Embed Size (px)
Citation preview

2015 – 2024
10 YEAR BUSINESS AVIATION MARKET OUTLOOK

2 10 YEAR MARKET OUTLOOK
Contents
FOREWORD 4
THE JETCRAFT PERSPECTIVE 6
EXECUTIVE SUMMARY 8
BUSINESS AVIATION OUTLOOK FOR 2015 - 2024 10
OUTLOOK BY REGION 14
SEGMENT ANALYSIS 23
ENGINE & AVIONICS OEMs 36
CONCLUSION 39
APPENDIX 42
SAFE HARBOR STATEMENT 49
3JETCRAFT.COM

FOREWORD

5JETCRAFT.COM
Foreword
A forecast is simply defined – the predicting of a future condition or occurrence. A market forecast for business aviation, given the industry’s past few years, is less simple as an exercise. Regardless, Jetcraft approached our first ever market forecast with a very strong belief in the value that our perspective would be able to bring to the industry.
Our industry’s lack of predictability since 2008 has become its permanent subtext. However, we believe unequivocally in the importance of planning ahead with vision and in playing our part as diligent advisors in order to enhance our industry’s long-term prospects.
With over 50 years in the industry and our unique position among a combination of high net worth individuals (HNWIs) and corporate customers, manufacturers and brokers, we aim to bring a fresh perspective and an aspiration that we can aid the industry in its planning to take on the inevitable challenges ahead.
We hope you find it useful.
Jahid Fazal-Karim Chairman of the Board, Jetcraft

THE JETCRAFT PERSPECTIVE
7JETCRAFT.COM
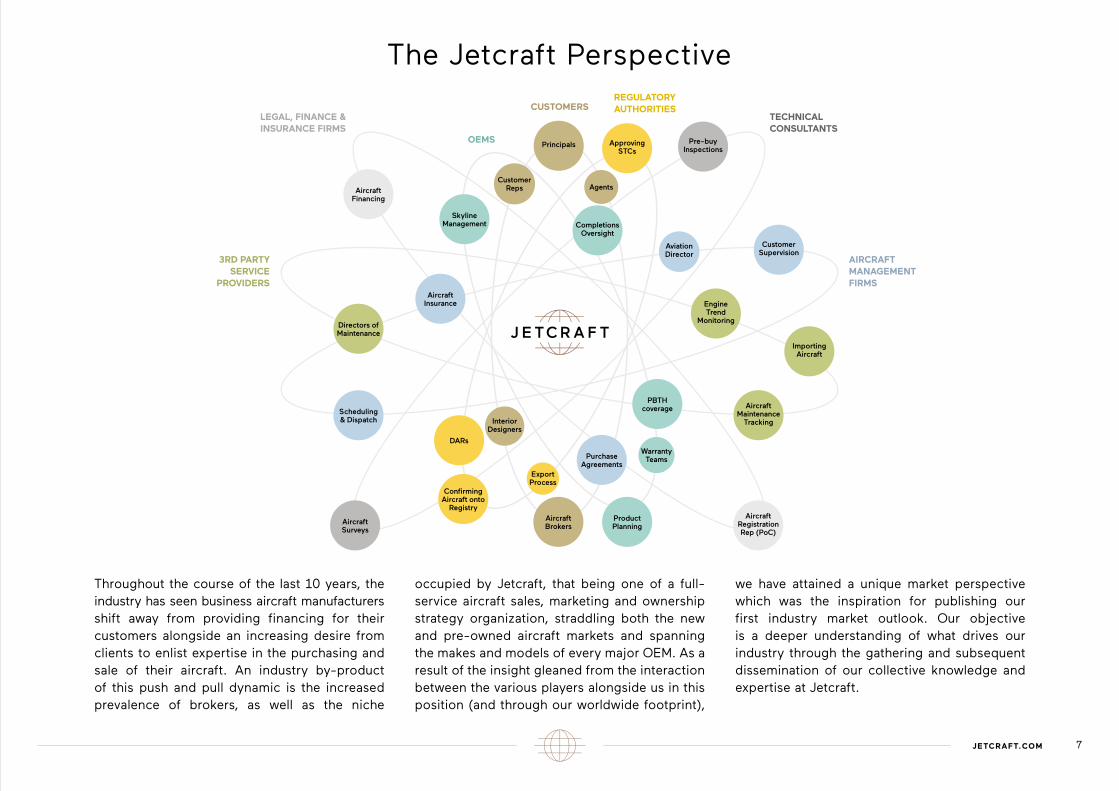
Throughout the course of the last 10 years, the industry has seen business aircraft manufacturers shift away from providing financing for their customers alongside an increasing desire from clients to enlist expertise in the purchasing and sale of their aircraft. An industry by-product of this push and pull dynamic is the increased prevalence of brokers, as well as the niche
occupied by Jetcraft, that being one of a full-service aircraft sales, marketing and ownership strategy organization, straddling both the new and pre-owned aircraft markets and spanning the makes and models of every major OEM. As a result of the insight gleaned from the interaction between the various players alongside us in this position (and through our worldwide footprint),
we have attained a unique market perspective which was the inspiration for publishing our first industry market outlook. Our objective is a deeper understanding of what drives our industry through the gathering and subsequent dissemination of our collective knowledge and expertise at Jetcraft.
The Jetcraft Perspective
Aircraft Surveys
Scheduling & Dispatch
Directors of Maintenance
Aircraft Financing
Skyline Management
Aircraft Insurance
DARs
Interior Designers
Confirming Aircraft onto
Registry
Aircraft Brokers
Export Process
Product Planning
Warranty TeamsPurchase
Agreements
PBTH coverage
Aircraft Registration Rep (PoC)
Aircraft Maintenance
Tracking
Importing Aircraft
Engine Trend
Monitoring
Customer Supervision
Aviation Director
Pre-buy Inspections
Approving STCs
Agents
Completions Oversight
Principals
Customer Reps
AIRCRAFT MANAGEMENT FIRMS
3RD PARTY SERVICE
PROVIDERS
TECHNICAL CONSULTANTS
LEGAL, FINANCE & INSURANCE FIRMS
OEMS
REGULATORY AUTHORITIESCUSTOMERS

EXECUTIVE SUMMARY
9JETCRAFT.COM
EXECUTIVE SUMMARY
-> Jetcraft’s market forecast perspective is developed on the insight provided by the company’s position in the industry; one that spans interactions with all of the principal players involved in executing tasks across the aircraft sales cycle.
-> An asynchronous recovery in North America compared to the rest of the world is significantly impacting business confidence which is, in turn, adversely affecting aircraft orders and deliveries.
-> Based on our assessment for each region, it is likely that the recovery run in business aviation will take place without the benefit of a virtuous economic cycle. As a result, year-on-year growth of aircraft unit deliveries will be relatively flat (i.e. 7.4% CAGR), before a downturn eventually moves onto the horizon.
-> We forecast this downturn to occur around 2022 but caution that this assertion is merely a best estimate. This is based principally on our desire to root the forecast in the reality of historical data, which shows that a downturn is likely to occur as there has never previously been a 10 year period during which a recovery run has grown for every single year.
-> Our forecast calls for 8,755 aircraft representing $271.1 billion in revenues to be delivered throughout the 10 year forecast period with Bombardier securing the highest market share in both unit deliveries (24.3%) and revenues (31.6%).
-> We forecast that the North American region will increase its share (compared to the rest of the world) of total aircraft unit deliveries to 54%.
-> We have noticed a number of discernible trends in industry player behaviour in the current business cycle. Customers are shying away from more ‘emotional’ purchases. Companies are committing cash reserves to buy back shares (and as a consequence away from aircraft purchases) and OEMs are developing more widebody models (at the expense of new narrowbody programs) – crowding the higher segment with multiple offerings.
-> From a product development perspective, the most intriguing aircraft development opportunity is for Dassault to launch a stretched version of the F5X into an ultra long range product.
-> Regarding engine OEMs, Rolls Royce’s dominance in business aviation is being seriously challenged by Pratt & Whitney Canada and General Electric.
Executive Summary
BUSINESS AVIATION OUTLOOK FOR 2015 - 2024
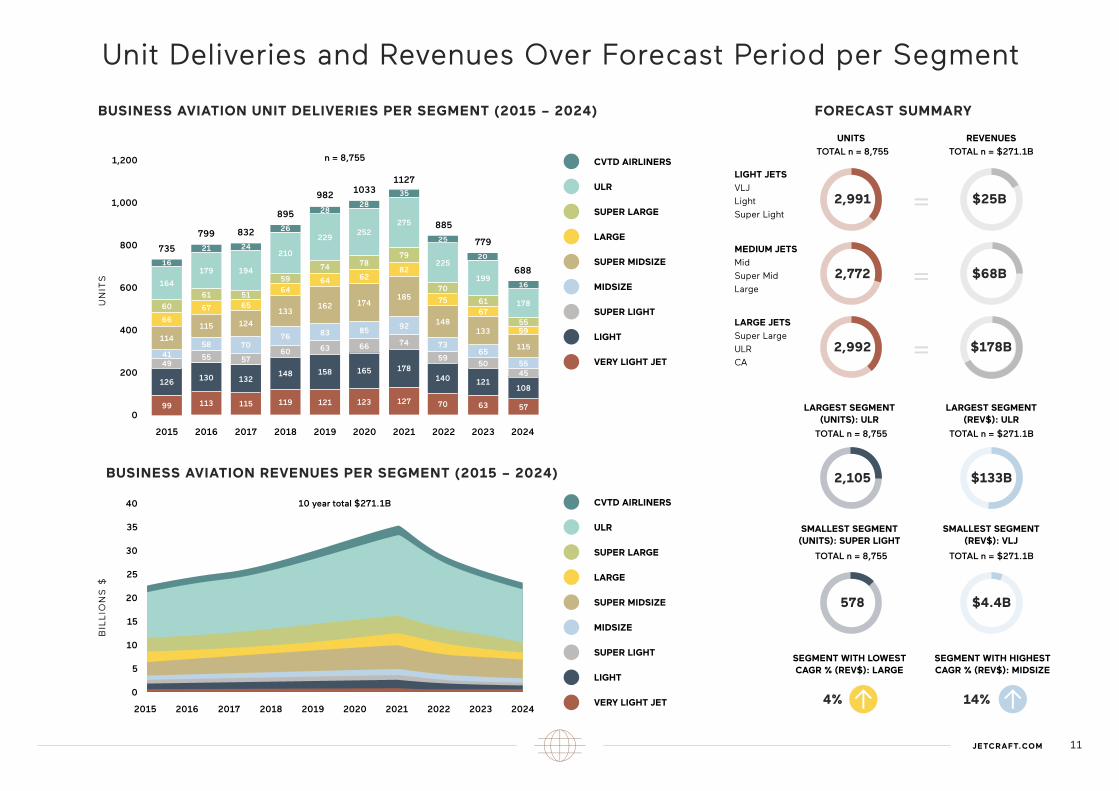
Unit Deliveries and Revenues Over Forecast Period per Segment
11JETCRAFT.COM
FORECAST SUMMARY
TOTAL n = 8,755 TOTAL n = $271.1B
BUSINESS AVIATION UNIT DELIVERIES PER SEGMENT (2015 – 2024)
BUSINESS AVIATION REVENUES PER SEGMENT (2015 – 2024)
0
0
200
400
5
600
10
15
800
20
1,000
30
25
35
1,200
40
2015
735
2015
UN
ITS
BIL
LIO
NS
$
2018
895
2018
2021
1127
2021
2016
799
2016
2019
982
2019
2022
885
2022
2017
832
2017
2020
1033
2020
2023
779
2023
2024
688
2024
CVTD AIRLINERS
ULR
SUPER LARGE
LARGE
SUPER MIDSIZE
MIDSIZE
SUPER LIGHT
LIGHT
VERY LIGHT JET
CVTD AIRLINERS
ULR
SUPER LARGE
LARGE
SUPER MIDSIZE
MIDSIZE
SUPER LIGHT
LIGHT
VERY LIGHT JET
n = 8,755
10 year total $271.1B
99
126
4941
114
66
60
164
113
130
55
58
21
16
115
67
61
179
115
132
57
70
2425
26
124
6551
194
119
148
60
76
133
64
59
210
28
121
158
63
64
83
162
74
229
28
123
165
66
62
85
174
78
252
35
127
178
74
82
92
185
79
275
70
140
59
75
73
148
70
225
16
57
108
45
59
55
115
55
178
63
121
50
67
65
133
61
199
20
UNITS REVENUES
2,772 $68B
MEDIUM JETS
Mid
Super Mid
Large=
2,992 $178B
LARGE JETS
Super Large
ULR
CA=
TOTAL n = 8,755 TOTAL n = $271.1B
SMALLEST SEGMENT (UNITS): SUPER LIGHT
SMALLEST SEGMENT (REV$): VLJ
578 $4.4B
SEGMENT WITH LOWEST CAGR % (REV$): LARGE
SEGMENT WITH HIGHEST CAGR % (REV$): MIDSIZE
4% -> 14% ->
TOTAL n = 8,755 TOTAL n = $271.1B
LARGEST SEGMENT (UNITS): ULR
LARGEST SEGMENT (REV$): ULR
2,105 $133B
2,991 $25B
LIGHT JETS
VLJ
Light
Super Light=
12 10 YEAR MARKET OUTLOOK
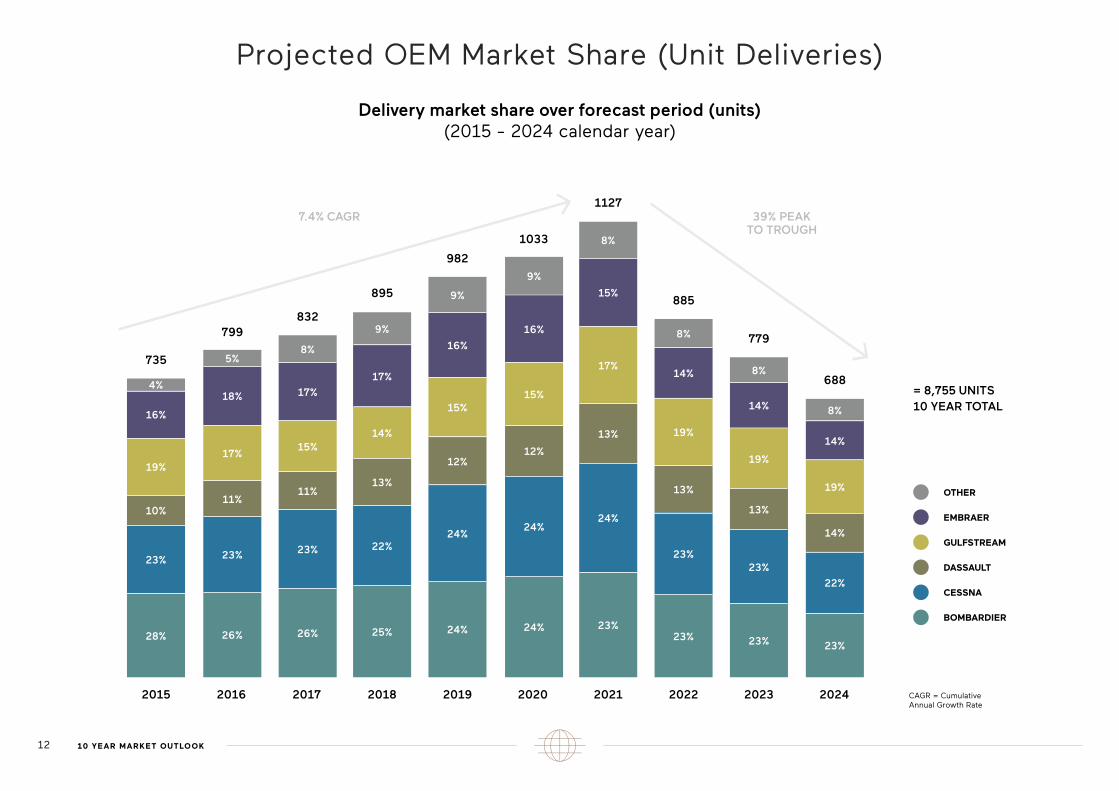
Projected OEM Market Share (Unit Deliveries)
Delivery market share over forecast period (units)(2015 - 2024 calendar year)
= 8,755 UNITS10 YEAR TOTAL
OTHER
EMBRAER
GULFSTREAM
DASSAULT
CESSNA
BOMBARDIER
CAGR = Cumulative Annual Growth Rate
2015
7.4% CAGR 39% PEAK TO TROUGH
735
832799
982
895
1033
885
779
688
1127
2018 20212016 2019 20222017 2020 2023 2024
28%
23%
10%
19%
16%
4%
26%
687
23%
19%
14%
22%
14%
8%
8858%
14%
19%
13%
23%
23%
77714%
19%
13%
8%
23%
23%
8%
15%
17%
13%
24%
23%24%
24%
16%
15%
12%
9%
16%
15%
12%
24%
24%
9%
9%
17%
14%
13%
22%
25%
23%
11%
17%
18%
5%
26%
8%
17%
15%
11%
23%
13JETCRAFT.COM
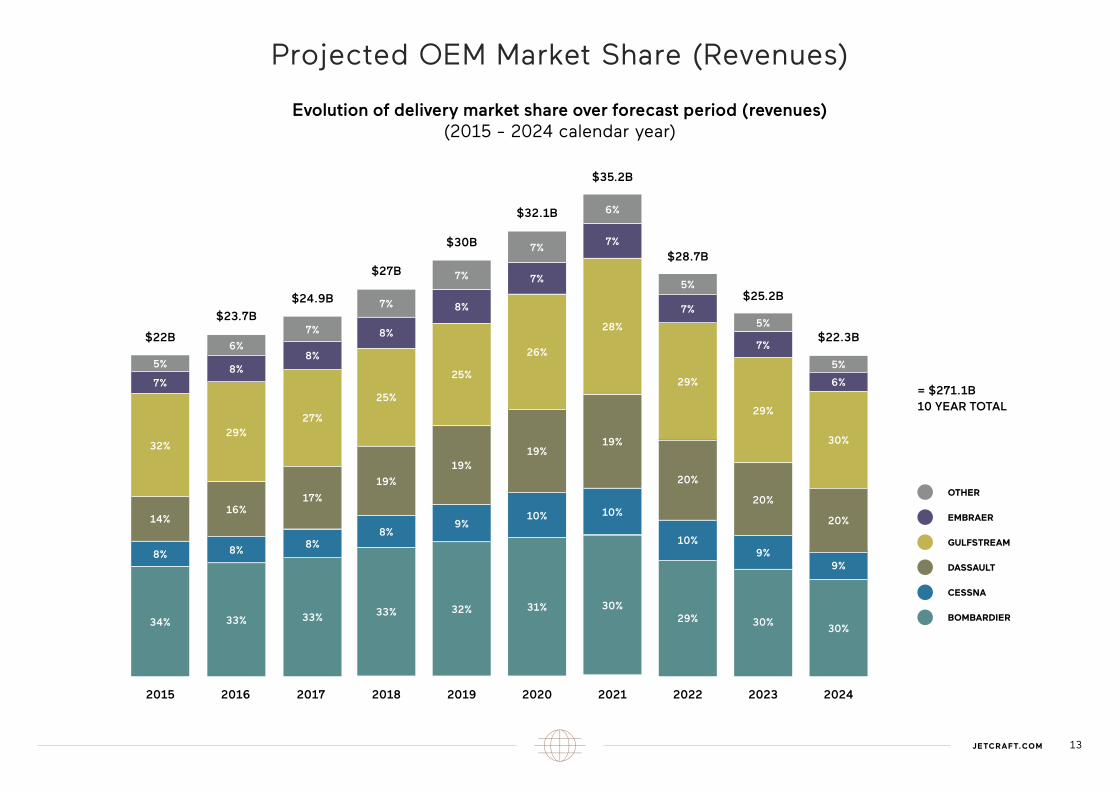
Projected OEM Market Share (Revenues)
Evolution of delivery market share over forecast period (revenues)(2015 - 2024 calendar year)
= $271.1B10 YEAR TOTAL
OTHER
EMBRAER
GULFSTREAM
DASSAULT
CESSNA
BOMBARDIER
$35.2B
34%
8%
14%
32%
7%
5%
33%
8%
16%
29%
8%
6%
33%
8%
17%
27%
8%
7%
33%
8%
19%
25%
8%
7%
32%
9%
19%
25%
8%
7%
31%
10%
19%
26%
7%
7%
30%
10%
19%
28%
7%
6%
29%
10%
20%
29%
7%
5%
30%
9%
20%
29%
7%
5%
30%
9%
20%
30%
6%
5%
2015
$28.7B
$25.2B
$22.3B$22B
$23.7B
$24.9B
$27B
$30B
$32.1B
2018 20212016 2019 20222017 2020 2023 2024

OUTLOOK BY REGION

15JETCRAFT.COM
Regional Distribution of 8,755 Unit Deliveries Over Forecast Period (2015 - 2024)
ASIA - PACIFIC12%
(1,050 units)
RUSSIA & CIS5%
(438 units)EUROPE14%
(1,225 units)NORTH AMERICA
54%(4,728 units)
LATIN AMERICA9%
(788 units)
AFRICA3%
(263 units)
MIDDLEEAST
3%(263 units)
A number of factors may dictate the regional location of business aircraft purchasers: from citizenship, registration or location of their aircraft, primary place of business, to the location of their aircraft management/operations. For this reason, forecast models are ill-equipped for a high level of clarity. As such, we caution that the allocation represents an approximation based on historical data.
However, the exercise remains relevant as it provides insight onto the pulse of the regions. What we’re looking for is a clear indication of how the economy is affecting business confidence and the regulatory climate, the two most critical elements in assessing the deal environment, not just for a region but for the entire industry.

Regional Outlook: North America
As the overwhelming driver for the region and home to the greatest number of Fortune 500 companies and High Net Worth Individuals (HNWIs), the U.S. possesses the longest history and greatest experience in business aviation ownership of any country. Throughout the last two business cycles (since 1995), this attribute insulated the North American market during downturns and slow recoveries as the region was predisposed to deliver a certain level of growth, irrespective of what was transpiring in the economy at large.
This is less the case in 2015. Today, even the hint that shareholders could view corporate flight departments as an unnecessary drain on shareholder value has prompted some companies with established track records in business aviation to close down or reduce operations. The implication is that the behaviour of the world’s foremost business aviation market has fundamentally changed e.g. customers are shying away from what could be deemed as emotional purchases and companies’ behaviours are changing with regard to what they do with their cash.
In a note to clients in April, for example, Goldman Sachs forecasted that companies will spend $600 billion this year alone in stock buy-backs, representing 30% of available cash at a time when equities are viewed as over-valued.
That is the current backdrop of the North American region. Moving forward, based on the crucial twin metrics of business confidence and a regulatory-friendly climate, there is cause for both concern and optimism. After more than six years of unprecedented Fed stimulus, i.e. three rounds of quantitative easing culminating in more than $4.5 trillion in asset purchases, the U.S. economy has grown in every one of the last five years.
The concern is that the trajectory of this growth has been flat, i.e. sub 3%, which has not translated into a robust aircraft transaction environment. Immediately available data and short-term forecasts call for much of the same level of growth this year and in 2016.
From a business aviation perspective, there appears to be a more conservative approach from our customers who point to this underlying economic data as a reason to hold off on buying new aircraft (pre-owned aircraft purchases are showing less sensitivity). An example of this economic juxtaposition is
that while the U.S. economy has recouped all the jobs that were shed during the 2008 recession, real wages have actually contracted since the recovery. Historically, robust real wage growth leads to greater personal consumption expenditure that, in turn, boosts business confidence. It is this equation that typically fuels growth during the middle to late stages of economic recoveries and which is noticeably absent from the economy today.
With the Fed preparing markets for a rate hike by the end of the year (coming at the later stage of the recovery run) it is conceivable that we may not achieve the required level of business confidence that would lead to a discernible increase in aircraft deliveries within the forecast period. Add to that the fact that emerging markets are decelerating which means that not only is the U.S. economy not performing well enough, it also cannot count on emerging markets to help fuel its growth.
So, the headwinds impacting the North American region are not insignificant, but there is some cause for optimism. First and foremost is the availability of financing as a result of all the liquidity in the market. Another bright spot is the bonus depreciation allowance (BDA) which allows individuals and companies to benefit from an aggressive depreciation schedule on capital equipment. Both examples are by-products of laudable public policies meant to serve business aviation by facilitating aircraft transactions.
Our outlook for the North American region assumes small incremental year-on-year growth for most of the forecast horizon. We are also projecting a marked increase in the percentage of total aircraft unit deliveries for North America compared to the rest of the world largely due to the weak asynchronous global recovery.
16 10 YEAR MARKET OUTLOOK

Regional Outlook: Europe
the beginning of the decade, it imposes very strict rules on lending practices. Previous to the accord, when financing an aircraft, the sole concern was how loan-to-value ratios were trending. Now, European banks are much more stringent in their lending practices, requiring customers to keep sufficient reserves and prove their creditworthiness and collateral requirements in order to have their asset financed.
Further friction on a smooth return of the business aviation market in Europe comes from the continuing currency issues. While a weak Euro vs USD is leading to better purchasing power for U.S. customers buying pre-owned European based aircraft, buyers of USD valued assets using Euros and CHF are finding it increasingly difficult to obtain a similarly equipped aircraft as they may have done a couple of years ago.
Despite its many current issues and challenges, we continue to believe in the resilience demonstrated by the region in general, and its business aviation installed base in particular. Europe has a long history with business aviation which is sustained by its high profile destinations and the business aviation traffic that it generates.
Despite the persistent turmoil caused by sovereign debt crises in several of its member states, Europe as a region has shown remarkable economic resilience. In fact, the IMF revised its forecast for the region from 1.3% to 1.7% for 2015. While this level of growth may not seem spectacular, it is remarkable given the complexities of instituting effective fiscal and monetary policy for a single region with disparate economic realities.
It was mere months since many industry watchers were contending that the state of the economy in Europe was going to relegate the entire region to the sideline during the course of the recovery in business aviation. While those more doom-mongering predictions for the region have not happened and despite the relatively improving economic climate, we see considerable obstacles preventing the region from contributing more than its traditional 15% unit delivery share over the forecast horizon. From a structural (market) perspective, Europe has an inordinate amount of
older narrowbodies, the average age of which is almost 30 years old, with few owners showing the inclination to upgrade. As a result, fewer narrowbody aircraft will contribute to the current replacement demand cycle. When we consider that the recovery will not include narrowbody unit deliveries reverting to pre-2008 levels, structurally, it’s difficult to see how we can expect much more from Europe. This crude calculation is merely to state that a 15% unit delivery level for the region is the most that we expect; and we see little help coming in the form of regulatory relief.
Since the passage of the Basel III accord in 2013, it has been almost impossible for European companies to finance their aircraft. Enacted as a response to the European credit crunch at
AVERAGE AGE OF MODEL (1986) 57%
nb (1,475)
AVERAGE AGE OF MODEL (2006) 43%wb (1,122)
n = 2,597 a/c
EUROPEAN FLEET
17JETCRAFT.COM

Regional Outlook: Latin America
A significant portion of Latin America’s customer base have been exposed to the business aviation industry for more than a generation. Aircraft sales are driven largely by Brazil – its single largest business aviation installed base – and thus how the Brazilian economy performs, the region as a whole tracks close behind.
While the overall economy being in a positive state does not necessarily translate into bull markets in business aviation, a poor economic climate does virtually guarantee low aircraft order intake and unit delivery performance. With Brazil’s $2.2 trillion (USD) economy slowing to a standstill (eking out 0.1% growth in 2014) and with no material pick-up in oil prices expected in the near-term, the consensus forecast for 2015 has the Brazilian economy contracting by 0.9%.
The government’s focus going forward is assessing what Brazil is facing in righting its economy in order to provide a healthy economic climate. Oil prices have stabilized and
short-term stimulus measures have been implemented, but the key to realizing Brazil’s true economic potential is its diversification strategy which is inextricably linked to its infrastructure development.
Herein lies the concern. The uncertainty of last year’s election has dissipated but the continued fallout from the Petrobras scandal is threatening to stunt the deployment of these projects. In jeopardy is more than $100 billion (USD) in transportation infrastructure with 5% of this figure committed to airport modernization alone affecting 270 regional airports throughout the country. Only recently
Brazil’s Aviation Minister went on record to confirm that the current tranche of aviation infrastructure funding is being threatened by austerity measures.
Brazilians generally appear to have had enough of corruption and the country would clearly like to avoid a repeat of the World Cup demonstrations, that took place last year, to resurface during the Olympics in 2016. With recent upheavals appearing as if they will be a fixture in the Brazilian political scene for some time, hanging in the balance is the entire infrastructure development plan that is seen as critical to the Brazilian economy.
As potentially bleak an outlook for the region as it is in the short to medium term, solid market fundamentals are what will redeem Brazil (and the region) in the long run. Firstly, as previously mentioned, Brazil has a long track record in business aviation dating back to the seventies. Latin American buyers are therefore likely to return quickly, as they understand that during the onset of a recovery, lower residual values for trade-ins will be more than offset by the discounting OEMs extend to customers on new aircraft.
Secondly, the ultra HNWI population in Latin America ($500M+ USD), while substantially less than the U.S., Europe and Asia, remains substantive enough to ensure that a certain level of aircraft transactions are and will continue taking place in the region. Finally, having a major business aviation manufacturer co-located within the region provides a number of intangible benefits. For example, Embraer has assisted the transformation of Brazil’s aviation authority (ANAC) into a world-class regulator, helping to ensure that Brazilian certification is as stringent as any other regulator, with ANAC being at par with the FAA, EASA and Transport Canada.
In terms of our outlook for the region, we view significant short-term challenges stemming from a weak economy and a political environment (in Brazil) currently grappling with major issues. However, in the medium term, we see a rebound in commodity prices helping to pull out the region from recession, as well as an improved political climate taking shape as the corporate scandal clears. Our forecast model has this transpiring within 24 - 36 months.
18 10 YEAR MARKET OUTLOOK

Regional Outlook: Asia-Pacific
Chinese buyers represented the single largest faction of new customers to business aviation since 2005. This is a large benefit for the industry as a whole as these buyers bring benefits such as the future-proofing of replacement demand as well as arriving into the market unencumbered by trade-ins, which in turn tends to expedite transactions.
However, with China’s $10 trillion economy now decelerating (the IMF forecasts GDP will steadily decline to 6.8% this year and 6.3% in 2016), there are serious issues looming. First and foremost is the country’s debt load, currently estimated at $28 trillion, which is 282% of GDP. China’s growth was fueled by public sector investment, particularly in infrastructure. The availability of easy credit and the frequent rolling-over of loans to support companies in financial peril are key elements that have contributed to China’s massive debt.
While the Chinese have moved to enact structural economic reforms to deleverage the economy, the potential issue for business aviation is that the ‘cure’ might be worse than the ‘ailment’. As efforts now shift on gearing economic growth toward domestic consumption – and away from infrastructure investment – critical airport development and related infrastructure is in jeopardy. Airport infrastructure is crucial for business aviation as it comes hand in hand with much needed regulatory additions, i.e. more airports lead to increased passenger traffic, which leads to more fixed based operations, which results in freeing up the airspace, all of which collectively feed the business aviation ecosystem. Ironically, developing China’s aviation infrastructure would be a significant source of many of the value-added services that would drive domestic consumption.
The government’s response in the first quarter of 2015 to reducing this overleverage has been that credit is still outpacing economic output 2 to 1 and the government remains committed to accelerating 300 infrastructure projects
China has been the primary driver of business aircraft orders for the Asia-Pacific region during the current business cycle but should be broken out as a separate entity for the purposes of this forecast as its economic situation is so unique.
valued at more than $1 trillion this year alone. From a strictly business aviation perspective, it is unlikely that the government will be able to successfully transition to a domestic consumption-based economy while at the same time selectively maintaining its aviation related infrastructure projects.
Other structural reforms from the government that are adversely impacting business aviation include the government’s efforts to clamp-down on corruption.Transparency International’s Corruption Perception Index ranked China 100 out of 176 nations that it tracks. Investigations into corrupt officials and their practices is seen as necessary in liberalizing the economy.
However, it has had the unintended effect of suppressing what is deemed to be any overt display of ‘ostentatious’ wealth, including business aircraft. This has hurt legitimate companies that use business aircraft as a tool to compete internationally and, more importantly, driven ultra HNWIs away from the region, principally to the UK and U.S. (see graph). As far as India making up the slack for the lower business aircraft order intake caused by a slowing Chinese economy, despite the marked improvement of the Indian economy throughout the last year, infrastructure
and bureaucratic reform remain significant obstacles in transforming India into a sophisticated business aviation installed base.
But perhaps the single most revealing characteristic of the region is that outflow of ultra HNWIs from Asia.
During the last global economic cycle, China and India were first and second in the outflow of billionaires. Throughout the next 10 years, given the challenges brought on by dealing with the issues of maturing complex economies, we see this trend continuing. We expect most of the challenges the region is facing will be successfully addressed, but the sheer scope of the issues facing China and India alone will blunt the region’s unit delivery performance throughout the forecast period. The hope is that some of the more prominent South East Asian economies such as Singapore, Indonesia, Malaysia and Thailand (all of which have customers with long track records in business aviation) can, in part at least, fill the vacuum until at least China’s economy stabilizes.
COUNTRIES WITH THE BIGGEST OUTFLOWS OF HNWI (PAST 10 YEARS)
COUNTRY HNWIs 2013
HNWIs LOST FROM 2003 TO 2013 (AS A PERCENTAGE OF TOTAL HNWI POPULATION)
Source: Knight Frank Wealth Report
507,800 76,200 (15%)CHINA
160,600 43,400 (27%)INDIA
244,100 31,700 (13%)FRANCE
124,000 18,600 (15%)ITALY
82,300 14,000 (17%)RUSSIA
265,800 10,600 (4%)SWITZERLAND
37,000 10,000 (27%)INDONESIA
19JETCRAFT.COM

Regional Outlook: Africa
Nestlé and Unilever and, in relative terms, the region continues to produce a high proportion of billionaires. However, the growing industrial base and wealth creation alone have not translated directly to growing aircraft orders.
For the past 15 years, the collective understanding among the business aviation community was that the African region needed to develop the appropriate infrastructure and training in order to realize its full potential. Expatriate expertise that was brought in (largely from Europe) was intended to fill the void until the infrastructure in question could be built.
Fast forward 15 years to today and there remains a lack of business aviation penetration in the region relative to its wealth as infrastructure development continues to be a significant problem. Of the five largest aircraft installed bases in Africa (South Africa, Nigeria, Egypt, Angola and Morocco) only South Africa has the level of business aviation infrastructure that can sustain growth.
The continent’s proximity to Europe has enabled the sourcing of support from outside the region to be both practical and easy. However, this has come at the cost of cultivating an indigenous source for pilots, technicians and other skilled service personnel. It has also stunted reform and robbed it of the opportunity to develop its regulatory authorities, which are critical to establishing world standards regarding oversight. As an indication of the region’s over-reliance on non-domestic service support,
approximately 20% of the aircraft based in Africa operate under non-African registries, a disproportionate level.
The region’s instability feeds these issues, but hope for the region has come in the form of a huge inflow of capital from expatriate Indian and Chinese business interests involved in the mineral sector. What differentiates this group from other foreign direct investment is that it has been exposed to business aviation and, in seeking to establish a corridor between Asia and Africa, might just be the best hope of the spark required to initiate development of its much needed infrastructure.
Our short-term outlook for the region is highlighted by significant negative challenges but as currency and commodity prices return over the forecast horizon we are cautiously optimistic the region will finally move forward with building its much needed aviation infrastructure and fulfill its potential. A centerpiece to this development are organizations like the AfBAA, which has, over a short period of time, steadily increased its advocacy of business aviation in the region.
The realization of the market potential will be driven by the dual fundamentals of increasing numbers of HNWIs and their global travel needs, alongside the increasing education provided through organizations such as AfBAA, with this combination eventually forcing infrastructure to improve.
EASE OF DOING BUSINESS INDEX
1 = MOST BUSINESS-FRIENDLY ENVIRONMENT
Source: The World Bank, 2014
1SINGAPORE
2HONG KONG
4U.S.
6MALAYSIA
7SOUTH KOREA
18THAILAND
21GERMANY
26SAUDI ARABIA
27JAPAN
38FRANCE
41SOUTH AFRICA
96CHINA
99VIETNAM
108PHILIPPINES
116BRAZIL
120INDONESIA
125ETHIOPIA
126ARGENTINA
128EGYPT
147NIGERIA
20 10 YEAR MARKET OUTLOOK
A burgeoning middle class is attracting investment from major international companies which are establishing footprints in the region such as Samsung, Wal-Mart, L’Oréal,
With its traditional resource-based economy transitioning to develop new high-technology and manufacturing sectors, the economic prospects bode well for the African continent and its respective economies during the forecast horizon.

JETCRAFT.COM
Regional Outlook: Middle East
Industry in general, and not just business aviation, has regularly had to factor one or a combination of political, economic or social instability into the cost of doing business in the Middle East and this remains the case today.
If oil prices are artificially depressed as has been the recent case, the repercussions for oil dependent regions like Latin America, Russia and Africa could be devastating, not to mention the exposure for North American and European oil interests.
While the world might welcome cheaper oil, prices at current levels are untenable for oil producing regions. Clearly this would directly impact the ability to buy aircraft in these regions, but also is a concern, as it would affect current efforts in transforming their respective economies. To this end, stronger more resilient economies are exactly what business aviation requires to flourish.
However, the economies of the Gulf Cooperation Council (GCC) states are still overly-reliant on oil as diversification efforts have largely not been as impactful as had been hoped. That dictates a less than robust backdrop in which business aviation is currently operating within the region.
On the business side, the aerospace sector (and by association business aviation) still holds a prominent position in the region in terms of industrial priority, but more so because of the sector’s international profile rather than as a product of a cohesive public policy platform. For example, just recently, Dubai Aerospace Enterprise (DAE) sold off its last prominent aerospace holding (i.e. Standard Aero – a maintenance, repair and overhaul business) to a private equity firm effectively putting an end to Dubai’s aerospace strategy that was launched in 2006 with much fanfare, but has now ended with the promise to ‘refocus’ the company into becoming a global aircraft finance lending player for commercial aviation.
Having an indigenous aerospace OEM or tier I supplier footprint in the region provides intangible benefits to the local installed base, whereas the re-purposing plan for DAE will provide very little for business aviation in this regard. With a thin aerospace industrial base, there is little for business aviation to build around.
The key takeaway is that the current climate for aircraft transactions is challenging. Customers in the region are sitting on their hands as a result and deal activity is slow. The few transactions that are closing are likely being facilitated by OEMs who are able to extend significant discounts.
Our outlook for the region throughout the forecast period is that it will under-perform as a result of the significant short- term headwinds.
21JETCRAFT.COM

Regional Outlook: Russia & CIS
As dramatic a rise as the Russian/CIS region experienced in transforming into an important business aviation market from a standstill, so too has been its decline.
With the Russian economy languishing, it’s a reflection of just how much the economic climate in Russia dictates the pace at which aircraft orders and deliveries are realized in the region.
While the CIS economies of Eastern and Central Europe will collectively outpace the Eurozone in terms of growth throughout the short term, the fact that the largest market (Russia) is contracting does not bode well for the region as a whole. In fact, throughout the past 18 months, orders have meaningfully slowed.
This is especially disconcerting for the industry as the Russian/CIS region has overwhelmingly favored high value, widebody product lines. What recent activity there has been has generally trended toward downgrades and purchasing of pre-owned aircraft, displacing what otherwise would have been new aircraft transactions.
There appears to be little respite in sight. The economy is contracting – forecasted to be down by as much as 4% this year alone – under the pressure of lower oil revenues and international sanctions. This prompted the Bank Rossii to cut interest rates for a third time in a relatively short period.
The immediate effect has been positive as stabilizing oil prices and less access to global credit markets (as a result of the sanctions) has resulted in a stronger ruble and unexpected deleveraging of the economy. However, with
industrial production expected to shrink considerably throughout the course of this year, the deterioration of the labor market (i.e. wage cuts and higher unemployment) may begin to erode the popular support the Russian Administration currently enjoys at home. The concern is that the government might train its attention toward geo-political issues (where it garners overwhelming domestic support) at the expense of dealing with the pressing economic reform of its overly dependent commodity based economy.
As the Russian economy enters its first recession in six years, it is very important to note that Russian customers remain fierce supporters of business aviation and despite short term pressure, the expectation over the forecast horizon is that the region will return to being a steady source of widebody orders.
CR
UD
E O
IL:
BR
EN
T (
US
D)
RU
BL
E V
AL
UE
(U
.S.
CE
NT
S)
1ST APR 2014 1ST MAY 2015
140
120
100
80
60
40
20
0
3.5
3
2.5
2
1.5
1
0.5
0
CRUDE OIL RUBLE
22 10 YEAR MARKET OUTLOOK

SEGMENT ANALYSIS

24 10 YEAR MARKET OUTLOOK
SMALL MEDIUM LARGE
VERY LIGHT
LIGHTSUPER LIGHT
MIDSIZESUPER
MIDSIZELARGE
SUPER LARGE
ULTRA LONG RANGE
CONVERTED AIRLINERS
BOMBARDIER L70 L75 CL350 CL650 G5000
G6000
G7000 (2017)¹
G8000 (2018)¹
C-SERIES BJ (2021)¹
CESSNA
M2
MUSTANG
CJ2+
CJ3+
CJ4
CJ4+ (2018)¹
XLS+
XLS++ (2018)¹
SOVEREIGN+ LATITUDE (2016)¹
NEW CITATION X
LONGITUDE (2019)¹
DASSAULT F2000S F2000LXSF900LX
F5X(2018)¹
F7X
F8X (2016)¹
ULR (2020)¹
GULFSTREAM G150 G280G400NG (2021)¹
G450
G500NG (2018)¹
G550
G650
G650ER
G600NG (2019)¹
EMBRAERPHENOM
100EPHENOM
300LEGACY
450LEGACY
500LEGACY
650LINEAGE
1000
OTHER HONDAJETPILATUS
PC-24 (2017)¹
BBJ I/II/III
ACJ
SUKHOI SBJ (2017)¹
Business Aviation OEM Product Line-Up
¹ Announced or otherwise anticipated entry into service. New aircraft development programs noted that have not been announced by an OEM are based solely on our experience. Note: Forecast does not include Eclipse 550 or Syberjet SJ30.
29
32
27 27
32
25JETCRAFT.COM
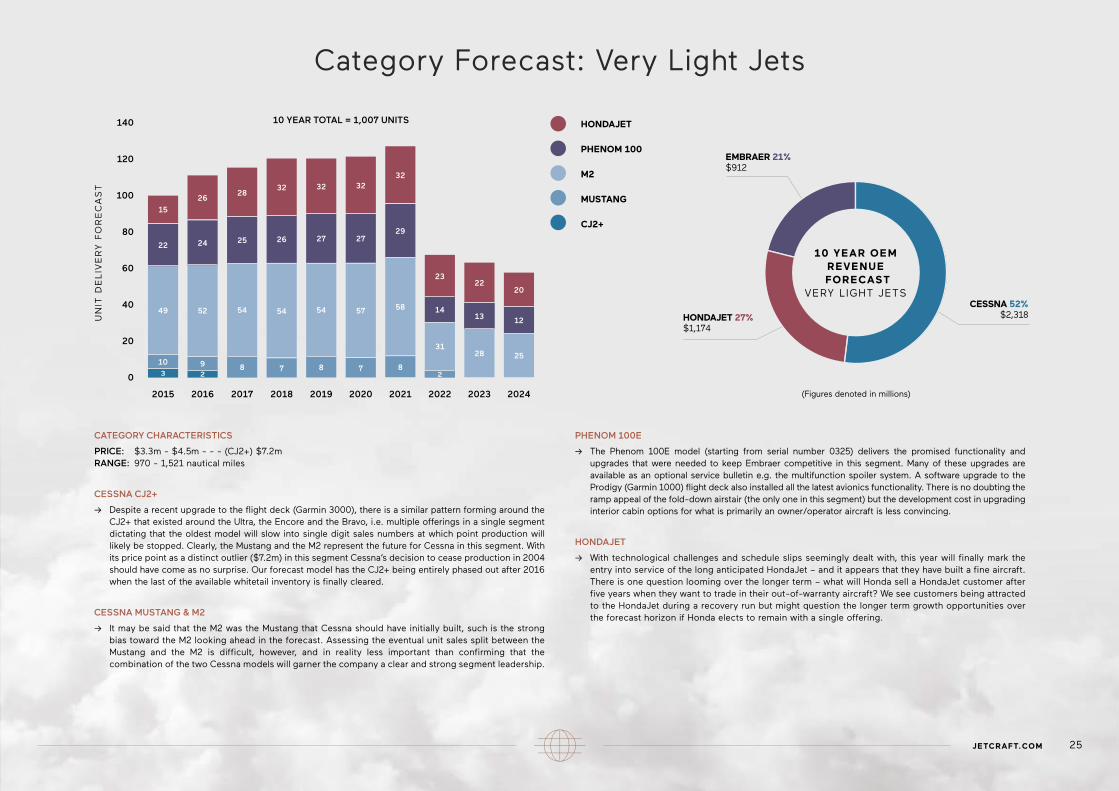
CATEGORY CHARACTERISTICS
PRICE: $3.3m - $4.5m - - - (CJ2+) $7.2m RANGE: 970 - 1,521 nautical miles
CESSNA CJ2+
-> Despite a recent upgrade to the flight deck (Garmin 3000), there is a similar pattern forming around the CJ2+ that existed around the Ultra, the Encore and the Bravo, i.e. multiple offerings in a single segment dictating that the oldest model will slow into single digit sales numbers at which point production will likely be stopped. Clearly, the Mustang and the M2 represent the future for Cessna in this segment. With its price point as a distinct outlier ($7.2m) in this segment Cessna’s decision to cease production in 2004 should have come as no surprise. Our forecast model has the CJ2+ being entirely phased out after 2016 when the last of the available whitetail inventory is finally cleared.
CESSNA MUSTANG & M2
-> It may be said that the M2 was the Mustang that Cessna should have initially built, such is the strong bias toward the M2 looking ahead in the forecast. Assessing the eventual unit sales split between the Mustang and the M2 is difficult, however, and in reality less important than confirming that the combination of the two Cessna models will garner the company a clear and strong segment leadership.
PHENOM 100E
-> The Phenom 100E model (starting from serial number 0325) delivers the promised functionality and upgrades that were needed to keep Embraer competitive in this segment. Many of these upgrades are available as an optional service bulletin e.g. the multifunction spoiler system. A software upgrade to the Prodigy (Garmin 1000) flight deck also installed all the latest avionics functionality. There is no doubting the ramp appeal of the fold-down airstair (the only one in this segment) but the development cost in upgrading interior cabin options for what is primarily an owner/operator aircraft is less convincing.
HONDAJET
-> With technological challenges and schedule slips seemingly dealt with, this year will finally mark the entry into service of the long anticipated HondaJet – and it appears that they have built a fine aircraft. There is one question looming over the longer term – what will Honda sell a HondaJet customer after five years when they want to trade in their out-of-warranty aircraft? We see customers being attracted to the HondaJet during a recovery run but might question the longer term growth opportunities over the forecast horizon if Honda elects to remain with a single offering.
Category Forecast: Very Light Jets
140
0
20
40
60
80
100
120
2015
UN
IT D
EL
IVE
RY
FO
RE
CA
ST
2018 20212016 2019 20222017 2020 2023 2024
3
10 9 8 7 7 8
3128 25
121314
23
58575454545249
22
15
26
24 25 26
2832 32
2220
8
10 YEAR TOTAL = 1,007 UNITS
HONDAJET 27%$1,174
EMBRAER 21%$912
CESSNA 52%$2,318
HONDAJET
PHENOM 100
M2
MUSTANG
CJ2+
-> 10 YEAR OEMREVENUE
FORECASTVERY LIGHT JETS
2 2
(Figures denoted in millions)

EMBRAER 36%$4,641
PILATUS 15%$1,838
CESSNA 36% $4,624
14 1113
19 18 16
29
2927
40
2930
32
29 2927
20
34
24
37
64
14 14
20 20
15 15 1516 18
16
53
5556
57
58
20 21 22
36
2326
44
3739
31 31
64
0
50
100
150
200
UN
IT D
EL
IVE
RY
FO
RE
CA
ST
2015 2018 20212016 2019 20222017 2020 2023 2024
CATEGORY CHARACTERISTICS
PRICE: $7.9m – $11.3m RANGE: 1,702 – 2,192 nautical miles
CJ3+ & CJ4
-> The falling numbers of the narrowbody customer base worldwide, especially in the U.S., will significantly impact CJ3+ and CJ4 sales as these two aircraft are almost exclusively North American based products. However, the dual offerings in the segment do provide customers the most flexibility in choice which will translate into market share leadership. The CJ4 has the best max payload and range specs in the segment (both very important customer considerations here).
PHENOM 300
-> With approximately 75% of the confirmed units delivered under the NetJets deal completed (the deal also includes 75 options) the Phenom 300 needs to prove it can extend its appeal beyond fractional buyers. We see the model doing very well in the space between the CJ3+ and the CJ4 where its performance specs are comparable to the Cessna offerings. The lack of an APU is what’s keeping the Phenom 300 from being a truly ‘great’ aircraft.
LEARJET 70
-> With new leadership at the helm of both Business Aircraft and Bombardier Inc. and armed with the singular mandate of increasing profitability amid the backdrop of the pressured narrowbody segment, lower selling models like the L70 might be in jeopardy. Being the highest priced in the segment does not aid what is otherwise a capable aircraft.
THE PILATUS PC-24
-> Pilatus seems to be developing an aircraft that is more of a stand-alone product than one designed to migrate owner/operators from its PC-12 customer base. Although it aligns with the marketing of the aircraft as “the super versatile jet” the wear and tear of the quick change interior is a large unknown. The advantages the PC-24 enjoys over its competitors are price, cabin and baggage volume, and take-off distance – time will tell if they manage to deliver on those strong specifications. Its order book for the PC-24 as of EBACE was confirmed at 84 units.
->
Category Forecast: Light Jets
PHENOM 300
PILATUS PC-24
CJ4/+
CJ3+
L70
10 YEAR TOTAL = 1,406 UNITS
BOMBARDIER 13%$1,631
26 10 YEAR MARKET OUTLOOK
10 YEAR OEMREVENUE
FORECASTLIGHT JETS
(Figures denoted in millions)

CESSNA 52%$3,980
BOMBARDIER 48%$3,668
2426 27 29 30 31 33
2521 20
0
10
20
70
60
50
40
30
80
2015
UN
IT D
EL
IVE
RY
FO
RE
CA
ST
2018 20212016 2019 20222017 2020 2023 2024
CATEGORY CHARACTERISTICS
PRICE: $12.7m – $13.8m RANGE: 1,858 – 2,040 nautical miles
GENERAL COMMENT ON SEGMENT
-> The XLS+ (and its predecessor Excel variants) have competed against the Learjet 75 (and the Learjet 45/XR in the past) for more than 10 years. In that span, Cessna has consistently been the segment leader at times garnering 75% market share over the Learjet offering. Cessna’s dominance has come despite Learjet’s superior performance specs e.g. max range, ceiling, long-range cruise, MTOW and balance field takeoff length. The reason for Cessna’s success over Bombardier’s Learjet models is because the XLS+ was a better charter aircraft than the Learjet. However, with the retraction of a sizable portion of narrowbody customers (some of whom have lost their appetite for ownership altogether) the market share split moving forward will be closer to 50/50 - slightly favoring the XLS+ on the assumption that Cessna will eventually switch out the Pro Line 21 flight deck for a Garmin 5000. The bad news is that the market appeal for this segment is the lowest from all the segments, i.e. 578 unit deliveries throughout the forecast period.
XLS+
-> Our forecast model has Cessna integrating the Garmin 5000 avionics in 2019 on this aircraft. The XLS+ (and its predecessors) number approximately 900 aircraft in the installed base. As a great charter aircraft, with an amazing dispatch reliability record, it makes it very attractive in the pre-owned market which will help Cessna pull Excel customers into new XLS+ models.
LEARJET 75
-> We are not sure if achieving an almost 50% market share against Cessna in this segment will be much consolation for Bombardier. With fewer narrowbody customers to win over, a flight deck switch-out that did not lead to hugely impactful sales of owner/operator customers and a persistent lack of international take-up, there are significant market realities facing the Learjet 75 moving forward despite its array of platform benefits.
Category Forecast: Super Light Jets
XLS+/NEW XLS+
LEARJET 75, 45
10 YEAR TOTAL = 578 UNITS
25
2930
31 3335
41
34
2925
27JETCRAFT.COM
-> 10 YEAR OEMREVENUE
FORECASTSUPER
LIGHT JETS
(Figures denoted in millions)

2024
19
19
18 18 16 16 13 12 10
0
80
60
40
20
100
2015
UN
IT D
EL
IVE
RY
FO
RE
CA
ST
2018 20212016 2019 20222017 2020 2023 2024
CATEGORY CHARACTERISTICS
PRICE: $15.7m – $17.8m RANGE: 2,292 – 3,063 nautical miles
LEGACY 450
-> With the retraction of the Learjet 85, the field is essentially left to Cessna and Embraer. The Legacy 450 is a solid aircraft based on a conventional airframe and loaded with many system enhancements. It has a great cabin and the typical seating configuration is 2+7. Standout interior features are the lavatory (e.g. solid door and vacuum toilet) and the baggage hold which is the best in class at 150 cubic feet (huge even by Super Midsize standards). It also is the least expensive offering in the segment but it is necessary for customers to spec out their options before they buy on price.
SOVEREIGN+ & LATITUDE
-> Based on the upgrades to the Sovereign+ e.g. winglets and the Garmin 5000 flight deck coupled with its existing max seating capacity for 12 passengers, cabin length, 3,000 nm range, and Cessna’s excellent customer service support program, the model still has a decent unit delivery future over the forecast horizon, especially if Cessna is willing to discount the aircraft a little more than usual. It is unlikely that it will have to worry about cannibalizing Latitude sales because this target customer base tends to be more interested in cabin amenities. One area where further improvement could have been made is if Cessna had promised a better payload – speed - range combination from the Latitude (compared to the Sovereign+) to give the former even greater differentiation.
G150
-> The G150 has the best range in this segment but the model is generally viewed as ageing. Customers that do opt for a new G150 are most likely to have prior experience with the model, that know the aircraft well and are comfortable with the product. It seems that neither Gulfstream nor Israeli Aerospace Industries (IAI) are overly concerned about single digit unit deliveries for this model.
->
Category Forecast: Midsize Jets
10 YEAR TOTAL = 698 UNITS
8
7
12
6
6
16
22
5
24
24
24
28
44 4
4
3
3
2
26
32
29
29
34
34
31
38
33
21
LEGACY 450
G150
LATITUDE
SOVEREIGN
GULFSTREAM 6%$676
CESSNA 61%$7,170
EMBRAER 33%$3,821
28 10 YEAR MARKET OUTLOOK
10 YEAR OEMREVENUE
FORECASTMIDSIZE
JETS
(Figures denoted in millions)

Category Forecast: Super Midsize Jets
CATEGORY CHARACTERISTICS
PRICE: $19.9m – $28.4m RANGE: 3,150 – 4,000 nautical miles
CHALLENGER 350
-> The Challenger 350 faces stiffer competition now than it did when Bombardier created this segment more than 10 years ago, when the Hawker 4000 and G200 could not match an aircraft that was purpose-built. With a little more than $1.5m added to the price tag (over the 300) the 350 is even more formidable and competitors (as good as they are) now have to face an impressive in-service record and reputation, i.e. 500+ aircraft in the installed base and a dispatch reliability rating of 99.98%. Even the last Challenger 300 aircraft that came off the line are competitive against other current offerings in this segment. Notwithstanding the F2000S, the 350 is nominally the most expensive model in this segment. But if all the standard equipment was priced on competitive aircraft, the price tags are virtually indistinguishable.
LEGACY 500
-> As is usually the case with new entrants into a segment, especially when the field is very competitive, Embraer may have to buy market share. Embraer has built a very good aircraft but competitive takeaways are very hard to realize in business aviation and while at first glance the $19.9m price tag is appealing, when the options that are standard in a Challenger 350 are priced in, the gap diminishes significantly. Having the same Honeywell engines and Rockwell Collins flight deck as the 350 is an indication of the customer base the Legacy 500 is focusing on.
F2000S
-> The F2000S is Dassault’s way of keeping a high margin aircraft in production. The F2000S was not purpose-built for this segment and our forecast has it low in market share as it doesn’t always meet customer requirements in this segment – particularly cost of operation. However, Dassault recognizes that this is a very popular segment where even a relatively small market share can translate into $4 billion in sales over the forecast horizon. This, on an aircraft where it is likely that significant margins exist as its program development costs have been paid back in full.
GULFSTREAM 280
-> Gulfstream developed an aircraft with many similar characteristics to the Challenger 300 (the historical leader in this segment) e.g. moved away from its older cruciform tail to a sharper looking t-tail configuration, switched to Honeywell engines, injected more speed, integrated a Rockwell Collins flight deck and gave it the segment’s longest legs with a 3,600 nm range (with 4 pax). However, these changes have not thus far translated into a material increase in segment market share but will only increase in terms of pressure on its competition’s sales numbers.
LONGITUDE
-> A redesign to the fuselage length and rumblings that Snecma is ironing out impeller problems with the Silvercrest engine is fueling speculation that Cessna may push back its initial entry into service date of 2017. However, prospective customers are keen to have a 4,000 nm offering in this segment so interest remains high.
200
2015 2018 20212016 2019 20222017 2020 2023 2024
GULFSTREAM 18%$6,222 BOMBARDIER 37%
$12,821
DASSAULT 12%$4,119
->
51 48 49 50 53 55 5742 39
35
0
50
100
150
UN
IT D
EL
IVE
RY
FO
RE
CA
ST
F2000S
LEGACY 500
G280
LONGITUDE
NEW CITATION X
CL350
10 YEAR TOTAL = 1,403 UNITS
8
8
8
26
16
13 13
6
2423
2225 26
2724
24
7
28
15
15
15
9
33
11
18
18
19
36
36
17
17
18
13 13
24
29
28
31
38
9
26
24
32
28
13
11
CESSNA 16%$5,727
EMBRAER 17%$5,873
29JETCRAFT.COM
10 YEAR OEMREVENUE
FORECASTSUPER
MIDSIZE JETS
(Figures denoted in millions)

EMBRAER 14%$3,043
DASSAULT 26%$5,664
BOMBARDIER 47%$10,495
GULFSTREAM 13%$2,877
CATEGORY CHARACTERISTICS
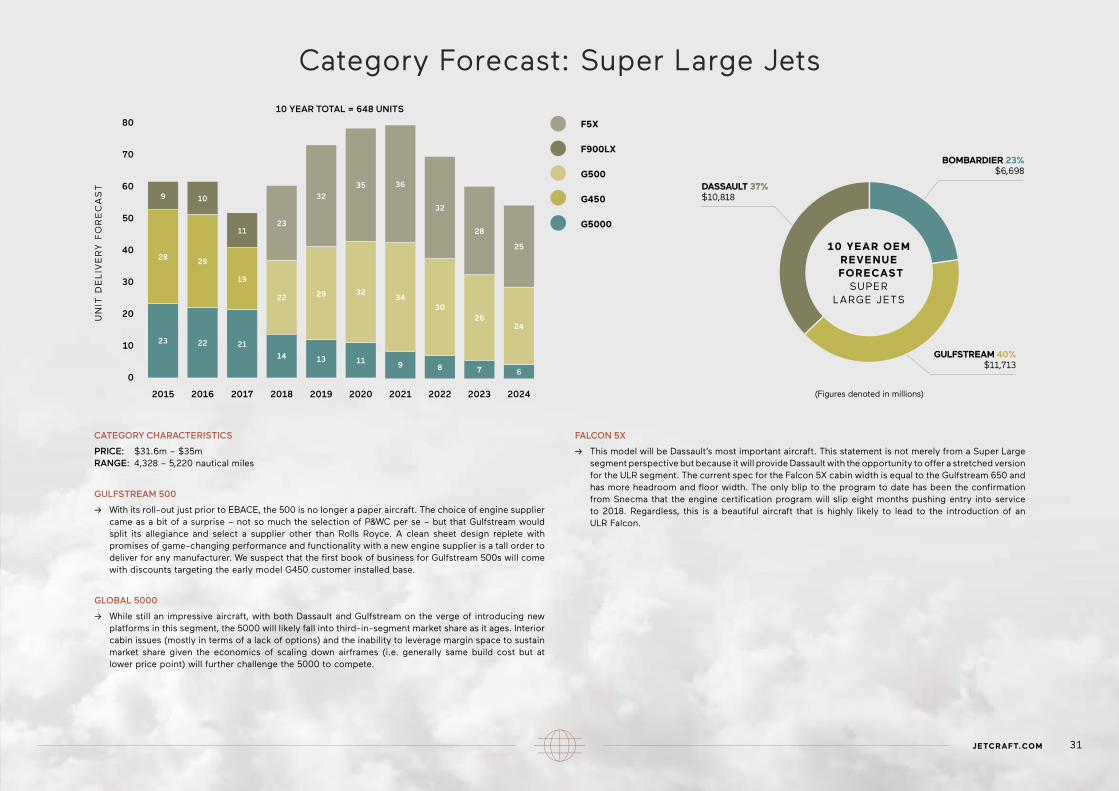
PRICE: $31.6m – $35m RANGE: 3,200 – 4,075 nautical miles
CHALLENGER 650
-> With approximately 1,000 Challenger series models in the installed base, Bombardier has a significant customer base to leverage…but also to protect. The steady NetJets deliveries will help Bombardier hold the line on its margins for its traditional sales, even though there is considerable margin room on such a mature program. It is likely that Bombardier will continue with incremental improvements to the Challenger product until the point arrives where the company will have to decide if it’s worth stretching the 350 (which has far more growth potential) into a 650 follow-on.
F2000LXS
-> As long as Dassault refuses to match Bombardier’s discounts, it will continue to place second in the segment in units. The minimal development cost to upgrade the Challenger 605 into the new Challenger 650 model is unlikely to affect Bombardier’s discounting ability, meaning this dynamic will continue. That said, it is highly likely that Dassault is comfortable with its product’s elasticity, i.e. content to deliver a certain number of aircraft at a target net margin.
LEGACY 650
-> Customers who opted for the Legacy 650 (and the 600 in the past) did so because they were able to load up on cabin options. With Bombardier beefing up the interior on the new Challenger 650 product and Dassault already with a very impressive interior in the LXS, sales of the Legacy 650 are going to be more difficult to realize.
GULFSTREAM - NEW MODEL
-> As Gulfstream introduced new models for the Ultra Long Range (ULR) and Super Long Range segments (i.e. replacements for the Gulfstream 550 and the Gulfstream 450), the void in a segment where it previously offered the Gulfstream 350 (a scaled down Gulfstream 450) likely points to an incoming new model. If Gulfstream can develop a sub-$35m aircraft with best in class cabin specs and performance, it will breathe new life into a segment that has been owned by Bombardier and Dassault for the last 15 years.
->
Category Forecast: Large Jets
GULFSTREAM - NEW MODEL
LEGACY 650
F2000LXS
C650
0
80
60
40
20
100
2015
UN
IT D
EL
IVE
RY
FO
RE
CA
ST
2018 20212016 2019 20222017 2020 2023 2024
10 YEAR TOTAL = 671 UNITS
35
20
11
35
21
1111
36
19
10
35
20
9
35
18
38
15
9
39
15
10
18
27
15
9
24
25
21
13
8
21
12
6
20
30 10 YEAR MARKET OUTLOOK
10 YEAR OEMREVENUE
FORECASTLARGEJETS
(Figures denoted in millions)
CATEGORY CHARACTERISTICS
PRICE: $31.6m – $35m RANGE: 4,328 – 5,220 nautical miles
GULFSTREAM 500
-> With its roll-out just prior to EBACE, the 500 is no longer a paper aircraft. The choice of engine supplier came as a bit of a surprise – not so much the selection of P&WC per se – but that Gulfstream would split its allegiance and select a supplier other than Rolls Royce. A clean sheet design replete with promises of game-changing performance and functionality with a new engine supplier is a tall order to deliver for any manufacturer. We suspect that the first book of business for Gulfstream 500s will come with discounts targeting the early model G450 customer installed base.
GLOBAL 5000
-> While still an impressive aircraft, with both Dassault and Gulfstream on the verge of introducing new platforms in this segment, the 5000 will likely fall into third-in-segment market share as it ages. Interior cabin issues (mostly in terms of a lack of options) and the inability to leverage margin space to sustain market share given the economics of scaling down airframes (i.e. generally same build cost but at lower price point) will further challenge the 5000 to compete.
FALCON 5X
-> This model will be Dassault’s most important aircraft. This statement is not merely from a Super Large segment perspective but because it will provide Dassault with the opportunity to offer a stretched version for the ULR segment. The current spec for the Falcon 5X cabin width is equal to the Gulfstream 650 and has more headroom and floor width. The only blip to the program to date has been the confirmation from Snecma that the engine certification program will slip eight months pushing entry into service to 2018. Regardless, this is a beautiful aircraft that is highly likely to lead to the introduction of an ULR Falcon.
->
Category Forecast: Super Large Jets
F5X
F900LX
G500
G450
G5000
23
23
22 21
14 13
0
10
20
70
60
50
40
30
80
2015
UN
IT D
EL
IVE
RY
FO
RE
CA
ST
2018 20212016 2019 20222017 2020 2023 2024
10 YEAR TOTAL = 648 UNITS
2829
28
9
9 8 7 6
10
19
11
11
32
32
35 36
25
22 29 3432
3026
24
DASSAULT 37%$10,818
GULFSTREAM 40%$11,713
BOMBARDIER 23%$6,698
31JETCRAFT.COM
10 YEAR OEMREVENUE
FORECASTSUPER
LARGE JETS
(Figures denoted in millions)

Category Forecast: Ultra Long Range Jets
CATEGORY CHARACTERISTICS
PRICE: $53.8m – $67.5m RANGE: 5,800 – 7,800 nautical miles
GULFSTREAM 650/ER
-> Having worked out the EIS teething problems on the G650, Gulfstream currently enjoys the advantage of offering different options in the segment with the base G650 and ER versions. As expected, the slowdown in G550 sales has affected the model’s residual value and while sales for its 650 variants will be good moving forward, managing the drawdown of the G550 is unlikely to be easy, especially since the G600 will enter service in 2019. That means at least four full years of having to ‘carry’ heavy discounting on the G550.
THE GLOBAL 6000, 7000 & 8000
-> Bombardier’s recent announcement of a 24 month delay to the 7000 was not surprising to the industry for such a program – and our forecast model had already factored in some kind of delay. Notwithstanding Bombardier’s disclosure that it was considering changes to the G7000/8000 wing, a flight test vehicle (FTV1) is almost complete and the model’s market appeal is unquestioned in the long term. The cloud’s silver lining of this announcement for Bombardier may be that it should buoy continued demand for the 6000 as buyers require solutions in the interim.
FALCON 7X, F8X AND ULR
-> When the specifications of the 5X were published and showed it having the widest purpose-built cabin of any business aircraft, it seemed to confirm that the development of an ULR aircraft was a mere formality. Based on the 5X platform, the aircraft will take over as Dassault’s flagship product and join Bombardier and Gulfstream in employing a multiple product offering strategy in this high value segment. The challenge for Dassault is to deliver on the F8X while keeping the new aircraft’s development lower key as they need to entrench the 7X and 8X as viable offerings on the lower scale of the ULR segment to avoid inadvertently training the market to wait for the EIS and bypassing the F8X. The imagined strategy will be to develop an installed base of customers who then migrate through the F7X, F8X and eventually to the new aircraft.
SUPERSONIC BUSINESS JETS
-> A brief perspective on the supersonic initiatives currently in development, as a growing amount of excitement exists in the industry. While undeniably fascinating, the question remains as to how the industry will deal with some of the real world operational issues it will generate. For example, as an industry, we are currently struggling to find qualified pilots for current platforms. The airmanship required to pilot a supersonic aircraft is specialized, so this type of instruction could not be commoditized. We see this issue as significant unless the technology – which has to date focused on aerodynamics and sonic boom suppression challenges – addresses flight control. But that adds another costly layer to the product as well as the technological complexity involved in addressing the issue. For these reasons, we forecast that any product that comes to market will be at the very end of the forecast horizon, in a best case scenario.
->
ULR
F8X
F7X
G650/ER
G650
G600
G550
G8000
G7000
G600059 6142
28 16 16 15 15 13 120
250
200
150
100
50
300
2015
UN
IT D
EL
IVE
RY
FO
RE
CA
ST
2018 20212016 2019 20222017 2020 2023 2024
10 YEAR TOTAL = 2,105 UNITS
29
2929
29
18
18
1827
30
20
23
21
21
22
26
26
23
24
14 14
35
36
36
19
31
37
37
10
34
48
25
46
50
28
23
23
51
11
1130
20
52
31
25
25
28
52
43
22
20
23
43
9
8
7
20
18
30
38
38
20
20
18
34
18
18
16
16
34
BOMBARDIER 37%$49,566
DASSAULT 23%$29,955
GULFSTREAM 40%$53,555
32 10 YEAR MARKET OUTLOOK
10 YEAR OEMREVENUE
FORECASTULTRA LONG RANGE JETS
(Figures denoted in millions)
CATEGORY CHARACTERISTICS
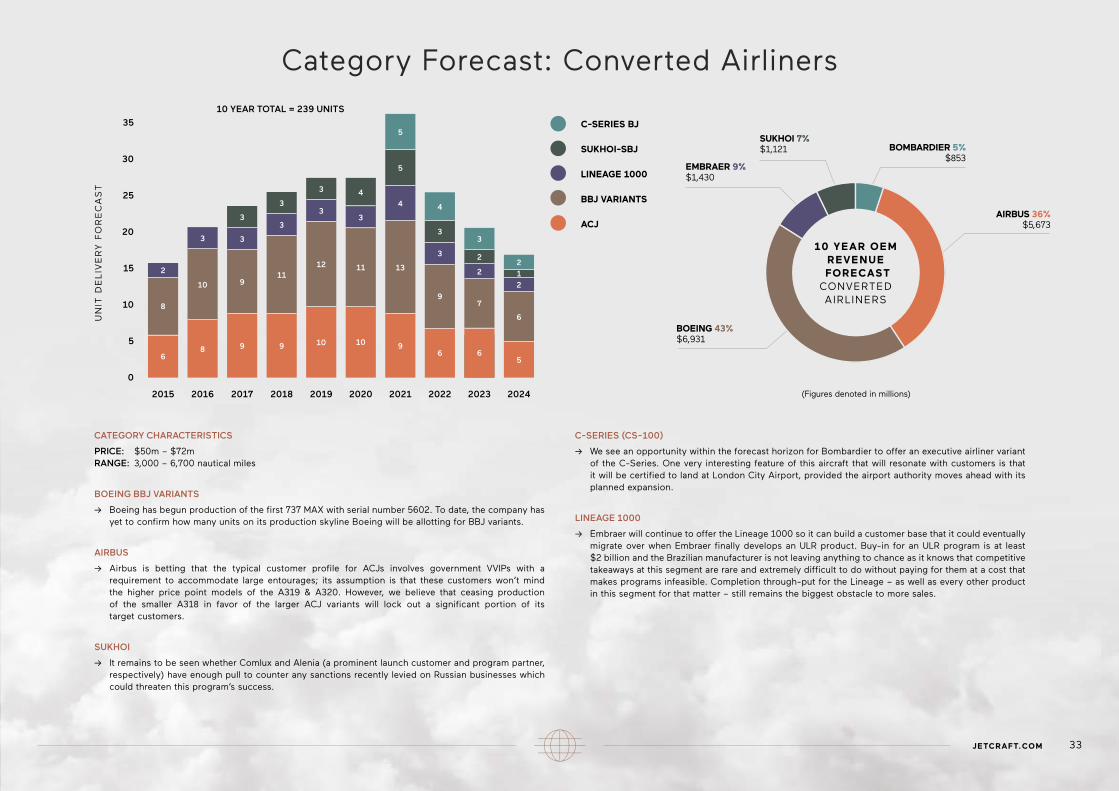
PRICE: $50m – $72m RANGE: 3,000 – 6,700 nautical miles
BOEING BBJ VARIANTS
-> Boeing has begun production of the first 737 MAX with serial number 5602. To date, the company has yet to confirm how many units on its production skyline Boeing will be allotting for BBJ variants.
AIRBUS
-> Airbus is betting that the typical customer profile for ACJs involves government VVIPs with a requirement to accommodate large entourages; its assumption is that these customers won’t mind the higher price point models of the A319 & A320. However, we believe that ceasing production of the smaller A318 in favor of the larger ACJ variants will lock out a significant portion of its target customers.
SUKHOI
-> It remains to be seen whether Comlux and Alenia (a prominent launch customer and program partner, respectively) have enough pull to counter any sanctions recently levied on Russian businesses which could threaten this program’s success.
C-SERIES (CS-100)
-> We see an opportunity within the forecast horizon for Bombardier to offer an executive airliner variant of the C-Series. One very interesting feature of this aircraft that will resonate with customers is that it will be certified to land at London City Airport, provided the airport authority moves ahead with its planned expansion.
LINEAGE 1000
-> Embraer will continue to offer the Lineage 1000 so it can build a customer base that it could eventually migrate over when Embraer finally develops an ULR product. Buy-in for an ULR program is at least $2 billion and the Brazilian manufacturer is not leaving anything to chance as it knows that competitive takeaways at this segment are rare and extremely difficult to do without paying for them at a cost that makes programs infeasible. Completion through-put for the Lineage – as well as every other product in this segment for that matter – still remains the biggest obstacle to more sales.
Category Forecast: Converted Airliners
->
C-SERIES BJ
SUKHOI-SBJ
LINEAGE 1000
BBJ VARIANTS
ACJ
6
0
30
20
25
15
10
5
35
2015
UN
IT D
EL
IVE
RY
FO
RE
CA
ST
2018 20212016 2019 20222017 2020 2023 2024
10 YEAR TOTAL = 239 UNITS
8
8 9 9
9
2
10
10 10 9
9
6 0
3 3
3
33
3
3
3
3
3
111112
4
4 4
13
5
5
6
6
5
7
2
2
22
3
1
BOEING 43%$6,931
AIRBUS 36%$5,673
BOMBARDIER 5%$853
EMBRAER 9%$1,430
SUKHOI 7%$1,121
33JETCRAFT.COM
10 YEAR OEMREVENUE
FORECASTCONVERTED AIRLINERS
(Figures denoted in millions)
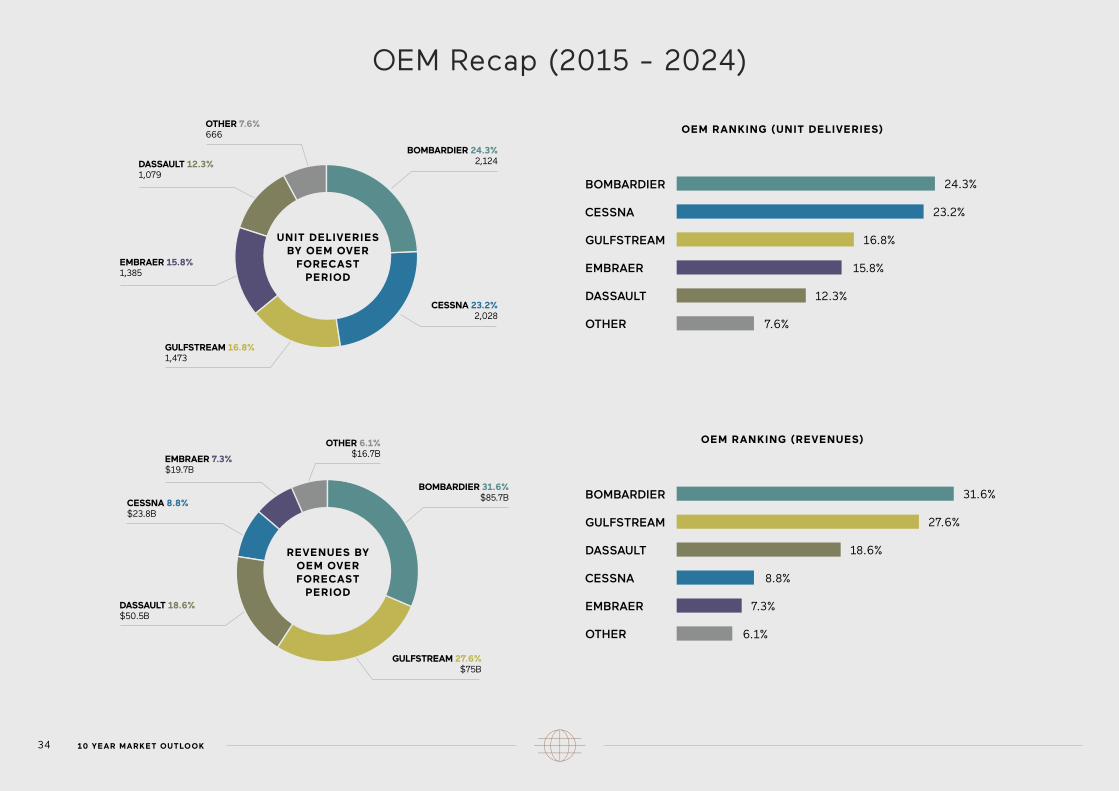
OEM Recap (2015 - 2024)
BOMBARDIER 31.6%$85.7B
GULFSTREAM 27.6%$75B
CESSNA 8.8%$23.8B
DASSAULT 18.6%$50.5B
EMBRAER 7.3%$19.7B
OTHER 6.1%$16.7B
OEM RANKING (UNIT DELIVERIES)
BOMBARDIER
CESSNA
GULFSTREAM
EMBRAER
DASSAULT
OTHER
24.3%
23.2%
16.8%
15.8%
12.3%
7.6%
OEM RANKING (REVENUES)
BOMBARDIER
GULFSTREAM
DASSAULT
CESSNA
EMBRAER
OTHER
31.6%
27.6%
18.6%
8.8%
7.3%
6.1%
BOMBARDIER 24.3%2,124
CESSNA 23.2%2,028
GULFSTREAM 16.8%1,473
EMBRAER 15.8%1,385
DASSAULT 12.3%1,079
OTHER 7.6%666
34 10 YEAR MARKET OUTLOOK
UNIT DELIVERIES BY OEM OVER
FORECAST PERIOD
REVENUES BY OEM OVER FORECAST
PERIOD
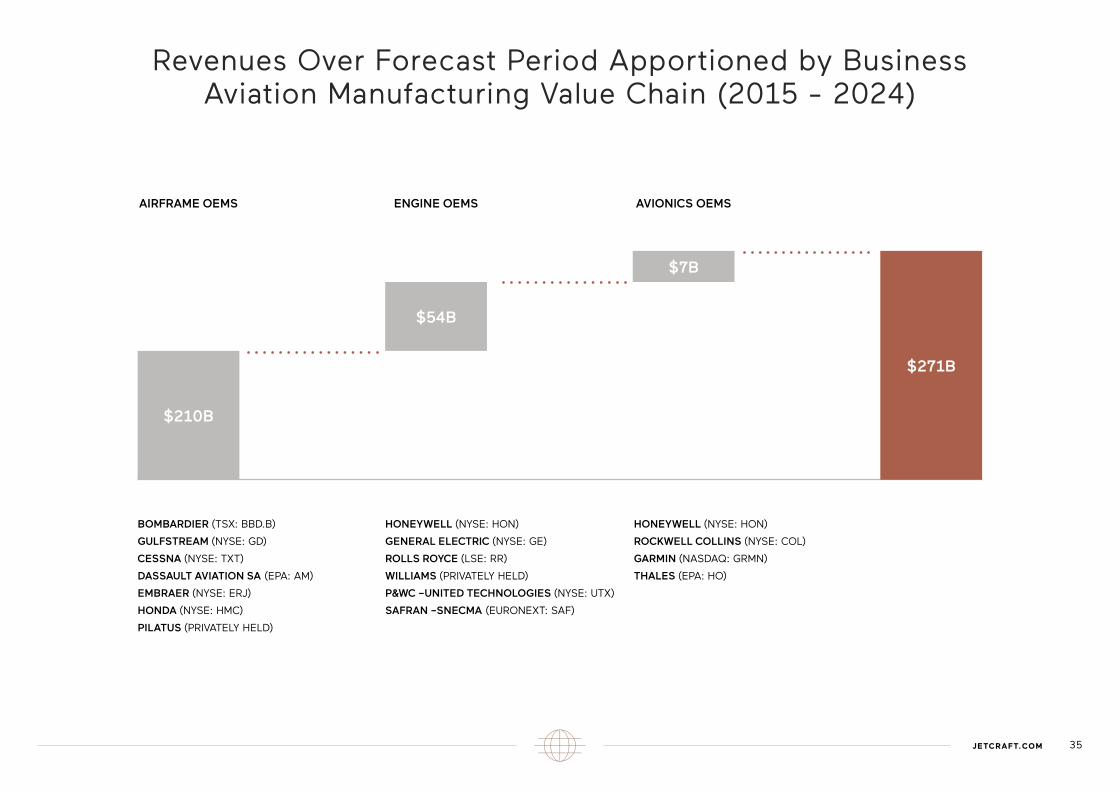
BOMBARDIER (TSX: BBD.B)
GULFSTREAM (NYSE: GD)
CESSNA (NYSE: TXT)
DASSAULT AVIATION SA (EPA: AM)
EMBRAER (NYSE: ERJ)
HONDA (NYSE: HMC)
PILATUS (PRIVATELY HELD)
HONEYWELL (NYSE: HON)
GENERAL ELECTRIC (NYSE: GE)
ROLLS ROYCE (LSE: RR)
WILLIAMS (PRIVATELY HELD)
P&WC –UNITED TECHNOLOGIES (NYSE: UTX)
SAFRAN –SNECMA (EURONEXT: SAF)
HONEYWELL (NYSE: HON)
ROCKWELL COLLINS (NYSE: COL)
GARMIN (NASDAQ: GRMN)
THALES (EPA: HO)
AIRFRAME OEMS
$210B
ENGINE OEMS
$54B
Revenues Over Forecast Period Apportioned by Business Aviation Manufacturing Value Chain (2015 - 2024)
AVIONICS OEMS
$7B
$271B
35JETCRAFT.COM
WHAT THE BUSINESS AVIATION OUTLOOK MEANS FOR ENGINE & AVIONICS OEMS

Avionics OEMs: Revenue Share Over Forecast Period (2015 - 2024)
0
1,200
1,000
800
600
400
200
1,400
1,600
VERYLIGHT
MA
RK
ET
PR
ES
EN
CE
(U
NIT
S)
LIGHT SUPERLIGHT
MIDSIZE SUPERMIDSIZE
LARGE SUPERLARGE
ULTRALONG RANGE
CONVERTEDAIRLINES
HONEYWELL
ROCKWELL
GARMIN
HONEYWELL
ROCKWELL COLLINS
GARMIN
The graph above illustrates the respective strategic orientations for each avionics OEM. Rockwell’s strategy is to secure program participation or Tier I vendor status (for its flight decks) in each of the business aviation segments, whereas Honeywell and Garmin chose to focus on particular ends of the segment scale, i.e. Garmin at the lower-end segments and Honeywell at the higher-end. Garmin in particular found favor with OEMs wishing to tap into the first-time buyer customer base with more intuitive flight deck design and functionality e.g. such as flight envelope protection, enhanced synthetic vision and touch- screen capability. In fact, with all the experience they’re amassing on current programs, Garmin could easily start vying
for the new larger widebody models such as Embraer’s first purpose-built widebody aircraft which it will eventually announce presumably within the forecast period.
Another strategic consideration of note when we look at the avionics OEM landscape is the potential horizontal play posed by the acquisition of Rockwell Collins by a major aerospace company such as United Technologies. With UTS looking to divest ‘primes’ as they did Sikorsky, integrating an avionics OEM would create a formidable competitor to counterbalance Honeywell, with both aerospace powerhouses enjoying world class powerplant and avionics capabilities.
HONEYWELL 42%$3,052
ROCKWELL COLLINS 39%
$2820
OTHER 3%$204GARMIN 16%
$1,136
REVENUES BY OEMOVER FORECAST
PERIOD
37JETCRAFT.COM
(Figures denoted in millions)
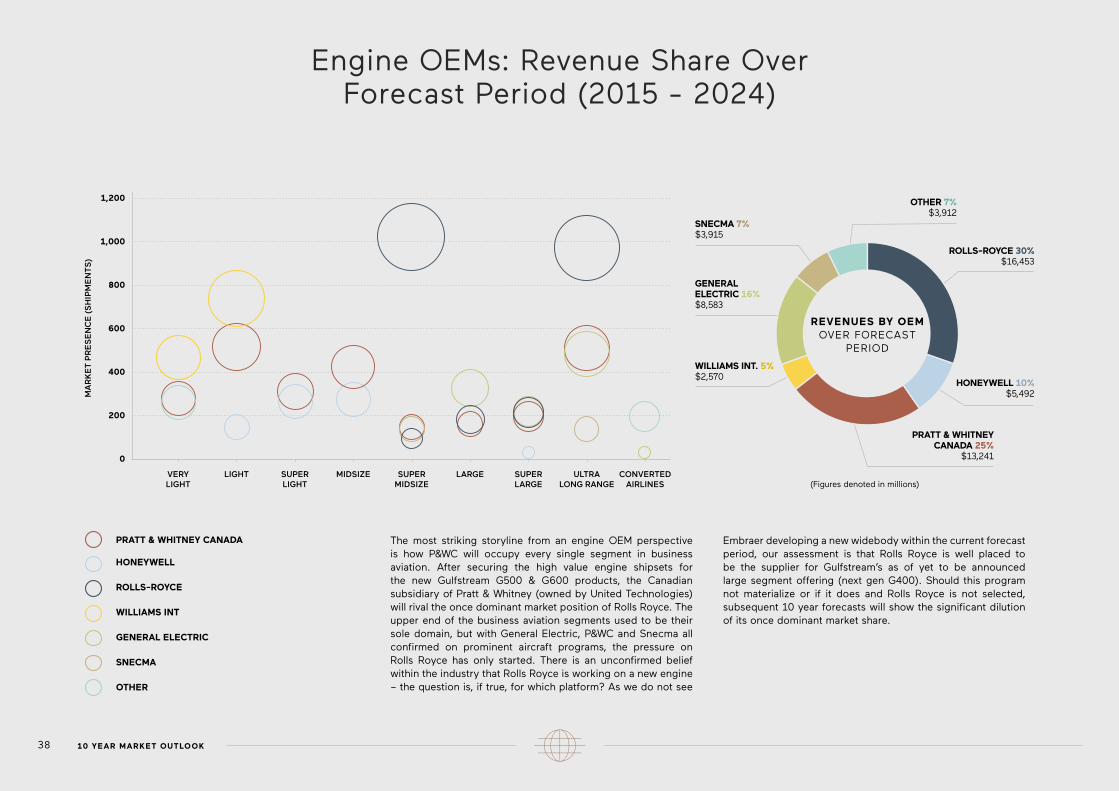
The most striking storyline from an engine OEM perspective is how P&WC will occupy every single segment in business aviation. After securing the high value engine shipsets for the new Gulfstream G500 & G600 products, the Canadian subsidiary of Pratt & Whitney (owned by United Technologies) will rival the once dominant market position of Rolls Royce. The upper end of the business aviation segments used to be their sole domain, but with General Electric, P&WC and Snecma all confirmed on prominent aircraft programs, the pressure on Rolls Royce has only started. There is an unconfirmed belief within the industry that Rolls Royce is working on a new engine – the question is, if true, for which platform? As we do not see
Embraer developing a new widebody within the current forecast period, our assessment is that Rolls Royce is well placed to be the supplier for Gulfstream’s as of yet to be announced large segment offering (next gen G400). Should this program not materialize or if it does and Rolls Royce is not selected, subsequent 10 year forecasts will show the significant dilution of its once dominant market share.
Engine OEMs: Revenue Share Over Forecast Period (2015 - 2024)
0
200
400
600
800
1,000
1,200
VERYLIGHT
MA
RK
ET
PR
ES
EN
CE
(S
HIP
ME
NT
S)
LIGHT SUPERLIGHT
MIDSIZE SUPERMIDSIZE
LARGE SUPERLARGE
ULTRALONG RANGE
CONVERTEDAIRLINES
PRATT & WHITNEY CANADA
HONEYWELL
ROLLS-ROYCE
WILLIAMS INT
GENERAL ELECTRIC
SNECMA
OTHER
PRATT & WHITNEY CANADA
HONEYWELL
ROLLS-ROYCE
WILLIAMS INT
GENERAL ELECTRIC
SNECMA
OTHER
PRATT & WHITNEY CANADA 25%
$13,241
OTHER 7%$3,912
ROLLS-ROYCE 30%$16,453
HONEYWELL 10%$5,492
SNECMA 7%$3,915
GENERAL ELECTRIC 16%$8,583
WILLIAMS INT. 5%$2,570
REVENUES BY OEMOVER FORECAST
PERIOD
38 10 YEAR MARKET OUTLOOK
(Figures denoted in millions)

CONCLUSION

40 10 YEAR MARKET OUTLOOK
Conclusion
The recovery in business aviation during the post recession period has been, by all accounts, underwhelming. Since the trough year in 2011, annual unit delivery growth has averaged an anemic 1.2% (0.6% when Eclipse deliveries are excluded).
Clearly, this is not what the industry expected. The expectation was that after a sharp downturn, unit deliveries would rebound once the economy had a chance to go through a balance sheet adjustment period. As the U.S. economy expanded, the industry began to track corporate profits in anticipation of the rebound as previous business cycles showed a high correlation between earnings and unit deliveries.
However, when corporate profits rebounded and deliveries did not follow suit, it was collectively reasoned it was on account of the jobless recovery. When the economy in the U.S. then surpassed pre-2008 employment levels and unit deliveries continued to remain flat, commentators “explained” it was because wealth creation was lagging. Finally, when the amount of ultra high net worth individuals (e.g. $500m+) increased to record levels without materially improving unit delivery performance, the business aviation community finally took
notice. A key issue seems to be the continued use of the same outdated understanding of what propagates the widespread belief that aircraft order and deliveries are “just lagging”.
In searching for a better explanation for the weak and asynchronous recovery, we learned two very important things.
Firstly, we discovered that given the economic challenges facing other regions, there is a strong likelihood that the global economy will not benefit from a virtuous cycle (i.e. the North American economies will not be able to count on foreign markets to fuel growth) within the forecast horizon. This in turn has impacted business confidence which is adversely affecting aircraft transaction activity.
Secondly, we’ve observed some profound changes in behaviours. For instance, customers are shying away from emotional purchases, with many losing their appetite for aircraft ownership altogether. In other cases, companies are electing to use available cash to buy back shares at a time when equities are over valued. The concern is that they’re doing this in lieu of placing new orders for aircraft. This year’s tally is projected to exceed $600 million which represents 30% of available cash (incidentally, in
2007, this figure was 34%). The difference then was that the pace of share buybacks increased in parallel with equity markets as opposed to today where we see the same level of share buyback activity in an equity market environment that is already over-priced. The Fed maintains that safeguards have been installed to prevent a recession similar to the one in 2008. Our fear is that policy makers focus on safeguards at the expense of clarity regarding what will trigger the next downturn.
The other change we’ve observed in this business cycle is that we see OEMs opting to develop more widebody aircraft and crowding the higher segments with multiple offerings. We believe that this further supports the assertion that narrowbody demand will not return to pre-2008 levels within the 10 year forecast period.
Faced with this changing reality in our industry, we believe in still engineering deals where we can, but always with strict financial discipline. We believe in continually tasking our international offices to become experts in their respective regions by tracking business confidence and the regulatory environment (the two key metrics that we know drive sales). The ultimate goal should be for us all to be more effective companies through a better understanding of our market.

41JETCRAFT.COM
-> Aviation International News (AIN)
-> Bloomberg Business
-> BMI Research
-> Business & Commercial Aviation (B&CA)
-> Focus Economics
-> Haver Analytics
-> JetNet
-> KKR Global Perspectives
-> Knight Frank Wealth Report
-> McKinsey Quarterly
-> Moody’s
-> National Bureau of Economic Research (U.S.)
-> Stratfor
-> The Federal Reserve Bank
-> The International Monetary Fund (IMF)
-> The Wall Street Journal
-> The World Bank
-> Transparency International
-> U.S. Department of Commerce
-> Vref
-> Wealth-X World Ultra Wealth Report 2014
-> World Economic Forum, Global Risks Report 2015
Sources

APPENDIX
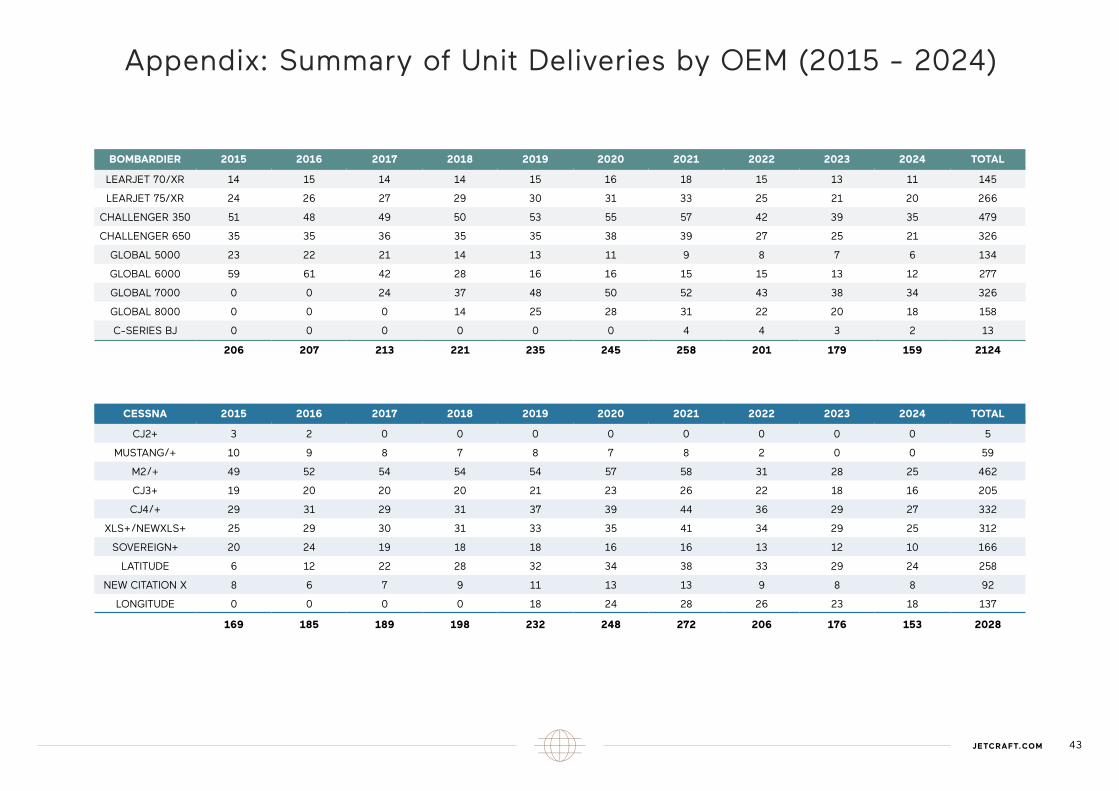
BOMBARDIER 2015 2016 2017 2018 2019 2020 2021 2022 2023 2024 TOTAL
LEARJET 70/XR 14 15 14 14 15 16 18 15 13 11 145
LEARJET 75/XR 24 26 27 29 30 31 33 25 21 20 266
CHALLENGER 350 51 48 49 50 53 55 57 42 39 35 479
CHALLENGER 650 35 35 36 35 35 38 39 27 25 21 326
GLOBAL 5000 23 22 21 14 13 11 9 8 7 6 134
GLOBAL 6000 59 61 42 28 16 16 15 15 13 12 277
GLOBAL 7000 0 0 24 37 48 50 52 43 38 34 326
GLOBAL 8000 0 0 0 14 25 28 31 22 20 18 158
C-SERIES BJ 0 0 0 0 0 0 4 4 3 2 13
206 207 213 221 235 245 258 201 179 159 2124
CESSNA 2015 2016 2017 2018 2019 2020 2021 2022 2023 2024 TOTAL
CJ2+ 3 2 0 0 0 0 0 0 0 0 5
MUSTANG/+ 10 9 8 7 8 7 8 2 0 0 59
M2/+ 49 52 54 54 54 57 58 31 28 25 462
CJ3+ 19 20 20 20 21 23 26 22 18 16 205
CJ4/+ 29 31 29 31 37 39 44 36 29 27 332
XLS+/NEWXLS+ 25 29 30 31 33 35 41 34 29 25 312
SOVEREIGN+ 20 24 19 18 18 16 16 13 12 10 166
LATITUDE 6 12 22 28 32 34 38 33 29 24 258
NEW CITATION X 8 6 7 9 11 13 13 9 8 8 92
LONGITUDE 0 0 0 0 18 24 28 26 23 18 137
169 185 189 198 232 248 272 206 176 153 2028
Appendix: Summary of Unit Deliveries by OEM (2015 - 2024)
43JETCRAFT.COM
44 10 YEAR MARKET OUTLOOK
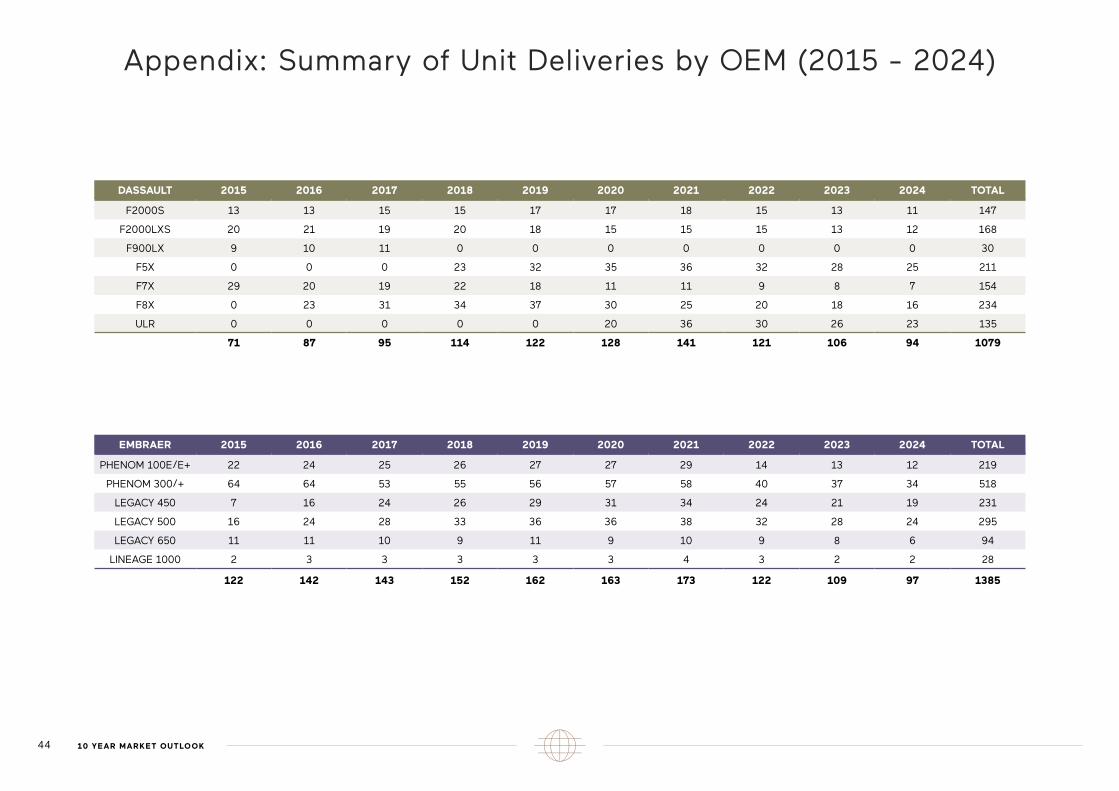
DASSAULT 2015 2016 2017 2018 2019 2020 2021 2022 2023 2024 TOTAL
F2000S 13 13 15 15 17 17 18 15 13 11 147
F2000LXS 20 21 19 20 18 15 15 15 13 12 168
F900LX 9 10 11 0 0 0 0 0 0 0 30
F5X 0 0 0 23 32 35 36 32 28 25 211
F7X 29 20 19 22 18 11 11 9 8 7 154
F8X 0 23 31 34 37 30 25 20 18 16 234
ULR 0 0 0 0 0 20 36 30 26 23 135
71 87 95 114 122 128 141 121 106 94 1079
EMBRAER 2015 2016 2017 2018 2019 2020 2021 2022 2023 2024 TOTAL
PHENOM 100E/E+ 22 24 25 26 27 27 29 14 13 12 219
PHENOM 300/+ 64 64 53 55 56 57 58 40 37 34 518
LEGACY 450 7 16 24 26 29 31 34 24 21 19 231
LEGACY 500 16 24 28 33 36 36 38 32 28 24 295
LEGACY 650 11 11 10 9 11 9 10 9 8 6 94
LINEAGE 1000 2 3 3 3 3 3 4 3 2 2 28
122 142 143 152 162 163 173 122 109 97 1385
Appendix: Summary of Unit Deliveries by OEM (2015 - 2024)
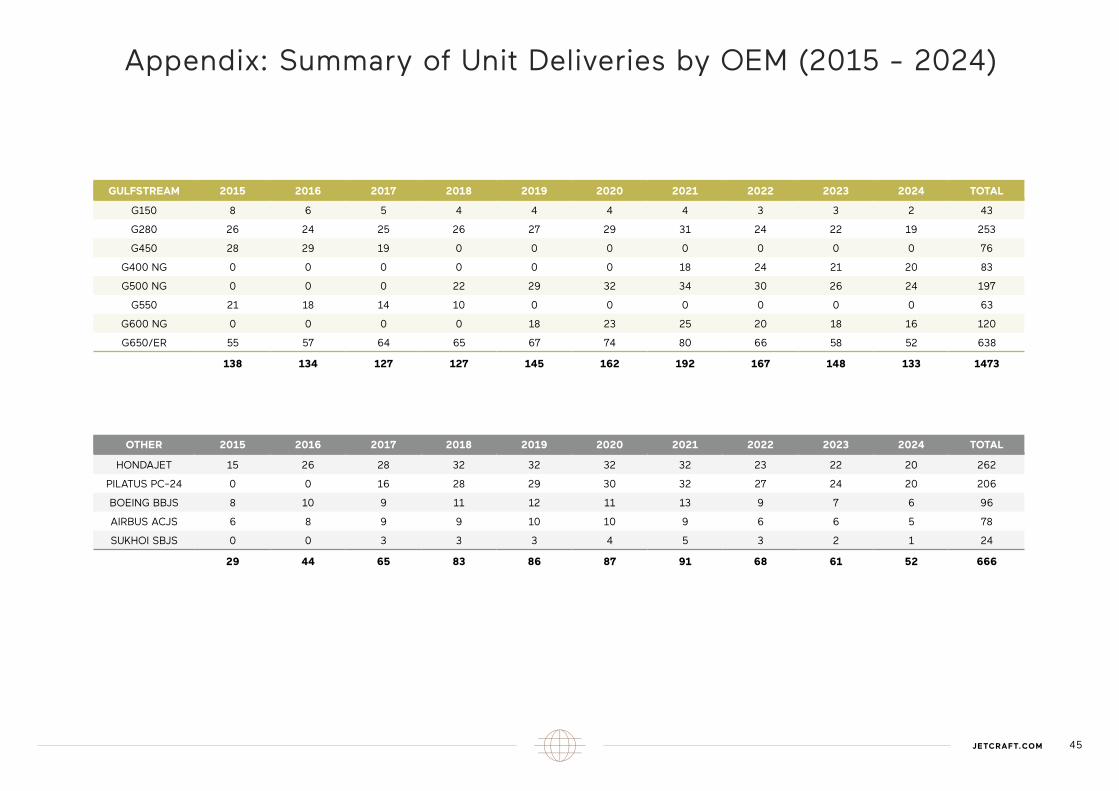
45JETCRAFT.COM
GULFSTREAM 2015 2016 2017 2018 2019 2020 2021 2022 2023 2024 TOTAL
G150 8 6 5 4 4 4 4 3 3 2 43
G280 26 24 25 26 27 29 31 24 22 19 253
G450 28 29 19 0 0 0 0 0 0 0 76
G400 NG 0 0 0 0 0 0 18 24 21 20 83
G500 NG 0 0 0 22 29 32 34 30 26 24 197
G550 21 18 14 10 0 0 0 0 0 0 63
G600 NG 0 0 0 0 18 23 25 20 18 16 120
G650/ER 55 57 64 65 67 74 80 66 58 52 638
138 134 127 127 145 162 192 167 148 133 1473
OTHER 2015 2016 2017 2018 2019 2020 2021 2022 2023 2024 TOTAL
HONDAJET 15 26 28 32 32 32 32 23 22 20 262
PILATUS PC-24 0 0 16 28 29 30 32 27 24 20 206
BOEING BBJS 8 10 9 11 12 11 13 9 7 6 96
AIRBUS ACJS 6 8 9 9 10 10 9 6 6 5 78
SUKHOI SBJS 0 0 3 3 3 4 5 3 2 1 24
29 44 65 83 86 87 91 68 61 52 666
Appendix: Summary of Unit Deliveries by OEM (2015 - 2024)
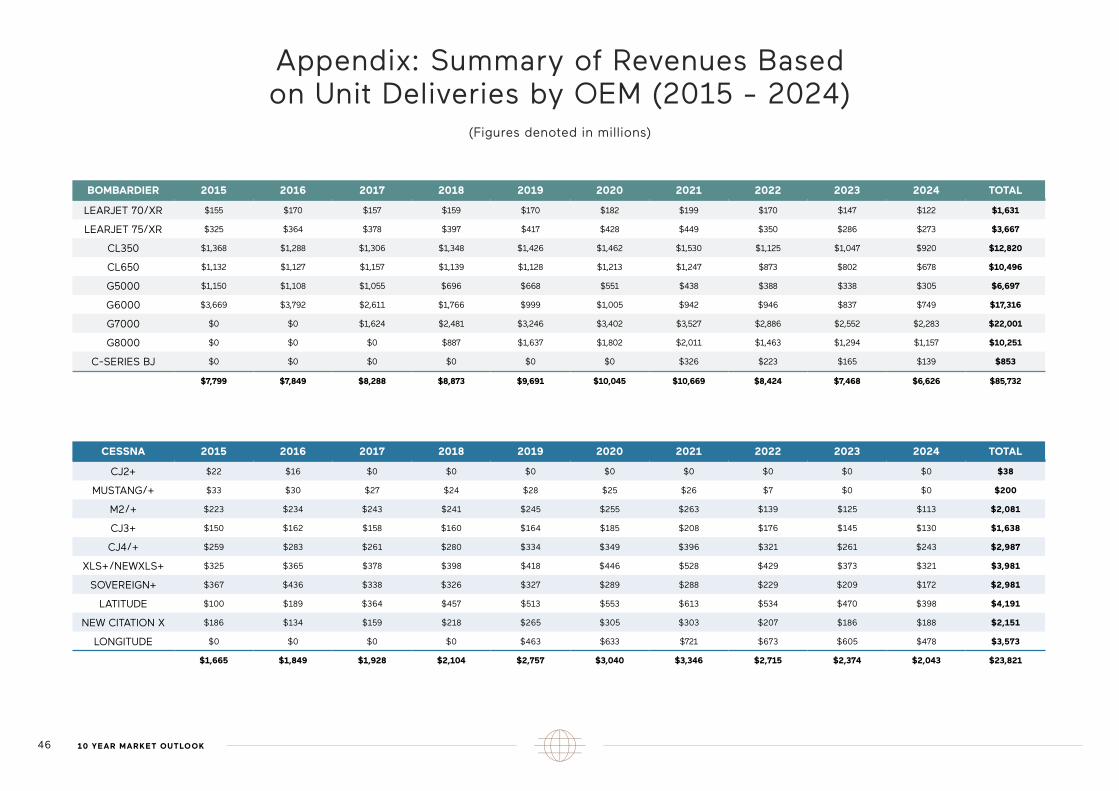
46 10 YEAR MARKET OUTLOOK
Appendix: Summary of Revenues Based on Unit Deliveries by OEM (2015 - 2024)
(Figures denoted in millions)
BOMBARDIER 2015 2016 2017 2018 2019 2020 2021 2022 2023 2024 TOTAL
LEARJET 70/XR $155 $170 $157 $159 $170 $182 $199 $170 $147 $122 $1,631
LEARJET 75/XR $325 $364 $378 $397 $417 $428 $449 $350 $286 $273 $3,667
CL350 $1,368 $1,288 $1,306 $1,348 $1,426 $1,462 $1,530 $1,125 $1,047 $920 $12,820
CL650 $1,132 $1,127 $1,157 $1,139 $1,128 $1,213 $1,247 $873 $802 $678 $10,496
G5000 $1,150 $1,108 $1,055 $696 $668 $551 $438 $388 $338 $305 $6,697
G6000 $3,669 $3,792 $2,611 $1,766 $999 $1,005 $942 $946 $837 $749 $17,316
G7000 $0 $0 $1,624 $2,481 $3,246 $3,402 $3,527 $2,886 $2,552 $2,283 $22,001
G8000 $0 $0 $0 $887 $1,637 $1,802 $2,011 $1,463 $1,294 $1,157 $10,251
C-SERIES BJ $0 $0 $0 $0 $0 $0 $326 $223 $165 $139 $853
$7,799 $7,849 $8,288 $8,873 $9,691 $10,045 $10,669 $8,424 $7,468 $6,626 $85,732
CESSNA 2015 2016 2017 2018 2019 2020 2021 2022 2023 2024 TOTAL
CJ2+ $22 $16 $0 $0 $0 $0 $0 $0 $0 $0 $38
MUSTANG/+ $33 $30 $27 $24 $28 $25 $26 $7 $0 $0 $200
M2/+ $223 $234 $243 $241 $245 $255 $263 $139 $125 $113 $2,081
CJ3+ $150 $162 $158 $160 $164 $185 $208 $176 $145 $130 $1,638
CJ4/+ $259 $283 $261 $280 $334 $349 $396 $321 $261 $243 $2,987
XLS+/NEWXLS+ $325 $365 $378 $398 $418 $446 $528 $429 $373 $321 $3,981
SOVEREIGN+ $367 $436 $338 $326 $327 $289 $288 $229 $209 $172 $2,981
LATITUDE $100 $189 $364 $457 $513 $553 $613 $534 $470 $398 $4,191
NEW CITATION X $186 $134 $159 $218 $265 $305 $303 $207 $186 $188 $2,151
LONGITUDE $0 $0 $0 $0 $463 $633 $721 $673 $605 $478 $3,573
$1,665 $1,849 $1,928 $2,104 $2,757 $3,040 $3,346 $2,715 $2,374 $2,043 $23,821
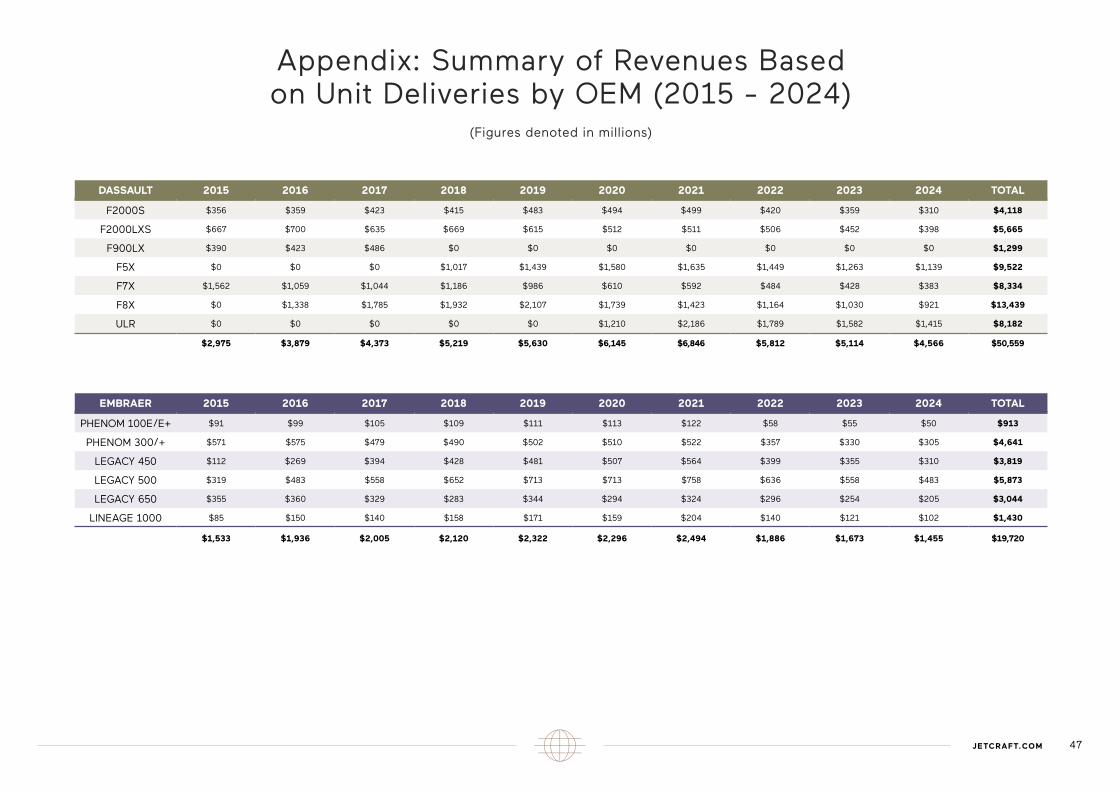
47JETCRAFT.COM
Appendix: Summary of Revenues Based on Unit Deliveries by OEM (2015 - 2024)
(Figures denoted in millions)
DASSAULT 2015 2016 2017 2018 2019 2020 2021 2022 2023 2024 TOTAL
F2000S $356 $359 $423 $415 $483 $494 $499 $420 $359 $310 $4,118
F2000LXS $667 $700 $635 $669 $615 $512 $511 $506 $452 $398 $5,665
F900LX $390 $423 $486 $0 $0 $0 $0 $0 $0 $0 $1,299
F5X $0 $0 $0 $1,017 $1,439 $1,580 $1,635 $1,449 $1,263 $1,139 $9,522
F7X $1,562 $1,059 $1,044 $1,186 $986 $610 $592 $484 $428 $383 $8,334
F8X $0 $1,338 $1,785 $1,932 $2,107 $1,739 $1,423 $1,164 $1,030 $921 $13,439
ULR $0 $0 $0 $0 $0 $1,210 $2,186 $1,789 $1,582 $1,415 $8,182
$2,975 $3,879 $4,373 $5,219 $5,630 $6,145 $6,846 $5,812 $5,114 $4,566 $50,559
EMBRAER 2015 2016 2017 2018 2019 2020 2021 2022 2023 2024 TOTAL
PHENOM 100E/E+ $91 $99 $105 $109 $111 $113 $122 $58 $55 $50 $913
PHENOM 300/+ $571 $575 $479 $490 $502 $510 $522 $357 $330 $305 $4,641
LEGACY 450 $112 $269 $394 $428 $481 $507 $564 $399 $355 $310 $3,819
LEGACY 500 $319 $483 $558 $652 $713 $713 $758 $636 $558 $483 $5,873
LEGACY 650 $355 $360 $329 $283 $344 $294 $324 $296 $254 $205 $3,044
LINEAGE 1000 $85 $150 $140 $158 $171 $159 $204 $140 $121 $102 $1,430
$1,533 $1,936 $2,005 $2,120 $2,322 $2,296 $2,494 $1,886 $1,673 $1,455 $19,720
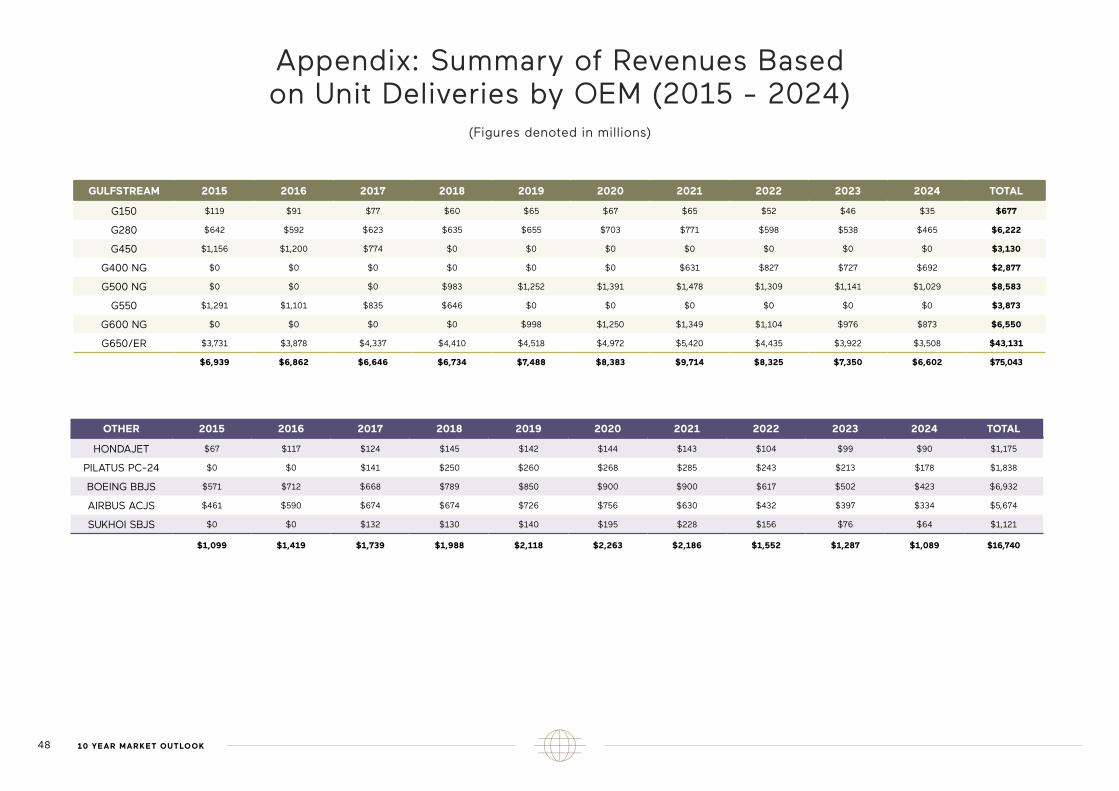
Appendix: Summary of Revenues Based on Unit Deliveries by OEM (2015 - 2024)
(Figures denoted in millions)
GULFSTREAM 2015 2016 2017 2018 2019 2020 2021 2022 2023 2024 TOTAL
G150 $119 $91 $77 $60 $65 $67 $65 $52 $46 $35 $677
G280 $642 $592 $623 $635 $655 $703 $771 $598 $538 $465 $6,222
G450 $1,156 $1,200 $774 $0 $0 $0 $0 $0 $0 $0 $3,130
G400 NG $0 $0 $0 $0 $0 $0 $631 $827 $727 $692 $2,877
G500 NG $0 $0 $0 $983 $1,252 $1,391 $1,478 $1,309 $1,141 $1,029 $8,583
G550 $1,291 $1,101 $835 $646 $0 $0 $0 $0 $0 $0 $3,873
G600 NG $0 $0 $0 $0 $998 $1,250 $1,349 $1,104 $976 $873 $6,550
G650/ER $3,731 $3,878 $4,337 $4,410 $4,518 $4,972 $5,420 $4,435 $3,922 $3,508 $43,131
$6,939 $6,862 $6,646 $6,734 $7,488 $8,383 $9,714 $8,325 $7,350 $6,602 $75,043
OTHER 2015 2016 2017 2018 2019 2020 2021 2022 2023 2024 TOTAL
HONDAJET $67 $117 $124 $145 $142 $144 $143 $104 $99 $90 $1,175
PILATUS PC-24 $0 $0 $141 $250 $260 $268 $285 $243 $213 $178 $1,838
BOEING BBJS $571 $712 $668 $789 $850 $900 $900 $617 $502 $423 $6,932
AIRBUS ACJS $461 $590 $674 $674 $726 $756 $630 $432 $397 $334 $5,674
SUKHOI SBJS $0 $0 $132 $130 $140 $195 $228 $156 $76 $64 $1,121
$1,099 $1,419 $1,739 $1,988 $2,118 $2,263 $2,186 $1,552 $1,287 $1,089 $16,740
48 10 YEAR MARKET OUTLOOK

SAFE HARBOR STATEMENT
No representation, guarantee or warranty is given as to the accuracy, completeness or likelihood of achievement or reasonableness of any forecasts, projections or any other forward-looking statements made by or on behalf of Jetcraft. Forecasts, projections and forward-looking statements are, by their nature, subject to significant uncertainties and unpredictable variations in market conditions. The information contained herein should not be construed as advice to purchase or sell aircraft or make any other business decisions. Neither Jetcraft nor its owners, directors, officers, employees, agents, independent contractors or other representatives shall be liable for any loss, expense or cost (including without limitation, any consequential or indirect loss) that you incur directly or indirectly as a result of or in connection with the use of data, information, estimates, projections, forecasts or forward-looking statements contained herein or otherwise provided by Jetcraft.

JETCRAFT.COM