Embed Size (px)
Citation preview
July 2012
NEW OAKVILLE HOSPITAL
Oakville Health Protection Air Quality By-Law Application for Approval
REP
OR
T
Report Number: 10-1151-0350
Distribution:
1 Copy - EllisDon Corporation, Oakville, Ontario
2 Copies - The Corporation of the Town of Oakville
2 Copies - Golder Associates Ltd., Mississauga, Ontario
Submitted to:EllisDon Corporation 504 Iroquois Shore Road, Unit #6 Oakville, Ontario L6H 3K4
NEW OAKVILLE HOSPITAL - HPAQB APPLICATION FOR APPROVAL
July 2012 Report No. 10-1151-0350 i
EXECUTIVE SUMMARY This Town of Oakville (the Town) Health Protection Air Quality By-Law (HPAQB) Application for Approval
(Application) was prepared to assess the potential health risk of emissions of fine particulate matter (FPM) and
its precursors from the proposed New Oakville Hospital (NOH). This Application was prepared following the
Oakville document “Guidance for Implementation of Oakville Health Protection Air Quality By-Law 2010-035,
Section 5 and 6 and Approval Requirements for Major Emitters v.5 June 2011”.
The NOH will be constructed at 3000 Third Line in Oakville, Ontario to replace the existing Oakville-Trafalgar
Memorial Hospital. It will provide healthcare facilities to the residents of Oakville and the surrounding area.
The primary sources of FPM from the NOH facility included in the assessment are the diesel fired emergency
generators, natural gas fired boilers, and the cooling towers. To simulate the impact of the NOH,,time varying
emission rates were developed based on U.S. EPA emission factors or manufacturer’s data along with expected
fuel consumption or operating data. These data were used with the aid of the CALPUFF modelling system to
estimate the ambient level of FPM from NOH operations.
This assessment considered both average and maximum operating scenarios for the NOH steam and hot water
boiler systems. As the emergency generator maintenance testing schedule does not vary from year to year, it is
assumed that the generator operation remains the same in both average and maximum operating scenarios.
The NOH cooling towers will generally operate during the cooling season between March 1st and September
30th. Natural gas consumption was based on an energy model completed during the design stage of the NOH.
Actual consumption rates will not be available until after construction and operation of the facility.
Dispersion modelling of emissions was carried out with the aid of the CALPUFF model, although an updated
version of the model was used. Modelling inputs such as meteorological data and background concentrations
were provided by the Town. In addition, self-contamination of the NOH was evaluated based on the results of a
previous wind-tunnel project.
Based on modelling results, the NOH facility does not significantly affect the existing airshed in Oakville or on
site sensitive receptors as the facility-induced FPM concentrations for average and maximum scenarios are less
than 0.2 µg/m3 (micrograms per cubic metre) annually, a criterion defined by the HPAQB. As a result, a health
risk assessment is not required.

NEW OAKVILLE HOSPITAL - HPAQB APPLICATION FOR APPROVAL
July 2012 Report No. 10-1151-0350 ii
Table of Contents
1.0 INTRODUCTION ............................................................................................................................................................... 1
2.0 FACILITY DESCRIPTION ................................................................................................................................................. 2
2.1 Overview .............................................................................................................................................................. 2
2.2 Location ............................................................................................................................................................... 2
2.3 Buildings .............................................................................................................................................................. 2
2.4 Raw Materials, Products and Processes ............................................................................................................. 3
2.5 Emission Sources and Processes ....................................................................................................................... 4
2.5.1 Sources Considered Insignificant ................................................................................................................... 4
2.6 Emission Control Equipment and Procedures and Emissions Monitoring ........................................................... 4
2.7 Identification and Quantification of Substances Released to Air .......................................................................... 5
2.7.1 Diesel Fired Emergency Generators .............................................................................................................. 6
2.7.2 Natural Gas Fired Boilers ............................................................................................................................... 6
2.7.3 Cooling Towers .............................................................................................................................................. 6
2.7.4 Equipment Maintenance ................................................................................................................................ 6
2.7.5 Average and Maximum Operating Scenarios ................................................................................................. 7
3.0 EVALUATION ................................................................................................................................................................... 8
3.1 Modelling Approach and Model Selection ............................................................................................................ 8
3.2 Model Inputs ...................................................................................................................................................... 10
3.2.1 Facility Emissions Estimation Methods ........................................................................................................ 11
3.2.2 Model Input Options ..................................................................................................................................... 11
3.2.3 Non-Default Settings .................................................................................................................................... 11
3.2.4 Coordinate System....................................................................................................................................... 12
3.2.5 Meteorology, Land Use and Terrain Data .................................................................................................... 12
3.2.6 Receptors ..................................................................................................................................................... 12
3.2.7 Building Downwash ...................................................................................................................................... 13
3.2.8 Background and Cumulative Concentrations ............................................................................................... 13
3.2.9 Chemistry Models ........................................................................................................................................ 13
3.2.10 Species Modelled ......................................................................................................................................... 13
NEW OAKVILLE HOSPITAL - HPAQB APPLICATION FOR APPROVAL
July 2012 Report No. 10-1151-0350 iii
3.3 Same Structure Contamination .......................................................................................................................... 14
4.0 MAPPING ....................................................................................................................................................................... 16
5.0 CONCLUSION ................................................................................................................................................................ 17
TABLES
Table 1: Annual Operations Summary ....................................................................................................................................... 3
Table 2: Emission Control Practices .......................................................................................................................................... 4
Table 3: Health-Risk Air Pollutant Total Annual Emissions ........................................................................................................ 5
Table 4: Annual Average and Maximum Emissions ................................................................................................................... 5
Table 5: Maximum Emissions .................................................................................................................................................... 5
Table 6: Additional CALPUFF Information ................................................................................................................................. 8
Table 7: Point Source Dispersion Modelling Input Parameters ................................................................................................ 10
Table 8: Model Input Options ................................................................................................................................................... 11
Table 9: Dilution Factors .......................................................................................................................................................... 14
Table 10: FPM Self-Contamination Modelling Results ............................................................................................................. 15
Table 11: FPM Modelling Results ............................................................................................................................................ 16
FIGURES
Figure 1 – Site Location Plan
Figure 2 – 3 km Aerial Photograph
Figure 3 – Zoning Map
Figure 4 – Building Plan
Figure 5 – Dispersion Modelling Plan
Figure 6 – Facility-Induced FPM Contour Map – Average
Figure 7 - Facility-Induced FPM Contour Map – Maximal
Figure 8 – Cumulative FPM Contour Map – Average
Figure 9 – Cumulative FPM Contour Map –Maximal

NEW OAKVILLE HOSPITAL - HPAQB APPLICATION FOR APPROVAL
July 2012 Report No. 10-1151-0350 iv
APPENDICES
APPENDIX A NOH Design Drawings
APPENDIX B Equipment Specifications and Manufacturer Guarantees
APPENDIX C Emission Rate Calculations
APPENDIX D Energy Model Report
APPENDIX E CALPUFF BPIP-Prime Error Message
APPENDIX F CALPUFF 6.263 Source Code, Dispersion Modelling Files, Exhaust Re-entrainment Study and CALMET Data Analysis
(on CD)
APPENDIX G Self-Contamination Sample Calculations
NEW OAKVILLE HOSPITAL - HPAQB APPLICATION FOR APPROVAL
July 2012 Report No. 10-1151-0350 1
1.0 INTRODUCTION The Town of Oakville (the Town) Health Protection Air Quality By-Law (HPAQB) Application for Approval
(Application) was prepared to assess the potential health risk of emissions of fine particulate matter (FPM) and
its precursors from the proposed New Oakville Hospital (NOH). This Application was prepared following the
Town’s document “Guidance for Implementation of Oakville Health Protection Air Quality By-Law 2010-035,
Section 5 and 6 and Approval Requirements for Major Emitters v.5 June 2011”.
An Environmental Compliance Approval (ECA) Application is also being prepared for submission to the Ontario
Ministry of the Environment (MOE).
NEW OAKVILLE HOSPITAL - HPAQB APPLICATION FOR APPROVAL
July 2012 Report No. 10-1151-0350 2
2.0 FACILITY DESCRIPTION
2.1 Overview The NOH will be constructed at 3000 Third Line in Oakville, Ontario to replace the existing Oakville-Trafalgar
Memorial Hospital. It will provide healthcare facilities to the residents of Oakville and the surrounding area.
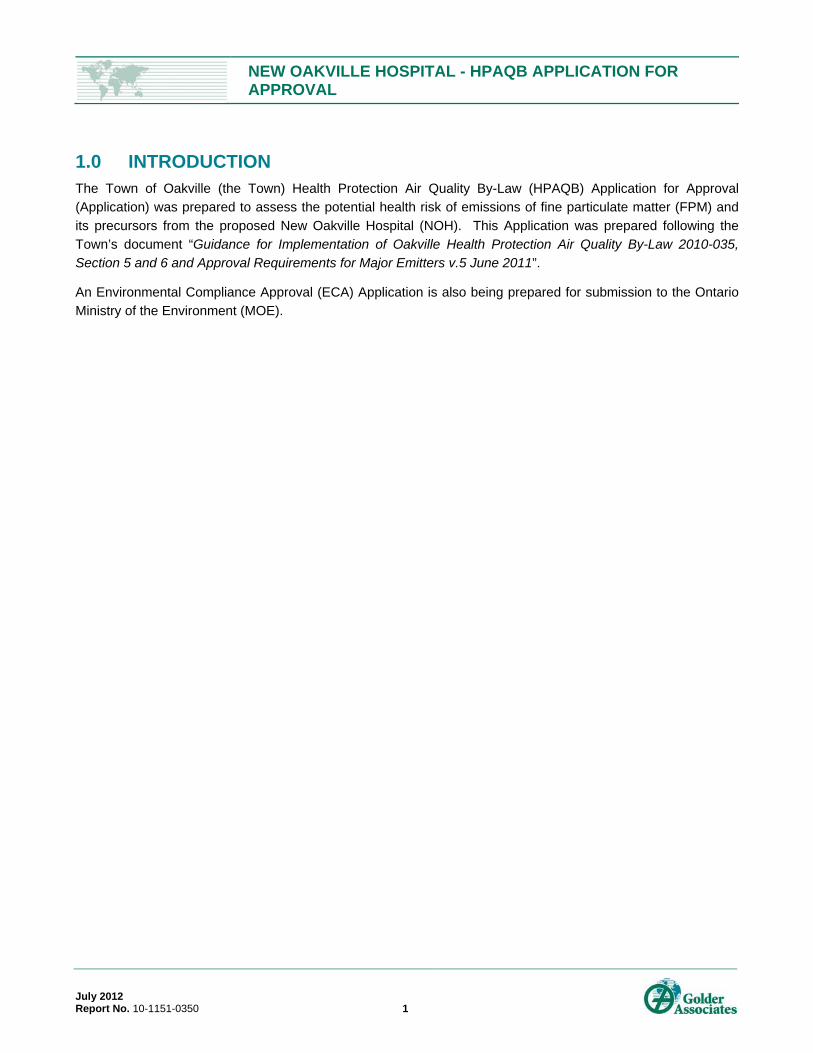
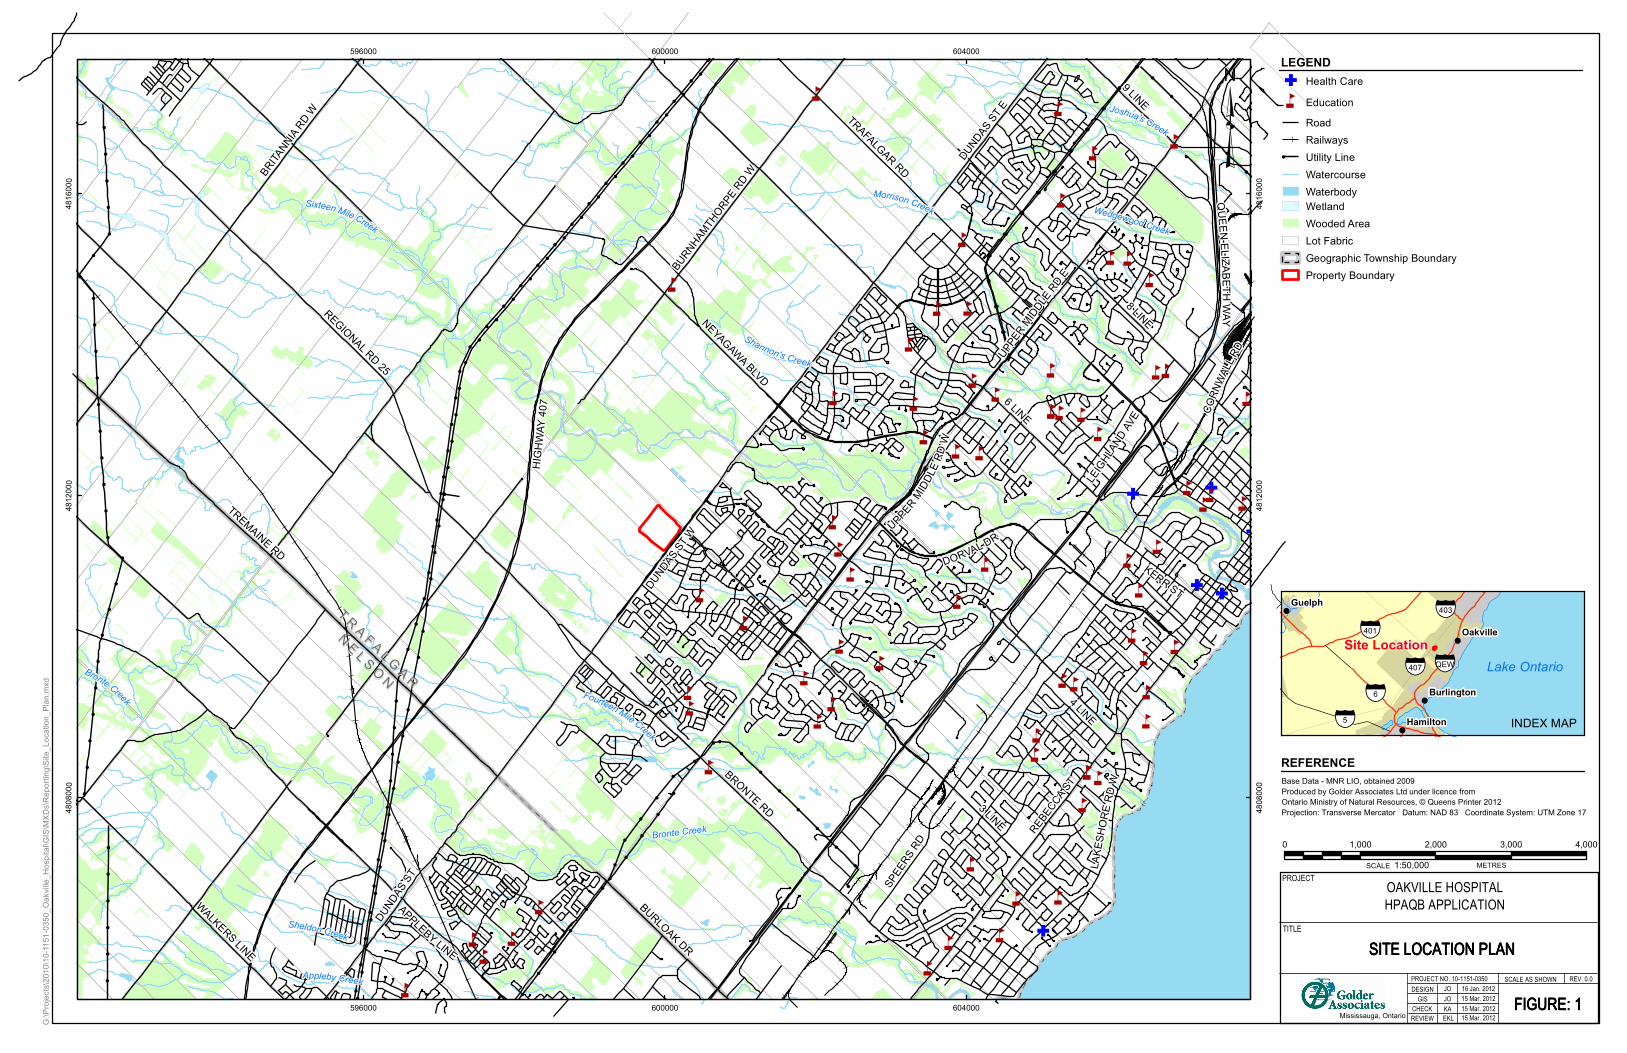
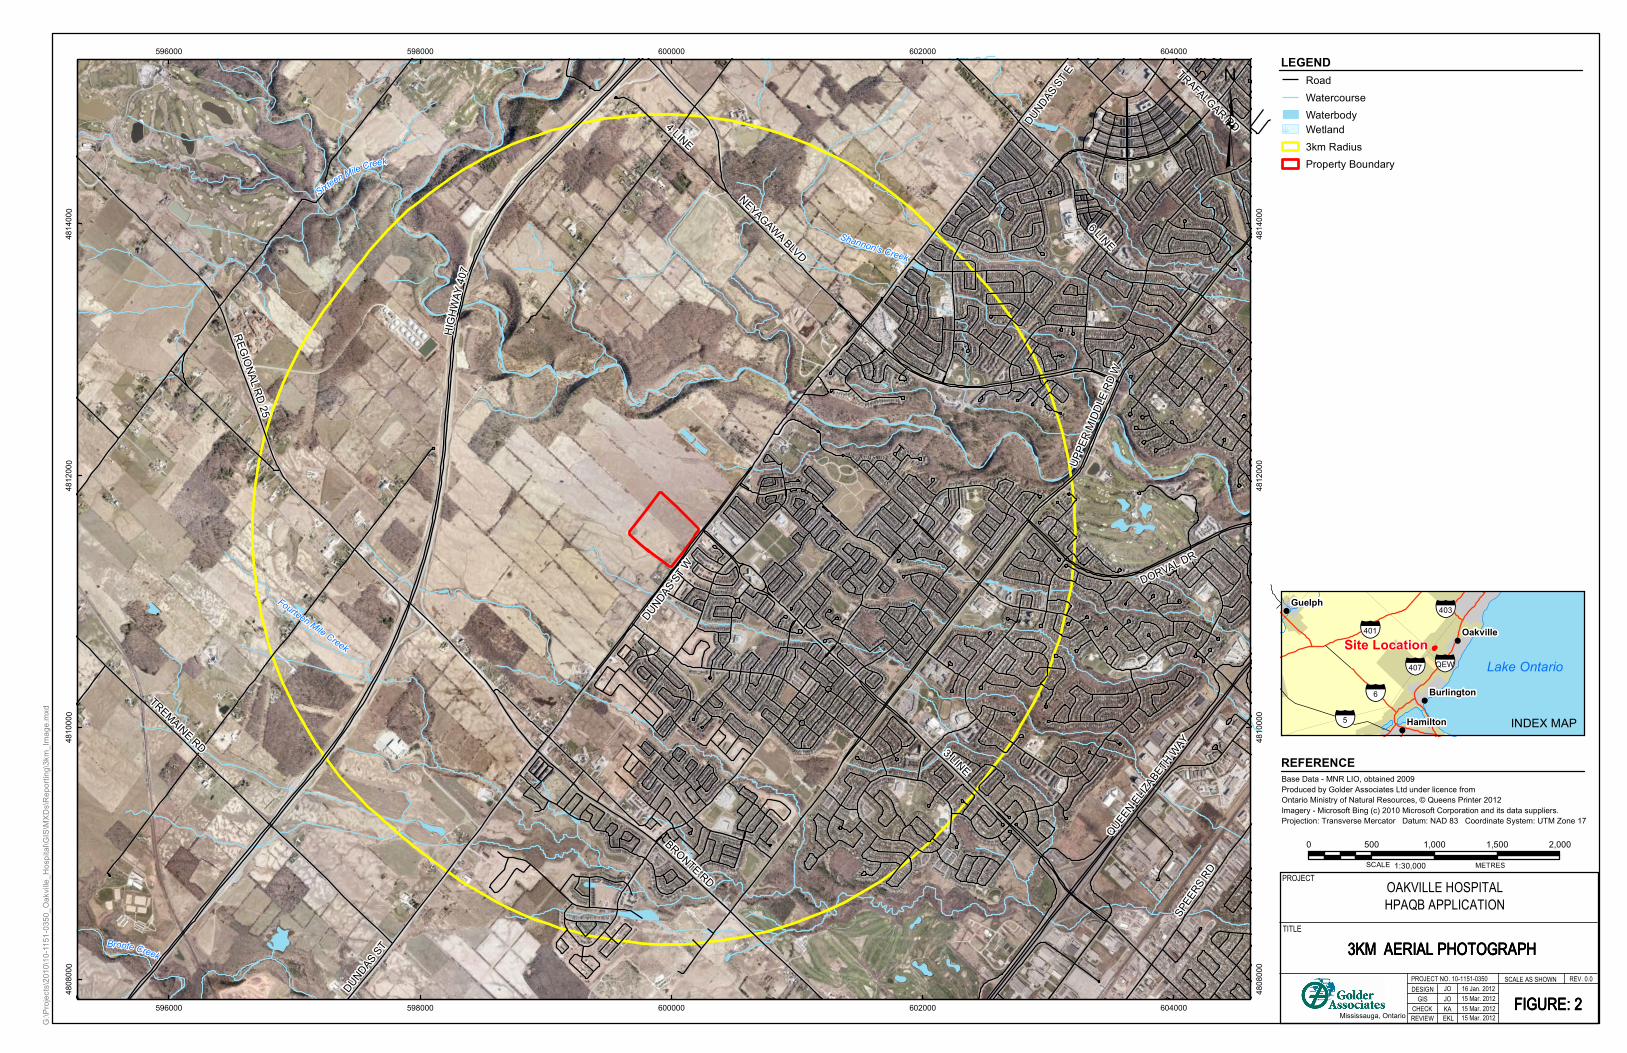
2.2 Location The following figures have been provided to detail the location of the NOH and surrounding features:
Figure 1 – Site Location Plan;
Figure 2 – 3 km Aerial Photograph; and
Figure 3 – Zoning Map.
Figure 1 provides the locations of educational and healthcare facilities (obtained from Land Information Ontario,
2009) in Oakville as well as major roads and highways. Figure 2 provides an aerial view of the surrounding
area. Figure 3 presents the local land use including areas zoned for residential use.
The figures provided in this Application are all geo-referenced to the Universal Transverse Mercator (UTM) North
American Datum of 1983 (NAD 83) coordinate system, which shows no difference compared to the World
Geodetic System of 1984 (WGS84) datum for the domain of interest. The NAD 83 system was used to enable
the use of higher resolution terrain data as provided by the MOE.
2.3 Buildings Consisting of four main sections, the NOH will have a floor area of approximately 1.6 million square feet, three
times the size of the existing hospital.
The NOH will have a capacity for 457 beds with shelled in space to grow to 602 beds. The NOH buildings
include four main sections; a 5-storey section for complex continuing care, rehabilitation that will also house a
number of outpatient programs such as nephrology, including the mechanical penthouse; an inpatient tower
section containing patient bedrooms, operating theatres, as well as pre and post-operative support functions. In
addition, the NOH also includes a 4-storey therapeutic and diagnostic imaging section that houses emergency
care, diagnostic imaging, ambulatory clinics, maternal/child services, adult mental health services and a
penthouse. The fourth section serves as the 2-storey, main hospital entrance and connects the rehabilitation
block to the inpatient tower block.
A six-level parking structure will also be located on site.
NEW OAKVILLE HOSPITAL - HPAQB APPLICATION FOR APPROVAL
July 2012 Report No. 10-1151-0350 3
The NOH has an intricate building design and for simplicity, only the tallest and widest building tiers were
considered for building downwash effects on emission release points The primary exhaust stacks also extend
from these tiers. Figure 4 – Building Plan, illustrates the on-site buildings that were considered in building
downwash calculations. Design drawings for the NOH are also provided in Appendix A.
Off-site buildings were not considered for building downwash as structures in the surrounding area are
predominantly commercial plazas and one or two-storey residences.
2.4 Raw Materials, Products and Processes The NOH will have no manufacturing processes on site, as it is a health care facility.
The significant atmospheric emission sources at the NOH include the following:
Diesel fired emergency generators;
Natural gas fired boilers; and
Cooling towers.
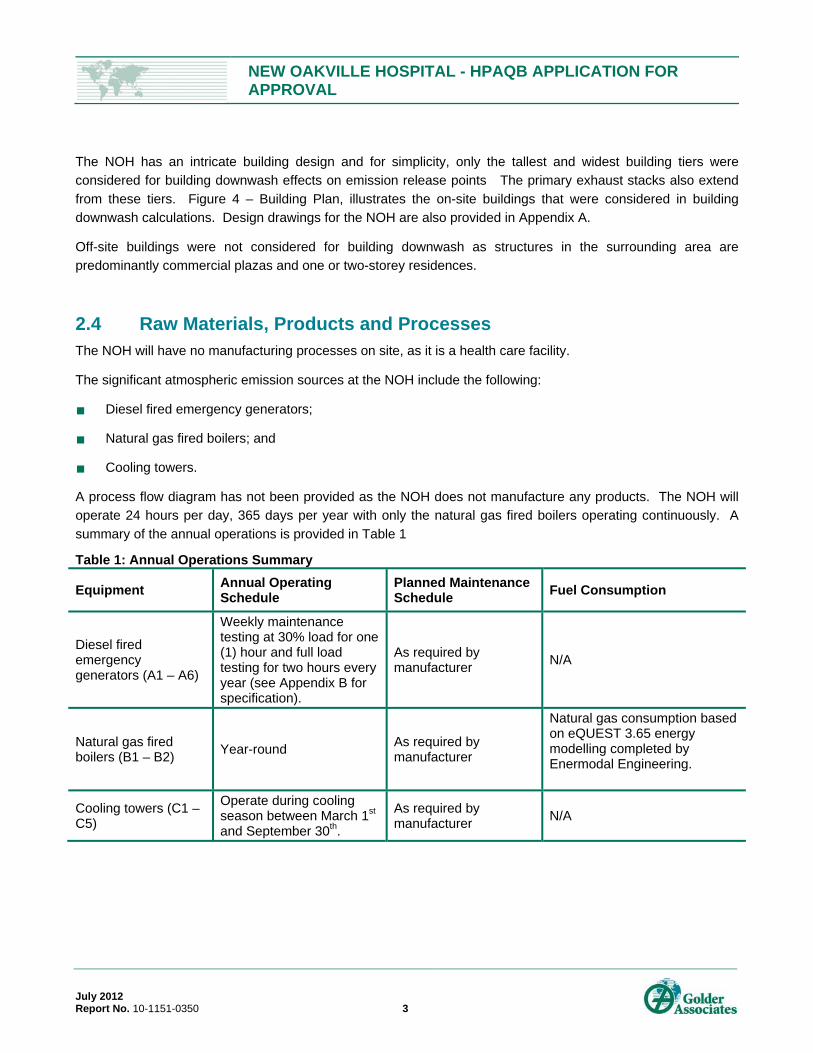
A process flow diagram has not been provided as the NOH does not manufacture any products. The NOH will
operate 24 hours per day, 365 days per year with only the natural gas fired boilers operating continuously. A
summary of the annual operations is provided in Table 1
Table 1: Annual Operations Summary
Equipment Annual Operating Schedule
Planned Maintenance Schedule
Fuel Consumption
Diesel fired emergency generators (A1 – A6)
Weekly maintenance testing at 30% load for one (1) hour and full load testing for two hours every year (see Appendix B for specification).
As required by manufacturer
N/A
Natural gas fired boilers (B1 – B2)
Year-round As required by manufacturer
Natural gas consumption based on eQUEST 3.65 energy modelling completed by Enermodal Engineering.
Cooling towers (C1 – C5)
Operate during cooling season between March 1st and September 30th.
As required by manufacturer
N/A
NEW OAKVILLE HOSPITAL - HPAQB APPLICATION FOR APPROVAL
July 2012 Report No. 10-1151-0350 4
2.5 Emission Sources and Processes The locations of the sources are identified in Figure 5 – Dispersion Modelling Plan.
2.5.1 Sources Considered Insignificant
Some emission sources at the NOH were considered to be insignificant. The rationale for each insignificant
source is provided below.
Kitchen Exhausts (D1 and D2) – The two kitchen exhausts are assumed to be sources of food odours, steam
and heat from cooking. The kitchen exhausts are not expected to emit FPM or precursor compounds.
Laboratory Fume Hood Exhaust (E) – The laboratory fume hood will be used to exhaust an area where
medical tests are completed. Emissions of FPM or precursor compounds are not expected.
Block A Exhausts (F) – These sources include a chemotherapy exhaust, radioactive waste storage, tech
workshop and welding exhausts. As the hospital is not yet constructed, any emissions from these sources are
difficult to estimate. Welding operations are assumed to occur infrequently for equipment maintenance only and
were considered insignificant in the operation of the NOH. All other sources at this location are not expected to
emit FPM or precursor compounds.
Pharmacy / Lab Exhaust (G) – The pharmacy / laboratory fume hood will be used to exhaust an area where
medications are dispensed. Emissions of FPM or precursor compounds are not expected.
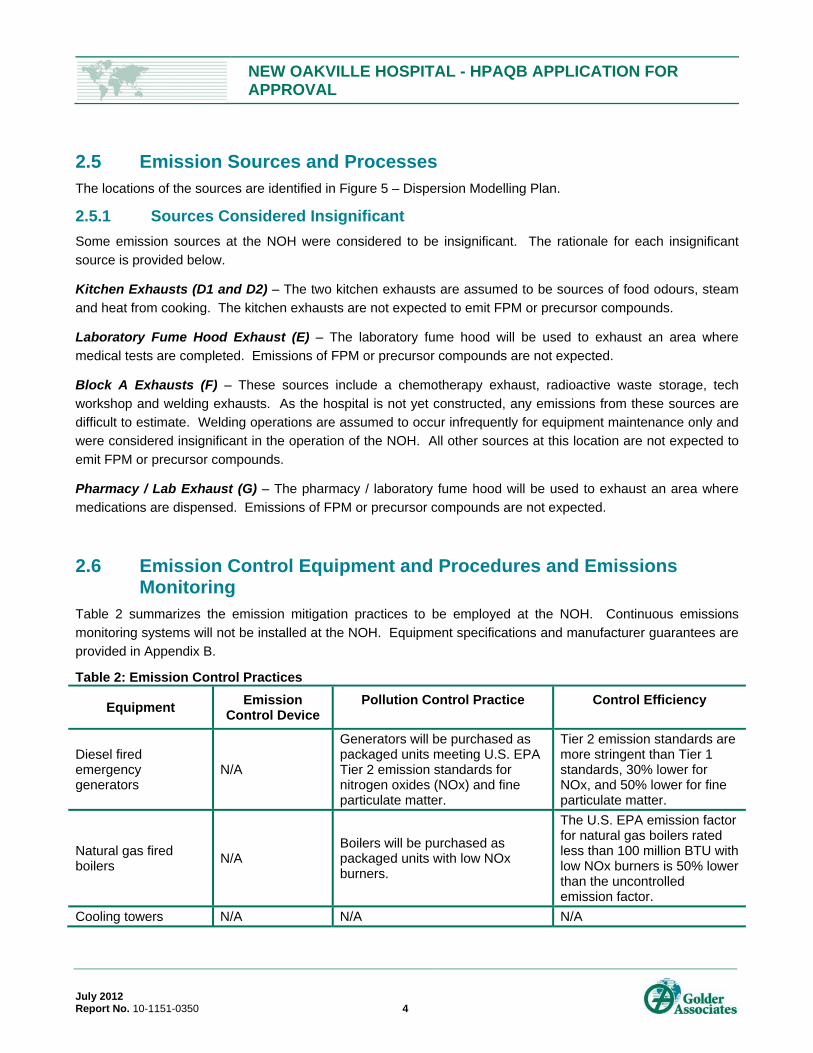
2.6 Emission Control Equipment and Procedures and Emissions Monitoring
Table 2 summarizes the emission mitigation practices to be employed at the NOH. Continuous emissions
monitoring systems will not be installed at the NOH. Equipment specifications and manufacturer guarantees are
provided in Appendix B.
Table 2: Emission Control Practices
Equipment Emission
Control Device Pollution Control Practice Control Efficiency
Diesel fired emergency generators
N/A
Generators will be purchased as packaged units meeting U.S. EPA Tier 2 emission standards for nitrogen oxides (NOx) and fine particulate matter.
Tier 2 emission standards are more stringent than Tier 1 standards, 30% lower for NOx, and 50% lower for fine particulate matter.
Natural gas fired boilers
N/A Boilers will be purchased as packaged units with low NOx burners.
The U.S. EPA emission factor for natural gas boilers rated less than 100 million BTU with low NOx burners is 50% lower than the uncontrolled emission factor.
Cooling towers N/A N/A N/A
NEW OAKVILLE HOSPITAL - HPAQB APPLICATION FOR APPROVAL
July 2012 Report No. 10-1151-0350 5
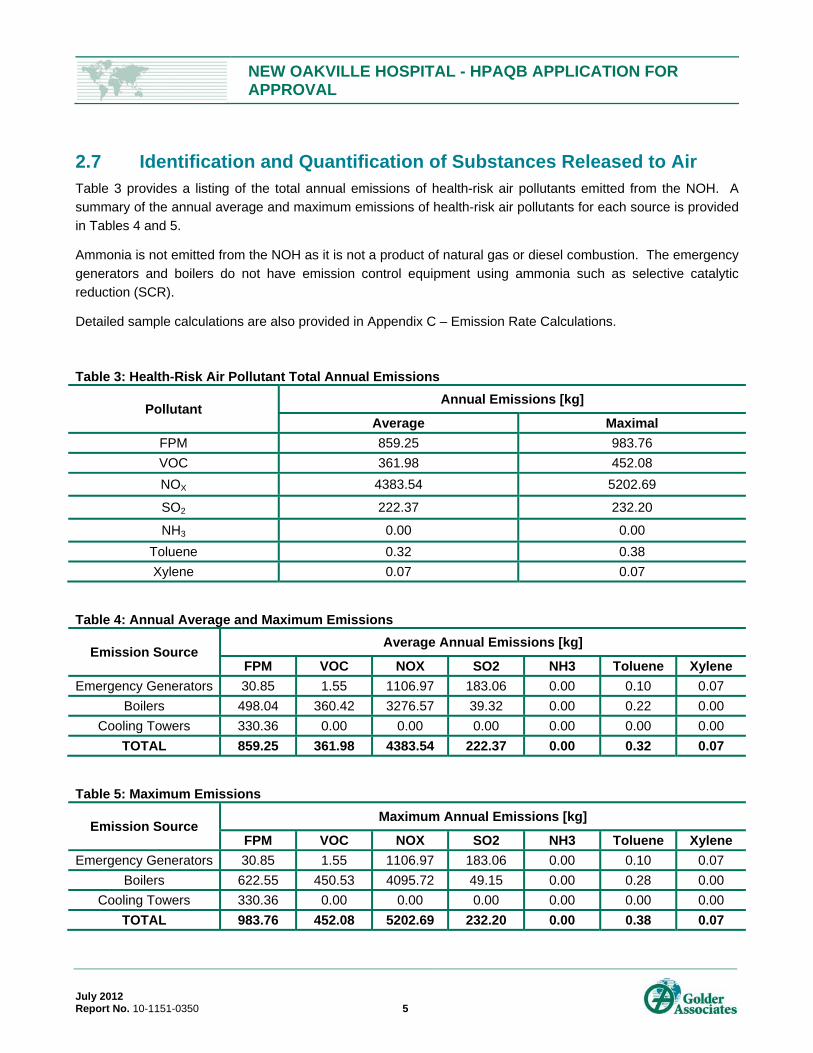
2.7 Identification and Quantification of Substances Released to Air Table 3 provides a listing of the total annual emissions of health-risk air pollutants emitted from the NOH. A
summary of the annual average and maximum emissions of health-risk air pollutants for each source is provided
in Tables 4 and 5.
Ammonia is not emitted from the NOH as it is not a product of natural gas or diesel combustion. The emergency
generators and boilers do not have emission control equipment using ammonia such as selective catalytic
reduction (SCR).
Detailed sample calculations are also provided in Appendix C – Emission Rate Calculations.
Table 3: Health-Risk Air Pollutant Total Annual Emissions
Pollutant Annual Emissions [kg]
Average Maximal
FPM 859.25 983.76
VOC 361.98 452.08
NOX 4383.54 5202.69
SO2 222.37 232.20
NH3 0.00 0.00
Toluene 0.32 0.38
Xylene 0.07 0.07
Table 4: Annual Average and Maximum Emissions
Emission Source Average Annual Emissions [kg]
FPM VOC NOX SO2 NH3 Toluene Xylene
Emergency Generators 30.85 1.55 1106.97 183.06 0.00 0.10 0.07
Boilers 498.04 360.42 3276.57 39.32 0.00 0.22 0.00
Cooling Towers 330.36 0.00 0.00 0.00 0.00 0.00 0.00
TOTAL 859.25 361.98 4383.54 222.37 0.00 0.32 0.07
Table 5: Maximum Emissions
Emission Source Maximum Annual Emissions [kg]
FPM VOC NOX SO2 NH3 Toluene Xylene
Emergency Generators 30.85 1.55 1106.97 183.06 0.00 0.10 0.07
Boilers 622.55 450.53 4095.72 49.15 0.00 0.28 0.00
Cooling Towers 330.36 0.00 0.00 0.00 0.00 0.00 0.00
TOTAL 983.76 452.08 5202.69 232.20 0.00 0.38 0.07

NEW OAKVILLE HOSPITAL - HPAQB APPLICATION FOR APPROVAL
July 2012 Report No. 10-1151-0350 6
2.7.1 Diesel Fired Emergency Generators
Manufacturer emission factors were used to estimate direct FPM and NOx emissions from the diesel fired
emergency generators. Emission factors from the U.S. EPA AP-42 Chapter 3.4 Large Stationary Diesel and All
Stationary Dual-fuel Engines were not used as they are not representative of the Tier 2 emissions standards for
the generators. The nominal emissions profile for the diesel engines were used for the modelling assessment as
these are representative of a well-maintained system (see Appendix B - Caterpillar Application and Installation
Guide, 2008, p. 36). The NOH emergency generators will always be properly maintained as they are critical
systems that must be operational if a power outage occurs.
The manufacturer emission factors did not include speciated volatile organic compound (VOC) emission rates.
Therefore, the Chapter 3.4 U.S. EPA emission factors were used to estimate VOC emissions for these sources
and are likely conservative. In addition, SO2 emissions were conservatively calculated based on a 0.5% sulphur
content in fuels as diesel fuel is typically at 0.005% sulphur.
As shown in Table 1, six emergency diesel generators will be available but only one (1) unit will be tested at any
time for an hour at 30% load as per CSA Standard CSA-C282 (2009), Table 3 (Appendix B). Air quality
simulations were carried out on hourly testing of one unit at 30% load for six hours one (1) day per week
between the hours of 0700 to 1900. The units also go through an annual test of two (2) hours per year at 100%
load but this would be scheduled to minimize air quality impacts and has not been included in the assessment.
2.7.2 Natural Gas Fired Boilers
U.S. EPA AP-42 Chapter 1.4 Natural Gas Combustion emission factors for boilers with low NOx burners were
used to estimate emissions from the NOH steam and hot water boilers.
Natural gas consumption was based on eQUEST 3.65 energy modelling completed by Enermodal Engineering.
Inputs to the energy model included design stage structural and mechanical specifications provided by the NOH
design team. A more detailed description of the model inputs is provided in Appendix D – Energy Model Report.
The annual natural gas consumption was assumed to be split evenly between the steam and hot water boilers.
2.7.3 Cooling Towers
Fine particulate emissions from the NOH cooling towers were estimated using the maximum circulating water
flow rate, drift loss and total dissolved solids concentration data provided by the manufacturer (Appendix B). The
Total Dissolved Solids (TDS) concentration is approximately 590 mg/L with a drift loss of 0.005%. In addition,
the fans have a capacity of 120.7 m³/s at 20 °C.
2.7.4 Equipment Maintenance
Maintenance information is not available at this time but can be provided when final equipment selection has
been completed.
NEW OAKVILLE HOSPITAL - HPAQB APPLICATION FOR APPROVAL
July 2012 Report No. 10-1151-0350 7
2.7.5 Average and Maximum Operating Scenarios
This assessment considered both average and maximum operating scenarios for the NOH steam and hot water
boiler systems. The average annual natural gas fuel consumption estimate for the boilers is based on the results
of an energy model for the NOH that provided monthly natural gas consumption values provided by Carillion
Canada (Carillion) of Concord, Ontario. The maximum annual fuel consumption estimate is based on a 25%
increase from the average values as recommended by Carillion. The 25% factor is based on the following:
Mitigation against potential design changes;
An adjustment for the over-optimization of energy modelling that in Carillion’s past experience and
knowledge can range from 10% to 25%; and
A further mitigation against process loads (autoclaves).
As the emergency generator maintenance testing schedule does not vary from year to year, it is assumed that
the generator operation remains the same in both average and maximum operating scenarios. According to the
“Guidance for Implementation of Oakville Health Protection Air Quality By-Law 2010-035, Section 5 and 6 and
Approval Requirements for Major Emitters v.5 June 2011” document, emissions due to emergency situations
should not be included in the assessment. Emergency generator operations during power outages were not
included in the modelling.
The cooling towers are assumed to operate continuously from 1 March to 31 September which results in 5136
hours of operation.
NEW OAKVILLE HOSPITAL - HPAQB APPLICATION FOR APPROVAL
July 2012 Report No. 10-1151-0350 8
3.0 EVALUATION
3.1 Modelling Approach and Model Selection Atmospheric dispersion modelling was carried out using an updated version of the CALPUFF model. The
CALPUFF model has many advancements including;
The CALPUFF modelling system is made up of three main components:
The CALMET meteorological model that generates hourly wind and temperature fields in a three
dimensional gridded modelling domain;
The CALPUFF transport and dispersion model that advects “puffs” of material emitted from sources to
calculate hourly concentration/fluxes at receptors of interest; and
CALPOST post processor (used to extract the data of interest from CALPUFF binary output files).
The default model (CALPUFF V5.8) contains an input read error that does not allow the use of PRIME building
downwash, which is considered to be more accurate in predicting concentrations within the building wake zone
since it takes into account the effect of vertical wind shear and the variation in wind speed deficit with downwind
distance. For this reason, a later version (CALPUFF V6.263) was used, where the error was corrected. It is our
understanding that the there are no fundamental differences between the models. CALPUFF V6.263 has been
applied to urban airshed modelling for the City of Toronto (Reference - Dr. Christopher Morgan and Regional
Municipality of Halton (Reference - Mr. Peter Steer).
The following Table 6 provides additional information as per S.3.2.1.1 of the Town guidance document.
Table 6: Additional CALPUFF Information
Name of Model Used: CALPUFF V6.263
Technical Issues which warrants use of Model:
Version 5.8 has a bug with respect to using building downwash using Prime input data. Problem Area 1 -- When performing cavity sampling for PRIME downwash, restrict primary source calculations to receptors downwind of primary source and add screen for receptors located far to the side (no impact). Without this restriction, the model may halt with an attempted division by zero. Receptors upwind of the source are processed for cavity impacts starting with Version 5.8, Level 070623. Modified: CAV_SAMP The model stops executing and returns an error message when by running BPIP-Prime with CALPUFF V5.8. The error message generated is provided in Appendix E.
References: MCB-E.txt
Website: http://www.src.com/calpuff/calpuff1.htm
Source Code: See Appendix F
NEW OAKVILLE HOSPITAL - HPAQB APPLICATION FOR APPROVAL
July 2012 Report No. 10-1151-0350 9
The following models and pre- and post-processors were used in the assessment:
CALPUFF dispersion model (V6.263, level 080827);
CALPOST post processor (V6.223);
BPIP building downwash pre-processor (V04274); and
CALMET was not required in this assessment as the CALPUFF-ready meteorological data were supplied
by the Town.
The Town provides all applicants with identical Town Default Inputs (TDI) data to be used with the CALPUFF
model. Golder received the following data from Mr. Jeffrey Lee of the Town in September 2011.
Model domain;
Fine gridded receptors with 100 meter spacing over the Town;
Pre-processed meteorology data using CALMET (2004 to 2008);
Geophysical data;
Terrain data;
Land use data; and
Coastline data;
Background concentration data;
Background hourly ozone data
Background monthly ammonia data; and
Background hourly FPM data.
NEW OAKVILLE HOSPITAL - HPAQB APPLICATION FOR APPROVAL
July 2012 Report No. 10-1151-0350 10
3.2 Model Inputs The CALPUFF model input and output files for the NOH have been provided on compact disc, see Appendix F.
Dispersion modelling input parameters are summarized in Table 7
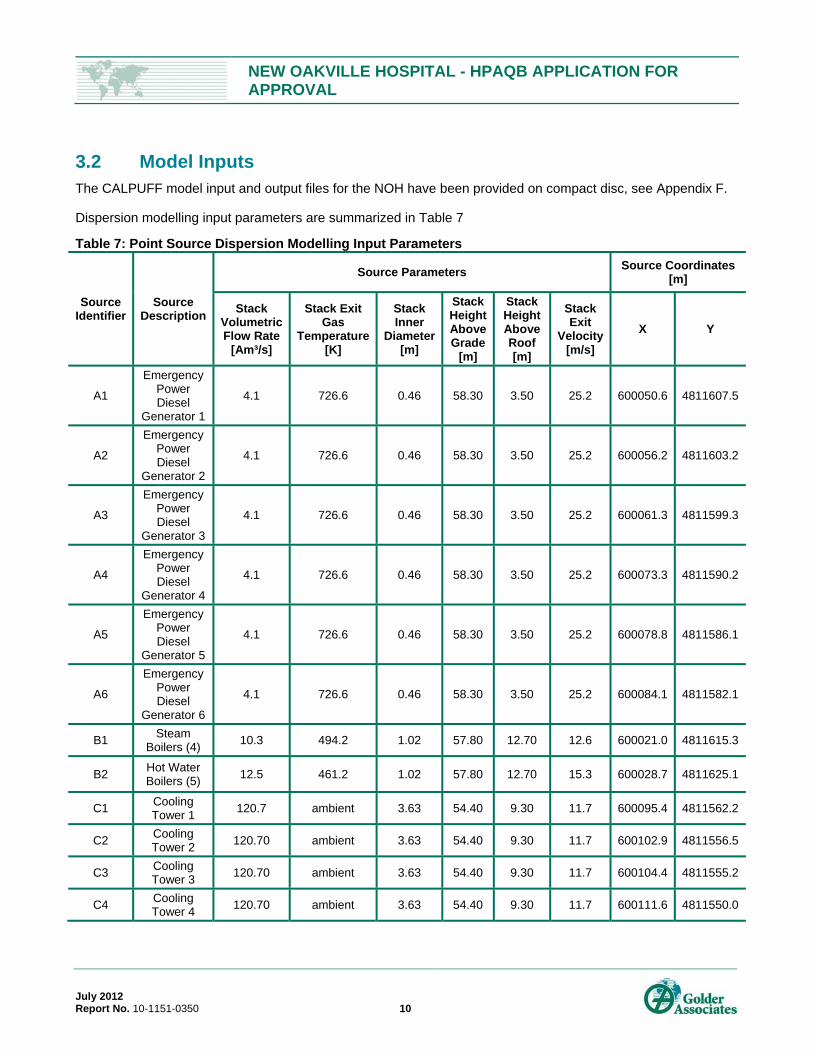
Table 7: Point Source Dispersion Modelling Input Parameters
Source Identifier
Source Description
Source Parameters Source Coordinates
[m]
Stack Volumetric Flow Rate
[Am³/s]
Stack Exit Gas
Temperature [K]
Stack Inner
Diameter [m]
Stack Height Above Grade
[m]
Stack Height Above Roof [m]
Stack Exit
Velocity [m/s]
X Y
A1
Emergency Power Diesel
Generator 1
4.1 726.6 0.46 58.30 3.50 25.2 600050.6 4811607.5
A2
Emergency Power Diesel
Generator 2
4.1 726.6 0.46 58.30 3.50 25.2 600056.2 4811603.2
A3
Emergency Power Diesel
Generator 3
4.1 726.6 0.46 58.30 3.50 25.2 600061.3 4811599.3
A4
Emergency Power Diesel
Generator 4
4.1 726.6 0.46 58.30 3.50 25.2 600073.3 4811590.2
A5
Emergency Power Diesel
Generator 5
4.1 726.6 0.46 58.30 3.50 25.2 600078.8 4811586.1
A6
Emergency Power Diesel
Generator 6
4.1 726.6 0.46 58.30 3.50 25.2 600084.1 4811582.1
B1 Steam
Boilers (4) 10.3 494.2 1.02 57.80 12.70 12.6 600021.0 4811615.3
B2 Hot Water Boilers (5)
12.5 461.2 1.02 57.80 12.70 15.3 600028.7 4811625.1
C1 Cooling Tower 1
120.7 ambient 3.63 54.40 9.30 11.7 600095.4 4811562.2
C2 Cooling Tower 2
120.70 ambient 3.63 54.40 9.30 11.7 600102.9 4811556.5
C3 Cooling Tower 3
120.70 ambient 3.63 54.40 9.30 11.7 600104.4 4811555.2
C4 Cooling Tower 4
120.70 ambient 3.63 54.40 9.30 11.7 600111.6 4811550.0

NEW OAKVILLE HOSPITAL - HPAQB APPLICATION FOR APPROVAL
July 2012 Report No. 10-1151-0350 11
3.2.1 Facility Emissions Estimation Methods
Sample calculations are presented in Appendix C – Emission Rate Calculations. The methods used to
calculation emissions are based on fuel usage and:
U.S. EPA AP-42 emission factors; or
Manufacturer’s emission guarantees.
Manufacturer’s emission data are provided in Appendix B – Equipment Specifications and Manufacturer
Guarantees.
The operation of the boilers and the cooling towers varies throughout the year and variable emission files were
used as input data into CALPUFF. Emissions from the boilers were calculated based on typical natural gas fuel
consumption for each month as suggested from the energy model. Cooling towers typically operate when
building cooling is required which is between March 1st and September 30th.
There is no information on the frequency that emissions reach 90 to 100% of the maximal emission scenario
over the next 10 years since the facility has not been constructed. As a result, this assessment has been based
on energy and fuel consumption models.
3.2.2 Model Input Options
CALPUFF dispersion modelling has been completed using the following input options summarized in Table 8.
Table 8: Model Input Options
Model Input Default Option Used Non-Default Option Used
Meteorological Data Yes - TDI
Receptor Grid Yes - TDI
Land Use Data Yes - TDI
Terrain Data Yes - TDI
Coastline Data Yes - TDI
Background Concentrations Yes - TDI
Ozone Yes - TDI
Ammonia Yes - TDI
FPM Yes - TDI
3.2.3 Non-Default Settings
The MSPLIT default value is zero which does not allow a puff to split into smaller puffs but allows the single puff
to grow to a large size. Initial runs with MSPLIT set to zero caused the model to fail, resulting in the following
error message:
NEW OAKVILLE HOSPITAL - HPAQB APPLICATION FOR APPROVAL
July 2012 Report No. 10-1151-0350 12
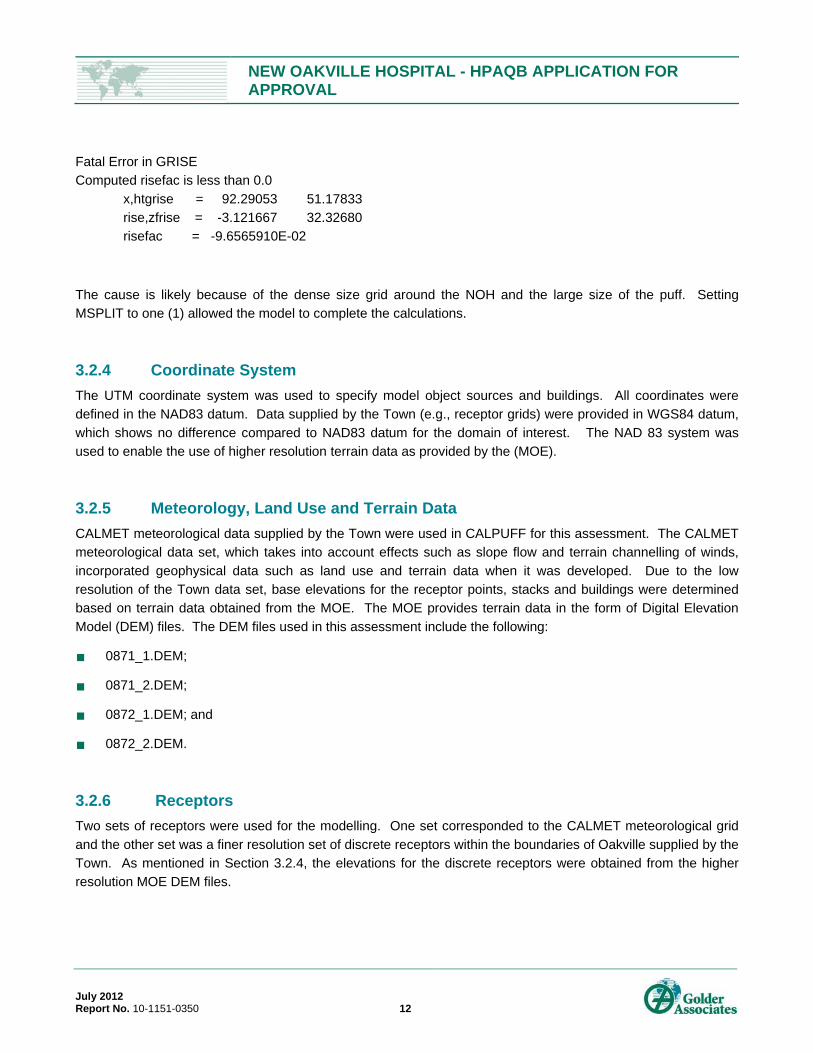
Fatal Error in GRISE
Computed risefac is less than 0.0
x,htgrise = 92.29053 51.17833
rise,zfrise = -3.121667 32.32680
risefac = -9.6565910E-02
The cause is likely because of the dense size grid around the NOH and the large size of the puff. Setting
MSPLIT to one (1) allowed the model to complete the calculations.
3.2.4 Coordinate System
The UTM coordinate system was used to specify model object sources and buildings. All coordinates were
defined in the NAD83 datum. Data supplied by the Town (e.g., receptor grids) were provided in WGS84 datum,
which shows no difference compared to NAD83 datum for the domain of interest. The NAD 83 system was
used to enable the use of higher resolution terrain data as provided by the (MOE).
3.2.5 Meteorology, Land Use and Terrain Data
CALMET meteorological data supplied by the Town were used in CALPUFF for this assessment. The CALMET
meteorological data set, which takes into account effects such as slope flow and terrain channelling of winds,
incorporated geophysical data such as land use and terrain data when it was developed. Due to the low
resolution of the Town data set, base elevations for the receptor points, stacks and buildings were determined
based on terrain data obtained from the MOE. The MOE provides terrain data in the form of Digital Elevation
Model (DEM) files. The DEM files used in this assessment include the following:
0871_1.DEM;
0871_2.DEM;
0872_1.DEM; and
0872_2.DEM.
3.2.6 Receptors
Two sets of receptors were used for the modelling. One set corresponded to the CALMET meteorological grid
and the other set was a finer resolution set of discrete receptors within the boundaries of Oakville supplied by the
Town. As mentioned in Section 3.2.4, the elevations for the discrete receptors were obtained from the higher
resolution MOE DEM files.

NEW OAKVILLE HOSPITAL - HPAQB APPLICATION FOR APPROVAL
July 2012 Report No. 10-1151-0350 13
3.2.7 Building Downwash
Building wake effects were considered in this modelling study using the U.S. EPA’s Building Profile Input
Program (BPIP-PRIME). The inputs into this pre-processor include the coordinates and heights of the buildings
and stacks. The BPIP output is used in the CALPUFF building wake effect calculations.
The NOH has an intricate building design and for simplicity, only the tallest and widest building tiers were
considered for building downwash effects on emission release points The primary exhaust stacks also extend
from these tiers. Figure 4 – Building Plan, illustrates the on-site buildings that were considered in building
downwash calculations. Design drawings for the NOH are also provided in Appendix A.
3.2.8 Background and Cumulative Concentrations
Hourly background ozone data and monthly background ammonia data were supplied by the Town to input into
CALPUFF. Background data for FPM were also supplied by the Town. The data file contains hourly FPM data
based on measurements taken at the MOE monitoring station in northeast Oakville. The hourly background
FPM concentrations were added to the hourly facility-induced FPM concentrations to determine the cumulative
concentrations.
3.2.9 Chemistry Models
To account for the secondary aerosol formation, the 5-species MESOPUFF chemistry and the Secondary
Organic Aerosols (SOA) chemistry options were used in CALPUFF. For both options, hourly background ozone
data provided by the Town were used as input into CALPUFF. The monthly background ammonia data were
only used for the MESOPUFF chemistry option. These options are acceptable by the guideline.
In order for the chemistry models to provide the correct output, the number of species (NSE) variable was set to
eight (8). This value accounts for the SO2, NOx, PM2.5 and VOCs as well as the four (4) other species (NO3,
HNO3, NH4 and SO4) also considered in the chemistry computation, which have an initial emission rate of zero.
3.2.10 Species Modelled
The following species were modelled in CALPUFF: SO2, SO4, NOx, HNO3, NO3, PM2.5, NH4 and VOC. Some of
the sources emit toluene and xylene and separate model runs were carried out using the SOA chemistry
module. For these runs, only toluene, xylene, and SOA were modelled with CALPUFF.
The concentration of facility-induced FPM was determined by summing the concentrations of directly emitted
FPM (PM2.5) and inorganic precursors including SO4, HNO3, and NO3 at each receptor location. As the
conversion of SO2 or NOx to particulate usually takes place over a long period of time, SO2 and NOx were not
included in the total FPM for all receptors modelled. In addition, based on the modelling results, predicted SOA
concentrations were approximately ten orders of magnitude lower than the concentrations of the inorganic
precursors mentioned above. Therefore, SOA was excluded from the determination of FPM for this assessment.

NEW OAKVILLE HOSPITAL - HPAQB APPLICATION FOR APPROVAL
July 2012 Report No. 10-1151-0350 14
3.3 Same Structure Contamination The NOH will provide healthcare services, and can itself be considered a sensitive receptor. Therefore, same-
structure contamination must be assessed. The assessment considered only the average case emissions as
worst case conditions are not expected to occur for extended periods of time.
The same structure contamination assessment was carried out in the following steps:
Exhaust flow rates for each source were normalized to standard temperature and pressure (20 °C and 1
atmosphere)
An in-stack concentration (µg/m³) was calculated using the hourly emission rate of FPM from each source
The in-stack concentration was divided by the dilution factor for each sensitive receptor location to
determine the concentration at the sensitive receptor
The averaging period conversation factor was used to convert the hourly average concentration to an
annual average concentration. The conversion factor was calculated using the method described in
Section 4.4 of the MOE Air Dispersion Guideline for Ontario (March 2009).
The annual average concentration was adjusted to account for the annual operating hours for each source.
The adjusted annual average concentrations for each sensitive receptor location were summed to
determine the overall impact of the FPM at that location.
The assessment indicated that Receptors 5 (R5) and 8 (R8) are the most influenced by the emissions from the
natural gas boiler exhausts B1 and B2. An analysis of the CALMET meteorology data and windrose determined
that winds are only favourable for direct self-contamination from these boiler exhausts to R5 and R8 less than
40% of the time. The analysis spreadsheet and a windrose are provided in Apppendix F. The FPM
concentrations from the boilers at R5 and R8 were adjusted to reflect this and are below the 0.2 µg/m³ limit.
Sample calculations for the above method are provided in Appendix G.
The dilution factors and receptor locations for this assessment were obtained from the Exhaust Re-entrainment
Study completed by RWDI Inc. (Appendix F). The dilution factors are summarized in Table 9, while results of the
self-contamination assessment are summarized in Table 10.
Table 9: Dilution Factors
Emission Source ID Receptor Location Dilution Factor
Air Intakes Entrances Terrace / Courtyard Windows
Emergency Generators A1- A6 1620 2500 2420 3400
Boilers B1 - B2 750 1340 550 1790
Cooling Towers C1 -C4 80 60 80 70
NEW OAKVILLE HOSPITAL - HPAQB APPLICATION FOR APPROVAL
July 2012 Report No. 10-1151-0350 15
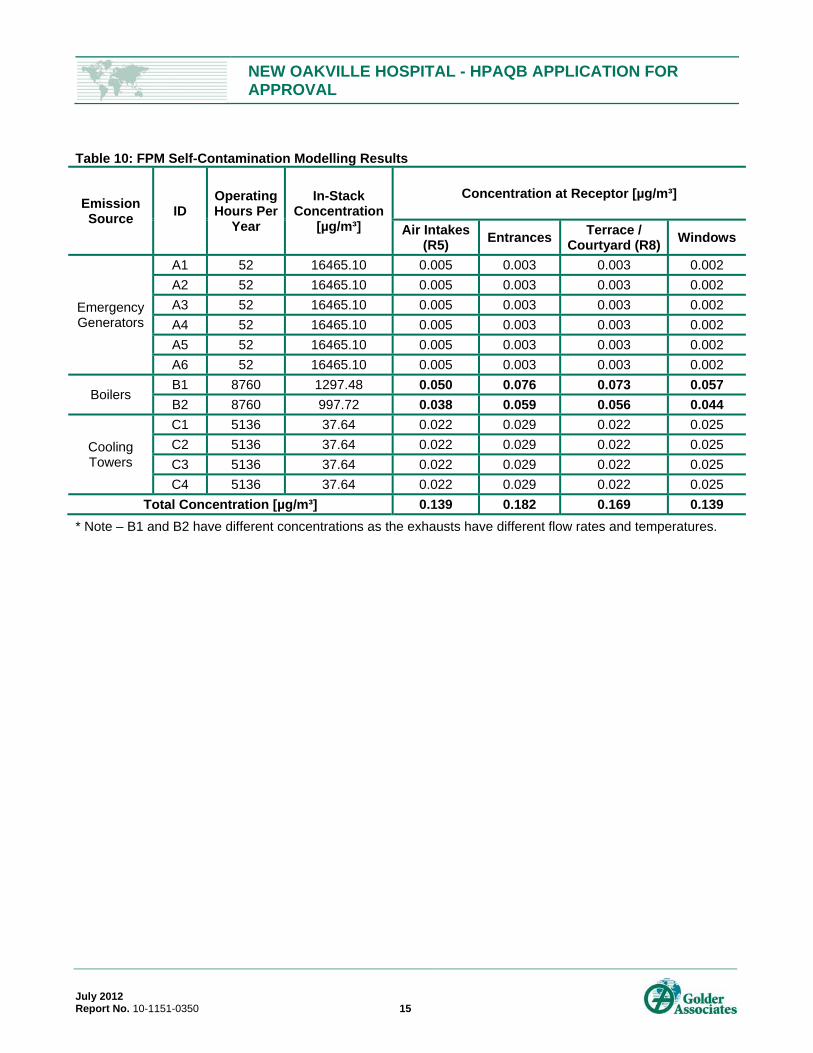
Table 10: FPM Self-Contamination Modelling Results
Emission Source
ID Operating Hours Per
Year
In-Stack Concentration
[µg/m³]
Concentration at Receptor [µg/m³]
Air Intakes (R5)
Entrances Terrace /
Courtyard (R8)Windows
Emergency Generators
A1 52 16465.10 0.005 0.003 0.003 0.002
A2 52 16465.10 0.005 0.003 0.003 0.002
A3 52 16465.10 0.005 0.003 0.003 0.002
A4 52 16465.10 0.005 0.003 0.003 0.002
A5 52 16465.10 0.005 0.003 0.003 0.002
A6 52 16465.10 0.005 0.003 0.003 0.002
Boilers B1 8760 1297.48 0.050 0.076 0.073 0.057
B2 8760 997.72 0.038 0.059 0.056 0.044
Cooling Towers
C1 5136 37.64 0.022 0.029 0.022 0.025
C2 5136 37.64 0.022 0.029 0.022 0.025
C3 5136 37.64 0.022 0.029 0.022 0.025
C4 5136 37.64 0.022 0.029 0.022 0.025
Total Concentration [µg/m³] 0.139 0.182 0.169 0.139
* Note – B1 and B2 have different concentrations as the exhausts have different flow rates and temperatures.

NEW OAKVILLE HOSPITAL - HPAQB APPLICATION FOR APPROVAL
July 2012 Report No. 10-1151-0350 16
4.0 MAPPING Table 8 summarizes the numeric results of the maximal total facility-induced (MTFI) and maximal cumulative
(MC) FPM concentrations for both the average and maximal scenarios. The results indicate the facility does not
significantly affect the existing airshed in Oakville as the facility-induced FPM concentrations for both scenarios
are less than 0.2 micrograms per cubic metre annually, a criterion defined by the HPAQB.
Table 11: FPM Modelling Results
"Average Emissions" Median Concentration (µg/m³)
"Maximal Emissions" Concentration (µg/m³)
Annual
Value
MTFI MC MTFI MC
0.054 8.97 0.070 8.98
Figures 6 and 7 show the total facility-induced FPM concentration contour maps for the average and maximal
scenarios, respectively. For clarity, the contour maps have not been superimposed on a land-use planning map.
Instead, a figure showing land-use is provided in Figure 3. These contour maps indicate the maximum FPM
concentrations are predicted at a location approximately 50 m north of the emergency generators. The plots
also indicate the FPM concentration decreases with distance from the facility.
The cumulative concentration was assessed by conservatively summing the total facility-induced FPM
concentrations and the background FPM concentrations, which were provided by the Town. Figures 8 and 9
show the cumulative FPM concentration contour maps for the average and maximal scenarios, respectively.
The contour maps based on cumulative concentration are similar to the contour maps based on facility-induced
concentration, indicating the annual background concentrations showed minor variability for the five year period.
The results also indicate that the facility-induced FPM concentrations are significantly less than the background
concentrations by at least two orders of magnitude.
NEW OAKVILLE HOSPITAL - HPAQB APPLICATION FOR APPROVAL
July 2012 Report No. 10-1151-0350 17
5.0 CONCLUSION This HPAQB Application for Approval (Application) was prepared to assess the potential health risk of emissions
of FPM and its precursors from the proposed NOH. This Application was prepared following the Town’s
document “Guidance for Implementation of Oakville Health Protection Air Quality By-Law 2010-035, Section 5
and 6 and Approval Requirements for Major Emitters v.5 June 2011”.
The major sources of FPM at the proposed NOH are diesel fired emergency generators, natural gas fired boilers,
and cooling towers. All of these sources were considered in this assessment. To closely reflect how the facility
operates, variable emission rates, which were estimated based on U.S. EPA emission factors or manufacturer’s
data, were employed for the modelling assessment.
Based on modelling results, the NOH facility does not significantly affect the existing airshed in Oakville or on
site sensitive receptors as the facility-induced FPM concentrations are less than 0.2 micrograms per cubic metre
annually, a criterion defined by the Oakville Health Protection Air Quality By-Law. As a result, a health risk
assessment is not required.
NEW OAKVILLE HOSPITAL - HPAQB APPLICATION FOR APPROVAL
July 2012 Report No. 10-1151-0350
Report Signature Page
GOLDER ASSOCIATES LTD.
Emily Lau, B.A.Sc., P.Eng. Anthony Ciccone, Ph.D., P.Eng. Air Quality Engineer Principal
EKL/ADC/ng;gf
Golder, Golder Associates and the GA globe design are trademarks of Golder Associates Corporation.
\\mis1-s-filesrv1\data\active\2010\1151\10-1151-0350 ellisdon-oakville hospital air&noise-oakville\09 revised obl report\10-1151-0350 rpt ellisdon noh obl 26july2012.docx

NEW OAKVILLE HOSPITAL - HPAQB APPLICATION FOR APPROVAL
July 2012 Report No. 10-1151-0350
FIGURES
É
ÉÉ É
ÉÉ
ÉÉ
É
É
É
!
!
!
!!
!
!
!!
!!
!!
!
!
!
!!
!!
!
!
!
!
!
!
!
!
!
!
!
!
!
!!
!!
!
!
!
!
!
!
!
!
!
!
!
!
!
!
!
!
!
!
!
!
!
!
!
!
!
!
!
!
!
!
!!
!!
!!
!
!!
!!
!
!
!
!
!
!
!
!
!
!
!
!
!
!
!
!
!
!
!
!
!
!
!
!
!
!
!
!
!
!
!
!
!
!
!!
!
!
!
!!
!
!!
!
!
!
!
!
!
!
!
!
!
!
!
!
!
!
!
!
!
!
!
!
!!
!!
!!
!
!
!
!
!!
!!
!!
!!
!!
!
!
!!
!!
!
!
!
!
!
!
!!
!!
!!
Ñ
ÑÑ
Ñ
Ñ
Ñ
å
å
å
å
å
å
å
å
å
å
å
å
å
å
å
å
å
å
å
å
å
å
å
å
å
å
å
å
å
åå
å
å
å
å
å
å
å
å
å
å
å
å
å
å
å
å
å
å
å
å
å
å
å
å
å
å
å
å
åå
å
å
å
å
å
å
å
å
å
å
å
åå
å
å
Fourteen Mile Creek
Bronte Creek
Joshua's Creek
Sheldon Creek
Appleby Creek
Wedgewood Creek
Morrison CreekSixteen Mile Creek
Shannon's Creek
Bronte Creek
TTRRAAFFAALLGGAARR
NNEELLSSOONN
BRITANNIA RD W
DORVAL DR
BURLOAK DR
REGIONAL RD 25
BRONTE RD
LAKESHORE RD W
TREMAINE RD
KERR ST
CORNWALL RD
REBECCA ST
8 LINE
LEIGHLAND AVE
WALKERS LINE
DUNDAS ST E
4 LIN
E
6 LINE
3 LINE
AP
PLEBY LINE
U
PPER MIDDLE RD W
DUNDAS ST W
HIGHWAY 407
DUNDAS ST
UPPER MIDDLE RD E
QUEEN ELIZABETH WAY
TRAFALGAR RD
NEYAGAWA BLVD
9 LINE
BURNHAMTHORPE RD W
SPEERS RD
596000
596000
600000
600000
604000
604000
4808000
4808000
4812000
4812000
4816000
4816000
G:\Projects\2010\10-1151-0350_Oakville_Hospital\GIS\MXDs\Reporting\Site_Location_Plan.mxd
³LEGEND
Base Data - MNR LIO, obtained 2009
Produced by Golder Associates Ltd under licence from
Ontario Ministry of Natural Resources, © Queens Printer 2012
Projection: Transverse Mercator Datum: NAD 83 Coordinate System: UTM Zone 17
REV. 0.0
Mississauga, Ontario
DESIGN
SITE LOCATION PLANSITE LOCATION PLANSITE LOCATION PLANSITE LOCATION PLAN
FIGURE: 1FIGURE: 1FIGURE: 1FIGURE: 1
PROJECT NO. 10-1151-0350 SCALE AS SHOWN
PROJECT
TITLE
GIS
REVIEW
JO 16 Jan. 2012
CHECK
OAKVILLE HOSPITAL
HPAQB APPLICATION
JO 15 Mar. 2012
KA
EKL
15 Mar. 2012
15 Mar. 2012
!
!
!
!
��401
��407
��5
��QEW
��403
��6
Guelph
Hamilton
Oakville
Burlington
REFERENCE
Ñ Health Care
å Education
Road
Railways
! Utility Line
Watercourse
Waterbody
É
É Wetland
Wooded Area
Lot Fabric
Geographic Township Boundary
Property Boundary
INDEX MAP
SCALE
Lake Ontario
1:50,000
0 1,000 2,000 3,000 4,000
METRES
Site Location
Fourteen Mile Creek
Sixteen Mile Cre
ek
Bronte Creek
Shannon's Creek
REGIONAL RD 25
TREMAINE RD
6 LIN
E
SPEERS RD
TRAFALGAR RD
UPPER MIDDLE RD W
QUEEN ELIZABETH WAY
BRONTE
RD
4 LIN
E
DUNDAS ST W
HIGHWAY 407
DUNDAS ST
DORV
AL DR
3 LIN
E
DUNDAS ST E
NEYAGAWA BLVD
596000
596000
598000
598000
600000
600000
602000
602000
604000
604000
4808000
4808000
4810000
4810000
4812000
4812000
4814000
4814000
G:\Projects\2010\10-1151-0350_Oakville_Hospital\GIS\M
XDs\Reporting\3km_Im
age.m
xd
³LEGEND
Base Data - MNR LIO, obtained 2009
Produced by Golder Associates Ltd under licence from
Ontario Ministry of Natural Resources, © Queens Printer 2012
Imagery - Microsoft Bing (c) 2010 Microsoft Corporation and its data suppliers.
Projection: Transverse Mercator Datum: NAD 83 Coordinate System: UTM Zone 17
REV. 0.0
Mississauga, Ontario
DESIGN
3KM AERIAL PHOTOGRAPH3KM AERIAL PHOTOGRAPH3KM AERIAL PHOTOGRAPH3KM AERIAL PHOTOGRAPH
FIGURE: 2FIGURE: 2FIGURE: 2FIGURE: 2
PROJECT NO. 10-1151-0350 SCALE AS SHOWN
PROJECT
TITLE
GIS
REVIEW
JO 16 Jan. 2012
CHECK
OAKVILLE HOSPITAL
HPAQB APPLICATION
JO 15 Mar. 2012
KA
EKL
15 Mar. 2012
15 Mar. 2012
!
!
!
!
��401
��407
��5
��QEW
��403
��6
Guelph
Hamilton
Oakville
Burlington
REFERENCE
Road
Watercourse
Waterbody
É
É
Wetland
3km Radius
Property Boundary
INDEX MAP
SCALE
Lake Ontario
1:30,000
0 500 1,000 1,500 2,000
METRES
Site Location


![10-1151-0350 Rpt EllisDon NOH OBL 26July2012 · GEN SET PACKAGE PERFORMANCE DATA [516DE5T] SEPTEMBER 03, 2010 For Help Desk Phone Numbers Click here Performance Number: DM8266 Change](https://img.dokumen.tips/doc/110x75/5f9cd4b226afa2693a63039c/10-1151-0350-rpt-ellisdon-noh-obl-26july2012-gen-set-package-performance-data-516de5t.jpg)