Embed Size (px)
Citation preview
Peter Martin, Wang Yuanqing, Li Yaxiang, and Derek Leung 1
XI’AN RAIL METRO PLANNING LESSONS LEARNED 1
2
3
4
Peter C. Martin 5
CDM Smith, 220 Montgomery Street, Suite 1418, San Francisco, CA 94104 6
Phone/Fax: 415-653-3304, Email: [email protected] 7
8
Wang Yuanqing 9
Professor and Dean, Department of Traffic Engineering, School of Highway 10
Chang’an University, P.O. Box #487, Middle section of South 2nd Ring Road, Xi’an, P.R. China 710064 11
Phone: 86 29 82334851, Fax: 86 29 82334851, Email: [email protected] 12
13
Li Yaxiang 14
PhD Candidate, Department of Traffic Engineering, School of Highway 15
Chang’an University, P.O. Box #487, Middle section of South 2nd Ring Road, Xi’an, P.R. China 710064 16
Phone: 86 29 82334851, Email: [email protected] 17
18
Derek Leung 19
Project Director, WB Group International Limited 20
Room 1106-1108, Block B, International Chamber of Commerce Building 21
138 Fuhua 1st Road, Futian District, Shenzhen PR China 518048 22
Phone: 86 755 8378 7378, Fax: 86 755 8378 7278, Email: [email protected] 23
24
25
Corresponding Author – Peter C. Martin 26
27
28
Word Count: Abstract text (219 words) + Manuscript text (5,029 words) + 9 tables/figures (2,250 words 29
at 250 words each) = 7,498 words 30
31
32
Submission Date: November 11, 2015 33
34
Peter Martin, Wang Yuanqing, Li Yaxiang, and Derek Leung 2
ABSTRACT 1
Xi’an is a major city of about 8 million population that is located approximately 740 miles southwest 2
of Beijing. Internationally, it is perhaps best known for its historic terra cotta warriors. The city is 3
rapidly growing and traffic congestion has increased along with deterioration of its air quality. Its 4
fleet of 7,700 buses serving 263 routes is being stressed beyond capacity. In response, the city adopted 5
an ambitious rail metro plan. The current plan is to construct 15 rail Metro lines by 2030. Two lines 6
have opened and another four are under construction. Line 2 opened in 2011 and serves the major 7
north-south corridor. Line 1 opened in 2013 (two years later) and serves a major east-west corridor. 8
To date, the Xi’an Metro is overly successful. Ridership on the first two lines is at capacity of the 9
current resources. The six car trainsets operating on 5 minute headways are at maximum capacity and 10
the crush load trains experience extended station dwell times. Opportunities to reduce headways, 11
lengthen trains and reduce station dwell times along with network expansion implications on these two 12
core lines are critically important issues. This paper describes the current and planned Xi’an Metro 13
and the planning lessons learned to date. Lessons can be learned as much from successful metro 14
implementations, as from those that have disappointed. 15
16

Peter Martin, Wang Yuanqing, Li Yaxiang, and Derek Leung 3
Xi’an, located approximately 740 miles southwest of Beijing, is the eastern starting point of the Ancient 1
Silk Road and perhaps best known worldwide for its historic terra cotta warriors. Xi’an is the capital 2
of Shaanxi Province. The built-up area has reached 505 square kilometers (195.0 sq. mi). It has a 3
population of 8.63 million and per capita GDP of $10,394. Like most cities in China, Xi’an is rapidly 4
growing and prospering. In 1990 Xi’an had a population of 6,088,901 and in 2030 it is projected to 5
grow to 12,000,000 residents. 6
Xi’an has a grid road network centered about a vibrant downtown, which includes the historic 7
Walled City at its core. Chang An Street bisects the downtown and Walled City and is the city’s 8
primary north-south spine traffic artery. Other defining structural features of the city are the 2nd Ring 9
Road, which is an expressway located about 5.5 km from the city center, and the 3rd Ring Road, which 10
is a freeway located about 10 km from the city center. The Walled City is rectangular shaped and is 11
about 2.7 km by 4.3 km in dimensions and its boundaries are defined by the 1st Ring Road. In the 12
Walled City and the core area of the city the blocks are relatively long (about 600 meters). 13
While the Walled City is the epicenter for passenger destinations, the areas within the 2nd Ring 14
Road are also densely developed with many important passenger destinations. Xi’an has a population 15
density of 95,000 residents per square mile within the 1st Ring Road, 53,000 residents per square mile 16
between the 1st Ring Road and 2nd Ring Road, and 17,000 residents per square mile between the 2nd 17
Ring Road and 3rd Ring Road (for perspective - the City of San Francisco has 17,000 residents per 18
square mile). The areas outside of the 2nd Ring Road are densely developed by western standards. 19
The city is aggressively promoting transit oriented development around its Metro stations. 20
Xi’an has been experiencing rapid motorization. Motor vehicle registration currently is 21
2.2 million and licensed drivers now total 3.2 million, accounting for 37 percent of the city’s population. 22
Almost 90 percent of vehicles are concentrated on Xi’an’s downtown road network. Not only are the 23
numbers of cars, taxis, buses and trucks increasing, but a major shift is occurring with bicycles in Xi’an. 24
Many conventional pedal bicycles are being replaced by electric battery powered bikes, which further 25
complicates traffic operations on city streets. Xi’an has a robust bike share program. 26
Transit and non-motorized traffic systems play an important role controlling road congestion 27
and low-carbon emission in Xi’an. Congestion and air pollution are major issues in the city. Xi’an 28
has a robust bus transit system with 23 bus enterprises, 7,769 buses and 263 bus lines which carry 29
4,680,000 passengers each day in this city. Currently, there are two metro rail transit lines in operation 30
with a total length of 51.8km and both serve the Walled City area. One transfer station, Bei Da Jie 31
Zhan, provides connections between the two lines. Xi’an Metro Line 1 serves a major east-west travel 32
corridor and Line 2 serves the Chang An Street north-south travel corridor. Combined, the two metro 33
lines reached 1,255,000 riders on the day before May Day 2015 (Labor Day) of which Metro Line 1 34
served 500,000 and Metro Line 2 served 755,000 riders. 35
The bus volumes and passenger loads are very high, even for corridors now served by Metro. 36
For example, nearly 250 buses per hour per direction ply the Chang An corridor, providing an additional 37
capacity of about 7,000 riders per hour per peak direction to the capacity of the Metro. More than 30 38
bus routes serve some bus stops, resulting in bus on bus conflicts where more than 7 buses could be 39
simultaneously boarding passengers. Xi’an bus passengers have learned to be quick and nimble at 40
these stops and bus dwell times are surprisingly short. 41
42

Peter Martin, Wang Yuanqing, Li Yaxiang, and Derek Leung 4
1. OVERVIEW OF XI’AN METRO 1
Xi’an’s planned metro rail transit network consists of 15 lines, totaling 667km. Six Metro lines will 2
be completed by 2020, totaling 252km. Metro Line 2 began construction on September 2006 and 3
opened to the public September 2011. Metro Line 1 began construction October 2008 and opened to 4
the public on September 2013 (two years later than Line 2). Xi’an Metro Lines 3 and 4 are under-5
construction. Xi’an Metro Lines 5, and 6 and the eastern extension line of Xi’an Metro Line 1 (second 6
phase) are awaiting construction. Figure 1 shows the 2020 rail network. As shown in Figure 1, the 7
2020 rail network will have no north-south line connections west of Line 2. The proposed post-2020 8
Metro rail transit lines (Lines 7 to 15) have not been fully planned. Metro trains are six cars long 9
(about 118 meters) and stations are designed with curtain doors. The trains are open with no barrier 10
doors between cars, which helps distribute passengers uniformly. 11
12
Source: Xi’an Metro. 13
FIGURE 1 Xi’an Metro Network Short-Term Planning (2006-2018). 14
The first phrase of Xi’an Metro Line 1 has a total length of 25.4 km with 19 underground stations. It 15
will be extended westward to Xianyang Forest Park (four stations) and eastward to Lintong Tourism 16
Resort Zone (15 stations) in the long-term planning. Station spacing averages 1.4 km or nearly one 17
mile apart. Metro Lines 1 and 6 are the only planned Metro lines to pass east-west through the Walled 18
City. 19
Line 2 was extended south four stations on June 16, 2014 (second phase). The current Xi’an 20
Metro Line 2 has a total length of 26.4 km and 21 underground stations, which averages to 1.3 km 21

Peter Martin, Wang Yuanqing, Li Yaxiang, and Derek Leung 5
spacing for stations. Line 2 is mostly underground, about 20 m below the surface. All station 1
platforms are island platforms with a length of 120 m each. Line 2 will be extended northeastward 2
from Xi’an North Railway Station to Chen Jiabao (three stations) in the long-term planning. It cost 3
$2.24US billion to construct Line 2, or about $137.3US million per mile. The transfer station with 4
Line 1, and the next station south (Zhong Lou Zhan, ZLZ) are the two busiest stations. When Lines 5
3, 4, 5 and 6 open, high volumes of passenger transfers are anticipated at these stations which are 6
already high passenger loading stations now. 7
Xi’an Metro Line 3 is aligned from northeast to southwest and along with Lines 1 and 2 it is 8
identified as a Backbone Metro Line. Line 3 has total length of 39.1 km and 26 stations including 19 9
underground stations and seven elevated stations. It is the only line with elevated stations in the short-10
term planning and provides for transfers with Lines 1, 2, 4, 5, and 6. 11
Xi’an Metro Line 4 is a north-south backbone Metro line, which is envisioned to play a 12
supporting and complementary role to Line 2 for north-south travel. It has a total length of 35.2 km 13
and 29 underground stations including eleven transfer stations. Line 4 passes through the Walled City 14
nearly one mile east of the Line 2 alignment. 15
Xi’an Metro Line 5 will complement Line 1 east-west passenger flow along with Line 3. It 16
will be 25.4 km long with 21 stations. 17
Xi’an Metro Line 6’s southwest to northeast alignment provides transfers with the other five 18
2020 metro lines. It directly serves the Walled City area in an east-west direction. Xi’an Metro Line 19
6 has a total length of 20.1 km and 15 stations. 20
Only four of the planned 15 lines focus on the core Walled City destinations (Lines 1, 2, 4 and 21
6). Lines 3 and 5 serve inner parts of the city, but their riders will need to transfer to reach the core 22
area of the city. Lines 1 and 2 are already operating at crush load conditions and will be very 23
challenged to accommodate transfer passengers from other lines. 24
25
2. DESCRIPTION OF XI’AN METRO LINES 1 AND 2 26
The current ridership, operating conditions and transfer features of Metro Lines 1 and 2 are important 27
to understanding Xi’an Metro’s capacity issues. 28
29
2.1 Passenger Volume 30
On September 16, 2011, Metro Line 2 opened with 145,000 riders. Two years later on September 16, 31
2013, Metro Line 1 opened and total daily Metro ridership increased to 471,000. Total annual rail 32
Metro passenger ridership is now close to 300 million riders. On June 16, 2014, the southern 33
extension line of Metro Line 2 opened and total daily metro passenger volume increased to 900,000. 34
The weekday ridership in July 2015 has increased to 950,000, but this average rises to more than 1 35
million daily riders on Friday, Saturday and Sunday. The peak one day ridership was 1,225,000, which 36
occurred on the day before Labor Day 2015. 37
Ridership data from November 2011 to August 2014 was reviewed to determine the trends in 38
daily passenger volumes. As shown in Figure 2, average daily ridership of Metro Line 2 was under 39
220,000 in the first two years. In the second quarter of 2013, average daily ridership increased by 40
42.4 percent, in comparison with the second quarter of 2012 ridership. Passenger volume increased 41
rapidly after November 2013. The combined two Metro lines ridership rose to 680,000. In the 42
second quarter of 2014, the daily passenger volume of Metro Line 2 increased by 120.3 percent in 43
comparison with the second quarter of 2013. August 2014 daily ridership on Line 2 was 550,000 and 44

Peter Martin, Wang Yuanqing, Li Yaxiang, and Derek Leung 6
for Line 1 it was 350,000 as shown in Figure 2. 1
2
FIGURE 2 Daily Mean Passenger Volume of Xi’an Metro Line 1 and 2. 3
4
Prior to opening of rail service, Metro Line 2 was forecast to reach 986,900 daily passengers 5
by 2025 and 1,178,300 by 2040 as shown in Table 1. The current 580,000 daily riders on Line 2 is 6
about 60 percent of the forecast 2025 daily ridership and the trains are now fully loaded running on 5 7
minute headways. 8
9
TABLE 1 Daily Passenger Forecast for Metro Lines 10
Parameter Year Line 1 Line 2 Line 3 Line 4 Line 5 Line 6
Passenger flow
(in 10,000 persons/day)
2025 83.65 98.69 93.15 74.33 66.83 60.24
2040 101.45 117.83 115.88 96.04 87.55 78.18
Source: Study on Urban Rail Transit Passenger Forecast and Analysis. Xi’an, China (1). 11
12
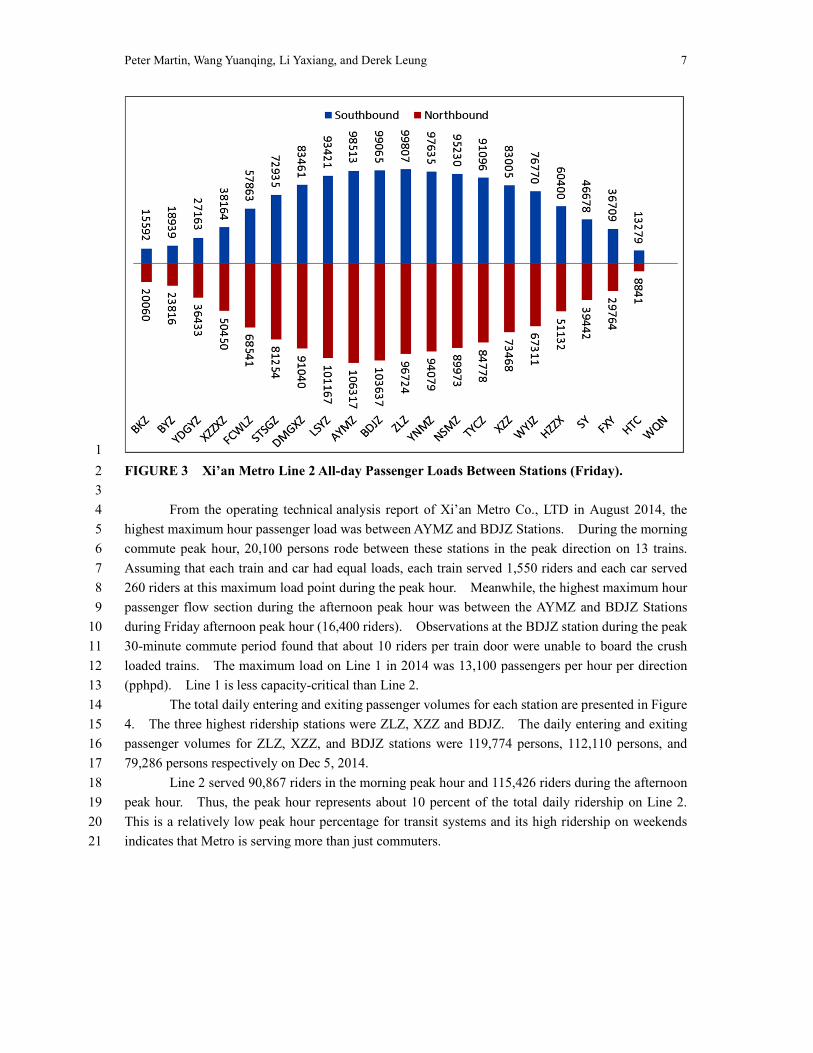
Analysis of Metro Line 2’s daily ridership on Friday Dec 5, 2014, (Figure 3) determined the 13
maximum passenger load point was between An Yuan Men Zhan (AYMZ) and Bei Da Jie Zhan (BDJZ) 14
stations. 15
0
100000
200000
300000
400000
500000
600000
Metro Line 1 Metro Line 2
Peter Martin, Wang Yuanqing, Li Yaxiang, and Derek Leung 7
1
FIGURE 3 Xi’an Metro Line 2 All-day Passenger Loads Between Stations (Friday). 2
3
From the operating technical analysis report of Xi’an Metro Co., LTD in August 2014, the 4
highest maximum hour passenger load was between AYMZ and BDJZ Stations. During the morning 5
commute peak hour, 20,100 persons rode between these stations in the peak direction on 13 trains. 6
Assuming that each train and car had equal loads, each train served 1,550 riders and each car served 7
260 riders at this maximum load point during the peak hour. Meanwhile, the highest maximum hour 8
passenger flow section during the afternoon peak hour was between the AYMZ and BDJZ Stations 9
during Friday afternoon peak hour (16,400 riders). Observations at the BDJZ station during the peak 10
30-minute commute period found that about 10 riders per train door were unable to board the crush 11
loaded trains. The maximum load on Line 1 in 2014 was 13,100 passengers per hour per direction 12
(pphpd). Line 1 is less capacity-critical than Line 2. 13
The total daily entering and exiting passenger volumes for each station are presented in Figure 14
4. The three highest ridership stations were ZLZ, XZZ and BDJZ. The daily entering and exiting 15
passenger volumes for ZLZ, XZZ, and BDJZ stations were 119,774 persons, 112,110 persons, and 16
79,286 persons respectively on Dec 5, 2014. 17
Line 2 served 90,867 riders in the morning peak hour and 115,426 riders during the afternoon 18
peak hour. Thus, the peak hour represents about 10 percent of the total daily ridership on Line 2. 19
This is a relatively low peak hour percentage for transit systems and its high ridership on weekends 20
indicates that Metro is serving more than just commuters. 21

Peter Martin, Wang Yuanqing, Li Yaxiang, and Derek Leung 8
1
FIGURE 4 Xi’an Metro Line 2 Daily Station Entering and Exiting Passenger Volumes. 2
3
The entering and exiting passenger volumes for the three most popular stations are shown in 4
Figure 5. 5
6
7
FIGURE 5 Hourly Passenger Volumes for Three Most Popular Stations. 8
9
2.2 Rail Operations 10
Xi’an Metro operates from 6:10AM to 23:15PM. The minimum headway for Metro Line 1 is 5 11
minutes 30 seconds, and for Line 2 is 4 minutes 44 seconds. The designed minimum headway is 2 12
minutes. The two Metro lines use six B type trains. Each train has a maximum rated passenger 13

Peter Martin, Wang Yuanqing, Li Yaxiang, and Derek Leung 9
capacity of 1,880 passengers. Current experience suggests that 1,500 passengers per train is the 1
effective capacity. B type trains are 118 meters long and 2.8 meters wide. Currently, 20 trains are 2
used to operate Line 1 and 22 trains to operate Line 2. 3
The average station spacing on Metro Line 2 is 1,306 meters. The maximum and minimum 4
station spacing are 1,799 meters and 870 meters, respectively. There are 5 stations spaced more than 5
1.5km (all suburban stations). 6
The scheduled station dwell times of Metro Line 2 from northern terminal (BKZ) to southern 7
terminal (WQN) are presented in Figure 6. Most stations have average dwell times of less than 35 8
seconds, but a few stations have 50 second and longer average dwell times. Observation at the BDJZ 9
station during peak hours found total dwell times exceeding 90 seconds. Observed afternoon peak 10
hour average dwell times were about 50 seconds at BDJZ Station and the loss time for opening doors 11
after train stop averaged 7 seconds along with loss time for door closing before train start average 13 12
seconds. 13
14
15
FIGURE 6 Xi’an Metro Line 2 Station Dwell Times (Southbound). 16
17
2.3 Transfer Station 18
Ultimately, Xi’an Metro Line 2 will have 5 transfer stations - XZZXZ (to Metro Line 4), BDJZ (to 19
Metro Line 1), ZLZ (to Metro Line 6), XZZ (to Metro Line 3) and HZZX (to Metro Line 5). At 20
present, only the BDJZ Station provides passenger interchanges. In December 2014, the daily 21
passenger transfer interchange volumes for workdays and non-workdays at this station were 109,175 22
riders and 127,867 riders, accounting for 65.7 percent and 67.6 percent of this station’s total boardings. 23
The daily interchange volume during morning and afternoon peak hours were 8,759 riders and 11,807 24
riders, accounting for 66.4 percent and 69.9 percent of this station boardings respectively. In summary, 25
substantial passenger transfers are occurring between Lines 1 and 2. 26
BDJZ, located in core downtown area, is a transfer station between Metro Line 1 and 2. BDJZ 27
has three underground layers, as shown in Figure 7. The ground floor is the station ticketing 28
mezzanine for Metro Lines 1 and 2. Below the mezzanine level are the side platforms for Metro Line 29
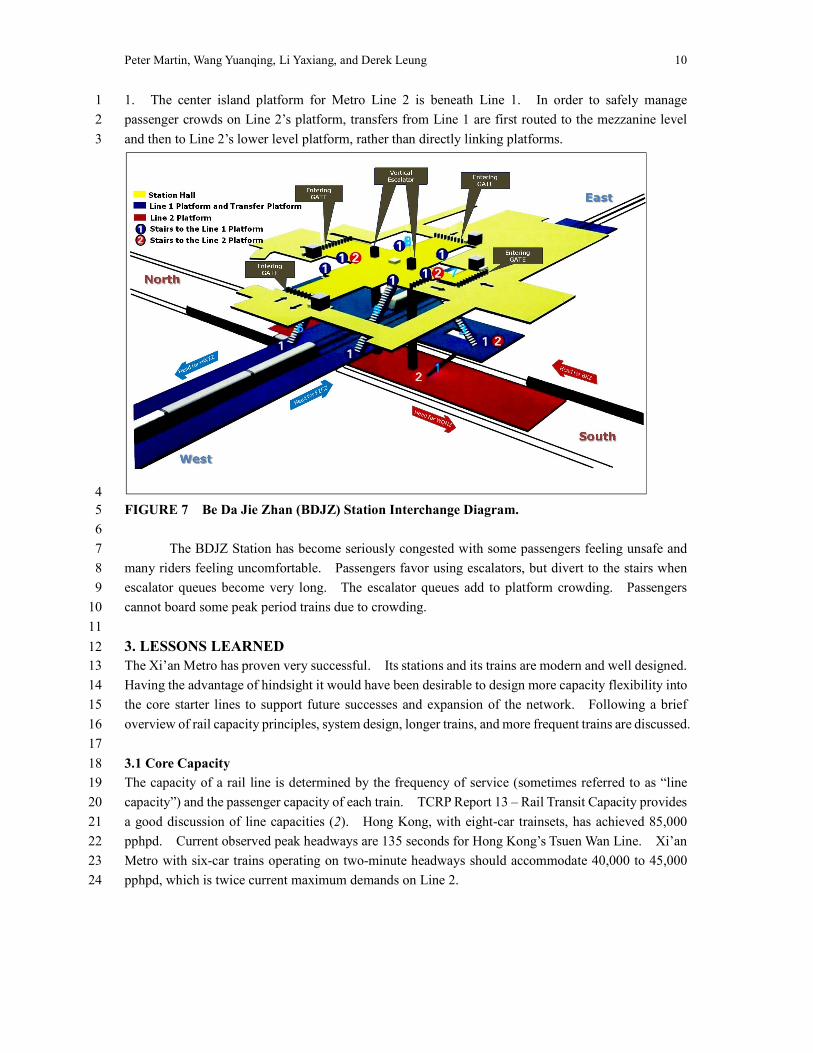
Peter Martin, Wang Yuanqing, Li Yaxiang, and Derek Leung 10
1. The center island platform for Metro Line 2 is beneath Line 1. In order to safely manage 1
passenger crowds on Line 2’s platform, transfers from Line 1 are first routed to the mezzanine level 2
and then to Line 2’s lower level platform, rather than directly linking platforms. 3
4
FIGURE 7 Be Da Jie Zhan (BDJZ) Station Interchange Diagram. 5
6
The BDJZ Station has become seriously congested with some passengers feeling unsafe and 7
many riders feeling uncomfortable. Passengers favor using escalators, but divert to the stairs when 8
escalator queues become very long. The escalator queues add to platform crowding. Passengers 9
cannot board some peak period trains due to crowding. 10
11
3. LESSONS LEARNED 12
The Xi’an Metro has proven very successful. Its stations and its trains are modern and well designed. 13
Having the advantage of hindsight it would have been desirable to design more capacity flexibility into 14
the core starter lines to support future successes and expansion of the network. Following a brief 15
overview of rail capacity principles, system design, longer trains, and more frequent trains are discussed. 16
17
3.1 Core Capacity 18
The capacity of a rail line is determined by the frequency of service (sometimes referred to as “line 19
capacity”) and the passenger capacity of each train. TCRP Report 13 – Rail Transit Capacity provides 20
a good discussion of line capacities (2). Hong Kong, with eight-car trainsets, has achieved 85,000 21
pphpd. Current observed peak headways are 135 seconds for Hong Kong’s Tsuen Wan Line. Xi’an 22
Metro with six-car trains operating on two-minute headways should accommodate 40,000 to 45,000 23
pphpd, which is twice current maximum demands on Line 2. 24

Peter Martin, Wang Yuanqing, Li Yaxiang, and Derek Leung 11
3.2 Passenger Capacity per Train 1
Passenger capacity of each train is a function of the size of cars and their interior configuration, 2
uniformity of loading, along with the maximum number of cars per train. The latter is often limited 3
by the length of station platforms. Train passenger capacity can be defined in terms of either 4
design/desired passenger loads or crush loads. Currently the maximum crush load capacity of each 5
six car train is defined to be 1,880 passengers. 6
7
3.3 Line Capacity 8
Line capacity is generally limited by the minimum reliable and safe headway, which is determined by 9
train speeds, maximum station dwell times, and by end of line turn-back, train control system 10
capabilities and other service line features. An operating margin is included in the calculation of 11
minimum headways to account for variations in dwell-times, other operational factors and the desired 12
level of schedule reliability. In essence, the operating margin represents the amount of time a train 13
can run behind schedule without impacting the following train. For a typical 120 second headway 14
metro service in the US, its component headway times might include 40 seconds for station dwell time, 15
15 to 25 seconds for the operating margin, and 55 to 65 seconds for train control separation (3). It 16
appears that 90 seconds is the closest headways that can be effectively operated. Shanghai Metro’s 17
train control can handle 90-second headways. The Xi’an Metro train control is designed for two 18
minute headway operations. Achieving this headway, however, will require effectively managing 19
station dwell times and increased efforts for operational schedule reliability. 20
21
3.4 System Elements Influencing Capacity 22
Secondary, but important capacity factors also include station capacity (vertical circulation and 23
platform features of stations) and electrical power distribution capacity. The simplistic determination 24
of theoretical capacity is not always identical to the practical capacity achieved, due to a myriad of 25
other influences. Most rail transit systems have their highest passenger loads closest to the downtown 26
core, with end of line loadings relatively light. The line capacity is designed for the maximum 27
passenger load point along the line. 28
Some rail networks have multiple lines sharing tracks in the core area and branching to 29
respective lines at their outer ends. This design provides double or more the train frequency on the 30
core segment of tracks, but branching generally requires switching trains and thus can reduce core 31
capacity. Operation of more than one line on core tracks can also increase station dwell times, as 32
passenger queueing and jockeying on the platform tends to increase conflicts. 33
34
3.5 System Design 35
Rail network capacity needs are commonly planned using sophisticated travel demand models. These 36
models use imperfect land use and other inputs, use imperfect travel behavior relationships and are run 37
and interpreted by imperfect humans. They tend to be good tools, but their weaknesses are often not 38
fully appreciated and the risks of erred forecasts are not fully considered. This problem is particularly 39
important in rapidly growing and prospering cities like Xi’an. For these rapid growth cities, the metro 40
lines that are first constructed tend to be in the heart of desired passenger destinations and tend to be 41
the foundation line for which all other subsequent lines will depend on for their success. Thus, fully 42
considering the risks of not providing the flexibility to provide long-term capacity for the core line of 43
the network warrants a vigorous risks assessment discussion. Recent experience has shown that “if 44

Peter Martin, Wang Yuanqing, Li Yaxiang, and Derek Leung 12
you build it they will come” applies to these starter lines serving core center city areas. In retrospect, 1
more capacity flexibility should have been designed into the network, particularly for Line 2. 2
Perhaps a better way of planning capacity would be to relate the capacity of the core network segment 3
to the demands of the other network elements. 4
The planned Xi’an Metro network consisting of 15 lines only focuses four of these lines (Lines 5
1, 2 ,4 and 6) on the core Walled City destinations. Lines 3 and 5 serve inner parts of the city, but 6
their riders will need to transfer to reach the core area of the city. Lines 1 and 2 are already operating 7
at crush load conditions with 5 minute headway operations and could be challenged in the future to 8
accommodate transfer passengers from other lines. The existing developments in and around the 9
Walled City complicate provision of additional Metro lines in this key area. In retrospect, with the 10
overly successful patronage of Line 2, additional capacity should have been provided on this rail line. 11
Design for longer trains and shorter headways would be desirable. 12
13
3.6 Augmented Pedestrian Link Capacity 14
Currently, the Line 2 capacity bottleneck is between the transfer station to Line 1 (BDJZ) and the Bell 15
Tower Station (ZLZ). In future, this bottleneck could expand to the six stations between Line 1 (BDJZ) 16
and the planned Line 3 (XZZ) Station. If the bottleneck remains primarily between the transfer to 17
Line 1 and the Bell Tower (about 1,200 meters), minor capacity enhancements might include the 18
provision of a high-capacity pedestrian link featuring moving sidewalks connecting the BDJZ and ZLZ 19
stations to divert Line 1 passengers destined for the Bell Tower away from Line 2. Hong Kong has a 20
300-meter pedestrian link like this connecting its Tsuen Wan Line Tsim Sha Tsui Station with the East 21
Tsim Sha Tsui Station on the West Line (shown in Figure 8). A less attractive option would be to 22
simply connect the mezzanines of the two stations with a pedestrian concourse. Bangkok’s Skytrain 23
provides an 800-meter mezzanine pedestrian link between its Chit Lom and Siam stations. The 1,200-24
meter distance is probably too long to be effectively served by this concept alone. Metro fares could 25
be adjusted to further encourage passengers to use the parallel pedestrian link. 26
27
FIGURE 8 Hong Kong’s Rail Station Pedestrian Connection. 28

Peter Martin, Wang Yuanqing, Li Yaxiang, and Derek Leung 13
3.7 Addition of Infill Stations 1
Additional stations on the capacity critical segment would help to disperse passenger boardings and 2
thereby reduce dwell times. For example, adding a station between the Line 1 (BDJZ) transfer station 3
and the Bell Tower Station (ZLZ) would reduce boardings at the current two stations and help to reduce 4
dwell times at these capacity critical stations. This would result in 600m spacings between core area 5
stations. As noted earlier, the typical city block size in Xi’an is about 600m. This could be 6
complemented with a Hong Kong type pedestrian linkage. The Bay Area Rapid Transit (BART) 7
system in San Francisco with its long 240m platforms has core stations spaced about 700m apart. 8
Similarly, the MTR system in Hong Kong has core stations spaced about 800m apart. 9
10
3.8 Overlapping Rail Lines 11
Depending on through ridership on Line 2, break Line 2 into two lines with the segments overlapping 12
on the four mile core segment. Northbound trains might operate on the upper level and southbound 13
trains on the lower level of a four track system between the Line 1 and Line 5 stations. This would 14
allow cross platform transfers for the through riding passengers. 15
Another strategy to provide a four-track system in the core would be to overlap two branching 16
lines with two northbound tracks on the upper level and two southbound tracks on the lower level. 17
Twice the capacity would be provided on the four track segment. Desirably, the junctions where the 18
two lines split would be grade separated. 19
20
3.9 Longer Trains 21
The current platforms at stations are designed for six car trains. Stations were designed to allow 22
platforms to be extended for another two cars without major difficulty and thereby add 33 percent more 23
capacity. Extending the trains further to serve ten car trains appears difficult. In retrospect, the 24
platform lengths for capacity-critical core rail lines probably should have been designed for expansion 25
to serve a ten car train (67 percent increase in capacity). While this would have added to construction 26
costs, the added investment would help maximize patronage of the entire network by alleviating the 27
network capacity constraint. It is understood that all planned Metro lines will use the same six car 28
trainset, but it would not be necessary for capacity-critical lines to be limited to system-wide practice. 29
Shanghai Metro currently operates some eight car trainsets and San Francisco’s BART operates 240-30
meter ten-car trainsets. Most metro rail platforms in the US are between 180m and 240m in length. 31
BART changes train lengths to fit demand needs. 32
33
3.10 More Frequent Trains 34
Significant capacity gains can be achieved by operating more trains per hour. Reducing train 35
headways to 4 minutes would provide approximately a 15 percent increase in capacity on Line 2. 36
Reducing the headway to 3 minutes, 2 minutes, and 90 seconds would provide 54 percent, 130 percent 37
and 200 percent capacity increases respectively over current service on Line 2. Thus, three times more 38
capacity could be provided with 90 second headways. In addition to more financial and equipment 39
resource investments, reducing train headways would require: a train control system capable of close 40
headways; reliable operations management (to reduce the operating margin needs) and reducing 41
capacity-critical station dwell-times. The train control system reportedly can accommodate 120 42
second headways. If 90-second headways are needed, the signal system would need to be upgraded. 43
Well-designed track crossovers and pocket tracks (for dead trains) would all help manage operating 44

Peter Martin, Wang Yuanqing, Li Yaxiang, and Derek Leung 14
margins and maintain reliable schedule operations. Theoretically, 90-second headway service using 1
eight car trains could provide four times the current capacity and a ten car train operating 90-second 2
headways could provide roughly five times the capacity of current service. Managing station dwell 3
times, particularly at the critical stations possibly might include: 4
• Manage passenger loads to avoid crush loaded trains; 5
• Forced and managed closure of train doors to maintain schedule; 6
• Provision of station saddle platforms; 7
• Increase capacity of train doors; and 8
• Passenger guidance to keep clear for exiting passengers. 9
10
3.11 Manage Passenger Loads 11
The amount of station dwell time varies widely with high boarding stations having longer times than 12
light boarding stations. The average time per boarding/alighting also depends on the degree of crush 13
loading and special needs passengers (those with wheelchairs, those with bulky items and those with 14
mobility impairments). Average boarding/alighting passenger times for crush load trains increase 15
dramatically due to circulation conflicts on board and at the train doors and increased conflicts between 16
boarding passengers and alighting passengers, which sometimes resembles a rugby scrum. The BART 17
rail system in San Francisco is somewhat typical having a mean dwell time of 46 seconds with 58 18
seconds being a one standard deviation maximum and 70 seconds being the two standard deviation 19
maximum (2). BART will be reducing these dwell times when they begin operating new trains with 20
three doors per car. A few very crowded rail lines limited train dwell times at capacity critical stations, 21
even if it leaves some passengers to wait for the next train. This practice recognizes that maximum 22
capacity is achieved by controlling and minimizing station dwell times, which allows more trains to be 23
run per hour. 24
Dwell times increase dramatically when trains are crush loaded as efforts to exit the train 25
increase and efforts to pack more passengers onto a fully loaded car take a lot of time and often block 26
train doors from closing. Operating sufficient capacity to avoid crush-loaded trains will significantly 27
reduce station dwell times, particularly at capacity critical stations. Xi’an Metro cars are often crush-28
loaded and dwell times vary widely, extending well beyond 45 seconds. The current average load of 29
1,550 riders per train might very well maximize passengers per train, but its extended station dwell time 30
limits the number of trains that can be operated. 31
Designing capacities to avoid crush loads would help to minimize station dwell times at key 32
stations. The reduction, however, would reduce the passenger capacity of each train. New York City 33
Transit (NYCT) plans for 3.6 passengers per square meter to manage dwell times and provide 34
contingent capacity to smooth over service irregularities and daily passenger fluctuations (2). Line 2 35
is currently serving 4.7 passengers per square meter. Adopting 4.0 passengers per square meter as a 36
standard would reduce the peak load point capacity of each train to 1,320 pphpd, but might allow for 37
shorter headway operations (more trains). Metro might experiment with different load standards to 38
determine which work best for local conditions. 39
40
3.12 Managed Dwell Times 41
With more frequent service, the inconvenience associated with waiting for the next train becomes less. 42
In practice, particularly in crush-load service conditions, passengers will fight hard to board the first 43
train. Some cities have imposed aggressive management to prevent excessive train dwell times at 44

Peter Martin, Wang Yuanqing, Li Yaxiang, and Derek Leung 15
stations. Essentially, when the scheduled dwell time is approached, staff advises passengers on the 1
platform that the train is about to depart and not to block door closings. Fines for passengers blocking 2
door closings might also be considered. Eliminating the loss times associated with door openings and 3
door closings (20 seconds) should also be a priority. 4
5
3.13 Provision of Station Saddle Platforms 6
Boarding and alighting passengers from the same doors on the same side of the train results in pushing 7
conflicts that add to station dwell times. Some metro systems have provided platforms on both sides 8
of trains and use one side for exiting passengers and the other platform for boarding passengers. Thus, 9
conflicts are eliminated at the train doors and the effective number of doors per car is doubled, reducing 10
passenger processing times. This concept of double sided platforms is often seen at airports for 11
people-mover stations. Typically, boarding passengers use the center platform and exiting passengers 12
use the side platforms at stations. The concept requires additional vertical circulation systems as well 13
as additional platforms. To minimize time loss due to curtain safety doors, it might be possible to only 14
have them on the boarding platform. 15
16
3.14 Increase Door Capacities 17
The Xi’an Metro cars are well designed for crush-loads and opportunities to widen or increase the 18
number of doors is not evident. The interior configuration of the Metro cars is very efficient and little 19
opportunity seems to exist to improve upon the current design. The 118m long train has 24 doors each 20
side or a door every 4.9m. 21
22
3.15 Keep Clear of Doors 23
Metro currently has excellent platform markings and deploys staff to help manage platform crowds as 24
trains approach. Opportunities for further improvements are not limited. Controlling crowds on 25
platforms warrants more attention. These measures include limiting access to overcrowded platforms 26
and efforts to distribute passengers along the platform. Emergency STOP buttons on entry escalators 27
should be considered. 28
29
REFERENCES 30
1. Wang Yuanqing. Study on Urban Rail Transit Forecast and Analysis. Xi’an China, Chang An 31
University, 2011. 32
2. Transit Cooperative Research Program Report 13 – Rail Transit Capacity. Transportation 33
Research Board National Academy Press, Washington, D.C., 1996. 34
3. Transit Cooperative Research Program Report 100 – Transit Quality of Service Manual, Third 35
Edition. Transportation Research Board National Academy Press, Washington, D.C., 2013. 36
37