Embed Size (px)
Citation preview

1
[Turn Over
SERANGOON JUNIOR COLLEGE
2010 JC2 PRELIMINARY EXAMINATION
MATHEMATICS
Higher 2 9740/2
Wednesday 25 August 2010
Additional materials: Writing paper
List of Formulae (MF15)
TIME : 3 hours
READ THESE INSTRUCTIONS FIRST
Write your name and class on the cover page and on all the work you hand in. Write in dark or black pen on both sides of the paper. You may use a soft pencil for any diagrams or graphs. Do not use staples, paper clips, highlighters, glue or correction fluid. Answer all the questions. Give non-exact numerical answers correct to 3 significant figures, or 1 decimal place in the case of angles in degrees, unless a different level of accuracy is specified in the question. You are expected to use a graphic calculator. Unsupported answers from a graphic calculator are allowed unless a question specifically states otherwise. Where unsupported answers from a graphic calculator are not allowed in a question, you are required to present the mathematical steps using mathematical notations and not calculator commands. You are reminded of the need for clear presentation in your answers. The number of marks is given in brackets [ ] at the end of each question or part question. At the end of the examination, fasten all your work securely together.
Total marks for this paper is 100 marks.
This question paper consists of many printed pages and no blank pages.

2
[Turn Over
Section A: Pure Mathematics [40 marks]
1 The computer company call “Orange” manufactures the latest electronic gadget in town
called the iBoard with 3 different storage capacities namely 16GB, 32GB and 64GB.
The profit earned from each unit sold is as shown in the table below.
Storage Capacity 16GB 32GB 64GB
Profit $x $y $z
Within the first week after it was officially launched, the sales from 3 of its outlets for the three different storage capacities is as shown below.
The total profit collected from outlets B and C are $38 750 and $8750 respectively. If the total profit earned due to both the sales of 16GB and 32GB iBoard is equal to 12 times the total profit earned from the sales of the 64GB iBoard, find the value of x, y and z.
[4] Find the total profit collected from outlet A. [1]
Solution:
( )
180 230 70 38750
45 50 10 8750
300 400 12 100 3 4 12 0
x y z
x y z
x y z x y z
+ + =
+ + =
+ = ⇒ + − =
M3 Using G.C, 100, 75 and 50x y z= = = A1 Profit collected by outlet A ( ) ( ) ( )$100 75 $75 120 $50 20 $17500= + + = B1
Storage Capacity 16GB 32GB 64GB
Outlet A 75 120 20 Outlet B 180 230 70 Outlet C 45 50 10
Comment [YUN1]: A rather straight forward question. A lot of students got the full marks.
Comment [YUN2]: Surprisingly some students were not able to obtain all 3 equations correctly. They got the first 2 correct but many had issues with obtaining the last one. A handful did not use GC but adopted the usual algebraic method to evaluate the answers for x, y and z.
Comment [YUN3]: Very few students forgot to write down the $ sign.

3
[Turn Over
2 A curve C has parametric equations
x = a sin2 t, y = a cos t, 02
tπ
≤ ≤ where a > 0.
(i) Sketch the curve. [2]
(ii) Find the equation of the normal at the point P where t = 3
π . [3]
(iii) Using a non-calculator method, determine whether the normal at P will meet C
again. [3] Solution:
(i)
1 mark - shape
1 mark - intercepts
(ii) x = a sin2 t, y = a cos t
ttat
xcossin2
d
d= , ta
t
ysin
d
d−=
ttta
ta
x
ysec
2
1
cossin2
sin
d
d−=
−=
[m1]
At the point P where t = 3
π, 1
d
d−=
x
y
[m1]
Equation of normal at P (3 1
,4 2
a a ):
y
x
a
a
Comment [YUN4]: Students fail to check the domain when sketching the graph while some have difficulty indicating the intercepts correctly.
Comment [YUN5]: Surprisingly, quite a number of students cannot differentiate x correctly while some after differentiating, the ‘a’ disappeared

4
[Turn Over
y – y1 = m (x – x1)
1 1 3
[ ]2 1 4
y a x a−
− = −−
Equation of normal:
1
4y x a= −
[a1]
(iii) Equation of Curve: x = a sin2 t, y = a cos t
Equation of normal: 1
4y x a= −
Solving, 24 cos 4 sina t a t a= − [m1]
24cos 4cos 3 0t t+ − =
(2cos 3)(2cos 1) 0t t+ − = [m1]
1 3cos , cos
2 2t t= = − (rejected) [m1]
3t
π= (point P)
Hence, the normal at P does not meet the curve again since 02
tπ
≤ ≤ .
Comment [YUN6]: Quite a number of students did not evaluate the gradient & leave the answer as
1 32cos ( )
2 4y a t x a− = −
Comment [YUN7]: Most have no idea how to answer this part of the question. For those who are able to, quite a number of students did not know how to continue to solve the trigo equation.

5
[Turn Over
3
The diagram above shows the graph of ( )fy x= . On separate diagrams, sketch the graphs
of
(i) ( )f 1 2y x= − , [3]
(ii) ( )fy x= , [2]
(iii) ( )2f 1y x= + . [3]
showing in each case, the coordinates of the points corresponding to A, B, C and the
equations of the asymptotes.
C(3,0)
0 2
1
x
• A(4, 3)
B(1, – 1)
y

6
[Turn Over
Solution:
(i) (Method 1) ( ) ( ) ( ) ( )f f 1 f 1 f 2 1x x x x→ + → − + → − +
(Method 2) ( ) ( ) ( )( )1
f f 2 f 2 f 22
x x x x
→ → − → − −
[B1-coordinates of points; B1-asymptotes; B1-shape of graph]
(ii) ( )( ) ( )
( ) ( )
f for 0 keep original f for 0f
f for 0 reflect f for 0 in y-axis
x x y x xx
x x y x x
> → = >=
− < → = >
0
1/2 x
•
A’(-3/2, 3)
-1/2
1
y
B’(0, -1)
C’(-1/2,0)
•
•
Translation
by 1 unit in
negative x
direction
Reflect
-ion in
y axis
Scaling by
scale factor
½ parallel to
x-axis.
Scaling by
scale factor
½ parallel to
x-axis
Reflect
-ion in
y axis
Translation
by 1/2 unit
in positive x
direction
Comment [YUN8]: Generally, most candidates recognized that there should be a translation, a relection in y-axis and a scaling parallel to the x-axis. However, it is obvious that those with errors in the coordinates either translated with wrong magnitude or translated in the wrong direction, or used the wrong scale factor in scaling.
Comment [YUN9]: 1)Quite a number of students reflected the negative x portion of the original graph in y-axis, to overlap with the positive x portion, instead of reflecting the positive x portion in y-axis. 2)Many students sketched the graph
of ( )fy x= instead, i.e., they relected
the portion below the x-axis.

7
[Turn Over
[B1-asymptotes; B1-coordinates]
(iii) ( ) ( ) ( )f 2f 2f 1x x x→ → +
[B1-coordinates of points; B1-asymptotes; B1-shape of graph]
1 x
•
A’(4, 7)
2
3
y
B’(1, -1)
C’(3,1)
•
•
2
x
• A’’(-4,3)
-2
1
y
B’(1, -1)
C’’(-3,0)
B’’(-1, -1)
A’(4, 3)
C’(3,0)
•
•
• •
•
Scaling by
scale factor
2 parallel to
y-axis
Translation
by 1 unit in
positive y
direction
Comment [YUN10]: Many students showed a stationary point here, when it should have been sharp.
Comment [YUN11]: Majority of students could get this right, or at least the right shape. Those with errors in coordinates or asymptotes are again due to wrong sequence of transformation, or in the wrong direction.
8
[Turn Over
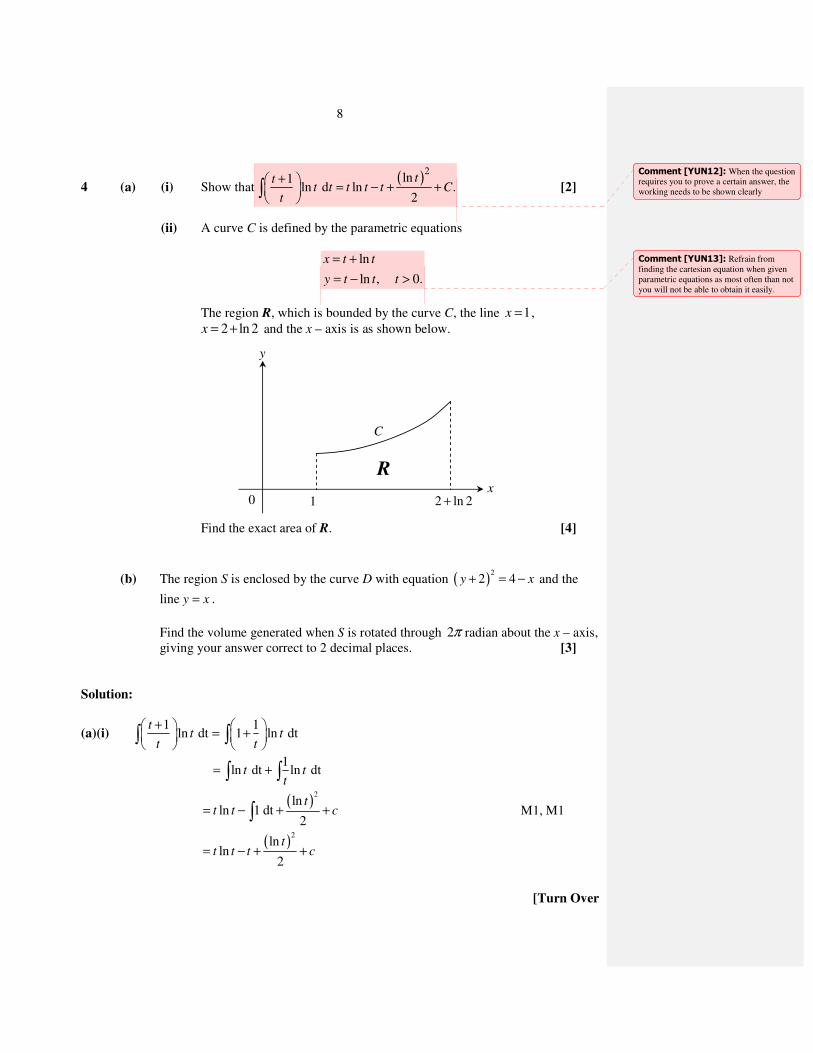
4 (a) (i) Show that( )
2ln1
ln d ln .2
ttt t t t t C
t
+ = − + +
∫ [2]
(ii) A curve C is defined by the parametric equations
ln
ln , 0.
x t t
y t t t
= +
= − >
The region R, which is bounded by the curve C, the line 1x = ,
2 ln 2x = + and the x – axis is as shown below. Find the exact area of R. [4]
(b) The region S is enclosed by the curve D with equation ( )2
2 4y x+ = − and the
line y x= .
Find the volume generated when S is rotated through 2π radian about the x – axis, giving your answer correct to 2 decimal places. [3]
Solution:
(a)(i) 1 1
ln dt 1 ln dtt
t tt t
+ = +
∫ ∫
1
ln dt ln dtt tt
= +∫ ∫
( )
2ln
ln 1 dt2
tt t c= − + +∫ M1, M1
( )
2ln
ln2
tt t t c= − + +
y
x 1 2 ln 2+
C
R
0
Comment [YUN12]: When the question requires you to prove a certain answer, the working needs to be shown clearly
Comment [YUN13]: Refrain from finding the cartesian equation when given parametric equations as most often than not you will not be able to obtain it easily.

9
[Turn Over
(a)(ii) Area R 2 ln 2
1 dy x
+
= ∫
( )2
1
1ln 1 dt t t
t
= − +
∫ M1
2
1
11 ln d
tt t t
t
+ = + −
∫
( )
22 22
1 1
lnln
2 2
ttt t t t
= + − − +
M1
( )
( )2
ln 212 2 1 2ln 2 2 1
2 2
= + − − − − + − −
( )
( )2
ln 213 2ln 2 2 1
2 2
= − − − + − −
( )
2ln 27
2ln 22 2
= − − units2 A1
Comment [YUN14]: The substitution
from 2 ln 2
1 dy x
+
∫ to
[ ]2
1
d( ) d
d
xy t t
t∫ must all be done
concurrently ensuring that not just the function gets substituted, the limits and the integral that you are integrating with respect to all need to be substituted as well

10
[Turn Over
(b)
V = ( ) ( ) ( )2 2 20 4
2
5 02 4 d 2 4 2 4 dx x x x x xπ π
−
− − − − + − − − − − + − ∫ ∫ M2
= 327.25 units3 A1
5 A disease is found to be present in a protected reserve containing 35 orangutans. The rate at which the number of infected orangutans, x, is increasing at any time t is proportional to the product of the number of infected orangutans and the number that have yet to be infected at that instant. Initially there were 5 animals infected.
Form a differential equation that describes this model and show that
35
35
35,
1
kt
kt
Aex
Ae=
+
where >0 is to be found. A [6] Deduce the total number of infected orangutans after a long period of time and represent the solution to this model on an appropriate graph. [4]
S
5− 4
y
x
Comment [YUN15]: Some identified the incorrect region
Comment [YUN16]: Formula for volume wrongly quoted as
2
1
22 dx
xy xπ ∫ ,
( )2
1
2
1 2 dx
xy y xπ −∫ or
2
1
2 dy
yy yπ ∫ (note that it is rotated
about x-axis) Some didn’t realize the need to identify the correct expression to use and instead just
wrote down as ( )2
2 4 x− ± − . It is
also important to note that
( )2
2 4 4 (4 )x x− − − ≠ − − and
( )2
22 4 4 (4 )x x x x − − − − ≠ − + −
Comment [ABK17]:
•Rate always refer to change with time. Thus since, x, is the no. of infected orangutans, we are interested in d
d
x
t
.
Comment [ABK18]:
•“is increasing at any time, t” – check that this refers to the rate, thus this means
d0
d
x
t>
at any time t. Question reading is
important here.
Comment [ABK19]:
•Here it means at t=0, x=5. It does not mean d
0d
x
t=
. This information where
d0
d
x
t=
is not to be found in the question at
all. Do not presume anything illogically. In fact if you sketch the graph at t=0, x=5,
the d0.
d
x
t≠

11
[Turn Over
Solution:
x is the number of infected orangutans at any time t. dx
dt∝ x 35 − x( )
⇒dx
dt= kx 35 − x( ), k > 0 [m1]
⇒1
x 35 − x( )∫ dx = k dt∫ [m1]
⇒1
35
1
x+
1
35 − x
∫ dx = k dt∫ [m1]
⇒ ln x − ln 35 − x( )= 35kt + c [m1]
⇒ lnx
35 − x
= 35kt + C
35 35
35
kt c ktxe Ae
x
+⇒ = =−
, 0A > [m1]
35
35
35
1
kt
kt
Aex
Ae⇒ =
+
When t=0, x=5, 1
6A⇒ = [a1]
35
635 1
6 ktx
e
= −
+ [m1]
As 35 35ktt e x→ ∞⇒ → ∞⇒ → [a1] [1 mark – for crucial points and 1 mark – shape]
x
t 0
35
5
Comment [ABK20]:
•In all DE question that involve application, it is crucial that you know what each variable actually mean. In this case ‘x’ refers to number of infected orangutans at any time t. This means x can only increase/no change but not decrease in this question.
Comment [ABK21]:
•Stating k>0 is important because we must ensure d
0d
x
t>
in line with the conditions of
the question that states “the rate is increasing at any time t”
Comment [ABK22]:
•By right, we should not remove the modulus i.e. we should have
ln ln 35x x− − but since we know that
0<x<35, we have this instead i.e. remove the modulus. However, in other questions, you need to check first before removing the modulus.
Comment [ABK23]: It is not obvious from this expression that as t tends to infinity, x tends to 35. You must do something to the expression (in a valid manner) to deduce more clearly the value of 35. Look below.
Comment [ABK24]:
•In order to determine x tends to 35, when t tends to infinity, you must write the expression into this form, else it is not so easy to deduce the value of 35.
•Also do not write butt t= ∞ → ∞ .
Comment [ABK25]:
•Your graph should indicate that for t tends to infinity, the curve should approach the line x=35.
•The starting point at t=0, x=35 is also crucial.

12
[Turn Over
Section B: Statistics [60 marks]
6 A survey on dining experience was undertaken in a small town with 10 three-star
restaurants, 60 two-star restaurants and 30 one-star restaurants.
The 100 restaurants in the small town are numbered from 1 to 100. A sample of 10 restaurants is selected by randomly choosing 10 numbers that are assigned to the restaurants. (i) Suggest one disadvantage of this sampling method. [1]
(ii) Suggest a better method of sampling and explain briefly how this could be done.
[3]
Solution:
(i) As there are only 10 three-star restaurants, there is a high chance that they might not get selected at all during random sampling. OR
The numbers of the respective types of restaurants selected might not be
representative of the restaurants in the town. [B1]
(ii) - Stratified sampling. Set up the 3 respective sub-groups. [B1]
- Use population proportions to determine the numbers required for each sub-group. Three-star(1), two-star(6), one-star(3). [B1]
- Randomly select the based on the respective numbers determined [B1]
Comment [YUN26]: Some students are not answering to the point. They mentioned that the numbers selected “will not be proportionate with the population numbers” or “most of the sample will be from the 2-star restaurants” without clearly explaining the implications.
Comment [YUN27]: Some students lifted off the sampling method from their notes without answering in context. i.e. they must at least give the numbers to be sampled.
Comment [YUN28]: Some students did not get full credit because they missed out the point where they need to mention that the numbers determined has to be sampled randomly.

13
[Turn Over
7 In a certain country, the probability that it rains on a given Tuesday is 1
5. For each of the
next 2 days, Wednesday and Thursday, the conditional probability that it rains, given that
it rained the previous day is α and the conditional probability that it rains, given that it
did not rain the previous day is β . The situation is illustrated in the uncompleted tree
diagram below.
(i) Complete the tree diagram to represent all the possible outcomes up to Thursday.
[2]
For 1
3α = and
2
3β = , find
(ii) the probability that it rains on a Thursday, [2]
(iii) the probability that it rains on at least two days given that it rains on a Thursday.
[3]
Solution
(i)
[m2 – 1 mark for each
correct branch]
Tuesday
1
5
R
Wednesday
R’
4
5
β
R’
R
1 β−
α
R’
R
1 α−
α
R’
R
1 α−
β
R’
R
1 β−
α
R’
R
1 α−
β
R’
R
1 β−
Thursday
R
R’
1
5
Tuesday
R
R’
R 1
5
R’
R
α
R’
R
β
R’
R
Wednesday
Comment [YUN29]: Not a well attempted qn. Many students were not able to draw the tree diagram properly. They
used the ,α β values in the next part to
complete it which is wrong. Many of the diagrams were not completed.

14
[Turn Over
(ii) P(rains on a Thursday)
1 1 1 1 2 2= [m1]
5 3 3 5 3 3
4 2 1 4 1 2[m1]
5 3 3 5 3 3
21 7
45 15
⋅ ⋅ + ⋅ ⋅
+ ⋅ ⋅ + ⋅ ⋅
= =
(iii) P(rains on at least 2 days given it rains on a Thursday)
P(A B)
=P(A\B)=P(B)
∩ [m1]
1 1 1 1 2 2 4 2 1 13
5 3 3 5 3 3 5 3 3 4521 21
45 45
⋅ ⋅ + ⋅ ⋅ + ⋅ ⋅= = [m1]
13
21= [a1]
8 Paul ordered 9 plates of sushi, namely 3 plates of unagi sushi, 2 plates of uni sushi and 4
plates of ebi sushi.
(i) Find the number of ways Paul can eat the 9 plates of sushi. [2]
(ii) Find the number of ways Paul can eat the 9 plates of sushi such that the first plate
and last plate are different types of sushi. [4]
(iii) Find the number of ways of arranging the nine plates of sushi on a round table
such that no two plates of ebi sushi are placed together. [2]
Solution:
(i) No. of ways = 9!
12602!3!4!
= [B1,B1]
(ii) Case 1: uni and unagi
Comment [YUN30]: Almost all students managed to get this part correct.
Comment [YUN31]: The students managed to get the numerator correct but forgot to divide by the denominator.
Comment [Des32]: A wide range of marks was obtained from 0 to 8 with most students obtaining 4 marks.
Comment [Des33]: This part was generally well done with an odd few giving the answer as 9! without realizing that there were identical items.

15
[Turn Over
No. of ways = ( )7!
2 2102!4!
= [M1]
Case 2: uni and ebi
No. of ways = ( )7!
2 2803!3!
= [M1]
Case 3: ebi and unagi
No. of ways = ( )7!
2 4202!2!3!
= [M1]
Total no. of ways = 910 [A1] (iii) - Unagi sushi - Uni sushi
Since there are only 2 ways of arranging the uni and unagi sushi plates on the round table,
No. of ways = ( )54 2 10C = [M1 + A1]
Comment [Des34]: Some students forgot to multiply by 2 when considering the three different cases.
Comment [Des35]: Many students failed to realize that one plate of unagi sushi is identical to another plate of unagi sushi, as with the other types of sushi. Hence, many students considered choosing from the same type of sushi, which makes no logical sense i.e.
2 31 1
7!2C C
2!4! (for uni and unagi as
the first and last plates).
Comment [Des36]: This part was poorly attempted.
Comment [Des37]:
•Many students tried to use the complement method where they found the total number
of ways as just ( )9 1 !− .
•When using the complement method, most students failed to obtain all cases which were to be subtracted from the total number of ways. Most simply considered one case where 2 plates of ebi sushi are together and even so, most failed to find the correct number of ways for this case.
•For the few students who were able to consider all the cases (2 plates of ebi together, 3 plates of ebi together and 4 plates of ebi together ) when using the complement method, they had overlapping cases, i.e. 2 plates of ebi sushi taken as one unit and arranged 7 units in a round table.
•Many other students who did not consider the complement method simply left their answer as one of the following, without realizing that there were identical items.
o ( )54C 5 1 !−
o ( )54P 5 1 !−
o
545! P
o5!4!

16
[Turn Over
9 Miss Curious wants to determine if there is any correlation between the amount of
preparation and the results obtained in a recently concluded exam.
She asked her friends how much time they spent preparing for the exam (x), with their
exam scores (y), and recorded her findings in the table below.
(i) Give a sketch of the scatter diagram for the data and find the equation of the least squares regression line of y on x. [2]
(ii) State, with a reason, which of the following would be an appropriate model
to represent the above data (where a and b are constants and b > 0).
b
y ax
= +A : xy a be−= +B : lny a b x= +C: [2]
(iii) For the appropriate model chosen, find the values of a and b. [1]
Explain how this model is a better one than the equation found in part (i). [1]
(iv) Obtain a good estimate of the score of a student who spent 8 hours studying for the exam and comment on the reliability of your answer. [2]
Solutions:
(i)
[B1] Least squares regression line: y = 0.785x + 24.4 [A1]
x (hour) 10 15 22 27 38 46 53 64
y (score) 11 40 51 56 61 62 64 66
Comment [YUN38]: - Some scripts have no divisions and labeling on the axis. - Some scripts make their point marks gigantic squares(marks deducted if too big) when a dot or a cross will do. - Some scripts link up the markings which is not correct for scatter plot
Comment [YUN39]: Some students did not leave the answers in 3 significant figures

17
[Turn Over
(ii) Model C. [B1] Possible reasons:
- Shape of the points follow the shape of an logarithmic graph - y increases as x increases (other 2 choices have p decreasing as x increases)
[A1] (iii) a = - 37.4, b = 26.3 [A1]
The value of r increases after transformation which indicates there is a better linear correlation between ln x and y instead of just x and y [A1]
(iii) lny a b x= + 8, 17.31when x y∴ = = [A1]
Extrapolation done in calculating y when x = 8. It might not be reliable as there may not be a linear relationship between ln x and y outside the range of data
[A1]
Comment [YUN40]: Should use the transformed equation for a good estimate.
Comment [YUN41]: Mark will only be awarded when students indicate that the linear relationship might not hold outside the data range.

18
[Turn Over
10 You are an Intelligence Quotient (IQ) expert. While reading the newspaper, you become
interested in a newspaper advertisement that reads as follows:
Increase the IQ of your children by 10 points in just 16 weeks! �
Subscribe now to Dr. Dune’s Drill (DDD) program
and astound your children’s friends, teachers and grandparents!
Assure a university education for your children
(and security for you in your old age). �
A scientific study of 15 children from all over Singapore
showed an average IQ score of 108*
after only six weeks of the fantastic DDD program .
*standard deviation is 15
As a concerned IQ expert, you would like to investigate the validity of this
advertisement. You know that for the general population of children, the mean IQ is 100.
Through close contacts in the industry, you confirmed that the scientific study as stated in
the advertisement is valid.
(i) Test at 5% significance level, whether the mean IQ points of children who
participated in the DDD program has increased. State any assumptions that you
have to make in carrying out the test. [6]
(ii) What do you understand by 5% significance level in this context? [1]
Suppose that the population standard deviation σ is now known and a larger sample size
of 50 children is taken.
(iii) Find the range of values of the sample mean in terms of σ if the conclusion at
5% significance level is now different from that concluded in part (i). [4]
Solution:
(i) Assuming that the IQ points of children is normally distributed. [m1]
Ho: µ = 100
H1: µ > 100 (test that the average IQ points of students who have participated in the
DDD program has increased) [m1]
Comment [ABK42]: This is just the title of the advertisement.
Comment [ABK43]: A sample size of 15 children, i.e n = 15 which is small in this case. If you look through, there is NO MENTION of population variance which implies that population variance in unknown. This should TRIGGER you to think of applying t-test in this question.
Comment [ABK44]:
This is the sample mean, i.e. 108x =
Comment [ABK45]: This is the sample standard deviation and when squared will give you sample
variance.
Comment [ABK46]: This refers to the population mean, 100µ =
which you will use in the hypothesis testing under Ho.
Comment [ABK47]:
•Now according to the context of the question you want to see whether the advertisement is valid. So you want to test whether the IQ score of children has increased, thus RIGH-TAILED test.
•You define X as the IQ score/points of a
randomly chosen child in Singapore (population) and NOT the mean IQ score. At this point of time, nothing has been said about the population X, whether it is normally distributed.
Comment [ABK48]: The IMPORTANT assumption is that X is normally distributed so that you can apply the t-test for small value of n=15. Some of you assume n is small, it is small, you don’t have to assume.
Comment [ABK49]:
•Now σ is known and n=50 is large, you
use the z-test instead. So repeat the whole testing again but this time, the conclusion is given, so you just need to work backwards.
Comment [ABK50]:
Again sample mean refers to x and you
must find the range of values for it and not
σ . Note that σ is known but value is not,
you must know the difference in when you read your question.

19
[Turn Over
1-tailed test at 5% significance level.
Under Ho , X − µS
n
~ t(n − 1) . [m1]
Where s2 =n
n − 1samplevariance( )=
15
1415( )2 =
3375
14= 241.07143 [b1]
By using GC, 1.996testt = and p-value = 0.0329. [m1]
Since p-value=0.0230<0.05, we reject Ho and conclude that here, we have sufficient
evidence at 5% significance level that the IQ points of children in the DDD program has
increased. [a1]
(ii) 5% significance level means there is a probability of 0.05 that we conclude that the mean
IQ points have increased when in fact it did not (reject Ho when Ho is true). [a1]
(iii) Population standard deviation σ is now known and a larger sample size of 50 children is taken.
Under Ho , 2
~ 100,50
X Nσ
by Central Limit Theorem (since n=50 is large) [m1]
At 5% significance level, Ho is not rejected when test 1.64485z < . [m1]
Thus 100
1.64485
50
x
σ
−< 2100 0.233x σ⇒ < + [m1, a1]
Comment [ABK51]: Actually by right it should be
~ ( 1)X
t n
n
µ
σ
−−
but because σ is unknown
we use s instead. Now s2 is the unbiased estimate of the population variance which is used in the absence of σ .
Comment [ABK52]: Under Ho, please don’t write any other things. Just write out this. Some of you write
~ (0,1)X
NS
n
µ− , why? We are
interested in t-test as all the conditions are satisfied for us to use t-test. So don’t put
~ (0,1)X
NS
n
µ− .
Comment [ABK53]: Now because of p-value=0.0230<0.05, we reject Ho and then we conclude that here, we have sufficient evidence at 5% significance level that the IQ points of children in the DDD program has increased. Some of you say we reject Ho because you have sufficient evidence….. This is WRONG you reject Ho because of the criteria p-value<0.05 or the ttest>tcritical.
Comment [ABK54]: Many of you did not say the probability of concluding but instead say probability that the mean IQ points have increased. These are two completely different things. For those having difficulty in this please use this:
P(rejecting Ho when Ho is true)α =
and then apply the CONTEXT of the question by looking at how you write your Ho and H1. So, if you write your null and alternative hypothesis wrongly, you will explain this wrongly too.
Comment [ABK55]: It is IMPORTANT that you invoke this
theorem here because your X will not be normally distributed unless you use this theorem. Also, please SPELL OUT and not use “CLT”.
Comment [ABK56]: This question demonstrates the importance of you knowing how to do the test using the formula method (test statistic method) other than the p-value method. Sketching the normal curve to show the critical region for rejection is also important for your better understanding.
20
[Turn Over
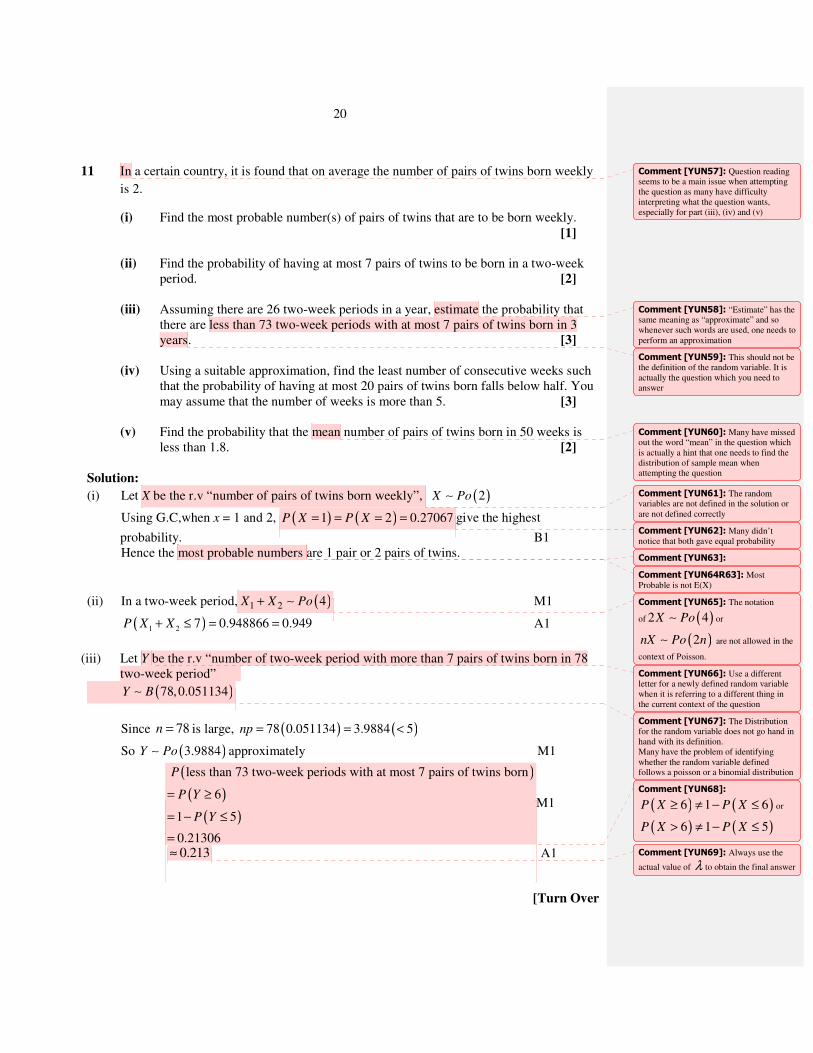
11 In a certain country, it is found that on average the number of pairs of twins born weekly
is 2.
(i) Find the most probable number(s) of pairs of twins that are to be born weekly. [1]
(ii) Find the probability of having at most 7 pairs of twins to be born in a two-week period. [2]
(iii) Assuming there are 26 two-week periods in a year, estimate the probability that there are less than 73 two-week periods with at most 7 pairs of twins born in 3 years. [3]
(iv) Using a suitable approximation, find the least number of consecutive weeks such
that the probability of having at most 20 pairs of twins born falls below half. You may assume that the number of weeks is more than 5. [3]
(v) Find the probability that the mean number of pairs of twins born in 50 weeks is less than 1.8. [2]
Solution:
(i) Let X be the r.v “number of pairs of twins born weekly”, ( )2X Po∼
Using G.C,when x = 1 and 2, ( ) ( )1 2 0.27067P X P X= = = = give the highest
probability. B1 Hence the most probable numbers are 1 pair or 2 pairs of twins.
(ii) In a two-week period, ( )1 2 4X X Po+ ∼ M1
( )1 2 7 0.948866 0.949P X X+ ≤ = = A1
(iii) Let Y be the r.v “number of two-week period with more than 7 pairs of twins born in 78
two-week period”
( )78,0.051134Y B∼
Since 78n = is large, ( ) ( )78 0.051134 3.9884 5np = = <
So ( )3.9884Y Po∼ approximately M1
( )
( )
( )
less than 73 two-week periods with at most 7 pairs of twins born
6
1 5
0.21306
P
P Y
P Y
= ≥
= − ≤
=
M1
0.213≈ A1
Comment [YUN57]: Question reading seems to be a main issue when attempting the question as many have difficulty interpreting what the question wants, especially for part (iii), (iv) and (v)
Comment [YUN58]: “Estimate” has the same meaning as “approximate” and so whenever such words are used, one needs to perform an approximation
Comment [YUN59]: This should not be the definition of the random variable. It is actually the question which you need to answer
Comment [YUN60]: Many have missed out the word “mean” in the question which is actually a hint that one needs to find the distribution of sample mean when attempting the question
Comment [YUN61]: The random variables are not defined in the solution or are not defined correctly
Comment [YUN62]: Many didn’t notice that both gave equal probability
Comment [YUN63]:
Comment [YUN64R63]: Most Probable is not E(X)
Comment [YUN65]: The notation
of ( )2 4X Po∼ or
( )2nX Po n∼ are not allowed in the
context of Poisson.
Comment [YUN66]: Use a different letter for a newly defined random variable when it is referring to a different thing in the current context of the question
Comment [YUN67]: The Distribution for the random variable does not go hand in hand with its definition. Many have the problem of identifying whether the random variable defined follows a poisson or a binomial distribution
Comment [YUN68]:
( ) ( )6 1 6P X P X≥ ≠ − ≤ or
( ) ( )6 1 5P X P X> ≠ − ≤
Comment [YUN69]: Always use the
actual value of λ to obtain the final answer

21
[Turn Over
(iii) Let n be the number of consecutive weeks
( )1 2 ... 2n
X X X Po n+ + + ∼
Since 2n > 10 ( )5n >∵ , so ( )1 2 ... 2 , 2nX X X N n n+ + + ∼ approximately M1
( ) ( )1 2 1 2.... 20 0.5 ... 20.5 0.5
n nC CP X X X P X X X+ + + ≤ < → + + + < < M1
Using G.C,when n =10, ( )1 10... 20.5 0.54451P X X+ + < =
when n =11, ( )1 11... 20.5 0.37456P X X+ + < =
Thus least n is 11 A1
(iv)
50
1 2~ 2,
50 50
i
i
X
X N= =
∑ approximately, by CLT since n is large. [M1]
Thus ( )1.8 0.15865 0.159(3 s.f)P X < = = [A1]
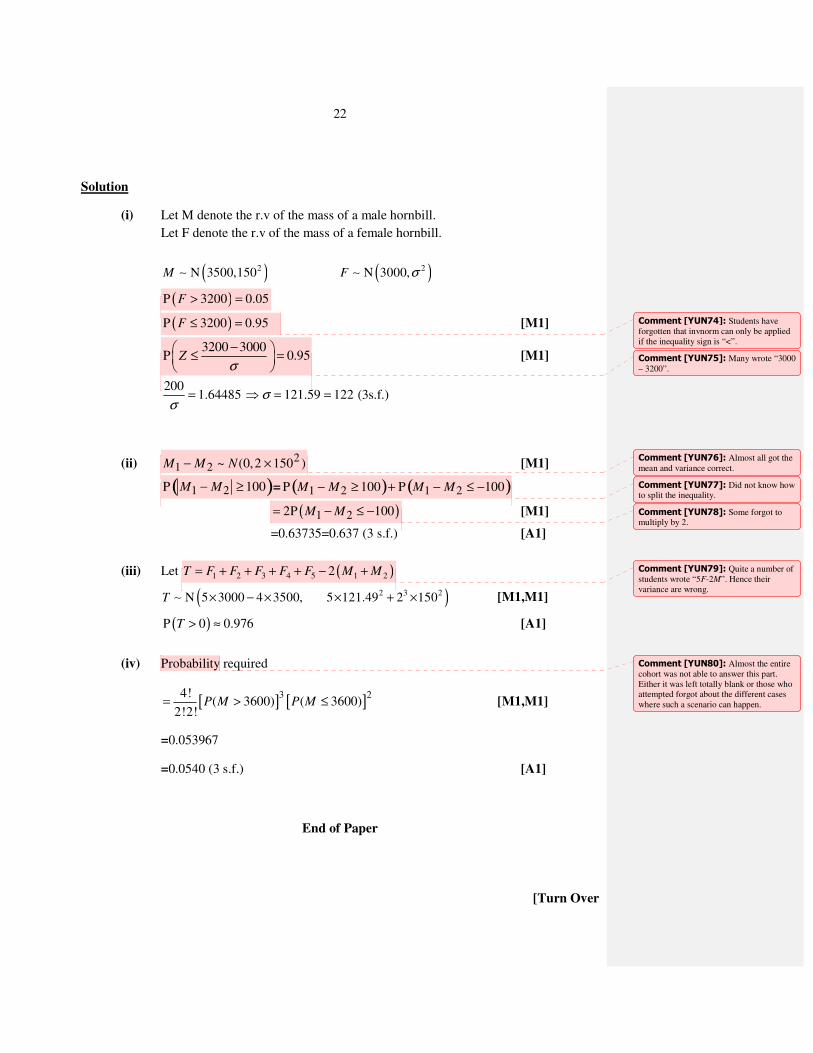
12 An ornithologist, who studies the behavior of birds, captures one male and one female
hornbill from a forest in Osaka, Japan. The masses of hornbills in that forest are assumed
to follow normal distributions with male hornbills having mean 3500g and standard
deviation 150g while female hornbills having mean 3000g and standard deviation σ .
(i) It is found from research that 5% of the female hornbills from the forest have
masses exceeding 3.2kg. Show that 122σ = . [2]
(ii) Find the probability that the difference in mass between two randomly chosen
male hornbills is at least 0.1kg. [3]
(iii) Find the probability that the mass of 5 randomly chosen female hornbills exceeds
twice the mass of 2 randomly chosen male hornbills. [3]
(iv) Five male hornbills are randomly chosen. Find the probability that the fifth male
hornbill is the third hornbill with mass exceeding 3.6kg. [3]
Comment [YUN70]: The initial distribution for the random variable needs to be stated before one conducts the check for the approximation
Comment [YUN71]: Some forgot to perform continuity correct when you have the approximation for a poisson distribution using a normal distribution
Comment [YUN72]: When one starts from this distribution
( )100X Po∼ to
100100,
50X N
∼ by CLT for
n = 50, it means one is identifying the mean of 50 such 100 weeks period which is not answering the question Another commonly seen incorrect
distribution is ( )2,2X N∼
Comment [YUN73]: Fair performance. Only a handful managed to get full marks. Many students got parts (i), (iii) correct only.
22
[Turn Over
Solution
(i) Let M denote the r.v of the mass of a male hornbill.
Let F denote the r.v of the mass of a female hornbill.
( ) ( )2 2N 3500,150 N 3000,M F σ∼ ∼
( )P 3200 0.05F > =
( )P 3200 0.95F ≤ = [M1]
3200 3000P 0.95Z
σ
− ≤ =
[M1]
200
σ= 1.64485 ⇒ σ = 121.59 = 122 (3s.f.)
(ii) M1 − M2 ~ N (0,2 × 1502 ) [M1]
P M1 − M2 ≥ 100( )= P M1 − M2 ≥ 100( )+ P M1 − M2 ≤ −100( )
( )1 22P 100M M= − ≤ − [M1]
=0.63735=0.637 (3 s.f.) [A1]
(iii) Let ( )1 2 3 4 5 1 22T F F F F F M M= + + + + − +
( )2 3 2N 5 3000 4 3500, 5 121.49 2 150T × − × × + ×∼ [M1,M1]
( )P 0 0.976T > ≈ [A1]
(iv) Probability required
[ ] [ ]3 24!( 3600) ( 3600)
2!2!P M P M= > ≤ [M1,M1]
=0.053967
=0.0540 (3 s.f.) [A1]
End of Paper
Comment [YUN74]: Students have forgotten that invnorm can only be applied if the inequality sign is “<”.
Comment [YUN75]: Many wrote “3000 – 3200”.
Comment [YUN76]: Almost all got the mean and variance correct.
Comment [YUN77]: Did not know how to split the inequality.
Comment [YUN78]: Some forgot to multiply by 2.
Comment [YUN79]: Quite a number of students wrote “5F-2M”. Hence their variance are wrong.
Comment [YUN80]: Almost the entire cohort was not able to answer this part. Either it was left totally blank or those who attempted forgot about the different cases where such a scenario can happen.

23
[Turn Over
BLANK PAGE