Embed Size (px)
Citation preview

1
The Why’s and How’s of Pension Reform
by
Estelle James
World Bank Institute
2
Populations are Aging • By 2030 the proportion of the world’s
population that is > 60 will nearly double, from 9% to 16%
• China’s old population will jump from 9% to 22%
• More than 25% of the world’s old people will live in China
• How to care for the old as family system breaks down (small size, urban migration)
3
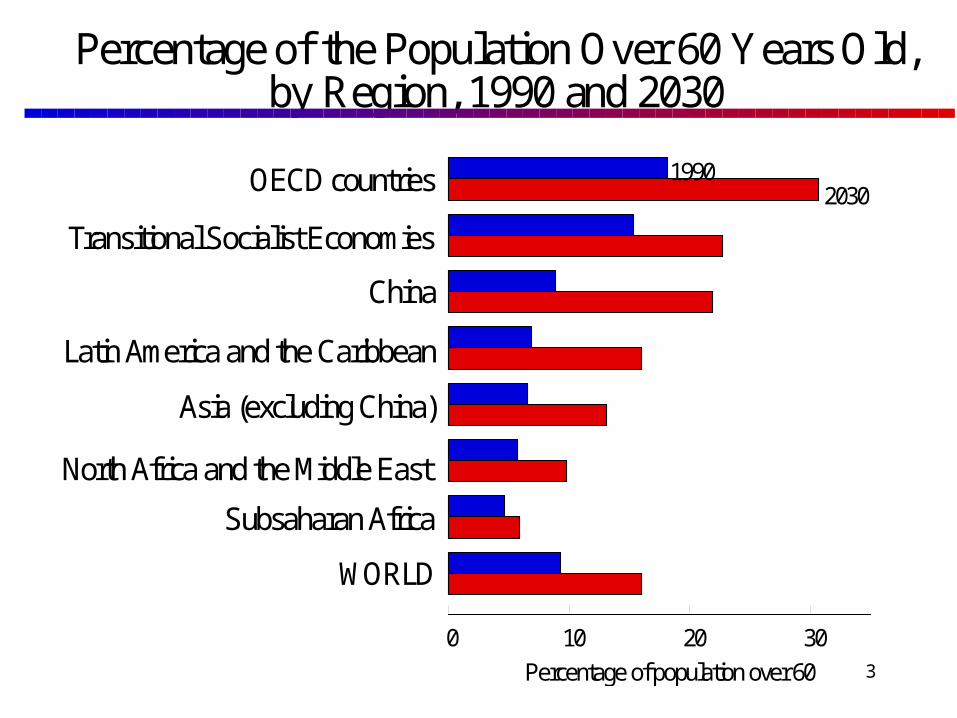
Percentage of the Population Over 60 Years Old, by Region, 1990 and 2030
OECD countries
Transitional Socialist Economies
China
Latin America and the Caribbean
Asia (excluding China)
North Africa and the Middle East
Subsaharan Africa
WORLD
0 10 20 30Percentage of population over 60
19902030

4
When Populations Age, Public Pension Spending Increases
• Many industrialized countries now spend more than 10% of the GDP on pensions
• China spends only 2% but will spend over 10% in 30 years if it follows the same policies
• This will interfere with ability to spend on health, education, other public goods

5
Relationship Between Percentage of the Population over 60 Years Old and Public Pension Spending
5 10 15 200
4
8
12
16
Pension spending as percentage of GDP
Jamaica
Israel AustraliaJapan
AustriaItaly
Sweden
U.K.
France
Luxembourg Greece
China
Uruguay
Panama
Costa Rica
U.S.
Percentage of population over 60 years old
Poland

6
Public health spending also increases as populations age
• I will talk mainly about pensions, but health spending and health systems for aging populations is something you should think about too

7
Public Health and Pension Spending versus Population Aging
Spending as a percentage of GDP
Percentage of population over 60 years old
0 5 10 15 20 250
5
10
15
20
Spending on health and pension
Spending on health
U.K.
Poland
Sweden
Austria
Czechoslovakia
Iceland
Australia
Cyprus
Switzerland
Japan
Brazil Trinidad & Tobago
ChinaJamaica
IndonesiaS. Korea
SwazilandZambia
Canada
New Zealand

8
With such large sums involved, social security affects the entire economy
• It influences:• Peoples’ incentive to work• Employers’ willingness to hire labor• Labor allocation between formal and informal
sectors• Level of national saving and its allocation• Financial market development• Therefore, the quantity and productivity of
labor and capital and size of GNP

9
I will talk about:
• Why countries have been reforming
• Commonalities and differences in reforms
• How China’s reforms compare with others
• The difficulties China faces in financing its transition to a partially funded system, and what steps might facilitate success

10
In most industrial countries, traditional systems were PAYG DB
• No funds were accumulated
• Benefits paid according to formula that depended on wages and years of work, but not closely linked to contributions
• China also used this system
• New systems try to add fully funded defined contribution component--mixed systems

11
Problems with PAYG DB Systems
• Not sustainable--contribution rate will have to rise or benefits fall drastically in future
• Inequitable--doesn’t redistribute to low-earners. Big gainers are first generations
• Not good for the economy– leads to high payroll tax as populations age– may discourage employment – doesn’t mobilize long term saving – doesn’t help develop financial markets– DB often rewards early retirement and evasion
• Political risk: Promises may not be kept in future because of high costs

12
Is this relevant to China?• Contribution rates already too high, especially in
declining regions--makes them decline faster
• Unemployment, so high payroll taxes not good; early retirement is not a good remedy--raises tax, discourages employment
• Growing evasion and informal sector
• Many municipalities find it hard to pay
• Private saving high but MPK also high
• China needs financial market development
13
Therefore, many countries have decided to reform
• By making their systems partially funded and DC, while maintaining a smaller targeted PAYG DB social safety net
• Examples--OECD countries (Australia, UK, Denmark, Switzerland); transitional economies (Hungary, Poland, Kazakhstan), Latin America (Chile, Mexico, Argentina, Bolivia, Uruguay, etc.)
• China also wants to reform but is finding it difficult to finance the transition

14
Reformed multi-pillar systems
• Pillar I: social safety net, publicly managed, tax financed
• Pillar II: individual accounts, fully funded DC, privately managed
• Pillar III: voluntary saving
• China has also decided to reform along these lines
15
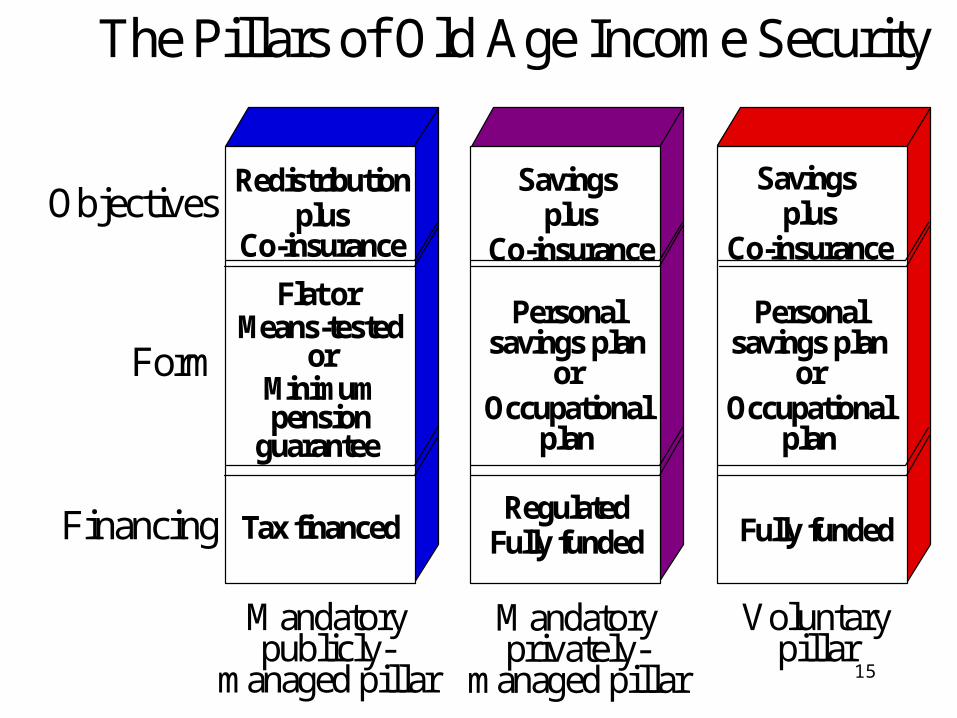
The Pillars of Old Age Income Security
Mandatory publicly-
managed pillar
Voluntary pillar
Objectives
Form
Financing
Redistributionplus
Co-insurance
Savings plus
Co-insurance
Savings plus
Co-insurance
Flat or Means-tested
orMinimum pension
guarantee
Personal savings plan
orOccupational
plan
Personal savings plan
orOccupational
plan
Tax financedRegulated
Fully funded Fully funded
Mandatory privately-
managed pillar

16
0
10
20
30
40
50
60
70
80
1982 1983 1984 1985 1986 1987 1988 1989 1990 1991 1992 1993 1994 1995 1996 1997 1998 1999 2000
In m
illio
ns
Chile
SwitzerlandNetherlands
United Kingdom
ArgentinaAustraliaColombiaDenmark
Peru
Uruguay
HungaryKazakhstan
Bolivia Mexico
El SalvadorPoland
Hong Kong
Number of Contributors to a Mandatory Private Plan, 1982-2000
17
Individual AccountsWhy DC?
• Links benefits to contributions
• Discourages & immunizes system to evasion and early retirement
• Avoids hidden redistributions
• Individual accounts in China will be DC

18
Why funded?• Avoids:
– Benefit promises that are too high– Tax increases as populations age– Intergenerational transfers
• Builds savings committed for long term
• China wants this but so far funds haven’t accumulated--are paid out to pensioners

19
Why competitively managed? • To get best return on savings, highest productivity of
capital• To diversify investments (public, private, internat’l)• To develop financial markets
• Empirical evidence shows private competitive management earns higher return than public management--portfolios are diversified, economic rather than political criteria determine investments
• New plans in Latin America, Hong Kong use private competitive management. Singapore uses central management--returns are low
• Controversial in China

20
Difference between annual compounded real publicly-managed pension fund returns and bank deposit rates in 20 countries (from worst to best)
-1.8%
-12% -10% -8% -6% -4% -2% 0% 2% 4%
Japan
Kore a
Philippine s
Sw e de n
US
M ala ys ia
India
Morocco
Singapore
Canada
Jam aica
Cos ta Rica
Ke nya
Guate m a la
Sri Lank a
Ecuador
Egypt
V e ne zue la
Zam bia
Uganda
Ave rage
gros s re turns m inus bank de pos it r ate

21
Difference between real annual compounded publicly-managed pension fund returns and real income per capita growth in selected countries
Source: IMF International Finance Statistics; Authors’ calculations.
-8.4%
-50% -40% -30% -20% -10% 0% 10%
Philippines
Morocco
US
Sweden
Malaysia
Canada
India
Japan
Korea
Jamaica
Sri Lanka
Singapore
Kenya
Guatemala
Costa Rica
Ecuador
Tanzania
Egypt
Venezuela
Zambia
Uganda
Peru
Average
gross returns minus income per capita

22
-10% -8% -6% -4% -2% 0% 2% 4% 6% 8% 10%
United Kingdom (84-96)
Sweden (84-93)
United States (84-96)
Belgium (84-96)
Chile (81-96)
Ireland (84-96)
Netherlands (84-96)
Spain (84-93)
United Kingdom (70-90)
Australia (87-94)
Denmark (84-96)
Switzerland (84-96)
Japan (84-93)
Netherlands (70-90)
Hong Kong (83-96)
Denmark (70-88)
Canada (75-89)
United States (70-90)
Japan (70-87)
Switzerland (70-90)
Average public schemes
Average private schemes
Gross returns minus income per capita growth
23
Alternative models for competitive management
• Latin American model (Chile, Mexico, Hungary)– Individual workers choose investment manager
– Portfolio restrictions and guarantees
– High administrative, marketing costs
• OECD Model (Australia, Switzerland, Hong Kong)– Employer and/or union representatives choose investment
manager for group
– Fewer restrictions and guarantees
– Lower costs--economies of scale & expertise
– But principle-agent problems--may not serve best interest of workers

24
3. Using the institutional market to give workers choice while keeping
costs low:• Bolivia--
– Limited entry: right to operate auctioned off to two companies using international competitive bidding process--much lower fees
• Sweden--– Open entry for fund management but public agency
negotiates fees centrally
– Centralized collections and records
• Competitive bidding may cut costs but must avoid collusion, corruption.Useful in China?

25
Results of multi-pillar systems• Too new in most countries to assess impact
• Some OECD countries have had quasi-mandatory funded pillar for 10-20 years--has deepened capital market, longer term investments, better corporate governance
• Chile has had new system for 20 years--average real rate of return 10%, financial markets developed, total factor productivity increased 1% per year due to pension reform

26
How have countries financed the transition--and how can China?
• Key issue:If country can’t finance transition to partially funded scheme, will remain PAYG with long term debt, even if has individual accounts--they will be notional
• Transition financing gap arises because, to fund individual accounts, part of contribution is diverted, so other money must be found to pay old pension debt

27
Methods to pay pension debt1.Downsize old system--raise retirement age,
reduce benefits (gradual, difficult, necessary). This only has small impact on IPD
2.Keep part of new system PAYG-- modest PAYG first pillar in new system; old workers stay in old PAYG system; so part of contribution flows into PAYG system
3.Use general government revenues or other assets to cover pension liabilities--budget or social security surplus, privatization assets

28
Methods to Pay Old Debt (2)
4.Raise taxes--payroll tax often too at beginning
5.Borrow: convert implicit into explicit debt and pay off gradually. Debt can eventually be paid off via PAYG surplus or tax
Advantage--spreads burden over generations so helps avoid political opposition, equitable
Disadvantage--doesn’t enhance national saving until debt is paid off.

29
What is happening in China?
• Attempt to shift from PAYG to multi-pillar system, but difficulty in financing transition

30
1997 State Council Document 26 and 2000 Document 42:
Multi-Pillar system in China• Pillar I: Basic benefit = 20% average wage
• Pillar II: Individual account with 8% contribution from workers. Funds invested in state bonds. Annual annuity = accumulation/10
• 20% payroll contribution from enterprise goes into pooled fund to finance basic benefit + transition--not enough in short run so transition obligations also covered by municipalities, provinces, central govt.

31
Problems with this plan• No firm plan to cover transition costs so full 28-
29% contribution (or more) is often used• Thus most individual accounts are not funded--
they remain largely notional, don’t avoid PAYG problems, costs will rise
• No diversification, investments won’t earn highest rate of return or MPK
• Conversion to annuities not actuarially fair--– accumulation won’t cover promised outlays– formula won’t discourage early retirement
• No work incentives in basic benefit• Problems augmented by fragmented system

32
Possible sources for financing transition in China
• SOE assets or other proceeds• Borrow in short run, repay from surplus in long
run (basic benefit will only require contribution rate of 10-12%, so surplus in long run if funded individual accounts generate high revenues from investments)
• Fragmentation complicates transition--who owns the assets and who is responsible for paying the pension debt?

33
Special Problem in China--Fragmentation
• Remnant of cultural revolution: was SOE responsibility, not pooled at municipal level--great differences in dependency rates
• Pension debt in China is low (<70% GDP) for country as a whole but IPD is unevenly distributed; > 100% in some municipalities.
• High payroll tax accelerates decline in depressed areas. They can’t fund accounts while paying benefits
34
Fragmentation (Cont’d)
• Problem when CR varies across localities; but provincial or national pooling is needed to have same CR when support rate varies
• Should rich areas be pooled with poor areas, to pay pension debt? Difficult--winners and losers.
• What is responsibility of national, provincial and municipal governments? Ambiguous.

35
Strong funded pillar helps reduce financing gap
• Diversification into private sector would raise returns and productivity--high MPK in China
• International diversification would reduce risk
• If individual accounts earn high rate of return, they will yield high replacement rate so PAYG can give less compensation to middlemen for past service, smaller transition gap
• Also, could make smaller contribution to individual account, more money for transition– if CR = 8% and r = 2%, RR only 15%, – but if r = 5%, RR 40%

36
Conclusion--key questions for China
• Who owns the assets and who is responsible for the debt?
• How can high investment return be earned to achieve high replacement rate?
• What reshaping is needed to encourage continued work, later retirement?
• China is now struggling to implement a multi-pillar system with partial funding, as other countries are doing. Never easy but always possible.