Embed Size (px)
Citation preview
1
The effects of education on phonemic verbal fluency performance: An original empirical
study and meta-analysis
Angela Baufeldt
ACSENT Laboratory Department of Psychology University of Cape Town
Supervisor: Kevin Thomas Co-Supervisor: Helen Ferrett Word Count: 9,274
2
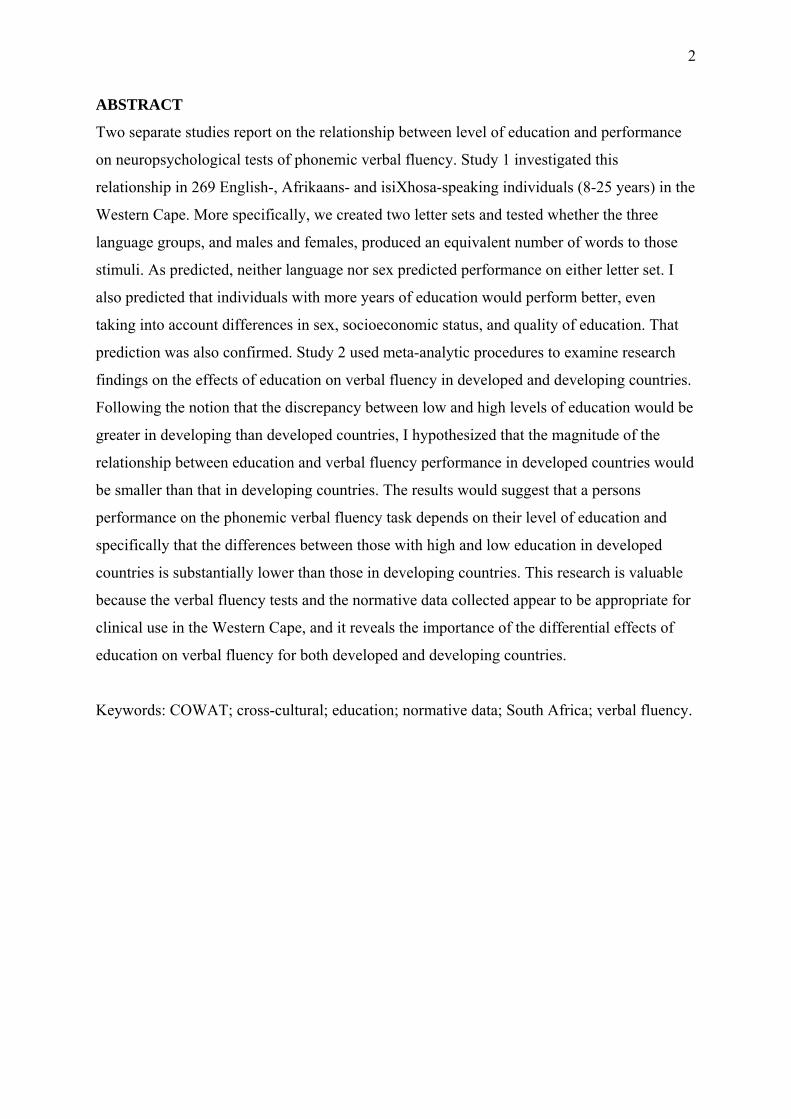
ABSTRACT
Two separate studies report on the relationship between level of education and performance
on neuropsychological tests of phonemic verbal fluency. Study 1 investigated this
relationship in 269 English-, Afrikaans- and isiXhosa-speaking individuals (8-25 years) in the
Western Cape. More specifically, we created two letter sets and tested whether the three
language groups, and males and females, produced an equivalent number of words to those
stimuli. As predicted, neither language nor sex predicted performance on either letter set. I
also predicted that individuals with more years of education would perform better, even
taking into account differences in sex, socioeconomic status, and quality of education. That
prediction was also confirmed. Study 2 used meta-analytic procedures to examine research
findings on the effects of education on verbal fluency in developed and developing countries.
Following the notion that the discrepancy between low and high levels of education would be
greater in developing than developed countries, I hypothesized that the magnitude of the
relationship between education and verbal fluency performance in developed countries would
be smaller than that in developing countries. The results would suggest that a persons
performance on the phonemic verbal fluency task depends on their level of education and
specifically that the differences between those with high and low education in developed
countries is substantially lower than those in developing countries. This research is valuable
because the verbal fluency tests and the normative data collected appear to be appropriate for
clinical use in the Western Cape, and it reveals the importance of the differential effects of
education on verbal fluency for both developed and developing countries.
Keywords: COWAT; cross-cultural; education; normative data; South Africa; verbal fluency.
3
General Introduction
Tests of verbal fluency1 are some of the simplest and most useful tests in a
neuropsychological battery. In these tests, the patient or examinee is asked to produce as
many words as possible, within given restrictions and rules, in a particular time. Tests of
verbal fluency are particularly useful for neuropsychologists because they activate specific
areas of the brain and because deficits in performance are associated with particular
psychopathologies and neurological conditions. Phonemic verbal fluency tests are especially
used to assess executive functioning in patients (Alvarez & Emory, 2006). Despite this
clinical popularity and a long history of research into verbal fluency tests, there is still some
debate as to the significance of moderator variables such as age, gender and education on
phonemic verbal fluency performance. Additionally, there is little work on cross-cultural
comparisons of phonemic verbal fluency performance.
History of Verbal Fluency Tests
Tests of verbal fluency date from the early 1960s, when Thurstone’s Word Fluency
test was published (Mitrushina, Boone, Razani, & D’Elia, 2005). Thurstone’s test required
patients to write down words beginning with a given letter, or words from a given category,
in a set amount of time (usually 4 or 5 minutes). The fact that the test required written
responses introduced numerous confounding variables (e.g., the literacy rate of the person,
how fast the person could write, etc.). To control for them, the test was modified so that the
patient’s response was verbal; this was the Controlled Verbal Fluency Test (CVFT; Benton,
1967). The initial format of the CVFT involved asking the patient to name as many words as
possible for each of the letters F, A, or S separately within a 1-minute time limit (Bechtold,
Benton, & Fogel, 1962). The patient’s total verbal fluency score was thus the sum of the
number of words produced across the three letter cues. Remarkably, the letters F, A, and S
were chosen with no empirical evidence supporting their status as particularly appropriate in
terms of word frequency or word complexity in the English language.
The Controlled Oral Word Association test (COWAT) is a revision of the CVFT that
uses letter sets supported by empirical analysis. Although the COWAT retains the format of
1There are two basic measures of verbal fluency; phonemic and semantic. Phonemic verbal fluency is a test where words are generated for a letter in a set time limit while semantic verbal fluency is a test where words are generated from a particular category within a set time limit. This research focuses on the phonemic verbal fluency measure.
4
the CVFT in that participants are instructed to name as many words as they can that begin
with a certain letter within 60 seconds, the newer test uses the letter sets CFL and PRW.
Borkowski, Benton and Spreen (1967) demonstrated that these sets are equivalent, in the
English language, in terms of word difficulty and complexity. More recent research has
reviewed the equivalency of the COWAT letter sets, and has confirmed that they continue to
be suitable alternatives to each other where the language of test administration is English
(Ross, Furr, Carter, & Weinberg, 2006).
The Use of Verbal Fluency Tests in Research and Clinical Practice
Despite the empirical evidence in favour of CFL and PRW presented above, there is
no consensus among contemporary clinical and experimental neuropsychologists as to which
phonemic fluency letter set is best to use. Although most neuropsychologists use the
COWAT administration format, the letter sets tend to vary by training, personal preference,
language of administration, and country (Strauss, Sherman, & Spreen, 2006).
In research studies, many experimenters prefer the COWAT letter sets (CFL and
PRW; see, e.g., Ross et al., 2006), while others prefer the original FAS set (see, e.g., Egeland,
Landro, Tjemsland, & Walbaekken, 2006; Troyer, 2000). Some studies use only two letters
such as PS (Ratcliff et al., 1998) or TN (Gauthier, Duyme, Zanca, & Capron, 2009), whereas
other use a mixture of the COWAT sets and FAS (Ruff, Light, Parker, & Levin, 1996). The
rationale for choosing letters other than the conventional CFL and PRW typically involves
creating appropriate normative data for the particular population under investigation.
The studies referred to in the previous paragraph are all normative studies of
phonemic verbal fluency performance, designed to produce standardized data relevant to
clinical practice in the countries in which the research was conducted (Canada, Norway,
India, and the United States). Phonemic verbal fluency tasks are also frequently used in
neuroimaging and lesion studies because performance on such tasks is correlated with neural
activity in specific brain regions. There seems to be consensus in the neuroimaging literature
that participants engaging in verbal fluency tasks commonly activate regions in the left
cerebral hemisphere more than in the right cerebral hemisphere (Billingsley et al., 2004).
Confirming this proposal, Szatkowska, Grabowska, and Szymanska (2000) found that
patients with lesions in the left dorsolateral prefrontal cortex performed significantly more
poorly than healthy controls on a standard format phonemic fluency task.
Another reason for the popularity of phonemic verbal fluency tasks is their ability to
measure aspects of executive functioning (e.g., generativity), which makes them most useful
5
in clinical settings (Fjell & Walhovd, 2003; Kockler & Stanford, 2008). This is especially the
case for disorders such as dementia. A study by Piatt, Fields, Paolo, Koller, and Troster
(1999) examined the performance of patients diagnosed with Parkinson’s disease with
dementia to those without dementia as well as to normal controls. The test used the original
letter set (FAS) and followed the standardised procedure i.e. 60s time limit for each letter
Results indicated that those diagnosed with Parkinson’s disease with dementia did
significantly worse than the control group and those with Parkinson’s disease without
dementia. Another study examined the effects of dementia on phonemic verbal fluency
outcomes in a clinical population with patients who have frontal lobe dementia, dementia of
the Alzheimer type and healthy controls. A 2 minute verbal task was used with the letter P
where it was found that those with dementia of the frontal lobe and dementia of the
Alzheimer type did significantly more poorly than controls (Pasquier, Lebert, Grymonprez, &
Petit, 2009).
Phonemic verbal fluency tests are also frequently used in investigations of the
neuropsychology of schizophrenia, a disorder that is commonly associated with frontal lobe
dysfunction (Bonilha et al., 2008). One such study by Landro and Ueland (2008) compared
phonemic verbal fluency in 21 adolescents diagnosed with schizophrenia to healthy controls.
The letters used were F and A with the standard 60 seconds time limit for each letter. It was
found that healthy controls did significantly better than the clinical population under
investigation.
Significant Moderators of Phonemic Verbal Fluency Performance
Sex. Some research suggests that biological sex has a significant impact on phonemic
verbal fluency performance and that it is therefore necessary to have separate normative data
sets for men and women (Barr, 2003). Sex differences on phonemic verbal fluency tasks tend
to be consistent with the conventional wisdom regarding differential male-female
performance on cognitive tasks (i.e., the majority of studies indicate that women tend to do
better than men on verbal fluency tasks; Aronoff, 2003). One such study by Burton,
Henninger, and Hafetz (2005) investigated sex differences in numerous tasks including
phonemic verbal fluency. This study required participants to write down as many words as
possible that began with the letter S in 5 minutes and then, in 4 minutes, to use the letter C to
write down as many four letter words as possible. The results showed the expected
relationship; women performed significantly better than male participants. Another study by
Aronoff (2003) looked at the phonemic verbal fluency performance of a group of high school
6
learners in a second-language class. They were all tested in the second language they were
learning, with the rationale being that, regardless of sex, they would all have had the same
amount of exposure to that language and its vocabulary. The results indicated that, despite
this equivalency in exposure to the second language, women performed better than men on a
written version of the phonemic fluency task.
Potential mechanisms for this sex difference include both sociocultural (e.g. girls start
talking before boys and tend to be more proficient though out their lives; Kolb, & Whishaw,
2003) and neurological explanations (e.g. the hormone, oestrogen, has been related to
improved verbal fluency outcomes; Zillmer, Spiers, Culbertson, 2008 and neuroimaging
studies show that women have larger language areas; Kolb, & Whishaw, 2003). Evidence for
the latter includes data from a recent study examining sex differences in brain activation
during the performance of verbal fluency tasks. This study found that the left and right
prefrontal cortex, cingulate gyrus, and right cerebellum were all significantly activated during
testing for both men and women, but that women had significantly more activation in the
right hippocampal gyrus and hippocampus (Weiss et al., 2003). This finding would suggest
that women’s activation of these areas contribute to better processing and performance on
phonemic verbal fluency. A major weakness of this study, unfortunately, is that it was not
possible for the researchers to compare actual behavioural performance across the sexes: The
participants were instructed to silently think of words relevant to the task during functional
magnetic resonance imaging (fMRI) scanning (in other words, the researchers could not
measure how many words each participant actually produced).
Age and education. Strauss, Sherman, and Spreen (2006) advise that these moderating
variables should be included in any study investigating phonemic verbal fluency
performance. Most studies follow that advice (see, e.g., Mungas, Reed, Farias, & DeCarli,
2009; Tombaugh, Kozak, & Rees, 1999). However, because age and number of years of
education are typically highly positively correlated, some studies investigating factors that
moderate phonemic verbal fluency performance focus either on age (e.g., Kave, Samuel-
Enoch, & Adiv, 2009; Landro & Ueland, 2008; Moreno-Martinez, Laws, & Schulz 2008;
Rodriguez-Aranda & Martinussen 2006), whereas others focus exclusively on education (e.g.,
Da Silva, Petersson, Faisca, Ingvar, & Reis, 2004; Ratcliff et al., 1998).
With regard to age, a meta-analysis of 26 studies by Rodriguez-Aranda and
Martinussen (2006) confirmed that an increase in age is associated with an increase in word
production until approximately the age of 40, when slight decreases set in; these get more
marked as old age advances. There remains some debate, however, as to the extent of the

7
effect of age on verbal fluency performance: some studies suggest age is only a slightly
significant moderator variable (Troyer, 2000), whereas others suggest it is a highly significant
moderator (Kave, Samuel-Enoch, & Adiv, 2009; Schneider, 2008).
With regard to education, it is the moderating variable most often found to have a
significant effect on phonemic verbal fluency performance. For instance, at the very extreme,
studies examining differences in verbal fluency performance between literate and illiterate
participants find that the latter perform significantly more poorly than the former (Da Silva et
al., 2004; Ratcliff et al., 1998). Further, these studies also suggest that participants with
higher levels of education (i.e., usually more than 12 years of education) perform better than
those with lower levels (i.e., usually less than 12 years of education) on these tasks. However,
no South African study has established whether, and to what extent, level of education has a
moderating effect on phonemic verbal fluency performance. Moreover, no study has
compared the differential effects of education on verbal fluency performance in developed
(i.e., relatively high quality educational systems) versus developing (i.e., relatively low
quality educational systems). This study will attempt to fill these knowledge gaps.
Cross-Cultural Neuropsychology of Verbal Fluency: The South African context
As noted earlier, and as in most other countries where neuropsychology is practiced,
phonemic verbal fluency tests are frequently used in South African clinical settings.
Unfortunately, however, there are no published normative studies of verbal fluency in this
country, and so South African clinical neuropsychologists often judge the performance of
their patients against that of individuals in northern hemisphere countries (e.g., the United
States, Canada, and the United Kingdom), where norms have been collected.
Although phonemic verbal fluency tasks are frequently used in clinical practise in
South Africa, there are very few published research studies on verbal fluency performance in
this country (H. Ferrett, personal communication, April 28, 2009). Of those that have been
published, most focus on the comparison of a clinical population to a control population on
the verbal fluency task. For instance, Kodituwakku et al. (2006) investigated the differences
in phonemic verbal fluency between 62 children diagnosed with Fetal Alcohol Syndrome
(FAS) and healthy matched controls. The language used by participants was Afrikaans. The
letters S and K were administered under the standard format of the 60 seconds time limit per
letter with the usual restrictions (proper nouns and same words with different endings were
not allowed). As expected, healthy controls did significantly better than the children
diagnosed with FAS. Similarly, Bittner and Crowe (2006) reported that adults who had

8
sustained a traumatic brain injury (TBI) performed significantly more poorly than healthy
matched controls on a verbal phonemic verbal fluency test when using the F-A-S letter set.
To this point, there have apparently been no efforts to develop, in an empirical
fashion, letter sets appropriate for the multilingual and multicultural South African society.
Neuropsychologists in clinical practice most often follow international conventions in using
the F-A-S set with their English-speaking patients; for Afrikaans-speaking patients, the most
commonly used letter set is M-A-S (because the letter F rarely starts in words Afrikaans, and
because it might be easily confused with V (H. Ferrett, personal communication, April 28,
2009). For Xhosa and Zulu speakers, tests are usually administered in English or Afrikaans,
depending on what language the testee is educated in.2
Summary and Rationale for the Present Study
Since Thurstone and Thurstone (1962) first published their paper on tests measuring
verbal fluency, the administrative procedure and stimuli featured within these tests have been
reviewed and revised numerous times. Verbal fluency tests are now an important part of
almost any neuropsychological test battery, and are widely used throughout the world. The
fact that verbal fluency performance is clearly associated with discrete brain regions and
those deficits in verbal fluency are associated with particular psychiatric diagnosis (e.g.,
schizophrenia) and neurological conditions (e.g., Alzheimer’s disease), indicate that
administration of these tests is useful in both clinical and research settings.
Studies focused on developing normative data, and investigating performance in
healthy individuals, have established that age, sex, and education are important moderators of
verbal fluency. Unfortunately, however, there are very few published research studies
presenting verbal fluency data for South Africans. Given that (a) South Africa is a
multilingual and multicultural society, (b) Western verbal fluency norms are potentially not
suited for use in this country, and (c) clinical neuropsychologists in South Africa use verbal
fluency tests at least as often as their North American and European counterparts, there is an
urgent need for empirical studies aimed at developing appropriate letter sets for use with
South African individuals of various first languages, at producing normative data for South
African samples, and at investigating the influence of moderator variables (such as age, level
2Bethlehem, De Piccotto, and Watt (2003) investigated semantic fluency in a bilingual English-Zulu cohort. They concluded that if a high proficiency of both languages is present the participant will choose to do the test in English, the language in which the participant is most likely to have received formal education.
9
of education, quality of education, home language, and bilingual/monolingual status) on
verbal fluency performance.
The purpose of this study is to help in filling this knowledge gap by. There are three
specific aims: (1) to establish the equivalency of the letters chosen to be equivalent across
three South African languages; English, Afrikaans and isiXhosa; (2) to determine to what
extent the variables of language, the years of education, gender and socio-economic status
(SES) affects performance of young South Africans on phonemic verbal fluency tasks; (3) to
place these findings from South Africa in a global context and to determine whether the level
of formal education in developing countries has a larger or smaller moderating effect on
phonemic verbal fluency performance than in developed countries.
Study 1
This study aims to determine the letter set equivalency for each of the languages under
investigation; English, Afrikaans and isiXhosa. It also determines which variables have the
most predictive value for outcomes on the phonemic verbal fluency task. The amount of
education the participant has completed is hypothesized to be the most important variable in
predicting phonemic verbal fluency outcomes.
Methods
Design and setting. The study is nested within a larger research project whose aim is
to provide normative data for English-, Afrikaans-, and isiXhosa-speaking individuals in the
Western Cape on the Wechsler Abbreviated Scale of Intelligence (WASI; Wechsler, 1999),
the Boston Naming Test (BNT; Kaplan, Goodglass, & Weintraub, 1983), and phonemic and
semantic verbal fluency tests. The entire test battery took approximately an hour, varying by
10 minutes.
Data were collected from learners at primary schools and high schools in the Cape
Town region and from students at the University of Cape Town. Data collection took place
on school premises and in the Department of Psychology at the University of Cape Town,
respectively.
A quantitative, cross-sectional design was used in accordance with nonrandomized
selection criteria. There was a single administration of the neuropsychological test battery.
Participants. The exclusion criteria used in the selection process were extensive, so
that the results were not confounded by extraneous variables. Participants were required to (a)
have English, Afrikaans or isiXhosa as their first language, (b) be between the ages of 7 and
10
25 years, (c) be currently attending a primary/high school or a tertiary institution, and (d) be
residing in the Cape Town region. Furthermore, in order to ensure that participants had been
educated in similar school systems and without specific hindrance, they all had to have been
educated in South Africa for at least 5 years, and were required not to have learning disorders
or educational difficulties. These criteria were put in place to ensure that a representative
sample of South African children, adolescents, and young adults would be recruited, and to
ensure ease of logistics.
Individuals were excluded from the study if they were on psychotropic medication,
had a psychiatric diagnosis, had pre-natal or birth complication, had a head injury which
resulted in a loss of consciousness for more than 5 minutes, or had seizure disorders,
substance abuse disorders, a medical illness resulting in loss of cognitive functioning,
language, speech or behavioural disorders; these exclusion criteria were put in place because
performance on neuropsychological tests may reflect cognitive disadvantages related to the
above conditions, thus confounding the results. Finally, participants who received
psychometric testing within the past 12 months were excluded from the study due to the
possibility of practice effects confounding the results.
Finally, a total sample of 269 participants was recruited (162 females, 107 males; 113
English-, 71 Afrikaans-, and 85 isiXhosa- speakers). The sample size used in the analysis
presented below was 147 due to incomplete data (85 females, 62 males; 59 English-, 39
Afrikaans-, and 49 isiXhosa- speakers). The tertiary participants participated as part of their
course requirements. Tertiary students who took part but did not receive course credit instead
received a small gift voucher as compensation. All schoolchildren received similar vouchers
as compensation for their participation.
Materials. The larger study within which the current study is nested uses a
comprehensive battery of neuropsychological tests and questionnaires; only those relevant to
the current study are discussed below.
All participants were required to complete a demographic questionnaire, designed as
part of the larger study. The questionnaire gathered information regarding race, place of
education, place of residence, medical history, and scholastic history. The school learners
completed a slightly different demographic questionnaire (see Appendix A) to that completed
by the university students (see Appendix B).
With regard to the phonemic verbal fluency tests, we used the standard COWAT
administration format. This is a 1-min task that requires the participant to name as many
words as possible that begin with a particular letter. The examiner gives a standard set of
11
instructions, and then gives the examinee the letter to which he/she should generate words.
The examiner records the examinee’s responses verbatim and in order, making sure to
document which words appeared in each 15-seond interval. All repetitions, self-corrected
errors, rule violations and set-loss errors3 are recorded. The total score on a verbal fluency
letter set is calculated as the sum of all words generated across the three letters, minus words
that represent repetitions, rule violations, or set loss errors. The COWAT has excellent
psychometric properties: inter-rater reliability is 0.9 (Ross, 2006), test-retest reliability is
similarly high, and there are good correlations, ranging from 0.85 to 0.94, between letter sets
(Lacy, Gore, Pliskin, & Henry, 1996; Troyer, 2000).
As noted earlier, the two letter sets used in the original COWAT are CFL and PRW.
Neither these letter sets, nor the popular FAS set, have been normed for South African
populations; furthermore, there are no letter sets with established equivalency across any
subset of South Africa’s official languages. In an initial attempt to remedy this situation, we
consulted with linguists and established that the letter sets LBS and MAT were the most
appropriate to use in the Western Cape, where the three dominant languages are English,
Afrikaans, and isiXhosa. The construction of these letter sets was based on rankings of the
relative frequency of words beginning with particular letters. The easiest (letters with the
highest frequency) are ‘L’ and ‘M’, while ‘S’ and ‘T’ had the lowest equivalent frequency
(and hence were the most difficult), with ‘B’ and ‘A’ falling in between.
Other than the variations in letter set, the standard COWAT administration and
scoring procedures (described above), were followed.
Procedure
Preliminary procedure. After individuals had been screened according to the
exclusion criteria, the parents of all participants under the age of 18 years completed
informed consent documents (see Appendix C); all participants over the age of 18 years
completed their own consent forms (see Appendix D). Parents of the younger learners were
responsible for providing the relevant demographic information, while high school learners
and tertiary students provided the information themselves.
In the case of the university students, a general meeting for interested applicants was
held beforehand; at that meeting, (a) the researchers confirmed that students qualified for the
3 Set-loss error: A type of error where a participant gives a word which is not within the predetermined restriction (e.g. saying the word ‘centre’ when the stimuli letter was S).

12
study, (b) potential participants completed the informed consent documents and the
demographic questionnaire, and (c) individual appointments were made for administration of
the test battery. A sample of the consent form is included in the Appendix.
Test battery administration. Before the battery was administered, participants were
informed that they could withdraw from the study at any time, or take a break during the
testing should they feel fatigued. Further, participants were informed that they would be
completing various tasks, some of which will require their responses to be timed or audio
recorded. Prior to the commencement of each test, participants were given clear instructions,
as well as an opportunity to ask questions if they do not clearly understand.
Specifically with regard to the phonemic verbal fluency tasks, the researcher (a) gave
standard instructions to each participant to control for any external bias that may have
influenced the testing process, (b) gave examples of what was expected of them during the
test, and (c) outlined restrictions on which kinds of words were allowed and which not (see
Appendix E). The researcher then clearly told the participant when to start generating words
and when to stop.
During phonemic fluency testing, if there was a pause, the researcher encouraged the
participant to think of more words by saying, “What other words can you think of?” After the
completion of each individual letter test, the researcher offered more words of
encouragement, in the form of “that was good” or the like. To control for fatigue and order
effects, half the participants were administered the MAT letter set first and the LBS letter set
second; the other half received the letter sets in the opposite order. The phonemic verbal
fluency task took approximately 8 minutes to administer.
Debriefing. Participants were debriefed at the end of the test battery administration
and thanked for their participation. They were given the opportunity to express any opinions
with regard to the testing experience, and they were informed of how to access the final
results of the study if they wished to do so.
Statistical Analysis
All statistical procedures were completed on the Statistical Package for Social
Sciences (SPSS), version 17.0 (SPSS Inc., Chicago IL).
Between-Group Comparisons: Ensuring letter set equivalency. Before completing any
between-group comparisons, descriptive statistics were calculated for all relevant variables,
and all assumptions underlying parametric stratified tests of significance were examined. To
ensure the letters were equivalent in difficulty across the languages (i.e., to ensure that all

13
participants, regardless of language group, had equal opportunity to produce a reasonably
equivalent number of words in response to each letter cue), a total of eight between-group
comparisons of means were calculated (one for each of the letter sets, LBS and MAT, and
one for each individual letter, L, B, S, M, A and T). In the event of missing data, cases were
excluded from just that analysis. Following this, a similar eight one-way between-group
comparisons of means were conducted to assess letter equivalency across male and female
groups. Here, as in all subsequent analyses, the level of statistical significance (α) was set at
.05.
Multiple Regression: Demographic predictors of phonemic verbal fluency
performance. In this multiple regression analysis, the demographic variables language of test
administration, years of education, sex, and socio-economic status (SES) were entered as
predictors of the outcome variable total phonemic verbal fluency score (i.e., the sum of all
correct words produced across both letter sets). The predictor variables were entered in one
block because I had no theoretical or statistical basis to enter them in hierarchical fashion.
Diagnostic tests were run and analyses of the residuals were examined; tolerance and any
partial correlations were noted, and inspection for outliers was also done.
Results
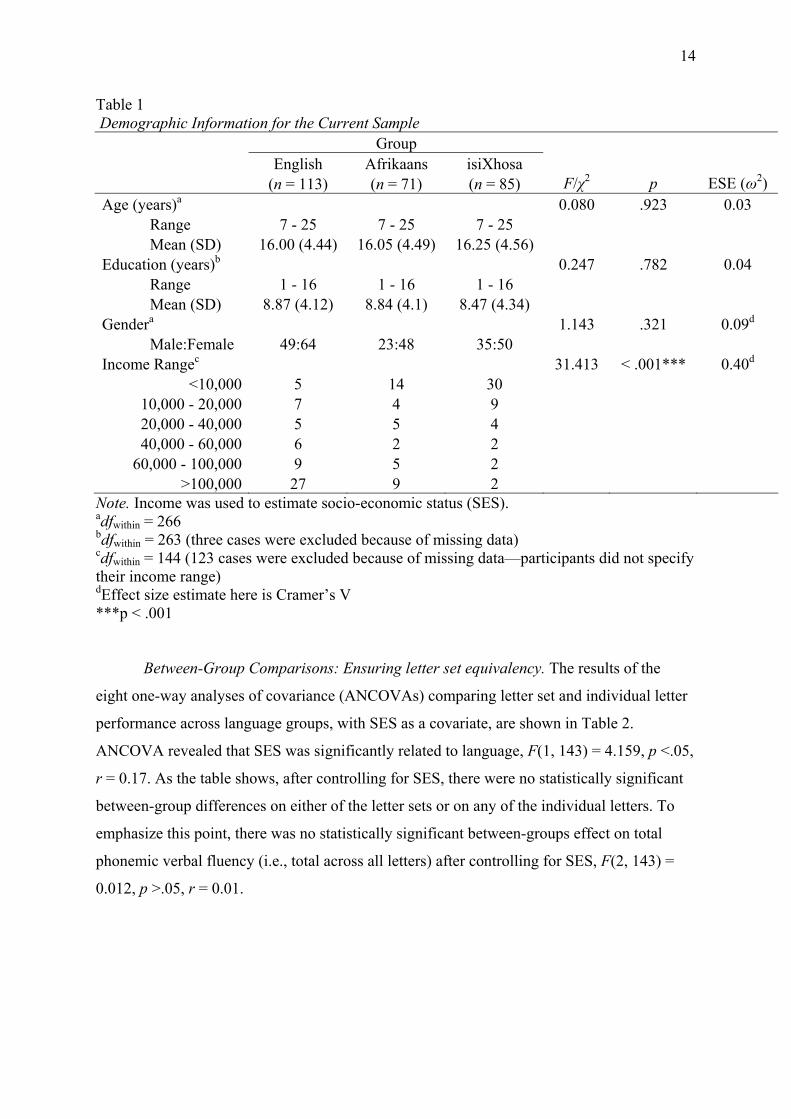
Table 1 presents demographic information for the final sample of 269 participants.
For all the variables presented in that table, the data were normally distributed and Levene’s
test for homogeneity of variance was not significant unless otherwise stated. As seen in the
table, there were no statistically significant differences between the language groups in terms
of age, years of education, or sex distribution. There was, however, a significant between-
groups difference with respect to SES. Therefore, in all subsequent analyses of differences
between language groups, SES was used as a covariate.
14
Table 1 Demographic Information for the Current Sample Group English Afrikaans isiXhosa (n = 113) (n = 71) (n = 85) F/χ2 p ESE (ω2) Age (years)a 0.080 .923 0.03 Range 7 - 25 7 - 25 7 - 25 Mean (SD) 16.00 (4.44) 16.05 (4.49) 16.25 (4.56) Education (years)b 0.247 .782 0.04 Range 1 - 16 1 - 16 1 - 16 Mean (SD) 8.87 (4.12) 8.84 (4.1) 8.47 (4.34) Gendera 1.143 .321 0.09d Male:Female 49:64 23:48 35:50 Income Rangec 31.413 < .001*** 0.40d
<10,000 5 14 30 10,000 - 20,000 7 4 9 20,000 - 40,000 5 5 4 40,000 - 60,000 6 2 2
60,000 - 100,000 9 5 2 >100,000 27 9 2
Note. Income was used to estimate socio-economic status (SES). adfwithin = 266 bdfwithin = 263 (three cases were excluded because of missing data) cdfwithin = 144 (123 cases were excluded because of missing data—participants did not specify their income range) dEffect size estimate here is Cramer’s V ***p < .001
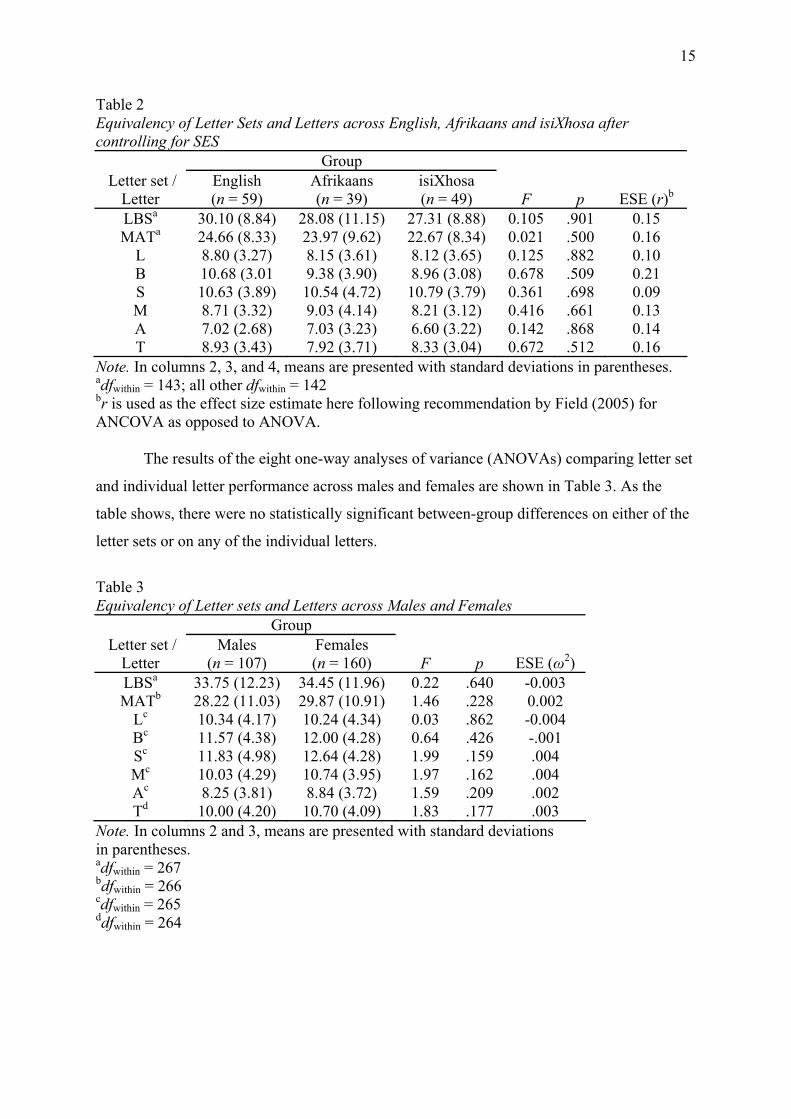
Between-Group Comparisons: Ensuring letter set equivalency. The results of the
eight one-way analyses of covariance (ANCOVAs) comparing letter set and individual letter
performance across language groups, with SES as a covariate, are shown in Table 2.
ANCOVA revealed that SES was significantly related to language, F(1, 143) = 4.159, p <.05,
r = 0.17. As the table shows, after controlling for SES, there were no statistically significant
between-group differences on either of the letter sets or on any of the individual letters. To
emphasize this point, there was no statistically significant between-groups effect on total
phonemic verbal fluency (i.e., total across all letters) after controlling for SES, F(2, 143) =
0.012, p >.05, r = 0.01.
15
Table 2 Equivalency of Letter Sets and Letters across English, Afrikaans and isiXhosa after controlling for SES
Group Letter set /
Letter English (n = 59)
Afrikaans (n = 39)
isiXhosa (n = 49) F p ESE (r)b
LBSa 30.10 (8.84) 28.08 (11.15) 27.31 (8.88) 0.105 .901 0.15 MATa 24.66 (8.33) 23.97 (9.62) 22.67 (8.34) 0.021 .500 0.16
L 8.80 (3.27) 8.15 (3.61) 8.12 (3.65) 0.125 .882 0.10 B 10.68 (3.01 9.38 (3.90) 8.96 (3.08) 0.678 .509 0.21 S 10.63 (3.89) 10.54 (4.72) 10.79 (3.79) 0.361 .698 0.09 M 8.71 (3.32) 9.03 (4.14) 8.21 (3.12) 0.416 .661 0.13 A 7.02 (2.68) 7.03 (3.23) 6.60 (3.22) 0.142 .868 0.14 T 8.93 (3.43) 7.92 (3.71) 8.33 (3.04) 0.672 .512 0.16
Note. In columns 2, 3, and 4, means are presented with standard deviations in parentheses. adfwithin = 143; all other dfwithin = 142 br is used as the effect size estimate here following recommendation by Field (2005) for ANCOVA as opposed to ANOVA.
The results of the eight one-way analyses of variance (ANOVAs) comparing letter set
and individual letter performance across males and females are shown in Table 3. As the
table shows, there were no statistically significant between-group differences on either of the
letter sets or on any of the individual letters.
Table 3 Equivalency of Letter sets and Letters across Males and Females
Group Letter set /
Letter Males
(n = 107) Females (n = 160) F p ESE (ω2)
LBSa 33.75 (12.23) 34.45 (11.96) 0.22 .640 -0.003 MATb 28.22 (11.03) 29.87 (10.91) 1.46 .228 0.002
Lc 10.34 (4.17) 10.24 (4.34) 0.03 .862 -0.004 Bc 11.57 (4.38) 12.00 (4.28) 0.64 .426 -.001 Sc 11.83 (4.98) 12.64 (4.28) 1.99 .159 .004 Mc 10.03 (4.29) 10.74 (3.95) 1.97 .162 .004 Ac 8.25 (3.81) 8.84 (3.72) 1.59 .209 .002 Td 10.00 (4.20) 10.70 (4.09) 1.83 .177 .003
Note. In columns 2 and 3, means are presented with standard deviations in parentheses. adfwithin = 267 bdfwithin = 266 cdfwithin = 265 ddfwithin = 264
16
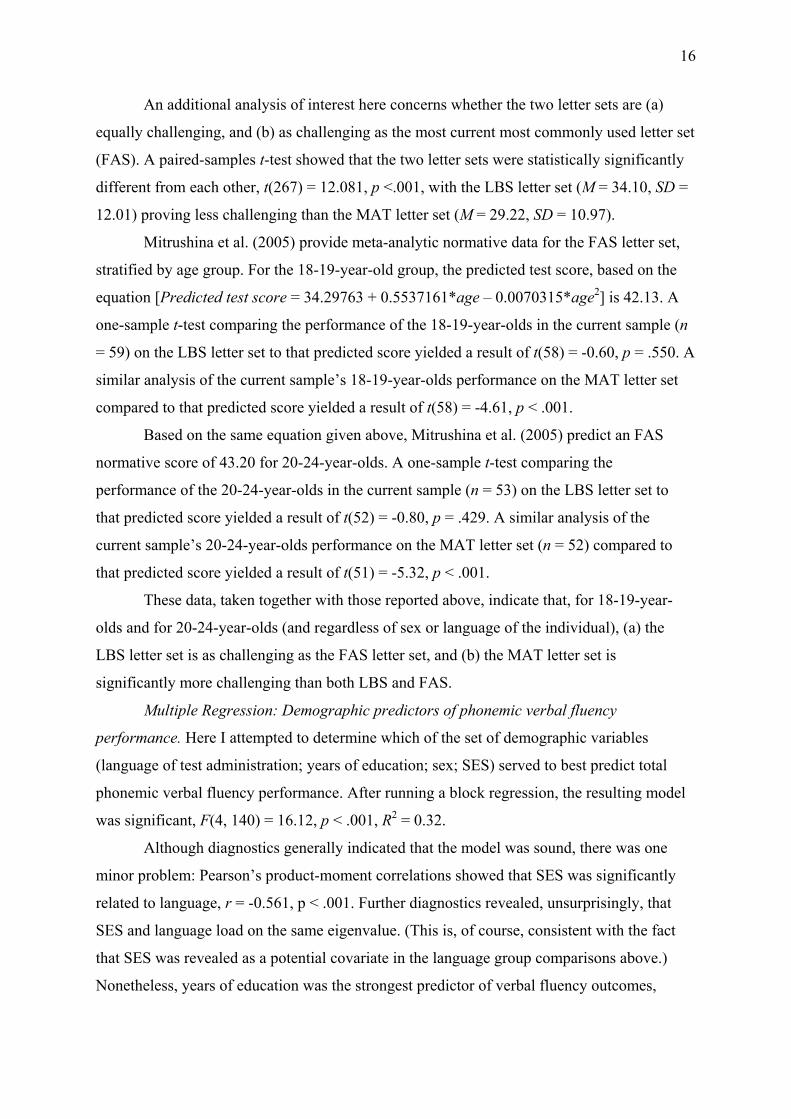
An additional analysis of interest here concerns whether the two letter sets are (a)
equally challenging, and (b) as challenging as the most current most commonly used letter set
(FAS). A paired-samples t-test showed that the two letter sets were statistically significantly
different from each other, t(267) = 12.081, p <.001, with the LBS letter set (M = 34.10, SD =
12.01) proving less challenging than the MAT letter set (M = 29.22, SD = 10.97).
Mitrushina et al. (2005) provide meta-analytic normative data for the FAS letter set,
stratified by age group. For the 18-19-year-old group, the predicted test score, based on the
equation [Predicted test score = 34.29763 + 0.5537161*age – 0.0070315*age2] is 42.13. A
one-sample t-test comparing the performance of the 18-19-year-olds in the current sample (n
= 59) on the LBS letter set to that predicted score yielded a result of t(58) = -0.60, p = .550. A
similar analysis of the current sample’s 18-19-year-olds performance on the MAT letter set
compared to that predicted score yielded a result of t(58) = -4.61, p < .001.
Based on the same equation given above, Mitrushina et al. (2005) predict an FAS
normative score of 43.20 for 20-24-year-olds. A one-sample t-test comparing the
performance of the 20-24-year-olds in the current sample (n = 53) on the LBS letter set to
that predicted score yielded a result of t(52) = -0.80, p = .429. A similar analysis of the
current sample’s 20-24-year-olds performance on the MAT letter set (n = 52) compared to
that predicted score yielded a result of t(51) = -5.32, p < .001.
These data, taken together with those reported above, indicate that, for 18-19-year-
olds and for 20-24-year-olds (and regardless of sex or language of the individual), (a) the
LBS letter set is as challenging as the FAS letter set, and (b) the MAT letter set is
significantly more challenging than both LBS and FAS.
Multiple Regression: Demographic predictors of phonemic verbal fluency
performance. Here I attempted to determine which of the set of demographic variables
(language of test administration; years of education; sex; SES) served to best predict total
phonemic verbal fluency performance. After running a block regression, the resulting model
was significant, F(4, 140) = 16.12, p < .001, R2 = 0.32.
Although diagnostics generally indicated that the model was sound, there was one
minor problem: Pearson’s product-moment correlations showed that SES was significantly
related to language, r = -0.561, p < .001. Further diagnostics revealed, unsurprisingly, that
SES and language load on the same eigenvalue. (This is, of course, consistent with the fact
that SES was revealed as a potential covariate in the language group comparisons above.)
Nonetheless, years of education was the strongest predictor of verbal fluency outcomes,
17
t(140) = 7.42, p < .001, followed by SES, t(140) = 2.25, p < .05. The final regression
equation therefore took the following form:
Total Phonemic Verbal Fluency Performance =
15.049 + (-0.063)Language + (1.616)Education + (-1.025)Sex + (0.782)SES
Discussion
Phonemic verbal fluency tests are a staple of neuropsychological test batteries across
the world because of their utility in detecting executive functioning deficits in a variety of
psychopathological and neurological conditions, and because of the clear correlation between
performance on such tests and activity in discrete brain regions. Unfortunately, however,
there is wide variation in the stimuli that comprise the test: many use the conventional FAS
(e.g., Loonstra, Tarlow, & Sellers, 2001) or the COWAT letter sets CFL and PRW (e.g. Ruff,
Light, & Parker, 1996), while some use subsets of CFL (e.g. Sumerall, Timmons, James,
Ewing, & Delert, 1997) and others use completely different letters/letter sets (Tallberg,
Ivachova, Tinghag, & Ostberg, 2008; Mathuranth et al., 2003; Ratcliff et al, 1998). The
reasons for this variation largely involve personal preference, differences in training, and
language/cultural/geographic considerations. In the current study, I attempted to determine
(a) whether two letter sets specially designed for use in South Africa (and more specifically,
the Western Cape) would be equally difficult for English-, Afrikaans-, and isiXhosa speakers,
and (b) whether performance of South African individuals on those letter sets would be
influenced by the same demographic factors as performance by, for instance, American
individuals on the FAS letter set.
The data reported above indicate that, if SES is controlled, the letters and letter sets
chosen are equivalent across all three languages (i.e., participants from the three language
groups produced reasonably equivalent numbers of words across both letter sets). This result
is encouraging for South African clinicians and researchers (and particularly for those in the
Western Cape): It suggests that these letter sets can be used, without adjustment, in practice
and experimental settings where English-, Afrikaans-, and isiXhosa-speaking individuals are
present.
Further, the analyses reported above comparing current data to normative data
provided in Mitrushina et al. (2005) suggest that the letter set LBS, but not the set MAT, is
comparable to the original and widely-used FAS set. This results stand in contrast to those of
Barry, Bates, and Labouvie (2008), who compared the relative difficulty of the FAS and CFL
18
letter sets. They found CFL to be more challenging than FAS, and noted that FAS
administration tended to be associated with greater variation in performance.
The regression results reported above suggest that education accounts for most of the
variance in this sample’s phonemic verbal fluency performance, but that the sex of the
participant has no significant effect on that performance. This finding is similar to that of
Tombaugh, Kozak and Rees (1999), who found identical patterns in terms of educational and
sex differences. Numerous other studies have also found a non-significant relationship
between sex and verbal performance (see, e.g., Brickman et al., 2005; Egeland et al., 2006;
Tallberg, Ivachova, Tinghag, & Ostberg, 2008). Obviously, this result suggests that, in the
clinical setting and in the absence of demographically-stratified normative data, both the
amount of education the person has had and their SES should be carefully considered when
interpreting their score on phonemic verbal fluency tasks.
With regard to limitations of the present study, the first is that the participants were
drawn from only three of the 11 official language groups in South Africa. Clearly, a direction
for future research is to extend the methodological principles developed in this study (i.e., the
way in which the letter sets were determined, and the way in which their equivalence across
language was tested) to other South African language groups.
Perhaps a more serious limitation, however, involves the population from which the
data were derived: students. Although it is commonplace to use such samples in psychology
studies, this does present presents problems of generalizability to the entire population. This
is especially the case in South Africa, where the majority of the population does not have
access to high levels of education (especially tertiary education). The fact that variations in
SES had a significant effect on phonemic verbal fluency performance further suggests the
importance of taking into account differences between those who have resources and those
that do not when interpreting scores on this test and when creating normative data for it. I
examine this relationship further in the next study.
Study 2
This study is a meta-analysis of published articles relating to the relationship between years
of education and phonemic verbal fluency performance. More specifically, I examine that
relationship in developed countries separate from that in developing countries. The rationale
behind this separation is that developed countries are resource rich and thus (one might
assume) can afford to place greater emphasis on education as a worthwhile investment,
19
whereas developing countries are resource poor and thus (one might assume) are unable to
invest as much in their population’s education.
Design and Methods
Data were drawn from studies conducted and published in different countries around
the world and included tests of phonemic verbal fluency that were then compared to each
other using the same education categories. The countries included were categorized as either
developed or developing following criteria described in Appendix F and Table 1. Studies
were thus divided into those conducted in developed (or resource-wealthy) countries and
those conducted in developing (or resource-poor) countries. Within each country,
comparisons were made between the phonemic verbal fluency performance of groups with
high levels of education and those with low levels of education.
Selection of Studies and Criteria for Inclusion. Two procedures were used to select
studies. First, the databases PsychInfo, PubMed and Web of Science were searched using a
specific time limit and the following keywords: verbal fluency, controlled oral word
association, COWAT, FAS, lexical fluency, letter fluency, phonemic fluency, word fluency
and word list generation. In this way, all peer-reviewed studies that were published between
1990 and 2009 and that focused on phonemic verbal fluency were retrieved. A total of 43
studies were thus identified as being suitable for further analysis.
The second procedure involved applying the following criteria to determine which
articles would be included in the final meta-analytic sample:
1. Explicit mention of the language in which the test was administered.
2. Explicit mention of the first language of the participant.
3. Explicit mention of which letters were used in the phonemic verbal fluency test.
4. Explicit mention of discrete categories describing the years of education the
participants had.
5. Use of only cognitively healthy humans as participants.
6. Provision of separate and independent raw scores for the phonemic verbal fluency
tests, regardless of how many and which other tests were also administered.
7. Provision of means, sample sizes and standard deviations for each phonemic verbal
fluency measure within each education category.
After applying those inclusion/exclusion criteria, 9 studies were judged suitable for inclusion
in the final set of analyses. The studies from developed countries that were included in the
final analysis are shown in Table 3 and the studies included from developing countries are
20
shown in Table 4. The studies excluded, and reasons for their exclusion, are presented in
Appendix G.
Variables of Interest. Besides the mean, sample size and standard deviation, other
variables of interest were: the language in which the test was administered, the country in
which the study was conducted, letters used, age range of sample, year study was published,
the number of letters, whether the country could be classified as a developed or developing
nation, sex of participants, age of participants, the number of education categories used, and
which education categories were used.
Statistical Analysis
Standard meta-analytic procedures were followed to explore the relationship between
years of education and performance on measures of phonemic verbal fluency.
For studies conducted in developed countries, one comparison was between
participants with education of less than or equal to high school (≤ 12 years of education)
versus those with education of more than high school (>12 years of education). Another
comparison was between participants with relatively low levels of education (≤ 15 years)
versus those with relatively high levels of education (>15 years). These two separate
comparisons had to be conducted because different studies used different categories in
defining participant levels of education, and I wanted to maximise the number of studies
included in this meta-analysis.
For studies conducted in developing countries, the comparison was between
participants with some high school education (<= 12 years) and those with more than high
school education (> 12 years).
Some of the studies used unique education categories (e.g., 13-15 years; Egeland et al.
2006), and so these categories had to be combined with others so they would fit into the
structure outlined above. When education categories were combined, the sample statistics
were combined in ways described elsewhere (Loonstra, Tarlow, & Sellers, 2001; Winer,
Brown, & Michels, 1991).
Ultimately, a total of nine analyses were performed. In each case, effect sizes were
calculated using Hedges’ formula and analyses were conducted using procedures outlined by
Lipsey and Wilson (2001).

21
Table 3
Studies from Developed Countries included in the Meta-Analysis
Education Categories ≤ 12 years >12 years
Study No. Authors Year Country Language
Letters used
Age range N Mean SD n Mean SD n
1
Ruff, Light, & Parker
1996
USA
English
C F L P R W
16 - 70
360
36.50
9.90
120
41.90
1.90
240
2
Loonstra, Tarlow, & Sellers
2001
USA
English
F A S
15 - 95
1945
30.70
13.09
1357
41.14
12.37
588
3 Kave 2005 Israel Hebrew B G S 18 - 85 369 36.00 9.00 89 38.60 10.10 180 4
Egeland, Landro, Tjemsland, & Walbaekken
2006
Norway
Norwegian
F A S
16 - 77
201
38.00
9.50
52
48.00
11.48
104
6
Tallberg, Ivachova, Tinghag, & Ostberg
2008
Sweden
Swedish
F A S
16 - 89
165
38.80
12.50
82
45.50
15.50
83
<=15 years >15 years 1
Ruff, Light, & Parker
1996
USA
English
C F L P R W
16 - 70
360
40.00
9.70
240
43.80
10.60
360
8
Brickman et al.
2005
UK, USA, Australia,
Netherlands
English/Dutch
F A S
21 - 82
471
18.02
0.29
245
19.17
0.43
471
9
Sumerall, Timmons, James, Ewing, & Dehlert
1997
USA
English
C F L
70 - 95
47
29.60
9.40
28
38.50
11.90
47
4
Egeland, Landro, Tjemsland, & Walbaekken
2006
Norway
Norwegian
F A S
16 - 77
201
41.00
10.35
104
52.00
11.20
156
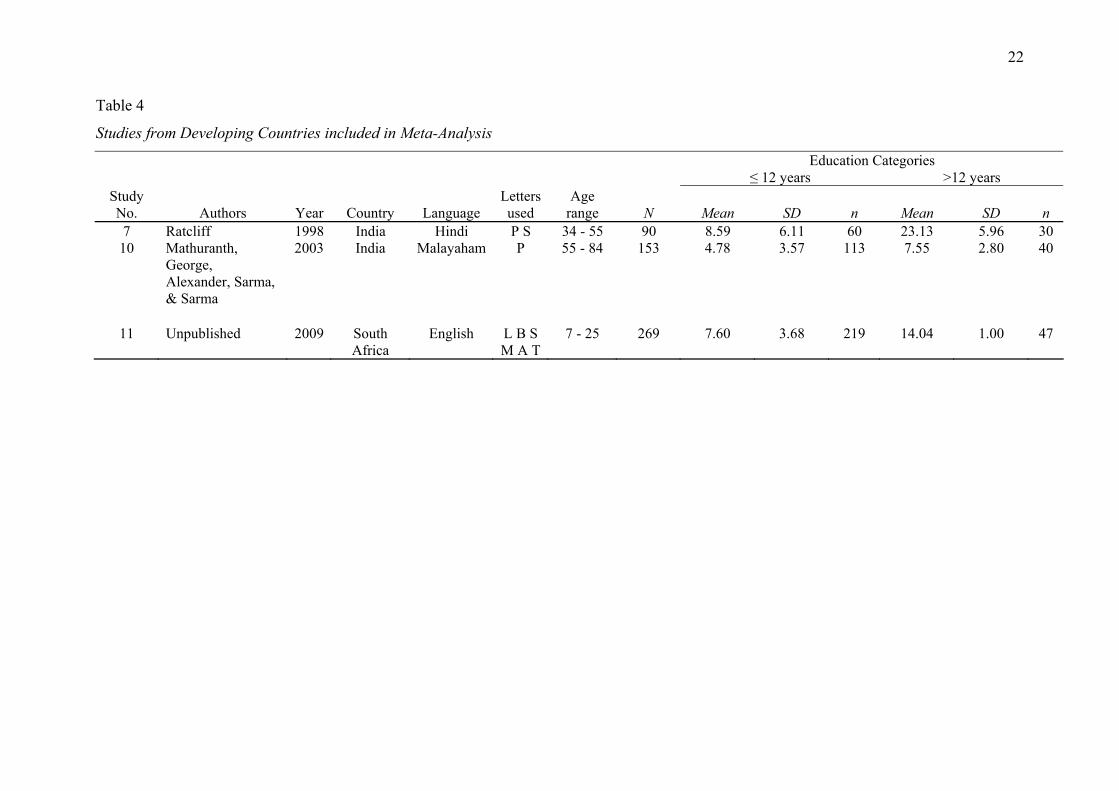
22
Table 4
Studies from Developing Countries included in Meta-Analysis
Education Categories ≤ 12 years >12 years
Study No. Authors Year Country Language
Letters used
Age range N Mean SD n Mean SD n
7 Ratcliff 1998 India Hindi P S 34 - 55 90 8.59 6.11 60 23.13 5.96 30 10
Mathuranth, George, Alexander, Sarma, & Sarma
2003
India
Malayaham
P
55 - 84
153
4.78
3.57
113
7.55
2.80
40
11
Unpublished
2009
South Africa
English
L B S M A T
7 - 25
269
7.60
3.68
219
14.04
1.00
47
23
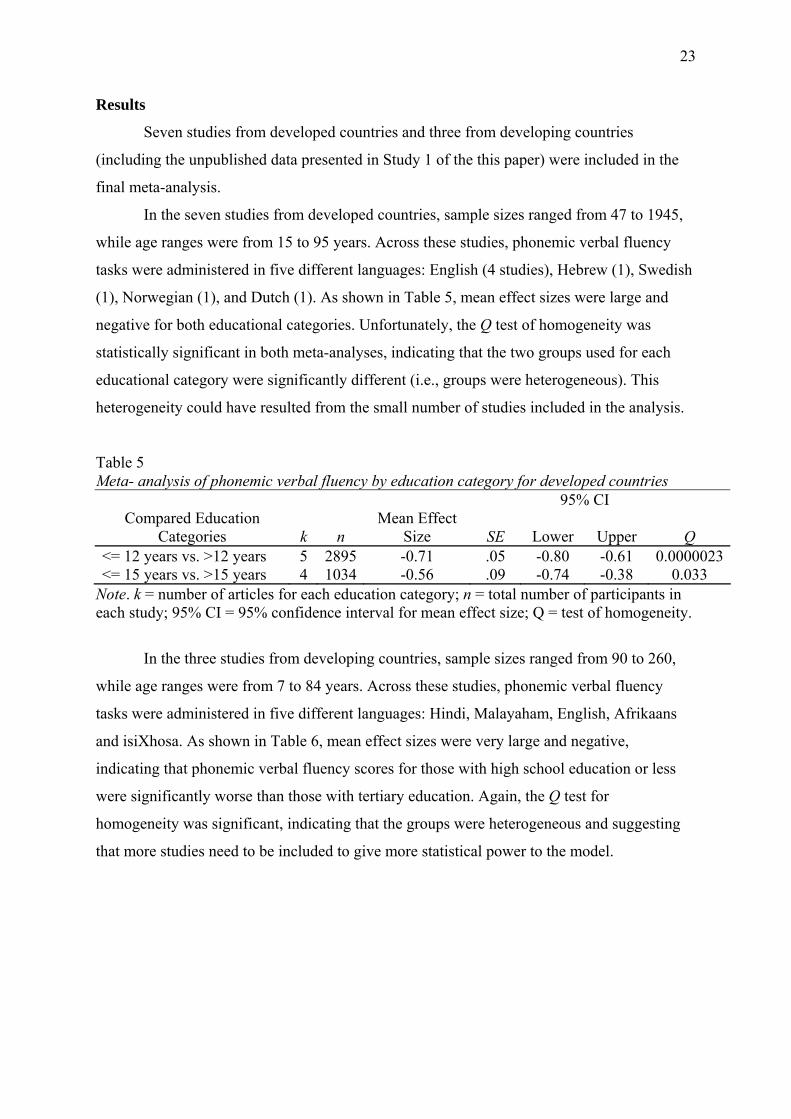
Results
Seven studies from developed countries and three from developing countries
(including the unpublished data presented in Study 1 of the this paper) were included in the
final meta-analysis.
In the seven studies from developed countries, sample sizes ranged from 47 to 1945,
while age ranges were from 15 to 95 years. Across these studies, phonemic verbal fluency
tasks were administered in five different languages: English (4 studies), Hebrew (1), Swedish
(1), Norwegian (1), and Dutch (1). As shown in Table 5, mean effect sizes were large and
negative for both educational categories. Unfortunately, the Q test of homogeneity was
statistically significant in both meta-analyses, indicating that the two groups used for each
educational category were significantly different (i.e., groups were heterogeneous). This
heterogeneity could have resulted from the small number of studies included in the analysis.
Table 5 Meta- analysis of phonemic verbal fluency by education category for developed countries 95% CI
Compared Education Categories k n
Mean Effect Size SE Lower Upper Q
<= 12 years vs. >12 years 5 2895 -0.71 .05 -0.80 -0.61 0.0000023<= 15 years vs. >15 years 4 1034 -0.56 .09 -0.74 -0.38 0.033
Note. k = number of articles for each education category; n = total number of participants in each study; 95% CI = 95% confidence interval for mean effect size; Q = test of homogeneity.
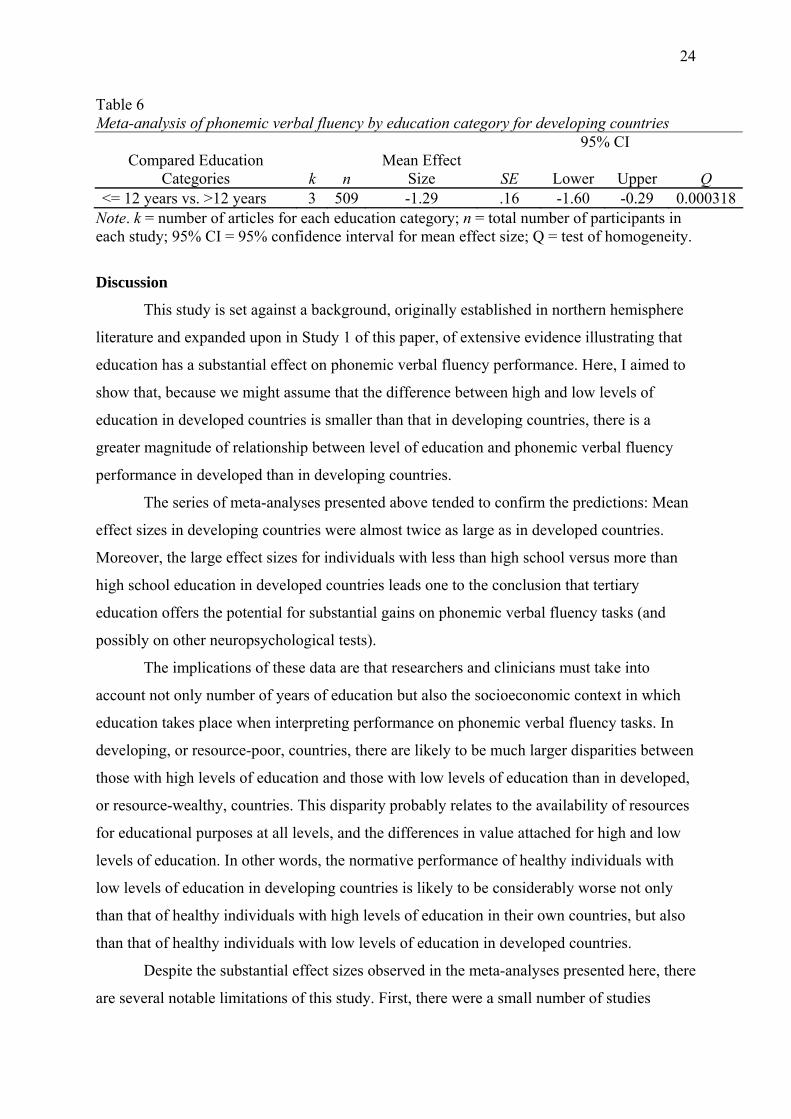
In the three studies from developing countries, sample sizes ranged from 90 to 260,
while age ranges were from 7 to 84 years. Across these studies, phonemic verbal fluency
tasks were administered in five different languages: Hindi, Malayaham, English, Afrikaans
and isiXhosa. As shown in Table 6, mean effect sizes were very large and negative,
indicating that phonemic verbal fluency scores for those with high school education or less
were significantly worse than those with tertiary education. Again, the Q test for
homogeneity was significant, indicating that the groups were heterogeneous and suggesting
that more studies need to be included to give more statistical power to the model.
24
Table 6 Meta-analysis of phonemic verbal fluency by education category for developing countries 95% CI
Compared Education Categories k n
Mean Effect Size SE Lower Upper Q
<= 12 years vs. >12 years 3 509 -1.29 .16 -1.60 -0.29 0.000318Note. k = number of articles for each education category; n = total number of participants in each study; 95% CI = 95% confidence interval for mean effect size; Q = test of homogeneity.
Discussion
This study is set against a background, originally established in northern hemisphere
literature and expanded upon in Study 1 of this paper, of extensive evidence illustrating that
education has a substantial effect on phonemic verbal fluency performance. Here, I aimed to
show that, because we might assume that the difference between high and low levels of
education in developed countries is smaller than that in developing countries, there is a
greater magnitude of relationship between level of education and phonemic verbal fluency
performance in developed than in developing countries.
The series of meta-analyses presented above tended to confirm the predictions: Mean
effect sizes in developing countries were almost twice as large as in developed countries.
Moreover, the large effect sizes for individuals with less than high school versus more than
high school education in developed countries leads one to the conclusion that tertiary
education offers the potential for substantial gains on phonemic verbal fluency tasks (and
possibly on other neuropsychological tests).
The implications of these data are that researchers and clinicians must take into
account not only number of years of education but also the socioeconomic context in which
education takes place when interpreting performance on phonemic verbal fluency tasks. In
developing, or resource-poor, countries, there are likely to be much larger disparities between
those with high levels of education and those with low levels of education than in developed,
or resource-wealthy, countries. This disparity probably relates to the availability of resources
for educational purposes at all levels, and the differences in value attached for high and low
levels of education. In other words, the normative performance of healthy individuals with
low levels of education in developing countries is likely to be considerably worse not only
than that of healthy individuals with high levels of education in their own countries, but also
than that of healthy individuals with low levels of education in developed countries.
Despite the substantial effect sizes observed in the meta-analyses presented here, there
are several notable limitations of this study. First, there were a small number of studies
25
included in each analysis. Although this fact is offset by the substantial sample sizes in the
included studies (for studies conducted in developed countries, the smallest N is 509), a clear
direction for future research is to broaden the base of included studies. This is relatively
easily done: The current search extended only as far back as 1990, whereas the original
verbal fluency tasks were developed in the 1960s, and some of the most important research in
the field was conducted in that decade. Second, time constraints in producing this manuscript
dictated that more complicated analyses, some of which require a larger sample of studies,
could not be conducted. For instance, further research is needed into why there are these
effect size differences between developing and developed countries; one might use a meta-
regression to calculate potentially significant predictors of the relationship, and thereby
answer that mechanism question. Third, because the Q test for homogeneity was consistently
statistically significant (indicating the groups in the meta-analyses were heterogeneous), the
addition of studies to the meta-analysis would increase the statistical power of the model.
Also, the significant Q statistic might indicate that the education categories, as they are
currently constituted, may be too broad in their classification, hence causing groups to be
heterogeneous. Thus, another way to counteract the heterogeneity of the groups would be to
create smaller education groups (e.g., 0-3 years, 4-6 years, etc.) which would become more
exclusive and hence more accurately defined and homogenous.
General Discussion
Phonemic verbal fluency tasks have great practical value in neuropsychology, and are
used in research and clinical settings across the world. Although numerous studies have
attempted to provide normative data that is culturally fair to the population in which the task
is being used, there are no published South African-specific phonemic verbal fluency norms.
For numerous reasons, clearly outlined in previously published South African literature and
clearly understood by South African clinicians, the use of normative data from other (and
specifically, developed) countries cannot be justified.
Study 1 detailed the development of two linguistically equivalent phonemic verbal
fluency letter sets (LBS and MAT) for specific use in research and clinical settings in the
Western Cape. The data presented showed that, across three language groups (English,
Afrikaans, and isiXhosa) there were no statistically significant differences in terms of
performance on the letter sets and on the individual letters. Furthermore, males and females
performed equally well on the newly developed letter sets, corroborating data from previous
studies which suggest that there are no sex differences in performance on phonemic verbal
26
fluency tasks (Bolla, Lindgren, Bonaccorsy, & Bleeker, 1990; Egeland et al., 2006; Ruff,
Light, & Parker, 1996). Additionally, the data from Study 1 showed that performance by our
South African sample on the LBS letter set is very similar to performance by northern
hemisphere normative samples on the widely-used FAS version of the test. Importantly, this
implies that, in the absence of extensive normative data for LBS, performance on this letter
set can be evaluated using the extensive and freely available normative data for FAS.
Although the sample used in Study 1 is relatively restricted in its generalizability to
the entire South African population, it is a step forward in developing culturally appropriate
normative data for the linguistically diverse South African population. This is the first study
of its kind in South Africa, and it is of immense value: Not only do these results provide letter
sets that are of practical use in the clinical setting, the process of letter set development and
data collection across different language groups provides a template for researchers in other
provinces who might want to develop letter sets appropriate for use in their regions.
The regression model presented in Study 1 sought to determine which demographic
variables were predictive of outcomes on the phonemic verbal fluency task. The variables
found to be most predictive were socio-economic status of the participant and the amount of
education he/she had attained. With regard to the former, literature on the effects of SES on
measures of verbal fluency is scant. Most studies in this field do not examine participants’
SES, suggesting either that the significant predictive value this variable has within the
multiple regression model may be unique to South Africa (which would not be surprising,
given that South Africa’s racial past continues to be manifest in correlated disparities in SES,
language, and academic performance), or that the researchers responsible for those studies do
not believe that SES plays a major role in the performance on phonemic verbal fluency tasks
by their largely middle-class participants.
This study sought to determine which variables are most influential in determining
important variables in verbal fluency. Although it has accomplished what it has set out to do,
it has also raised some important questions. The first question involves the relationship
between the language of the participant and their SES. All post hoc tests showed a significant
difference between the English group to the Afrikaans and isiXhosa groups. A study
examining the source for this difference would reveal important information about the
populations that are reliant on government funding and could help direct funds to those who
need it most.
With regard to education, although the regression model suggests that years of
completed education is a significant predictor of phonemic verbal fluency outcomes (and,
27
indeed, of performance on many other neuropsychological tests; Shuttleworth-Edwards,
Kemp, Rust, Muirhead, Hartman, & Radloff, 2004), there are many issues surrounding the
availability and quality of education in this country. The South African government has
acknowledged that teachers tend to be poorly trained and that schools lack the relevant
infrastructure such as science and sports equipment, adequate library materials, etc. Recent
estimates suggest that 24% of adults over the age of 15 are illiterate, which translates into
roughly 7 million adults in South Africa who are unable to read (SouthAfrica.info, 2006).
Study 2 attempted to place phonemic verbal fluency performance in South Africa in a
more global context. It is well known that South Africa suffers from some of the worst
inequality in the world; the difference between those with the necessary resources to attain
high levels of education differs drastically from those who do not possess such resources.
This sort of disparity is typical in developing countries; in contrast, individuals in developed
countries have much higher standards of living and higher average incomes, and thus a higher
percentage of those populations are able to access the benefits of higher education. More
specifically, though, the difference between high and low levels of education is substantially
smaller than that in developing countries, as more resources are directed to the improvement
of education at all levels. Therefore, those who are able to afford tertiary education in
developing countries differ substantially from those who can only afford high school
education, whereas this is not the case in developed countries, where, in any case,
substantially more people are able to undertake tertiary education.
The results of the meta-analyses presented in Study 2, although preliminary and
suffering from numerous limitations, support the notion that there are greater disparities
between high and low levels of education in developing than in developed countries, and that
these greater disparities have a sizable impact on phonemic verbal fluency performance.
In closing, it is important to reiterate that the sample in this study was drawn from a
relatively wealthy area of South Africa, and that therefore these results should be used with
caution when being applied to populations outside of urban and suburban neighbourhoods in
the Western Cape. Our hope is that this research is built upon and extended to include
normative data for other official languages, for rural populations, and for an increased overall
sample size that includes a more heterogeneous sampling within each carefully defined
educational category.

28
References
Alvarez, J. A., & Emory, E. (2006). Executive function and the frontal lobes: A meta-analytic
review. Neuropsychological Review, 16, 17-42.
Aronoff, J. M. (2003). Gender and the letter fluency task: Evidence from second language
learners. USC Working Papers in Linguistics, 111-120.
Barr, W. (2003). Neuropsychological testing of high school athletes: preliminary norms and
test-retest indices. Archives of Clinical Neuropsychology, 18, 91-101.
Barry, D., Bates, M. E., & Labouvie, E. (2008). FAS and CFL forms of verbal fluency differ
in difficulty: A meta-analytic study. Applied Neuropsychology, 15, 97-106.
Bechtold, H. P., Benton, A. L., & Fogel, M. L. (1962). An application of factor analysis in
neuropsychology. Psychological Record, 12, 147-156. In Mitrushina, M., Boone, K.
B., Razani, J., & D’Elia, L. F. (2005). Handbook of Normative Data for
Neuropsychological Assessment. 2nd Ed. Oxford University Press.
Benton, A. (1967). Problems of test construction in the field of aphasia. Cortex, 3, 32-58. In
Mitrushina, M., Boone, K. B., Razani, J., & D’Elia, L. F. (2005). Handbook of
Normative Data for Neuropsychological Assessment. 2nd Ed. Oxford University Press.
Bethlehem, D., De Piccotto, J. & Watt, N. (2003). Assessment of verbal fluency in bilingual
Zulu-English speakers. South African Journal of Psychology, 33, 236-240.
Billingsley, R. L., Simos, P. G., Castillo, E. M., Sarkari, S., Breier, J. I., Pataria, E. et al.
(2004). Spatio-temporal cortical dynamics of phonemic and semantic fluency. Journal
of Clinical and Experimental Neuropsychology, 26, 1031-1043.
Bittner, R. M., & Crowe, S. F. (2006). The relationship between naming difficulty and FAS
performance following traumatic brain injury. Brain Injury, 20, 971-980.
Bolla, K. I., Lindgren, K. N., Bonaccorsy, C., & Bleecker, M. L. (1990). Predictors of verbal
fluency (FAS) in the healthy elderly. Journal of Clinical Psychology, 46, 623-628.
Bonhila, L., Molnar, C., Horner, M. D., Anderson, B., Forster, L., George, M. S., & Nahas, Z.
(2008). Neurocognitive deficits and prefrontal cortical atrophy in patients with
schizophrenia. Schizophrenia Research, 101, 142-151.
Borkowski, J., Benton, A., & Spreen, O. (1967). Word fluency and brain damage.
Neuropsychologica, 5, 135-140. In Mitrushina, M., Boone, K. B., Razani, J., &
D’Elia, L. F. (2005). Handbook of Normative Data for Neuropsychological
Assessment. 2nd Ed. Oxford University Press.
Brickman, A. M., Paul, R. H., Cohen, R. A., Williams, L. M., MacGregor K. L., Jefferson, A.
L., Tate, D. F., Gunstad, J., & Gordon, E. (2005). Category and letter verbal fluency
29
across the adult lifespan: relationship to EEG theta power. Archives of Clinical
Neuropsychology, 20, 561-573.
Burton, L. A., Henninger, D., & Hafetz, J. (2005). Gender differences in relations of mental
rotation, verbal fluency, and SAT scores to finger length ratios as hormonal indexes.
Developmental Psychology, 28, 493-505.
Da Silva, C. G., Petersson, K. M., Faisca, L., Ingvar, M., & Reis, A. (2004). The effects of
literacy and education on the quantitative and qualitative aspects of semantic verbal
fluency. Journal of Clinical and Experimental Neuropsychology, 26, 266-277.
Egeland, J., Landro, N. I., Tjemsland, E., & Walbaekken, K. (2006). Norwegian norms and
factor-structure of phonemic and semantic word list generation. The Clinical
Neuropsychologist, 20, 716-728.
Fjell, A. M., & Walhovd, K. B. (2003). P3a and Neuropsychological ‘Frontal’ Tests in
Aging. Aging Neuropsychology and Cognition. 10, 169-181.
Gauthier, C. T., Duyme, M., Zanca, M., & Capron, C. (2009). Sex and performance level
effects on brain activation during a verbal fluency task: a functional magnetic
resonance imaging study. Cortex, 45, 164-176.
Kave, G., Samuel-Enoch, K., & Adiv, S. (2009). The association between age and the
frequency of nouns selected for production. Psychology and Aging, 24, 17-27.
Kockler, T. R., & Stanford, M. S. (2008). Using a clinically aggressive sample to examine the
association between impulsivity, executive functioning, and verbal learning and
memory. Archives of Clinical Neuropsychology, 23, 165-173.
Kodituwakku, P. W., Adnams, C. M., Hay, A., Kitching, A. E., Burger, E., Kalberg et al.
(2006). Letter and category fluency in children with Fetal Alcohol Syndrome from a
community in South Africa. Journal of Studies on Alcohol, 67, 502-510.
Kolb, B., & Whishaw, I. Q. (2003). Fundamentals of human neuropsychology. 5th Edition.
University of Lethbridge, Worth Publishers.
Lacy, M. A., Gore, P. A., Pliskin, N. H., & Henry, G. K. (1996). Verbal fluency task
equivalency. Clinical Neuropsychologist, 10, 305-308.
Landro, N. I., & Ueland, T. (2008). Verbal memory and verbal fluency in adolescents with
schizophrenia spectrum disorders. Psychiatry and Clinical Neurosciences, 62, 653-
661.
Loonstra, A. S., Tarlow, A. R., & Sellers, A. H. (2001). COWAT metanorms across age,
education, and gender. Applied Neuropsychology, 8, 161-166.
30
Mitrushina, M., Boone, K. B., Razani, J., & D’Elia, L. F. (2005). Handbook of Normative
Data for Neuropsychological Assessment. 2nd Ed. Oxford University Press.
Moreno-Martinez, F. J., Laws, K. R., & Schultz, J. (2008). The impact of dementia, age and
sex on category fluency: greater deficits in women with Alzheimer’s disease. Cortex,
44, 1256-1264.
Mungas, D., Reed, B. R., Farias, S. T., & DeCarli, C. (2009). Age and education effects on
relationships of cognitive test scores with brain structure in demographically diverse
older persons. Psychology and Aging, 24, 116-128.
Pasquier, F., Lebert, F., Grymonprez, L., & Petit, H. (2009). Verbal fluency in dementia of
frontal lobe type and dementia of Alzheimer type. Journal of Neurology,
Neurosurgery, and Psychiatry,58, 81-84.
Piatt, A. L., Fields, J. A., Paolo, A. M., Koller, W. C., & Troster, A. I. (1999). Lexical,
Semantic, and action verbal fluency in Parkinson’s disease with and without
dementia. Journal of Clinical and Experimental Neuropsychology, 21, 435-443.
Ratcliff, G., Ganguli, M., Chandra, V., Sharma, S., Belle, S., Seaberg, E. et al. (1998). Effects
of literacy and education on measures of word fluency. Brain and Language, 61, 115-
122.
Rodriguez-Aranda, C., & Martinussen, M. (2006). Age-related differences in performance of
phonemic verbal fluency measured by Controlled Oral Word Association Test: a
meta-analytic study. Developmental Neuropsychology, 30, 697-717.
Ross, T. P., Furr, A. E., Carter, S. E., & Weinberg, M. (2006). The psychometric equivalence
of two alternate forms of the Controlled Oral Word Association Test. The Clinical
Neuropsychologist, 20, 414-431.
Ruff, R. M., Light, R. H., Parker, S. B., & Levin, H. S. (1996). The psychological construct
of word fluency. Brain and Language, 57, 394-405.
Schneider, B. C., & Lichtenberg, P. A. (2008). Executive ability and physical performance in
urban black older adults. Archives of Clinical Neuropsychology, 23, 593-601.
Shuttleworth-Edwards, A. B., Kemp, R. D., Rust, A. L., Muirhead, J. G. L., Hartman, N. P.,
& Radloff, S. E. (2004). Cross-cultural effects on IQ test performance: A review and
preliminary normative indications of WAIS-III test performance. Journal of Clinical
Neuropsychology, 26, 903-920.
SouthAfrica.info. (2006). Education in South Africa. Retrieved October 29, 2009, from
http://www.southafrica.info/about/education/education.htm

31
Strauss, E, Sherman, E. M. S., & Spreen, O. (2006). A compendium of neuropsychological
tests: Administration, Norms and Commentary. 3rd Edition. Oxford University Press
Sumerall, A. W., Timmons, P. L., James, A. L., Ewing, M. J. M., & Oehlert, M. E. (1997).
Expanded norms for the controlled oral word association test. Journal of Clinical
Psychology, 53, 517-521.
Szatkowska, I., Grabowska, A., & Szymanska, O. (2000). Phonological and semantic
fluencies are mediated by different regions of the prefrontal cortex. Acta Neurobiol.
Exp., 60, 503-508.
Tallberg, I. M., Ivachova, E., Tinghag, K. J., & Osterberg, P. (2008). Swedish norms for
word fluency tests: FAS, animals and verbs. Scandinavian Journal of Psychology, 49,
479-485.
Thurstone, L. L., & Thurstone, T. G. (1962). Primary mental abilities (Rev). Chicago:
Science Research Associates. In Mitrushina, M., Boone, K. B., Razani, J., & D’Elia,
L. F. (2005). Handbook of Normative Data for Neuropsychological Assessment. 2nd
Ed. Oxford University Press.
Tombaugh, T. N., Kozak, J., Rees, L. (1999).Normative data stratified by age and education
for two measures of verbal fluency: FAS and animal naming. Archives of Clinical
Neuropsychology, 14, 167-177.
Troyer, A. K. (2000). Normative data for clustering and switching on verbal fluency tasks.
Journal of Clinical and Experimental Neuropsychology, 22, 370-378.
Weiss, E. M., Siedentopf, C., Hofer, A., Deisenhammer, E. A., Hoptman, M. J., Kremser, C.
et al. (2003). Brain activation pattern during a verbal fluency test in healthy male and
female volunteers: a functional magnetic resonance imaging study. Neuroscience
Letters, 352, 191-194.
Winer, B. J., Brown, D. R., Michels, K. M. (1991). Statistical principles in experimental
design. 3rd Ed. New York: McGraw-Hill.
World Bank. (2008). Gross National Income per capita, 2008, Atlas method and PPP.
Retrieved October 28, 2009, from
http://siteresources.worldbank.org/DATASTATISTICS/Resources/GNIPC.pdf
Zillmer, E. A., Spiers, M. V., & Culbertson, W. C. (2008). Principles of Neuropsychology.
2nd Ed. USA: Thomson-Wadsworth.
32
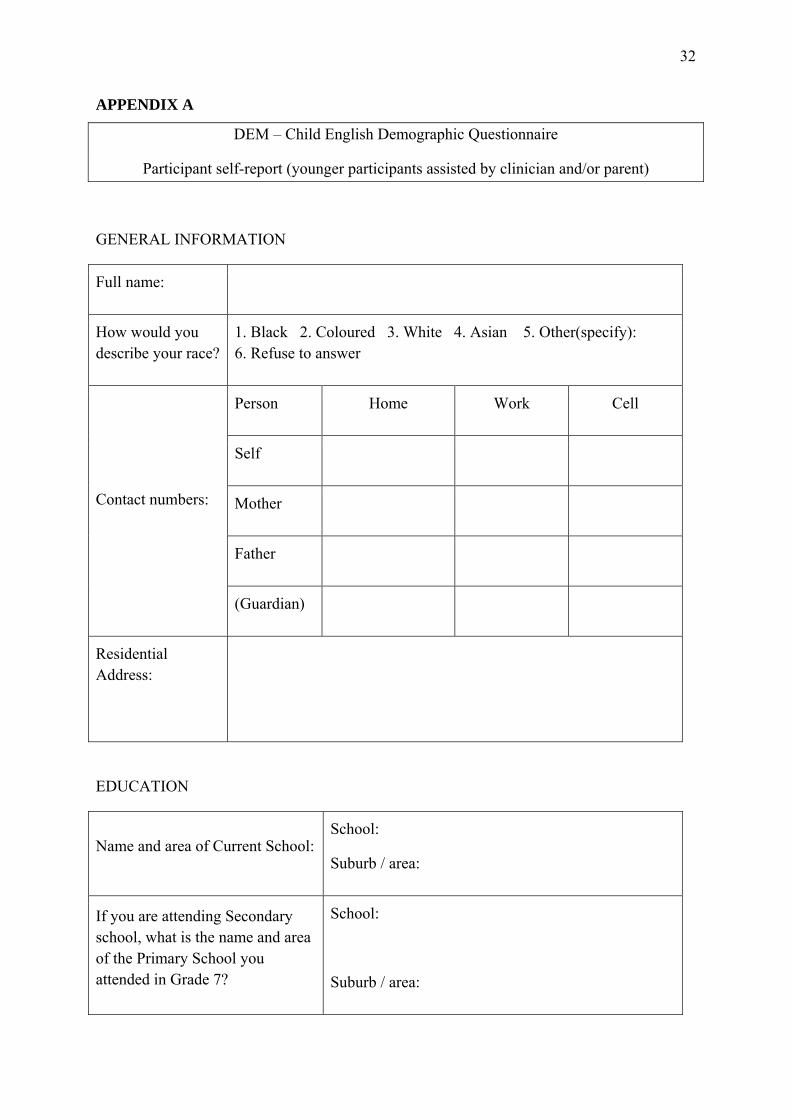
APPENDIX A
DEM – Child English Demographic Questionnaire
Participant self-report (younger participants assisted by clinician and/or parent)
GENERAL INFORMATION
Full name:
How would you describe your race?
1. Black 2. Coloured 3. White 4. Asian 5. Other(specify): 6. Refuse to answer
Person Home Work Cell
Self
Mother
Father
Contact numbers:
(Guardian)
Residential Address:
EDUCATION
Name and area of Current School: School:
Suburb / area:
If you are attending Secondary school, what is the name and area of the Primary School you attended in Grade 7?
School:
Suburb / area:

33
RESIDENTIAL INFORMATION
How long have you lived at your current address?
How would you describe your dwelling?
1. Shack 2. Wendy house or backyard dwelling
3. Tent or traditional dwelling 4. Flat / apartment
5. Town house / semi-detached house
6. Freestanding brick house 7. Other (specify):
Which of these items do you have in your home? (mark as many as necessary)
A. Tap water B. Flush toilet inside home C. Electricity
D. Telephone (landline) E. Television F. Computer G. Car
How many people sleep in the same room with you at night when you are at home?
1. one 2. two 3. three 4. four 5. five 6. more than five 7. none
FAMILIAL INFORMATION
Who is your primary care-giver?
(Describe the relationship, e.g. mother, father, uncle etc.)
What is your relationship with your BIOLOGICAL MOTHER?
1. Unknown 2.Known, but irregular contact
3. Known and regular contact 4. Living with child
5. Deceased
How old is she? (If deceased, specify age and reason of death)
What is your relationship with your BIOLOGICAL FATHER?
1. Unknown 2.Known, but irregular contact
3. Known and regular contact 4. Living with child
5. Deceased
How old is he? (If deceased, specify age and reason of death)
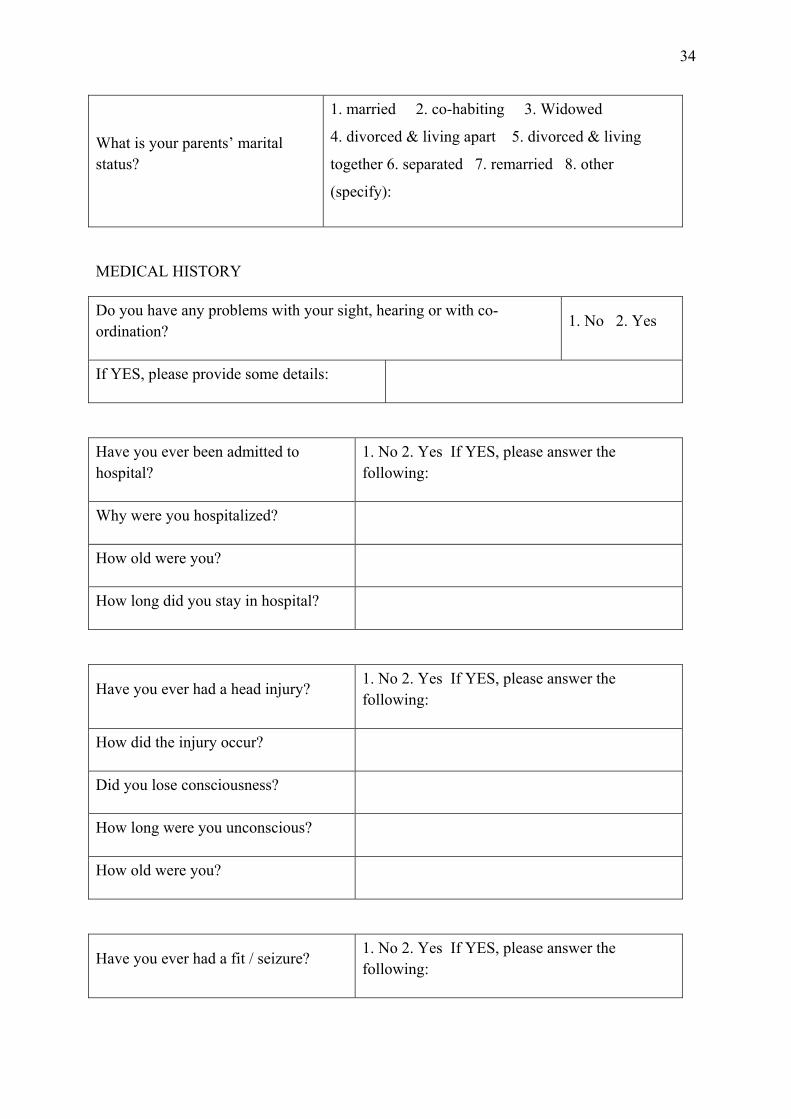
34
What is your parents’ marital status?
1. married 2. co-habiting 3. Widowed
4. divorced & living apart 5. divorced & living
together 6. separated 7. remarried 8. other
(specify):
MEDICAL HISTORY
Do you have any problems with your sight, hearing or with co-ordination?
1. No 2. Yes
If YES, please provide some details:
Have you ever been admitted to hospital?
1. No 2. Yes If YES, please answer the following:
Why were you hospitalized?
How old were you?
How long did you stay in hospital?
Have you ever had a head injury? 1. No 2. Yes If YES, please answer the following:
How did the injury occur?
Did you lose consciousness?
How long were you unconscious?
How old were you?
Have you ever had a fit / seizure? 1. No 2. Yes If YES, please answer the following:

35
How old were you?
What caused it?
Has it happened more than once?
Do you take medication for it?
Have you ever had a serious illness?
1. No 2. Yes If YES, please answer the following:
Name of illness/es age
Have you ever had to take medication for over two weeks? (do not include medication for common conditions such as colds, flu, gastro enteritis)
1. No 2. Yes If YES, please answer the following:
What was the reason for the medication?
What was the name and dosage of the medication?
Are you currently taking any medication?
What is the reason for the medication?
What is the name and dosage of the medication?
PSYCHIATRIC HISTORY
Have you ever sought counselling (at school, church or elsewhere) for
1. No 2. Yes If YES, please answer the following:
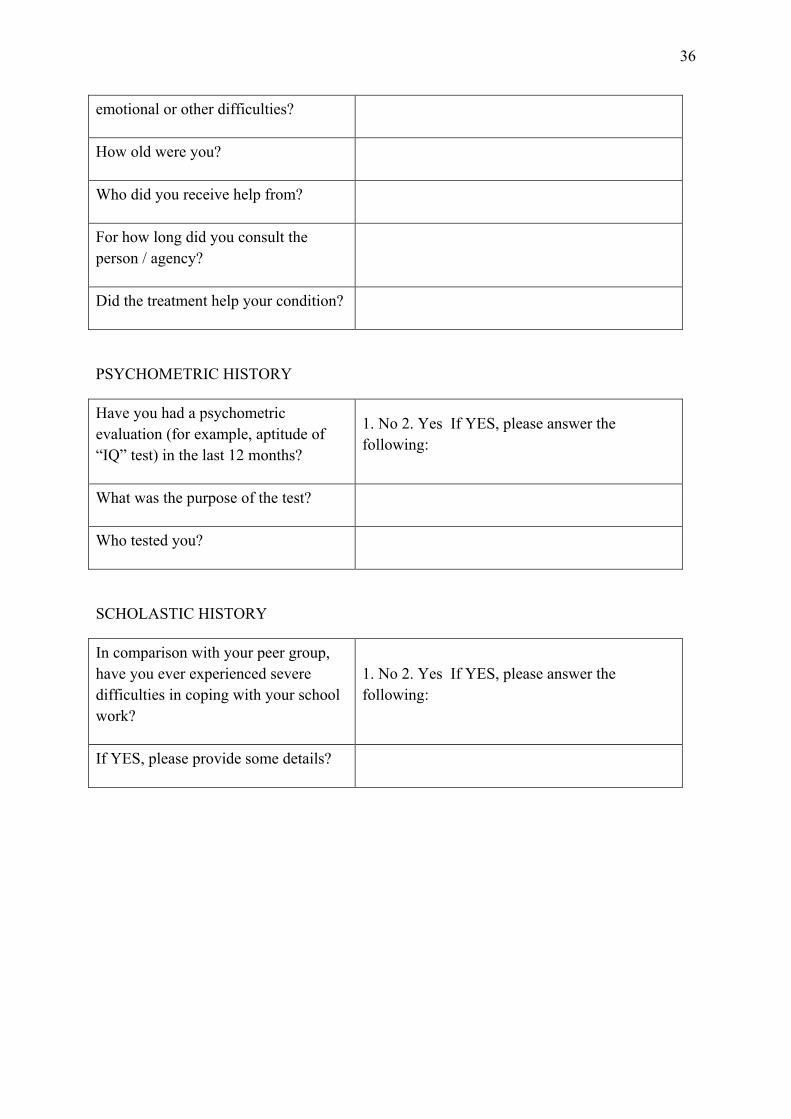
36
emotional or other difficulties?
How old were you?
Who did you receive help from?
For how long did you consult the person / agency?
Did the treatment help your condition?
PSYCHOMETRIC HISTORY
Have you had a psychometric evaluation (for example, aptitude of “IQ” test) in the last 12 months?
1. No 2. Yes If YES, please answer the following:
What was the purpose of the test?
Who tested you?
SCHOLASTIC HISTORY
In comparison with your peer group, have you ever experienced severe difficulties in coping with your school work?
1. No 2. Yes If YES, please answer the following:
If YES, please provide some details?
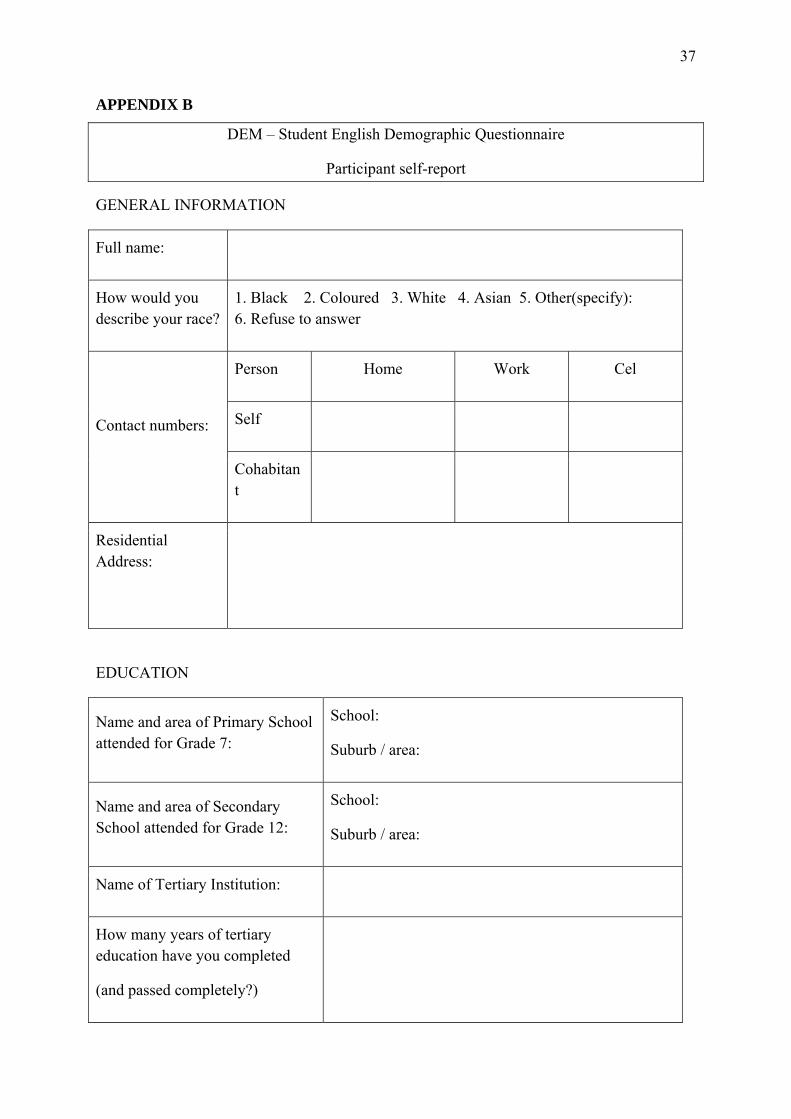
37
APPENDIX B
DEM – Student English Demographic Questionnaire
Participant self-report
GENERAL INFORMATION
Full name:
How would you describe your race?
1. Black 2. Coloured 3. White 4. Asian 5. Other(specify): 6. Refuse to answer
Person Home Work Cel
Self Contact numbers:
Cohabitant
Residential Address:
EDUCATION
Name and area of Primary School attended for Grade 7:
School:
Suburb / area:
Name and area of Secondary School attended for Grade 12:
School:
Suburb / area:
Name of Tertiary Institution:
How many years of tertiary education have you completed
(and passed completely?)
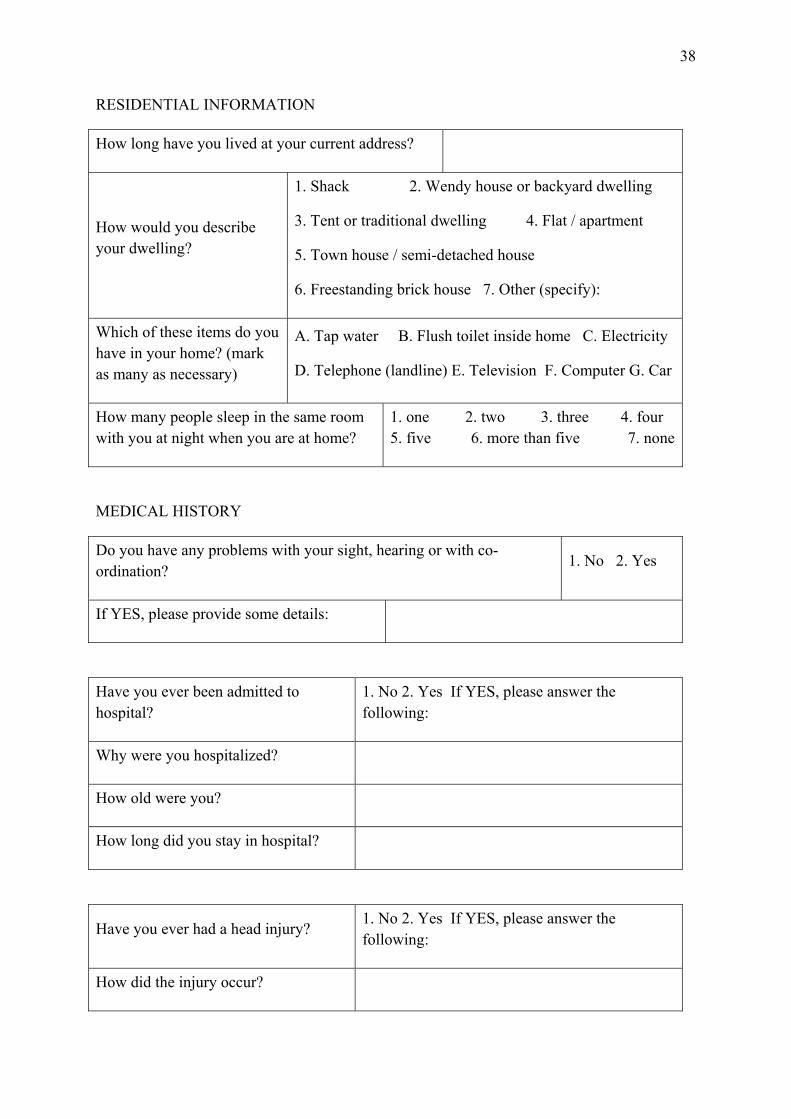
38
RESIDENTIAL INFORMATION
How long have you lived at your current address?
How would you describe your dwelling?
1. Shack 2. Wendy house or backyard dwelling
3. Tent or traditional dwelling 4. Flat / apartment
5. Town house / semi-detached house
6. Freestanding brick house 7. Other (specify):
Which of these items do you have in your home? (mark as many as necessary)
A. Tap water B. Flush toilet inside home C. Electricity
D. Telephone (landline) E. Television F. Computer G. Car
How many people sleep in the same room with you at night when you are at home?
1. one 2. two 3. three 4. four 5. five 6. more than five 7. none
MEDICAL HISTORY
Do you have any problems with your sight, hearing or with co-ordination?
1. No 2. Yes
If YES, please provide some details:
Have you ever been admitted to hospital?
1. No 2. Yes If YES, please answer the following:
Why were you hospitalized?
How old were you?
How long did you stay in hospital?
Have you ever had a head injury? 1. No 2. Yes If YES, please answer the following:
How did the injury occur?
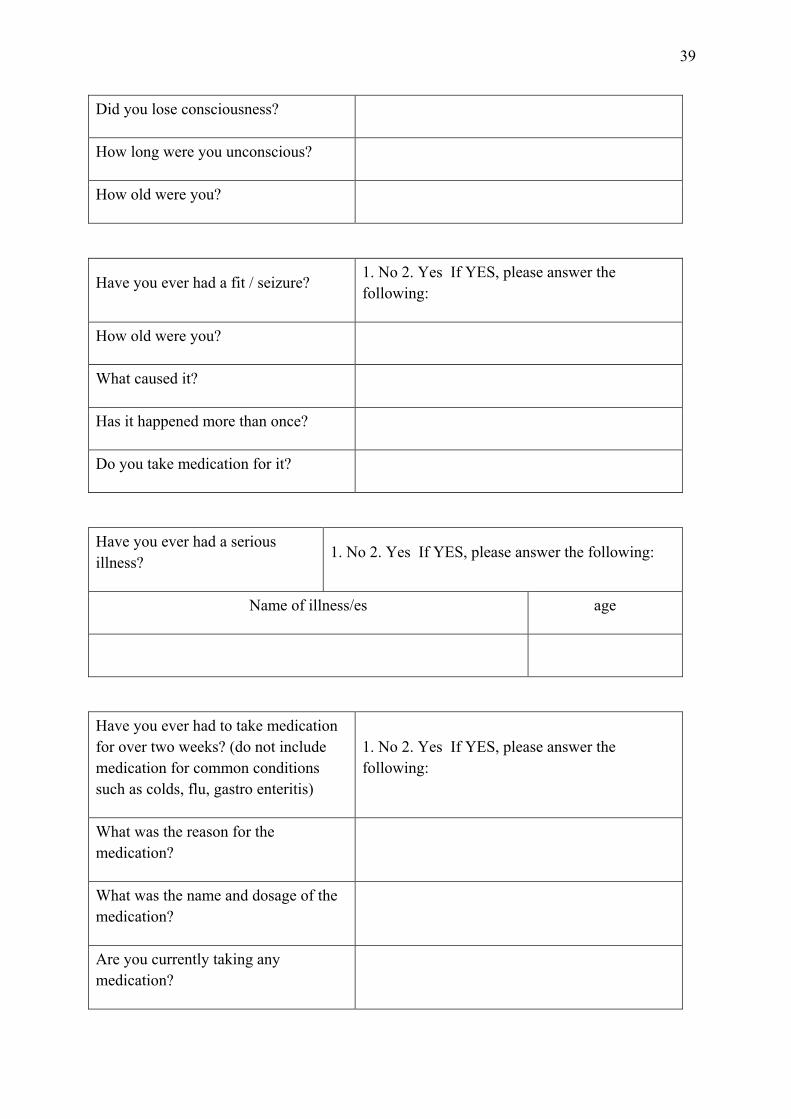
39
Did you lose consciousness?
How long were you unconscious?
How old were you?
Have you ever had a fit / seizure? 1. No 2. Yes If YES, please answer the following:
How old were you?
What caused it?
Has it happened more than once?
Do you take medication for it?
Have you ever had a serious illness?
1. No 2. Yes If YES, please answer the following:
Name of illness/es age
Have you ever had to take medication for over two weeks? (do not include medication for common conditions such as colds, flu, gastro enteritis)
1. No 2. Yes If YES, please answer the following:
What was the reason for the medication?
What was the name and dosage of the medication?
Are you currently taking any medication?
40
What is the reason for the medication?
What is the name and dosage of the medication?
PSYCHIATRIC HISTORY
Have you ever sought counselling (at school, church or elsewhere) for emotional or other difficulties?
1. No 2. Yes If YES, please answer the following:
How old were you?
Who did you receive help from?
For how long did you consult the person / agency?
Did the treatment help your condition?
PSYCHOMETRIC HISTORY
Have you had a psychometric evaluation (for example, aptitude of “IQ” test) in the last 12 months?
1. No 2. Yes If YES, please answer the following:
What was the purpose of the test?
Who tested you?
SCHOLASTIC HISTORY
In comparison with your peer group, have you ever experienced severe difficulties in coping with your school work?
1. No 2. Yes If YES, please answer the following:
If YES, please provide some details?
41
APPENDIX C
ENGLISH CHILD ASSENT, PARENT CONSENT AND INFORMATION LEAFLET
RESEARCH PROJECT NUMBER: NO8/08/227 RESEARCH PROJECT TITLE: Comparing the utility of South African adaptations of the Wechsler Abbreviated Scale of Intelligence, the Controlled Oral Word Association Test and the Boston Naming Test for English, Afrikaans and Xhosa-speaking 8-25 year olds in the Western Cape Province.
INVESTIGATORS: Mrs H. Ferrett (PI), Dr P. Carey, Dr K. Thomas
Dear Volunteer
Why is this study being done? A research study is a way to learn more about something. A team of researchers from the Universities of Stellenbosch and Cape Town are trying to learn more about the ways in which children’s brains develop. Many of the tests (called neuropsychological tests) that we use come from other countries. We want to be able to use these tests in South Africa, for children who speak English, Afrikaans or Xhosa. Who can take part in the study? Learners who are at school, older than 8 years and have passed Grade 1 may take part in this study. If you speak English, Afrikaans or Xhosa as your home language, you may take part. We will ask your parent/guardian to fill in a form for us which will tell us if you have ever had any serious medical problems. If you have had serious problems with your health or schooling, you will not be able to take part in this study, but you may be able to take part in some of our other studies. What will happen to you if you agree to take part in this study? If you agree to take part in the study, a researcher will visit you twice at your school during school hours. At the first visit, the researcher will explain everything to you and answer any questions or concerns you may have. You will be asked to fill in a form to give us some information about yourself. The researcher will help you to complete the form if you need help. You will be given a form to take home for your parent/guardian to read and to sign if they agree to let you take part. If they agree, they will also be asked to fill in a short questionnaire giving us some information about your medical history and where you live. Once you have returned the forms to the school, the researcher will arrange a time and date for you to be tested. At the second visit, you will be tested by yourself in a quiet room in your school. You will be asked to answer some questions and do some activities like naming things or describing things to us. You do not have to study for the “test” and you are not expected to get everything correct. All you will be asked to do is to try your best. The test will take about one hour. The tests will not hurt you in any way. You may feel a bit tired during the tests, so the researcher will allow you to take short breaks. If you feel too tired to
42
complete the tests on the second visit, the researcher will arrange to finish the test with you on another day.
What will happen to the information you give us?
If you agree to take part, the researcher will use a code for the information about you. This means that the information that you give us will be kept private and your name will not be used.
Do you have to pay to take part?
You don’t have to pay anything to take part in this study. If you fill in all the forms and complete the tests, we will give you a gift voucher for R50. This is our way of thanking you for taking part in the study.
Do you have to take part in the study?
You do not have to take part in the study. It is up to you and your parent/guardian to decide whether you want to take part or not. If you want to take part, we would like you and your parent/ guardian to write your names and signatures on this form. If you sign the papers now and then decide to change your mind later, all you have to do is to tell us that you don’t want to take part anymore. No-one will get cross with you if you decide not to take part, or if you agree to take part and then change your mind later.
What if you have any questions?
If you have any questions about this study, you may ask the researcher about them during one of the visits, or later on. You can phone Mrs Alexander on 021 938 9771 or 073 548 3928 between 08h30 and 16h30 on weekdays if you have any more questions.
If you (the learner) agree to take part in this study and you understand what the researcher has explained to you, please write and sign your name below:
Child’s name: ___________________________________________
Child’s signature: ________________________________________
Date: __________________ Place: ________________________________ If your parent or guardian has read this form and allows you to take part in the study, please ask him/her to sign his/her name below:
43
Parent (or guardian’s) name: _______________________________
Parent (or guardian’s) signature ____________________________
Date: __________________ Place: ________________________________
The researcher must sign his/her name below to confirm that he/she has explained the study to you in your home language and answered the questions you have about it:
Researcher’s name: ______________________________________
Researcher’s signature: ___________________________________
Date: __________________ Place: ________________________________
44
APPENDIX D
ENGLISH STUDENT CONSENT AND INFORMATION LEAFLET RESEARCH PROJECT NUMBER: NO8/08/227 RESEARCH PROJECT TITLE: Comparing the utility of South African adaptations of the Wechsler Abbreviated Scale of Intelligence, the Controlled Oral Word Association Test and the Boston Naming Test for English, Afrikaans and Xhosa-speaking 8-25 year olds in the Western Cape Province.
INVESTIGATORS: Mrs H. Ferrett (PI), Dr P. Carey, Dr K. Thomas
Dear Volunteer
Why is this study being done? A research study is a way to learn more about something. A team of researchers from the Universities of Stellenbosch and Cape Town are trying to learn more about the ways in which people’s brains develop. Many of the tests (called neuropsychological tests) that we use come from other countries. We want to be able to use these tests in South Africa, for people who speak English, Afrikaans or Xhosa. Who can take part in the study? Learners who are at school, older than 8 years and have passed Grade 1 and students attending tertiary education institutions may take part in this study. If you speak English, Afrikaans or Xhosa as your home language, you may take part. If you have had serious problems with your health or schooling, you will not be able to take part in this study, but you may be able to take part in some of our other studies. What will happen to you if you agree to take part in this study? If you agree to take part in the study, you will have two appointments with a researcher. At the first visit, the researcher will explain everything to you and answer any questions or concerns you may have. You will be asked to fill in a form to give us some information about yourself and to sign the consent form. You will also be asked to bring a copy of your matriculation certificate in a sealed envelope. The researcher will give the envelope to the Principal Investigator, who will make sure that the information is appropriately coded so that it is anonymous. At the second visit, you will be tested by yourself in a quiet room at one of the universities involved in the study. You will be asked to answer some questions and do some activities like naming things or describing things to us. You do not have to study for the “test” and you are not expected to get everything correct. All you will be asked to do is to try your best. The test will take about one hour. The tests will not hurt you in any way. You may feel a bit tired during the tests, so the researcher will allow you to take short breaks. If you feel too tired to complete the tests on the second visit, the researcher will arrange to finish the test with you on another day.
What will happen to the information you give us?
45
If you agree to take part, the researcher will use a code for the information about you. This means that the information that you give us will be kept private and your name will not be used.
Do you have to pay to take part?
You don’t have to pay anything to take part in this study. If you fill in all the forms and complete the tests, you will be given credits for research participation.
Do you have to take part in the study?
You do not have to take part in the study. It is up to you to decide whether you want to take part or not. If you want to take part, we would like you to write your name and signature on this form. If you sign the papers now and then decide to change your mind later, all you have to do is to tell us that you don’t want to take part anymore. No-one will get cross with you if you decide not to take part, or if you agree to take part and then change your mind later.
What if you have any questions?
If you have any questions about this study, you may ask the researcher about them during one of the visits, or later on. You can also phone one of the researchers, who will provide his/her contact details during working hours.
If you agree to take part in this study and you understand what the researcher has explained to you, please write and sign your name below:
Student’s name: _____________________________________________
Student’s signature: __________________________________________
Date: ___________________ Place: ____________________________________
Researcher’s name: __________________________________________
Researcher’s signature: _______________________________________
Date: ___________________ Place: ____________________________________

46
APPENDIX E
COWAT SA Phonemic Fluency: First Letter Set: 1. L, 2. B, 3. S
I will say a letter of the alphabet. Then you must name as many words that
begin with that letter as quickly as you can. For example, if I say D, you might give me DOG, DATE, DIRTY. Do not
use words which begin with capital letters, like DURBAN or DAVID. Also, don't use the same word with different
endings, like DIG, DIGGER, DIGGING. Do you have any questions?
Start when I say the letter... (L,B,S)
Ek gaan ‘n letter van die alphaber sê. Dan moet jy so veel moontlik woorde sê wat met daardie letter begin, so gou as wat jy kan. Byvoorbeeld, as ek D sê, mag jy DOM, DONKER, DOF sê. Moenie woorde gebruik wat met
hoofletters begin nie, soos DURBAN en DAWID. Moenie dieselfde woord
gebruik met verskillende eindes nie, soos DEEL, DEELTEKEN. Het jy
enige vrae?
Begin as ek die letter noem... (L,B,S)
Some repetitions may be acceptable if an alternate meaning was intended by the examinee (e.g. SUN and SON). Clarify any ambiguous, inaudible or unknown words at the end of the relevant letter.
Begin as soon as the examiner says the letter.
Stop after one minute.
If the examinee discontinues before the end of the period, encourage him/her to produce more words.
Time one minute, but allow extra time if instructions are repeated during administration.
Mark 15 second interval divisions.
Score later.
Record answers verbatim.
Record Errors later (Repetitions, Rule Violations, Set Loss Errors).
INFO
STOP
SAY
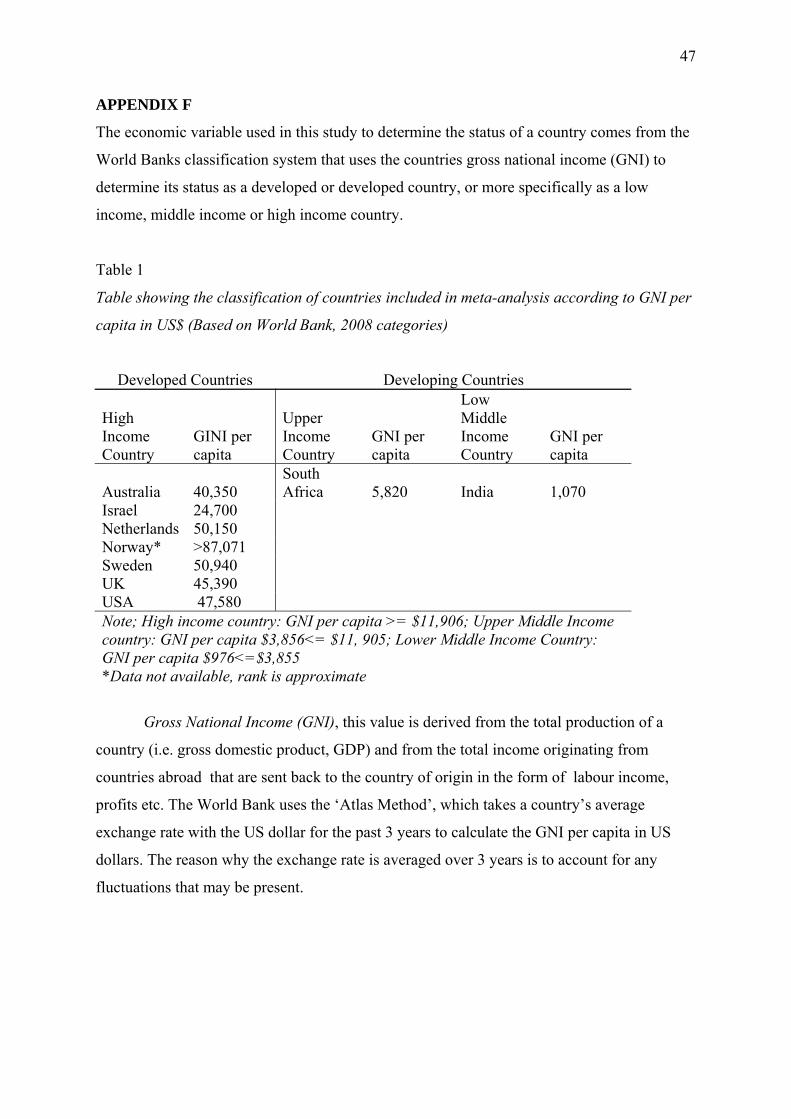
47
APPENDIX F
The economic variable used in this study to determine the status of a country comes from the
World Banks classification system that uses the countries gross national income (GNI) to
determine its status as a developed or developed country, or more specifically as a low
income, middle income or high income country.
Table 1
Table showing the classification of countries included in meta-analysis according to GNI per
capita in US$ (Based on World Bank, 2008 categories)
Developed Countries Developing Countries
High Income Country
GINI per capita
Upper Income Country
GNI per capita
Low Middle Income Country
GNI per capita
Australia 40,350 South Africa 5,820 India 1,070
Israel 24,700 Netherlands 50,150 Norway* >87,071 Sweden 50,940 UK 45,390 USA 47,580 Note; High income country: GNI per capita >= $11,906; Upper Middle Income country: GNI per capita $3,856<= $11, 905; Lower Middle Income Country: GNI per capita $976<=$3,855 *Data not available, rank is approximate
Gross National Income (GNI), this value is derived from the total production of a
country (i.e. gross domestic product, GDP) and from the total income originating from
countries abroad that are sent back to the country of origin in the form of labour income,
profits etc. The World Bank uses the ‘Atlas Method’, which takes a country’s average
exchange rate with the US dollar for the past 3 years to calculate the GNI per capita in US
dollars. The reason why the exchange rate is averaged over 3 years is to account for any
fluctuations that may be present.
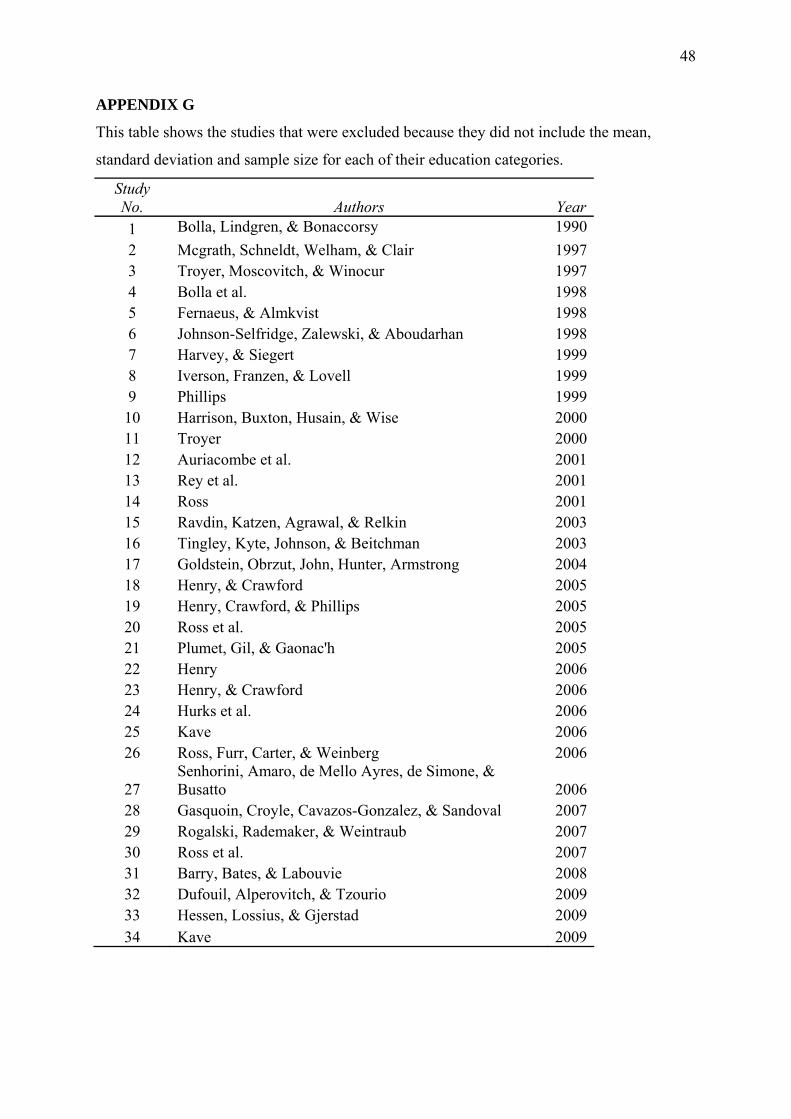
48
APPENDIX G
This table shows the studies that were excluded because they did not include the mean,
standard deviation and sample size for each of their education categories.
Study No. Authors Year 1 Bolla, Lindgren, & Bonaccorsy 1990 2 Mcgrath, Schneldt, Welham, & Clair 1997 3 Troyer, Moscovitch, & Winocur 1997 4 Bolla et al. 1998 5 Fernaeus, & Almkvist 1998 6 Johnson-Selfridge, Zalewski, & Aboudarhan 1998 7 Harvey, & Siegert 1999 8 Iverson, Franzen, & Lovell 1999 9 Phillips 1999 10 Harrison, Buxton, Husain, & Wise 2000 11 Troyer 2000 12 Auriacombe et al. 2001 13 Rey et al. 2001 14 Ross 2001 15 Ravdin, Katzen, Agrawal, & Relkin 2003 16 Tingley, Kyte, Johnson, & Beitchman 2003 17 Goldstein, Obrzut, John, Hunter, Armstrong 2004 18 Henry, & Crawford 2005 19 Henry, Crawford, & Phillips 2005 20 Ross et al. 2005 21 Plumet, Gil, & Gaonac'h 2005 22 Henry 2006 23 Henry, & Crawford 2006 24 Hurks et al. 2006 25 Kave 2006 26 Ross, Furr, Carter, & Weinberg 2006
27 Senhorini, Amaro, de Mello Ayres, de Simone, & Busatto 2006
28 Gasquoin, Croyle, Cavazos-Gonzalez, & Sandoval 2007 29 Rogalski, Rademaker, & Weintraub 2007 30 Ross et al. 2007 31 Barry, Bates, & Labouvie 2008 32 Dufouil, Alperovitch, & Tzourio 2009 33 Hessen, Lossius, & Gjerstad 2009 34 Kave 2009
49
Plagiarism Declaration
1. I know that plagiarism is wrong. Plagiarism is to use another's work and pretend that it is
one's own.
2. I have used the APA convention for citation and referencing. Each contribution to, and
quotation in, this thesis from the work(s) of other people has been attributed, and has been
cited and referenced.
3. This essay thesis is my own work.
4. I have not allowed, and will not allow, anyone to copy my work with the intention of
passing it off as his or her own work.
5. I acknowledge that copying someone else’s assignment or essay, or part of it, is wrong, and
declare that this is my own work.
Date: 29 October 2009
Signature: ......................................
Full Name of Student: Angela Lesley Baufeldt