Embed Size (px)
Citation preview

1 Revised Upper Limb Module for Spinal Muscular Atrophy: 12 month changes 1
2
Maria Carmela Pera1,2¶, Giorgia Coratti1,2¶, Elena S. Mazzone1¶, Jacqueline Montes3,4, 3
Mariacristina Scoto5, Roberto De Sanctis1,2, Marion Main5, Anna Mayhew6, Robert Muni Lofra6, 4
Sally Dunaway Young3,4, Allan M. Glanzman7, Tina Duong8, Amy Pasternak9,10, Danielle Ramsey5, 5
Basil Darras9, John W. Day8, Richard S. Finkel11, Darryl C. De Vivo4, Maria Pia Sormani12, 6
Francesca Bovis12, Volker Straub6, Francesco Muntoni5,13, Marika Pane1,2&, Eugenio 7
Mercuri1,2&*, for the iSMAC Consortium Group. 8
¶All first authors 9
&Both senior authors 10
1Paediatric Neurology Unit, Catholic University, and 2Centro Nemo, Fondazione Gemelli, Rome, 11
Italy 12
3Departments of Rehabilitation and Regenerative Medicine, Columbia University Medical 13
Center, New York, USA 14
4Departments of Neurology, Columbia University Medical Center, New York, USA 15
5Dubowitz Neuromuscular Centre, UCL Institute of Child Health & Great Ormond Street Hospital, 16
London 17
6John Walton Muscular Dystrophy Research Centre, Newcastle University, UK 18
7Department of Physical Therapy, The Children's Hospital of Philadelphia, Philadelphia 19
8Department of Neurology, Stanford University, Stanford, California, USA 20
9Department of Neurology, Boston Children's Hospital, Harvard Medical School, Boston, MA, 21
USA 22
10 Department of Physical Therapy and Occupational Therapy, Boston Children’s Hospital, 23
Boston, MA, USA 24

2 11Nemours Children’s Hospital, University of Central Florida College of Medicine, Orlando, USA 25
12Biostatistics Unit, Department of Health Sciences, University of Genoa, Italy 26
13. NIHR Great Ormond Street Hospital Biomedical Research Centre, London, UK. 27
Corresponding author: 28
Eugenio Mercuri 29
Pediatric Neurology, Catholic University 30
Largo Gemelli 8, 00168 Rome, Italy 31
Tel.: +390630155340; fax: +390630154363 32
E-mail: [email protected] 33

3 Abstract 34
The aim of the study was to use the Revised Upper Limb Module functional scale to assess 35
longitudinal 12 month changes in type 2 and 3 patients affected by spinal muscular atrophy 36
and to identify possible trajectories of progression according to age or functional status. 37
The study included 114 patients, 60 type 2 and 54 type 3 (32 ambulant and 22 non-ambulant). 38
Their age ranged between 30 months and 49 years. The 12 month changes on the Revised 39
Upper Limb Module ranged between -7 and 9 (mean -0.41; SD 2.93). The mean changes were 40
not significantly different between the three spinal muscular atrophy (SMA) groups (-0.45 in 41
type 2, -0.23 in non-ambulant type 3 and -0.34 in ambulant type 3, p=0.96) and the relationship 42
between 12 month change and age classes was not significantly different among the three 43
types of SMA patients. 44
Some patterns of changes however occurred more frequently in some age and functional 45
categories. Improvements were mainly seen in children below the age of 5 years. Negative 46
changes >2 points were more common in type 2 compared to type 3. In type 2 the highest rate 47
of deterioration was found between the age of 5 and 14 while in ambulant patients loss of 48
upper limb function occurred more frequently in older individuals. 49
Our results confirm that the Revised Upper Limb Module explores a wide range of functional 50
abilities and can be used in ambulant and non-ambulant patients of different ages. Although 51
the overall mean 12 month changes were relatively small, age and functional status appear to 52
have some effect on the patterns of changes. This information can be of help at the time of 53
designing clinical trials. 54

4 Introduction 55
There is a growing need for robust clinical measures to assess upper limb motor function in 56
spinal muscular atrophy (SMA), in conjunction with the available gross motor scales which 57
however may lack sensitivity at the extremes of the clinical spectrum[1, 2]. 58
The Revised Upper Limb Module (RULM) was recently designed [3] as a revision of the Upper 59
Limb Module (ULM)[4] originally developed to assess aspects of upper limb function in the 60
weaker end of the SMA spectrum from the age of 30 months onwards. 61
The RULM includes a number of additional items that expand the spectrum of upper limb 62
activities originally included in the ULM in order to reduce the risk of ceiling effect in stronger 63
children. The revised scale has been shown to measure the same construct as the original ULM 64
and has shown robust psychometric properties[3]. While this reliability, validity and suitability 65
of the scale in a multi-center clinical research setting have been published[3], there is yet no 66
longitudinal data on the RULM. 67
The aim of the study was to provide longitudinal 12 month natural history data in a large cohort 68
of type 2 and 3 SMA patients using the RULM. More specifically, we wished to establish if the 69
revision of the scale adequately addressed the ceiling effect of the ULM original version. As the 70
study population ranged from weak non-ambulant to stronger ambulant patients, we also 71
aimed to identify if there were different trajectories according to functional status. 72
73
Materials and Methods 74
The study was performed by collecting longitudinal 12 month data within three national SMA 75
networks across USA, Italy and UK. All patients had a genetically confirmed diagnosis of SMA 76
and only those with a diagnosis of type 2 and 3 SMA were included in the study. To reduce 77
selection bias, all patients seen in the neuromuscular clinics who were older than 30 months 78
and who were not participating in any interventional clinical trial were consecutively offered 79

5 enrollment. Only patients with two assessments at 12 month interval were selected for this 80
study. Patients in whom one of the two performances was affected by fractures, transient pain 81
episodes, recent respiratory infections, or any other factor that affected temporarily one of the 82
two motor performances, were excluded from the analysis. 83
84
RULM 85
The scale consists of an entry item to establish functional levels and 19 items covering distal to 86
proximal movements [3]. The entry item is a modified version of the Brooke scale, including 87
activities ranging from no functional use of hands (score 0) to full bilateral shoulder abduction 88
(score 6). The entry item does not contribute to the total score but serves as a functional 89
classification of overall upper limb functional ability. Of the remaining 19 items, 18 are scored 90
on a 3 point scoring system and 1 item is scored on a 2 point scoring system. The total score 91
ranges from 0, if all the items cannot be performed, to 37, if all the activities are achieved fully 92
without any compensation. All items were tested without spinal jacket or orthoses. 93
Patients received the test at two time points at 12+ 2 months apart. 94
95
Evaluator training sessions 96
The physical therapist in the participating clinics received the same training programs with 97
establishment of yearly intra and inter-rater reliability, and standardized procedures of scale 98
administration. 99
Inter and intra observer reliability of the RULM have already been reported[3]. 100
101
Statistical analysis 102
The RULM was evaluated longitudinally over a 12 month period of time. Summary statistics (N, 103
mean, median, SD, range) were used. 104
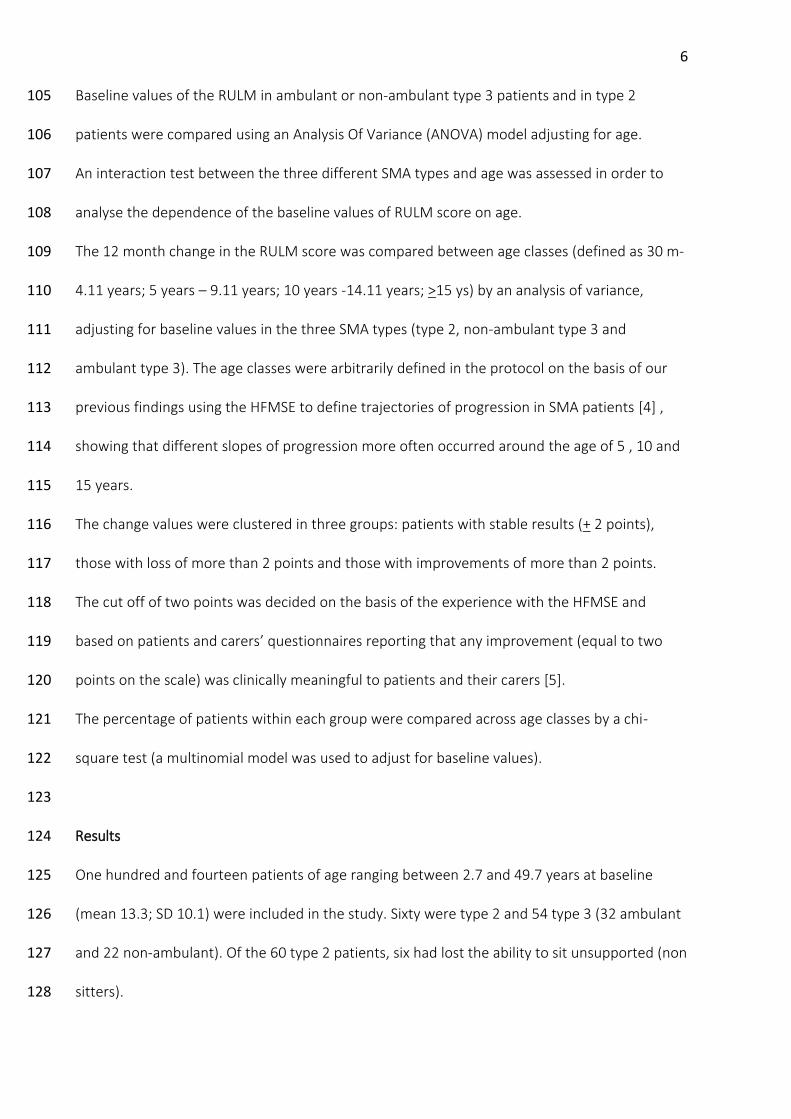
6 Baseline values of the RULM in ambulant or non-ambulant type 3 patients and in type 2 105
patients were compared using an Analysis Of Variance (ANOVA) model adjusting for age. 106
An interaction test between the three different SMA types and age was assessed in order to 107
analyse the dependence of the baseline values of RULM score on age. 108
The 12 month change in the RULM score was compared between age classes (defined as 30 m-109
4.11 years; 5 years – 9.11 years; 10 years -14.11 years; >15 ys) by an analysis of variance, 110
adjusting for baseline values in the three SMA types (type 2, non-ambulant type 3 and 111
ambulant type 3). The age classes were arbitrarily defined in the protocol on the basis of our 112
previous findings using the HFMSE to define trajectories of progression in SMA patients [4] , 113
showing that different slopes of progression more often occurred around the age of 5 , 10 and 114
15 years. 115
The change values were clustered in three groups: patients with stable results (+ 2 points), 116
those with loss of more than 2 points and those with improvements of more than 2 points. 117
The cut off of two points was decided on the basis of the experience with the HFMSE and 118
based on patients and carers’ questionnaires reporting that any improvement (equal to two 119
points on the scale) was clinically meaningful to patients and their carers [5]. 120
The percentage of patients within each group were compared across age classes by a chi-121
square test (a multinomial model was used to adjust for baseline values). 122
123
Results 124
One hundred and fourteen patients of age ranging between 2.7 and 49.7 years at baseline 125
(mean 13.3; SD 10.1) were included in the study. Sixty were type 2 and 54 type 3 (32 ambulant 126
and 22 non-ambulant). Of the 60 type 2 patients, six had lost the ability to sit unsupported (non 127
sitters). 128

7 At baseline the RULM scores ranged between 0 and 37 (mean 22.6; SD 10.5). At 12 months the 129
scores ranged between and 0 and 37 (mean 22.2; SD 10.7). 130
Figure 1 shows details of the distribution of scores at baseline according to age and to 131
functional status. The maximum score (37) was found in 13 of the 114 (11.4%) who were, with 132
two exceptions, ambulant patients. 133
134
>>>> Fig 1. Baseline distribution of scores according to age and to functional status. Curves 135
represent the resulting fits to a LOESS model. 136
Baseline values of RULM scores were significantly different between type 2, and type 3 137
ambulant and non-ambulant patients. The mean value was 14.8 (SD=6.6) in type 2 patients, 138
27.4 (SD=6.9) in non-ambulant type 3 and 34.2 (SD=3.7) in ambulant type 3 patients (p<.0001, 139
adjusting for age). Six of the 60 type 2 patients were non sitters, their scores ranged between 0 140
and 17 (mean 10.83, SD 6.85) . As the number of the non sitters was small, for statistical 141
purposes they were kept within the type 2 group. Details of the scores of the non sitters are 142
shown in figure 1 and 3. 143

8 The interaction between the three SMA groups and age was significant (p=0.011). There was a 144
significant association with the four age levels (<4 ys; 5 ys - 9 ys; 10 ys -14 ys; >15 ys) in 145
ambulant type 3 patients (p=0.002), while there was no association with age in type 2 and non-146
ambulant type 3 patients (p=0.12 and p=0.14, respectively). 147
148
12 month changes 149
The changes ranged between -7 and 9 (mean -0.41; SD 2.93). Table 1 shows details of the 150
changes subdivided by functional status and age groups. 151
Mean change (SD) <-2 +2 >2
All (n:114) -0.4 (+2.9) 20%(n:23) 67% (n:76) 13% (n:15)
<4 (n:16) 1.2 (+4.7) 31% (n:5) 25% (n:4) 44% (n:7)
5-9 (n:38) -0.3 (+2.4) 18% (n:7) 71% (n:27) 11% (n:4)
10-14 (n:33) -1.1 (+2.6) 21% (n:7) 73% (n:24) 6% (n:2)
>15 (n:27) -0.6 (+2.3) 15% (n:4) 78% (n:21) 7% (n:2)
Type II (n:60) -0.5 (+3.0) 23%(n:14) 60% (n:36) 17% (n:10)
<4 (n:10) 0.9 (+4.2) 30% (n:3) 30% (n:3) 40% (n:4)
5-9 (n:19) -0.9 (+2.9) 32% (n:6) 53% (n:10) 16% (n:3)
10-14 (n:17) -1.5(+2.9) 29% (n:5) 65% (n:11) 6% (n:1)
>15 (n:14) 0.2 (+1.8) 0% (n:0) 86% (n:12) 14% (n:2)
Non ambulant III (n:22) -0.2 (+2.7) 18%(n:4) 73% (n:16) 9% (n:2)
<4 (n:0) N/A 0%(n:0) 0% (n:0) 0% (n:0)
5-9 (n:7) 1 (+2.4) 14% (n:1) 71% (n:5) 14% (n:1)
10-14 (n:9) -0.2(+2.9) 11% (n:1) 78% (n:7) 11% (n:1)
>15 (n:6) -1.7 (+2.4) 33% (n:2) 67% (n:4) 0% (n:0)
Ambulant (n:32) -0.3(+3.0) 16%(n:5) 75% (n:24) 9% (n:3)
<4 (n:6) 1.8 (+5.8) 33% (n:2) 17% (n:1) 50% (n:3)
9 5-9 (n:12) -0.2 (+1.0) 0% (n:0) 100% (n:12) 0% (n:0)
10-14 (n:7) -1.4 (+2.5) 14% (n:1) 86% (n:6) 0% (n:0)
>15 (n:7) -1.4 (+2.7) 29% (n:2) 71% (n:5) 0% (n:0)
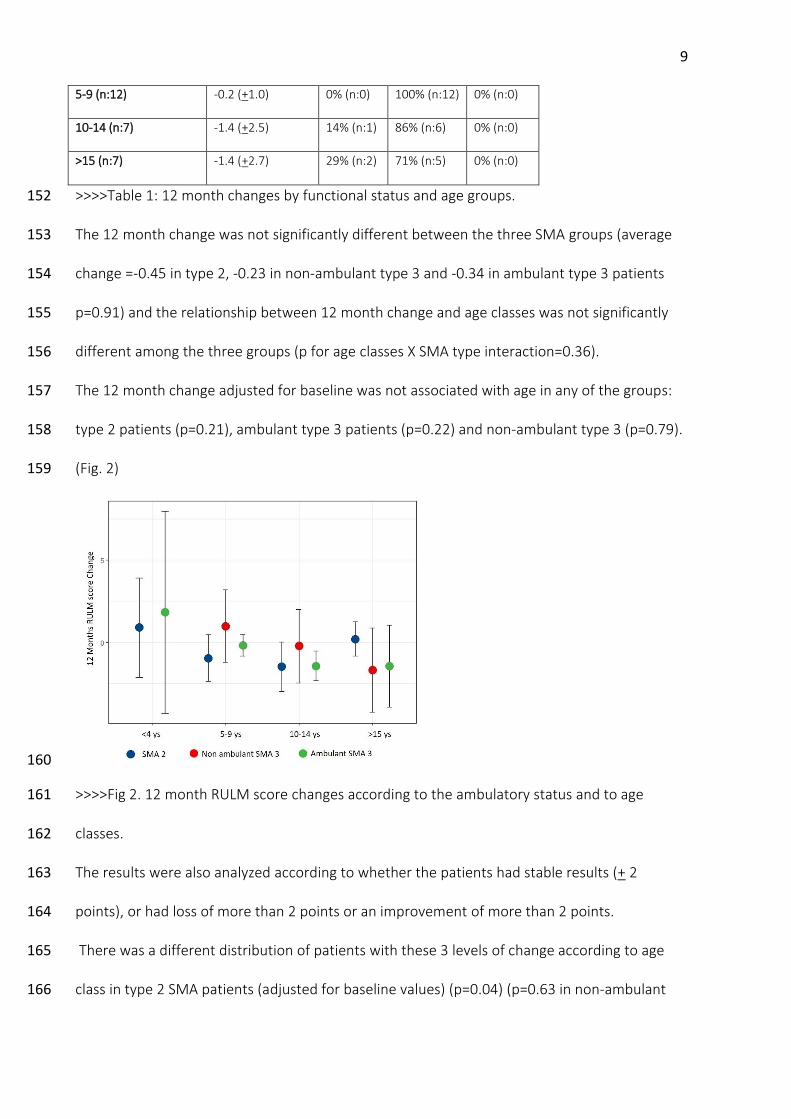
>>>>Table 1: 12 month changes by functional status and age groups. 152
The 12 month change was not significantly different between the three SMA groups (average 153
change =-0.45 in type 2, -0.23 in non-ambulant type 3 and -0.34 in ambulant type 3 patients 154
p=0.91) and the relationship between 12 month change and age classes was not significantly 155
different among the three groups (p for age classes X SMA type interaction=0.36). 156
The 12 month change adjusted for baseline was not associated with age in any of the groups: 157
type 2 patients (p=0.21), ambulant type 3 patients (p=0.22) and non-ambulant type 3 (p=0.79). 158
(Fig. 2) 159
160
>>>>Fig 2. 12 month RULM score changes according to the ambulatory status and to age 161
classes. 162
The results were also analyzed according to whether the patients had stable results (+ 2 163
points), or had loss of more than 2 points or an improvement of more than 2 points. 164
There was a different distribution of patients with these 3 levels of change according to age 165
class in type 2 SMA patients (adjusted for baseline values) (p=0.04) (p=0.63 in non-ambulant 166

10 type 3 SMA patients and p=0.11 in ambulant type 3 SMA patients). 167
168
>>>>Fig 3. 12 month changes by age. 169
Figure 4 shows details of the mean changes according to entry level. There was no difference in 170
trajectories among the different subgroups (p=0.48). 171
172
>>>>Fig 4. Mean 12 month changes according to entry level. (—∙∙—: Entry level 1; ——: Entry 173
level 2; —∙—: Entry level 3; — —: Entry level 4; —: Mean all groups; ∙∙∙∙∙∙: Entry level 5; : 174
Entry level 6) 175
Discussion 176
Until recently upper limb function has not been systematically assessed in SMA ambulant 177
patients[1] as for ambulant patients upper limb impairment was generally not reported as one 178

11 of the major concerns. In these patients the clinical assessment mainly focused on ambulatory 179
performance and range of motion. Our results show that the RULM can capture upper limb 180
function in a broad range of SMA patients, from non sitters to ambulatory patients. Only one of 181
the non sitters had a RULM score of 0, with the others ranging between 6 and 17. At the other 182
end of the spectrum, ceiling effect was reached in 11.4% of the whole cohort and 183
approximately in a third of the ambulant subgroup, these findings suggesting that upper limb 184
function should be assessed also in ambulant patients who may not complain of upper limb 185
weakness or functional impairment. 186
Baseline values of RULM score were different between type 2, type 3 non-ambulant and 187
ambulant patients. Over 12 months, the mean change in the whole cohort was less than one 188
point even though changes ranged between -7 and +9. The relationship between 12 month 189
change and age classes were not significantly different among the three SMA groups patients. 190
The lack of significance is probably at least partly related to the fact that the youngest group 191
(below the age of 5 years), which mainly included non-ambulant children, had a very 192
heterogeneous pattern of changes. 193
Nevertheless, we were still able to identify some patterns of changes that occurred more 194
frequently in some age and functional categories, reinforcing our previous observation using 195
the Hammersmith Functional Motor Scale Expanded (HFMSE)[5]. 196
Approximately 2/3 of the whole cohort had changes within +2 points, with type 3 patients 197
remaining more often stable (73%) than type 2 (63%). It is of interest that the magnitude of 198
changes and percentage of stable results in non-ambulant type 3 patients was more similar to 199
the ambulant type 3 than to the type 2 patients. In the past there has been a tendency to 200
cluster type 2 and non-ambulant type 3 patients as they share several common clinical features 201
such as scoliosis, joints affected by contracture and muscle weakness patterns. This does not 202
appear to be the case for upper limb function as even after loss of ambulation, patients with 203

12 type 3 SMA have RULM results more similar to those found in ambulant patients. The 204
distribution of patients with these 3 levels of change according to age class was different in 205
type 2 SMA patients (adjusted for baseline values) (p=0.05) but not for the other groups. 206
Improvements were mainly seen in children below the age of 5 years similarly to previous 207
reports of gross motor assessments [5, 6]. These probably reflect development, growth and to 208
some extent improvement in cooperation and understanding. The items that more frequently 209
did not have a full score in young children are tearing the paper, opening container and lifting 210
weights above shoulder height. It is of interest however that only a minority showed an 211
improvement of 5 points or more, as observed in recently reported clinical trials[7]. 212
Negative changes >2 points were observed in 20% of the whole cohort, and were more 213
common in type 2 compared to type 3. Similarly to HFMSE[5], in type 2 the highest rate of 214
deterioration was observed between the age of 5 and 14 years. Although the number of older 215
ambulant patients included in this study was very small, it appears that a loss of upper limb 216
function may occur more frequently at a later age compared to type 2. 217
As the RULM has an entry item based on the Brooke scale[8] that is able to classify upper limb 218
performance into broad functional levels, we were interested in establishing whether the 219
patterns of changes were related to the entry level, as observed for progressive disorder, such 220
as DMD[9]. However, in SMA there was no difference between the subgroups subdivided 221
according to entry levels as they all were within + 1 point. These findings suggest that the 222
functional level at entry does not predict the magnitude of changes at least over a period of 12 223
months, due to the very modest magnitude of changes observed. 224
In conclusion, our results confirm that the RULM explores a wider range of functional abilities 225
and can be used in the broader phenotypic spectrum of SMA including ambulant patients. We 226
also demonstrated that although the mean 12 month changes were relatively small, the range 227
of change was broad and that functional level and age can help to identify categories of 228

13 patients at higher risk of more substantial changes. Understanding these differences, may help 229
with clinical trial design or interpreting results of an intervention. Further studies using more 230
defined statistical methods and a longer follow up, as recently used in other neuromuscular 231
disorders[10, 11], may help to identify further prognostic elements and define more precise 232
trajectories of progression. Furthermore, studies designed to investigate minimal clinically 233
important difference across ages and abilities will contribute to a better understanding of 234
perceptions of meaningful change during daily activities for patients and families. 235

14 Acknowledgments 236
The SMA Foundation, the PNCR Network, the Muscle Study Group, SMA REACH UK, the Italian 237
SMA Network and the patients and families who participated. On behalf of the iSMAC 238
Consortium Group: Chiara Marini Bettolo, Matthew Civitiello, Elizabeth Mirek, Rachel Salazar, 239
Nicola Forcina, Giulia Norcia, Sara Carnicella, Laura Antonaci. 240
241
242
References 243
1. Finkel R, Bertini E, Muntoni F, Mercuri E, Group ESWS. 209th ENMC International 244
Workshop: Outcome Measures and Clinical Trial Readiness in Spinal Muscular Atrophy 7-9 245
November 2014, Heemskerk, The Netherlands. Neuromuscul Disord. 2015;25(7):593-602. 246
2. Finkel RS, Sejersen T, Mercuri E, Group ESWS. 218th ENMC International Workshop:: 247
Revisiting the consensus on standards of care in SMA Naarden, The Netherlands, 19-21 248
February 2016. Neuromuscul Disord. 2017;27(6):596-605. 249
3. Mazzone ES, Mayhew A, Montes J, Ramsey D, Fanelli L, Young SD, et al. Revised upper 250
limb module for spinal muscular atrophy: Development of a new module. Muscle & nerve. 251
2017;55(6):869-74. Epub 2016/10/05. 252
4. Mercuri E, Finkel R, Montes J, Mazzone ES, Sormani MP, Main M, et al. Pattern of disease 253
progression in type 2 and 3 SMA: implication for clinical trials. Nueromuscul Disord. 254
2016;26(2):126-31 255
5. Pera MC, Coratti G, Forcina N, Mazzone ES, Scoto MC, Montes J, et al. Content validity and 256
clinical meanigfulness of the HMFSE in spinal muscular atrophy. BMC Neurology. 2017; 257
17(1):39 258

15 6. Mazzone E, Bianco F, Martinelli D, Glanzman AM, Messina S, De Sanctis R, et al. 259
Assessing upper limb function in nonambulant SMA patients: development of a new module. 260
Neuromuscul Disord. 2011;21(6):406-12. 261
7. Mercuri E, Finkel R, Montes J, Mazzone ES, Sormani MP, Main M, et al. Patterns of 262
disease progression in type 2 and 3 SMA: Implications for clinical trials. Neuromuscul Disord. 263
2016;26(2):126-31. 264
8. Kaufmann P, McDermott MP, Darras BT, Finkel R, Kang P, Oskoui M, et al. 265
Observational study of spinal muscular atrophy type 2 and 3: functional outcomes over 1 year. 266
Arch Neurol. 2011;68(6):779-86. 267
9. Mercuri E, Darras BT, Chiriboga CA, Day JW, Campbell C, Connolly AM, et al. 268
Nusinersen versus Sham Control in Later-Onset Spinal Muscular Atrophy. N Engl J Med. 269
2018;378(7):625-35. 270
10. Brooke MH, Griggs RC, Mendell JR, Fenichel GM, Shumate JB, Pellegrino RJ. Clinical 271
trial in Duchenne dystrophy. I. The design of the protocol. Muscle & nerve. 1981;4(3):186-97. 272
Epub 1981/05/01. 273
11. Mayhew A, Mazzone ES, Eagle M, Duong T, Ash M, Decostre V, et al. Development of 274
the Performance of the Upper Limb module for Duchenne muscular dystrophy. Dev Med Child 275
Neurol. 2013;55(11):1038-45. 276
12. Mercuri E, Signorovitch JE, Swallow E, Song J, Ward SJ, Group DMDI, et al. Categorizing 277
natural history trajectories of ambulatory function measured by the 6-minute walk distance in 278
patients with Duchenne muscular dystrophy. Neuromuscul Disord. 2016;26(9):576-83. 279
13. Goemans N, Vanden Hauwe M, Signorovitch J, Swallow E, Song J, Collaborative 280
Trajectory Analysis P. Individualized Prediction of Changes in 6-Minute Walk Distance for 281
Patients with Duchenne Muscular Dystrophy. PloS one. 2016;11(10):e0164684. 282