Embed Size (px)
Citation preview

1
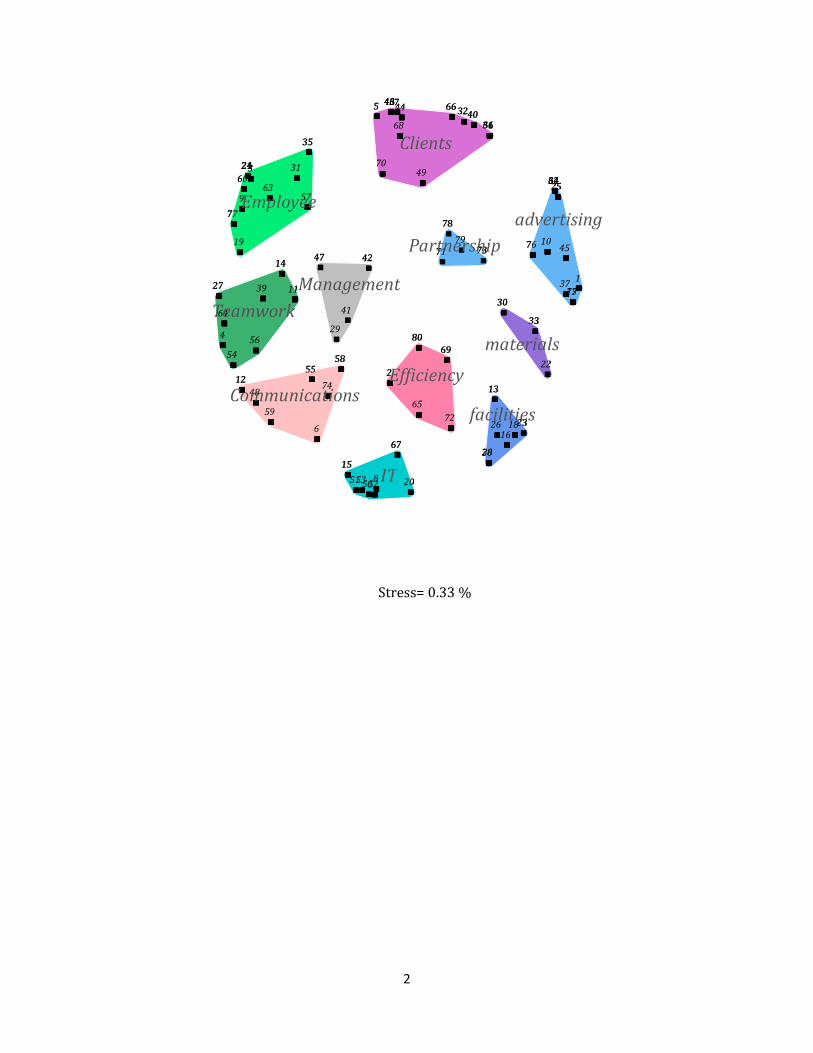
1 PLOTS
1.1 CLUSTERS
Stress=0.33%
1
2
3
4
5
6
7
8
9
10
11
12 13
14
15
16
17
18
19
20
21
22
23
24 25
26
27
28
29
30
31
32
33
34
35 36
37
38
39
40
41
42
43 44
45
46
47
48
49
50 51 52 53
54 55
56
57
58
59
60
61
62 63
64
65
66
67
68
69
70
71
72
73
74
75
76
77 78 79
80
advertising
Efficiency
Employee
Teamwork
Clients
Communications
IT facilities
materials
Management
Partnership
2
Stress=0.33%
1
2
3
4
5
6
7
8
9
10
11
12 13
14
15
16
17
18
19
20
21
22
23
24 25
26
27
28
29
30
31
32
33
34
35 36
37
38
39
40
41
42
43 44
45
46
47
48
49
50 51 52 53
54 55
56
57
58
59
60
61
62 63
64
65
66
67
68
69
70
71
72
73
74
75
76
77 78 79
80
1
2
3
4
5
6
7
8
9
10
11
12 13
14
15
16
17
18
19
20
21
22
23
24 25
26
27
28
29
30
31
32
33
34
35 36
37
38
39
40
41
42
43 44
45
46
47
48
49
50 51 52 53
54 55
56
57
58
59
60
61
62 63
64
65
66
67
68
69
70
71
72
73
74
75
76
77 78 79
80
advertising
Efficiency
Employee
Teamwork
Clients
Communications
IT
facilities
materials
Management
Partnership

3
1.2 UNIVARIATE RATING - BY STATEMENT
RatingMapforGroupAll-Feasibility
1
2
3
4
5
6
7
8
9
10
11
12 13
14
15
16
17
18
19
20
21
22
23
24 25
26
27
28
29 30
31
32
33
34
35 36
37
38
39
40
41
42
43 44
45
46
47
48
49
50 51 52 53
54 55
56
57
58
59
60
61
62 63
64
65
66
67
68
69
70
71
72
73
74
75
76
77 78 79
80

4
1.3 UNIVARIATE RATING - BY CLUSTER
ClusterRatingMapforGroupAll-Importance
1
2
3
4
5
6
7
8
9
10
11 1
2
3
4
5
6
7
8
9
10
11
12 13
14
15
16
17
18
19
20
21
22
23
24 25
26
27
28
29
30
31
32
33
34
35 36
37
38
39
40
41
42
43 44
45
46
47
48
49
50 51 52 53
54 55
56
57
58
59
60
61
62 63
64
65
66
67
68
69
70
71
72
73
74
75
76
77 78 79
80
advertising
Efficiency
Employee
Teamwork
Clients
Communications
IT
facilities
materials
Management
Partnership

5
1.4 BAR CHART
advertising
Efficiency
Employee
Team
work
Clients
Communications
IT
facilities
materials
Managem
ent
Partnership
Feasibility 0
1 2
3 4
5 6
Importance
0 1
2 3
4 5
BarChartforGroupAll
advertising
Efficiency
Employee
Team
work
Clients
Communications
IT
facilities
materials
Managem
ent
Partnership

6
Feasibility 0
1 2
3 4
5 Importance
0 1
2 3
4 5
BarChartforGroupLargeMedium
advertising
Efficiency
Employee
Team
work
Clients
Communications
IT
facilities
materials
Managem
ent
Partnership
advertising
Efficiency
Employee
Team
work
Clients
Communications
IT
facilities
materials
Managem
ent
Partnership

7
1.5 PATTERN MATCHING
advertising2.5
materials2.7
facilities3.1 Clients3.2
IT3.3 Partnership3.4
Efficiency3.5
Employee3.7 Communications3.7
Management3.9 Teamwork4.0
3.0
2.9
3.1
2.9 2.9
3.1
3.2
2.9
3.2 3.3
2.8
Feasibility Importance

8
1.6 GOZONE
GoZoneforGroupAll
Feasibility
Importance
2.0 2.5 3.0 3.5 4.0 4.5 5.0
2.0
2.5
3.0
3.5
4.0
1 2
3
4
5
6
7
8 9
10
11
12
13
14
15
16
17
18 19
20 21
22
23
24
25
26
27
28
29
30
31
32
33
34
35
36
37
38
39
40
41
42
43
44
45
46
47
48 49
50
51 52
53
54
55 56
57
58
59
60 61
62
63
64
65
66
67
68
69 70
71
72
73 74
75
76
77
78
79
80
A B
C
D
E
F
E
G C
A
D
F
H
D
G
H
A
H C
G C
I
H
C
A
H
D
H
J
I
C
E
I
A
C
E
A
H
D
E
J
J
E
E
A
E
J
F E
G
G G
G
D
F D
C
F
F
C E
A
C
D
B
E
G
E
B E
K
B
K F
A
A
C
K
K
B

9
GoZoneforGroupAll
Feasibility
Importance
2.0 2.5 3.0 3.5 4.0 4.5 5.0
2.0
2.5
3.0
3.5
4.0
4 11
14
27 29
39
41
42
47 54
56
64
A A
A
A B
A
B
B
B A
A
A

10
1.7 DENDROGRAM
57
31
35
63
60 3 21
24 19
9 77
59
12
48
6
58
55
74
29
41
42
47
39
11
14 27
4 64
54
56
28
38
13
18
23
16
26 22
30
33
50
8 52
15
51
53 20
67
65
72
2 69
80
36
61
66
32
40
5 68
43
46 7 44 49
70
73
71
78
79
25
34
62
1 37
17
75 45
10
76
hclust(*,"complete")

11
2 REPORTS
2.1 SORTERS Group: All Sorter ID Statements Sorted Groupings 1 80 13 2 80 11 3 80 12 4 80 10 5 80 13 6 80 12 7 80 13 8 80 13 9 80 9 10 80 20
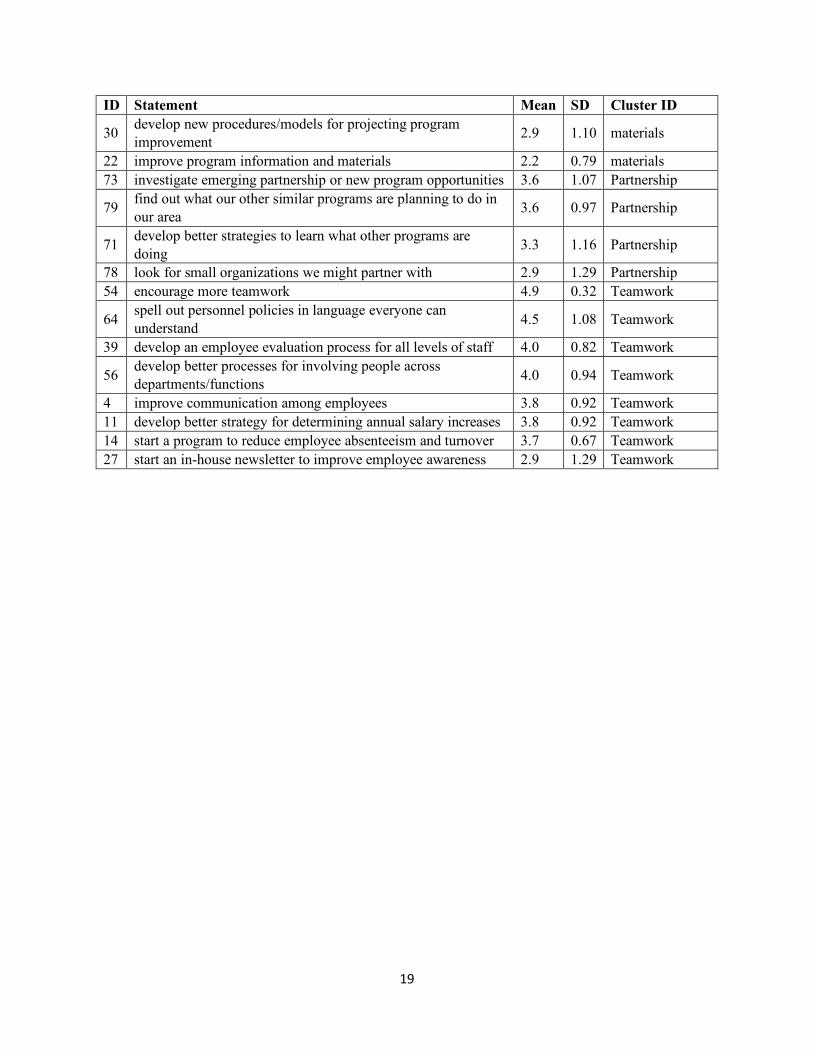
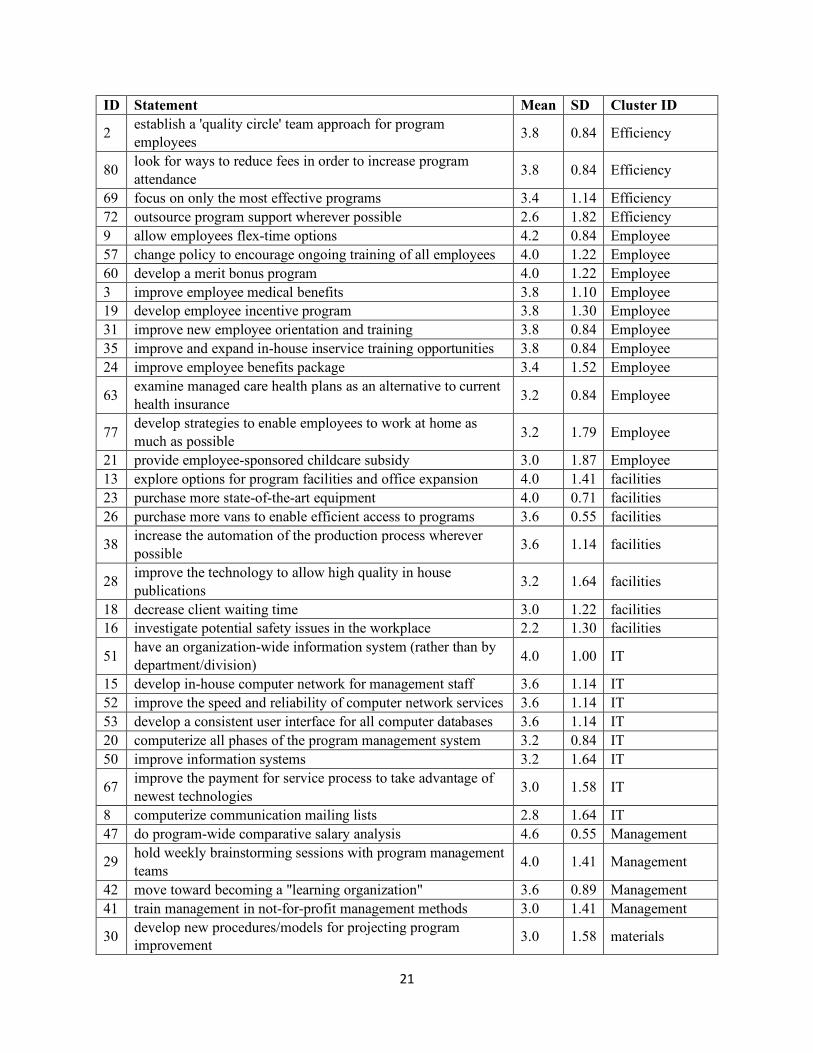
2.2 STATEMENTS Group: All, Rating variable: Importance ID Statement Mean SD Cluster ID
25 sponsor local arts and cultural events to improve organization's image 3.8 1.14 advertising
17 improve the quality of our program advertising 3.4 0.97 advertising 34 improve organization's image in the LOCAL community 3.3 0.95 advertising
62 pick a visible community-level organization we can become the publicly-recognized sponsor for 3.3 1.64 advertising
76 find ways to make our programs more appealing to the key client groups 2.9 1.20 advertising
45 develop a unified program logo and look 2.8 1.14 advertising
10 conduct program effectiveness analysis for all major current programs 2.7 1.16 advertising
75 develop a stronger external marketing campaign 2.7 1.25 advertising
1 advertise the organization's image rather than just specific programs 2.6 1.17 advertising
37 improve targeting of messages to appropriate clients 2.6 1.17 advertising 36 perform regular client satisfaction surveys 3.9 0.99 Clients 7 improve cleanliness of offices and program locations 3.7 1.34 Clients 43 change the layout/style of facilities 3.2 1.23 Clients
61 conduct ongoing client focus groups to assure continuous feedback 3.1 1.52 Clients
70 close facilities that are too old or are underutilized 3.1 0.88 Clients
46 reduce the clutter of reading material and program information in the public areas of the main facility 3.0 0.82 Clients
5 friendlier program managers 2.9 1.60 Clients

12
ID Statement Mean SD Cluster ID 32 improve client satisfaction 2.7 1.16 Clients 40 establish a client satisfaction/complaints telephone hotline 2.6 0.97 Clients
68 find better ways to manage high-traffic (peak) periods in the facilities 2.6 1.07 Clients
49 expand the number of program facilities by 25% in next five years 2.5 1.18 Clients
66 take a "total quality service" approach to working with the client 2.4 1.35 Clients
44 coordinate the facilities' color schemes 2.3 1.06 Clients 12 initiate labor management relations group 3.5 1.08 Communications 58 manage internal resources more efficiently 3.5 1.27 Communications 6 reduce unnecessary reports, memos, meetings 3.1 1.20 Communications
55 reduce middle management -- make organizational structure more horizontal 3.1 1.20 Communications
59 open the budgeting process to more than just managers 3.0 0.94 Communications
74 hire outside support to do routine administrative tasks wherever possible 3.0 1.41 Communications
48 improve management/labor negotiation process 2.4 1.17 Communications
65 devise a team-based productivity incentive system for program teams 3.4 0.84 Efficiency
69 focus on only the most effective programs 3.1 1.52 Efficiency
80 look for ways to reduce fees in order to increase program attendance 2.9 1.20 Efficiency
2 establish a 'quality circle' team approach for program employees 2.7 1.42 Efficiency
72 outsource program support wherever possible 2.4 0.70 Efficiency 24 improve employee benefits package 3.5 1.27 Employee
77 develop strategies to enable employees to work at home as much as possible 3.4 1.26 Employee
57 change policy to encourage ongoing training of all employees 3.3 1.06 Employee 60 develop a merit bonus program 3.2 1.23 Employee 3 improve employee medical benefits 3.1 1.10 Employee 21 provide employee-sponsored childcare subsidy 3.1 1.20 Employee 31 improve new employee orientation and training 3.1 1.37 Employee 9 allow employees flex-time options 3.0 1.25 Employee 19 develop employee incentive program 2.9 1.20 Employee 35 improve and expand in-house inservice training opportunities 2.6 1.26 Employee
63 examine managed care health plans as an alternative to current health insurance 2.4 0.97 Employee
23 purchase more state-of-the-art equipment 3.1 1.45 facilities
38 increase the automation of the production process wherever possible 3.0 1.05 facilities
13 explore options for program facilities and office expansion 2.9 1.37 facilities 18 decrease client waiting time 2.9 1.20 facilities

13
ID Statement Mean SD Cluster ID
28 improve the technology to allow high quality in house publications 2.9 0.99 facilities
26 purchase more vans to enable efficient access to programs 2.8 1.23 facilities 16 investigate potential safety issues in the workplace 2.4 1.17 facilities
51 have an organization-wide information system (rather than by department/division) 3.8 1.40 IT
52 improve the speed and reliability of computer network services 3.7 1.34 IT 15 develop in-house computer network for management staff 3.3 1.34 IT 53 develop a consistent user interface for all computer databases 3.2 0.92 IT 20 computerize all phases of the program management system 3.1 1.20 IT 8 computerize communication mailing lists 2.9 1.20 IT 50 improve information systems 2.8 1.14 IT
67 improve the payment for service process to take advantage of newest technologies 2.8 1.32 IT
42 move toward becoming a "learning organization" 3.7 1.06 Management 47 do program-wide comparative salary analysis 3.4 1.58 Management
29 hold weekly brainstorming sessions with program management teams 3.1 1.52 Management
41 train management in not-for-profit management methods 3.0 1.25 Management
30 develop new procedures/models for projecting program improvement 3.7 1.06 materials
33 rewrite program documentation/instructions to improve clarity and readability 3.1 1.45 materials
22 improve program information and materials 2.9 1.29 materials 73 investigate emerging partnership or new program opportunities 3.0 0.94 Partnership 78 look for small organizations we might partner with 2.9 1.10 Partnership
71 develop better strategies to learn what other programs are doing 2.8 1.23 Partnership
79 find out what our other similar programs are planning to do in our area 2.5 1.18 Partnership
54 encourage more teamwork 3.5 1.08 Teamwork 4 improve communication among employees 3.3 1.06 Teamwork 11 develop better strategy for determining annual salary increases 3.3 1.06 Teamwork 27 start an in-house newsletter to improve employee awareness 3.1 1.10 Teamwork
56 develop better processes for involving people across departments/functions 3.1 0.74 Teamwork
64 spell out personnel policies in language everyone can understand 2.6 0.97 Teamwork
14 start a program to reduce employee absenteeism and turnover 2.5 1.35 Teamwork 39 develop an employee evaluation process for all levels of staff 2.1 0.88 Teamwork

14
Group: LargeMedium, Rating variable: Importance ID Statement Mean SD Cluster ID
25 sponsor local arts and cultural events to improve organization's image 3.8 1.10 advertising
17 improve the quality of our program advertising 3.6 1.14 advertising
76 find ways to make our programs more appealing to the key client groups 3.4 1.14 advertising
34 improve organization's image in the LOCAL community 3.2 1.30 advertising
1 advertise the organization's image rather than just specific programs 3.0 1.41 advertising
62 pick a visible community-level organization we can become the publicly-recognized sponsor for 3.0 1.87 advertising
45 develop a unified program logo and look 2.8 0.84 advertising
10 conduct program effectiveness analysis for all major current programs 2.2 0.84 advertising
37 improve targeting of messages to appropriate clients 2.2 1.30 advertising 75 develop a stronger external marketing campaign 2.2 1.30 advertising 36 perform regular client satisfaction surveys 3.8 1.30 Clients 5 friendlier program managers 3.6 1.34 Clients
61 conduct ongoing client focus groups to assure continuous feedback 3.6 1.14 Clients
32 improve client satisfaction 3.4 0.89 Clients 43 change the layout/style of facilities 3.4 0.89 Clients
49 expand the number of program facilities by 25% in next five years 3.4 0.89 Clients
7 improve cleanliness of offices and program locations 3.2 1.30 Clients 70 close facilities that are too old or are underutilized 3.0 1.00 Clients 40 establish a client satisfaction/complaints telephone hotline 2.8 0.84 Clients
46 reduce the clutter of reading material and program information in the public areas of the main facility 2.6 0.55 Clients
66 take a "total quality service" approach to working with the client 2.6 1.52 Clients
68 find better ways to manage high-traffic (peak) periods in the facilities 2.4 1.52 Clients
44 coordinate the facilities' color schemes 2.0 0.71 Clients 12 initiate labor management relations group 3.8 1.30 Communications 58 manage internal resources more efficiently 3.8 1.30 Communications 6 reduce unnecessary reports, memos, meetings 3.2 1.30 Communications
74 hire outside support to do routine administrative tasks wherever possible 3.2 1.48 Communications
59 open the budgeting process to more than just managers 3.0 0.71 Communications 48 improve management/labor negotiation process 2.6 1.52 Communications
55 reduce middle management -- make organizational structure more horizontal 2.6 1.34 Communications
65 devise a team-based productivity incentive system for program teams 3.0 0.71 Efficiency

15
ID Statement Mean SD Cluster ID 69 focus on only the most effective programs 2.8 1.64 Efficiency
80 look for ways to reduce fees in order to increase program attendance 2.6 1.34 Efficiency
72 outsource program support wherever possible 2.4 0.55 Efficiency
2 establish a 'quality circle' team approach for program employees 1.8 1.10 Efficiency
57 change policy to encourage ongoing training of all employees 3.6 0.89 Employee 60 develop a merit bonus program 3.6 1.14 Employee 24 improve employee benefits package 3.4 1.14 Employee 3 improve employee medical benefits 3.2 0.84 Employee 21 provide employee-sponsored childcare subsidy 3.2 1.30 Employee 31 improve new employee orientation and training 3.0 1.41 Employee 19 develop employee incentive program 2.8 1.10 Employee
77 develop strategies to enable employees to work at home as much as possible 2.8 1.10 Employee
9 allow employees flex-time options 2.4 1.14 Employee 35 improve and expand in-house inservice training opportunities 2.4 0.89 Employee
63 examine managed care health plans as an alternative to current health insurance 2.4 1.14 Employee
23 purchase more state-of-the-art equipment 3.2 1.64 facilities
38 increase the automation of the production process wherever possible 3.0 1.22 facilities
13 explore options for program facilities and office expansion 2.6 1.52 facilities 18 decrease client waiting time 2.4 0.55 facilities 26 purchase more vans to enable efficient access to programs 2.4 1.14 facilities
28 improve the technology to allow high quality in house publications 2.4 0.89 facilities
16 investigate potential safety issues in the workplace 2.2 1.10 facilities
51 have an organization-wide information system (rather than by department/division) 3.8 1.10 IT
8 computerize communication mailing lists 3.4 0.55 IT 53 develop a consistent user interface for all computer databases 3.4 1.14 IT 15 develop in-house computer network for management staff 3.2 1.64 IT 20 computerize all phases of the program management system 3.2 1.48 IT 52 improve the speed and reliability of computer network services 3.2 1.64 IT 50 improve information systems 2.8 1.30 IT
67 improve the payment for service process to take advantage of newest technologies 2.8 1.10 IT
42 move toward becoming a "learning organization" 3.8 1.30 Management 47 do program-wide comparative salary analysis 3.4 1.52 Management
29 hold weekly brainstorming sessions with program management teams 3.2 1.79 Management
41 train management in not-for-profit management methods 3.2 1.48 Management
30 develop new procedures/models for projecting program improvement 3.6 1.52 materials

16
ID Statement Mean SD Cluster ID
33 rewrite program documentation/instructions to improve clarity and readability 2.6 1.67 materials
22 improve program information and materials 2.2 1.10 materials 73 investigate emerging partnership or new program opportunities 3.0 0.71 Partnership
79 find out what our other similar programs are planning to do in our area 2.6 1.34 Partnership
78 look for small organizations we might partner with 2.4 0.89 Partnership
71 develop better strategies to learn what other programs are doing 2.2 1.10 Partnership
54 encourage more teamwork 3.6 1.14 Teamwork 27 start an in-house newsletter to improve employee awareness 3.0 1.22 Teamwork
56 develop better processes for involving people across departments/functions 3.0 0.71 Teamwork
4 improve communication among employees 2.8 1.10 Teamwork 11 develop better strategy for determining annual salary increases 2.8 0.84 Teamwork
64 spell out personnel policies in language everyone can understand 2.8 0.84 Teamwork
39 develop an employee evaluation process for all levels of staff 2.6 0.89 Teamwork 14 start a program to reduce employee absenteeism and turnover 2.2 0.84 Teamwork

17
Group: All, Rating variable: Feasibility ID Statement Mean SD Cluster ID 37 improve targeting of messages to appropriate clients 3.1 0.74 advertising
10 conduct program effectiveness analysis for all major current programs 2.9 1.10 advertising
75 develop a stronger external marketing campaign 2.8 1.40 advertising
76 find ways to make our programs more appealing to the key client groups 2.8 0.79 advertising
34 improve organization's image in the LOCAL community 2.5 0.97 advertising 17 improve the quality of our program advertising 2.4 0.52 advertising
1 advertise the organization's image rather than just specific programs 2.3 0.95 advertising
45 develop a unified program logo and look 2.3 1.16 advertising
25 sponsor local arts and cultural events to improve organization's image 2.0 1.33 advertising
62 pick a visible community-level organization we can become the publicly-recognized sponsor for 2.0 1.05 advertising
32 improve client satisfaction 4.6 0.52 Clients
66 take a "total quality service" approach to working with the client 4.0 0.82 Clients
70 close facilities that are too old or are underutilized 3.5 1.43 Clients 5 friendlier program managers 3.1 0.99 Clients 7 improve cleanliness of offices and program locations 3.1 0.88 Clients
68 find better ways to manage high-traffic (peak) periods in the facilities 3.1 0.99 Clients
36 perform regular client satisfaction surveys 3.0 0.94 Clients
61 conduct ongoing client focus groups to assure continuous feedback 3.0 0.82 Clients
40 establish a client satisfaction/complaints telephone hotline 2.9 1.10 Clients
46 reduce the clutter of reading material and program information in the public areas of the main facility 2.9 1.20 Clients
43 change the layout/style of facilities 2.7 1.25 Clients
49 expand the number of program facilities by 25% in next five years 2.7 1.16 Clients
44 coordinate the facilities' color schemes 2.4 1.35 Clients 6 reduce unnecessary reports, memos, meetings 4.5 0.53 Communications 58 manage internal resources more efficiently 4.3 0.82 Communications 48 improve management/labor negotiation process 4.0 1.05 Communications
55 reduce middle management -- make organizational structure more horizontal 3.6 1.71 Communications
59 open the budgeting process to more than just managers 3.5 1.43 Communications 12 initiate labor management relations group 3.2 1.75 Communications
74 hire outside support to do routine administrative tasks wherever possible 2.5 1.43 Communications
2 establish a 'quality circle' team approach for program employees 3.8 0.79 Efficiency

18
ID Statement Mean SD Cluster ID
65 devise a team-based productivity incentive system for program teams 3.7 0.67 Efficiency
80 look for ways to reduce fees in order to increase program attendance 3.7 0.67 Efficiency
69 focus on only the most effective programs 3.5 0.85 Efficiency 72 outsource program support wherever possible 2.8 1.75 Efficiency 9 allow employees flex-time options 4.1 1.10 Employee 57 change policy to encourage ongoing training of all employees 4.0 1.15 Employee 3 improve employee medical benefits 3.9 1.20 Employee 60 develop a merit bonus program 3.9 0.99 Employee 19 develop employee incentive program 3.8 1.14 Employee 31 improve new employee orientation and training 3.7 0.82 Employee 35 improve and expand in-house inservice training opportunities 3.7 0.95 Employee 24 improve employee benefits package 3.5 1.27 Employee
77 develop strategies to enable employees to work at home as much as possible 3.5 1.43 Employee
21 provide employee-sponsored childcare subsidy 3.3 1.49 Employee
63 examine managed care health plans as an alternative to current health insurance 2.8 0.92 Employee
28 improve the technology to allow high quality in house publications 3.3 1.16 facilities
13 explore options for program facilities and office expansion 3.2 1.62 facilities 18 decrease client waiting time 3.2 0.92 facilities 23 purchase more state-of-the-art equipment 3.2 1.23 facilities 26 purchase more vans to enable efficient access to programs 3.2 0.79 facilities
38 increase the automation of the production process wherever possible 3.2 1.23 facilities
16 investigate potential safety issues in the workplace 2.6 1.65 facilities
51 have an organization-wide information system (rather than by department/division) 3.9 1.29 IT
53 develop a consistent user interface for all computer databases 3.6 1.26 IT 15 develop in-house computer network for management staff 3.4 0.97 IT 52 improve the speed and reliability of computer network services 3.4 1.17 IT 8 computerize communication mailing lists 3.2 1.40 IT 50 improve information systems 3.1 1.52 IT 20 computerize all phases of the program management system 3.0 0.82 IT
67 improve the payment for service process to take advantage of newest technologies 2.7 1.16 IT
29 hold weekly brainstorming sessions with program management teams 4.2 1.03 Management
47 do program-wide comparative salary analysis 4.0 0.94 Management 42 move toward becoming a "learning organization" 3.9 0.88 Management 41 train management in not-for-profit management methods 3.3 1.42 Management
33 rewrite program documentation/instructions to improve clarity and readability 3.1 1.37 materials
19
ID Statement Mean SD Cluster ID
30 develop new procedures/models for projecting program improvement 2.9 1.10 materials
22 improve program information and materials 2.2 0.79 materials 73 investigate emerging partnership or new program opportunities 3.6 1.07 Partnership
79 find out what our other similar programs are planning to do in our area 3.6 0.97 Partnership
71 develop better strategies to learn what other programs are doing 3.3 1.16 Partnership
78 look for small organizations we might partner with 2.9 1.29 Partnership 54 encourage more teamwork 4.9 0.32 Teamwork
64 spell out personnel policies in language everyone can understand 4.5 1.08 Teamwork
39 develop an employee evaluation process for all levels of staff 4.0 0.82 Teamwork
56 develop better processes for involving people across departments/functions 4.0 0.94 Teamwork
4 improve communication among employees 3.8 0.92 Teamwork 11 develop better strategy for determining annual salary increases 3.8 0.92 Teamwork 14 start a program to reduce employee absenteeism and turnover 3.7 0.67 Teamwork 27 start an in-house newsletter to improve employee awareness 2.9 1.29 Teamwork

20
Group: LargeMedium, Rating variable: Feasibility ID Statement Mean SD Cluster ID
10 conduct program effectiveness analysis for all major current programs 3.4 1.34 advertising
37 improve targeting of messages to appropriate clients 3.0 1.00 advertising
1 advertise the organization's image rather than just specific programs 2.6 1.14 advertising
75 develop a stronger external marketing campaign 2.6 1.34 advertising
76 find ways to make our programs more appealing to the key client groups 2.6 0.55 advertising
17 improve the quality of our program advertising 2.4 0.55 advertising 45 develop a unified program logo and look 2.4 1.52 advertising 34 improve organization's image in the LOCAL community 2.0 1.00 advertising
62 pick a visible community-level organization we can become the publicly-recognized sponsor for 1.8 0.84 advertising
25 sponsor local arts and cultural events to improve organization's image 1.4 0.89 advertising
32 improve client satisfaction 4.6 0.55 Clients 70 close facilities that are too old or are underutilized 4.4 0.55 Clients
66 take a "total quality service" approach to working with the client 3.8 0.84 Clients
68 find better ways to manage high-traffic (peak) periods in the facilities 3.6 0.89 Clients
7 improve cleanliness of offices and program locations 3.4 0.55 Clients
49 expand the number of program facilities by 25% in next five years 3.4 1.14 Clients
5 friendlier program managers 3.2 1.30 Clients
61 conduct ongoing client focus groups to assure continuous feedback 3.2 1.10 Clients
36 perform regular client satisfaction surveys 3.0 1.22 Clients
46 reduce the clutter of reading material and program information in the public areas of the main facility 3.0 1.41 Clients
43 change the layout/style of facilities 2.8 1.64 Clients 40 establish a client satisfaction/complaints telephone hotline 2.4 1.14 Clients 44 coordinate the facilities' color schemes 2.2 1.79 Clients 6 reduce unnecessary reports, memos, meetings 4.8 0.45 Communications 58 manage internal resources more efficiently 4.4 0.89 Communications 48 improve management/labor negotiation process 4.0 1.00 Communications 12 initiate labor management relations group 3.6 1.95 Communications
55 reduce middle management -- make organizational structure more horizontal 3.4 2.19 Communications
59 open the budgeting process to more than just managers 3.2 1.79 Communications
74 hire outside support to do routine administrative tasks wherever possible 2.4 1.52 Communications
65 devise a team-based productivity incentive system for program teams 4.0 0.71 Efficiency
21
ID Statement Mean SD Cluster ID
2 establish a 'quality circle' team approach for program employees 3.8 0.84 Efficiency
80 look for ways to reduce fees in order to increase program attendance 3.8 0.84 Efficiency
69 focus on only the most effective programs 3.4 1.14 Efficiency 72 outsource program support wherever possible 2.6 1.82 Efficiency 9 allow employees flex-time options 4.2 0.84 Employee 57 change policy to encourage ongoing training of all employees 4.0 1.22 Employee 60 develop a merit bonus program 4.0 1.22 Employee 3 improve employee medical benefits 3.8 1.10 Employee 19 develop employee incentive program 3.8 1.30 Employee 31 improve new employee orientation and training 3.8 0.84 Employee 35 improve and expand in-house inservice training opportunities 3.8 0.84 Employee 24 improve employee benefits package 3.4 1.52 Employee
63 examine managed care health plans as an alternative to current health insurance 3.2 0.84 Employee
77 develop strategies to enable employees to work at home as much as possible 3.2 1.79 Employee
21 provide employee-sponsored childcare subsidy 3.0 1.87 Employee 13 explore options for program facilities and office expansion 4.0 1.41 facilities 23 purchase more state-of-the-art equipment 4.0 0.71 facilities 26 purchase more vans to enable efficient access to programs 3.6 0.55 facilities
38 increase the automation of the production process wherever possible 3.6 1.14 facilities
28 improve the technology to allow high quality in house publications 3.2 1.64 facilities
18 decrease client waiting time 3.0 1.22 facilities 16 investigate potential safety issues in the workplace 2.2 1.30 facilities
51 have an organization-wide information system (rather than by department/division) 4.0 1.00 IT
15 develop in-house computer network for management staff 3.6 1.14 IT 52 improve the speed and reliability of computer network services 3.6 1.14 IT 53 develop a consistent user interface for all computer databases 3.6 1.14 IT 20 computerize all phases of the program management system 3.2 0.84 IT 50 improve information systems 3.2 1.64 IT
67 improve the payment for service process to take advantage of newest technologies 3.0 1.58 IT
8 computerize communication mailing lists 2.8 1.64 IT 47 do program-wide comparative salary analysis 4.6 0.55 Management
29 hold weekly brainstorming sessions with program management teams 4.0 1.41 Management
42 move toward becoming a "learning organization" 3.6 0.89 Management 41 train management in not-for-profit management methods 3.0 1.41 Management
30 develop new procedures/models for projecting program improvement 3.0 1.58 materials

22
ID Statement Mean SD Cluster ID
33 rewrite program documentation/instructions to improve clarity and readability 2.6 0.89 materials
22 improve program information and materials 2.2 0.84 materials 73 investigate emerging partnership or new program opportunities 3.8 1.30 Partnership
79 find out what our other similar programs are planning to do in our area 3.8 1.10 Partnership
71 develop better strategies to learn what other programs are doing 3.4 1.52 Partnership
78 look for small organizations we might partner with 3.4 1.52 Partnership 54 encourage more teamwork 4.8 0.45 Teamwork
64 spell out personnel policies in language everyone can understand 4.4 1.34 Teamwork
4 improve communication among employees 4.0 1.00 Teamwork 11 develop better strategy for determining annual salary increases 4.0 0.71 Teamwork 14 start a program to reduce employee absenteeism and turnover 4.0 0.71 Teamwork 39 develop an employee evaluation process for all levels of staff 3.8 0.84 Teamwork
56 develop better processes for involving people across departments/functions 3.6 1.14 Teamwork
27 start an in-house newsletter to improve employee awareness 3.2 1.48 Teamwork
2.3 CLUSTERS Group: LargeMedium, Rating variable: Importance Cluster ID N SSq/N Mean S D advertising 10 0.032 2.940 0.589 Efficiency 5 0.024 2.520 0.460 Employee 11 0.025 2.982 0.460 Teamwork 8 0.028 2.850 0.396 Clients 13 0.039 3.062 0.544 Communications 7 0.032 3.171 0.496 IT 8 0.010 3.225 0.328 facilities 7 0.009 2.600 0.365 materials 3 0.017 2.800 0.721 Management 4 0.022 3.400 0.283 Partnership 4 0.007 2.550 0.342

23
Group: All, Rating variable: Importance Cluster ID N SSq/N Mean S D advertising 10 0.032 3.010 0.412 Efficiency 5 0.024 2.900 0.381 Employee 11 0.025 3.055 0.327 Teamwork 8 0.028 2.938 0.484 Clients 13 0.039 2.923 0.483 Communications 7 0.032 3.086 0.372 IT 8 0.010 3.200 0.385 facilities 7 0.009 2.857 0.223 materials 3 0.017 3.233 0.416 Management 4 0.022 3.300 0.316 Partnership 4 0.007 2.800 0.216
3 ANALYSIS
3.1 ANOVA Group: All, Rating variable: Feasibility DF Sum Sq. Mean Sq. F value p-value 10 14.704 1.47041 6.6857 3.6379e-07 69 15.175 0.21993
Group: LargeMedium, Rating variable: Feasibility DF Sum Sq. Mean Sq. F value p-value 10 16.422 1.64221 5.0782 1.6053e-05 69 22.313 0.32338
Group: LargeMedium, Rating variable: Importance DF Sum Sq. Mean Sq. F value p-value 10 4.5011 0.45011 2.0169 0.044473 69 15.3984 0.22317
Group: All, Rating variable: Importance DF Sum Sq. Mean Sq. F value p-value 10 1.377 0.1377 0.89886 0.53899 69 10.570 0.1532

24
3.2 TUKEY Group: All, Rating variable: Feasibility Difference Lower CI Upper CI Adjusted p-value 0.644 -0.013 1.301 5.944e-02 1.147 0.378 1.917 2.390e-04 0.990 0.135 1.845 1.084e-02 1.145 0.462 1.827 2.226e-05 0.619 -0.151 1.388 2.321e-01 0.778 0.037 1.518 3.159e-02 1.340 0.416 2.264 3.910e-04 0.223 -0.804 1.251 9.997e-01 0.840 -0.084 1.764 1.076e-01 1.440 0.699 2.181 6.318e-07 0.503 -0.229 1.235 4.528e-01 0.346 -0.475 1.168 9.437e-01 0.501 -0.139 1.140 2.660e-01 -0.025 -0.757 0.707 1.000e+00 0.134 -0.568 0.835 9.999e-01 0.696 -0.196 1.589 2.710e-01 -0.421 -1.420 0.579 9.443e-01 0.196 -0.696 1.089 9.997e-01 0.796 0.095 1.498 1.372e-02 -0.157 -1.071 0.757 1.000e+00 -0.003 -0.757 0.752 1.000e+00 -0.529 -1.363 0.306 5.754e-01 -0.370 -1.178 0.438 9.070e-01 0.193 -0.786 1.171 9.999e-01 -0.924 -2.001 0.154 1.600e-01 -0.307 -1.286 0.671 9.931e-01 0.293 -0.515 1.101 9.797e-01 0.155 -0.688 0.997 9.999e-01 -0.371 -1.286 0.543 9.554e-01 -0.213 -1.103 0.678 9.993e-01 0.350 -0.697 1.397 9.888e-01 -0.767 -1.907 0.373 4.866e-01 -0.150 -1.197 0.897 1.000e+00 0.450 -0.440 1.340 8.388e-01 -0.526 -1.281 0.229 4.328e-01 -0.367 -1.092 0.358 8.382e-01 0.195 -0.716 1.107 9.997e-01 -0.921 -1.938 0.096 1.106e-01 -0.305 -1.216 0.607 9.888e-01 0.295 -0.430 1.021 9.547e-01 0.159 -0.649 0.967 9.999e-01 0.721 -0.257 1.700 3.491e-01

25
Difference Lower CI Upper CI Adjusted p-value -0.395 -1.473 0.682 9.778e-01 0.221 -0.757 1.200 9.995e-01 0.821 0.013 1.629 4.303e-02 0.563 -0.394 1.519 6.770e-01 -0.554 -1.611 0.503 8.066e-01 0.063 -0.894 1.019 1.000e+00 0.663 -0.118 1.443 1.705e-01 -1.117 -2.309 0.076 8.641e-02 -0.500 -1.604 0.604 9.123e-01 0.100 -0.856 1.056 1.000e+00 0.617 -0.576 1.809 8.192e-01 1.217 0.160 2.274 1.161e-02 0.600 -0.356 1.556 5.887e-01
Group: LargeMedium, Rating variable: Feasibility Difference Lower CI Upper CI Adjusted p-value 0.888 0.091 1.684 0.0168000 1.266 0.333 2.199 0.0012010 1.100 0.063 2.137 0.0284700 1.235 0.407 2.062 0.0002345 0.951 0.019 1.884 0.0417800 0.955 0.057 1.853 0.0277600 1.380 0.260 2.500 0.0049110 0.180 -1.066 1.426 1.0000000 1.180 0.060 2.300 0.0305100 1.555 0.657 2.453 0.0000110 0.378 -0.509 1.266 0.9397000 0.212 -0.784 1.209 0.9997000 0.347 -0.429 1.122 0.9186000 0.064 -0.824 0.951 1.0000000 0.067 -0.783 0.918 1.0000000 0.492 -0.590 1.575 0.9101000 -0.708 -1.920 0.505 0.6874000 0.292 -0.790 1.375 0.9979000 0.667 -0.183 1.518 0.2634000 -0.166 -1.274 0.943 1.0000000 -0.031 -0.946 0.884 1.0000000 -0.314 -1.326 0.698 0.9936000 -0.311 -1.290 0.669 0.9925000 0.114 -1.072 1.301 1.0000000 -1.086 -2.392 0.221 0.1932000 -0.086 -1.272 1.101 1.0000000 0.289 -0.690 1.269 0.9957000

26
Difference Lower CI Upper CI Adjusted p-value 0.135 -0.887 1.156 1.0000000 -0.149 -1.257 0.960 1.0000000 -0.145 -1.224 0.934 1.0000000 0.280 -0.990 1.550 0.9996000 -0.920 -2.303 0.463 0.5023000 0.080 -1.190 1.350 1.0000000 0.455 -0.624 1.534 0.9434000 -0.283 -1.198 0.632 0.9938000 -0.280 -1.159 0.600 0.9924000 0.145 -0.960 1.251 1.0000000 -1.055 -2.288 0.178 0.1626000 -0.055 -1.160 1.051 1.0000000 0.320 -0.559 1.200 0.9789000 0.004 -0.976 0.983 1.0000000 0.429 -0.758 1.615 0.9802000 -0.771 -2.078 0.535 0.6723000 0.229 -0.958 1.415 0.9999000 0.604 -0.376 1.583 0.6151000 0.425 -0.734 1.584 0.9779000 -0.775 -2.057 0.507 0.6407000 0.225 -0.934 1.384 0.9999000 0.600 -0.347 1.547 0.5743000 -1.200 -2.646 0.246 0.1947000 -0.200 -1.539 1.139 1.0000000 0.175 -0.984 1.334 1.0000000 1.000 -0.446 2.446 0.4441000 1.375 0.093 2.657 0.0253800 0.375 -0.784 1.534 0.9913000
This file was created on May 28, 2018 at 22:56:12.


![Beyond outliers and on to micro-clusters: Vision-guided ...For graph anomaly detection, [30,21] nd communities and suspicious clusters with spectral-subspace plots. SpokEn[30] considers](https://img.dokumen.tips/doc/110x75/5f47770af15dfb4e8b6989af/beyond-outliers-and-on-to-micro-clusters-vision-guided-for-graph-anomaly-detection.jpg)