Embed Size (px)
Citation preview

1
PHASE CHANGES:
Chap. 13: Day 4
Heat of Fusion
Heat of Vaporization
Phase Diagrams

2
Heating/Cooling Curve
temperature = KINETIC E
phase (position) =
POTENTIAL E
Used to show the Energy changes associated with changes in phase
Why do the two phase changes take different amounts of energy?
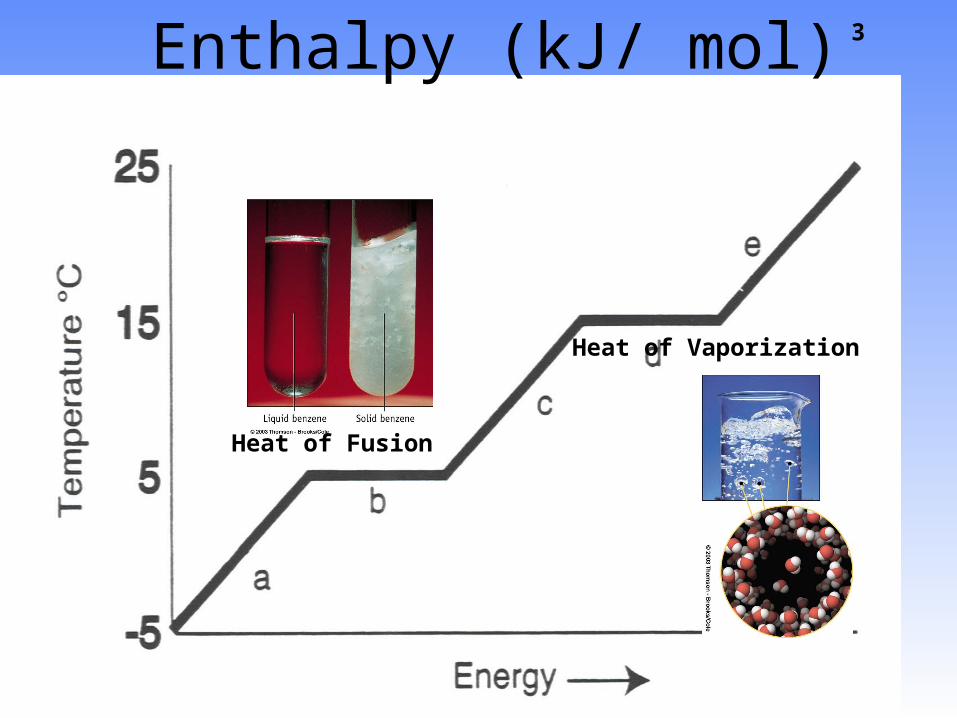
3Enthalpy (kJ/ mol)
Heat of Fusion
Heat of Vaporization

4
PHASE CHANGES:
Standard molar enthalpy of Fusion = (kJ/mol)
fus
The heat energy required to fuse (melt) one mole of a sample

5

6
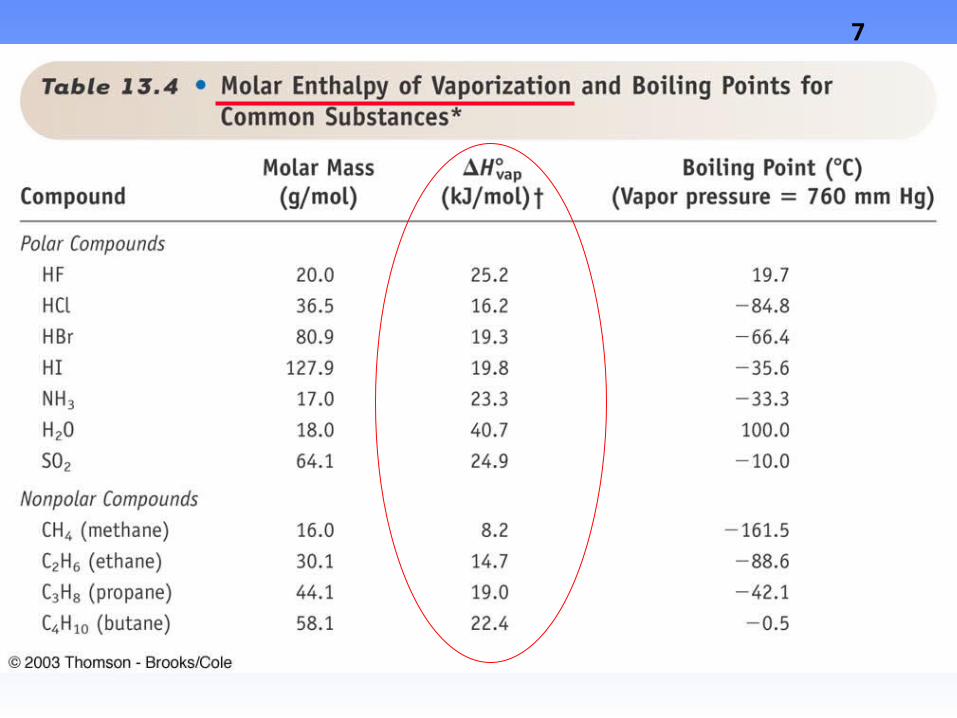
PHASE CHANGES:
Standard molar enthalpy of Vaporization = (kJ/mol)
Hvap
The heat energy required to vaporize one mole of a sample
7

8
1. You place 985 g of water (1L) into a pan at 100 C. How much heat must be supplied to vaporize all the water?
2. The same amount ice is at 0 C. How much heat must be supplied to melt all the water?

9
TWO ways to change PHASE
•Temperature
Pressure

10
Almeltingpoints

11
Boiling points: Liquid to Vapor
Water

12Phase DiagramsPhase Diagrams

13
TRANSITIONS TRANSITIONS BETWEEN BETWEEN PHASESPHASESSection 13.10Section 13.10
Lines connect all conditions of T and P where EQUILIBRIUM exists between the phases on either side of the line.
(At equilibrium particles move from liquid to gas as fast as they move from gas to liquid, for example.)

14
Phase Equilibria — WaterPhase Equilibria — Water
Solid-liquidSolid-liquid
Gas-Gas-LiquidLiquid
Gas-Gas-SolidSolid

15
And depositswhen cooled

16
Triple Point Triple Point — Water— Water
At the At the TRIPLE POINTTRIPLE POINT all all three phases are in three phases are in equilibrium.equilibrium.

17
Phases Phases Diagrams—Diagrams—
Important Points Important Points for Waterfor Water
T(˚C)T(˚C) P(mmHg)P(mmHg)
Normal boil point Normal boil point 100100 760760
Normal freeze pointNormal freeze point 00 760760
Triple point Triple point 0.00980.0098 4.58 4.58

18
Critical T and PCritical T and P
.
LIQUID
GAS
Pcritical
Hig
h P
ress
ure
High Temperature
Tcritical
Note that linegoes straight up
Above critical T Above critical T no liquid exists no liquid exists no matter how no matter how high the high the pressure.pressure.
Above critical T Above critical T no liquid exists no liquid exists no matter how no matter how high the high the pressure.pressure.
As P and T increase, you finally reach the
CRITICAL T and P

19

20
Critical T and PCritical T and P
TTcc((ooC) PC) Pcc(atm) M ((atm) M (g/molg/mol))
HH22OO 374 374 218 (18) P 218 (18) P
Freon-12Freon-12 112112 41 (121) NP 41 (121) NP
(CCl(CCl22FF22))
COCO22 31 31 73 (44) NP 73 (44) NP
CHCH44 -82 -82 46 (16) NP 46 (16) NP
Notice that TNotice that Tcc and P and Pcc depend on depend on
intermolecular forces.intermolecular forces.

21

22

23Phase Diagram for Water

24
Solid-Liquid EquilibriaSolid-Liquid Equilibria
Raising the pressure at constant T causes water to melt.
The NEGATIVE SLOPE of the S/L line is unique to H2O. Almost everything else has positive slope.
SolidH2O
LiquidH2O
P
T
760mmHg
0 ÞC
Normalfreezingpoint
LIQUID H2OICEfavored atlow P
favored athigh P
LIQUID H2OICEfavored atlow P
favored athigh P

25


![Latent heat of vaporization of ammonia - NIST Page · · 2012-10-04v'anDusen] LatentHeatofVaporizationofAmmonia 441 differentexperiments.Ineachexperimenttheammoniawas completelyevaporatedandallvaporexpandedtoatmospheric](https://img.dokumen.tips/doc/110x75/5ae846987f8b9a870490918a/latent-heat-of-vaporization-of-ammonia-nist-page-andusen-latentheatofvaporizationofammonia.jpg)


