Embed Size (px)
Citation preview

1
Optimal Preventive Maintenance Scheduling in
Semiconductor Manufacturing Systems:
Software Tool & Simulation Case Studies
José A. Ramírez-Hernández, Member, IEEE, Jason Crabtree, Xiaodong Yao,
Member, IEEE, Emmanuel Fernandez, Senior Member, IEEE, Michael C. Fu,
Fellow, IEEE, Mani Janakiram, Steven I. Marcus, Fellow, IEEE, Matilda
O’Connor, and Nipa Patel
Abstract
This paper presents the architecture and implementation of PMOST, a Preventive Maintenance Opti-
mization Software Tool, based on algorithms for the optimal scheduling of preventive maintenance (PM)
tasks in semiconductor manufacturing operations. We also present results from four complex simulation
case studies, based on real industrial data and employing full fab models, to illustrate the use, data
needs and outcomes produced by PMOST. These results demonstrate significant improvements in tool
production and consolidation of PM tasks. We give a description of the different software modules that
compose PMOST, to provide guidelines as well as a template for other implementations of the PM
optimization algorithms utilized by PMOST.
This work was partially supported by a grant from the Semiconductor Research Corporation (SRC) and International Sematech(ISMT), within the Factory Operations Research Center (FORCe), Task NJ 877.001.
José A. Ramírez-Hernández, and Emmanuel Fernandez are affiliated with the Department of Electrical and ComputerEngineering, University of Cincinnati, OH 45221-0030, USA (e-mails: [email protected]; [email protected];address: 822 Rhodes Hall, University of Cincinnati, PO Box 210030, Cincinnati, Ohio 45221-0030.
Jason Crabtree is with Integral Analytics Inc., Cincinnati, OH, (e-mail: [email protected]).
Xiaodong Yao is with SAS Institute, Inc., (e-mail: [email protected]).
Michael C. Fu and Steven I. Marcus are with the Institute for Systems Research, University of Maryland, College Park, MD20742, USA, emails: {mfu; marcus}@isr.umd.edu.
Mani Janakiram is with Intel Corp., Chandler, AZ, USA Email: [email protected].
Matilda O’Connor was with Advanced Micro Devices Inc, Austin, TX 78741, USA.
Nipa Patel is with Advanced Micro Devices Inc, Austin, TX 78741, USA (e-mail: [email protected]; address: 5204 E.Ben White Blvd. M/S 563, Austin, TX 78741; phone: 512-602-9441; fax: 512-602-0360).
November 30, 2009 DRAFT

2
I. INTRODUCTION
In semiconductor manufacturing systems, Preventive Maintenance (PM) is performed by tak-
ing off-line a specific tool to apply a prescribed maintenance task. PM increases the overall
operational reliability while decreasing unanticipated (expensive) down-time from tool failures.
The importance of the PM operations in the semiconductor industry is clearly illustrated by
the large costs of the tools utilized in the fabrication process. For instance, a new fab using
technology for 300 mm wafers can cost in excess of $3 billion [1], [2]. PM properly applied
is a necessity in the fab to maintain and improve productivity, and to justify enormous capital
investments of this industry. In addition, PM operations are usually based on heuristic methods,
e.g., cumulative experience obtained by the engineers from the fab operations. The application
of optimization methods in this problem is a topic that has received significant attention recently
[3], [4], [5].
The objectives of this paper are as follows. First, to present the architecture and implemen-
tation of a software tool called Preventive Maintenance Optimization Software Tool (PMOST),
based on the PM scheduling optimization algorithm for semiconductor manufacturing operations
proposed in [3], [4], [5]. This software tool receives operational data and baseline PM schedules
to generate an optimized PM schedule. Second, to present the architecture and implementation
of PMOST, in order to provide guidelines and a template, as well as experimental data, that
can help in the adoption of these by others, and also perhaps serve as the basis for generic
third-party commercial tools. Third, to present a set of four complex simulation case studies,
based on real industrial data and using full fab models, to illustrate the use, data needs and
outcomes produced by PMOST. Both the PM optimization algorithms reported in [3], [4], [5]
and PMOST are the result of research supported by the Semiconductor Research Corporation
(SRC) and International Sematech (ISMT) within the “Factory Operations Research Center”
(FORCe) program. The project was justified by the fact that neither algorithms nor software
tools for PM scheduling optimization in semiconductor manufacturing operations were available
previous to this research.
The case studies presented in this paper consisted of simulations of four different tool groups
in photolithography, metal deposition, and thin films processes on which the impact of optimized
PM schedules, obtained with PMOST, versus heuristic and baseline PM schedules was evaluated.
November 30, 2009 DRAFT

3
The simulation experiments were performed in two fabs from different semiconductor companies.
For the experiments, the companies allowed the utilization of industrial data as well as the full
factory simulation models. Moreover, the simulations were conducted under the strict supervision
of the personnel in charge of factory simulations, and according to the simulation practices
utilized by each company.
We also studied the problem of incorporating non-calendar based PM schedules into the PM
scheduling optimization. As a result, a conversion algorithm [6], [7] was designed to provide
estimates of the equivalent calendar-time PM schedules for PM tasks defined under other non-
calendar time units, e.g., number of wafers processed or processing-time elapsed since last PM
task. The algorithm reported in [6], [7] utilizes as input the projections of the Work-In-Process
(WIP) and the system’s parameters (e.g., tool throughput rate, number of chambers), and then
yields estimates of the dates for which the corresponding tool could receive a prescribed non-
calendar time type of PM task. In addition to the fact that calendar-time PM schedules are easy to
use and to implement, in terms of the optimization algorithm given in [3], [4], [5], calendar-time
schedules are preferred because the search space for the optimization problem may be smaller
when compared to the use of other units used to describe the PM schedules. Specific details
of the conversion algorithm are provided in [6], [7]. Moreover, in [7] an overview of how the
calendar-time PM schedules generated by the conversion algorithm are incorporated in the PM
optimization with PMOST is presented, as well as a case study with real industrial data that
demonstrates the accuracy of the conversion algorithm.
The organization of this paper is as follows: Section II presents an overview of the optimal
PM scheduling framework utilized by PMOST. This is followed by a description of PMOST
in section III that describes the data utilized by the software tool and how optimization results
are provided. An overview of the simulation studies and the corresponding optimization and
simulation results are given in section IV and V, respectively. Finally, conclusions are presented
in section VI.
II. OVERVIEW OF PM SCHEDULING OPTIMIZATION
PMOST is based on the modeling framework for optimization of PM schedules given in [3],
[4], [5]. This framework is described as a two-level hierarchical model [3], with a Markov
Decision Process (MDP) [4] at the higher level and a Mixed Integer Programming (MIP)
November 30, 2009 DRAFT

4
formulation [3], [4], [5] at the lower level, as depicted in Fig. 1 below.
Upper MDP
Lower MIPWIP
PM Schedule
PM Policy
Objective
Constraints
Demand Pattern
Failure Dynamics
Figure 1. Two-level hierarchical framework for PM planning and scheduling (adapted from [3], [4], [5]).
The long-term PM planning policies are produced by the MDP, which employs “the available
information in a way that provides a trade-off between immediate and future benefits and costs,
and that utilizes the fact that observations will be available in the future" [8]. In the lower
level, a MIP formulation [3], [4], [5] generates the optimized PM schedules according to an
optimization objective, projections of the Work-In-Process (WIP), and these are subjected to
several constraints. It is this PM scheduling optimization algorithm that is implemented by
PMOST, and the PM planning policy, or frequency for performing the different PM tasks, is
obtained from the baseline, or nominal, schedule employed in daily fab operations. This frequency
is determined by the semiconductor fab operations, and based on recommendations from the
tool’s manufacturer.
Next we present some notation and details on the optimization models and algorithmic solu-
tions, presented previously in [3], [4], [5], which are utilized in PMOST.
As presented in [3], [4], [5], the objectives utilized for the lower level MIP model are as
follows:
MIP Objective 1
max
Tp∑t=1
M∑i=1
(bi · Vi(t)− cI
i · Ii(t)−ρi∑
l=1
cli · al
i(t)
), (1)
November 30, 2009 DRAFT

5
MIP Objective 2
max
Tp∑t=1
M∑i=1
(b′i ·Xi(t)−
ρi∑
l=1
cli · al
i(t)
), (2)
where, using the same notation as in [3], [4], [5], Tp represents the number of time units or
periods in the PM scheduling horizon, M is the number of tools (or tool chambers), Vi(t) is
availability of tool i in period t, bi is the profit coefficient for availability of tool i, Ii(t) is the
workload level (i.e., WIP) for tool i in period t, cIi is the cost coefficient for inventory in tool i,
ρi is the number of PM tasks on tool i, ali(t) is a binary decision variable (1: do PM, 0: don’t
do PM) for PM task l on tool i in period t, and cli is the cost of performing PM task l on tool
i. Moreover, in MIP Objective 2 the quantity Xi(t) represents the wafer throughput of tool i in
period t and b′i is the profit coefficient for throughput on tool i. The above MIP objectives (1)
and (2) would be optimized under constraints such as inventory levels, availability of resources
(e.g., maintenance technicians per period), tools availability and throughput. Notice that each
objective aims to maximize two different performance indices in a tool group. In MIP Objective
1 the goal is to maximize the availability of tools while minimizing inventory and PM task costs.
For MIP Objective 2, the goal corresponds to maximize the tool throughput while minimizing
the PM costs.
The PM scheduling optimization considers a scheduling horizon where PM tasks are specified
by "PM windows" and are delimited by a warning, due and late date, or by the amount of units
completed (e.g., wafers, kilowatt-hours), see Fig. 2.
November 30, 2009 DRAFT

6
Time (day)
Tool
Tool 1
Tool 2
Tool 3
…
Schedul ing Horizon Present
… Warning Due Late
Figure 2. Calendar-time based PM windows.
Thus, the range of time or units completed, as indicated by a PM window, represents the
interval of time or production when a PM task can be applied. The warning represents the
earliest moment when a PM should be conducted, and the due and late dates are the suggested
and latest time to perform a PM task, respectively. The optimization algorithm assigns the
occurrence of these tasks within the associated PM windows. Thus, PM tasks have a nominal
frequency to be performed; for example, every 30 days or every 15000 wafers since the last
PM task was completed. The frequency is determined by the semiconductor fab operations and
based on recommendations from the tool’s manufacturer.
The optimization increases tool throughput and availability by determining due dates of PM
tasks, within the scheduling horizon, e.g., by avoiding periods of high incoming WIP, and
by consolidating PM tasks. Consolidating PM tasks involves scheduling PM tasks to occur
synchronously, if those tasks can be performed concurrently on the tool, thus reducing the total
time to complete all the tasks and increasing overall tool availability. When a consolidation is
obtained, PM tasks with the longest repair time are selected. Scheduling PM tasks by avoiding
periods of high incoming WIP helps ensure that the tools are not down for maintenance during
times when these are most needed.
In the next section, we present a description of the software tool PMOST, which implements
the PM scheduling optimization algorithm.
November 30, 2009 DRAFT

7
III. PREVENTIVE MAINTENANCE OPTIMAL SCHEDULING TOOL (PMOST)
Different operational data from the process is required to formulate the MIP problem (e.g.,
estimated WIP, tool parameters, scheduling horizon). The optimization algorithm [3], [4], [5] was
originally designed to use PM tasks based on calendar-time schedules because of ease of use of
data in this format and dimensionality of the MIP. When non-calendar based PM schedules are
considered (e.g., processing-time based PM tasks), these need to be converted into calendar-time
format by using, e.g., the conversion algorithm in [6], [7].
The data inputs and outputs for the optimization algorithm are illustrated in Fig. 3 below.
As presented, the algorithm receives as data inputs a set of tools, an initial PM schedule, a
scheduling horizon, projected incoming WIP, cost parameters and constraints, as well as the
available resources. As data outputs, it generates the optimized schedule, the estimated tool
availability and the estimated WIP when the optimized PM schedule is utilized.
PM Optimization Scheduling
Model/algorithm
A set of toolsInitial schedule (PM tasks)
Scheduling horizonProjected Incoming WIP
Cost Parameters andconstraints
Available resources
Optimized ScheduleEstimated AvailabilityEstimated WIP
Figure 3. Data inputs and outputs for the PM optimization algorithm.
The Preventive Maintenance Optimal Scheduling Tool (PMOST) is a comprehensive software
tool designed to implement the PM scheduling optimization model presented in [3], [4], [5];
see also [9]. This software tool was developed as a joint effort of the Systems Modeling &
Information Technology Laboratory (SMITLab) at the University of Cincinnati, and the Institute
for Systems Research at the University of Maryland.
In the same way as the optimization algorithm [3], [4], [5], PMOST accepts a set of input
parameters and data related to the PM optimization process, e.g., scheduling horizon, number
of available resources for the PM tasks, cost coefficients related to the PM tasks (see Fig. 3),
via data files and user input. The data files consist of both static and dynamic data. Static data
is information that does not generally change from run to run of the optimization, e.g., mean
duration of a PM task. This data is generally entered manually into text files. Dynamic data
November 30, 2009 DRAFT
8
is information that changes from run to run of the optimization, e.g., upcoming due date of a
PM task. Thus, PMOST’s static data files include information of the tool family, PM tasks per
tool, and a file with a mapping of the effective throughput of tools with multiple chambers.
The dynamic data files include data of the initial or baseline PM schedule for the tool group,
the projected WIP levels per tool at each period in the scheduling horizon, and the number of
technicians available per period in the scheduling horizon. Regarding the length of the periods
for the scheduling horizon, it is a common practice in the industry to utilize scheduling horizons
of one or two weeks, with periods of one day or one shift, i.e., half day. Also, data projections of
WIP levels at each tool can be obtained from scheduling tools such as the Real-Time Dispatcher
[10]. Moreover, the collection of the dynamic data could be automated by linking the necessary
input files to the different fab information systems, e.g., Manufacturing Execution System (MES)
[10], Enterprise Resource Planning (ERP).
PMOST assembles the input data into a Mathematical Programming System (MPS) file [11],
[12], which contains the objective function, constraints, and all input data. The MPS file format,
created by IBM in the 1960s, is a standard for defining linear programming (LP) problems, and
is widely accepted by commercial LP solvers [13]. Although PMOST does not need a Modeling
Description Language (MDL) [14], [13] to model the optimization process and generate the
corresponding MPS file, modifications on future versions of PMOST may include interfaces
with MDL software, e.g., AMPL [15] and ILOG Optimization Programming Language (OPL)
[16].
Currently, PMOST has the ability to work directly with any commercial mathematical program-
ming solvers that accept command line executions. Solvers that have been successfully utilized
with PMOST include IBM Optimization Solution Library (OSL) [17] and ILOG CPLEX [18].
For instance, PMOST is able to generate a call to IBM’s OSL, transferring the MPS file and
processing the output results from the solver. The parsed solution from the IBM’s OSL can be
easily read and displayed, or used to create a PM order file for simulation purposes, e.g., in
AutoSched AP [19], [20].
The core of PMOST was written in C [21], which allows portability across different platforms
or operating systems. For the current version of PMOST, we also developed a User Interface
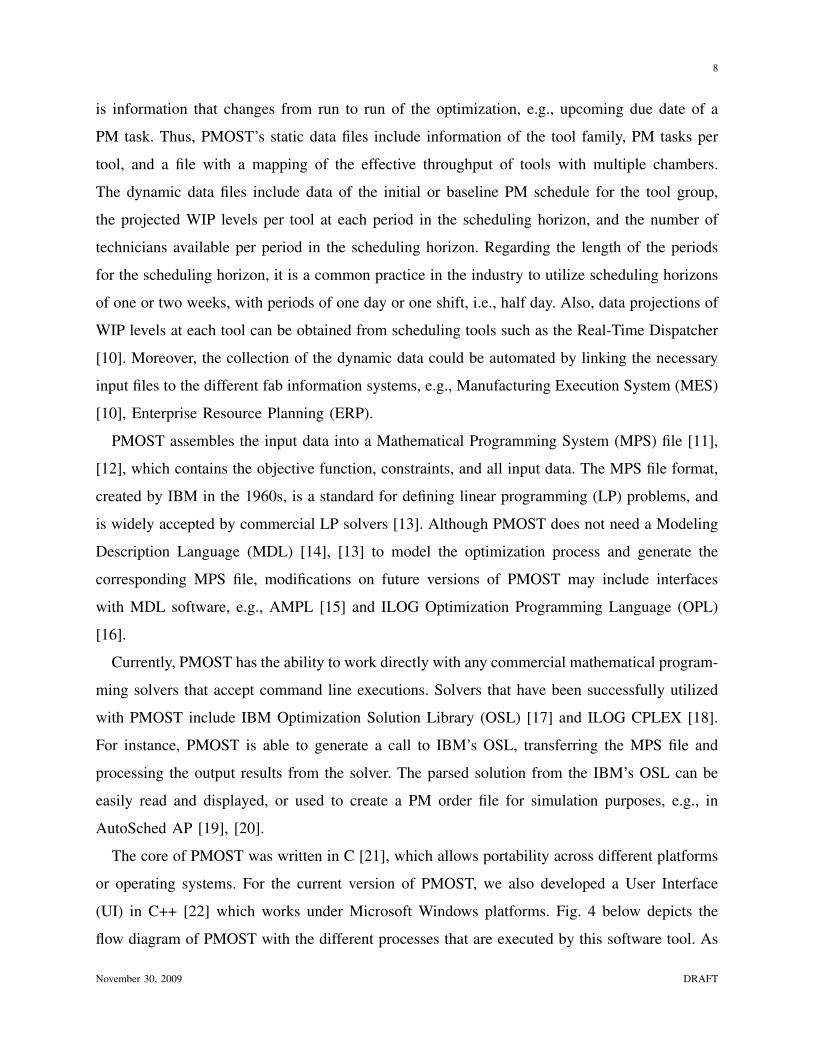
(UI) in C++ [22] which works under Microsoft Windows platforms. Fig. 4 below depicts the
flow diagram of PMOST with the different processes that are executed by this software tool. As
November 30, 2009 DRAFT

9
illustrated in the figure, the program “pmost_ui.exe,” which corresponds to the UI application,
includes the process utilized to gather information manually from the user, such as the scheduling
horizon, tool family information, and number of technicians. The UI application is also utilized to
manually start the PM optimization process. Also, the application “conv2cal.exe” implements the
conversion algorithm reported in [6], [7] for the conversion of non-calendar time PM schedules,
e.g., wafer-based PM tasks. Within the user interface is the core application, “pmost.exe,” which
uses as input the data collected by reading the static and dynamic information contained in
multiple data files. The core application then generates the corresponding MPS file that is passed
to the LP/MIP solver to generate the PM optimization. Once the solver finds a feasible solution
according to the input data provided, then the solution is properly parsed into a calendar-time
format that can be used by the fab simulation model, or for direct use in the PM operations. In
the work described here, the simulation models utilized were those in use at the industrial sites,
which were implemented utilizing commercial software, e.g., AutoSched AP [19], [20].
November 30, 2009 DRAFT
10
START User input
ReadInput Data
-Tool data files-PM data files-PM schedule-Estimated WIP data files-Conversion of PM Schedule
to calendar-time format (conv2cal.exe)
WriteMPS file
LP/MIPSOLVER
ParseSolution
MPS file
Output: PM Orders
PM Optimal Scheduling Tool (PMOST)
-Scheduling horizon-Tools family-Number of Technicians
Solution file
Solution file in calendar-time format
Fab Simulation
Baseline PM Schedule
pmost_ui.exe
pmost.exe
Figure 4. PMOST flow diagram.
The current version available for PMOST is version G2.0. Several screenshots from the user
interface of this version are found below. Fig. 5 shows a screenshot of a Tool/PM data file open
for editing. This file contains the general parameters for the tool group.
November 30, 2009 DRAFT

11
Figure 5. PMOST user interface screenshot, tool/PM data file.
Fig. 6 shows a screenshot that illustrates the progress of the optimization process during a
run. After a successful optimization run, the user can open and view the optimal PM schedule
in a text file.
Figure 6. PMOST user interface screenshot, progress of optimization process during a run.
November 30, 2009 DRAFT

12
The screenshot in Fig. 7 shows a solution file that contains the optimal PM schedule from
the optimization run. The optimal PM schedule is given alongside the initial PM schedule.
Figure 7. PMOST user interface screenshot, optimal PM schedule file.
In the next section we present an overview of the simulation studies, including the general
conditions for the simulation experiments, as well as additional terminology utilized in the
subsequent sections. Each case study described in the following sections utilized PMOST,
together with IBM’s OSL or CPLEX, to obtain the optimized PM schedules.
IV. SIMULATION STUDIES OVERVIEW
Four simulation case studies were performed for three relevant semiconductor manufacturing
operations: photolithography, metal deposition, and thin films. In previous work presented in
[3], [5], another simulation case study is provided for which a group of 11 tools in a thin films
operation was considered. That case study also considered the optimization objectives given in
(1) and (2), and the results reported in [3], [5], demonstrated an increase of tool throughput of
up to 13.9%. In this paper we present results from simulation experiments conducted in two
fabs, each from a different semiconductor companies. Moreover, the metal deposition and thin
films operations case studies presented here included both calendar-time and wafer-based PM
November 30, 2009 DRAFT

13
tasks. Similarly to the study reported in [3], [5], the results presented in this paper indicate that
a maximum increase of 14.2% was observed in tool throughput for the thin films operations.
All the case studies presented in this section were conducted utilizing industrial data and the
corresponding full factory simulation models, including modeling of unscheduled tool down-
times due to failures, from the two fabs that participated in the study. The simulation experiments
were performed under strict supervision of the personnel in charge of factory simulations at each
company, and by following the simulation practices utilized at each fab. In addition, the different
data required for modeling and the optimization process was collected in meetings with personnel
in each fab, from technicians to tool/process managers.
It is important to mention that the types of simulation case studies described in this section
are difficult to perform. These experiments are costly, in terms of the time invested by qualified
personnel in charge of factory simulation, the need that they be conducted over a limited time
period, the experiments involve very sensitive data related to the simulation model, and the
complexity of the corresponding implementation of the experiments. Therefore, in this section
we present as much information as possible from our on-site research at the fabs and companies
that participated in the study. As indicated earlier, these simulation case studies were done in
two different industrial settings. Therefore, the two sets of simulation studies conducted differ
in terms of the factory simulation model utilized, and some simulation parameters, e.g., number
of replications, simulation lengths, warm-up periods which were done as per common practices
utilized by the different industrial groups. Unfortunately, not all the numerical results presented
in this paper are given in the same format because of the difficulties mentioned above and
because of the different simulation practices utilized at each fab.
In the case of the photolithography process, two different groups of tracker/stepper tools were
selected. These tools are utilized to expose wafers with the circuit patterns, which are later
etched into the wafers. Steppers are good candidates for optimization because of their high cost,
and these are common bottlenecks in the manufacturing process. Increasing the throughput of
a set of steppers through optimization can alleviate the bottleneck condition and possibly allow
a fab to reduce equipment costs by obtaining the same productivity from a smaller amount of
tools. Tracks are responsible for preparing the wafers for the steppers. This preparation involves
coating the wafers with photoresist and spinning them to evenly distribute it. The tracks were
considered in the simulation studies because these are physically connected to the steppers, and
November 30, 2009 DRAFT

14
thus PM activities performed on them affect the operation of the steppers.
The tools in the thin films and metal deposition processes are utilized to deposit thin layers
of material on the wafers (e.g., metallic layers, silicon oxide). As with the tracker/steppers,
these tools are good candidates for optimization because they are common constraints (e.g.,
bottlenecks) in the fab.
The four simulation case studies are organized as follows:
• Case I: considered a PM schedule with only calendar-time based PM tasks in a tracker/stepper
tool group for a photolithography process.
• Case II: this case included a PM schedule with only calendar-time based PM tasks and was
performed on a second tracker/stepper tool group for a photolithography process.
• Case III: utilized PM schedules with only wafer-based PM tasks on a set of metal deposition
tools.
• Case IV: applied a PM schedule of both calendar and wafer-based PM tasks for a thin films
tool group.
From the previous list notice that although the case studies I and II utilized the same type
of tools and process, we preferred to differentiate these because each case was conducted in a
different fab, and thus under significant data and simulation settings differences. The pair of case
studies {I, III}, and {II, IV} were performed in different industrial settings. Therefore, these two
sets of experiments differ in terms of the factory simulation model utilized and the simulation
experiments parameters, e.g., number of replications, simulation lengths, warm-up periods, etc.,
as per common practices utilized by the different industrial groups.
The simulations were performed by using actual fab simulation models built in AutoSched
AP [19], [20]. For each of the four case studies, two schedules were simulated for multiple
replications: one generated by applying a heuristic or baseline PM schedule employed by the
fab, and the other obtained through the PM optimization algorithm. Performance was compared
between the optimized and non-optimized schedules.
Through the next sections, we use the following terminology for PM schedules:
• Baseline: is defined as the nominal PM schedule that contains the raw PM due dates based
on PM frequencies. These frequencies are suggested by the tool manufacturers and fab
operations. The baseline schedules can be specified in calendar-time, wafer, or processing
time formats.
November 30, 2009 DRAFT

15
• Initial: is a strictly calendar-time version of the baseline schedule, where all non-calendar
PM tasks (e.g., wafer-based) have been converted to equivalent calendar-based PM tasks.
The initial PM schedule is the input schedule for PMOST.
• Heuristic: is defined as a PM schedule generated and implemented by fab engineers. In
general, this type of schedule is created manually from a baseline schedule.
• Optimal schedule: is obtained from the PM scheduling optimization algorithm implemented
in PMOST.
The following are common conditions considered in the four case studies:
• The semiconductor fab operated 24 hours a day, seven days of the week.
• The statistics of interest collected from the simulation studies were: percentage of tool
availability, tool utilization, and tool throughput (production).
• Actual heuristic PM schedules were obtained by collecting historical operational data from
the fab information systems. The data include the baseline PM schedules for the scheduling
horizon that were based on the assigned frequencies for each PM task.
The next subsections describe the specific conditions considered in each case. Case I and II
are presented together because of the similarity of their conditions, while case III and IV are
described independently.
A. Case studies I and II: Optimal scheduling of calendar-time PM tasks on photolithography
process tools
Case I and II considered stepper and track tools in a photolithography process. In both cases,
the PM activities were strictly calendar-based, thus no conversions were needed to feed the PM
tasks into the optimization algorithm (i.e., the PM optimization works in calendar time only).
The simulation studies were conducted under the following conditions:
Case I conditions
• The scheduling horizon considered was 8 days.
• PM tasks were only calendar-time based. A total of 12 single-chambered tools were con-
sidered in the simulation study, of which only eight tools had their PM windows in the
scheduling horizon.
• PM tasks were performed with different frequencies since the last PM (e.g., every week,
month), from 7 to 90 days.
November 30, 2009 DRAFT

16
• A baseline PM schedule, in calendar-time format, was obtained from the fab information
systems, e.g., Manufacturing Execution System (MES), in-house customized systems. It was
directly used as an initial schedule by PMOST.
• Estimated incoming WIP, from the fab’s lot scheduling system, e.g, Real-Time Dispatcher
(RTD) [10], was specified in hours of processing-time.
Case II conditions
• The scheduling horizon was one week (7 days).
• The simulation study involved 25 steppers and 25 tracks, e.g., each stepper and track
combination modeled as a single tool. Of these tools, 13 had PM tasks due within the
scheduling horizon.
• The baseline PM schedule was in calendar-format; thus it was utilized as an initial schedule
by PMOST.
• Additional data, such as a WIP snapshot for the fab at the beginning of the week and the
wafer starts for the week, were gathered to ensure an accurate simulation.
For case II, a WIP snapshot was used to initialize the fab at the beginning of the scheduling
horizon. The snapshot indicated the amount of WIP at each tool and processing step at the horizon
start. The wafer starts data indicated the amount of new wafers started during the scheduling
horizon. Coupled with the WIP snapshot, this data enabled the simulation to accurately reflect
the WIP conditions in the fab.
In particular, for case II, since each stepper and track combination was modeled as a single
tool, PM activities were scheduled on the whole tool as opposed to being scheduled on the tool’s
chambers. However, since each stepper and track were physically linked together, taking one tool
down for maintenance disabled the other tool. Thus, the steppers and tracks were each considered
chambers of a two-chambered tool. Treating each stepper-track combination as a two-chambered
tool allowed the optimization algorithm to take advantage of potential PM consolidations, where
if a PM task was scheduled on one chamber, then a second PM task could be scheduled to
occur concurrently on the second chamber. In contrast, the tools in case I were considered as
single-chambered.
In general, by scheduling PM tasks to occur concurrently, the total time to complete the tasks
may be reduced. That is, by consolidating several PM tasks for a tool, the number of times
November 30, 2009 DRAFT

17
that the tool needs to be taken down is reduced as compared with the case in which the PM
operations are not performed concurrently. The immediate benefit from PM consolidations is
then an increase in tool availability. That is, consolidating PM tasks helps to minimize the total
maintenance time that a tool experiences, which in turn, helps to maximize both tool availability
and throughput.
B. Case study III: Optimal scheduling of wafer-based PM tasks on metal deposition tools
The third case study focused on scheduling strictly wafer-based PM tasks on a group of tools
for a metal deposition process. To optimally schedule wafer-based PM tasks, the conversion
algorithm in [6] was applied to obtain an equivalent baseline PM schedule in calendar-time
format. This was used as an initial PM schedule in PMOST.
The simulation study considered the following conditions:
• The scheduling horizon was 8 days.
• Four different wafer-based PM tasks were considered.
• Although a total of 29 tools were included in the simulation study, only five tools had their
PM windows in the scheduling horizon. These five tools were then considered for the PM
optimization process.
• The due amounts of wafers required to perform each PM task were in the order of thousands
of wafers.
• Estimated incoming WIP, from the fab’s lot scheduling system, e.g, Real-Time Dispatcher
(RTD) [10], was given in hours of processing time.
In addition to comparing the performance of optimized and non-optimized PM schedules, a
related goal was also to utilize this case study to validate the integration of non-calendar based PM
schedules into the PM optimization process. Moreover, the accuracy of the conversion algorithm
was evaluated by comparing historical data against the estimated calendar-time PM schedules. In
general, a satisfactory performance was obtained as it is reported in [7]. However, an important
conclusion from this experience is that accurate projections or estimates of the incoming WIP are
required to improve the accuracy of the equivalent calendar-time PM schedules. For instance, in
the evaluations of the conversion algorithm reported in [7], it was observed that the accuracy in
the estimations is affected by projected WIP levels that are far from the PM window targets, i.e.,
warning, due, and late dates. In practice, the engineers in charge of the factory simulations at the
November 30, 2009 DRAFT
18
fabs prefer to utilize WIP projections of no more than two weeks for the scheduling horizons. In
doing so, the goal is to provide accurate simulations that are then utilized in different planning
of operations in the fab, including PM. Moreover, accurate estimates of the incoming WIP will
directly affect the PM optimization process. For instance, MIP Objective (1) depends directly
on the projected incoming WIP; therefore, the solution obtained by solving the MIP will reflect
the operational conditions assumed by using the WIP projections.
C. Case Study IV: Optimal scheduling of mixed-type PM tasks on thin films tools
The fourth simulation study was performed on a group of thin films tools, which are responsible
for depositing a layer of dielectric material ("glass") on wafers.
The simulation study was conducted under the following conditions:
• The scheduling horizon was 22 days.
• The simulation study involved 28 thin films tools. Of these tools, 16 had PM tasks due
within the scheduling horizon.
• The thin films tools employed both calendar and wafer-based PM tasks.
The thin films tools were chosen because these were true parallel tools, which is what the PM
scheduling optimization is best suited for. Parallel refers to the fact that multiple chambers of
the tool can perform the same functions. This ability allows the tool to still operate, at a reduced
throughput, while a chamber is taken down for maintenance. In addition, these tools are also
common bottlenecks in the fab, because they are subject to large amounts of reentrant flow,
where a wafer comes back to the same tool type for further processing. In principle, these
tools are good candidates for the optimization. Each tool in the group was comprised of three
processing chambers along with a main transfer chamber, where a robot transfers wafers from
one processing chamber to the next, as well as initially transferring wafers from the load docks
to the first processing chamber. However, chamber-specific data was not made available to us
at the time of the study, and thus for the purpose of the PM scheduling optimization, the entire
tool was considered as one chamber.
Also included in the optimization were subfab PM activities. The term subfab refers to the
pumps and other equipment that lie beneath the floor, under the tools. These PM tasks were
included because their execution also requires that the tool be taken down for the duration of
the PM operation. The subfab was considered as an additional chamber of the tool. For the PM
November 30, 2009 DRAFT

19
optimization the tools had to be modeled as two-chambered tools, with the entire tool representing
the first chamber and the subfab representing the second one. This simplification reduced the
possibility of the optimization finding PM consolidations. However, as the results show, some
consolidations were made, and slight improvements in performance were then achieved.
In addition, since the optimization works in terms of calendar time, the wafer-based PM
windows needed to be converted to equivalent calendar-based PM windows. Because historical
data was being used for the simulation study, this was not a difficult task since the wafer counts
of each tool could be matched up with their corresponding calendar times. Thus, by looking at
historical production data, the wafer counts corresponding to the PM windows could be matched
up with calendar dates.
The next section presents the results from the simulation case studies.
V. OPTIMIZATION & SIMULATION RESULTS
This section presents the results from the PM scheduling optimization and simulation studies.
The results for each case study are described independently and organized by subsections. In
addition, each subsection presents a comparison between the initial and optimized PM schedules,
as well as the percentage change observed in the performance statistics for the tool group when
a baseline or a heuristic PM schedule was replaced by an optimized PM schedule.
A. Results for Case Study I: scheduling of calendar-time PM tasks on photolithography process
tools.
A comparison between the optimal and baseline PM schedules is shown in Table I. In this
table, the label STR#_PMC# represents the PM name that is associated to each pair of tools
and PM tasks. These labels are utilized instead of the actual names for proprietary reasons. For
instance, STR1_PMC1 corresponds to the PM task "PMC1" at tool "STR1".
As presented in Table I, the only PM operation that was not modified by the optimization
process is STR3_PMC2. Moreover, the optimal PM schedule indicates to not perform the PM
tasks STR5_PMC4 and STR8_PMC2 within the corresponding PM scheduling horizon.
Statistical results for this simulation study are presented in Table II. These results correspond
to average values for the entire group of twelve tools when three replications were generated
using the baseline and optimal schedules. While the first column lists the performance statistics
November 30, 2009 DRAFT

20
Table ICOMPARISON OF BASELINE AND OPTIMAL PM SCHEDULES FOR CASE STUDY I
PM Schedule (Day)
PM Name Baseline Optimal
STR1_PMC1 1 2
STR2_PMC1 1 2
STR3_PMC2 4 4
STR4_PMC3 1 2
STR5_PMC4 8 Do Not Perform PM
STR6_PMC2 3 4
STR7_PMC5 5 6
STR8_PMC3 7 Do Not Perform PM
considered, the second and third show the maximum and minimum percentage change for a
single tool in the group, respectively, when the baseline is replaced by an optimized PM schedule.
Similarly, the last column indicates the average change in the statistic over the entire group of
tools when the baseline is replaced by an optimized PM schedule.
Table IIPERFORMANCE RESULTS FROM CASE STUDY I: PERCENTAGE CHANGE FOR BASELINE VS. OPTIMAL PM SCHEDULE
Statistic Max.(%) Min.(%) Avg. (%)WCOMPS 96.85 -38.01 1.64
AVAIL 54.15 -34.56 1.02UTIL 53.10 -34.74 1.68
Min., Max.: minimum and maximum change in a single tool.
Avg.: average change over the entire tool group.
The first statistic in Table II corresponds to the average number of wafers completed (WCOMPS).
Results indicate that when the optimized PM schedule was applied, the group of tools produced
on average 1.64% more wafers as compared with the baseline PM schedule. Notice, however, that
the PM tasks STR5_PMC4 and STR8_PMC3, which require several hours to be completed, were
not performed under the optimized PM schedule and these were then expected to be scheduled
earlier in the next scheduling horizon.
The results also indicate that the positive change in WCOMPS is due to better PM scheduling
November 30, 2009 DRAFT

21
provided by the optimization algorithm rather than the non-scheduling of PM operations in the
tools STR5 and STR8. In fact, the increase in WCOMPS for the tool group under the optimal
PM schedule is due to production increases in the tools that received PM operations within the
scheduling horizon, some of them yielding an increase of up to 97% in production. Interestingly,
the results indicate that the tools STR5 and STR8 decreased their WCOMPS by about 20% under
the optimal PM schedule. Nevertheless, in other case studies presented in this paper we also
observed an increase in WCOMPS when the optimized schedule was utilized and all the PM
tasks were properly scheduled within the PM scheduling horizon.
As can be seen in Table II, by solely looking at the numbers, the percentage improvement
obtained with the optimal PM schedule is relatively small. However, even such small changes
in the tool group performance, e.g., average WCOMPS, may represent substantial increases in
marginal profits in the semiconductor manufacturing business. The results from this case study
also indicate slight but positive differences of 1.02% and 1.68% in average tool availability
(AVAIL) and average tool utilization (UTIL), respectively, by applying the optimal PM schedule.
Although the statistics for some single tools obtained a significant increase while for other tools
the statistics decreased, it was observed that the average performance of the entire tool group
was improved when the optimized PM schedule was utilized.
B. Results for Case Study II: scheduling of calendar-time PM tasks on photolithography process
tools.
The results of the optimization for this case are given in Table III. In this table, the optimal
PM schedule is given alongside the heuristic schedule. The first column of the table provides the
PM names, which have been also modified from the actual names. Each PM name is comprised
of the tool name (Tool#) and a chamber name (CH#). Chamber one (CH1) refers to the stepper,
and chamber 2 (CH2) refers to the track. The symbols †, 4, and ♦ indicate the dates with
consolidations of PM tasks in a tool. By consolidation we mean conducting two or more different
PM tasks in the same tool.
From Table III, notice that several PM tasks are consolidated in both the heuristic and optimal
PM schedules, e.g., PM tasks on the stepper (CH1) and track (CH2) of Tool13. The way in which
the heuristic PM schedule is presented indicates that fab engineers performed consolidations of
PM tasks as appropriate due to the physical interrelationships between the steppers and trackers
November 30, 2009 DRAFT

22
Table IIICOMPARISON OF INITIAL (BASELINE) AND OPTIMAL PM SCHEDULES FOR CASE STUDY II
PM Schedule (Day)
PM Name Heuristic Optimal
Tool1_CH1 2 2
Tool2_CH1 5 2
Tool8_CH1 1 3
Tool10_CH1 3 1
Tool11_CH1 1 2
Tool12_CH1 4 6
Tool13_CH1 2† 3†Tool13_CH2 2† 3†Tool14_CH1 6 3
Tool17_CH1 6 2
Tool18_CH1 34 74
Tool18_CH2 34 74
Tool19_CH1 5♦ 1♦
Tool19_CH2 5♦ 1♦
Tool20_CH1 1 2
Tool25_CH1 4 4
Tool25_CH2 4 4
† , 4, ♦: Dates with consolidated PM tasks in a tool.
described in section IV. This interdependence between steppers and trackers was also indicated
to the PM optimization algorithm as constraints. As a result, the PM optimization algorithm
preserved the PM task consolidations, while changing the dates when the tasks were scheduled.
Thus, any improvements in tool throughput made by the optimization algorithm would therefore
be left to scheduling the PM tasks around periods of high incoming WIP.
The simulation results for the tool group are given in Table IV.
Table IVPERFORMANCE RESULTS FROM CASE STUDY II: HEURISTIC VS. OPTIMAL PM SCHEDULE
Statistic Change (%)WCOMPS 0
AVAIL 0.03UTIL 0.01
November 30, 2009 DRAFT

23
These results show the percentage change for the total number of wafers completed (WCOMPS)
when the heuristic PM schedule was replaced by an optimized schedule. Table IV also lists
the percentage change for the average availability (AVAIL) and utilization (UTIL). The results
represent the average statistics from ten simulation replications.
The results in Table IV show very minor improvements in tool availability and tool utilization
made by the PM optimization. These gains were most likely due to scheduling the PM tasks
around periods of high incoming WIP, since the PM consolidations, made by the optimization,
were also made by fab engineers. Evidently, the fab engineers did a very good job at scheduling
PM tasks in this instance, but accomplishing this may be a very time-consuming job and highly
sensitive to the ability of the particular individual(s) performing the scheduling. Fig. 8 illustrates
a WIP profile for the tool group during the scheduling horizon, taken from the simulation results.
The figure shows that highest WIP level occurred on Day 5 and the lowest on Day 2. Referring
to the PM schedules in Table III, the PM optimization avoids scheduling PM tasks on Day 5
and schedules several tasks on Day 2.
Figure 8. Sample WIP profile for case study II optimization results.
The results of this simulation study validate the PM scheduling optimization. While the PM
optimization does not make major gains in this simulation study, it does show that it can capture
the major decision factors in the PM scheduling process and perform as well as the best heuristic
policies. An argument in favor of the use of such software tool is that it would yield optimized
schedules every time, guiding fab engineers to the best schedule and thus avoiding any potential
November 30, 2009 DRAFT

24
gross inefficiencies due to human error. The optimization would also be of value in efforts to
automate the PM scheduling process. Automating the PM scheduling process would not only
save time to engineers who manually generate the PM schedules, but could also lead to more
sophisticated lot scheduling in the fab.
C. Simulations results for Case Study III: scheduling of wafer-based PM tasks on metal depo-
sition tools.
In this case study an optimized schedule was obtained for wafer-based PM tasks. Table V
shows both the initial and optimal PM schedules. In the first column of Table V, the label
MDep#_PMW# identifies the PM name that is associated with the pair of tools and PM tasks.
The second and third columns list the baseline and optimal schedules, respectively. The baseline
PM schedule was estimated by using the conversion algorithm in [6].
It should be noted from Table V that consolidations of PM tasks are produced in three out
of the five tools considered in the optimization. Consolidations of PM tasks in the tools are
highlighted in bold and properly identified with the symbols †, 4, and ♦ in Table V. For instance,
before the optimization the PM tasks PMW1 and PMW2 were scheduled on different days for
the tool MDep1. After the PM scheduling optimization, these PM operations for MDep1 were
consolidated and scheduled on the same date (Day 2). Moreover, notice that for this simulation
experiment the tools considered did not have the physical constraints observed for the steppers
and trackers of case study II. Thus, in this case the PM optimization algorithm provided PM task
consolidations that both improved the overall scheduling and were not due to physical constraints
in the tools.
The statistical results from the simulation are presented in Table VI. The value of these
percentages of change in the statistics represent an average of three replications and considered
the entire tool group. In addition, the minimum and maximum change for a single tool is
indicated.
As seen in this table, the optimal PM schedule produces a positive effect in tool availability
(AVAIL); an average of 1.04% improvement was obtained. Also, the total number of wafers
completed (WCOMPS) was increased in 2.19% by utilizing the optimal schedule. Similarly,
note that some single tools obtained either substantial increases or decreases in the statistics
when the optimized PM scheduled is applied, while the percentage change over the entire tool
November 30, 2009 DRAFT

25
Table VCOMPARISON OF BASELINE AND OPTIMAL PM SCHEDULES FOR CASE STUDY III
PM Schedule (Day)
PM Name Baseline Optimal
MDep1_PMW1 1 2†
MDep1_PMW2 2 2†
MDep2_PMW3 3 44
MDep2_PMW1 5 44
MDep3_PMW3 5 2♦
MDep3_PMW1 3 2♦
MDep4_PMW3 4 2
MDep5_PMW3 7 5
†, 4, ♦: Dates with consolidated PM tasks in a tool.
Table VIPERFORMANCE RESULTS FROM CASE STUDY III: PERCENTAGE CHANGE FOR BASELINE VS. OPTIMAL PM SCHEDULE
Statistic Max.(%) Min.(%) Avg. (%)WCOMPS 14.52 -8.09 2.19
AVAIL 5.83 0 1.04UTIL 6.34 -2.65 0.75
Min., Max.: minimum and maximum change in a single tool.
Avg.: average change over the entire tool group.
group remains positive. In this case, it is clear that the consolidation of PM tasks produced a
significant positive effect in tool availability and throughput.
Two objectives were accomplished with this case study. First, it validated the PM optimization
algorithm by presenting positive improvements in the tools’ production. And second, the case
study served as proof of concept for the integration of the conversion algorithm [6], [7] for
non-calendar time schedules and the PM scheduling optimization algorithm.
D. Simulations results for Case Study IV: scheduling of mixed-type PM tasks on thin films tools.
Table VII presents the results of the optimization for this case study. In the table, the optimal
PM schedule is given alongside the heuristic schedule. The resulting PM task consolidations in
the tools are highlighted in bold in the third column and respectively marked with the symbols
†, 4, ‡, and ♦. The first column of the table provides the modified PM names. Each PM name
November 30, 2009 DRAFT
26
is comprised of a tool name (Tool#) and chamber name (CH#). Chamber one (CH1) refers to
the tool and chamber 2 (CH2) refers to the subfab.
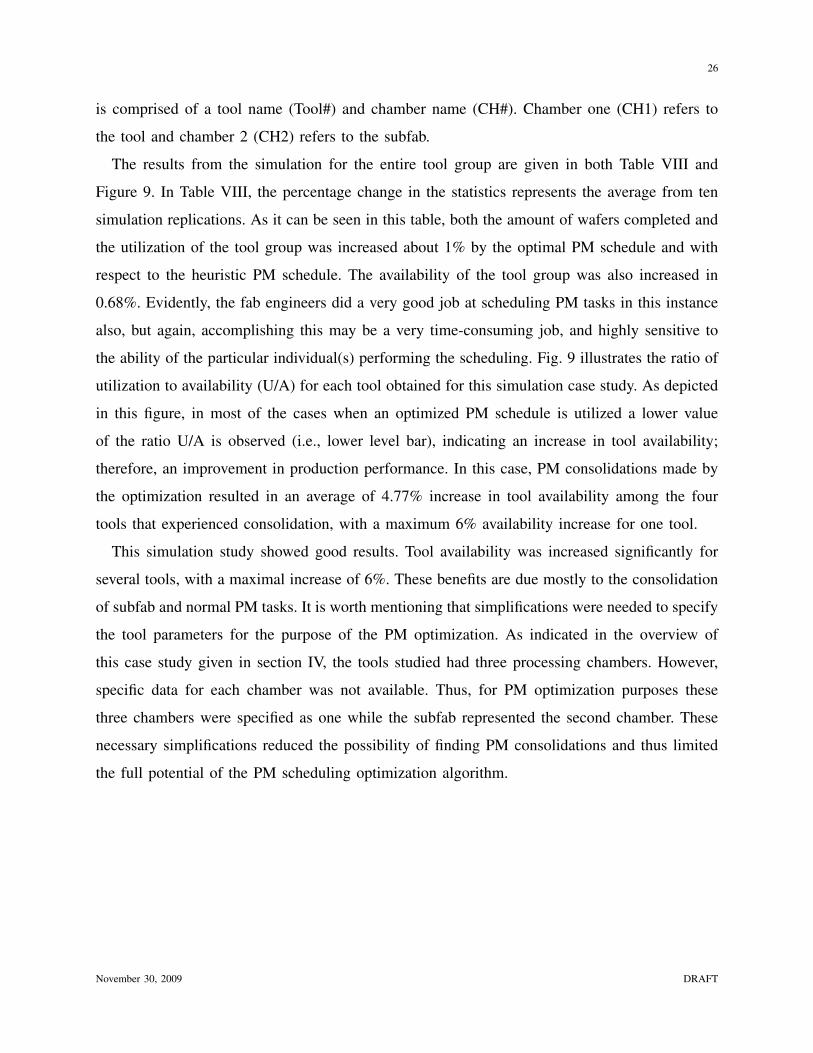
The results from the simulation for the entire tool group are given in both Table VIII and
Figure 9. In Table VIII, the percentage change in the statistics represents the average from ten
simulation replications. As it can be seen in this table, both the amount of wafers completed and
the utilization of the tool group was increased about 1% by the optimal PM schedule and with
respect to the heuristic PM schedule. The availability of the tool group was also increased in
0.68%. Evidently, the fab engineers did a very good job at scheduling PM tasks in this instance
also, but again, accomplishing this may be a very time-consuming job, and highly sensitive to
the ability of the particular individual(s) performing the scheduling. Fig. 9 illustrates the ratio of
utilization to availability (U/A) for each tool obtained for this simulation case study. As depicted
in this figure, in most of the cases when an optimized PM schedule is utilized a lower value
of the ratio U/A is observed (i.e., lower level bar), indicating an increase in tool availability;
therefore, an improvement in production performance. In this case, PM consolidations made by
the optimization resulted in an average of 4.77% increase in tool availability among the four
tools that experienced consolidation, with a maximum 6% availability increase for one tool.
This simulation study showed good results. Tool availability was increased significantly for
several tools, with a maximal increase of 6%. These benefits are due mostly to the consolidation
of subfab and normal PM tasks. It is worth mentioning that simplifications were needed to specify
the tool parameters for the purpose of the PM optimization. As indicated in the overview of
this case study given in section IV, the tools studied had three processing chambers. However,
specific data for each chamber was not available. Thus, for PM optimization purposes these
three chambers were specified as one while the subfab represented the second chamber. These
necessary simplifications reduced the possibility of finding PM consolidations and thus limited
the full potential of the PM scheduling optimization algorithm.
November 30, 2009 DRAFT

27
Table VIICOMPARISON OF HEURISTIC AND OPTIMAL PM SCHEDULES FOR CASE STUDY IV
PM Schedule (Day)
PM Name Heuristic Optimal
Tool5_CH1 17 16
Tool6_CH1 12 10†
Tool6_CH2 5 10†
Tool7_CH2 5 3
Tool8_CH2 16 2
Tool10_CH1 9 6
Tool19_CH1 3 4
Tool20_CH1 3 1
Tool21_CH1 16 144
Tool21_CH2 6 144
Tool22_CH2 6 16
Tool31_CH2 1 8
Tool32_CH2 1 11
Tool33_CH2 17 8
Tool34_CH1 9 10‡
Tool34_CH2 17 10‡
Tool35_CH1 8 6
Tool37_CH1 2 1
Tool39_CH1 15 12♦
Tool39_CH2 8 12♦
†, 4, ‡, ♦: Dates with consolidated PM tasks in a tool.
Table VIIIPERFORMANCE RESULTS FROM CASE STUDY IV: HEURISTIC VS. OPTIMAL PM SCHEDULE
Statistic Change (%)WCOMPS 0.94
AVAIL 0.68UTIL 1.00
November 30, 2009 DRAFT

28
Tool ID
U/A
90%
91%
92%
93%
94%
95%
32 31 37 12 20 14 11 19 10 13 5 8 35 22 7 39 34 33 6 21
Baseline U/A
Optimal U/A
Figure 9. Tool utilization/availability (U/A) improvement using Baseline and Optimal PM schedules, case study IV.
VI. CONCLUSIONS
The architecture and implementation of the software tool PMOST, which utilizes a PM
optimization algorithm for semiconductor manufacturing operations, has been described. To
demonstrate how PMOST can be utilized in practice to improve PM operations, we presented
results from four complex simulation case studies, based on real industrial data, that were
conducted on groups of semiconductor manufacturing tools, located at two separate fabs. Results
from these simulation experiments demonstrated that the PM optimization performed as well as,
if not better than, the heuristic PM policies obtained by the fab engineers, and in Studies III
and IV it performed noticeably better than the available fab’s baseline PM schedules. Software
implementations of PM optimal scheduling algorithms as PMOST, are therefore shown to be a
valuable decision support tool, which can be used by fab engineers to aid in PM scheduling, as
well as a component in efforts to automate the PM scheduling process. Results presented here
also demonstrated an increase in tool production. As such, the utilization of a PM optimization
algorithm can lead to significant improvements in marginal profits.
By presenting here an architecture and the corresponding software implementation of the PM
optimization algorithm, i.e., PMOST, we also aimed to provide guidelines and a template, as
well as experimental data, that can help in the adoption of these by others, and also perhaps
November 30, 2009 DRAFT

29
serve as the basis for generic third-party commercial tools. Moreover, the current version of
PMOST is subject to further improvements. For instance, PMOST currently does not use a
MDL for the optimization model and to generate the corresponding MPS file used by the LP/MIP
solver. However, future versions or modifications of PMOST could include interfaces with MDL
software to facilitate implementation and portability.
REFERENCES
[1] M. Venables, “Small is beatiful: small, low volume semiconductor manufacturing plants,” IEE Review, pp. 26–27, March
2005.
[2] J. Blau, “News analysis: Europe’s semiconductor makers are back in the game,” IEEE Spectr., pp. 18–19, February 2003.
[3] X. Yao, M. C. Fu, S. I. Marcus, and E. Fernandez-Gaucherand, “Optimization of preventive maintenance scheduling for
semiconductor manufacturing systems: models and implementation,” in Proc. 2001 IEEE Int. Conf. on Control Applications,
Mexico City, 2001, pp. 407–411.
[4] ——, “Incorporating production planning into preventive maintenance scheduling in semiconductor fabs,” in Proc. Int.
Conf. on Modeling and Analysis of Semicond. Manuf. (MASM) 2002, Tempe, AZ, 2002, pp. 84–89.
[5] X. Yao, E. Fernandez-Gaucherand, M. C. Fu, and S. I. Marcus, “Optimal preventive maintenance scheduling in
semiconductor manufacturing,” IEEE Trans. Semicond. Manufac., vol. 17, no. 23, pp. 345–356, 2004.
[6] J. A. Ramírez-Hernández and E. Fernández-Gaucherand, “An algorithm to convert wafer to calendar-based preventive
maintenance schedules for semiconductor manufacturing systems,” in Proc. 42ndIEEE Conf. on Decision and Control,
Maui, HI, 2003, pp. 5926–5931.
[7] J. A. Ramírez-Hernández, E. Fernandez, M. O’Connor, and N. Patel, “Conversion of non-calendar to calendar-time based
preventive maintenance schedules for semiconductor manufacturing systems,” J. of Quality in Maintenance Eng., vol. 13,
no. 3, pp. 259–275, 2007.
[8] S. Bhatnagar, E. Fernandez-Gaucherand, M. C. Fu, Y. He, and S. I. Marcus, “A markov decision processes model for
capacity expansion and allocation,” in Proc. 38th IEEE Conf. on Decision and Control, Phoenix, AZ, 1999, pp. 1380–1385.
[9] J. Crabtree, “Optimal preventive maintenance scheduling in semiconductor fabs,” Master’s Thesis Electrical Engineering,
Dept. Elect. & Comp. Eng., University of Cincinnati, Cincinnati, OH, August 2003.
[10] Applied Materials, Inc. Real-Time Dispatcher. [Online]. Available:
http://www.appliedmaterials.com/products/rt_dispatch_2.html
[11] D. Applegate, W. Cook, S. Dash, and M. Mevenkamp. (2009) Mps format. [Online]. Available:
http://www2.isye.gatech.edu/wcook/qsopt/hlp/ff_mps_format.htm
[12] I. Maros, Computational Techniques of the Simplex Method. USA: Kluwer Academic Publishers, 2003.
[13] R. Fourer. Linear programming: 2005 software survey. [Online]. Available: http://www.lionhrtpub.com/orms/orms-6-
05/frsurvey.html
[14] R. Fourer, D. M. Gay, and B. W. Kernighan, “A modeling language for mathematical programming,” Management Science,
vol. 36, pp. 519–554, 1990.
[15] ——, AMPL: A Modeling Language for Mathematical Programming. Duxbury Press Brooks Cole Publishing Company,
1993.
November 30, 2009 DRAFT

30
[16] ILOG, Inc. OPL Studio. [Online]. Available: http://www.ilog.com/products/oplstudio/
[17] D. G. Wilson and B. D. Rudin, “Introduction to the ibm optimization subroutine library,” IBM Systems Journal, vol. 31,
1992.
[18] ILOG, Inc. CPLEX Optimizers. [Online]. Available: http://www.ilog.com/products/cplex/
[19] Applied Materials, Inc. AutoSched AP. [Online]. Available:
http://www.appliedmaterials.com/products/autosched_ap_2.html
[20] T. Phillips, “AutoSched AP by AutoSimulations,” in Proc. 1998 Winter Simulation Conf., 1998, pp. 219–222.
[21] B. W. Kernighan and D. M. Ritchie, The C Programming Language, 1st ed. Englewood Cliffs, NJ: Prentice Hall, 1978.
[22] B. Stroustrup, The C++ Programming Language, special ed. Addison-Wesley, 2000.
November 30, 2009 DRAFT