Embed Size (px)
Citation preview

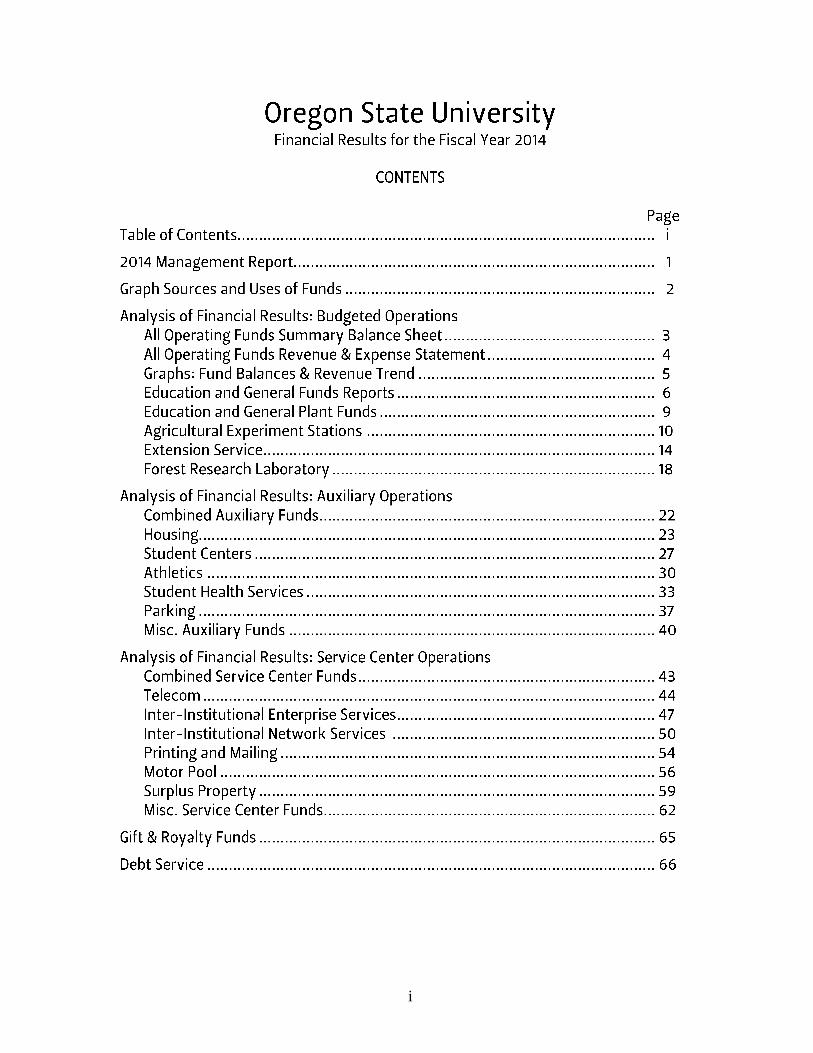
i

1 of 68 Unaudited - For Internal Management Purposes Only

1 Plant funds not included
* Estimated - interfund transactions eliminated
Oregon State UniversitySources & Uses of Funds1
Fiscal Year 2014
Enrollment Fees 36%
Grants 22%
State Appropriations 16%
Other Gov Approp 2%
Sales & Service 14%
Gifts & Royalties 6%
Other Revenue 4% Source of Funds *
$903 million
Enrollment Fees Grants State Appropriations Other Gov Approp
Sales & Service Gifts & Royalties Other Revenue
Salaries & OPE 67%
Services & Supplies 27%
Student Aid 5%
Capital Outlay 1%
Net Transfers 0% Use of Funds *
$896 million
Salaries & OPE Services & Supplies Student Aid Capital Outlay Net Transfers
2 of 68 Unaudited - For Internal Management Purposes Only

Education & Statewide Auxiliary Service Center Gift & Royalty Designated Research
FY2014 General Public Services Enterprises Departments Funds Operations Funds Total2
Current Assets $ 78,190 $ 14,417 $ 45,686 $ 3,596 $ 28,218 $ 4,457 $ 17,994 $ 192,559
Non Current Assets 329,278 4,163 333,441
Total Assets 78,190 14,417 374,964 7,759 28,218 4,457 17,994 526,000
Current Liabilities 44,939 4,975 31,917 1,782 1,783 1,745 20,604 107,745
Non Current Liabilities 270,039 270,039
Fund Balance 33,251 9,442 73,008 5,977 26,435 2,712 ( 2,610) 148,215
Total Liabilities and Fund Balance $ 78,190 $ 14,417 $ 374,964 $ 7,759 $ 28,218 $ 4,457 $ 17,994 $ 526,000
FY2013
Current Assets $ 74,202 $ 12,170 $ 55,614 $ 3,024 $ 25,307 $ 4,792 $ 13,973 $ 189,080
Non Current Assets 290,819 3,512 294,331
Total Assets 74,202 12,170 346,433 6,535 25,307 4,792 13,973 483,411
Current Liabilities 42,074 4,561 18,077 1,487 2,151 1,772 17,160 87,282
Non Current Liabilities 219,510 219,510
Fund Balance 32,128 7,609 108,846 5,049 23,155 3,020 ( 3,187) 176,620
Total Liabilities and Fund Balance $ 74,202 $ 12,170 $ 346,433 $ 6,535 $ 25,307 $ 4,792 $ 13,973 $ 483,411
1 Plant Funds not included.2 Memorandum Only - Interfund eliminations have not been made for certain transactions which are counted in more than one fund, such as internal sales.
Oregon State University
Operating Funds1
Fiscal Year 2014 and 2013(in thousands)
Summary Balance Sheet
3 of 68 Unaudited - For Internal Management Purposes Only

Education & Statewide Auxiliary Service Center Gift & Royalty Designated Research
FY2014 General Public Services Enterprises Departments Funds Operations Funds Total2
Revenue $ 433,924 $ 74,191 $ 140,033 $ 20,086 $ 75,444 $ 14,686 $ 196,825 $ 955,189
Expenditures 432,801 72,358 151,123 20,022 72,165 14,994 196,247 959,711
Net Increase (Decrease in Fund Balance) 1,123 1,833 ( 11,091) 64 3,279 ( 308) 577 ( 4,522)
Beginning Fund Balance 32,128 7,609 108,846 4,773 23,155 3,020 ( 3,187) 176,344
Fund Additions (Deductions) ( 24,747) 1,140 ( 23,607)
Ending Fund Balance $ 33,251 $ 9,442 $ 73,008 $ 5,977 $ 26,435 $ 2,712 ($ 2,610) $ 148,215
FY2013
Revenue $ 389,193 $ 71,286 $ 135,807 $ 23,303 $ 75,964 $ 14,248 $ 199,478 $ 909,280
Expenditures 398,159 70,137 137,339 23,597 71,582 14,309 198,248 913,371
Net Increase (Decrease in Fund Balance) ( 8,967) 1,149 ( 1,532) ( 294) 4,383 ( 60) 1,230 ( 4,091)
Beginning Fund Balance 41,095 6,460 106,512 6,008 18,773 3,080 ( 4,417) 177,511
Fund Additions (Deductions) 3,866 ( 941) 2,925
Ending Fund Balance $ 32,128 $ 7,609 $ 108,846 $ 4,773 $ 23,155 $ 3,020 ($ 3,187) $ 176,344
1 Plant Funds not included.2 Memorandum Only - Interfund eliminations have not been made for certain transactions which are counted in more than one fund, such as internal sales.
Oregon State University
Operating Funds1
Fiscal Year 2014 and 2013(in thousands)
Summary Revenue and Expense Statement
4 of 68 Unaudited - For Internal Management Purposes Only
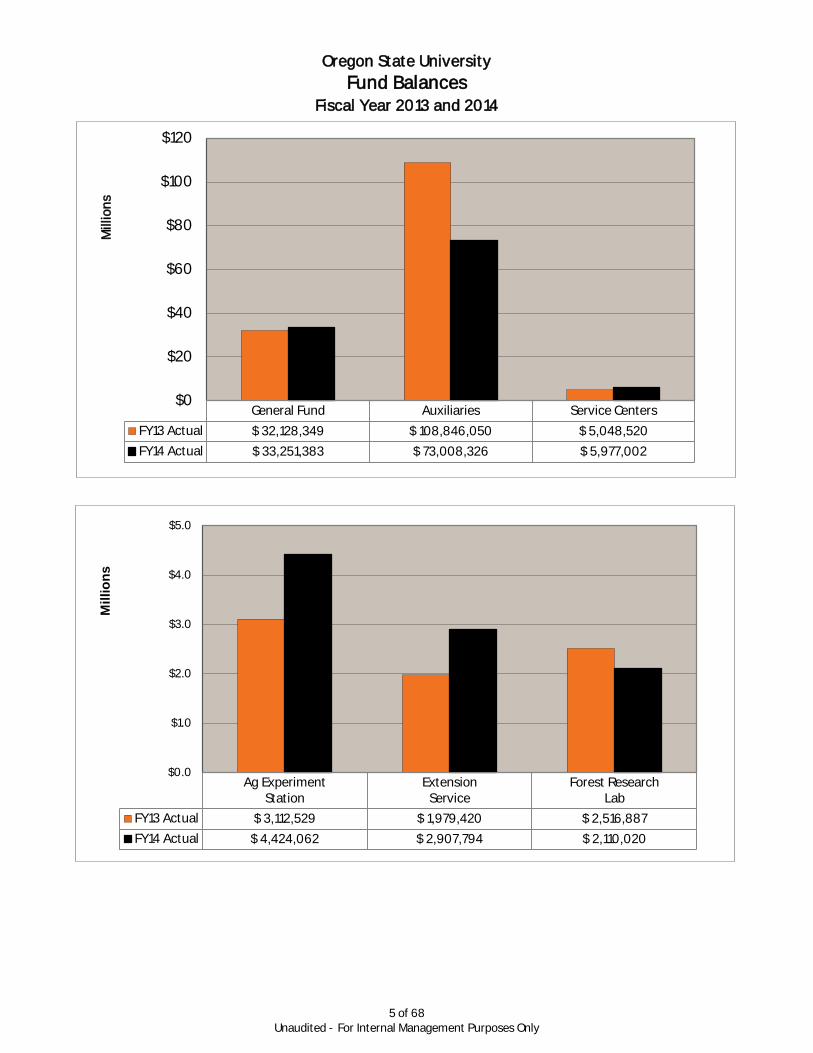
Oregon State University
Fund BalancesFiscal Year 2013 and 2014
General Fund Auxiliaries Service Centers
FY13 Actual $ 32,128,349 $ 108,846,050 $ 5,048,520
FY14 Actual $ 33,251,383 $ 73,008,326 $ 5,977,002
$0
$20
$40
$60
$80
$100
$120
Mill
ion
s
Ag ExperimentStation
ExtensionService
Forest ResearchLab
FY13 Actual $ 3,112,529 $ 1,979,420 $ 2,516,887
FY14 Actual $ 4,424,062 $ 2,907,794 $ 2,110,020
$0.0
$1.0
$2.0
$3.0
$4.0
$5.0
Millio
ns
5 of 68 Unaudited - For Internal Management Purposes Only

6 of 68 Unaudited - For Internal Management Purposes Only

7 of 68 Unaudited - For Internal Management Purposes Only
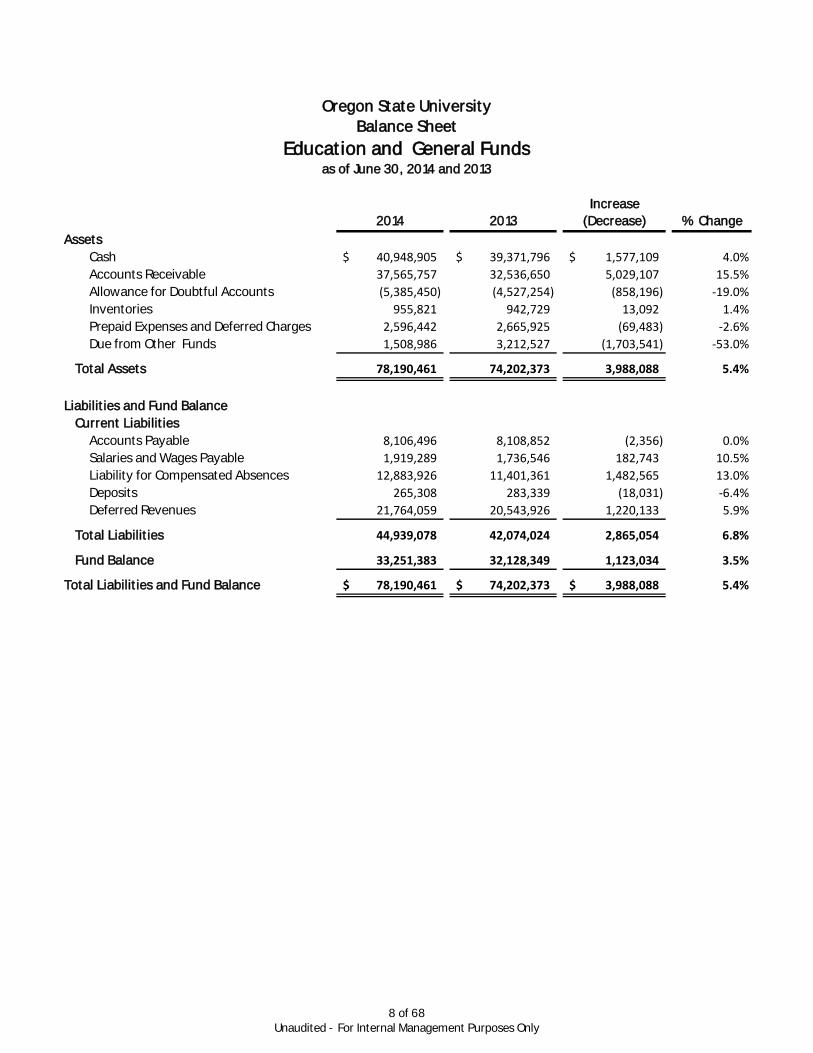
Increase
2014 2013 (Decrease) % Change
Assets
Cash 40,948,905$ 39,371,796$ 1,577,109$ 4.0%
Accounts Receivable 37,565,757 32,536,650 5,029,107 15.5%
Allowance for Doubtful Accounts (5,385,450) (4,527,254) (858,196) -19.0%
Inventories 955,821 942,729 13,092 1.4%
Prepaid Expenses and Deferred Charges 2,596,442 2,665,925 (69,483) -2.6%
Due from Other Funds 1,508,986 3,212,527 (1,703,541) -53.0%
Total Assets 78,190,461 74,202,373 3,988,088 5.4%
Liabilities and Fund Balance
Current Liabilities
Accounts Payable 8,106,496 8,108,852 (2,356) 0.0%
Salaries and Wages Payable 1,919,289 1,736,546 182,743 10.5%
Liability for Compensated Absences 12,883,926 11,401,361 1,482,565 13.0%
Deposits 265,308 283,339 (18,031) -6.4%
Deferred Revenues 21,764,059 20,543,926 1,220,133 5.9%
Total Liabilities 44,939,078 42,074,024 2,865,054 6.8%
Fund Balance 33,251,383 32,128,349 1,123,034 3.5%
Total Liabilities and Fund Balance 78,190,461$ 74,202,373$ 3,988,088$ 5.4%
Oregon State UniversityBalance Sheet
Education and General Fundsas of June 30, 2014 and 2013
8 of 68 Unaudited - For Internal Management Purposes Only

Increase %2014 2013 (Decrease) Change
RevenueEnrollment Fees 321,290,944$ 286,677,315$ 34,613,629$ 12.1%
Fee Remissions (30,837,425) (31,818,897) 981,472 3.1%
State Appropriations 90,705,628 82,309,645 8,395,983 10.2%
F&A Rate Recovery 34,195,656 34,780,919 (585,263) -1.7%
Interest Income 2,949,827 2,600,300 349,527 13.4%
Sales & Services 12,236,954 10,841,287 1,395,667 12.9%
Other Revenue 3,382,597 3,802,042 (419,445) -11.0%
Total Revenue 433,924,181 389,192,611 44,731,570 11.5%
Expense
Total Salaries and OPE 335,237,406 304,513,168 30,724,238 10.1%
Service and Supplies 82,613,169 79,171,506 3,441,663 4.3%
Capital Outlay 4,609,084 8,933,389 (4,324,305) -48.4%
Student Aid 1,136,171 1,326,419 (190,248) -14.3%
Total Expense 423,595,830 393,944,482 29,651,348 7.5%
Net Change From Operations 10,328,351 (4,751,871) 15,080,222 317.4%
Net Transfers In/(Out) (9,205,317) (4,214,952) (4,990,365) -118.4%
Net Increase (Decrease) in Fund Balance 1,123,034 (8,966,823) 10,089,857 112.5%
Beginning Fund Balance 32,128,349 41,095,172 (8,966,823) -21.8%
Ending Fund Balance 33,251,383$ 32,128,349$ 1,123,034$ 3.5%
7.7% 8.3%
Statement of Revenues, Expenses, and Other ChangesOregon State University
Education and General Funds For the Twelve Months Ending June 30, 2014 and 2013
9 of 68 Unaudited - For Internal Management Purposes Only

Beginning Cash as of July 1, 2013 39,371,796$
Net Cash provided (used) by Changes in Assets and Liabilities
June 2013 June 2014 Change
Assets
Accounts Receivable (Net) 28,009,396 32,180,307 (4,170,911)
Inventories 942,729 955,821 (13,092)
Prepaid Expenses & Deferred Charges 2,665,925 2,596,442 69,483
Due From Other Funds 3,212,527 1,508,986 1,703,541
Liabilities
Accounts Payable 8,108,852 8,106,496 (2,356)
Salaries & Wages Payable 1,736,546 1,919,289 182,743
Liability for Compensated Absences 11,401,361 12,883,926 1,482,565
Deposits 283,339 265,308 (18,031)
Deferred Revenues 20,543,926 21,764,059 1,220,133
Total Net Cash Provided (Used) by Changes in Assets and Liabilities 454,075
Cash Provided (Used) by Operating Activities
Revenue
Enrollment Fees 321,290,944
Fee Remissions (30,837,425)
State Appropriations 90,705,628
F&A Rate Recovery 34,195,656
Interest Income 2,949,827
Sales & Services 12,236,954
Other Revenue 3,382,597
Expense
Total Salaries and OPE 335,237,406
Service and Supplies 82,613,169
Capital Outlay 4,609,084
Student Aid 1,136,171
Net Transfers 9,205,317
Total Cash Provided (Used) by Operating Activities 1,123,034
Cash as of June 30, 2014 40,948,905$
Oregon State UniversityStatement of Cash Flows
Education and General FundsFor the Twelve Months Ending June 30, 2014
10 of 68 Unaudited - For Internal Management Purposes Only
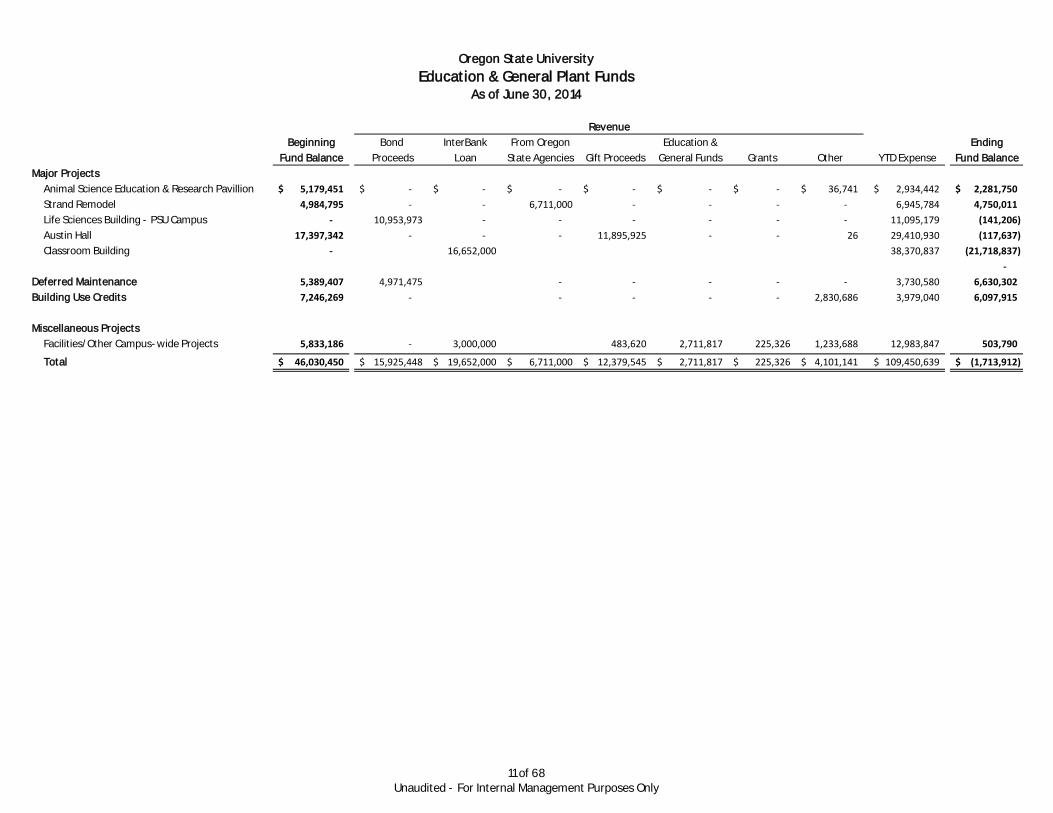
Beginning Bond InterBank From Oregon Education & Ending
Fund Balance Proceeds Loan State Agencies Gift Proceeds General Funds Grants Other YTD Expense Fund Balance
Major Projects
Animal Science Education & Research Pavillion 5,179,451$ -$ -$ -$ -$ -$ -$ 36,741$ 2,934,442$ 2,281,750$
Strand Remodel 4,984,795 - - 6,711,000 - - - - 6,945,784 4,750,011
Life Sciences Building - PSU Campus - 10,953,973 - - - - - - 11,095,179 (141,206)
Austin Hall 17,397,342 - - - 11,895,925 - - 26 29,410,930 (117,637)
Classroom Building - 16,652,000 38,370,837 (21,718,837)
-
Deferred Maintenance 5,389,407 4,971,475 - - - - - 3,730,580 6,630,302
Building Use Credits 7,246,269 - - - - - 2,830,686 3,979,040 6,097,915
Miscellaneous Projects
Facilities/Other Campus-wide Projects 5,833,186 - 3,000,000 483,620 2,711,817 225,326 1,233,688 12,983,847 503,790
Total 46,030,450$ 15,925,448$ 19,652,000$ 6,711,000$ 12,379,545$ 2,711,817$ 225,326$ 4,101,141$ 109,450,639$ (1,713,912)$
Oregon State University
Education & General Plant FundsAs of June 30, 2014
Revenue
11 of 68 Unaudited - For Internal Management Purposes Only

12 of 68 Unaudited - For Internal Management Purposes Only

Increase
2014 2013 (Decrease) % Change
Assets
Cash 5,150,009$ 3,269,773$ 1,880,236$ 57.5%
Accounts Receivable 1,338,411 1,607,720 (269,309) -16.8%
Prepaid Expenses and Deferred Charges 2,581 11,816 (9,235) -78.2%
Total Assets 6,491,001 4,889,309 1,601,692 32.8%
Liabilities and Fund Balance
Current Liabilities
Accounts Payable 212,101 255,074 (42,973) -16.8%
Liability for Compensated Absences 1,854,838 1,521,706 333,132 21.9%
Total Liabilities 2,066,939 1,776,780 290,159 16.3%
Fund Balance 4,424,062 3,112,529 1,311,533 42.1%
Total Liabilities and Fund Balance 6,491,001$ 4,889,309$ 1,601,692$ 32.8%
Oregon State UniversityBalance Sheet
Statewide Operations
as of June 30, 2014 and 2013
Agricultural Experiment Station
13 of 68 Unaudited - For Internal Management Purposes Only

Increae %
2014 2013 (Decrease) Change
Revenue
State Appropriations 27,035,888$ 26,414,682$ 621,206$ 2.4%
Other Governmental Appropriations 4,130,243 2,696,099 1,434,144 53.2%
Interest Income 227 191 36 18.8%
Sales & Services 1,853,921 1,849,842 4,079 0.2%
Other Revenue 12,494 161,376 (148,882) -92.3%
Total Revenue 33,032,773 31,122,190 1,910,583 6.1%
Expense
Total Salaries and OPE 25,337,555 25,055,947 281,608 1.1%
Service and Supplies 6,829,329 6,346,781 482,548 7.6%
Capital Outlay 198,747 456,718 (257,971) -56.5%
Total Expense 32,365,631 31,859,446 506,185 1.6%
Net Change From Operations 667,142 (737,256) 1,404,398 190.5%
Net Transfers In/(Out) 644,391 634,754 9,637 1.5%
Net Increase (Decrease) in Fund Balance 1,311,533 (102,502) 1,414,035 1379.5%
Beginning Fund Balance 3,112,529 3,215,031 (102,502) -3.2%
Fund Additions from Other Funds -
Ending Fund Balance 4,424,062$ 3,112,529$ 1,311,533$ 42.1%
For the Twelve Months Ending June 30, 2014 and 2013
Oregon State UniversityStatement of Revenues, Expenses, and Other Changes
Statewide Operations
Agricultural Experiment Station
14 of 68 Unaudited - For Internal Management Purposes Only

Beginning Cash as of July 1, 2013 3,269,773$
Net Cash provided (used) by Changes in Assets and Liabilities
June 2013 June 2014 Change
Assets
Accounts Receivable 1,607,720 1,338,411 269,309
Prepaid Expenses and Deferred Charges 11,816 2,581 9,235
Liabilities
Accounts Payable 255,074 212,101 (42,973)
Liability for Compensated Absences 1,521,706 1,854,838 333,132
Total Net Cash Provided (Used) by Changes in Assets and Liabilities 568,703
Cash Provided (Used) by Operating Activities
Revenue
State Appropriations 27,035,888
Other Governmental Appropriations 4,130,243
Interest Income 227
Sales & Services 1,853,921
Other Revenue 12,494
Expense
Total Salaries and OPE 25,337,555
Service and Supplies 6,829,329
Capital Outlay 198,747
Net Transfers (644,391)
Total Cash Provided (Used) by Operating Activities 1,311,533
Cash as of June 30, 2014 5,150,009$
For the Twelve Months Ending June 30, 2014
Oregon State UniversityStatement of Cash Flows
Statewide Operations
Agricultural Experiment Station
15 of 68 Unaudited - For Internal Management Purposes Only
16 of 68
Unaudited - For Internal Management Purposes Only

Increase
2014 2013 (Decrease) % Change
Assets
Cash 4,282,961$ 2,334,533$ 1,948,428$ 83.5%
Accounts Receivable 818,093 1,954,156 (1,136,063) -58.1%
Inventories 59,332 38,603 20,729 53.7%
Prepaid Expenses and Deferred Charges 45,375 31,006 14,369 46.3%
Total Assets 5,205,761 4,358,298 847,463 19.4%
Liabilities and Fund Balance
Current Liabilities
Accounts Payable 227,732 203,820 23,912 11.7%
Liability for Compensated Absences 2,065,250 2,171,963 (106,713) -4.9%
Deposits 4,895 3,095 1,800 58.2%
Deferred Revenues 90 - 90 -
Total Liabilities 2,297,967 2,378,878 (80,911) -3.4%
Fund Balance 2,907,794 1,979,420 928,374 46.9%
Total Liabilities and Fund Balance 5,205,761$ 4,358,298$ 847,463$ 19.4%
Oregon State UniversityBalance Sheet
Statewide Operations
as of June 30, 2014 and 2013
Extension Service
17 of 68 Unaudited - For Internal Management Purposes Only

Increase %
2014 2013 (Decrease) Change
Revenue
State Appropriations 19,555,668$ 19,106,335$ 449,333$ 2.4%
Other Governmental Appropriations 12,393,962 12,539,116 (145,154) -1.2%
Sales & Services 1,154,482 1,087,238 67,244 6.2%
Other Revenue 156,269 189,643 (33,374) -17.6%
Total Revenue 33,260,381 32,922,332 338,049 1.0%
Expense
Total Salaries and OPE 27,141,827 26,705,936 435,891 1.6%
Service and Supplies 5,928,315 5,707,453 220,862 3.9%
Capital Outlay 14,953 92,105 (77,152) -83.8%
Total Expense 33,085,095 32,505,494 579,601 1.8%
Net Change From Operations 175,286 416,838 (241,552) -57.9%
Net Transfers In/(Out) 753,088 708,600 44,488 6.3%
Net Increase (Decrease) in Fund Balance 928,374 1,125,438 (197,064) -17.5%
Beginning Fund Balance 1,979,420 853,982 1,125,438 131.8%
Ending Fund Balance 2,907,794$ 1,979,420$ 928,374$ 46.9%
Statement of Revenues, Expenses, and Other ChangesOregon State University
Statewide Operations
For the Twelve Months Ending June 30, 2014 and 2013
Extension Service
18 of 68 Unaudited - For Internal Management Purposes Only

Beginning Cash as of July 1, 2013 2,334,533$
Net Cash provided (used) by Changes in Assets and Liabilities
June 2013 June 2014 Change
Assets
Accounts Receivable 1,954,156 818,093 1,136,063
Inventories 38,603 59,332 (20,729)
Prepaid Expenses and Deferred Charges 31,006 45,375 (14,369)
Liabilities
Accounts Payable 203,820 227,732 23,912
Liability for Compensated Absences 2,171,963 2,065,250 (106,713)
Deposits 3,095 4,895 1,800
Deferred Revenues - 90 90
Total Net Cash Provided (Used) by Changes in Assets and Liabilities 1,020,054
Cash Provided (Used) by Operating Activities
Revenue
State Appropriations 19,555,668
Other Governmental Appropriations 12,393,962
Sales & Services 1,154,482
Other Revenue 156,269
Expense
Total Salaries and OPE 27,141,827
Service and Supplies 5,928,315
Capital Outlay 14,953
Net Transfers (753,088)
Total Cash Provided (Used) by Operating Activities 928,374
Cash as of June 30, 2014 4,282,961$
For the Twelve Months Ending June 30, 2014
Oregon State UniversityStatement of Cash Flows
Statewide Operations
Extension Service
19 of 68 Unaudited - For Internal Management Purposes Only

20 of 68
Unaudited - For Internal Management Purposes Only

Increase
2014 2013 (Decrease) % Change
Assets
Cash 2,692,969$ 2,897,087$ (204,118)$ -7.0%
Accounts Receivable 21,460 21,900 (440) -2.0%
Prepaid Expenses and Deferred Charges 5,842 2,971 2,871 96.6%
Total Assets 2,720,271 2,921,958 (201,687) -6.9%
Liabilities and Fund Balance
Current Liabilities
Accounts Payable 53,191 20,833 32,358 155.3%
Liability for Compensated Absences 557,060 384,238 172,822 45.0%
Total Liabilities 610,251 405,071 205,180 50.7%-
Fund Balance 2,110,020 2,516,887 (406,867) -16.2%-
Total Liabilities and Fund Balance 2,720,271$ 2,921,958$ (201,687)$ -6.9%
Oregon State UniversityBalance Sheet
Statewide Operations
as of June 30, 2014 and 2013
Forest Research Laboratory
21 of 68 Unaudited - For Internal Management Purposes Only

Increase %
2014 2013 (Decrease) Change
Revenue
State Appropriations 2,974,678$ 2,906,329$ 68,349$ 2.4%
Other Governmental Appropriations 943,793 1,061,001 (117,208) -11.0%
Transfers From State Agencies 3,812,562 3,115,735 696,827 22.4%
Sales & Services 162,854 156,526 6,328 4.0%
Other Revenue 4,028 1,885 2,143 113.7%
Total Revenue 7,897,915 7,241,476 656,439 9.1%
Expense
Total Salaries and OPE 7,102,400 5,887,813 1,214,587 20.6%
Service and Supplies 1,292,660 1,291,528 1,132 0.1%
Capital Outlay 9,451 43,557 (34,106) -78.3%
Total Expense 8,404,511 7,222,898 1,181,613 16.4%
Net Change From Operations (506,596) 18,578 (525,174) -2826.9%
Net Transfers In/(Out) 99,729 107,489 (7,760) -7.2%
Net Increase (Decrease) in Fund Balance (406,867) 126,067 (532,934) -422.7%
Beginning Fund Balance 2,516,887 2,390,820 126,067 5.3%
Ending Fund Balance 2,110,020$ 2,516,887$ (406,867)$ -16.2%
For the Twelve Months Ending June 30, 2014 and 2013
Oregon State UniversityStatement of Revenues, Expenses, and Other Changes
Statewide Operations
Forest Research Laboratory
22 of 68 Unaudited - For Internal Management Purposes Only

Beginning Cash as of July 1, 2013 2,897,087$
Net Cash provided (used) by Changes in Assets and Liabilities
June 2013 June 2014 Change
Assets
Accounts Receivable 21,900 21,460 440
Prepaid Expenses and Deferred Charges 2,971 5,842 (2,871)
Liabilities
Accounts Payable 20,833 53,191 32,358
Liability for Compensated Absences 384,238 557,060 172,822
Total Net Cash Provided (Used) by Changes in Assets and Liabilities 202,749
Cash Provided (Used) by Operating Activities
Revenue
State Appropriations 2,974,678
Other Governmental Appropriations 943,793
Transfers From State Agencies 3,812,562
Sales & Services 162,854
Other Revenue 4,028
Expense
Total Salaries and OPE 7,102,400
Service and Supplies 1,292,660
Capital Outlay 9,451
Net Transfers (99,729)
Total Cash Provided (Used) by Operating Activities (406,867)
Cash as of June 30, 2014 2,692,969$
For the Twelve Months Ending June 30, 2014
Oregon State UniversityStatement of Cash Flows
Statewide Operations
Forest Research Laboratory
23 of 68 Unaudited - For Internal Management Purposes Only

Student Cntrs Health Fiscal Year Fiscal Year Increase %Housing & Activities Athletics Services Parking Miscellaneous 2014 2013 (Decrease) Change
RevenueStudent Fees -$ 31,773,997$ -$ 4,362$ - 319,896$ 32,098,255$ 31,833,813$ 264,442$ 0.82%
Lottery Proceeds - - 440,000 - - - 440,000 784,243 (344,243) -78.24%
Gifts, Grants & Contracts - 150,000 50,300 - - - 200,300 903,754 (703,454) -351.20%
Interest Income - 342,841 858,201 142,169 - 12,467 1,355,678 1,198,276 157,402 11.61%
Sales & Services 46,405,554 5,620,368 37,772,730 5,196,194 2,371,428 3,456,983 100,823,257 96,300,067 4,523,190 4.49%
Other Revenue 61,956 151,250 1,666,865 158,925 9,359 17,273 2,065,628 1,854,169 211,459 10.24%
Internal Sales 1,676,787 498,518 83,082 7,465 179,566 604,026 3,049,444 2,933,031 116,413 3.82%
Total Revenue 48,144,297 38,536,974 40,871,178 5,509,115 2,560,353 4,410,645 140,032,562 135,807,353 4,225,209 3.02%
Expense
Total Salaries and OPE 16,036,395 11,231,505 24,062,130 8,840,750 699,480 1,504,526 62,374,786 52,114,815 10,259,971 16.45%
Service and Supplies 25,234,420 9,507,208 22,926,405 5,915,195 1,063,521 2,721,373 67,368,122 60,087,602 7,280,520 10.81%
Depreciation 5,575,928 1,937,176 5,988,247 173,042 802,883 185,766 14,663,042 13,642,255 1,020,787 6.96%
Student Aid - - 9,450,699 - - - 9,450,699 8,800,504 650,195 6.88%
Total Expense 46,846,743 22,675,889 62,427,481 14,928,987 2,565,884 4,411,665 153,856,649 134,645,176 19,211,473 12.49%
Net Change From Operations 1,297,554 15,861,085 (21,556,303) (9,419,872) (5,531) (1,020) (13,824,087) 1,162,177 (14,986,264) 108.41%
Fixed Asset Disposal Gain/(Loss) - (10,322) - - (14,500) - (24,822) (54,137) 29,315 118.10%
Transfers In 6,751,590 16,700,998 6,004,427 9,335,990 - 515,239 39,308,244 31,706,453 7,601,791 19.34%
Transfers Out (6,753,333) (28,706,197) (335,406) (466) - (754,861) (36,550,263) (34,346,039) (2,204,224) -6.03%
Net Increase (Decrease) in Fund Balance 1,295,811 3,845,564 (15,887,282) (84,348) (20,031) (240,642) (11,090,928) (1,531,546) (9,559,382) -86.19%
Beginning Operations Fund Balance (823,452) 43,517,449 39,484,300 12,311,109 7,113,659 7,242,987 108,846,052 106,511,842 2,334,210 2.14%
Fund Additions/Deductions (745,909) (21,006,665) 5,283,817 258,750 27,938 (2,466,127) (18,648,196) 3,865,756 (22,513,952) 120.73%
Ending Fund Balance from Operations (273,550) 26,356,348 28,880,835 12,485,511 7,121,566 4,536,218 79,106,928 108,846,052 (29,739,124) -37.59%
Beginning Plant Fund Balance 13,136,662 7,389,526 2,066,387 1,263,746 849,456 2,038,731 26,744,508 21,540,652 5,203,856 19.46%
Plant Revenues 471,382 1,309,788 721,098 11,907 10,760 20,974 2,545,909 3,143,572 (597,663) -23.48%
Plant Expenditures (22,574,797) (29,817,866) (2,088,145) (285,366) - (307,627) (55,073,801) (28,816,820) (26,256,981) -47.68%
Net Transfers 20,325,372 56,053,595 32,216 (126,174) (7,225) 145,205 76,422,989 27,796,557 48,626,432 63.63%
Net Incr (Decr) in Plant Fund Balance 11,358,619 34,935,043 731,556 864,113 852,991 1,897,283 50,639,605 23,663,961 26,975,644 53.27%
Fund Additions (Deductions) 3,000,000 378,225 - 26,616 (200,000) 348,190 3,553,031 3,080,547 472,484 13.30%
Ending Plant Fund Balance 14,358,619 35,313,268 731,556 890,729 652,991 2,245,473 54,192,636 26,744,508 27,448,128 50.65%
Total Operations & Plant Fund Balance 14,085,069$ 61,669,616$ 29,612,391$ 13,376,240$ 7,774,557$ 6,781,691$ 133,299,564$ 135,590,560$ (2,290,996)$ -1.72%
Oregon State UniversityStatement of Revenues, Expenses, and Other Changes
Auxiliary EnterprisesFor the Twelve Months Ending June 30, 2014 and 2013
24 of 68 Unaudited - For Internal Management Purposes Only

25 of 68 Unaudited - For Internal Management Purposes Only

26 of 68 Unaudited - For Internal Management Purposes Only

Increase
2014 2013 (Decrease) % Change
Assets
Current Assets
Cash 9,489,904$ 9,185,290$ 304,614$ 3.3%
Restricted Cash 13,206,422 8,581,243 4,625,179 53.9%
Accounts Receivable 2,294,728 2,056,133 238,595 11.6%
Allowance for Doubtful Accounts (290,168) (253,526) (36,642) -14.5%
Inventories 298,766 241,889 56,877 23.5%
Prepaid Expenses and Deferred Charges - 591,197 (591,197) -
Total Current Assets 24,999,652 20,402,226 4,597,426 22.5%
Non-Current Assets
Restricted Cash 5,971,962 5,155,772 816,190 15.8%
Fixed Assets 181,304,629 158,783,079 22,521,550 14.2%
Accumulated Depreciation (65,889,082) (60,365,982) (5,523,100) -9.1%
Total Non-Current Assets 121,387,509 103,572,869 17,814,640 17.2%
Total Assets 146,387,161 123,975,095 22,412,066 18.1%
Liabilities and Fund Balance
Current Liabilities
Accounts Payable 5,377,216 1,214,542 4,162,674 342.7%
Liability for Compensated Absences 561,060 761,953 (200,893) -26.4%
Deferred Revenues 325,965 179,356 146,609 81.7%
Deposits 19,832 96,870 (77,038) -79.5%
Current Portion of Long Term Liabilities 9,555,360 10,678,366 (1,123,006) -10.5%
Total Current Liabilities 15,839,433 12,931,087 2,908,346 22.5%
Non-Current Liabilities
Internal Bank Loan 113,696,724 96,222,803 17,473,921 18.2%
Longterm Notes Payable 2,765,935 2,507,995 257,940 10.3%Total Non-Current Liabilities 116,462,659 98,730,798 17,731,861 18.0%
Total Liabilities 132,302,092 111,661,885 20,640,207 18.5%
Fund Balance 14,085,069 12,313,210 1,771,859 14.4%
Total Liabilities and Fund Balance 146,387,161$ 123,975,095$ 22,412,066$ 18.1%
Working Capital
Current Assets 24,999,652$ 20,402,226$ 4,597,426$ 22.5%
Less: Current Liabilities 15,839,433 12,931,087 2,908,346 22.5%
End of Period Working Capital 9,160,219$ 7,471,139$ 1,689,080$ -22.6%
Oregon State UniversityBalance Sheet
Auxiliary Funds - Housing & Dining Servicesas of June 30, 2014 and 2013
27 of 68 Unaudited - For Internal Management Purposes Only

Increase %
2014 2013 (Decrease) Change
Revenues
Sales & Services 46,405,554$ 41,026,038$ 5,379,516$ 13.1%
Other Revenue 61,956 44,096 17,860 40.5%
Internal Sales 1,676,787 1,674,525 2,262 0.1%
Total Revenues 48,144,297 42,744,659 5,399,638 12.6%
Expenses
Total Salaries and OPE 16,036,395 15,030,162 1,006,233 6.7%
Service and Supplies 25,234,420 20,966,047 4,268,373 20.4%
Depreciation 5,575,928 5,289,939 285,989 5.4%
Total Expenses 46,846,743 41,286,148 5,560,595 13.5%
Net Change From Operations 1,297,554 1,458,511 (160,957) -11.0%
Fixed Asset Disposal Gain/(Loss) - (25,023) 25,023 -
Transfers In 6,751,590 - 6,751,590 -
Transfers Out (6,753,333) (80,000) (6,673,333) -8341.7%
Net Increase (Decrease) in Fund Balance 1,295,811 1,353,488 (57,677) -4.3%
Beginning Operations Fund Balance (823,452) 4,396,653 (5,220,105) -118.7%
NIP Change in Fixed Assets 22,348,624 4,982,194 17,366,430 348.6%
Fund Additions/Deductions for Internal Loans (19,836,592) (9,356,175) (10,480,417) -112.0%
Fund Additions for Bonded Debt (257,941) 323,765 (581,706) -179.7%
Fund Deductions to Other Funds - (2,440,000) 2,440,000 -
Fund Deductions to Reserves (3,000,000) (83,377) (2,916,623) -3498.1%
Ending Fund Balance From Operations (273,550)$ (823,452)$ 549,902$ 66.8%
Beginning Plant Fund Balance 13,136,662$ 8,974,730$ 4,161,932 46.4%Plant Revenue - Interest 53,485 52,887 598 1.1%Other Revenue 417,897 - 417,897 -Expenses (22,574,797) (8,382,779) (14,192,018) -169.3%Transfers In 33,606,029 18,065,679 15,540,350 86.0%Transfers Out (13,280,657) (8,097,232) (5,183,425) -64.0%Fund Additions/Deductions 3,000,000 2,523,377 476,623 18.9%
Ending Plant Fund Balance 14,358,619$ 13,136,662$ 1,221,957$ 9.3%
Statement of Revenues, Expenses, and Other ChangesOregon State University
Auxiliary Funds - Housing & Dining ServicesFor the Twelve Months Ending June 30, 2014 and 2013
28 of 68 Unaudited - For Internal Management Purposes Only

29 of 68
Unaudited - For Internal Management Purposes Only

Increase
2014 2013 (Decrease) % Change
Assets
Current Assets
Cash 23,997,841$ 19,462,340$ 4,535,501$ 23.3%
Restricted Cash 37,231,092 6,518,108 30,712,984 471.2%
Accounts Receivable 1,717,884 1,800,944 (83,060) -4.6%
Allowance for Doubtful Accounts (215,672) (224,571) 8,899 4.0%
Inventories 9,032 8,029 1,003 12.5%
Prepaid Expenses and Deferred Charges 9,709 5,799 3,910 67.4%
Total Current Assets 62,749,886 27,570,649 35,179,237 127.6%
Non-Current Assets
Restricted Cash 7,397,378 2,871,458 4,525,920 157.6%
Fixed Assets 92,862,632 63,695,886 29,166,746 45.8%
Accumulated Depreciation (28,904,899) (27,093,527) (1,811,372) -6.7%
Total Non-Current Assets 71,355,111 39,473,817 31,881,294 80.8%
Total Assets 134,104,997 67,044,466 67,060,531 100.0%
Liabilities and Fund Balance
Current Liabilities
Accounts Payable 8,701,376 1,663,037 7,038,339 423.2%
Liability for Compensated Absences 413,994 420,195 (6,201) -1.5%
Deposits 226,697 184,326 42,371 23.0%
Deferred Revenues 1,942,901 1,937,221 5,680 0.3%
Current Portion of Long Term Liabilities 1,324,935 2,683,386 (1,358,451) -50.6%
Total Current Liabilities 12,609,903 6,888,165 5,721,738 83.1%
Non-Current Liabilities
Internal Bank Loan 59,819,892 9,244,328 50,575,564 547.1%
Bonds Payable 5,586 4,998 588 11.8%
Total Non-Current Liabilities 59,825,478 9,249,326 50,576,152 546.8%
Total Liabilities 72,435,381 16,137,491 56,297,890 348.9%
Fund Balance 61,669,616 50,906,975 10,762,641 21.1%
Total Liabilities and Fund Balance 134,104,997$ 67,044,466$ 67,060,531$ 100.0%
Working Capital
Current Assets 62,749,886$ 27,570,649$ 35,179,237$ 127.6%
Less: Current Liabilities 12,609,903 6,888,165 5,721,738 83.1%
End of Period Working Capital 50,139,983$ 20,682,484$ 29,457,499$ 142.4%
Oregon State UniversityBalance Sheet
Auxiliary Funds - Student Centers & Activities/Fee ClearingAs of June 30, 2014 and 2013
30 of 68 Unaudited - For Internal Management Purposes Only
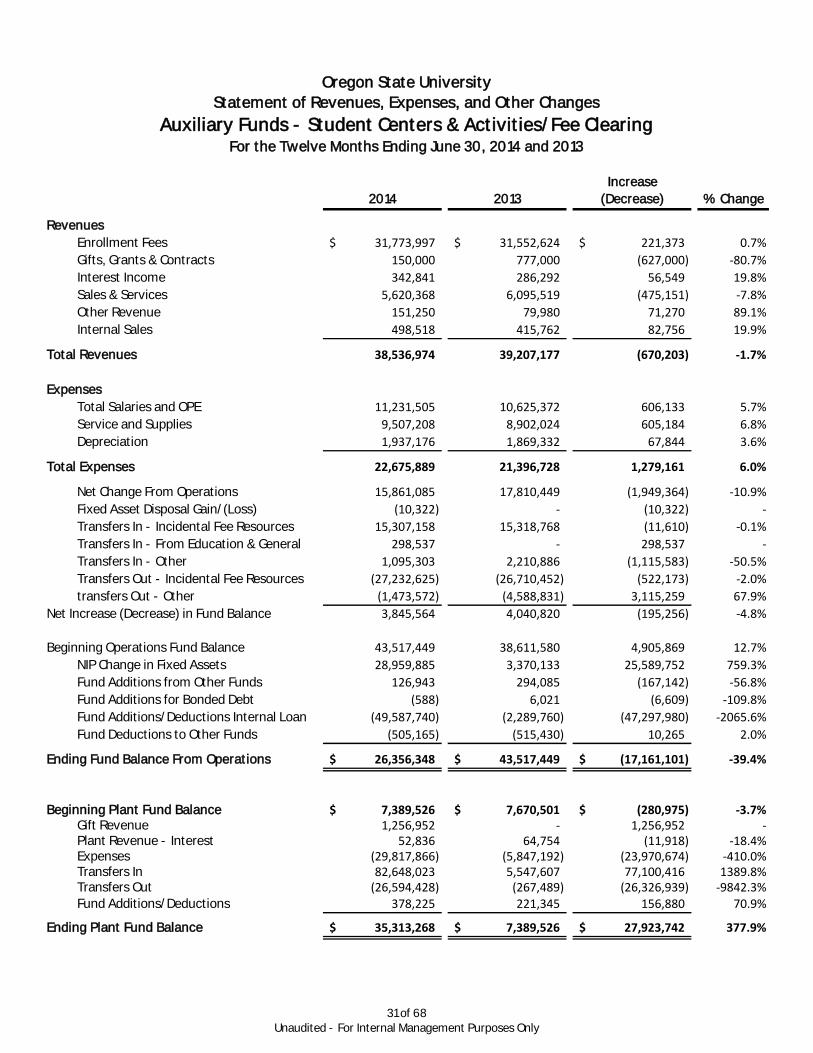
Increase
2014 2013 (Decrease) % Change
Revenues
Enrollment Fees 31,773,997$ 31,552,624$ 221,373$ 0.7%
Gifts, Grants & Contracts 150,000 777,000 (627,000) -80.7%
Interest Income 342,841 286,292 56,549 19.8%
Sales & Services 5,620,368 6,095,519 (475,151) -7.8%
Other Revenue 151,250 79,980 71,270 89.1%
Internal Sales 498,518 415,762 82,756 19.9%
Total Revenues 38,536,974 39,207,177 (670,203) -1.7%
Expenses
Total Salaries and OPE 11,231,505 10,625,372 606,133 5.7%
Service and Supplies 9,507,208 8,902,024 605,184 6.8%
Depreciation 1,937,176 1,869,332 67,844 3.6%
Total Expenses 22,675,889 21,396,728 1,279,161 6.0%
Net Change From Operations 15,861,085 17,810,449 (1,949,364) -10.9%
Fixed Asset Disposal Gain/(Loss) (10,322) - (10,322) -
Transfers In - Incidental Fee Resources 15,307,158 15,318,768 (11,610) -0.1%
Transfers In - From Education & General 298,537 - 298,537 -
Transfers In - Other 1,095,303 2,210,886 (1,115,583) -50.5%
Transfers Out - Incidental Fee Resources (27,232,625) (26,710,452) (522,173) -2.0%
transfers Out - Other (1,473,572) (4,588,831) 3,115,259 67.9%
Net Increase (Decrease) in Fund Balance 3,845,564 4,040,820 (195,256) -4.8%
Beginning Operations Fund Balance 43,517,449 38,611,580 4,905,869 12.7%
NIP Change in Fixed Assets 28,959,885 3,370,133 25,589,752 759.3%
Fund Additions from Other Funds 126,943 294,085 (167,142) -56.8%
Fund Additions for Bonded Debt (588) 6,021 (6,609) -109.8%
Fund Additions/Deductions Internal Loan (49,587,740) (2,289,760) (47,297,980) -2065.6%
Fund Deductions to Other Funds (505,165) (515,430) 10,265 2.0%
Ending Fund Balance From Operations 26,356,348$ 43,517,449$ (17,161,101)$ -39.4%
Beginning Plant Fund Balance 7,389,526$ 7,670,501$ (280,975)$ -3.7%Gift Revenue 1,256,952 - 1,256,952 -Plant Revenue - Interest 52,836 64,754 (11,918) -18.4%Expenses (29,817,866) (5,847,192) (23,970,674) -410.0%Transfers In 82,648,023 5,547,607 77,100,416 1389.8%Transfers Out (26,594,428) (267,489) (26,326,939) -9842.3%Fund Additions/Deductions 378,225 221,345 156,880 70.9%
Ending Plant Fund Balance 35,313,268$ 7,389,526$ 27,923,742$ 377.9%
For the Twelve Months Ending June 30, 2014 and 2013
Oregon State UniversityStatement of Revenues, Expenses, and Other Changes
Auxiliary Funds - Student Centers & Activities/Fee Clearing
31 of 68 Unaudited - For Internal Management Purposes Only

32 of 68
Unaudited - For Internal Management Purposes Only

Increase
2014 2013 (Decrease) % Change
Assets
Current Assets
Cash (6,982,653)$ 3,195,473$ (10,178,126)$ -318.5%
Accounts Receivable 4,514,519 2,232,286 2,282,233 102.2%
Allowance for Doubtful Accounts (25) (556) 531 95.5%
Prepaid Expenses and Deferred Charges 155,347 148,349 6,998 4.7%
Total Current Assets (2,312,812) 5,575,552 (7,888,364) -141.5%
Non-Current Assets
Restricted Cash 810,444 3,784,133 (2,973,689) -78.6%
Fixed Assets 183,141,799 180,999,542 2,142,257 1.2%
Accumulated Depreciation (50,612,884) (44,624,439) (5,988,445) -13.4%
Total Non-Current Assets 133,339,359 140,159,236 (6,819,877) -4.9%
Total Assets 131,026,547 145,734,788 (14,708,241) -10.1%
Liabilities and Fund Balance
Current Liabilities
Accounts Payable 761,255 2,452,872 (1,691,617) -69.0%
Liability for Compensated Absences 609,729 528,266 81,463 15.4%
Employee Termination Liability - Current 1,288,726 - 1,288,726 -
Notes Payable 202,676 290,352 (87,676) -30.2%
Due to Other Funds - 2,000,000 (2,000,000) -
Deferred Revenues 5,922,368 5,648,124 274,244 4.9%
Current Portion of Long Term Liabilities 4,156,892 3,646,642 510,250 14.0%
Total Current Liabilities 12,941,646 14,566,256 (1,624,610) -11.2%
Non-Current Liabilities
Internal Bank Loan 84,651,236 88,675,405 (4,024,169) -4.5%
Employee Termination Liability 2,752,454 - 2,752,454 -
Long-term Notes Payable 1,068,820 942,440 126,380 13.4%
Total Non-Current Liabilities 88,472,510 89,617,845 (1,145,335) -1.3%
Total Liabilities 101,414,156 104,184,101 (2,769,945) -2.7%
Fund Balance 29,612,391 41,550,687 (11,938,296) -28.7%
Total Liabilities and Fund Balance 131,026,547$ 145,734,788$ (14,708,241)$ -10.1%
-$
Working Capital
Current Assets (2,312,812)$ 5,575,552$ (7,888,364)$ -141.5%
Less: Current Liabilities 12,941,646 14,566,256 (1,624,610) -11.2%
End of Period Working Capital (15,254,458)$ (8,990,704)$ (6,263,754)$ -69.7%
Oregon State UniversityBalance Sheet
Auxiliary Funds - AthleticsAs of June 30, 2014 and 2013
33 of 68 Unaudited - For Internal Management Purposes Only

Increase %
2014 2013 (Decrease) Change
Revenues
Gifts, Grants, and Contracts 50,300$ 126,754$ (76,454)$ -60.3%
Interest Income 858,201 760,845 97,356 12.8%
Lottery Proceeds 440,000 784,243 (344,243) -43.9%
Sales & Services 37,772,730 38,063,434 (290,704) -0.8%
Other Revenue 1,666,865 1,582,386 84,479 5.3%
Internal Sales 83,082 82,950 132 0.2%
Total Revenues 40,871,178 41,400,612 (529,434) -1.3%
Expenses
Total Salaries and OPE 24,062,130 15,465,886 8,596,244 55.6%
Service and Supplies 22,926,405 17,855,168 5,071,237 28.4%
Student Aid 9,450,699 8,800,504 650,195 7.4%
Depreciation 5,988,247 5,305,729 682,518 12.9%
Total Expenses 62,427,481 47,427,287 15,000,194 31.6%
Net Change From Operations (21,556,303) (6,026,675) (15,529,628) -257.7%
Fixed Asset Disposal Gain/(Loss) - - - -
Transfers In - Incidental Fees 2,502,830 2,565,348 (62,518) -2.4%
Transfers In - From Education & General 3,354,375 - 3,354,375 -
Transfers In - Other 147,222 80,612 66,610 82.6%
Transfers Out (335,406) (280,000) (55,406) -19.8%
Net Increase (Decrease) in Fund Balance (15,887,282) (3,660,715) (12,226,567) -334.0%
Beginning Operations Fund Balance 39,484,300 37,036,009 2,448,291 6.6%
NIP Change in Fixed Assets 2,031,656 14,702,866 (12,671,210) -86.2%
Fund Additions for Bonded Debt (126,379) 235,948 (362,327) -153.6%
Fund Additions/Deductions for Internal Loans 3,378,540 (8,829,808) 12,208,348 138.3%
Ending Fund Balance From Operations 28,880,835$ 39,484,300$ (10,603,465)$ -26.9%
Beginning Plant Fund Balance 2,066,387$ 850,783$ 1,215,604$ 142.9%
Plant Revenue - Interest 8,720 7,417 1,303 17.6%
Plant Revenue - Gifts 712,378 2,976,572 (2,264,194) -76.1%
Expenses (2,088,145) (14,302,955) 12,214,810 85.4%
Transfers In 90,526 22,291,637 (22,201,111) -99.6%Transfers Out (58,310) (9,757,067) 9,698,757 99.4%
Ending Plant Fund Balance 731,556$ 2,066,387$ (1,334,831)$ -64.6%
For the Twelve Months Ending June 30, 2014 and 2013
Oregon State UniversityStatement of Revenues, Expenses, and Other Changes
Auxiliary Funds - Athletics
-Athletics spent $3.4 million and $3.6 million from Education & General funds in Fiscal Years 2014 and 2013 repectively,
which is not reflected in the statements above.
-See page 65 for Gift Fund revenue and expense information.
34 of 68 Unaudited - For Internal Management Purposes Only

35 of 68 Unaudited - For Internal Management Purposes Only

36 of 68 Unaudited - For Internal Management Purposes Only

Increase
2014 2013 (Decrease) % Change
Assets
Current Assets
Cash 10,219,160$ 10,298,860$ (79,700)$ -0.8%
Accounts Receivable 780,686 616,728 163,958 26.6%
Allowance for Doubtful Accounts (100,893) (80,606) (20,287) -25.2%
Prepaid Expenses and Deferred Charges 9,923 757 9,166 1210.8%
Total Current Assets 10,908,876 10,835,739 73,137 0.7%
Non-Current Assets
Restricted Cash 890,734 1,264,391 (373,657) -29.6%
Fixed Assets 4,129,136 3,450,467 678,669 19.7%
Accumulated Depreciation (1,858,303) (1,325,870) (532,433) -40.2%
Total Non-Current Assets 3,161,567 3,388,988 (227,421) -6.7%
Total Assets 14,070,443 14,224,727 (154,284) -1.1%
Liabilities and Fund Balance
Current Liabilities
Accounts Payable 138,314 156,119 (17,805) -11.4%
Liability for Compensated Absences 373,559 432,662 (59,103) -13.7%
Deferred Revenues 182,330 61,091 121,239 198.5%
Total Current Liabilities 694,203 649,872 44,331 6.8%
Fund Balance 13,376,240 13,574,855 (198,615) -1.5%
Total Liabilities and Fund Balance 14,070,443$ 14,224,727$ (154,284)$ -1.1%
Working Capital
Current Assets 10,908,876$ 10,835,739$ 73,137$ 0.7%
Less: Current Liabilities 694,203 649,872 44,331 6.8%
End of Period Working Capital 10,214,673$ 10,185,867$ 28,806$ 0.3%
Oregon State UniversityBalance Sheet
Auxiliary Funds - Health Servicesas of June 30, 2014 and 2013
37 of 68 Unaudited - For Internal Management Purposes Only

Increase %
2014 2013 (Decrease) Change
Revenues
Enrollment Fees 4,362$ 45,361$ (40,999)$ -90.4%
Interest Income 142,169 137,829 4,340 3.1%
Sales & Services 5,196,194 4,522,813 673,381 14.9%
Other Revenue 158,925 9,757 149,168 1528.8%
Internal Sales 7,465 8,088 (623) -7.7%
Total Revenues 5,509,115 4,723,848 785,267 16.6%
Expenses
Total Salaries and OPE 8,840,750 8,371,602 469,148 5.6%
Service and Supplies 5,915,195 5,185,131 730,064 14.1%
Depreciation 173,042 139,898 33,144 23.7%
Total Expenses 14,928,987 13,696,631 1,232,356 9.0%
Net Change From Operations (9,419,872) (8,972,783) (447,089) -5.0%
Transfers In - Incidental Fees 9,174,816 8,826,336 348,480 3.9%
Transfers In - From Education & General 35,000 - 35,000 -
Transfers In - Other 126,174 - 126,174 -
Transfers Out - Other (466) 220 (686) -311.8%
Net Increase (Decrease) in Fund Balance (84,348) (146,227) 61,879 42.3%
Beginning Operations Fund Balance 12,311,109 12,437,968 (126,859) -1.0%
NIP Change in Fixed Assets 285,366 19,368 265,998 1373.4%
Fund Additions/Deductions (26,616) - (26,616) -
Ending Fund Balance From Operations 12,485,511$ 12,311,109$ 174,402$ 1.4%
Beginning Plant Fund Balance 1,263,746$ 1,269,891$ (6,145)$ -0.5%Plant Revenue - Interest 11,907 13,453 (1,546) -11.5%Plant Revenue - Miscellaneous - (230) 230 -Expenses (285,366) (19,368) (265,998) -1373.4%Transfers In 200,000 - 200,000 -Transfers Out (326,174) - (326,174) -Fund Additions/Deductions 26,616 - 26,616 -
Ending Plant Fund Balance 890,729$ 1,263,746$ (373,017)$ -29.5%
For the Twelve Months Ending June 30, 2014 and 2013
Oregon State UniversityStatement of Revenues, Expenses, and Other Changes
Auxiliary Funds - Health Services
38 of 68 Unaudited - For Internal Management Purposes Only

39 of 68
Unaudited - For Internal Management Purposes Only

Increase
2014 2013 (Decrease) % Change
Assets
Current Assets
Cash 2,131,574$ 1,586,130$ 545,444$ 34.4%
Restricted Cash 300,000 -$ 300,000$ -
Accounts Receivable 57,837 59,651 (1,814) -3.0%
Allowance for Doubtful Accounts (7,451) (7,699) 248 3.2%
Total Current Assets 2,481,960 1,638,082 843,878 51.5%
Non-Current Assets
Restricted Cash 352,991 849,457 (496,466) -58.4%
Fixed Assets 21,888,507 22,384,662 (496,155) -2.2%
Accumulated Depreciation (8,776,572) (8,485,176) (291,396) -3.4%
Total Non-Current Assets 13,464,926 14,748,943 (1,284,017) -8.7%
Total Assets 15,946,886 16,387,025 (440,139) -2.7%
Liabilities and Fund Balance
Current Liabilities
Accounts Payable 41,607 18,489 23,118 125.0%
Liability for Compensated Absences 23,597 46,543 (22,946) -49.3%
Current Portion of Long Term Liabilities 278,980 267,381 11,599 4.3%
Total Current Liabilities 344,184 332,413 11,771 3.5%
Non-Current Liabilities
Internal Bank Loan 7,828,145 8,091,497 (263,352) -3.3%
Total Liabilities 8,172,329 8,423,910 (251,581) -3.0%
Fund Balance 7,774,557 7,963,115 (188,558) -2.4%
Total Liabilities and Fund Balance 15,946,886$ 16,387,025$ (440,139)$ -2.7%
Working Capital
Current Assets 2,481,960$ 1,638,082$ 843,878$ 51.5%
Less: Current Liabilities 344,184 332,413 11,771 3.5%
End of Period Working Capital 2,137,776$ 1,305,669$ 832,107$ 63.7%
Oregon State UniversityBalance Sheet
Auxiliary Funds - Transportation & Parking ServicesAs of June 30, 2014 and 2013
40 of 68 Unaudited - For Internal Management Purposes Only

Increase %
2014 2013 (Decrease) Change
Revenues
Sales & Services 2,371,428$ 2,279,307$ 92,121$ 4.0%
Other Revenue 9,359 1,032 8,327 806.9%
Internal Sales 179,566 187,246 (7,680) -4.1%
Total Revenues 2,560,353 2,467,585 92,768 3.8%
Expenses
Total Salaries and OPE 699,480 801,918 (102,438) -12.8%
Service and Supplies 1,063,521 924,949 138,572 15.0%
Depreciation 802,883 822,620 (19,737) -2.4%
Total Expenses 2,565,884 2,549,487 16,397 0.6%
Net Change From Operations (5,531) (81,902) 76,371 93.2%
Fixed Asset Disposal Gain/(Loss) (14,500) - - -
Net Increase (Decrease) in Fund Balance (20,031) (81,902) 76,371 93.2%
Beginning Operations Fund Balance 7,113,659 7,195,561 (81,902) -1.1%
NIP Change in Fixed Assets (172,062) - (172,062) -
Fund Additions from Other Funds 200,000 - 200,000 -
Ending Fund Balance From Operations 7,121,566$ 7,113,659$ 22,407$ 0.3%
Beginning Plant Fund Balance 849,456$ 892,213$ (42,757)$ -4.8%Plant Revenue - Interest 10,760 11,198 (438) -3.9%Expenses - (37,382) 37,382 -Transfers Out (7,225) (16,573) 9,348 56.4%Fund Additions/Deductions (200,000) - (200,000) -
Ending Plant Fund Balance 652,991$ 849,456$ (196,465)$ -23.1%
For the Twelve Months Ending June 30, 2014 and 2013
Oregon State UniversityStatement of Revenues, Expenses, and Other Changes
Auxiliary Funds - Transportation & Parking Services
41 of 68 Unaudited - For Internal Management Purposes Only

42 of 68
Unaudited - For Internal Management Purposes Only

Increase
2014 2013 (Decrease) % Change
Assets
Current Assets
Cash 3,486,525$ 3,667,848$ (181,323)$ -4.9%
Accounts Receivable 179,444 196,877 (17,433) -8.9%
Allowance for Doubtful Accounts (22,125) (24,781) 2,656 10.7%
Inventories 126,872 129,427 (2,555) -2.0%
Prepaid Expenses and Deferred Charges 27,430 22,042 5,388 24.4%
Total Current Assets 3,798,146 3,991,413 (193,267) -4.8%
Non-Current Assets
Restricted Cash 2,339,826 2,042,456 297,370 14.6%
Fixed Assets 4,554,124 6,925,415 (2,371,291) -34.2%
Accumulated Depreciation (3,452,433) (3,525,122) 72,689 2.1%
Total Non-Current Assets 3,441,517 5,442,749 (2,001,232) -36.8%
Total Assets 7,239,663 9,434,162 (2,194,499) -23.3%
Liabilities and Fund Balance
Current Liabilities
Accounts Payable 149,629 114,634 34,995 30.5%
Liability for Compensated Absences 70,196 93,858 (23,662) -25.2%
Deposits 2,689 2,789 (100) -3.6%
Deferred Revenues 235,458 (58,837) 294,295 500.2%
Total Current Liabilities 457,972 152,444 305,528 200.4%
Fund Balance 6,781,691 9,281,718 (2,500,027) -26.9%
Total Liabilities and Fund Balance 7,239,663$ 9,434,162$ (2,194,499)$ -23.3%
Working Capital
Current Assets 3,798,146$ 3,991,413$ (193,267)$ -4.8%
Less: Current Liabilities 457,972 152,444 305,528 200.4%
End of Period Working Capital 3,340,174$ 3,838,969$ (498,795)$ -13.0%
Oregon State UniversityBalance Sheet
Auxiliary Funds - Miscellaneousas of June 30, 2014 and 2013
1Restated to include Incidental Fee Clearing Funds in report and excluded from other Auxiliary units.
43 of 68 Unaudited - For Internal Management Purposes Only

Increase %
2014 2013 (Decrease) Change
Revenue
Enrollment Fees 319,896$ 235,828$ 84,068$ 35.6%
Interest Income 12,467 13,310 (843) -6.3%
Sales & Services 3,456,983 4,312,956 (855,973) -19.8%
Other Revenue 17,273 136,918 (119,645) -87.4%
Internal Sales 604,026 564,460 39,566 7.0%
Total Revenue 4,410,645 5,263,472 (852,827) -16.2%
Expense
Total Salaries and OPE 1,504,526 1,819,874 (315,348) -17.3%
Service and Supplies 2,721,373 3,048,156 (326,783) -10.7%
Depreciation 185,766 214,737 (28,971) -13.5%
Total Expense 4,411,665 5,082,767 (671,102) -13.2%
Net Change From Operations (1,020) 180,705 (181,725) -100.6%
Transfers In 515,239 869,800 (354,561) -40.8%
Transfers Out (754,861) (852,273) 97,412 11.4%
Net Increase (Decrease) in Fund Balance (240,642) 198,232 (438,874) -221.4%
Beginning Operations Fund Balance 7,242,987 6,834,071 408,916 6.0%
NIP Change in Fixed Assets (2,117,937) 546,509 (2,664,446) -487.5%
Fund Additions/Deductions (348,190) (335,825) (12,365) -3.7%
Ending Fund Balance From Operations 4,536,218$ 7,242,987 (2,706,769)$ -37.4%
Beginning Plant Fund Balance 2,038,731$ 1,882,534$ 156,197$ 8.3%Plant Revenue - Interest 20,974 17,521 3,453 19.7%Expenses (307,627) (227,144) (80,483) -35.4%Transfers In 562,010 191,771 370,239 193.1%Transfers Out (416,805) (161,776) (255,029) -157.6%Fund Additions/Deductions 348,190 335,825 12,365 3.7%
Ending Plant Fund Balance 2,245,473$ 2,038,731$ 206,742$ 10.1%
For the Twelve Months Ending June 30, 2014 and 2013
Oregon State UniversityStatement of Revenues, Expenses, and Other Changes
Auxiliary Funds - Miscellaneous
44 of 68 Unaudited - For Internal Management Purposes Only
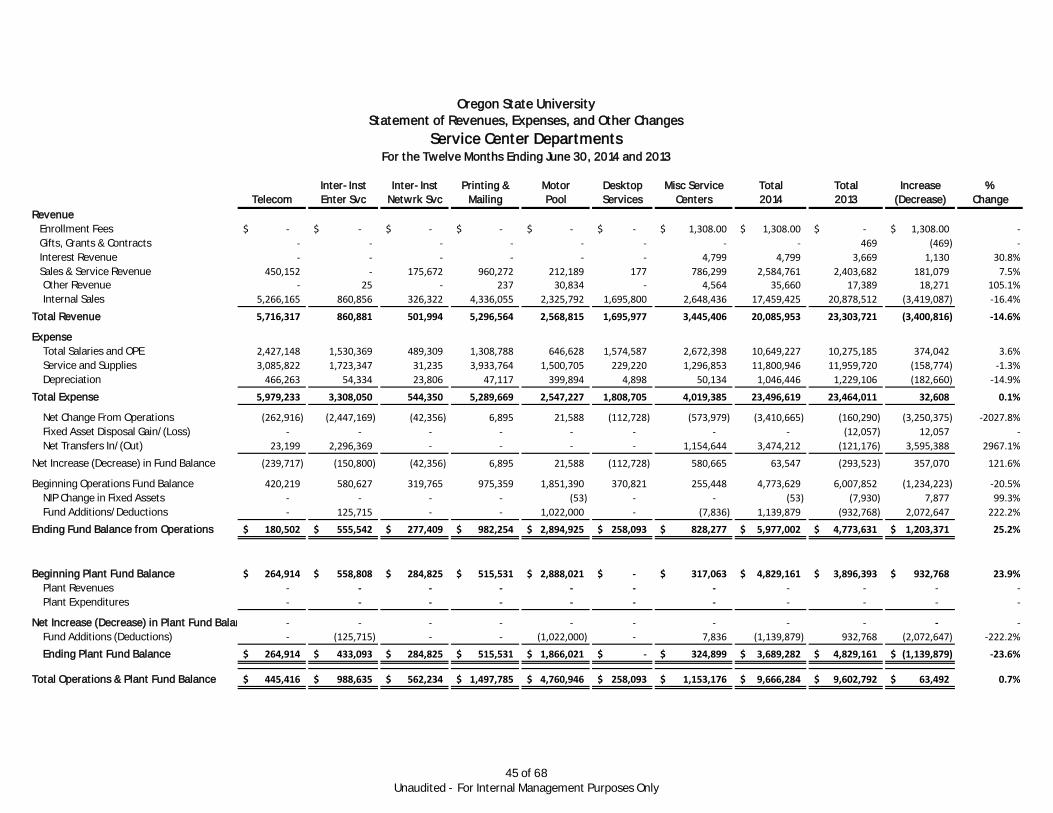
Inter-Inst Inter-Inst Printing & Motor Desktop Misc Service Total Total Increase %
Telecom Enter Svc Netwrk Svc Mailing Pool Services Centers 2014 2013 (Decrease) Change
Revenue
Enrollment Fees -$ -$ -$ -$ -$ -$ 1,308.00$ 1,308.00$ -$ 1,308.00$ -
Gifts, Grants & Contracts - - - - - - - - 469 (469) -
Interest Revenue - - - - - - 4,799 4,799 3,669 1,130 30.8%
Sales & Service Revenue 450,152 - 175,672 960,272 212,189 177 786,299 2,584,761 2,403,682 181,079 7.5%Other Revenue - 25 - 237 30,834 - 4,564 35,660 17,389 18,271 105.1%
Internal Sales 5,266,165 860,856 326,322 4,336,055 2,325,792 1,695,800 2,648,436 17,459,425 20,878,512 (3,419,087) -16.4%
Total Revenue 5,716,317 860,881 501,994 5,296,564 2,568,815 1,695,977 3,445,406 20,085,953 23,303,721 (3,400,816) -14.6%
Expense
Total Salaries and OPE 2,427,148 1,530,369 489,309 1,308,788 646,628 1,574,587 2,672,398 10,649,227 10,275,185 374,042 3.6%
Service and Supplies 3,085,822 1,723,347 31,235 3,933,764 1,500,705 229,220 1,296,853 11,800,946 11,959,720 (158,774) -1.3%
Depreciation 466,263 54,334 23,806 47,117 399,894 4,898 50,134 1,046,446 1,229,106 (182,660) -14.9%
Total Expense 5,979,233 3,308,050 544,350 5,289,669 2,547,227 1,808,705 4,019,385 23,496,619 23,464,011 32,608 0.1%
Net Change From Operations (262,916) (2,447,169) (42,356) 6,895 21,588 (112,728) (573,979) (3,410,665) (160,290) (3,250,375) -2027.8%
Fixed Asset Disposal Gain/(Loss) - - - - - - - - (12,057) 12,057 -
Net Transfers In/(Out) 23,199 2,296,369 - - - - 1,154,644 3,474,212 (121,176) 3,595,388 2967.1%-
Net Increase (Decrease) in Fund Balance (239,717) (150,800) (42,356) 6,895 21,588 (112,728) 580,665 63,547 (293,523) 357,070 121.6%
Beginning Operations Fund Balance 420,219 580,627 319,765 975,359 1,851,390 370,821 255,448 4,773,629 6,007,852 (1,234,223) -20.5%
NIP Change in Fixed Assets - - - - (53) - - (53) (7,930) 7,877 99.3%
Fund Additions/Deductions - 125,715 - - 1,022,000 - (7,836) 1,139,879 (932,768) 2,072,647 222.2%
Ending Fund Balance from Operations 180,502$ 555,542$ 277,409$ 982,254$ 2,894,925$ 258,093$ 828,277$ 5,977,002$ 4,773,631$ 1,203,371$ 25.2%
Beginning Plant Fund Balance 264,914$ 558,808$ 284,825$ 515,531$ 2,888,021$ -$ 317,063$ 4,829,161$ 3,896,393$ 932,768$ 23.9%
Plant Revenues - - - - - - - - - - -
Plant Expenditures - - - - - - - - - - -
Net Increase (Decrease) in Plant Fund Balance - - - - - - - - - - -
Fund Additions (Deductions) - (125,715) - - (1,022,000) - 7,836 (1,139,879) 932,768 (2,072,647) -222.2%
Ending Plant Fund Balance 264,914$ 433,093$ 284,825$ 515,531$ 1,866,021$ -$ 324,899$ 3,689,282$ 4,829,161$ (1,139,879)$ -23.6%
Total Operations & Plant Fund Balance 445,416$ 988,635$ 562,234$ 1,497,785$ 4,760,946$ 258,093$ 1,153,176$ 9,666,284$ 9,602,792$ 63,492$ 0.7%
Oregon State UniversityStatement of Revenues, Expenses, and Other Changes
Service Center DepartmentsFor the Twelve Months Ending June 30, 2014 and 2013
45 of 68 Unaudited - For Internal Management Purposes Only
46 of 68
Unaudited - For Internal Management Purposes Only

Increase
2014 2013 (Decrease) % Change
Assets
Current Assets
Cash (731,030)$ (921,210)$ 190,180$ 20.6%
Inventories 89,208 94,333 (5,125) -5.4%
Prepaid Expenses 289,771 96,962 192,809 198.9%
Total Current Assets (352,051) (729,915) 377,864 51.8%
Non-Current Assets
Restricted Cash 264,914 264,914 - 0.0%
Fixed Assets 8,884,294 8,873,466 10,828 0.1%
Accumulated Depreciation (7,703,335) (7,276,801) (426,534) -5.9%
Total Non-Current Assets 1,445,873 1,861,579 (415,706) -22.3%
Total Assets 1,093,822 1,131,664 (37,842) -3.3%
Liabilities and Fund Balance
Current Liabilities
Accounts Payable 330,441 113,316 217,125 191.6%
Liability for Compensated Absences 133,458 143,319 (9,861) -6.9%
Deferred Income 184,507 189,896 (5,389) -2.8%
Total Current Liabilities 648,406 446,531 201,875 45.2%
Fund Balance 445,416 685,133 (239,717) -35.0%
Total Liabilities and Fund Balance 1,093,822$ 1,131,664$ (37,842)$ -3.3%
Working Capital
Current Assets (352,051)$ (729,915)$ 377,864$ 51.8%
Less: Current Liabilities 648,406 446,531 201,875 45.2%
End of Period Working Capital (1,000,457)$ (1,176,446)$ 175,989$ 15.0%
Oregon State UniversityBalance Sheet
Service Center Funds - Telecomas of June 30, 2014 and 2013
47 of 68 Unaudited - For Internal Management Purposes Only

Increase %
2014 2013 (Decrease) Change
Revenue
Sales & Services 450,152$ 530,490$ (80,338)$ -15.1%
Other Revenue - 128 (128) -
Internal Sales 5,266,165 5,269,770 (3,605) -0.1%
Total Revenue 5,716,317 5,800,388 (84,071) -1.4%
Expense
Total Salaries and OPE 2,427,148 2,268,742 158,406 7.0%
Service and Supplies 3,085,822 3,695,098 (609,276) -16.5%
Depreciation 466,263 628,639 (162,376) -25.8%
Total Expense 5,979,233 6,592,479 (613,246) -9.3%
Net Change From Operations (262,916) (792,091) 529,175 66.8%
Fixed Asset Disposal Gain/(Loss) - - - -
Net Transfers In/(Out) 23,199 (145,565) 168,764 115.9%
Net Increase (Decrease) in Fund Balance (239,717) (937,656) 697,939 74.4%
Beginning Operations Fund Balance 420,219 1,357,875 (937,656) -69.1%
NIP Change in Fixed Assets - - - -
Fund Additions/Deductions - - - -
Ending Fund Balance From Operations 180,502$ 420,219$ (239,717)$ -57.0%
Beginning Plant Fund Balance 264,914$ 264,914$ - 0.0%Expenses - - - -Transfers Out - - - -Fund Additions/Deductions - - - -
Ending Plant Fund Balance 264,914$ 264,914$ -$ 0.0%
Statement of Revenues, Expenses, and Other ChangesOregon State University
Service Center Funds - TelecomFor the Twelve Months Ending June 30, 2014 and 2013
48 of 68 Unaudited - For Internal Management Purposes Only

49 of 68 Unaudited - For Internal Management Purposes Only

Increase
2014 2013 (Decrease) % Change
Assets
Current Assets
Cash 354,707$ 447,313$ (92,606)$ -20.7%
Prepaid Expense 150,098 171,830 (21,732) -12.6%
Total Current Assets 504,805 619,143 (114,338) -18.5%
Non-Current Assets
Restricted Cash 433,093 558,808 (125,715) -22.5%
Fixed Assets 749,461 608,997 140,464 23.1%
Accumulated Depreciation (602,881) (548,548) (54,333) -9.9%
Total Non-Current Assets 579,673 619,257 (39,584) -6.4%
Total Assets 1,084,478 1,238,400 (153,922) -12.4%
Liabilities and Fund Balance
Current Liabilities
Accounts Payable 1,490 952 538 56.5%
Liability for Compensated Absences 94,353 98,013 (3,660) -3.7%
Total Current Liabilities 95,843 98,965 (3,122) -3.2%
Fund Balance 988,635 1,139,435 (150,800) -13.2%
Total Liabilities and Fund Balance 1,084,478$ 1,238,400$ (153,922)$ -12.4%
Working Capital
Current Assets 504,805$ 619,143$ (114,338)$ -18.5%
Less: Current Liabilities 95,843 98,965 (3,122) -3.2%
End of Period Working Capital 408,962$ 520,178$ (111,216)$ -21.4%
Oregon State UniversityBalance Sheet
Service Center Funds - Enterprise Servicesas of June 30, 2014 and 2013
50 of 68 Unaudited - For Internal Management Purposes Only

Increase %
2014 2013 (Decrease) Change
Revenue
Sales & Service Revenue 25$ -$ 25$ -
Internal Sales 860,856 3,392,609 (2,531,753) -74.6%
Total Revenue 860,881 3,392,609 (2,531,728) -74.6%
Expense
Total Salaries and OPE 1,530,369 1,555,190 (24,821) -1.6%
Service and Supplies 1,723,347 1,162,840 560,507 48.2%
Depreciation 54,334 49,009 5,325 10.9%
Total Expense 3,308,050 2,767,039 541,011 19.6%
Net Change From Operations (2,447,169) 625,570 (3,072,739) -491.2%
Net Transfers In/(Out) 2,296,369 - 2,296,369 -
Net Increase (Decrease) in Fund Balance (150,800) 625,570 (776,370) -124.1%
Beginning Operations Fund Balance 580,627 - 580,627 -
NIP Change in Fixed Assets - - - -
Fund Additions/Deductions 125,715 (44,943) 170,658 379.7%
Ending Fund Balance From Operations 555,542$ 580,627$ (25,085)$ -4.3%
Beginning Plant Fund Balance 558,808$ 513,865$ 44,943$ 8.7%Fund Additions/Deductions (125,715) 44,943 (170,658) -379.7%
Ending Plant Fund Balance 433,093$ 558,808$ (125,715)$ -22.5%
Oregon State UniversityStatement of Revenues, Expenses, and Other Changes
Service Center Funds - Enterprise ServicesFor the Twelve Months Ending June 30, 2014 and 2013
51 of 68 Unaudited - For Internal Management Purposes Only

52 of 68
Unaudited - For Internal Management Purposes Only

Increase
2014 2013 (Decrease) % Change
Assets
Current Assets
Cash 215,704 311,787 (96,083)$ -30.8%
Accounts Receivable 75,288 - 75,288 -
Prepaid Expense - - - -
Total Current Assets 290,992 311,787 (20,795) -6.7%
Non-Current Assets
Restricted Cash 284,825 284,825 - 0.0%
Fixed Assets 489,813 508,591 (18,778) -3.7%
Accumulated Depreciation (469,078) (463,050) (6,028) -1.3%
Total Non-Current Assets 305,560 330,366 (24,806) -7.5%
Total Assets 596,552 642,153 (45,601) -7.1%
Liabilities and Fund Balance
Current Liabilities
Accounts Payable - - -
Liability for Compensated Absences 34,318 36,563 (2,245) -6.1%
Total Current Liabilities 34,318 36,563 (2,245) -6.1%
Fund Balance 562,234 604,590 (42,356) -7.0%
Total Liabilities and Fund Balance 596,552$ 641,153$ (44,601)$ -7.0%
Working Capital
Current Assets 290,992$ 311,787$ (20,795)$ -6.7%
Less: Current Liabilities 34,318 36,563 (2,245) -6.1%
End of Period Working Capital 256,674$ 275,224$ (18,550)$ -6.7%
Oregon State UniversityBalance Sheet
Service Center Funds - Network Servicesas of June 30, 2014 and 2013
53 of 68 Unaudited - For Internal Management Purposes Only

Increase %
2014 2013 (Decrease) Change
Revenue
Sales & Service Revenue 175,672$ 140,549$ 35,123$ 25.0%
Internal Sales 326,322 343,980 (17,658) -5.1%
Total Revenue 501,994 484,529 17,465 3.6%
Expense
Total Salaries and OPE 489,309 470,232 19,077 4.1%
Service and Supplies 31,235 28,036 3,199 11.4%
Depreciation 23,806 35,816 (12,010) -33.5%
Total Expense 544,350 534,084 10,266 1.9%
Net Change From Operations (42,356) (49,555) 7,199 14.5%
Fixed Asset Disposal Gain/(Loss) - (1,536) 1,536 -
Net Increase (Decrease) in Fund Balance (42,356) (51,091) 8,735 17.1%
Beginning Operations Fund Balance 319,765 370,856 (51,091) -13.8%
Ending Fund Balance From Operations 277,409$ 319,765$ (33,621)$ -10.5%
Beginning Plant Fund Balance 284,825$ 284,825$ -$ 0.0%Fund Additions/Deductions - -
Ending Plant Fund Balance 284,825$ 284,825$ -$ 0.0%
For the Twelve Months Ending June 30, 2014 and 2013
Oregon State UniversityStatement of Revenues, Expenses, and Other Changes
Service Center Funds - Network Services
54 of 68 Unaudited - For Internal Management Purposes Only

55 of 68
Unaudited - For Internal Management Purposes Only

Increase
2014 2013 (Decrease) % Change
Assets
Current Assets
Cash 920,994$ 872,289$ 48,705$ 5.6%
Accounts Receivable 73,747 117,331 (43,584) -37.1%
Inventories 187,778 251,848 (64,070) -25.4%
Prepaid Expenses - - -
Total Current Assets 1,182,519 1,241,468 (58,949) -4.7%
Non-Current Assets
Restricted Cash 515,531 515,531 - 0.0%
Fixed Assets 728,206 728,205 1 0.0%
Accumulated Depreciation (653,335) (606,217) (47,118) -7.8%
Total Non-Current Assets 590,402 637,519 (47,117) -7.4%
Total Assets 1,772,921 1,878,987 (106,066) -5.6%
Liabilities and Fund Balance
Current Liabilities
Accounts Payable 210,917 309,484 (98,567) -31.8%
Liability for Compensated Absences 64,219 78,613 (14,394) -18.3%
Deposits - - - -
Total Current Liabilities 275,136 388,097 (112,961) -29.1%
Fund Balance 1,497,785 1,490,890 6,895 0.5%
Total Liabilities and Fund Balance 1,772,921$ 1,878,987$ (106,066)$ -5.6%
Working Capital
Current Assets 1,182,519$ 1,241,468$ (58,949)$ -4.7%
Less: Current Liabilities 275,136 388,097 (112,961) -29.1%
End of Period Working Capital 907,383$ 853,371$ 54,012$ 6.3%
Oregon State UniversityBalance Sheet
Service Center Funds - Printing & Mailingas of June 30, 2014 and 2013
56 of 68 Unaudited - For Internal Management Purposes Only

Increase %
2014 2013 (Decrease) Change
Revenue
Sales & Service Revenue 960,272$ 789,307$ 170,965$ 21.7%
Other Revenue 237 54 183 338.9%
Internal Sales 4,336,055 4,217,435 118,620 2.8%
Total Revenue 5,296,564 5,006,796 289,768 5.8%
Expense
Total Salaries and OPE 1,308,788 1,220,028 88,760 7.3%
Service and Supplies 3,933,764 3,611,938 321,826 8.9%
Depreciation 47,117 58,585 (11,468) -19.6%
Total Expense 5,289,669 4,890,551 399,118 8.2%
Net Change From Operations 6,895 116,245 (109,350) -94.1%
Fixed Asset Disposal Gain/(Loss) - (7,410) 7,410 -
Net Increase (Decrease) in Fund Balance 6,895 108,835 (101,940) -93.7%
Beginning Operations Fund Balance 975,359 896,524 78,835 8.8%
Fund Additions/Deductions - (30,000) 30,000 -
Ending Fund Balance From Operations 982,254$ 975,359$ (95,045)$ -9.7%
Beginning Plant Fund Balance 515,531$ 485,531$ 30,000$ 6.2%Fund Additions/Deductions - 30,000 (30,000) -
Ending Plant Fund Balance 515,531$ 515,531$ -$ 0.0%
For the Twelve Months Ending June 30, 2014 and 2013
Oregon State UniversityStatement of Revenues, Expenses, and Other Changes
Service Center Funds - Printing & Mailing
57 of 68 Unaudited - For Internal Management Purposes Only

58 of 68
Unaudited - For Internal Management Purposes Only

Increase
2014 2013 (Decrease) % Change
Assets
Current Assets
Cash 542,763$ 422,684$ 120,079$ 28.4%
Accounts Receivable 25,041 21,703 3,338 15.4%
Inventories 18,556 19,621 (1,065) -5.4%
Prepaid Expense 23,924 14,232 9,692 68.1%
Total Current Assets 610,284 478,240 132,044 27.6%
Non-Current Assets
Restricted Cash 1,866,021 2,888,021 (1,022,000) -35.4%
Fixed Assets 7,708,502 6,457,171 1,251,331 19.4%
Accumulated Depreciation (5,153,710) (4,952,137) (201,573) -4.1%
Total Non-Current Assets 4,420,813 4,393,055 27,758 0.6%
Total Assets 5,031,097 4,871,295 159,802 3.3%
Liabilities and Fund Balance
Current Liabilities
Accounts Payable 230,038 100,046 129,992 129.9%
Liability for Compensated Absences 40,113 31,838 8,275 26.0%
Total Current Liabilities 270,151 131,884 138,267 104.8%
Fund Balance 4,760,946 4,739,411 21,535 0.5%
Total Liabilities and Fund Balance 5,031,097$ 4,871,295$ 159,802$ 3.3%
Working Capital
Current Assets 610,284$ 478,240$ 132,044$ 27.6%
Less: Current Liabilities 270,151 131,884 138,267 104.8%
End of Period Working Capital 340,133$ 346,356$ (6,223)$ -1.8%
Oregon State UniversityBalance Sheet
Service Center Funds - Motor Poolas of June 30, 2014 and 2013
59 of 68 Unaudited - For Internal Management Purposes Only

Increase %
2014 2013 (Decrease) Change
Revenue
Sales & Service Revenue 212,189$ 160,188$ 52,001$ 32.5%
Other Revenue 30,834 17,207 13,627 79.2%
Revenue from OUS Depts 2,325,792 2,302,970 22,822 1.0%
Total Revenue 2,568,815 2,480,365 88,450 3.6%
Expense
Total Salaries and OPE 646,628 548,061 98,567 18.0%
Service and Supplies 1,500,705 1,405,105 95,600 6.8%
Depreciation 399,894 393,550 6,344 1.6%
Total Expense 2,547,227 2,346,716 200,511 8.5%
Net Change From Operations 21,588 133,649 (112,061) -83.8%
NIP Change in Fixed Assets (53) - (53) -
Fund Additions/Deductions 1,022,000 (850,000) 1,872,000 220.2%
Net Increase (Decrease) in Fund Balance 1,043,535 (716,351) 1,759,886 245.7%
Beginning Operations Fund Balance 1,851,390 2,567,741 (716,351) -27.9%
Ending Fund Balance From Operations 2,894,925$ 1,851,390$ 1,043,535$ 56.4%
Beginning Plant Fund Balance 2,888,021$ 2,038,021$ 850,000$ 41.7%
Fund Additions/Deductions (1,022,000) 850,000$ (1,872,000) -220.2%Ending Plant Fund Balance 1,866,021$ 2,888,021$ (1,022,000)$ -35.4%
For the Twelve Months Ending June 30, 2014 and 2013
Oregon State UniversityStatement of Revenues, Expenses, and Other Changes
Service Center Funds - Motor Pool
60 of 68 Unaudited - For Internal Management Purposes Only

61 of 68
Unaudited - For Internal Management Purposes Only

Increase
2014 2013 (Decrease) % Change
Assets
Current Assets
Cash 349,141$ 510,409$ (161,268)$ -31.6%
Prepaid Expense - - - -
Total Current Assets 349,141 510,409 (161,268) -31.6%
Non-Current Assets
Restricted Cash - - - -
Fixed Assets 30,142 21,664 8,478 39.1%
Accumulated Depreciation (10,314) (5,416) (4,898) -90.4%
Total Non-Current Assets 19,828 16,248 3,580 22.0%
Total Assets 368,969 526,657 (157,688) -29.9%
Liabilities and Fund Balance
Current Liabilities
Accounts Payable 19,036 66,624 (47,588) -71.4%
Liability for Compensated Absences 91,840 89,212 2,628 2.9%
Total Current Liabilities 110,876 155,836 (44,960) -28.9%
Fund Balance 258,093 370,821 (112,728) -30.4%
Total Liabilities and Fund Balance 368,969$ 526,657$ (157,688)$ -29.9%
Working Capital
Current Assets 349,141$ 510,409$ (161,268)$ -31.6%
Less: Current Liabilities 110,876 155,836 (44,960) -28.9%
End of Period Working Capital 238,265$ 354,573$ (116,308)$ -32.8%
Oregon State UniversityBalance Sheet
Service Center Funds - Desktop Servicesas of June 30, 2014 and 2013
62 of 68 Unaudited - For Internal Management Purposes Only

Increase %
2014 2013 (Decrease) Change
Revenue
Sales & Service Revenue 177$ -$ 177$ -
Internal Sales 1,695,800 1,670,011 25,789 1.5%
Total Revenue 1,695,977 1,670,011 25,966 1.6%
Expense
Total Salaries and OPE 1,574,587 1,483,503 91,084 6.1%
Service and Supplies 229,220 152,722 76,498 50.1%
Depreciation 4,898 4,333 565 13.0%
Total Expense 1,808,705 1,640,558 168,147 10.2%
Net Change From Operations (112,728) 29,453 (142,181) -482.7%
Beginning Operations Fund Balance 370,821 341,368 29,453 8.6%
Fund Additions/Deductions - - - -
Ending Fund Balance From Operations 258,093$ 370,821$ (112,728)$ -30.4%
Beginning Plant Fund Balance - - -$ -Fund Additions/Deductions - - - -
Ending Plant Fund Balance -$ -$ -$ -
For the Twelve Months Ending June 30, 2014 and 2013
Oregon State UniversityStatement of Revenues, Expenses, and Other Changes
Service Center Funds - Desktop Services
63 of 68 Unaudited - For Internal Management Purposes Only

64 of 68
Unaudited - For Internal Management Purposes Only

Increase
2014 2013 (Decrease) % Change
Assets
Current Assets
Cash 448,833$ (97,189)$ 546,022$ 561.8%
Accounts Receivable 132,084 146,911 (14,827) -10.1%
Inventories 214,652 166,076 48,576 29.2%
Prepaid Expenses 214,359 105,788 108,571 102.6%
Total Current Assets 1,009,928 321,586 688,342 214.0%
Non-Current Assets
Restricted Cash 324,899 317,063 7,836 2.5%
Fixed Assets 844,427 795,796 48,631 6.1%
Accumulated Depreciation (678,944) (628,809) (50,135) -8.0%
Total Non-Current Assets 490,382 484,050 6,332 1.3%
Total Assets 1,500,310 805,636 694,674 86.2%
Liabilities and Fund Balance
Current Liabilities
Accounts Payable 162,673 69,804 92,869 133.0%
Liability for Compensated Absences 152,962 163,321 (10,359) -6.3%
Deferred Income 31,499 - 31,499 -
Total Current Liabilities 347,134 233,125 114,009 48.9%
Fund Balance 1,153,176 572,511 580,665 101.4%
Total Liabilities and Fund Balance 1,500,310$ 805,636$ 694,674$ 86.2%
Working Capital
Current Assets 1,009,928$ 321,586$ 688,342$ 214.0%
Less: Current Liabilities 347,134 233,125 114,009 48.9%
End of Period Working Capital 662,794$ 88,461$ 574,333$ 649.2%
Oregon State UniversityBalance Sheet
Service Center Funds - Miscellaneousas of June 30, 2014 and 2013
65 of 68 Unaudited - For Internal Management Purposes Only

Increase %
2014 2013 (Decrease) Change
Revenue
Enrollment Fees 1,308$ -$ 1,308$ -
Gifts, Grants & Contracts - 469 (469) -
Interest Revenue 4,799 3,669 1,130 30.8%
Sales & Service Revenue 786,299 783,147 3,152 0.4%
Other Revenue 4,564 - 4,564 -Internal Sales 2,648,436 3,681,736 (1,033,300) -28.1%
Total Revenue 3,445,406 4,469,021 (1,023,615) -22.9%
Expense
Total Salaries and OPE 2,672,398 2,729,429 (57,031) -2.1%
Service and Supplies 1,296,853 1,907,092 (610,239) -32.0%Depreciation 50,134 59,174 (9,040) -15.3%
Total Expense 4,019,385 4,695,695 (676,310) -14.4%
Net Change From Operations (573,979) (226,674) (347,305) -153.2%
Fixed Asset Disposal Gain/(Loss) - - - -
Net Transfers In (Out) 1,154,644 24,389 1,130,255 4634.3%
Net Increase (Decrease) in Fund Balance 580,665 (202,285) (347,305) -171.7%
Beginning Operations Fund Balance 255,448 473,488 (218,040) -46.0%
NIP Change in Fixed Assets - (7,930) 7,930 -
Fund Additions/Deductions (7,836) (7,825) (11) -0.1%
Ending Fund Balance From Operations 828,277$ 255,448$ 225,524$ 88.3%
Beginning Plant Fund Balance 317,063$ 309,238$ 7,825$ 2.5%Fund Additions/Deductions 7,836 7,825 11 0.1%
Ending Plant Fund Balance 324,899$ 317,063$ 7,836$ 2.5%
For the Twelve Months Ending June 30, 2014 and 2013
Oregon State UniversityStatement of Revenues, Expenses, and Other Changes
Service Center Funds - Miscellaneous
66 of 68 Unaudited - For Internal Management Purposes Only

Revenue Expense Net Result Revenue Expense Net Result
Scholarships 25,756,600$ 25,225,533$ 531,067$ 24,235,376$ 24,114,996$ 120,380$
Athletics 10,619,938 10,610,682 9,255 12,532,070 12,554,374 (22,303)
Agricultural Science 11,010,207 9,519,002 1,491,205 9,262,318 8,172,037 1,090,281
Forestry 3,541,816 4,222,671 (680,855) 6,251,283 5,481,583 769,700
Engineering 6,077,564 6,001,519 76,045 5,078,669 5,206,706 (128,037)
Other Academic Units 5,442,047 5,458,635 (16,588) 4,566,927 4,713,708 (146,781)
Royalties & Inventions 7,593,464 5,948,439 1,645,025 8,896,876 6,548,182 2,348,694
Research 3,086,355 3,020,234 66,120 2,009,823 1,768,156 241,666
Administrative Units 1,275,053 1,135,642 139,411 2,057,732 2,027,109 30,623
Library 513,022 522,986 (9,964) 580,291 572,733 7,558
Extension 528,262 499,560 28,702 493,027 422,164 70,863
75,444,326$ 72,164,903$ 3,279,423$ 75,964,392$ 71,581,748$ 4,382,644$
Revenue Expense Net Result Revenue Expense Net Result
Seed Certification & Testing 4,301,370$ 4,277,710$ 23,660$ 4,241,702$ 4,414,140$ (172,438)$
Health & Human Sciences Outreach 2,713,323 3,186,184 (472,861) 2,812,317 2,690,110 122,207
Other Agriculture Related 1,561,431 1,447,327 114,104 1,899,139 2,000,406 (101,267)
International Study Abroad Programs 1,233,324 1,255,541 (22,217) 1,115,490 1,077,114 38,376
Extension 1,005,952 941,051 64,901 600,828 562,675 38,153
Open Source Programming - - - 517,206 517,206 -
College of Engineering 796,102 761,359 34,743 285,419 295,698 (10,279)
College of Oceanic & Atmospheric Sciences 696,218 665,761 30,458 684,710 670,707 14,003
OSU Press 469,365 411,827 57,538 395,495 429,531 (34,037)
Ecampus Non-credit courses & workshops 452,603 482,593 (29,991) 233,350 269,966 (36,616)
College of Liberal Arts 152,490 178,299 (25,809) 225,010 237,357 (12,347)
College of Business 285,055 272,906 12,148 295,831 326,378 (30,547)
College of Forestry 482,499 551,765 (69,267) 522,551 494,304 28,247
Miscellaneous 536,051 561,372 (25,321) 419,210 322,948 96,262
14,685,783$ 14,993,696$ (307,913)$ 14,248,257$ 14,308,540$ (60,283)$
1The Designated Operations fund group also referred to as public service activities, consists of self-sustaining operations whose purpose is to account for specific activities such as
labs, workshops, seminars, teesting, consulting and special interest publications.
Oregon State University
Designated Operations1
Fiscal Years 2014-2013
Fiscal Year 201 Fiscal Year 2013
Oregon State University
Gift & Royalty FundsFiscal Years 2014-2013
Fiscal Year 2014 Fiscal Year 2013
67 of 68 Unaudited - For Internal Management Purposes Only

XI-G Bonds XI-F Bonds SELP Lottery COPs XI-Q Bonds
6/30/2014 122,219,821$ 347,553,148$ 14,970,228$ 70,746,786$ 17,186,862$ 10,365,252$
6/30/2015 118,192,998 336,825,626 14,260,498 69,223,390 15,352,104 10,214,354
6/30/2016 113,985,141 324,539,961 13,551,085 67,235,590 13,441,395 10,054,979
6/30/2017 109,686,144 312,056,732 12,808,754 65,191,088 11,436,920 9,888,822
6/30/2018 105,251,866 299,121,978 12,031,941 63,270,645 9,724,924 9,354,551
6/30/2019 100,494,509 285,036,582 11,293,517 61,384,171 8,680,000 8,792,755
XI-G Bonds XI-F Bonds SELP Lottery COPs XI-Q Bonds
2014-2015 10,264,375$ 26,296,997$ 1,396,781$ 4,736,825$ 2,602,106$ 683,057$
2015-2016 10,289,383 28,645,827 1,363,227 5,150,448 2,600,491 680,378
2016-2017 10,316,561 29,014,883 1,363,227 5,155,983 2,605,297 673,679
2017-2018 10,235,276 28,683,760 1,363,227 4,973,258 2,229,926 1,028,164
2018-2019 10,209,953 28,696,022 1,288,718 4,882,173 1,501,154 1,029,042
Thereafter 149,913,428 433,821,123 15,115,416 83,086,175 11,025,429 12,227,073
Total 201,228,977$ 575,158,610$ 21,890,597$ 107,984,862$ 22,564,402$ 16,321,393$
Pay off Date 8/1/2041 8/1/2043 6/30/2032 4/1/2033 5/1/2029 5/1/2036
XI-G Bonds - Amount reflects OSU's portion of OUS total liability. OSU is not directly responsible for funding. Debt is managed by OUS.
XI-F(1) Bonds - Used to finance self-liquidating and self supporting projects.
SELP - State Energy Loan Program - A low interest loan program for projects that save energy. Administered through the State of Oregon, Office of Energy.
(Principal & Interest)
Oregon State University
Report of Obligations and Debt Service
as of June 30, 2014
Debt Service
Debt Obligation
(Principal)
68 of 68 Unaudited - For Internal Management Purposes Only