Embed Size (px)
Citation preview

1 of 62Copyright © 2011 Worth Publishers· International Economics· Feenstra/Taylor, 2/e.
Cha
pter
5:
Mov
emen
ts o
f Lab
or a
nd C
apita
l bet
wee
n C
ount
ries
Movement of Labor and Capital between Countries
Prepared by:Fernando QuijanoDickinson State University
51 Movement of Labor
between Countries: Migration
2 Movement of Capital between Countries: Foreign Direct Investment
3 Gains from Labor and Capital Flows

2 of 62Copyright © 2011 Worth Publishers· International Economics· Feenstra/Taylor, 2/e.
Cha
pter
5:
Mov
emen
ts o
f Lab
or a
nd C
apita
l bet
wee
n C
ount
ries
In this chapter, we begin our study of themovement of labor across countries byexplaining the case in which immigrationleads to a fall in wages, as we normallyexpect.
The model we use in that case is the specific-factors model, the short-run model introduced in Chapter 3.
Next, we use the long-run Heckscher-Ohlin model, from Chapter 4, in which capital and land can also move between industries.
In the long run, an increase in labor will not lower the wage, as industries have more time to respond to the inflow of workers.
Agricultural workers in the United States
Introduction

3 of 62Copyright © 2011 Worth Publishers· International Economics· Feenstra/Taylor, 2/e.
Cha
pter
5:
Mov
emen
ts o
f Lab
or a
nd C
apita
l bet
wee
n C
ount
ries
After studying what happens in the shortrun and long run when labor movesacross countries, we study the effects offoreign direct investment (FDI), themovement of capital across countries.
We conclude the chapter by discussing the gains to the host and destination countries, and to the world, from the movement of labor or capital between countries.
Agricultural workers in the United States
Introduction

4 of 62Copyright © 2011 Worth Publishers· International Economics· Feenstra/Taylor, 2/e.
Cha
pter
5:
Mov
emen
ts o
f Lab
or a
nd C
apita
l bet
wee
n C
ount
ries
Effects of Immigration in the Short Run: Specific-Factors Model
Determining the Wage
FIGURE 5-1The Home wage is determined at point A, the intersection of the marginal product of labor curves PM • MPLM and PA • MPLA in manufacturing and agriculture, respectively.
The amount of labor used in manufacturing is measured from left to right, starting at the origin 0M, and the amount of labor used in agriculture is measured from right to left, starting at the origin 0A. At point A, 0ML units of labor are used in manufacturing and 0AL units of labor are used in agriculture.
1 Movement of Labor between Countries: Migration
Home Labor Market

5 of 62Copyright © 2011 Worth Publishers· International Economics· Feenstra/Taylor, 2/e.
Cha
pter
5:
Mov
emen
ts o
f Lab
or a
nd C
apita
l bet
wee
n C
ount
ries
Effects of Immigration in the Short Run:Specific-Factors ModelEffect of Immigration on the Wage in Home
FIGURE 5-2
When the amount of labor at Home increases by the amount L, the origin for agriculture shifts to the right by that amount, from 0A to 0A. The marginal product of labor curve in agriculture also shifts right by the amount L.
Equilibrium in the Home labor market is now at point B: wages have fallen to W and the amount of labor has increased in manufacturing (to 0ML) and in agriculture (to 0AL).
1 Movement of Labor between Countries: Migration
Increase in Home Labor

6 of 62Copyright © 2011 Worth Publishers· International Economics· Feenstra/Taylor, 2/e.
Cha
pter
5:
Mov
emen
ts o
f Lab
or a
nd C
apita
l bet
wee
n C
ount
ries
APPLICATION
Immigration to the New WorldFIGURE 5-3
Large-scale migration from Europe to the New World in America and Australia closed the wage gap between the two locations. In 1870 wages in the New World were almost three times as high as wages in Europe, whereas in 1910 they were about twice as high.
Wages in Europe and the New World
Migration also slowed the growth of wages in the New World relative to what they would have been without migration and allowed for slightly faster growth of wages in Europe.
7 of 62Copyright © 2011 Worth Publishers· International Economics· Feenstra/Taylor, 2/e.
Cha
pter
5:
Mov
emen
ts o
f Lab
or a
nd C
apita
l bet
wee
n C
ount
ries
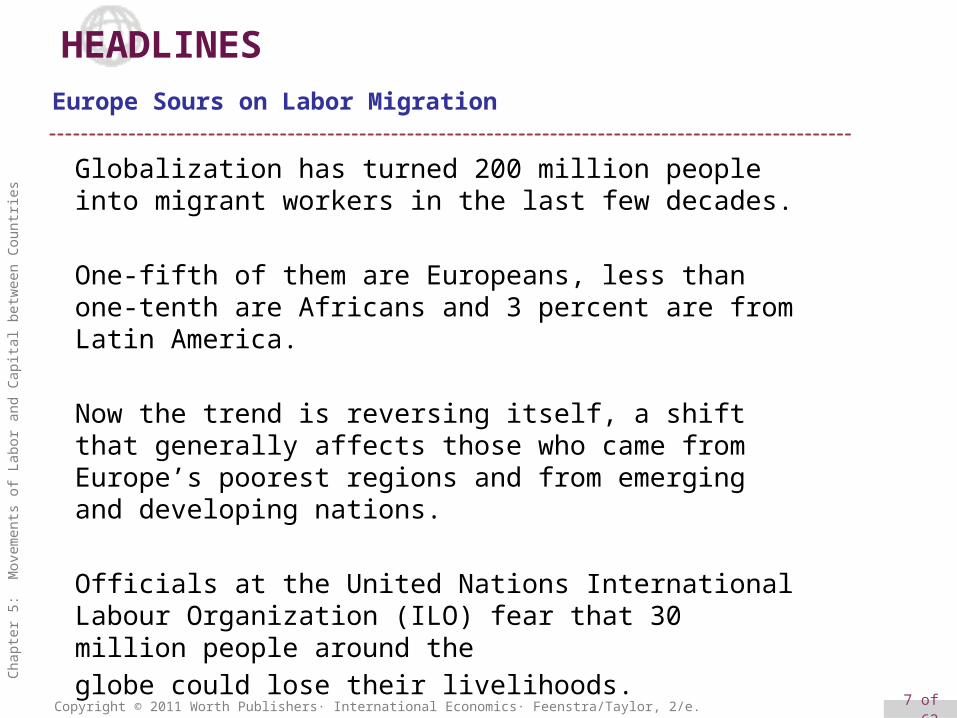
Globalization has turned 200 million people into migrant workers in the last few decades.
One-fifth of them are Europeans, less than one-tenth are Africans and 3 percent are from Latin America.
Now the trend is reversing itself, a shift that generally affects those who came from Europe’s poorest regions and from emerging and developing nations.
Officials at the United Nations International Labour Organization (ILO) fear that 30 million people around the
globe could lose their livelihoods.
HEADLINES
Europe Sours on Labor Migration

8 of 62Copyright © 2011 Worth Publishers· International Economics· Feenstra/Taylor, 2/e.
Cha
pter
5:
Mov
emen
ts o
f Lab
or a
nd C
apita
l bet
wee
n C
ount
ries
APPLICATION
Immigration to the United States and Europe TodayFIGURE 5-4 (1 of 3)
This figure shows the share of foreign-born workers in the U.S. workforce, categorized by educational level.
For example, among workers with only 0 to 8 years of education, more than 70% were foreign born; for those with 9 to 11 years of education, more than 20% were foreign born.
Share of Foreign-Born Workers in U.S. Workforce, 2008

9 of 62Copyright © 2011 Worth Publishers· International Economics· Feenstra/Taylor, 2/e.
Cha
pter
5:
Mov
emen
ts o
f Lab
or a
nd C
apita
l bet
wee
n C
ount
ries
APPLICATION
Immigration to the United States and Europe TodayFIGURE 5-4 (2 of 3)
At the other end of the spectrum, the foreign born make up 16% of workers with master’s and professional degrees and almost 30% of those with PhD’s.
Share of Foreign-Born Workers in U.S. Workforce, 2008
(continued)

10 of 62Copyright © 2011 Worth Publishers· International Economics· Feenstra/Taylor, 2/e.
Cha
pter
5:
Mov
emen
ts o
f Lab
or a
nd C
apita
l bet
wee
n C
ount
ries
APPLICATION
Immigration to the United States and Europe TodayFIGURE 5-4 (2 of 3)
In the middle educational levels (high school and college graduates), there are much smaller shares of foreign-born workers, ranging from 10% to 15%. In contrast, only about 10% of U.S.-born workers are categorized in each of the low-education and high-education groups; most U.S.-born workers are either high school graduates or college graduates.
Share of Foreign-Born Workers in U.S. Workforce, 2008
(continued)
11 of 62Copyright © 2011 Worth Publishers· International Economics· Feenstra/Taylor, 2/e.
Cha
pter
5:
Mov
emen
ts o
f Lab
or a
nd C
apita
l bet
wee
n C
ount
ries
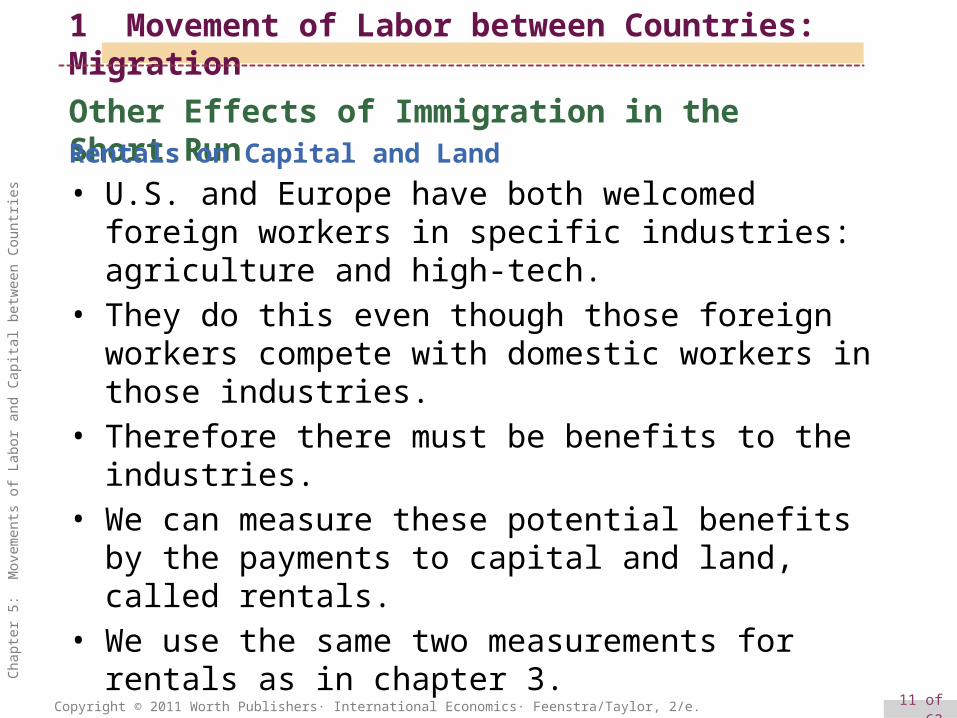
Other Effects of Immigration in the Short RunRentals on Capital and Land
• U.S. and Europe have both welcomed foreign workers in specific industries: agriculture and high-tech.
• They do this even though those foreign workers compete with domestic workers in those industries.
• Therefore there must be benefits to the industries.• We can measure these potential benefits by the
payments to capital and land, called rentals.• We use the same two measurements for rentals as in
chapter 3.
1 Movement of Labor between Countries: Migration
12 of 62Copyright © 2011 Worth Publishers· International Economics· Feenstra/Taylor, 2/e.
Cha
pter
5:
Mov
emen
ts o
f Lab
or a
nd C
apita
l bet
wee
n C
ount
ries
Other Effects of Immigration in the Short RunRentals on Capital and Land
• Under the first method for computing the rentals, we take the revenue earned in either manufacturing or agriculture and subtract the payments to labor.
• If wages fall, then there is more left over as earnings of capital and land, so these rentals are higher.
1 Movement of Labor between Countries: Migration

13 of 62Copyright © 2011 Worth Publishers· International Economics· Feenstra/Taylor, 2/e.
Cha
pter
5:
Mov
emen
ts o
f Lab
or a
nd C
apita
l bet
wee
n C
ount
ries
Other Effects of Immigration in the Short RunRentals on Capital and Land
• Under the second method for computing rentals, capital and land earn their marginal product in each industry times the price of the industry’s good.
• As more labor is hired in each industry (because wages are lower), the marginal products of capital and land both increase. The increase in the marginal product occurs because each machine or acre of land has more workers available to it, and that machine or acre of land is therefore more productive.
• So under the second method, too, the marginal products of capital and land rise and so do their rentals.
1 Movement of Labor between Countries: Migration

14 of 62Copyright © 2011 Worth Publishers· International Economics· Feenstra/Taylor, 2/e.
Cha
pter
5:
Mov
emen
ts o
f Lab
or a
nd C
apita
l bet
wee
n C
ount
ries
Other Effects of Immigration in the Short RunRentals on Capital and Land
• From this line of reasoning, we should not be surprised that owners of capital and land often support more open borders, which provides them with foreign workers that can be employed in their industries.
• The restriction on immigration in a country should therefore be seen as a compromise between entrepreneurs and landowners who might welcome the foreign labor.
• Local unions and workers who view migrants as a potential source of competition leading to lower wages.
• Immigrant groups themselves, if they are large enough, might also have the ability to influence the political outcome on immigration policy.
1 Movement of Labor between Countries: Migration
15 of 62Copyright © 2011 Worth Publishers· International Economics· Feenstra/Taylor, 2/e.
Cha
pter
5:
Mov
emen
ts o
f Lab
or a
nd C
apita
l bet
wee
n C
ount
ries
Other Effects of Immigration in the Short Run
Effect of Immigration on Industry Output
FIGURE 5-5
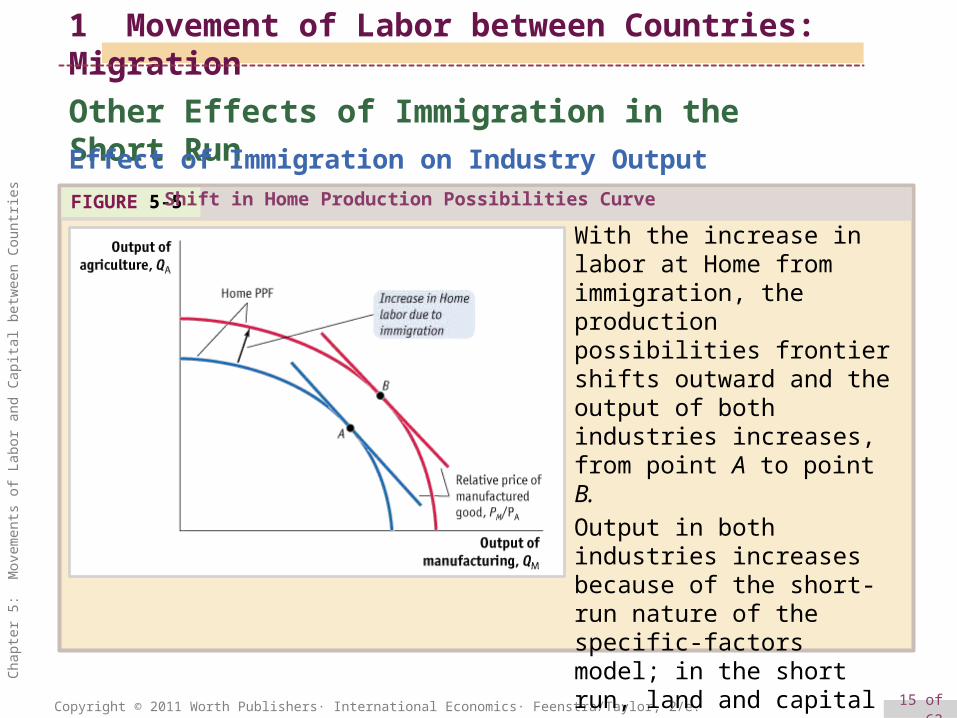
With the increase in labor at Home from immigration, the production possibilities frontier shifts outward and the output of both industries increases, from point A to point B.
Output in both industries increases because of the short-run nature of the specific-factors model; in the short run, land and capital do not move between the industries, and the extra labor in the economy is shared between both industries.
1 Movement of Labor between Countries: Migration
Shift in Home Production Possibilities Curve

16 of 62Copyright © 2011 Worth Publishers· International Economics· Feenstra/Taylor, 2/e.
Cha
pter
5:
Mov
emen
ts o
f Lab
or a
nd C
apita
l bet
wee
n C
ount
ries
Effects of Immigration in the Long RunEffect of Immigration on Industry Output FIGURE 5-6
Shown here is the production possibilities frontier (PPF) between two manufactured goods, computers and shoes, with initial equilibrium at point A.
Domestic production takes place at point A, which is the point of tangency between the world price line and the PPF.
1 Movement of Labor between Countries: Migration
Production Possibilities Frontier

17 of 62Copyright © 2011 Worth Publishers· International Economics· Feenstra/Taylor, 2/e.
Cha
pter
5:
Mov
emen
ts o
f Lab
or a
nd C
apita
l bet
wee
n C
ount
ries
Effects of Immigration in the Long RunEffect of Immigration on Industry Output FIGURE 5-7
The top and bottom axes of the box diagram measure the amount of labor, L, in the economy, and the side axes measure the amount of capital, K.
At point A, 0SL units of labor and 0SK units of capital are used in shoe production, and 0CL units of labor and 0CK units of capital are used in computers.
The K/L ratios in the two industries are measured by the slopes of 0SA and 0CA, respectively.
1 Movement of Labor between Countries: Migration
Allocation of Labor and Capital in a Box Diagram

18 of 62Copyright © 2011 Worth Publishers· International Economics· Feenstra/Taylor, 2/e.
Cha
pter
5:
Mov
emen
ts o
f Lab
or a
nd C
apita
l bet
wee
n C
ount
ries
Effects of Immigration in the Long Run
Determination of the Real Wage and Real Rental
• To determine the wage and rental in the economy, we use the marginal products of labor and capital, which are in turn determined by the capital-labor ratio in either industry.
• If there is a higher capital-labor ratio (that is, if there are more machines per worker), then by the law of diminishing returns, the marginal product of capital and the real rental must be lower.
• Having more machines per worker means that the marginal product of labor (and hence the real wage) is higher because each worker is more productive.
1 Movement of Labor between Countries: Migration
19 of 62Copyright © 2011 Worth Publishers· International Economics· Feenstra/Taylor, 2/e.
Cha
pter
5:
Mov
emen
ts o
f Lab
or a
nd C
apita
l bet
wee
n C
ount
ries
Effects of Immigration in the Long Run
Determination of the Real Wage and Real Rental
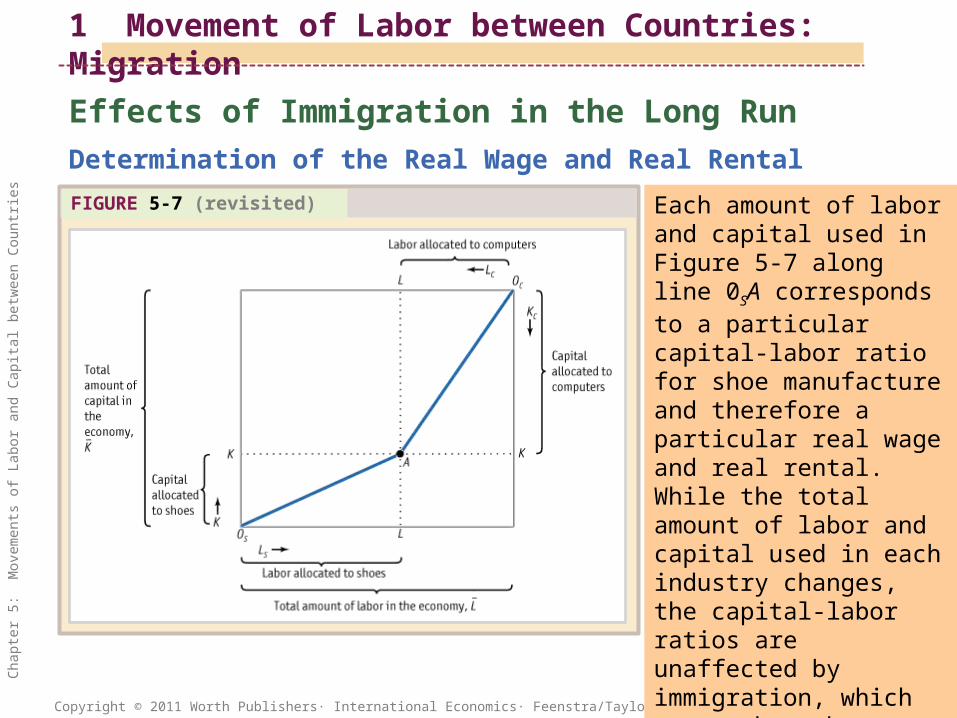
Each amount of labor and capital used in Figure 5-7 along line 0SA corresponds to a particular capital-labor ratio for shoe manufacture and therefore a particular real wage and real rental. While the total amount of labor and capital used in each industry changes, the capital-labor ratios are unaffected by immigration, which means that the immigrants can be absorbed with no change at all in the real wage and real rental.
1 Movement of Labor between Countries: Migration
FIGURE 5-7 (revisited)

20 of 62Copyright © 2011 Worth Publishers· International Economics· Feenstra/Taylor, 2/e.
Cha
pter
5:
Mov
emen
ts o
f Lab
or a
nd C
apita
l bet
wee
n C
ount
ries
Effects of Immigration in the Long RunIncrease in the Amount of Home LaborFIGURE 5-8 (1 of 2)
With an increase in Home labor from L to L + L, the origin for the shoe industry shifts from 0S to 0S. At point B, 0SL units of labor and 0SK units of capital are used in shoes, while 0CL units of labor and 0CK units of capital are used in computers.
1 Movement of Labor between Countries: Migration
Increase in Home Labor

21 of 62Copyright © 2011 Worth Publishers· International Economics· Feenstra/Taylor, 2/e.
Cha
pter
5:
Mov
emen
ts o
f Lab
or a
nd C
apita
l bet
wee
n C
ount
ries
Effects of Immigration in the Long RunIncrease in the Amount of Home LaborFIGURE 5-8 (2 of 2)
In the long run, industry outputs adjust so that the capital-labor ratios in each industry at point B (the slopes of 0SB and 0CB) are unchanged from the initial equilibrium at point A (the slopes of 0SA and 0CA). To achieve this outcome, all new labor resulting from immigration is allocated to the shoe industry, and capital and additional labor are transferred from computers to shoes, keeping the capital-labor ratio in both industries unchanged.
1 Movement of Labor between Countries: Migration
Increase in Home Labor (continued)

22 of 62Copyright © 2011 Worth Publishers· International Economics· Feenstra/Taylor, 2/e.
Cha
pter
5:
Mov
emen
ts o
f Lab
or a
nd C
apita
l bet
wee
n C
ount
ries
Effects of Immigration in the Long RunEffect of Immigration on Industry OutputsFIGURE 5-9
With an increase in the amount of labor at Home, the PPF shifts outward.
The output of shoes increases while the output of computers declines as the equilibrium moves from point A to B.
The prices of goods have not changed, so the slopes of the PPFs at points A and B (i.e., the relative price of computers) are equal.
The finding that an increase in labor will expand one industry but contract the other holds only in the long run; in the short run, as we saw in Figure 5-5, both industries will expand.
1 Movement of Labor between Countries: Migration
The Long-Run Effect on Industry Outputs of an Increase in Home Labor
23 of 62Copyright © 2011 Worth Publishers· International Economics· Feenstra/Taylor, 2/e.
Cha
pter
5:
Mov
emen
ts o
f Lab
or a
nd C
apita
l bet
wee
n C
ount
ries
Rybczynski Theorem
The Rybczynski theorem states that, in the Heckscher-Ohlin model with two goods and two factors, an increase in the amount of a factor found in an economy will increase the output of the industry using that factor intensively and decrease the output of the other industry.
We have proved the Rybczynski theorem for the case of immigration, where labor in the economy grows.
As we argue later in the chapter, the same theorem holds when capital in the economy grows: in this case, the industry using capital intensively expands and the other industry contracts.
1 Movement of Labor between Countries: Migration

24 of 62Copyright © 2011 Worth Publishers· International Economics· Feenstra/Taylor, 2/e.
Cha
pter
5:
Mov
emen
ts o
f Lab
or a
nd C
apita
l bet
wee
n C
ount
ries
Effect of Immigration on Factor Prices The Rybczynski theorem
Factor prices do not need to change as a result of immigration.
The reason that factor prices do not need to change is that the economy can absorb the extra amount of a factor by increasing the output of the industry using that factor intensively and reducing the output of the other industry.
The finding that factor prices do not change is sometimes called the factor price insensitivity result.
1 Movement of Labor between Countries: Migration
To understand the application that follows next, you should know that real value-added measures the payments to labor and capital in an industry corrected for inflation.

25 of 62Copyright © 2011 Worth Publishers· International Economics· Feenstra/Taylor, 2/e.
Cha
pter
5:
Mov
emen
ts o
f Lab
or a
nd C
apita
l bet
wee
n C
ount
ries
APPLICATION
The Effects of the Mariel Boat Lift on Industry Output in Miami
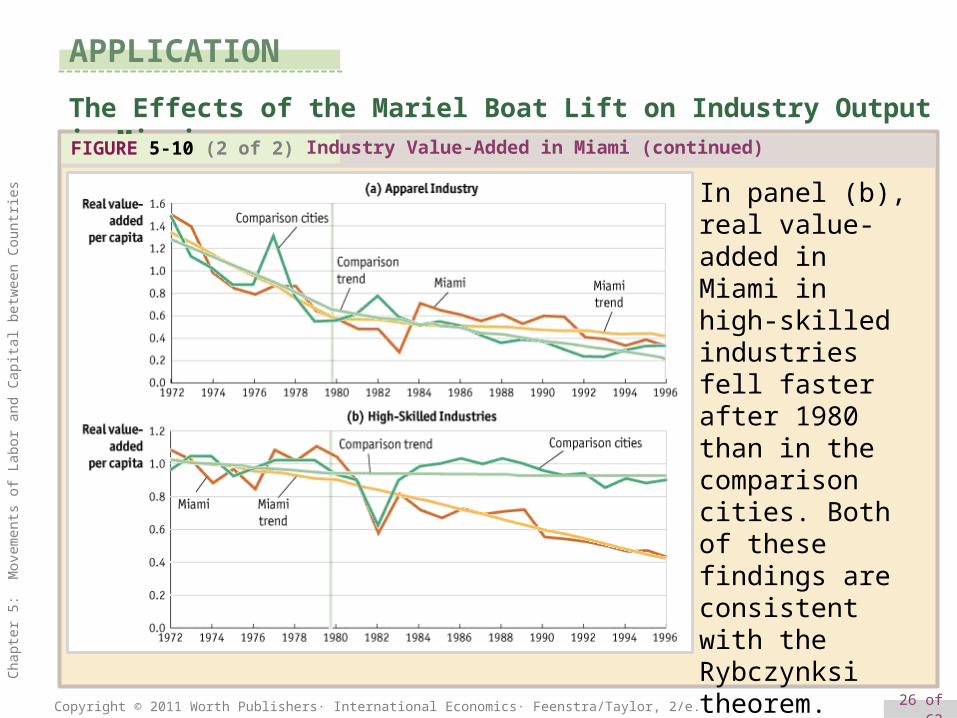
FIGURE 5-10 (1 of 2)
In panel (a), with the inflow of refugees from Cuba in 1980, real value-added in the apparel industry in Miami rose from 1983 to 1984, and the trend decline of this industry in Miami was slower (i.e., value-added did not fall as fast) after 1980 than in the comparison cities.
Industry Value-Added in Miami
26 of 62Copyright © 2011 Worth Publishers· International Economics· Feenstra/Taylor, 2/e.
Cha
pter
5:
Mov
emen
ts o
f Lab
or a
nd C
apita
l bet
wee
n C
ount
ries
APPLICATION
The Effects of the Mariel Boat Lift on Industry Output in Miami
FIGURE 5-10 (2 of 2)
In panel (b), real value-added in Miami in high-skilled industries fell faster after 1980 than in the comparison cities. Both of these findings are consistent with the Rybczynksi theorem.
Industry Value-Added in Miami (continued)

27 of 62Copyright © 2011 Worth Publishers· International Economics· Feenstra/Taylor, 2/e.
Cha
pter
5:
Mov
emen
ts o
f Lab
or a
nd C
apita
l bet
wee
n C
ount
ries
TABLE 5-1
APPLICATION
Immigration and U.S. Wages, 1990–2004
Miami Immigration and Wages in the United States This table shows the estimated effect of immigration on the wages of workers, depending on their educational level.

28 of 62Copyright © 2011 Worth Publishers· International Economics· Feenstra/Taylor, 2/e.
Cha
pter
5:
Mov
emen
ts o
f Lab
or a
nd C
apita
l bet
wee
n C
ount
ries
2 Movement of Capital between Countries:Foreign Direct Investment
Direct Investment
To continue our examination of what happens to wages and rentals when factors can move across borders, we turn now to look at how capital can move from one country to another through foreign direct investment (FDI), which occurs when a firm from one country owns a company in another country.

29 of 62Copyright © 2011 Worth Publishers· International Economics· Feenstra/Taylor, 2/e.
Cha
pter
5:
Mov
emen
ts o
f Lab
or a
nd C
apita
l bet
wee
n C
ount
ries
2 Movement of Capital between Countries:Foreign Direct Investment
Greenfield Investment
Our focus in this section will be on Greenfield investment, that is, the building of new plants abroad.
We model FDI as a movement of capital between countries, just as we modeled the movement of labor between countries.
The key question we ask is: How does the movement of capital into a country affect the earnings of labor and capital there?
This question is similar to the one we asked for immigration, so the earlier graphs that we developed can be modified to address FDI.
30 of 62Copyright © 2011 Worth Publishers· International Economics· Feenstra/Taylor, 2/e.
Cha
pter
5:
Mov
emen
ts o
f Lab
or a
nd C
apita
l bet
wee
n C
ount
ries
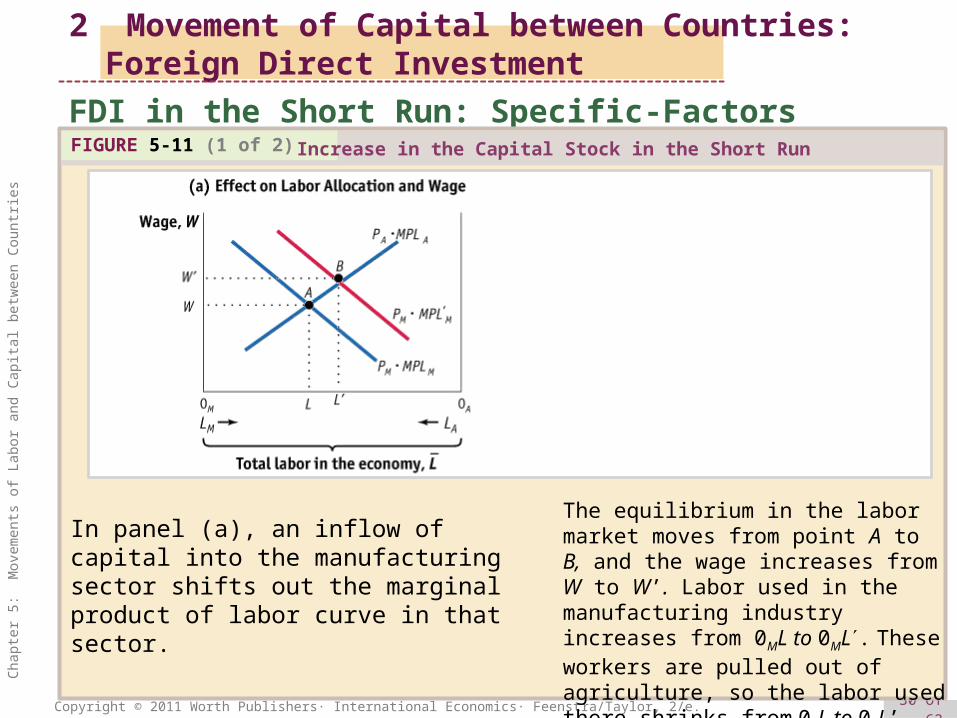
FDI in the Short Run: Specific-Factors ModelFIGURE 5-11 (1 of 2)
In panel (a), an inflow of capital into the manufacturing sector shifts out the marginal product of labor curve in that sector.
The equilibrium in the labor market moves from point A to B, and the wage increases from W to W’. Labor used in the manufacturing industry increases from 0ML to 0ML. These workers are pulled out of agriculture, so the labor used there shrinks from 0AL to 0AL’.
2 Movement of Capital between Countries:Foreign Direct Investment
Increase in the Capital Stock in the Short Run

31 of 62Copyright © 2011 Worth Publishers· International Economics· Feenstra/Taylor, 2/e.
Cha
pter
5:
Mov
emen
ts o
f Lab
or a
nd C
apita
l bet
wee
n C
ount
ries
FDI in the Short Run: Specific-Factors ModelFIGURE 5-11 (2 of 2)
In panel (b), with the inflow of capital into manufacturing, and the extra labor used in that sector, the output of manufacturing increases.
Because labor has been drawn out of agriculture, the output of that sector falls. These changes in outputs are shown by the outward shift of the PPF (due to the increase in capital) and the movement from point A to point B.
2 Movement of Capital between Countries:Foreign Direct Investment
Increase in the Capital Stock in the Short Run (continued)

32 of 62Copyright © 2011 Worth Publishers· International Economics· Feenstra/Taylor, 2/e.
Cha
pter
5:
Mov
emen
ts o
f Lab
or a
nd C
apita
l bet
wee
n C
ount
ries
FDI in the Short Run: Specific-Factors Model
2 Movement of Capital between Countries:Foreign Direct Investment
Effect of FDI on the Rentals:
With regard to the rental on land, we know that with an inflow of FDI, fewer workers are employed in agriculture, and each acre of land cannot be used as intensively.
The value of marginal product of land, RK = PA • MPTA, falls.
If MPTA falls and PA remains unchanged, then land rental must fall.
One way to measure the impact of FDI on the rental of capital is by the value of the marginal product of capital, or RK = PM • MPKM. However, using this method is difficult to determine how the rental on capital changes.
Another method is to take the revenue earned in manufacturing and subtract the payments to labor.
33 of 62Copyright © 2011 Worth Publishers· International Economics· Feenstra/Taylor, 2/e.
Cha
pter
5:
Mov
emen
ts o
f Lab
or a
nd C
apita
l bet
wee
n C
ount
ries
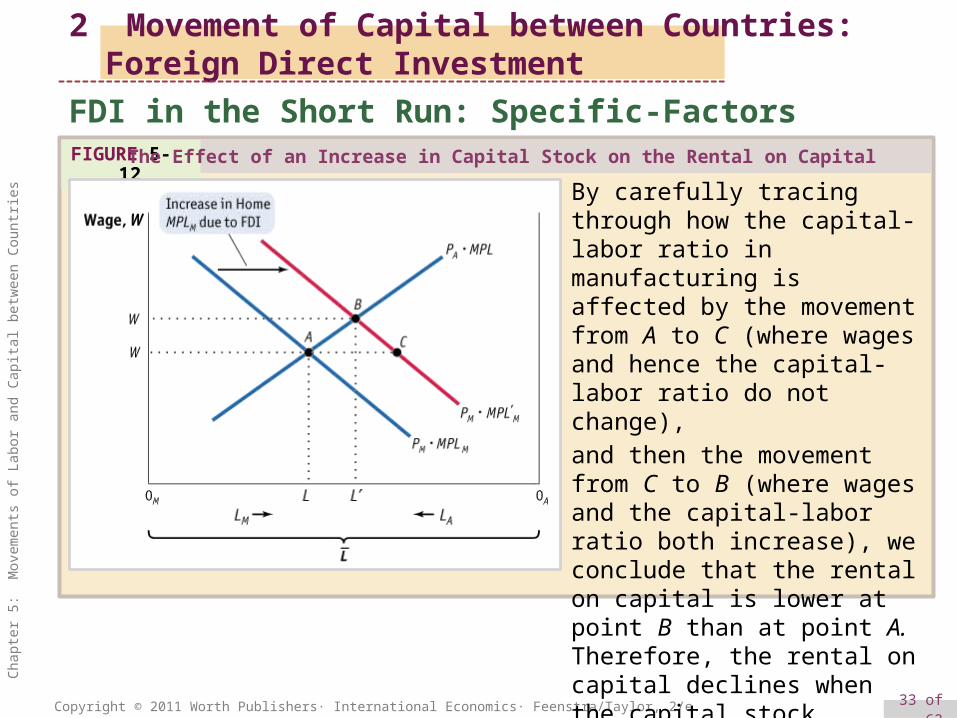
FDI in the Short Run: Specific-Factors ModelFIGURE 5-12
By carefully tracing through how the capital-labor ratio in manufacturing is affected by the movement from A to C (where wages and hence the capital-labor ratio do not change),
and then the movement from C to B (where wages and the capital-labor ratio both increase), we conclude that the rental on capital is lower at point B than at point A. Therefore, the rental on capital declines when the capital stock increases through FDI.
2 Movement of Capital between Countries:Foreign Direct Investment
The Effect of an Increase in Capital Stock on the Rental on Capital

34 of 62Copyright © 2011 Worth Publishers· International Economics· Feenstra/Taylor, 2/e.
Cha
pter
5:
Mov
emen
ts o
f Lab
or a
nd C
apita
l bet
wee
n C
ount
ries
FDI in the Long Run
2 Movement of Capital between Countries:Foreign Direct Investment
To analyze the impact of FDI in the long run, we continue with the same assumptions as before.• There are two industries, computers and shoes, with
two factors, labor and capital.• Computers are capital intensive and shoes are labor
intensive.

35 of 62Copyright © 2011 Worth Publishers· International Economics· Feenstra/Taylor, 2/e.
Cha
pter
5:
Mov
emen
ts o
f Lab
or a
nd C
apita
l bet
wee
n C
ount
ries
FDI in the Long RunFIGURE 5-13 (1 of 2)
In panel (a) the top and bottom axes of the box diagram measure the amount of labor in the economy, and the right and left axes measure the amount of capital. The initial equilibrium is at point A.
2 Movement of Capital between Countries:Foreign Direct Investment
Increase in the Capital Stock in the Long Run

36 of 62Copyright © 2011 Worth Publishers· International Economics· Feenstra/Taylor, 2/e.
Cha
pter
5:
Mov
emen
ts o
f Lab
or a
nd C
apita
l bet
wee
n C
ount
ries
FDI in the Long RunFIGURE 5-13 (2 of 2)
In panel (b), with the increase in the amount of capital at Home from increased FDI, the PPF shifts outward.
2 Movement of Capital between Countries:Foreign Direct Investment
Increase in the Capital Stock in the Long Run (continued)

37 of 62Copyright © 2011 Worth Publishers· International Economics· Feenstra/Taylor, 2/e.
Cha
pter
5:
Mov
emen
ts o
f Lab
or a
nd C
apita
l bet
wee
n C
ount
ries
FDI in the Long Run
2 Movement of Capital between Countries:Foreign Direct Investment
Effect of FDI on Outputs and Factor Prices• Capital increases due to FDI.• As the Rybczynski Theorem states, the increase in
capital through FDI has increased the output of the capital-intensive industry and reduced the output of the labor-intensive industry.
• This change in output is achieved with no change in the capital labor ratios in either industry. In figure 5-13, OC’B and OSB have same slopes as OCA and OSA.
• Because capital-labor ratios are unchanged, the wage and the rental on capital are also unchanged.
• In the long run model, an inflow of either factor of production will leave factor prices unchanged.
38 of 62Copyright © 2011 Worth Publishers· International Economics· Feenstra/Taylor, 2/e.
Cha
pter
5:
Mov
emen
ts o
f Lab
or a
nd C
apita
l bet
wee
n C
ount
ries
APPLICATION
The Effect of FDI on Rentals and Wages in Singapore
To analyze the impact of FDI on wages and rentals, we can use two methods:• First, we can estimate the marginal product of capital in
Singapore, using a production function that applies to the entire economy.
• The second approach involves the following:• If capital was rented instead of purchased, what would
the rental be?• The rental agency needs to make the same rate of
return on renting the capital equipment that it would make if it invested elsewhere.
• The real rental is:)( di
P
P
P
R K

39 of 62Copyright © 2011 Worth Publishers· International Economics· Feenstra/Taylor, 2/e.
Cha
pter
5:
Mov
emen
ts o
f Lab
or a
nd C
apita
l bet
wee
n C
ount
ries
TABLE 5-2 (1 of 2)
APPLICATION
The Effect of FDI on Rentals and Wages in Singapore
In part A, a production function approach is used to construct the factor prices, and the real rental falls over time because of the growth in capital. As a result, implied productivity growth is negative.
Real Rental and Wages in Singapore

40 of 62Copyright © 2011 Worth Publishers· International Economics· Feenstra/Taylor, 2/e.
Cha
pter
5:
Mov
emen
ts o
f Lab
or a
nd C
apita
l bet
wee
n C
ount
ries
TABLE 5-2 (2 of 2)
APPLICATION
The Effect of FDI on Rentals and Wages in Singapore
In part B, the rental and wages are constructed from data on payments to capital and labor in Singapore, and real wages grow over time, while the real rental either grows or falls slightly. As a result, implied productivity growth is positive.
Real Rental and Wages in Singapore

41 of 62Copyright © 2011 Worth Publishers· International Economics· Feenstra/Taylor, 2/e.
Cha
pter
5:
Mov
emen
ts o
f Lab
or a
nd C
apita
l bet
wee
n C
ount
ries
APPLICATION
The Effect of FDI on Rentals and Wages in Singapore• According to the calculated real rentals in part B of Table
5-2, there is little evidence of a downward fall in the rentals over time.
• There is also evidence that real wages grew over time.• This is not what the long run model predicts. The model
predicts unchanged factor prices with an inflow of capital.• That real wages are growing in Singapore, with little
change in the real rental, is an indication that there is productivity growth in the economy, which leads to an increase in the marginal product of labor and in the real wage. ■

42 of 62Copyright © 2011 Worth Publishers· International Economics· Feenstra/Taylor, 2/e.
Cha
pter
5:
Mov
emen
ts o
f Lab
or a
nd C
apita
l bet
wee
n C
ount
ries
Once upon a time, Western opinion leaders found themselves
both impressed and frightened by the extraordinary growth rates achieved by a set of Eastern economies.
- Called into question the dominance of Western power and ideology
- The leaders of those nations did not share our faith in free markets or unlimited civil liberties
- What time period are we referring to??
The 1960s
Asian economies are not too different from the growth of the Soviet Union in the 1950s and 1960.
HEADLINESThe Myth of Asia’s Miracle

43 of 62Copyright © 2011 Worth Publishers· International Economics· Feenstra/Taylor, 2/e.
Cha
pter
5:
Mov
emen
ts o
f Lab
or a
nd C
apita
l bet
wee
n C
ount
ries
Gains from Immigration
3 Gains from Labor and Capital Flows
Foreign investment and immigration are both controversial policy issues.
Most countries have at some point controlled FDI but later became open to foreign investment.
However, almost all countries impose limits on immigration.
U.S. immigration controls were established by the Quota Law of 1921. It allows a limited number of persons arriving annually from each country of origin.

44 of 62Copyright © 2011 Worth Publishers· International Economics· Feenstra/Taylor, 2/e.
Cha
pter
5:
Mov
emen
ts o
f Lab
or a
nd C
apita
l bet
wee
n C
ount
ries
Gains from Immigration
3 Gains from Labor and Capital Flows
The Immigration and Nationality Act Amendments of 1965 revised the country-specific limits and allowed immigration on a first-come first-served basis up to a limit.
Subsequent revisions to the immigration laws in the U.S. have changed policies, including:• Penalties for employers hiring illegal immigrants• Allowing some illegal immigrants to gain citizenship• Tightening border controls• Deporting other illegal immigrants
45 of 62Copyright © 2011 Worth Publishers· International Economics· Feenstra/Taylor, 2/e.
Cha
pter
5:
Mov
emen
ts o
f Lab
or a
nd C
apita
l bet
wee
n C
ount
ries
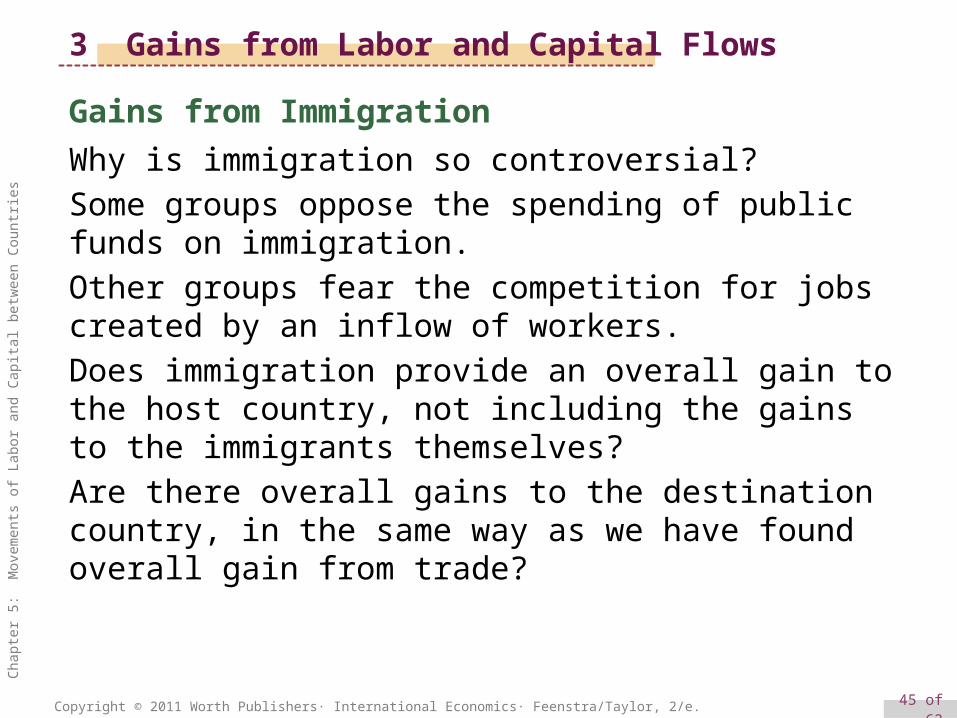
Gains from Immigration
3 Gains from Labor and Capital Flows
Why is immigration so controversial?
Some groups oppose the spending of public funds on immigration.
Other groups fear the competition for jobs created by an inflow of workers.
Does immigration provide an overall gain to the host country, not including the gains to the immigrants themselves?
Are there overall gains to the destination country, in the same way as we have found overall gain from trade?
46 of 62Copyright © 2011 Worth Publishers· International Economics· Feenstra/Taylor, 2/e.
Cha
pter
5:
Mov
emen
ts o
f Lab
or a
nd C
apita
l bet
wee
n C
ount
ries
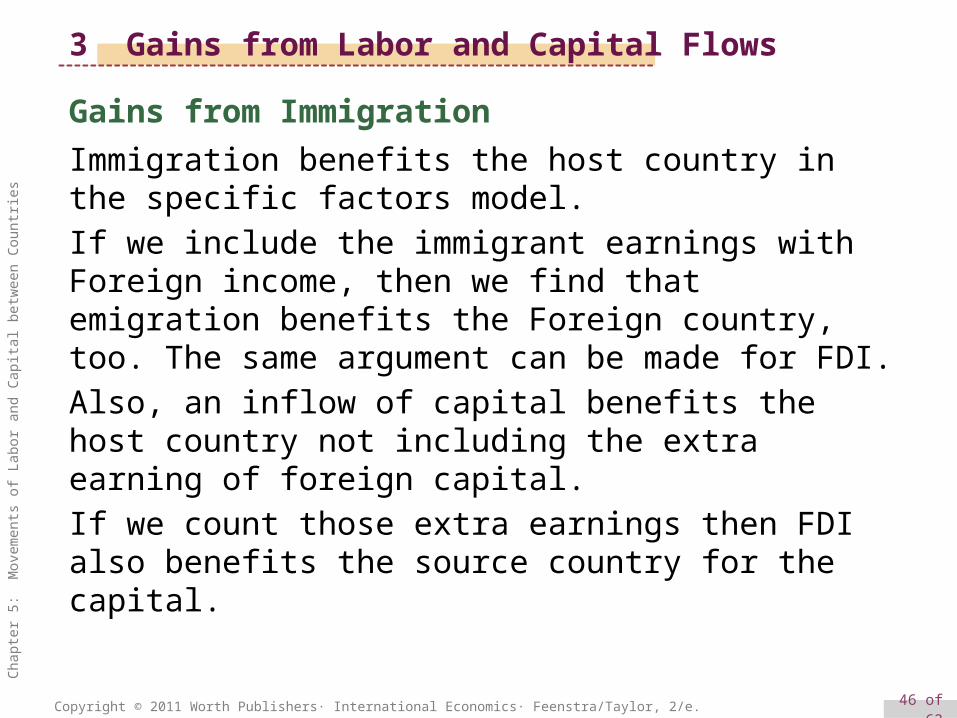
Gains from Immigration
3 Gains from Labor and Capital Flows
Immigration benefits the host country in the specific factors model.
If we include the immigrant earnings with Foreign income, then we find that emigration benefits the Foreign country, too. The same argument can be made for FDI.
Also, an inflow of capital benefits the host country not including the extra earning of foreign capital.
If we count those extra earnings then FDI also benefits the source country for the capital.

47 of 62Copyright © 2011 Worth Publishers· International Economics· Feenstra/Taylor, 2/e.
Cha
pter
5:
Mov
emen
ts o
f Lab
or a
nd C
apita
l bet
wee
n C
ount
ries
FIGURE 5-14
Initially, Home has OL workers and Foreign has O*L workers.
The Home wage is W, as determined at point A, which is higher than the Foreign wage W* at A*.
Workers will move from Foreign to Home to receive higher wages. The equilibrium with full migration is at point C, where wages are equalized at W.The gain to Home from migration is measured by triangle ABC,
and triangle A*BC represents the gains to Foreign.
Gains from Immigration
3 Gains from Labor and Capital Flows
World Labor Market

48 of 62Copyright © 2011 Worth Publishers· International Economics· Feenstra/Taylor, 2/e.
Cha
pter
5:
Mov
emen
ts o
f Lab
or a
nd C
apita
l bet
wee
n C
ount
ries
Gains from Immigration
3 Gains from Labor and Capital Flows
Combining the gains to the Home and Foreign countries, we obtain the triangular region ABA*, the world gains from immigration.
This magnitude is not too difficult to measure in practice. Turning the triangle on its side, its base equals (W – W*), the difference in the Home and Foreign wage in the absence of any migration.
The height of the triangle is (L – L), the number of foreign workers that would emigrate in the equilibrium with full migration. So the area of the triangle is 1/2(W – W*) • (L – L).
FIGURE 5-14 (revisited) World Gains from Migration
49 of 62Copyright © 2011 Worth Publishers· International Economics· Feenstra/Taylor, 2/e.
Cha
pter
5:
Mov
emen
ts o
f Lab
or a
nd C
apita
l bet
wee
n C
ount
ries
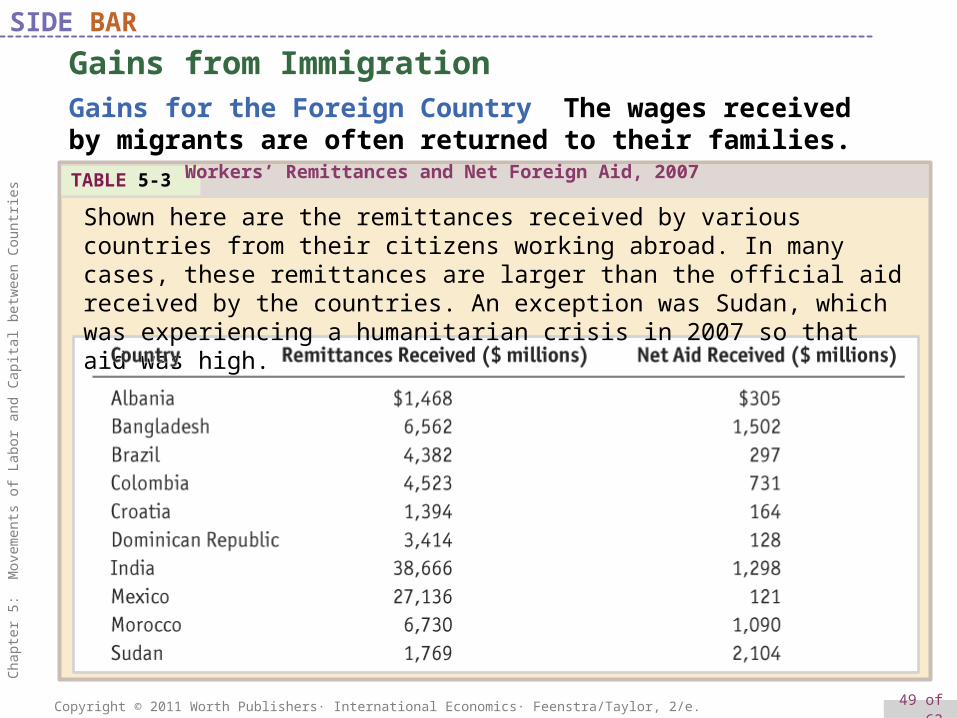
Gains from ImmigrationGains for the Foreign Country The wages received by migrants are often returned to their families.
SIDE BAR
TABLE 5-3
Shown here are the remittances received by various countries from their citizens working abroad. In many cases, these remittances are larger than the official aid received by the countries. An exception was Sudan, which was experiencing a humanitarian crisis in 2007 so that aid was high.
Workers’ Remittances and Net Foreign Aid, 2007

50 of 62Copyright © 2011 Worth Publishers· International Economics· Feenstra/Taylor, 2/e.
Cha
pter
5:
Mov
emen
ts o
f Lab
or a
nd C
apita
l bet
wee
n C
ount
ries
TABLE 5-4 (1 of 2)
APPLICATION
Gains from Migration
The results from several studies of immigration are shown in this table. The second column shows the amount of immigration (as a percentage of the Home labor force), and the third column shows the increase in Home GDP or the increase in GDP of the region.
Gains from Immigration

51 of 62Copyright © 2011 Worth Publishers· International Economics· Feenstra/Taylor, 2/e.
Cha
pter
5:
Mov
emen
ts o
f Lab
or a
nd C
apita
l bet
wee
n C
ount
ries
TABLE 5-4 (2 of 2)
APPLICATION
Gains from Migration

52 of 62Copyright © 2011 Worth Publishers· International Economics· Feenstra/Taylor, 2/e.
Cha
pter
5:
Mov
emen
ts o
f Lab
or a
nd C
apita
l bet
wee
n C
ount
ries
FIGURE 5-15
With 0K units of capital at Home, the Home rental is R, at point A.
The remaining capital 0*K is in Foreign, and the Foreign rental is R*, at point A*.
Capital will move from Home to Foreign to receive a higher rental. The equilibrium with full capital flows is at point B, where rentals are equalized at R. Triangle ABC measures the gains to Home from the capital outflow,
and triangle A*BC measures the gains to Foreign.
Gains from Foreign Direct Investment
3 Gains from Labor and Capital Flows
World Capital Market
53 of 62Copyright © 2011 Worth Publishers· International Economics· Feenstra/Taylor, 2/e.
Cha
pter
5:
Mov
emen
ts o
f Lab
or a
nd C
apita
l bet
wee
n C
ount
ries
1. Holding the amount of capital and land fixed in both industries, as in the specific-factors model, immigration leads to a fall in wages. This was the case, for example, with the mass migration to the New World in the nineteenth century.
K e y T e r m KEY POINTS

54 of 62Copyright © 2011 Worth Publishers· International Economics· Feenstra/Taylor, 2/e.
Cha
pter
5:
Mov
emen
ts o
f Lab
or a
nd C
apita
l bet
wee
n C
ount
ries
2. As wages fall due to immigration, the marginal products of the specific factors (capital and land) rise, and therefore their rentals also increase.
K e y T e r m KEY POINTS

55 of 62Copyright © 2011 Worth Publishers· International Economics· Feenstra/Taylor, 2/e.
Cha
pter
5:
Mov
emen
ts o
f Lab
or a
nd C
apita
l bet
wee
n C
ount
ries
3. Fixing the amount of capital and land in a country is a reasonable assumption in the short run, but in the longer run, firms will move capital between industries, which will change the effect of immigration on wages and rentals.
K e y T e r m KEY POINTS

56 of 62Copyright © 2011 Worth Publishers· International Economics· Feenstra/Taylor, 2/e.
Cha
pter
5:
Mov
emen
ts o
f Lab
or a
nd C
apita
l bet
wee
n C
ount
ries
4. In a long-run model with two goods and two factors, both of which are perfectly mobile between the industries, additional labor from immigration will be absorbed entirely by the labor-intensive industry. Furthermore, the labor-intensive industry will also absorb additional capital and labor from the capital-intensive industry, so its capital–labor ratio does not change in the long run. Because the capital–labor ratio in each industry does not change, the wage and rentals remain the same as well. This results in what is known as factor price insensitivity.
K e y T e r m KEY POINTS

57 of 62Copyright © 2011 Worth Publishers· International Economics· Feenstra/Taylor, 2/e.
Cha
pter
5:
Mov
emen
ts o
f Lab
or a
nd C
apita
l bet
wee
n C
ount
ries
5. According to the Rybczynski theorem, immigration will lead to an increase in output in the labor-intensive industry and a decrease in the output of the capital-intensive industry. This result is different from that of the short-run specific-factors model, in which immigration leads to increased output in both industries.
K e y T e r m KEY POINTS

58 of 62Copyright © 2011 Worth Publishers· International Economics· Feenstra/Taylor, 2/e.
Cha
pter
5:
Mov
emen
ts o
f Lab
or a
nd C
apita
l bet
wee
n C
ount
ries
6. Besides trade in goods and the movement of labor, another way that countries interact with one another is through investment. When a company owns property, plant, or equipment in another country, it is called foreign direct investment, or FDI.
K e y T e r m KEY POINTS

59 of 62Copyright © 2011 Worth Publishers· International Economics· Feenstra/Taylor, 2/e.
Cha
pter
5:
Mov
emen
ts o
f Lab
or a
nd C
apita
l bet
wee
n C
ount
ries
7. In the short run, FDI lowers the rentals on capital and land and raises wages. In the long run, the extra capital can be absorbed in the capital-intensive industry without any change in the wage or rental.
K e y T e r m KEY POINTS

60 of 62Copyright © 2011 Worth Publishers· International Economics· Feenstra/Taylor, 2/e.
Cha
pter
5:
Mov
emen
ts o
f Lab
or a
nd C
apita
l bet
wee
n C
ount
ries
8. According to the Rybczynski theorem, FDI will lead to an increase in the output of the capital-intensive industry and a decrease in the output of the labor-intensive industry.
K e y T e r m KEY POINTS

61 of 62Copyright © 2011 Worth Publishers· International Economics· Feenstra/Taylor, 2/e.
Cha
pter
5:
Mov
emen
ts o
f Lab
or a
nd C
apita
l bet
wee
n C
ount
ries
9. The movement of capital and labor generates overall gains for both the source and host countries, provided that the income of the emigrants is included in the source country’s welfare. Hence, there are global gains from immigration and FDI.
K e y T e r m KEY POINTS

62 of 62Copyright © 2011 Worth Publishers· International Economics· Feenstra/Taylor, 2/e.
Cha
pter
5:
Mov
emen
ts o
f Lab
or a
nd C
apita
l bet
wee
n C
ount
ries
specific-factors model
Rybczynski theorem
factor price insensitivity
real value-added
foreign direct investment (FDI)
equilibrium with full migration
K e y T e r m KEY TERMS