Embed Size (px)
Citation preview
1
MF-852 Financial Econometrics
Lecture 2
Matrix Operations in Econometrics, Optimization with Excel
Roy J. EpsteinFall 2003

2
Matrix Application in Excel: Curve Fitting Data for 3 different years as
follows:Year Value1 157 4525 60
Fit a smooth curve through these points using a quadratic (2nd degree) polynomial. Why does a parabola work?
3
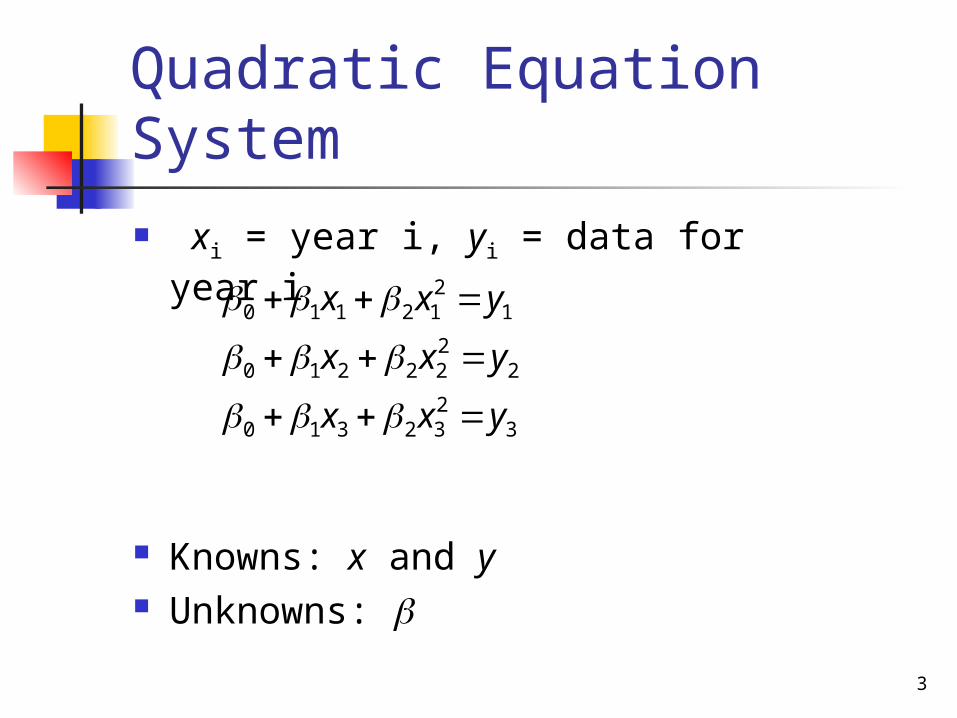
Quadratic Equation System xi = year i, yi = data for year i
Knowns: x and y Unknowns:
3232310
2222210
1212110
yxx
yxx
yxx

4
Matrix Solution for
Can solve when X has an inverse! Must be square, non-singular matrix
3
2
1
2
1
0
233
222
211
, ,
1
1
1
y
y
y
y
xx
xx
xx
X
Xy
yX 1
5
Matrix Solution for
60
45
15
,
256 52 1
94 7 1
1 1 1
yX
174.0
39.6
78.8

6
Excel GraphQuadratic Fit with 3 Data Points
0
10
20
30
40
50
60
70
80
0 5 10 15 20 25 30
X
Y

7
Sum of Squares Suppose
Then
mb
b
b
b
2
1
n
ibbb1
2

8
Cross-Products Matrix Suppose m > n and
Does X –1 exist?
XX is the cross-products matrix.
mnmm
n
n
xxx
xxx
xxx
X
2 1
2 22 21
1 12 11

9
Cross-Products Matrix XX =
Can (XX )–1 exist?
m
inin
m
iin
m
iin
m
ini
m
ii
m
ii
m
ini
m
ii
m
ii
xxxxxx
xxxxxx
xxxxxx
1
12
11
12
122
112
11
121
111

10
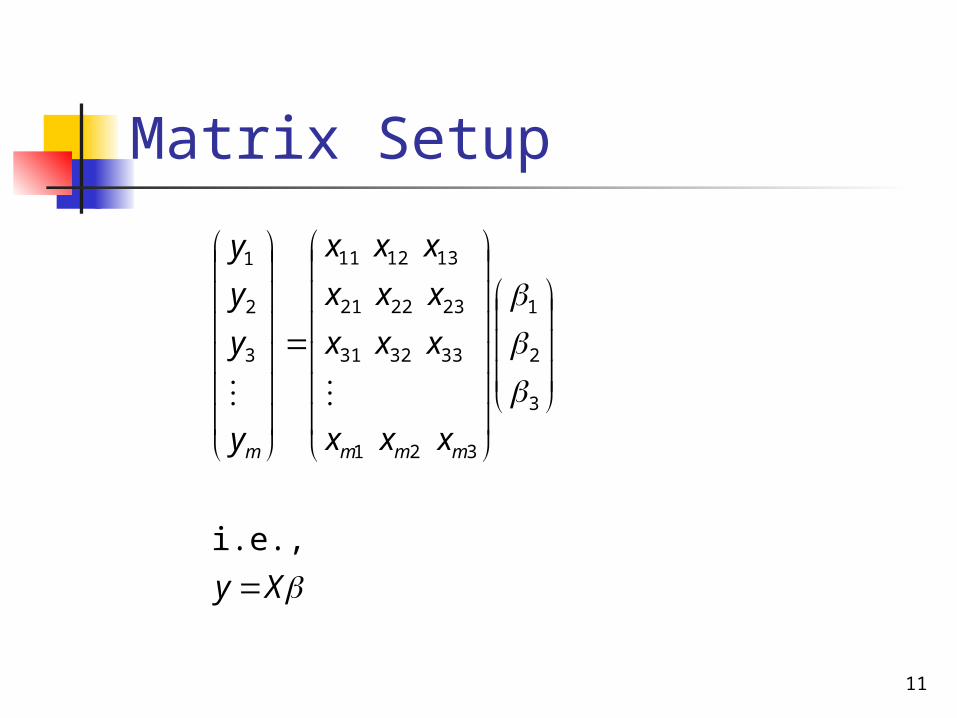
Exact Linear Model y is dependent variable (a vector). 3 independent variables: x1, x2, x3
(each is a vector). Each observation is of the form
The ’s are unknown and have to be estimated from the data.
332211 iiii xxxy
11
Matrix Setup
Xy
xxx
xxx
xxx
xxx
y
y
y
y
mmmm
i.e.,
3
2
1
321
333231
232221
131211
3
2
1

12
Model Dimensionality Model is y = X . How many equations? How many unknowns? Is there a solution?

13
Solution to Linear Model
Multiply through by XX y = X X
How many equations, how many unknowns?
Solution is = (X X )–1X y

14
Linear Regression Model Each observation is of the form
ei is “noise” or an “error” term. Why would a model contain an
error term?
eXy
exxxy iiiii
so
332211

15
Solution to Regression Model Multiply through by X
X y = X X + X e
Suppose X e = 0. What are the implications?
Then solution is = (X X )–1X y
16
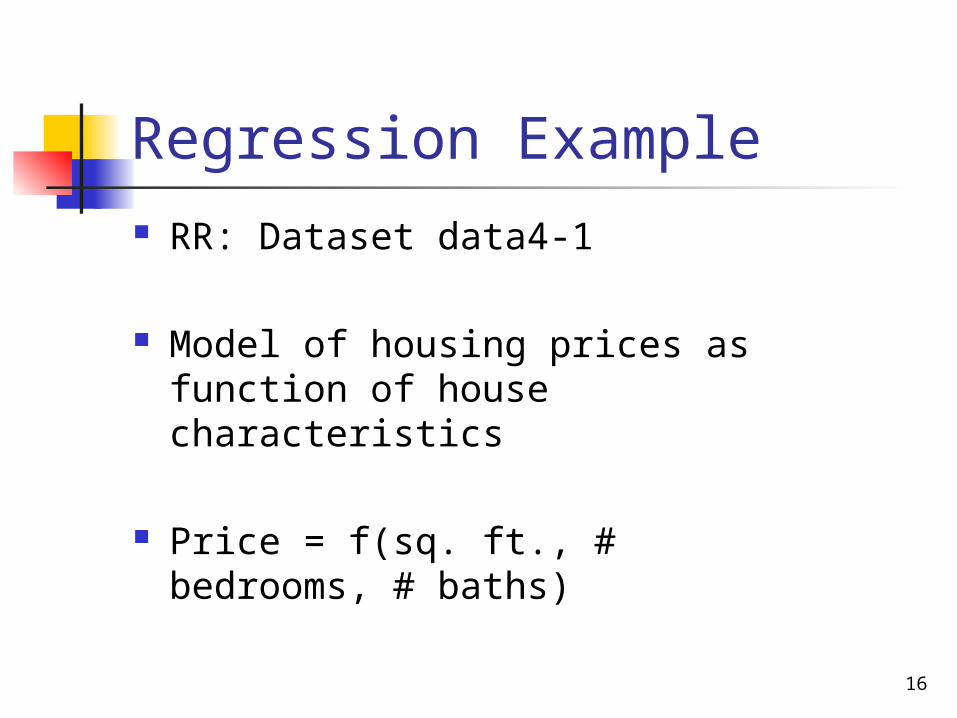
Regression Example RR: Dataset data4-1
Model of housing prices as function of house characteristics
Price = f(sq. ft., # bedrooms, # baths)

17
Constrained Optimization We often need to maximize (or
minimize) a function subject to constraints on the function’s arguments.
E.g. Maximize a1x1 + a2x2 + a3x3 subject to b11x1 + b12x2 + b13x3 c1
b21x1 + b22x2 + b23x3 c2
Knowns: ai , bi , ci
Unknowns: xi
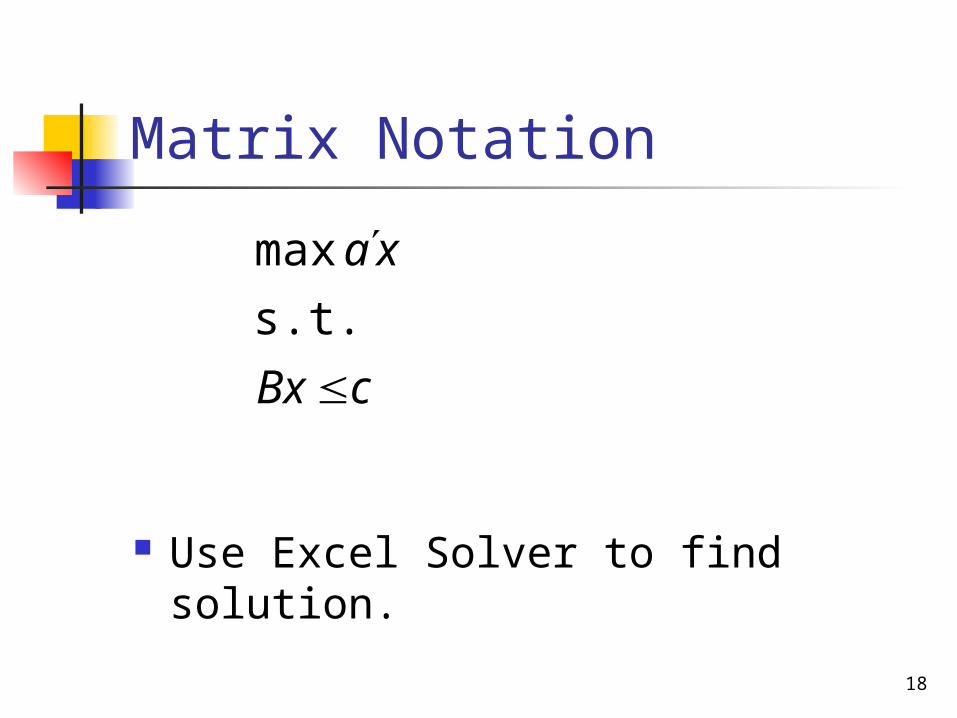
18
Matrix Notation
Use Excel Solver to find solution.
cBx
xa
s.t.
max

19
Example — Bond Portfolio Maximize expected after-tax return subject to
constraints on portfolio characteristics
Instrument After-tax yield MaturityT-bill 4.85% 0.5T-bond 6.88% 18.5State bond 8.05% 19.4Local bond 7.65% 7.3Corporates 7.34% 24.4
20
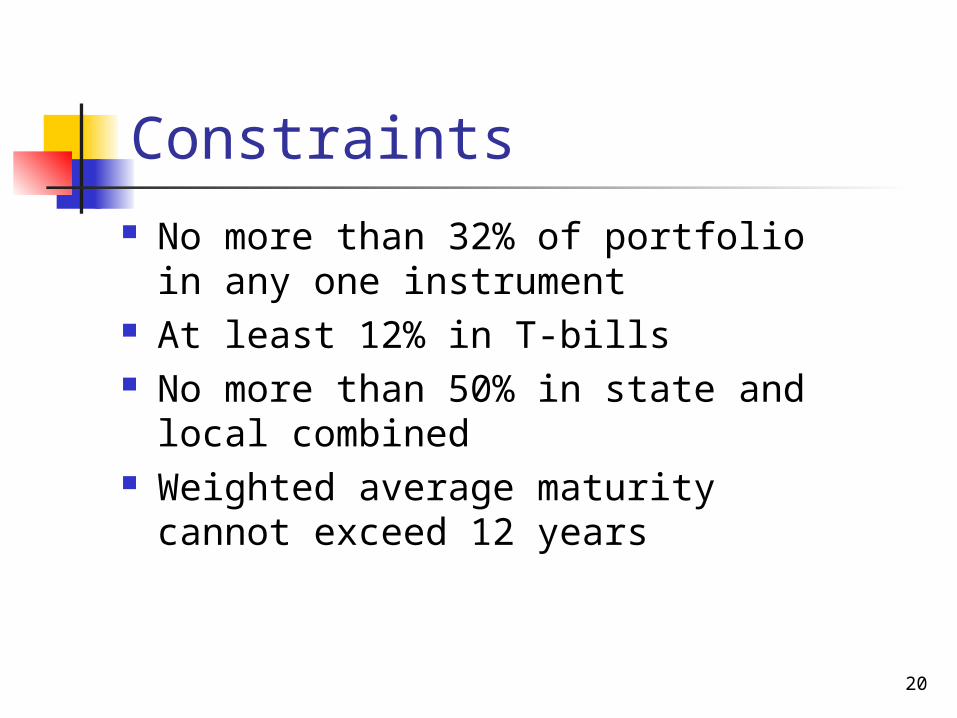
Constraints No more than 32% of portfolio in
any one instrument At least 12% in T-bills No more than 50% in state and
local combined Weighted average maturity
cannot exceed 12 years

21
Problem Set-Up Max .0485x1 + .0688x2 + .0805x3 + .0765x4
+ .0734x5
s.t.x1 + x2 + x3 + x4 + x5 = 1
x1 0.32
x2 0.32
x3 0.32
x4 0.32
x5 0.32
x3 + x4 0.50
0.5x1 + 18.5x2 + 19.4x3 + 7.3x4 + 24.4x5 12
x1 0.12
22
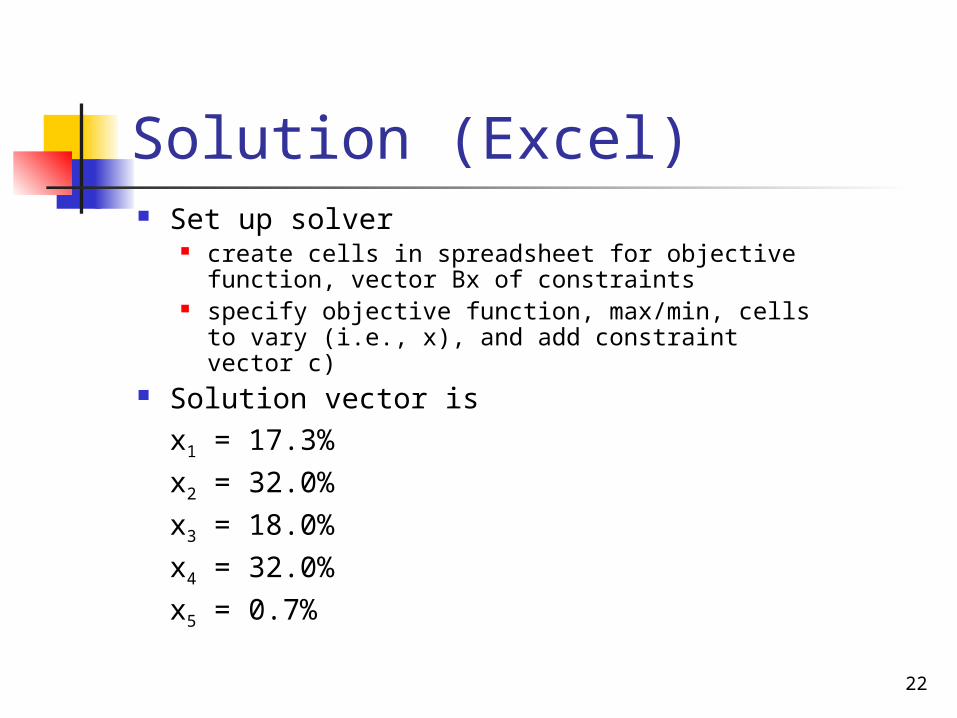
Solution (Excel) Set up solver
create cells in spreadsheet for objective function, vector Bx of constraints
specify objective function, max/min, cells to vary (i.e., x), and add constraint vector c)
Solution vector isx1 = 17.3%
x2 = 32.0%
x3 = 18.0%
x4 = 32.0%
x5 = 0.7%