Embed Size (px)
Citation preview
1
May 27, 2009
Briefing for National Treasury Employees Union
End-User Equipment & Services (EUES)
Business Process Reengineering (BPR)
Presented by- Bill Ankrum
EUES Business Process Reengineering
• Today’s Discussion
• Case for Change
• EUES BPR: What, Why, How & When
• New Service Delivery Blueprint
• Workforce Impact
• Proposed Placement
• Proposed Mitigation
• Timeline
• Communications
2
3
EUES Business Process Reengineering• Case for Change
• Business Partners must have timely and consistent delivery of information technology equipment and support services to successfully achieve their tax administration missions
• MITS must deliver its mission efficiently and effectively to meet business needs while balancing cost, performance and risk to the IRS
• Significant opportunity exists where these drivers intersect to:
• Reduce customer downtime by resolving problems at the service desk on the first contact
• Avoid and upstream break/fix work from field support to the service desk• Improve service delivery, especially for remote sites, via service desk • Better coordinate project work that impacts service desk, field, and
business partner resources
• Business process reengineering within EUES will enable MITS to deliver end-user services at reduced cost, with improved service levels, and within acceptable risk; freeing-up support dollars for other priority needs
4
EUES Business Process Reengineering
• What• EUES organization is currently undergoing business processing
reengineering to reduce operational costs and increase service delivery performance to meet or exceed Federal Information Technology Infrastructure Line-of-Business (ITI-LOB) target levels
• ITI-LOB standards reflect industry comparable levels of cost and performance for the delivery of end-user IT equipment and service desk services
• Why• EUES organization was previously undergoing an A-76 Competition as part
of President’s Management Agenda (PMA) Competitive Sourcing program directed by the Office of Management and Budget (OMB)
• Although the competition was ultimately canceled, the OMB and Department of Treasury carried forward an expectation that IRS would achieve results comparable to competition through use of business process reengineering

5
EUES Business Process Reengineering
• How• EUES BPR team has developed a High Performing Organization (HPO)
blueprint designed around reengineered service delivery processes, updated technology tools, and industry best-practices
• HPO design significantly changes the current support model which is highly distributed and heavy on labor, to a leaner model focused on centralized service desk support, consolidated onsite support in high-density customer locations, and contracted support for low-density customer locations
• When• HPO blueprint is to be deployed beginning FY-10 with workforce transition
activities completing in FY-12

6
EUES Business Process Reengineering
• New Service Delivery Blueprint
• Redistributes labor between field support and service desk• Provides multi-functional resources capable of delivering service desk
and/or field support as workload demands require • Combines service desk and field support into one command and control
structure – with one reporting line and centralized workload planning• Consolidates & centralizes support functions• Institutionalizes continual process improvement functions• Is based on industry best-practice IT service management model –
Information Technology Infrastructure Library (ITIL)• Uses reengineered processes to drive a function based organization• Implements robust performance measures and reporting scorecard• Will improve customer service to business partners
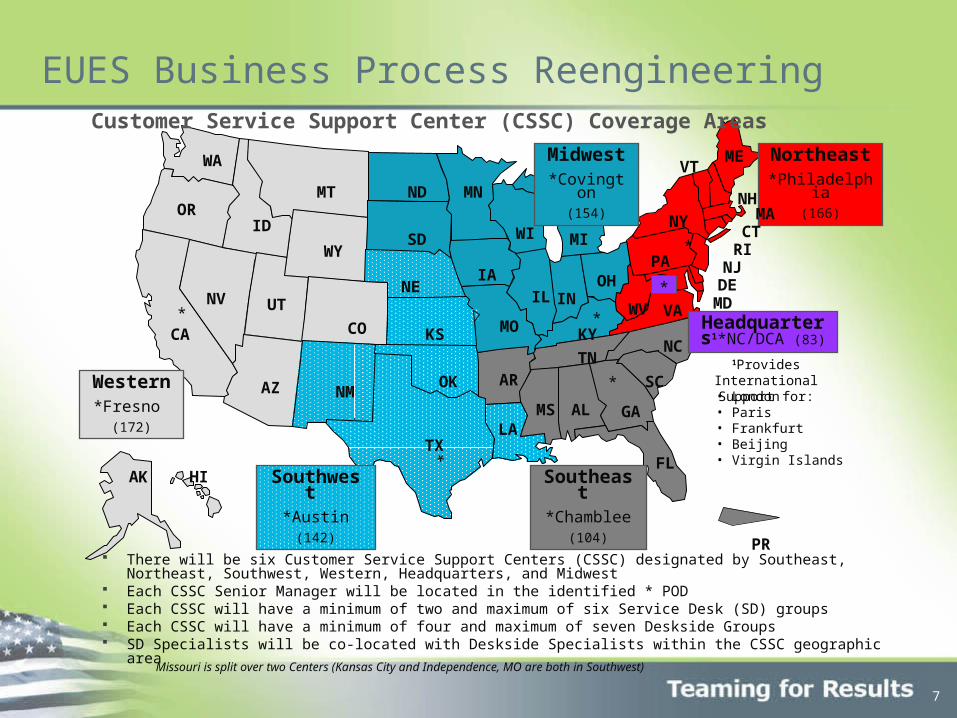
There will be six Customer Service Support Centers (CSSC) designated by Southeast, Northeast, Southwest, Western, Headquarters, and Midwest
Each CSSC Senior Manager will be located in the identified * POD Each CSSC will have a minimum of two and maximum of six Service Desk (SD) groups Each CSSC will have a minimum of four and maximum of seven Deskside Groups SD Specialists will be co-located with Deskside Specialists within the CSSC geographic area
Missouri is split over two Centers (Kansas City and Independence, MO are both in Southwest)
EUES Business Process Reengineering
7
PR
1Provides International Support for:• London• Paris• Frankfurt• Beijing• Virgin Islands
Northeast*Philadelphia
(166)
Midwest *Covington
(154)
Headquarters1
*NC/DCA (83)
Southeast *Chamblee
(104)
Southwest *Austin
(142)
Western*Fresno
(172)
WA
SD
ND
AZ
UT
WY
MT
NV
ORID
CA MO
IANE
MN
CO
NMOK
TXFL
WI
IL
ARTN
SC
AL GALA
WV
PA
INOH
MI
KY
VA
NC
MANH
VT
MS
NY
ME
NJRICT
DEMD
AK HI
KS
*
*
*
*
*
Customer Service Support Center (CSSC) Coverage Areas
*
ACIO 1.0
NC/DCA1373 (3FTE)
Deputy ACIO2.0
NC/DCA (3FTE)
4.0 Operations Service Support NC/DCA223 (3FTE)
5.0 Business Services and Management
NC/DCA182 (3FTE)
3.0 Customer Service Support NC/DCA962 (3FTE)
3.8 Solution Design and Development
Chamblee (2)
3.1 Southeast Customer Service
Support CenterChamblee (5)
5.5 SecurityNC/DCA
5.2 Project & Workload
ManagementNC/DCA (2)
4.1 Service, Asset, and Configuration
ManagementOgden (3)
4.1.1 Hardware Asset Management
ANC/DCA
4.1.3 Software Asset Management
MCC
4.1.4 Configuration Management
Ogden
4.3 AcquisitionsStrategy
NC/DCA (3)
4.3.1 Commodities & Contract Management
Group A(NC/DCA)
4.3.2 Commodities & Contract Management
Group BDallas
4.3.3 Purchasing Andover
4.2 Standards, Release, &
Change Management
MCC (4)
4.2.1 Security Standards
MCC
4.2.2 Development & Standards
MCC – Mgr & 9 ee’s
NYC – 8 ee’s
4.2.3 Integration & TestingMCC
5.1 Service Level ManagementNC/DCA (2)
5.1.2 Service Review
Oakland-Bay Area
5.1.1 Service DesignNC/DCA
5.4.3 Performance Measurement
Chicago
5.4.2 Reports AnalysisFresno
5.4.1 Operational Assessment NC/DCA
5.3 Business Administration
Austin (2)
5.3.1 Training Cincinnati
5.3.2 Budget / Financial
ManagementAustin
5.3.3 Human Resources
Oakland-Bay Area
4.1.5 Inventory Management
Ogden
3.8.1 Knowledge Management
Austin
3.8.3 Philadelphia End User Problem
Management
3.8.2 Vendor Support Liaison
Chamblee
5.4 Continual Process
Improvement NC/DCA (2)
5.2.1 Project Group A
NC/DCA
5.2.2 Project Group B
Atlanta
5.2.3 Project Group C
Seattle
5.2.4 Capacity, Continuity, & Availability
ManagementNC/DCA – Mgr & 7
ee’sAtlanta – 8 ee’s
4.2.5 Change Management Philadelphia
4.2.4 Release ManagementPhiladelphia
4.1.2 Hardware Asset Management
BPhiladelphia
4.1.6 Austin Equipment Depot
4.1.7 Ogden Equipment Depot
3.7 Operational Planning & Control Center
Laguna – Mgr & 10 ee’s Brookhaven – 6 ee’s
3.8.4 FresnoEnd User Problem
Management
3.8.5 San Francisco
End User Problem Management
3.3 Northeast Customer Service
Support CenterPhiladelphia (4)
3.4 Midwest Customer Service
Support CenterCovington (4)
3.5 Southwest Customer Service
Support CenterAustin (4)
3.2 Western Customer Service
Support CenterFresno (4)
3.6 Headquarters Customer Service
Support CenterNC/DCA (5)
3.1.5-7 Service Desk Groups (3)
46
3.1.1-4 Deskside Groups (4)
53
3.2.8-11 Service Desk Groups (4)
62
3.2.1-7 Deskside
Groups (7) 87
3.3.6-11 Service Desk Groups (6)
93
3.3.1-5 Deskside
Groups (5) 69
3.4.6-11 Service Desk Groups (6)
95
3.4.1-5 Deskside Groups 5)
55
3.5.6-10 Service Desk Groups (5)
78
3.5.1-5 Deskside
Groups (5) 60
3.6.5-6 Service Desk
Groups (2) 30
3.6.1-4 Deskside
Groups (4) 48
104
172
154
166
142
83
78
96
79
60
12
13
11
11
11
45
13
13
16
11
16
1818
12
12
11
13
13
15
11
11
2844
58
39
16
10
10
13
14
13
16
15
15
12
12
13
12
220
179
959
1367
3.2.12*SOI
Development & Maintenance
19
3.7.1*IDSE
4
4.1.8*VITA
Support Group
7
3.7.1.2-11*CDMC
50
3.7.1.1*Quality Support Ctr
Memphis7
61
7
50
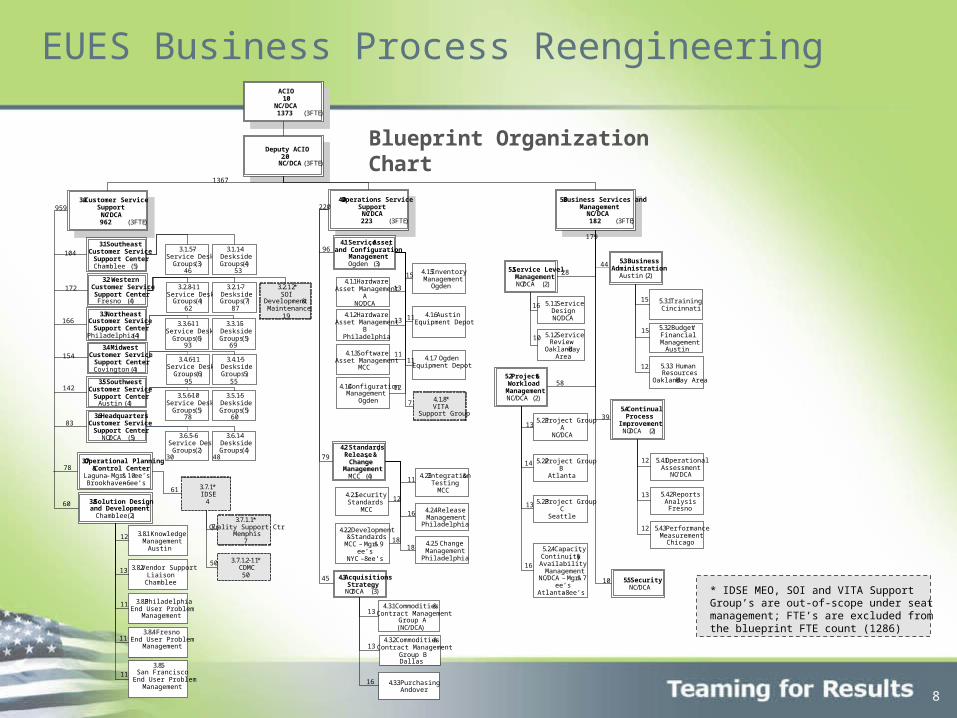
EUES Business Process Reengineering
Blueprint Organization Chart
* IDSE MEO, SOI and VITA Support Group’s are out-of-scope under seat management; FTE’s are excluded from the blueprint FTE count (1286)
8

9
EUES Business Process Reengineering
• Workforce Impact
• EUES will experience many new positions and job function changes • EUES will move from 136 PODs to 89 & from 90 commuting areas to 59• The new organization will expand the current 24/7 operation creating an
increased need for varying tours of duty and existing AWS schedules will be impacted
• Fewer management positions (143 to 104) will result in many employees having new managers
• EUES/MITS is committed to utilizing a variety of mitigation tools to reduce EUES employee impact
10
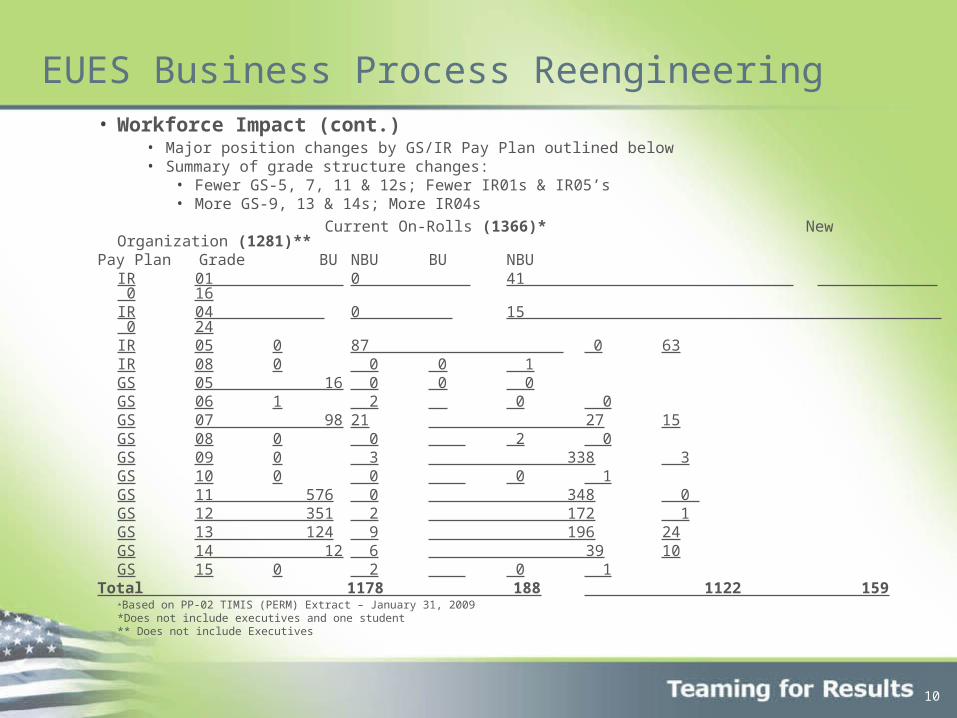
EUES Business Process Reengineering• Workforce Impact (cont.)
• Major position changes by GS/IR Pay Plan outlined below• Summary of grade structure changes:
• Fewer GS-5, 7, 11 & 12s; Fewer IR01s & IR05’s• More GS-9, 13 & 14s; More IR04s
Current On-Rolls (1366)* New Organization (1281)**Pay Plan Grade BUNBU BU NBU
IR 01 0 41 0 16IR 04 0 15 0 24IR 05 0 87 0 63IR 08 0 0 0 1GS 05 16 0 0 0GS 06 1 2 0 0GS 07 98 21 27 15GS 08 0 0 2 0GS 09 0 3 338 3GS 10 0 0 0 1GS 11 576 0 348 0 GS 12 351 2 172 1GS 13 124 9 196 24GS 14 12 6 39 10GS 15 0 2 0 1
Total 1178 188 1122 159 *Based on PP-02 TIMIS (PERM) Extract – January 31, 2009
*Does not include executives and one student ** Does not include Executives

11
EUES Business Process Reengineering• Workforce Impact (cont.)
• Major position changes by Series outlined below:• Summary of series structure:
• Fewer series 318 (secretarial), 335 (computer asst) & 560 (budget)• More series 344 (mgmt asst), 343 (mgmt analyst) & BU 2210 (IT Specialist)
Current On-Rolls (1366)* New Organization (1281)**Pay Plan Series BU NBU BU NBUGS & IR 0080 0 1 0 1
0301 1 3 0 10318 16 26 0 40335 98 0 14 00340 0 31 0 160343 53 21 81 340344 1 0 15 160560 26 0 14 02210 983 106 998 87
Total 1178 188 1122 159 *Based on PP-02 TIMIS (PERM) Extract – January 31, 2009
*Does not include executives and one student **Does not include Executives
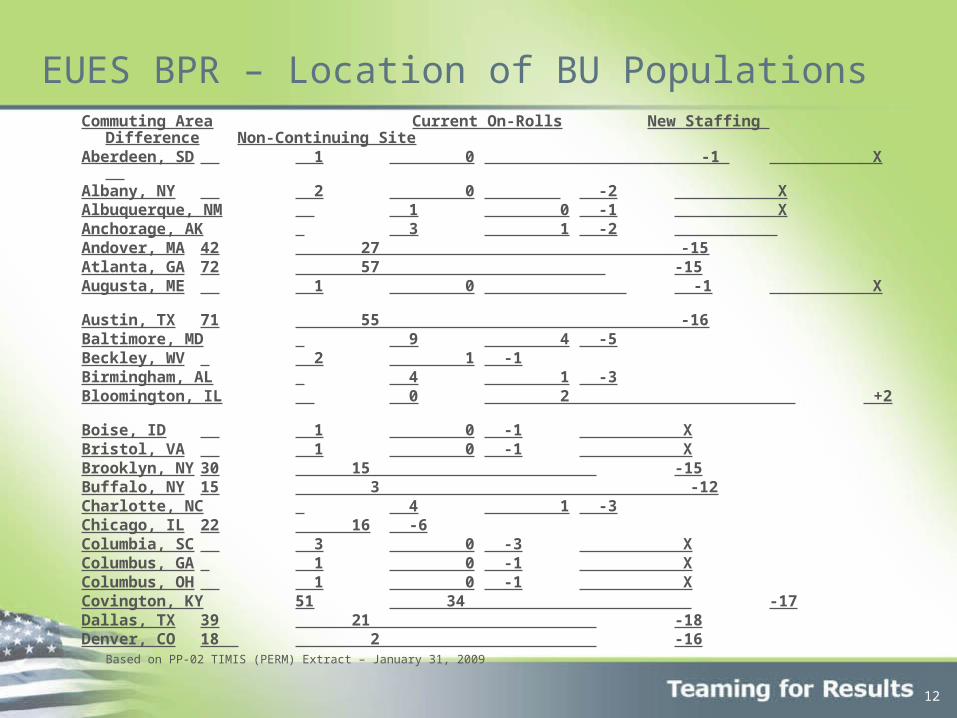
EUES BPR – Location of BU PopulationsCommuting Area Current On-Rolls New Staffing Difference Non-Continuing SiteAberdeen, SD 1 0 -1 X Albany, NY 2 0 -2 XAlbuquerque, NM 1 0 -1 XAnchorage, AK 3 1 -2 Andover, MA 42 27 -15Atlanta, GA 72 57 -15Augusta, ME 1 0 -1 XAustin, TX 71 55 -16Baltimore, MD 9 4 -5Beckley, WV 2 1 -1Birmingham, AL 4 1 -3Bloomington, IL 0 2 +2Boise, ID 1 0 -1 XBristol, VA 1 0 -1 XBrooklyn, NY 30 15 -15Buffalo, NY 15 3 -12Charlotte, NC 4 1 -3Chicago, IL 22 16 -6Columbia, SC 3 0 -3 XColumbus, GA 1 0 -1 XColumbus, OH 1 0 -1 XCovington, KY 51 34 -17Dallas, TX 39 21 -18Denver, CO 18 2 -16 Based on PP-02 TIMIS (PERM) Extract – January 31, 2009
12

EUES BPR – Location of BU PopulationsCommuting Area Current On-Rolls New Staffing Difference Non-Continuing SiteDes Moines, IA 2 0 -2 XDetroit, MI 24 5 -19Eugene, OR 1 0 -1 XFargo, ND 1 0 -1 XFitchburg, MA 0 1 +1Fresno, CA 62 45 -17Grand Rapids, MI 2 0 -2 XGreensboro, NC 10 1 -9Hartford, CT 7 2 -5Hato Rey, PR 6 2 -4Helena, MT 1 0 -1 XHoltsville, NY 33 15 -18Honolulu, HI 2 1 -1Houma, LA 1 0 -1 XHouston, TX 15 4 -11Independence, OH 11 4 -7Indianapolis, IN 12 3 -9Jackson, MS 1 0 -1 XJacksonville, FL 16 4 -12Kansas City, MO 37 16 -21Knoxville, TN 1 0 -1 XLaguna Niguel, CA 22 13 -9Las Vegas, NV 2 2 0Little Rock, AR 2 0 -2 X Based on PP-02 TIMIS (PERM) Extract – January 31, 2009
13
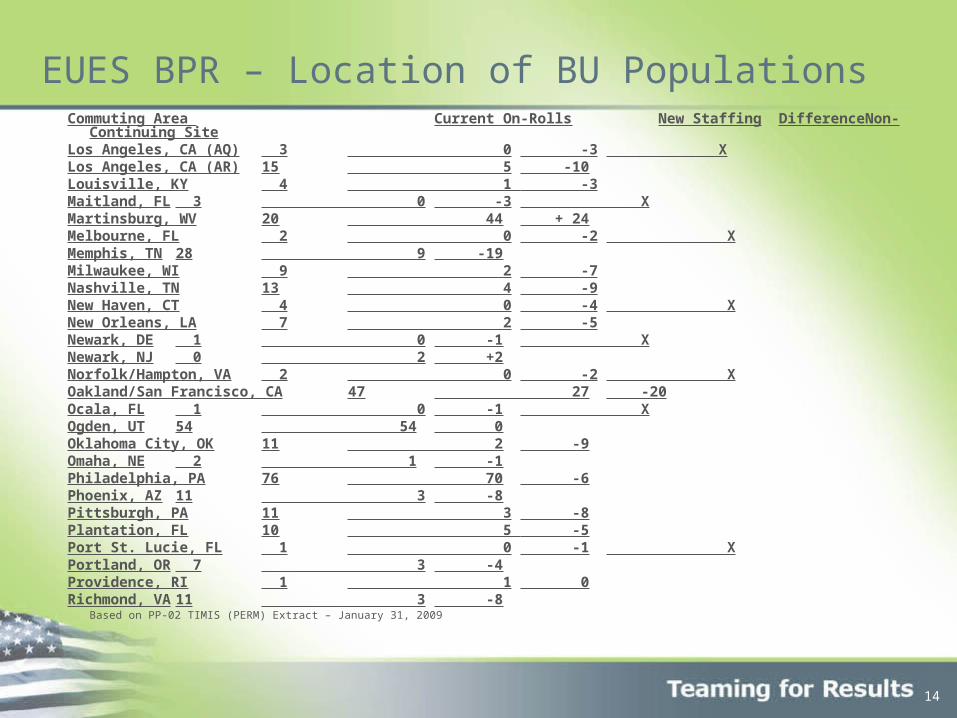
EUES BPR – Location of BU PopulationsCommuting Area Current On-Rolls New Staffing Difference Non-Continuing SiteLos Angeles, CA (AQ) 3 0 -3 XLos Angeles, CA (AR) 15 5 -10Louisville, KY 4 1 -3Maitland, FL 3 0 -3 XMartinsburg, WV 20 44 + 24Melbourne, FL 2 0 -2 XMemphis, TN 28 9 -19Milwaukee, WI 9 2 -7Nashville, TN 13 4 -9New Haven, CT 4 0 -4 XNew Orleans, LA 7 2 -5Newark, DE 1 0 -1 XNewark, NJ 0 2 +2Norfolk/Hampton, VA 2 0 -2 XOakland/San Francisco, CA 47 27 -20Ocala, FL 1 0 -1 XOgden, UT 54 54 0Oklahoma City, OK 11 2 -9Omaha, NE 2 1 -1Philadelphia, PA 76 70 -6Phoenix, AZ 11 3 -8Pittsburgh, PA 11 3 -8Plantation, FL 10 5 -5Port St. Lucie, FL 1 0 -1 XPortland, OR 7 3 -4Providence, RI 1 1 0Richmond, VA 11 3 -8
Based on PP-02 TIMIS (PERM) Extract – January 31, 2009
14

EUES BPR – Location of BU PopulationsCommuting Area Current On-Rolls New Staffing Difference Non-Continuing SiteSacramento, CA 4 2 -2 Salisbury, MD 1 0 -1 XSan Antonio, TX 2 2 0 San Bernardino, CA 2 1 -1San Diego, CA 4 2 -2Seattle, WA 18 15 -3Springfield, NJ 10 1 -9 St. Louis, MO 17 6 -11St. Paul, MN 13 3 -10Tampa, FL 4 0 -4 XThousand Oaks, CA 0 1 +1Tulsa, OK 2 0 -2 XWashington DC 80 112 +32West Palm Beach, FL 1 0 -1 XWichita, KS 1 0 -1 XHeadquarters Service Desk-PODA- R1 0 28 +28Midwest Service Desk- PODA R2 0 89 +89Northeast Service Desk- PODA-R3 0 87 +87Southeast Service Desk-PODA-R4 0 43 +43Southwest Service Desk- PODA-R5 0 73 +73Western Service Desk- PODA-R6 0 58 +58 TOTAL 1178 1122 -56 31Based on PP-02 TIMIS (PERM) Extract – January 31, 2009
Service Desk managers and employees may sit at any POD with a Desk side presence within the specific Customer Service Support Center
15
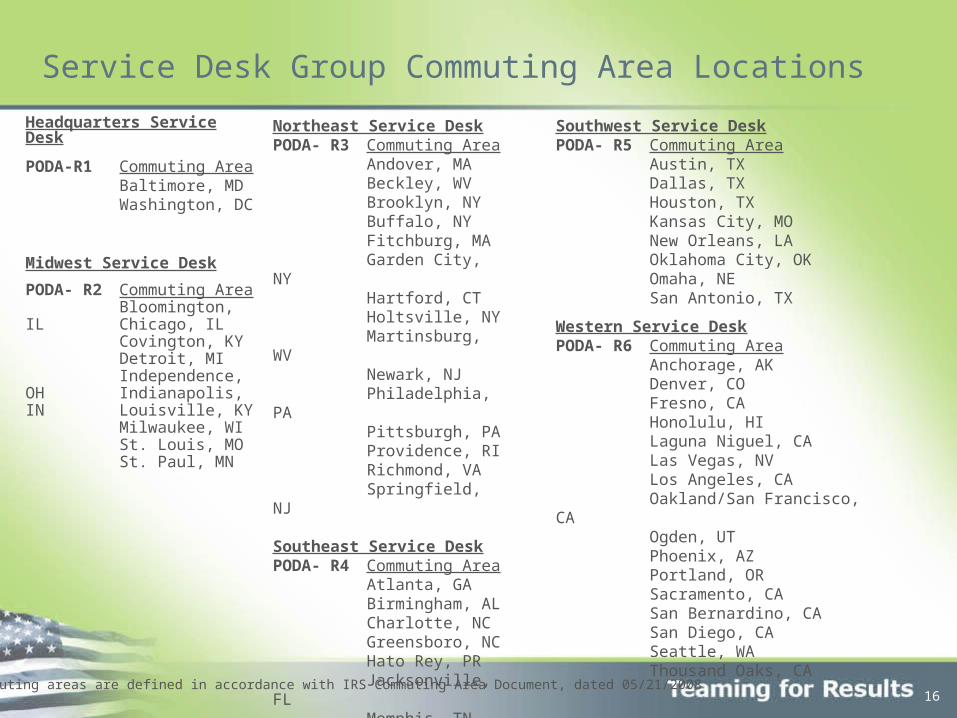
Service Desk Group Commuting Area Locations
Headquarters Service Desk
PODA-R1 Commuting AreaBaltimore, MDWashington, DC
Midwest Service Desk
PODA- R2 Commuting AreaBloomington, ILChicago, IL
Covington, KYDetroit, MI Independence, OH
Indianapolis, INLouisville, KYMilwaukee, WISt. Louis, MO St. Paul, MN
Northeast Service DeskPODA- R3 Commuting Area
Andover, MABeckley, WVBrooklyn, NYBuffalo, NYFitchburg, MAGarden City, NYHartford, CTHoltsville, NYMartinsburg, WVNewark, NJPhiladelphia, PAPittsburgh, PAProvidence, RIRichmond, VA Springfield, NJ
Southeast Service DeskPODA- R4 Commuting Area
Atlanta, GABirmingham, ALCharlotte, NCGreensboro, NCHato Rey, PRJacksonville, FLMemphis, TNNashville, TNPlantation, FL
Southwest Service DeskPODA- R5 Commuting Area
Austin, TXDallas, TXHouston, TXKansas City, MONew Orleans, LAOklahoma City, OKOmaha, NESan Antonio, TX
Western Service DeskPODA- R6 Commuting Area
Anchorage, AKDenver, COFresno, CAHonolulu, HILaguna Niguel, CALas Vegas, NVLos Angeles, CAOakland/San Francisco, CAOgden, UTPhoenix, AZPortland, ORSacramento, CASan Bernardino, CASan Diego, CASeattle, WAThousand Oaks, CA
16* Commuting areas are defined in accordance with IRS Commuting Area Document, dated 05/21/2008

EUES BPR - Proposed Placement Process
1) Where workforce supply is =/< than demand for a specific position* w/in a POD, employees will follow their work & be realigned into the like continuing positions.
2) Where remaining workforce supply exceeds demand for a specific position* w/in a commuting area, Art 15 will be used to realign employees into the like continuing positions within POD first and then the commuting area.
3) Article 13 will be used to competitively announce remaining blueprint positions not filled in 1-2 above **
4) Open window for voluntary movement of EUES GS-2210-11/12 (Customer Support) employees to new GS-2210-9 (CS), POD-flexible positions. If more volunteers than positions, EOD determines placement.
5) Using Art 15, reassign remaining employees who are eligible for different/remaining positions w/in the POD first then commuting area.
6) Remaining NBP employees assigned work & offered additional mitigation opportunities.
*Same series, specialty, grade (full working level), and PD** Propose RPP letters be issued before competition roundNote: Voluntary Relocation Incentive (VRI) offered in Step 3 for lateral movement only (w/ same promotion potential)
17
18
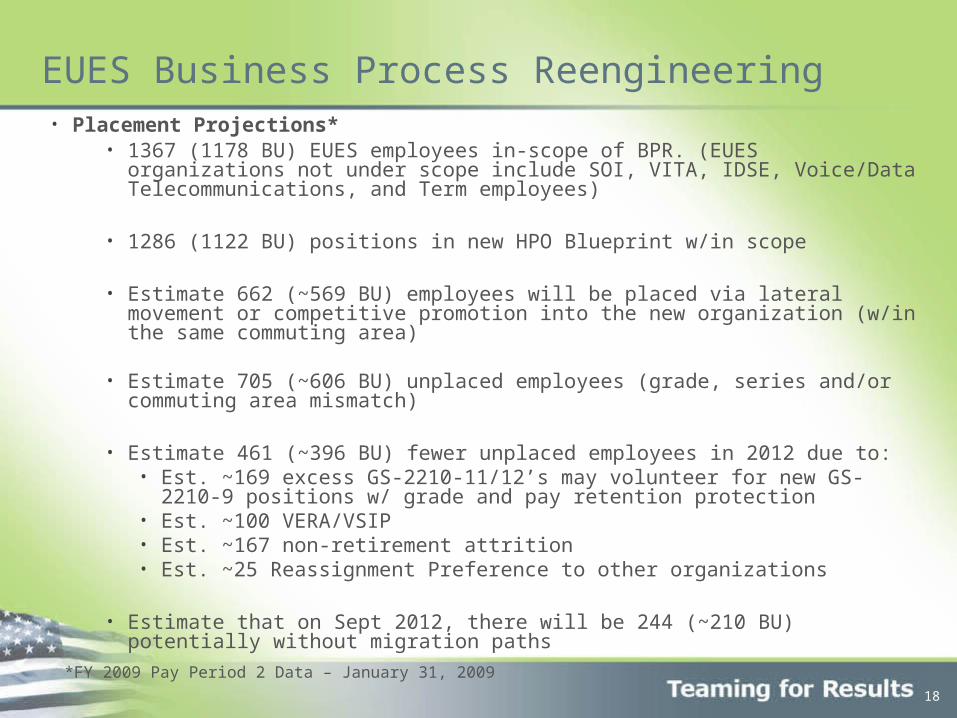
EUES Business Process Reengineering• Placement Projections*
• 1367 (1178 BU) EUES employees in-scope of BPR. (EUES organizations not under scope include SOI, VITA, IDSE, Voice/Data Telecommunications, and Term employees)
• 1286 (1122 BU) positions in new HPO Blueprint w/in scope
• Estimate 662 (~569 BU) employees will be placed via lateral movement or competitive promotion into the new organization (w/in the same commuting area)
• Estimate 705 (~606 BU) unplaced employees (grade, series and/or commuting area mismatch)
• Estimate 461 (~396 BU) fewer unplaced employees in 2012 due to:• Est. ~169 excess GS-2210-11/12’s may volunteer for new GS-2210-9 positions
w/ grade and pay retention protection• Est. ~100 VERA/VSIP• Est. ~167 non-retirement attrition• Est. ~25 Reassignment Preference to other organizations
• Estimate that on Sept 2012, there will be 244 (~210 BU) potentially without migration paths
*FY 2009 Pay Period 2 Data – January 31, 2009
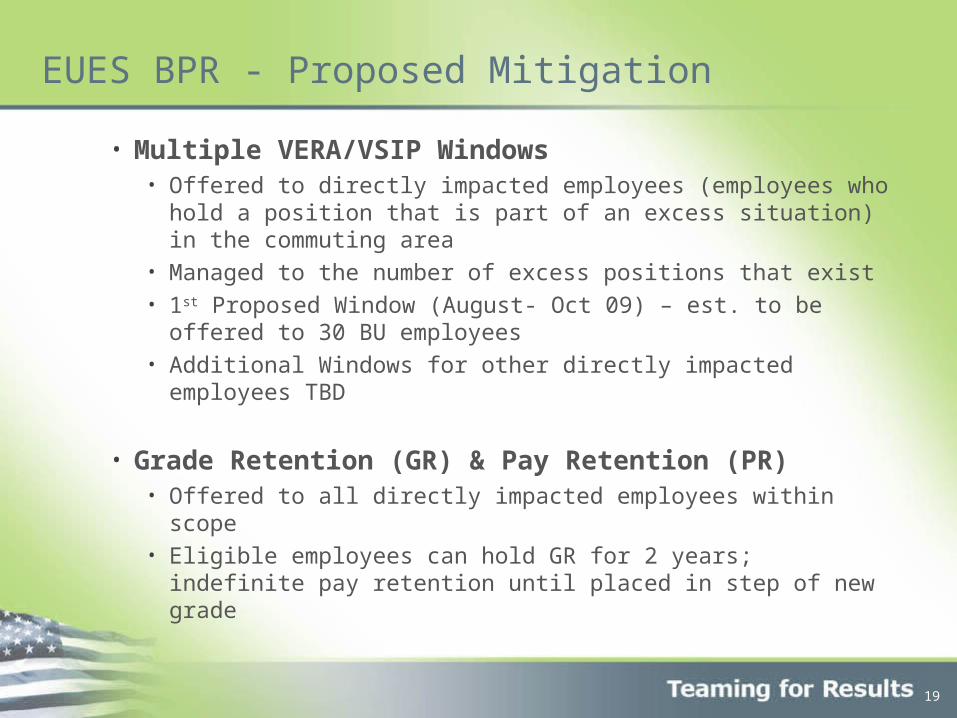
EUES BPR - Proposed Mitigation
• Multiple VERA/VSIP Windows• Offered to directly impacted employees (employees who hold a position
that is part of an excess situation) in the commuting area• Managed to the number of excess positions that exist• 1st Proposed Window (August- Oct 09) – est. to be offered to 30 BU
employees • Additional Windows for other directly impacted employees TBD
• Grade Retention (GR) & Pay Retention (PR) • Offered to all directly impacted employees within scope • Eligible employees can hold GR for 2 years; indefinite pay retention until
placed in step of new grade
19
EUES BPR - Proposed Mitigation (cont’d)
• Reassignment Preference Priority (RPP) • RPP offered to directly impacted employees who hold a position that is
considered to have an excess for the commuting area• RPP can be used for any lateral/lower graded movement• Propose RPP notices be issued upon completion of step 2 in proposed
placement process (before competition step 3)
• Voluntary Relocation Incentives • Policy 78 to govern; Move must promote restructuring goals and new
position must have same career ladder and similar skills that is not “at risk” and closes a skills gap in the new duty station
• Offered to directly impacted employees who voluntarily move to a position in a new duty station (case-by-case review/approval)
• Individual case-by-case review; Employee may receive up to 25% of salary (not to exceed $15,000)
20
EUES BPR - Proposed Mitigation (cont’d)
• Career Counseling • EUES committed to ensuring employees have access to COL, USAJobs,
phones, faxes, copy machines and other equipment that will facilitate job search
• EUES committed to providing 4 hrs admin time for directly impacted employees to pursue services such as:
• ELMS courses such as MPQ preparation, Creating Career Learning Plans, Managing Change, etc
• Books 24X7
• CIO-IT Council Outreach• MITS will network with existing federal IT forums to promote the availability of
skilled EUES workforce that may be in need of placement• Seek to advertise in-house, availability of known like positions in industry or
w/ other federal agencies
• Business Partners/BODs• EUES mgmt committed to working with BODs to ascertain opportunities for
unplaced EUES employees where good fits exist
21

EUES - BPR Timeline
22
Apr-09 May-09 Jun-09 Jul -09 Aug -09 Sep -09 Oct -09 Nov -09 Dec-09 Jan -10 Feb -09 Mar-10
Oct 09 Organizational
Standup*
Apr-10
* Standup = Initial movement of some EUES employees into new org structure
Nov 09 - March 10 - Execute BU Placement Process
June – Aug 09 NTEU
Negotiations – VV & Reorg
Sept – Nov 09 Potential 2nd VV Window
Jul 09 – VV Authority Obtained
Aug –Oct 09 1st VV Window
May 09 – Brief NTEU on Org Blueprint
Oct - Nov 09 Mgmt Placement Process

23
EUES Business Process Reengineering
• Communications Strategy• Employee and customer focused dissemination per robust communications
plan coordinated with NTEU• EUES ACIO & Deputy ACIO (or designate) in collaboration with NTEU will
conduct town hall meetings in all locations where employees may be impacted by the new organization. Topics will include:
1) Sharing the MOU
2) Providing the proponents for taking advantage of reassignment
and merit placement opportunities
3) Explaining the mitigation strategies