Embed Size (px)
Citation preview
1
Introduction to the Cross Media Optimization Study
Introduction to the Cross Media Optimization Study
Robert AcquaottaDirector, Advertiser Relations

2
Landmark study methodology assesses “Cost Effectiveness”
of each Medium
Scientifically evaluates real world, in-market
campaigns
Marketers carefully considered
methodology
Largest Cross Media Study Ever ConductedLargest Cross Media Study Ever Conducted

3
Introducing the ParticipantsIntroducing the Participants
IAB:IAB: The organizing Association
Marketing Evolution/Rex Briggs:Marketing Evolution/Rex Briggs: Developed landmark study methodology and executed the studies
Dynamic Logic:Dynamic Logic: Applied AdIndex® product to collect consumer views and behavior
ARF (Advertising Research Foundation):ARF (Advertising Research Foundation): Reviewed the study methodology
Forrester Research:Forrester Research: Full analysis & review
4
State of The Union:
Interactive Medium
State of The Union:
Interactive Medium
5
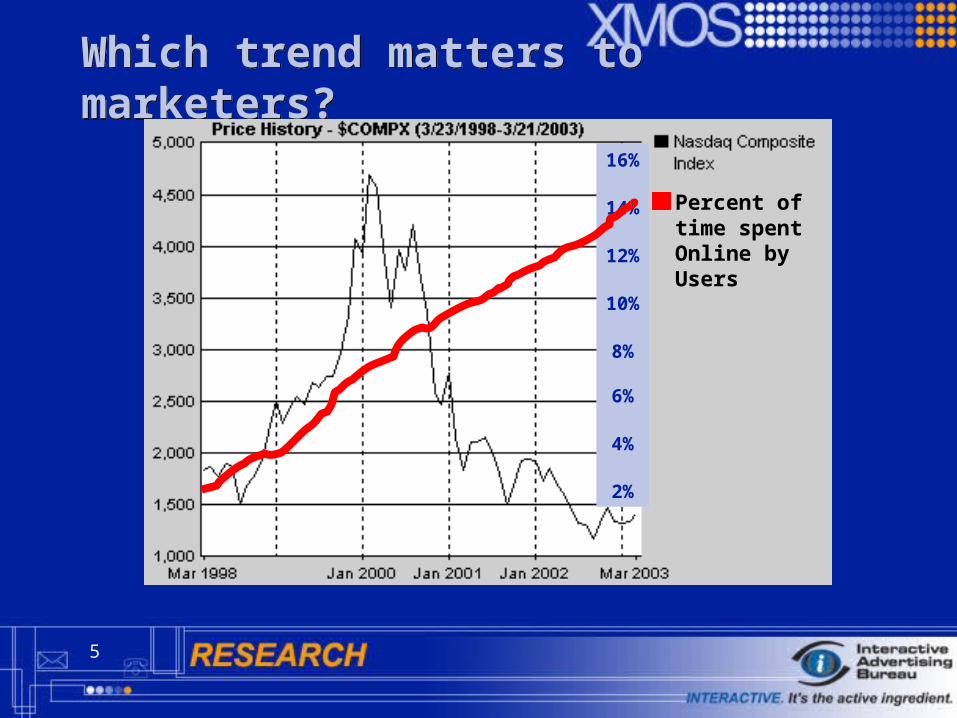
Which trend matters to marketers?Which trend matters to marketers?
Percent of time spent Online by Users
16%
14%
12%
10%
8%
6%
4%
2%

6
Online Delivers the AudienceOnline Delivers the Audience
66%
34%
Source: Harris Interactive, April 2002
Fully Two Thirds of the
Adult U.S. Population is Now Online
137 Million Consumers Online
137 Million Consumers Online
Source: Harris Interactive, April 2002

7
…And their Usage Doubles Over Time…And their Usage Doubles Over Time
6.57.5
8.8
11.1
13.2
0
2
4
6
8
10
12
14
Ho
urs
Per
Wee
k
<1 year 1-2 years 2-4 years 4-5 years 5+ years
The longer online, the more they use & engage
Source: eMarketer; UCLA Center for Communications Policy, November, 2001
8
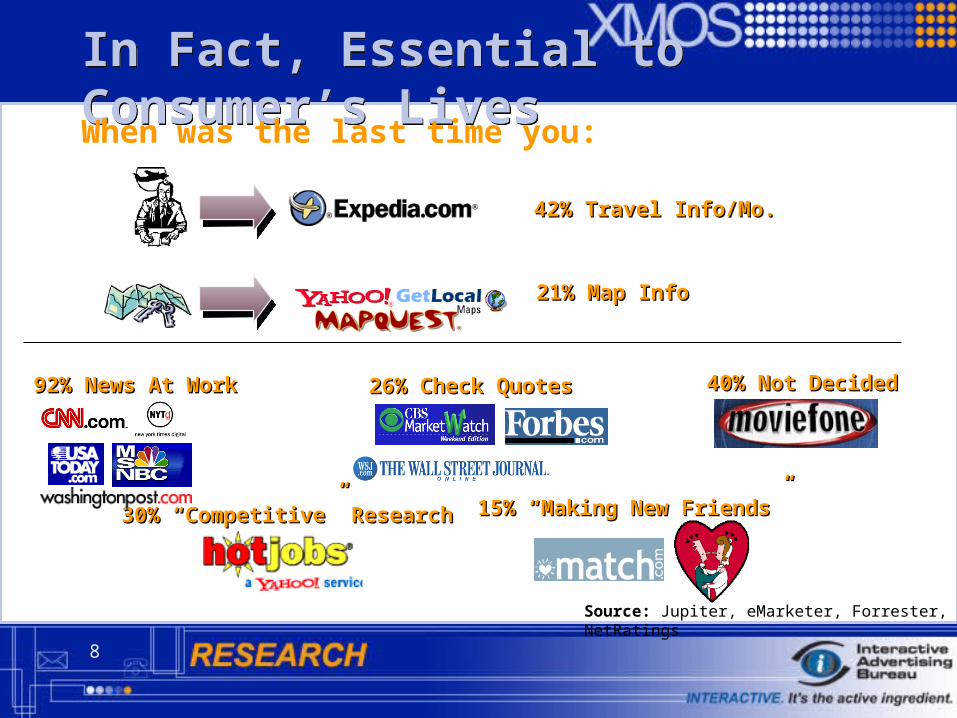
In Fact, Essential to Consumer’s LivesIn Fact, Essential to Consumer’s LivesWhen was the last time you:
Source: Jupiter, eMarketer, Forrester, NetRatings
40% Not Decided40% Not Decided
42% Travel Info/Mo.42% Travel Info/Mo.
21% Map Info21% Map Info
92% News At Work92% News At Work
30% “Competitive” Research30% “Competitive” Research 15% “Making New Friends”15% “Making New Friends”
26% Check Quotes26% Check Quotes

9
The Media Landscape Has ChangedThe Media Landscape Has Changed
34%
24%
13%9%
0%
5%
10%
15%
20%
25%
30%
35%
% D
ay A
fter
TV
Rec
all
1965 1974 1981 2000
Source: NAB (1965-1986); Nielsen (2000)
Percent of adult evening viewers who can name a brand advertised watched
Make bars in same colors

10
Perhaps you have questions about the
Effectiveness of Online advertising…
Perhaps you have questions about the
Effectiveness of Online advertising…

11
1,000+ Ads Tested – Online Advertising Works!1,000+ Ads Tested – Online Advertising Works!
0% 20% 40% 60% 80%
PurchaseIntent
BrandFavorability
MessageAssociation
Aided BrandAwareness
Exposed
Control
Mean Changes for Four Measures of EffectivenessSource: Dynamic Logic MarketNorms – Database of 400 campaigns
*All measures statistically significant at 99%; n=campaigns; between 375 and 416
+3.7+3.7
+5.9+5.9
+2.0+2.0
+2.1+2.1

12
The New Marketing QuestionThe New Marketing Question
No longer talking about WhyWhy Online
HowHow to integrate
Specifically, how to integrate to
maximize:• Brand Awareness• Brand Image • Purchase Intent & Sales

13
Key Findings from XMOSKey Findings from XMOSThe major findings of the Study to date

14
The Key Finding of the StudyThe Key Finding of the Study
Same budget Same budget Better resultsBetter results

15
Why does Increasing Online produce better results within the same budget?Why does Increasing Online produce better results within the same budget?
Online advertising affects branding metrics
Online advertising is typically more cost efficient at producing branding gains
Online reaches those who would otherwise not get the advertising message
CoverageCoverage
EffectivenessEffectiveness
ValueValue
16
CoverageCoverage
Media Media potholespotholesCoverageCoverage
17
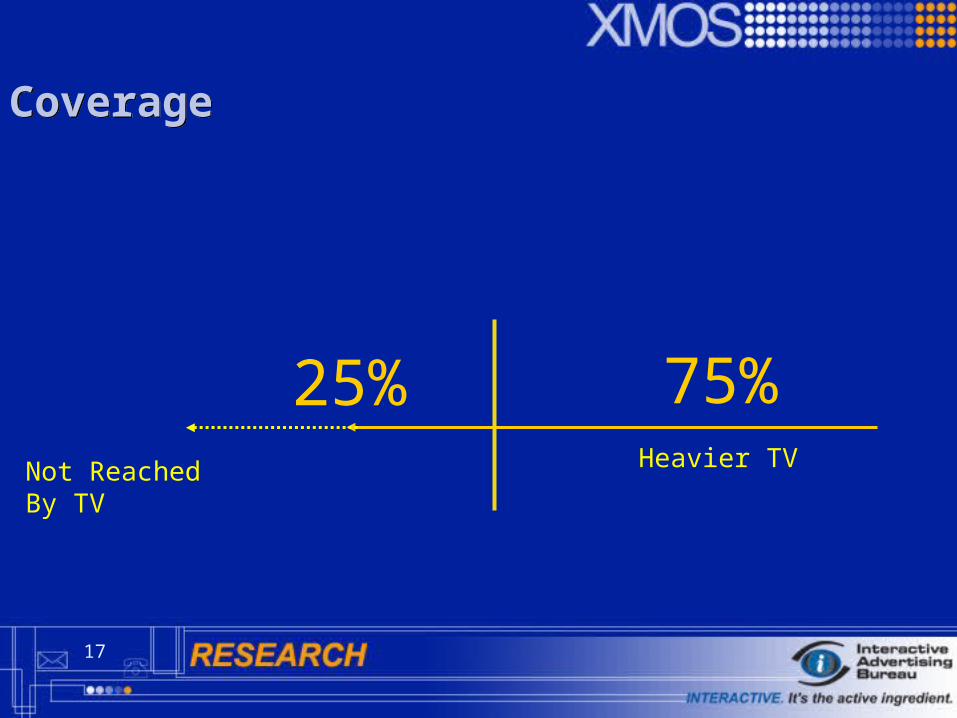
CoverageCoverage
Heavier TV Not Reached
By TV
25% 75%

18
Frequency Does Not Fall EvenlyFrequency Does Not Fall Evenly
2.4
4.3
7.6
16.4
1.0
V IV III II I
HEAVIESTLIGHTEST
Avg
. F
req
by
Qu
inti
le Frequency considered
wasteful
Frequency considered not helpful
15%
19
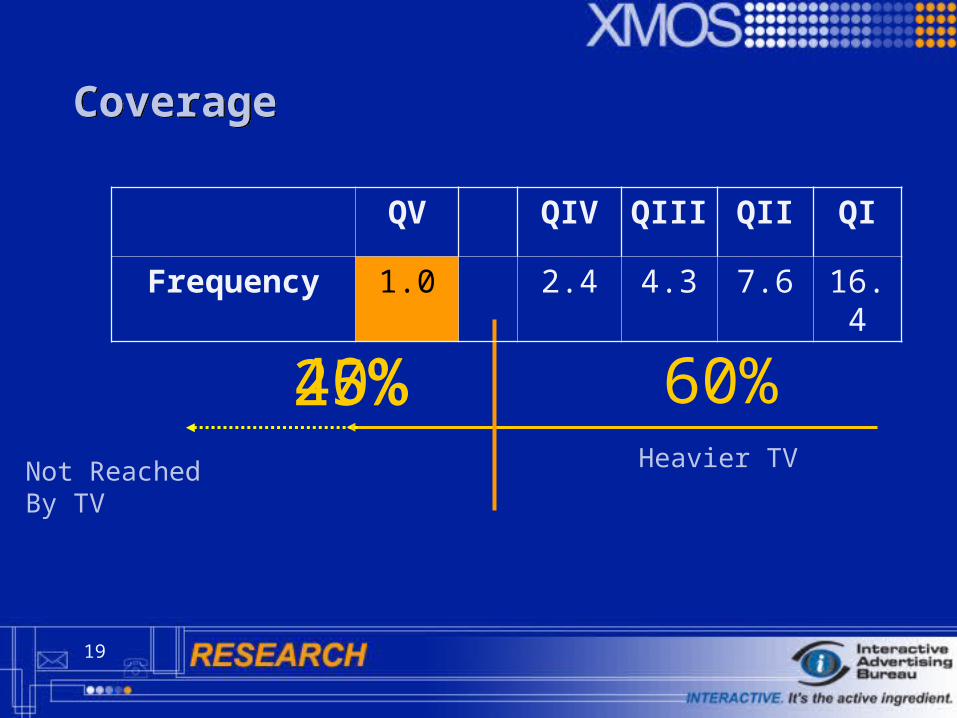
CoverageCoverage
Heavier TV Not Reached
By TV
25%
QV QIV QIII QII QI
Frequency 1.0 2.4 4.3 7.6 16.4
60% 40%

20
CoverageCoverage
Media Media potholes!potholes!
21
Effectiveness
and ValueEffectiveness
and Value

22
Effectiveness and valueEffectiveness and value
*OTS = Opportunity to see advertisement based on GRP levels
% P
urch
ase
inte
nt
0
10
20
30
40
50
60
70
80
90
100
0 1 2 3 4 5 6 7 8 9 10
Frequency: Number of OTS* ad exposures
Diminishing returns

23
Bra
n din
g e f
f ect
Marketing spend
Television
Internet
Effectiveness and valueEffectiveness and value

24
CoverageCoverage
EffectivenessEffectiveness
ValueValue
• Brand Awareness
• Brand Image
• Purchase preference

25
Growing Brand Awareness Growing Brand Awareness The major findings of the Study to date

26
Growing Brand AwarenessGrowing Brand Awareness
Increasing Online is more cost effective way to build brand awareness

27
Product AwarenessProduct AwarenessAided awareness: Grilled chicken flatbread sandwich
*4 day moving average (for greater sample size stability)
0%
5%
10%
15%
20%
25%
30%
35%
40%
45%
50%
6/3 6/5 6/7 6/9 6/11 6/13 6/15 6/17 6/19
Broadcast Only

28
Online builds brand awareness Online builds brand awareness
That’s a 3pt incremental That’s a 3pt incremental branding gain for same branding gain for same budgetbudget
10.0%10.0%
20.0%20.0%
30.0%30.0%
40.0%40.0%
50.0%50.0%
60.0%60.0%
0.0%0.0%
*Online advertising:
• 60% reach/2.0 frequency
• TV TRPs trimmed by approximately 20%13.6%13.6%
Of budgetOf budget
Point of diminishing returns

29
Optimizing for Brand BuildingOptimizing for Brand Building
Recommendation
Intern
etIn
ternet R
eachR
each
60%60%
or66 MillionMillion
More More Consumers Consumers Aware of the Aware of the
Product!Product!The AffectThe Affect
==
Aw
areness
Aw
areness

30
CoverageCoverage
EffectivenessEffectiveness
ValueValue
31
Positioning the Brand Brand ImagePositioning the Brand Brand Image
The major findings of the Study to date
32
Building Brand ImageBuilding Brand Image
For McDonald’s Flatbread Sandwich…For McDonald’s Flatbread Sandwich…• “New”, “Different” and “Combination of great flavors”
For Dove Nutrium Bar…For Dove Nutrium Bar… • “Nourishes your skin” and “is a for people like me”
For ColgateFor Colgate• “Long lasting protection” and “complete protection”
For Kleenex soft packFor Kleenex soft pack• “Convenient” and “innovative design”

33
Cross-media synergy
Creative reinforced the Creative reinforced the core message across mediacore message across media
34
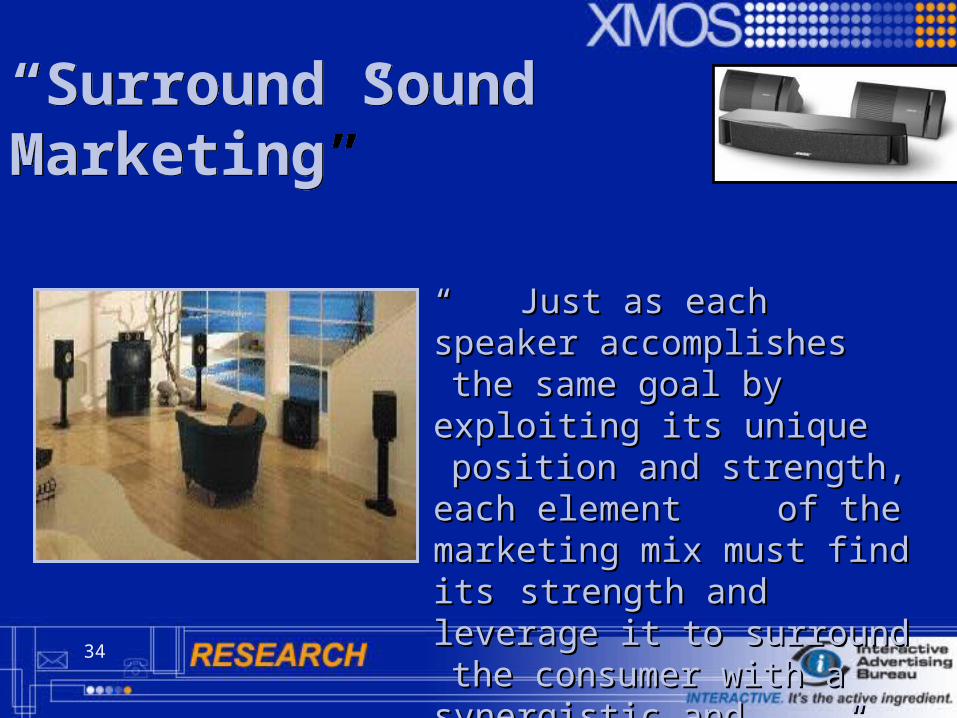
“Surround Sound Marketing”“Surround Sound Marketing”
““ Just as each speaker accomplishes Just as each speaker accomplishes the same goal by exploiting its unique the same goal by exploiting its unique position and strength, each element position and strength, each element of the marketing mix must find its of the marketing mix must find its strength and leverage it to surround strength and leverage it to surround the consumer with a synergistic and the consumer with a synergistic and consistent message.”consistent message.”

35
What about the
40% of your target that are not reached by TV?
What about the
40% of your target that are not reached by TV?

36
The Kleenex® TV campaignThe Kleenex® TV campaign

37
Campaign over 8 weeksCampaign over 8 weeks
Heavier TV Lighter TV Not Reached
By TV
40% 60% 25%
Heavier Online Heavier Online
Lighter Online Lighter Online Not Reached Not Reached By Online By Online
38

39
Summary of branding gains among lightly reached / not reached TV audienceSummary of branding gains among lightly reached / not reached TV audience
Positive Brand association Positive Brand association
(top box average) (top box average)
35%
39%
39%
42%
10% 15% 20% 25% 30% 35% 40% 45%
No Mag or OnlineNo Mag or Online
Online (no mag)Online (no mag)
Magazine (no online)Magazine (no online)
Magazine and OnlineMagazine and Online

40
CoverageCoverage
EffectivenessEffectiveness
ValueValue
41
Purchase Intent & SalesPurchase Intent & Sales
The major findings of the Study to date

42
Results in a 14% increase in purchase intent
Same Budget, Same Budget, Better ResultsBetter Results
Results in a 14% increase in purchase intent
Same Budget, Same Budget, Better ResultsBetter Results
Optimizing OnlineOptimizing Online
43
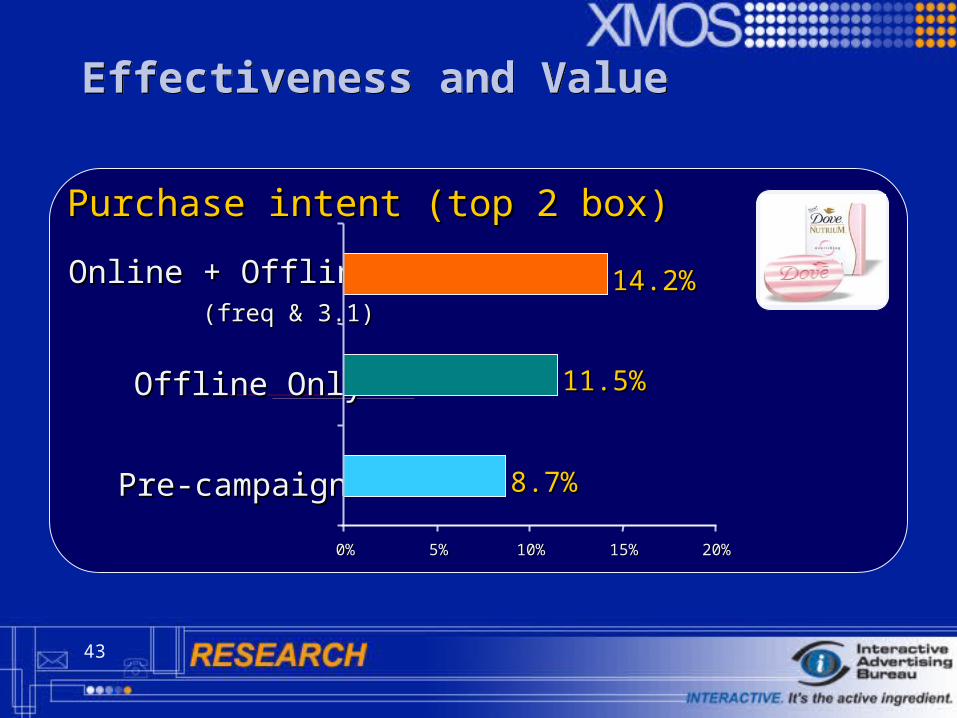
Effectiveness and Value Effectiveness and Value
Purchase intent (top 2 box)Purchase intent (top 2 box)
8.7%8.7%
11.5%11.5%
14.2%14.2%
0%0% 5%5% 10%10% 15%15% 20%20%
Pre-campaignPre-campaign
Offline OnlyOffline Only
Online + OfflineOnline + Offline ((freq & freq & 3.1)3.1)
44
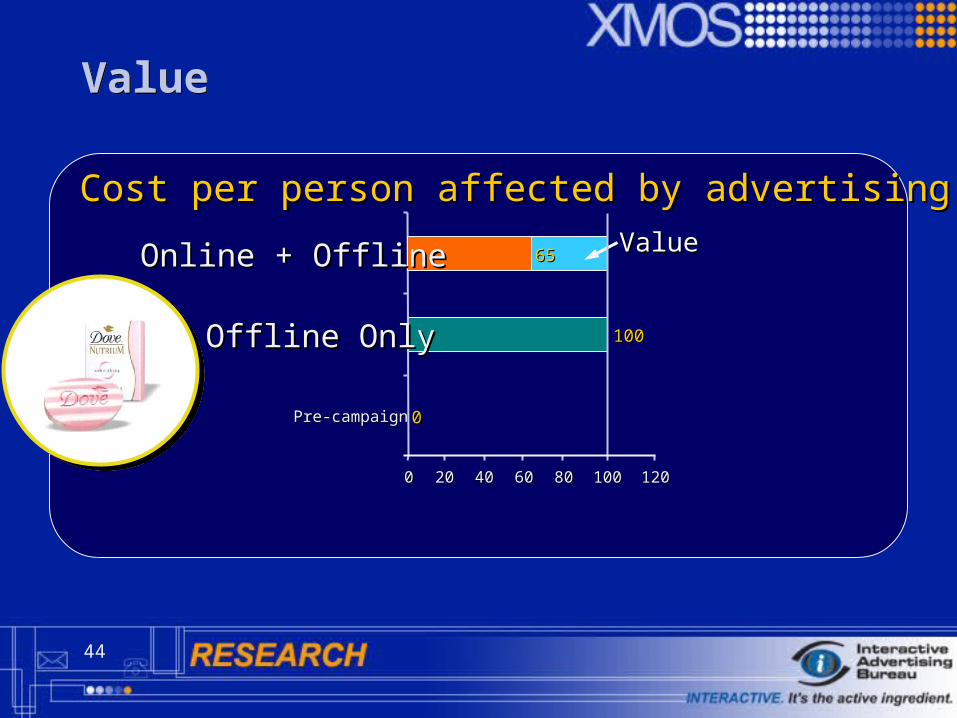
ValueValue
ValueValue
Cost per person affected by advertisingCost per person affected by advertising
00
100100
00 2020 4040 6060 8080
Pre-campaignPre-campaign
100100 120120
6565
Offline OnlyOffline Only
Online + OfflineOnline + Offline

45
All Media Demonstrate Diminishing ReturnsAll Media Demonstrate Diminishing Returns
Number of advertising exposures
Ave
rag
e o
f B
ran
din
g M
etri
cs (
%)
MagazineMagazineOnlineOnline
TelevisionTelevision
20%
25%
30%
35%
40%
45%
0 2 4 6 8 10 12 14 16Frequency

46
Optimizing the Dove Plan for Brand BuildingOptimizing the Dove Plan for Brand Building
2.0 impressions(down from 2.6)
5.5 impressions (down from 6.0)
TV
3.1 Impressions(up from 1.7)
Inte
rnet
TV Print
85%
50%
10%
10% in Original
Plan
Reach Frequency
Inte
rnet
60%

47
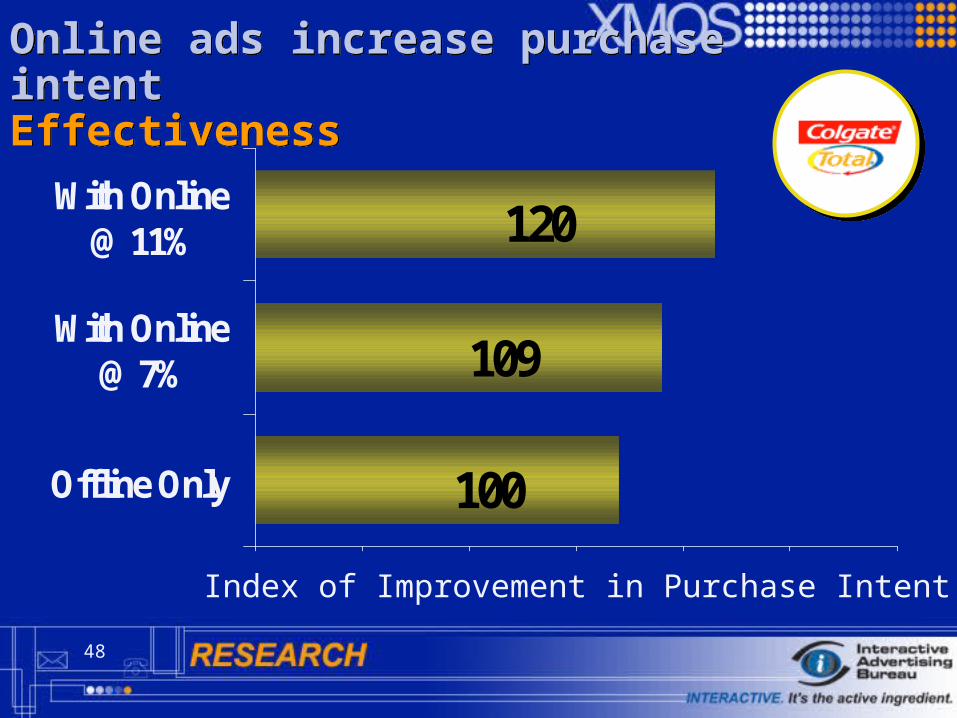
Colgate Total ToothpasteColgate Total Toothpaste
48
Online ads increase purchase intentEffectivenessOnline ads increase purchase intentEffectiveness
120
109
100
0.0% 1.0% 2.0% 3.0% 4.0% 5.0% 6.0%
Offline Only
With Online@ 7%
With Online@ 11%
Index of Improvement in Purchase Intent

49
Online is More Cost Effective than Other MediaOnline is More Cost Effective than Other Media
Effective TV and Print CPMs are compared and indexed to this number.
Online TV Magazine
(100) (123) (184)
Purchase Intent Purchase Intent
Cost of Change by Other Media Indexed to Online

50
Overall, Online is the most cost efficient mediaOverall, Online is the most cost efficient media
Cost per impact
Media CombinationsOnline only Most cost efficient
Magazine & Online
All media combined
Broadcast Only
Magazine Only Least cost efficient
Point gain over baseline is calculated by measuring the post branding level and subtracting the pre-campaign level (linear regression used to measure underlying trend). Costs per person impacted indexed against online advertising only and rank ordered.

51
Recap: Topline Brand ResultsRecap: Topline Brand Results
Base %Base %Online:Online:
Reco %Reco %Online:Online:
Resu
lts
And more to come…And more to come…
2%2%2%2%
15%15%
+14%
1%1%1%1%
13%13%
+8%
7%7%7%7%
11%11%
+20%
+34%
2%2%2%2%
10%10%
+7%
Purchase Intent
Brand Image
Awareness

52
CoverageCoverage
EffectivenessEffectiveness
ValueValue
53
Key TakeawaysKey Takeaways
Same budget Same budget Better resultsBetter results

54
Thank YouThank You