Embed Size (px)
Citation preview

Interference Suppression and Signal Detection for LTE and WLAN Signals in Cognitive
Radio Applications
Johanna Vartiainenand Risto Vuohtoniemi
Centre for WirelessCommunications
University of OuluOulu, Finland
Email: [email protected]: [email protected]
Attaphongse Taparugssanagornand Natthanan Promsuk
School of Engineering and TechnologyICT Department, TelecommunicationsAsian Institute of Technology (AIT)
Pathum Thani, ThailandEmail: [email protected]
Email: [email protected]
Abstract—Cognitive radio spectrum is traditionally divided intotwo spaces. Black space is reserved to primary users trans-missions and secondary users are able to transmit in whitespace. To get more capacity, black space has been divided intoblack and grey spaces. Grey space includes interfering signalscoming from primary and other secondary users, so the needfor interference suppression has grown. Novel applications likeInternet of Things generate narrowband interfering signals. Inthis paper, the performance of the forward consecutive meanexcision algorithm (FCME) method is studied in the presence ofnarrowband interfering signals. In addition, the extension of theFCME method called the localization algorithm based on double-thresholding (LAD) method that uses three thresholds is proposedto be used for both narrowband interference suppression andintended signal detection. Both Long Term Evolution (LTE)signal simulations and real-world LTE and Wireless Local AreaNetwork (WLAN) signal measurements were used to verify theusability of the methods in future cognitive radio applications.
Keywords–interference suppression; signal detection; grey zone;cognitive radio; measurements.
I. INTRODUCTIONHeavily used spectrum calls for new technologies and in-
novations. Novel applications and signals like Long Term Evo-lution (LTE) generate novel interfering environments like dis-cussed in COCORA 2016 [1]. Cognitive radio (CR) [2][3][4][5][6][7] offers possibility to effective spectrum usage allowingsecondary users (SU) to transmit at unreserved frequenciesif they guarantee that primary users (PU) transmissions arenot disturbed. Earlier, spectrum was divided into two zones(spaces): black and white zone. As black zone was fullyreserved to PUs and off limits to secondary users, theirtransmission was allowed in white zones where there wereno PU transmissions. The problem in this classification is thatif the spectrum is not totally unused, secondary users are notable to transmit. Thus, the spectrum usage is not as efficientas it could be. Instead, spectra can be divided into three zones:white, grey (or gray) and black zone [8]. In this model, theSU transmission is allowed in white and grey spaces, as blackspaces are reserved for PUs.
Cognitive radio has several novel applications. Long TermEvolution Advanced (LTE-A) is a 4G mobile communica-
tion technology [9]. LTE for M2M communication (LTE-M)exploits cognitive radio technology and utilizes flexible andintelligent spectrum usage. Its focus is on high capacity. LTE-A enables one of the newest topics called Wide Area Internetof Things (IoT) [10], where sensors, systems and other smartdevices are connected to Internet. Therein, long-range commu-nication, long battery life and minimal amount of data, as wellas narrow bandwidth are key issues. IoT (or, widely thinking,Network of Things, NoT [11]) is already here. However, thereare several problems and challenges. Many IoT devices usealready overcrowded unlicensed bands. Another possibility isto use operated mobile communication networks but it wastesfinancial/frequency resources and technologies like 3G andLTE do not support IoT directly. Secondly, radio networkscome more and more complex. Self-organized networks (SON)[12] form a key to manage complex IoT networks. One of theexisting SON solutions is LTE standard. However, SON has nointelligent learning aka cognitivity. Cognitive IoT (CIoT) termhas been proposed to highlight required intelligence [13][14].CIoT can be considered to be a technological revolution thatbrings a new era of communication, connectivity and comput-ing. It has been predicted that by 2020, there are billions ofconnected devices in the world [15]. Thus, cognitivity is reallyneeded.
As cognitive radio technology offers more efficient spec-trum use, there are many challenges. One of those is thatthe cognitive world is an interference-intensive environment.Especially in-band interfering signals cause problems. Thereare three main types of interference in CR: from SU to PU(SU-PU interference), from PU to SU (PU-SU interference),and interference among SUs (SU-SU interference) [16][17].The basic idea in CR is that SU must not interfere PUs,so there should not be SU-PU interference. Instead, SU maybe interfered by PUs or other SUs. When there are multiplePUs and SUs with different applications and technologies,cumulative interference is a problematic task [18]. In greyspaces, there is interference from PU (and possible other SU)transmissions. It is efficient to mitigate unknown interferencein order to achieve higher capacity. Therefore, interferencesuppression (IS) methods are needed.
1
International Journal on Advances in Telecommunications, vol 10 no 1 & 2, year 2017, http://www.iariajournals.org/telecommunications/
2017, © Copyright by authors, Published under agreement with IARIA - www.iaria.org
It is crystal clear that when operating in real-world withmobile devices and varying environment, computational com-plexity is one of the key issues. Fast and reliable as well ascost-effective, powersave and adaptive methods are needed.Thus, it is beneficial if one method does several operations. Inthis paper, a transform domain IS method called the forwardconsecutive mean excision (FCME) algorithm [19][20] is usedfor interfering signal suppression (IS) in cognitive radio ap-plications [1]. Its extension called the localization algorithmbased on double-thresholding (LAD) method [21][22] can beused for intended signal detection. Both the methods detectall kind of signals regardless of their modulation types. Thedifference is that the LAD method is more accurate and,thus, suitable for detection. Thus, the extended LAD methodthat uses three thresholds is proposed to be used for bothinterference suppression and intended signal detection. TheFCME algorithm and the LAD method are blind constant falsealarm rate (CFAR) -type methods that are able to find allkind of relatively narrowband (RNB) signals in all kind ofenvironments and in all kind of frequency areas. Here, RNBmeans that the suppressed signal is narrowband with respectto the studied bandwidth. The wider the studied band is thewider the suppressed signal can be.
First, future cognitive radio applications and interferenceenvironment in cognitive radios are considered. Focus is on ISin SU receiver interfered by PUs and other SUs. A scenariothat clarifies the interference environment is presented andIS methods are discussed. The FCME algorithm and LADmethods are presented and those feasibilities are considered.Simulations for LTE-signals are used to verify the performanceof the extended LAD method that uses three thresholds. Mea-surement results for LTE and Wireless Local Area Network(WLAN) signals are used to verify the performance of theFCME IS method.
This paper is organized as follows. The state of art isdiscussed in Section II. Section III focuses on interferenceenvironment in cognitive radios as Section IV considers in-terference suppression. The FCME algorithm and the LADmethod are presented and their feasibility is considered inSection V. Simulation and measurement results are presentedin Section VI. Conclusions are drawn in Section VII.
II. STATE OF THE ART
Future applications that use cognitive approach include,for example, LTE-A and cognitive IoT [23][24]. LTE-A isan advanced version of LTE. Therein, orthogonal FrequencyDivision Multiplex (OFDM) signal is used. In OFDM systems,data is divided between several closely spaced carriers. LTEdownlink uses OFDM signal as uplink uses Single CarrierFrequency Division Multiple Access (SC-FDMA). Downlinksignal has more power than uplink signal. Thus, its interferencedistance is larger than uplink signals. OFDM offers high databandwidths and tolerance to interference. As LTE uses 6bandwidths up to 20 MHz, LTE-A may offer even 100 MHzbandwidth. LTE-A offers about three times greater spectrumefficiency when compared to LTE. In addition, some kindof cognitive characteristics are expected [25][26][27]. RNBinterfering signals exist especially at grey zones. This callsfor IS.
In the network ecosystem, it is expected that cognitiveIoT [28][29] will be the next ’big’ thing to focus on. Wide-
area IoT is a network of nodes like sensors and it offersconnections between/to/from systems and smart devices (i.e.,objects) [10][30]. Cognitive IoT enables objects to learn, thinkand understand both the physical and social world. Connectedobjects are intelligent and autonomous and they are able tointeract with environment and networks so that the amount ofhuman intervention is minimized. Basically, a human cognitionprocess is integrated into IoT system design. Technically,CIoT operates as a transparent bridge between the social andphysical world. The radio platform in CIoT devices should beefficient, simple, agile and have low power. CIoT has severaladvantages, including time, money and effort saving whileresource efficiency is increased. It offers adaptable and simpleautomated systems. CIoT will consist of numerous heteroge-neous, interconnected, embedded and intelligent devices thatwill generate a huge amount of data. The long-range (even tensof kilometers) connection of nodes via cellular connections isexpected. Data sent by nodes is minimal and transmissions mayseldom occur. Thus, there is no need to use wide bandwidthsfor a transmission. This saves power consumption but alsospectrum resources.
Proposed technologies include, e.g., LoRa (’long range’)[31], Neul (’cloud’ in English) [32], Global System for Mobile(GSM), SigFox [33], and LTE-M [34]. As Neul is able tooperate in bands below 1 GHz and LoRa as well as SigFoxoperate in ISM band, LTE-M operates in LTE frequencies. InSigFox, messages are 100 Hz wide. In Neul, 180 kHz band isneeded. A common thing is that the ultra-narrowband (UNB)signals are proposed to be used. For example, LTE-M (BW1.4 MHz) and narrowband IoT (NB-IoT) in LTE bands (BW200 kHz) are studied. In LTE-M, maximum transmit power isof the order of 20 dBm. In the Third-Generation PartnershipProject’s (3GPP) Radio Access Network Plenary Meeting 69,it was decided to standardize narrowband IoT [35][36]. Mostof those technologies are on the phase of development. In anycase, it is expected that the amount of narrowband signals isgrowing. Thus, IS is required, especially when it is operatedin mobile bands.
III. INTERFERENCE ENVIRONMENT IN CRThe received discrete-time signal is assumed to be of form
r(n) =m∑i=1
si(n) +
p∑j=1
ij(n) + η, n ∈ Z, (1)
where si(n) is the ith intended (relatively) narrowband signal,ij(n) is the jth unknown (relatively) narrowband interferingsignal, m is the number of intended signals, p is the number ofinterfering signals, and η is a complex additive white Gaussiannoise (AWGN) with variance σ2
η . Here, relatively narrowbandsignal means that the joint bandwidth of the intended andinterfering signal(s) is less than 80% of the total bandwidth,so the FCME method is able to operate [19].
In modern CR, the spectrum is divided into three zones- white, grey and black. In Figure 1, zone classification ispresented. It is assumed that PU-SU distance is >y km in thewhite zone, <x km in the black zone, and in the grey zone itholds that x km <PU-SU-distance <y km [37]. It means that ifSU is more than y km from the PU, SU is allowed to transmit.If SU is closer than y km but further than x km from the PU,SU may be able to transmit with low power. Spectrum sensing
2
International Journal on Advances in Telecommunications, vol 10 no 1 & 2, year 2017, http://www.iariajournals.org/telecommunications/
2017, © Copyright by authors, Published under agreement with IARIA - www.iaria.org

y-z km x-y km 0-x km
y kmz km x km
black
zone
grey
zone
white
zone
0 km
Figure 1: White, grey and black zones.
is required before transmission and there are interfering signalsso IS is needed to ensure SU transmissions. If PU-SU distanceis less than x km, SU transmission is not allowed.
Interference environment differs between the zones. Whitespace contains only noise. Therein, the noise is most com-monly additive white Gaussian (AWGN) noise at the receiver’sfront-end, and man-made noise. This is related to the used fre-quency band. Grey space contains interfering signals within thenoise, which causes challenges. Grey space is occupied by PU(and possible other SU) signals with low to medium power thatmeans interference with low to medium power. IS is requiredespecially is this zone. Black space includes communicationssignals, possible interfering signals, and noise. In black space,there are PU signals with high power and SUs have no access.
There must be some rules that enable SUs to transmit ingrey zone without causing any harm to PUs. According to [38],SU can transmit at the same time as PU if the limit of inter-ference temperature at the desired receiver is not reached. In[3], it is considered the maximum amount of interference thata receiver is able to tolerate, i.e., an interference temperaturemodel. This can be used when studying interference from SUto PU network. In [39], primary radio network (PRN) definessome interference margin. This can be done based on channelconditions and target performance metric. Interference marginis broadcasted to the cognitive radio network. In any case, themaximum transmit power of SUs is limited.
In our scenario presented in Figure 2, it is assumed thatwe have one PU base station (BS), several PU mobile stationsand several SUs. SU terminals form microcells. Part or all ofSUs are mobile and part of SUs may be intelligent devicesor sensors (i.e., IoT). Between SUs, weak signal powers areneeded for a transmission. One microcell can consist of, forexample, devices in an office room. They can use the same ordifferent signal types than PU. For example, in the office roomcase, WLAN can be used. Between the intelligent devices(IoT), UNB signals are used. It is assumed that SUs operateat grey zone, so IS is required to ensure the quality of SUtransmissions.
SUs measure signals transmitted by PU base stations andestimate relative distance to them. Using this information,SUs know whether their short range communication willcause harmful interference to the PU base station. To enablesecondary transmissions under continuous interference causedby the PU base station this interference is attenuated by IS.
The secondary access point knows the locations of PUterminals or SUs measure the power levels of the signals
Figure 2: Scenario with one macrocell and two microcells.
coming from PU mobile terminals in the uplink. If it isassumed that SUs know the locations of PUs, SUs do notinterfere with PUs. If SUs do not know PUs locations, theirtransmission is allowed when received PU signal power isbelow some predetermined threshold. If the level of the powercoming from a certain primary terminal is small, it is assumedthat secondary transmission generates negligible interferencetowards primary terminal. However, it may happen that SUsdon’t sense closely spaced silent PUs.
Let us consider microcell 1 in Figure 2. There are one SUtransmitter SU TX1 and four terminals SU i, i = 1, · · · , 4. Inaddition to the intended signal from SU TX1, SU 1 receivesthe noise η, SU 2 receives PU downlink (PU BS) signal andthe noise η, SU 3 receives PU downlink (PU BS) and PUuplink (PU 1) signals and the noise η, and SU 4 receives PUdownlink (PU BS) signal, signal from other microcell’s SU,and the noise η. That is, we get from (1) that
r1(n) = s(n) + η, (2)
r2(n) = s(n) + i2(n) + η, (3)
r3(n) = s(n) +
2∑j=1
ij(n) + η, (4)
r4(n) = s(n) +
3∑j=2
ij(n) + η, (5)
where i1(n) is PU 1, i2(n) is PU BS and i3(n) is other SU. Forexample, if it is assumed that PUs are in the LTE-A networkand SUs use WLAN signals, receiver SU 2 has to suppressOFDM signal, receiver SU 3 has to suppress OFDM and SC-FDMA signals, and receiver SU 4 has to suppress OFDM andWLAN signals.
In addition, interfering and communication (intended) sig-nals have to be separated from each other. The receiver has to
3
International Journal on Advances in Telecommunications, vol 10 no 1 & 2, year 2017, http://www.iariajournals.org/telecommunications/
2017, © Copyright by authors, Published under agreement with IARIA - www.iaria.org
know what signals are interfering signals to be suppressed andwhat signals are of interest. In an ideal situation, detected andinterfering signals have distinct characteristics. However, this isnot always the situation. An easy way to separate an interferingsignal from the intended signal is to use different bandwidths.For example, in LTE networks, it is known that there are 6different signal bandwidths between 1.4 and 20 MHz that areused [9]. Especially if a different signal type is used, it is easyto separate interfering signals from our information signal. Itcan also be assumed that interfering signal has higher powerthan the desired signal. However, this consideration is out ofthe scope of this paper.
IV. INTERFERENCE SUPPRESSION
Interference suppression exploits the characteristics ofdesired/interfering signal by filtering the received signal[40]. After 1970, IS techniques have been widely studied.IS techniques include, for example, filters, cyclostationar-ity, transform-domain methods like wavelets and short-timeFourier transform (STFT), high order statistics, spatial process-ing like beamforming and joint detection/multiuser detection[41]. Filter-based IS is performed in the time domain. Thosecan be further divided into linear and nonlinear methods. Opti-mal filter (Wiener filter) can be defined only if the interferenceand signal of interest are known by their Power Spectral Den-sities (PSDs), which is only possible when they are stationary.Usually, the signal, the interference or both are nonstationary,so adaptive filtering is the alternative capable of tracking theircharacteristics. Linear predictive filters can be made adaptiveusing, for example, the least mean square (LMS) algorithm. Infilter-based IS, both computational complexity and hardwarecosts are low but co-channel interference cannot be suppressed,and no interference with similar waveforms to signals canbe suppressed. Cyclostationarity based IS has low hardwarecomplexity but medium computational complexity. This maycause challenges in real-time low-power applications.
In transform domain IS [42], signal is suppressed infrequency or in some other transform domain (like fractionalFourier transform). Usually, frequency domain is used, sosignal is transformed using the Fourier transform. Computa-tional complexity is medium, but transform domain IS cannotbe used when interference and signal-of-interest have thesame kind of waveforms and spectral power concentration.However, waveform design may be used. Transform domainIS has low hardware complexity. High-order statistics based ISis computationally complex, and multiple antennas/samplersare needed, so its hardware cost is high and computationalcomplexity too. In beamforming, co-channel interference aswell as interference with similar waveforms to the signal ofinterest can be suppressed, but because of multiple antennas,the hardware cost is high. Its computational complexity ismedium.
The less about the interfering signal characteristics isknown, the more demanding the IS task will be. As most ofthe IS methods need some information about the suppressedsignals and/or noise, there are some methods that are able tooperate blindly [19]. Blind IS methods do not need any a prioriinformation about the interfering signals, their modulations orother characteristics. Also, the noise level can be unknown, soit has to be estimated. Blind IS methods are well suited fordemanding and varying environments.
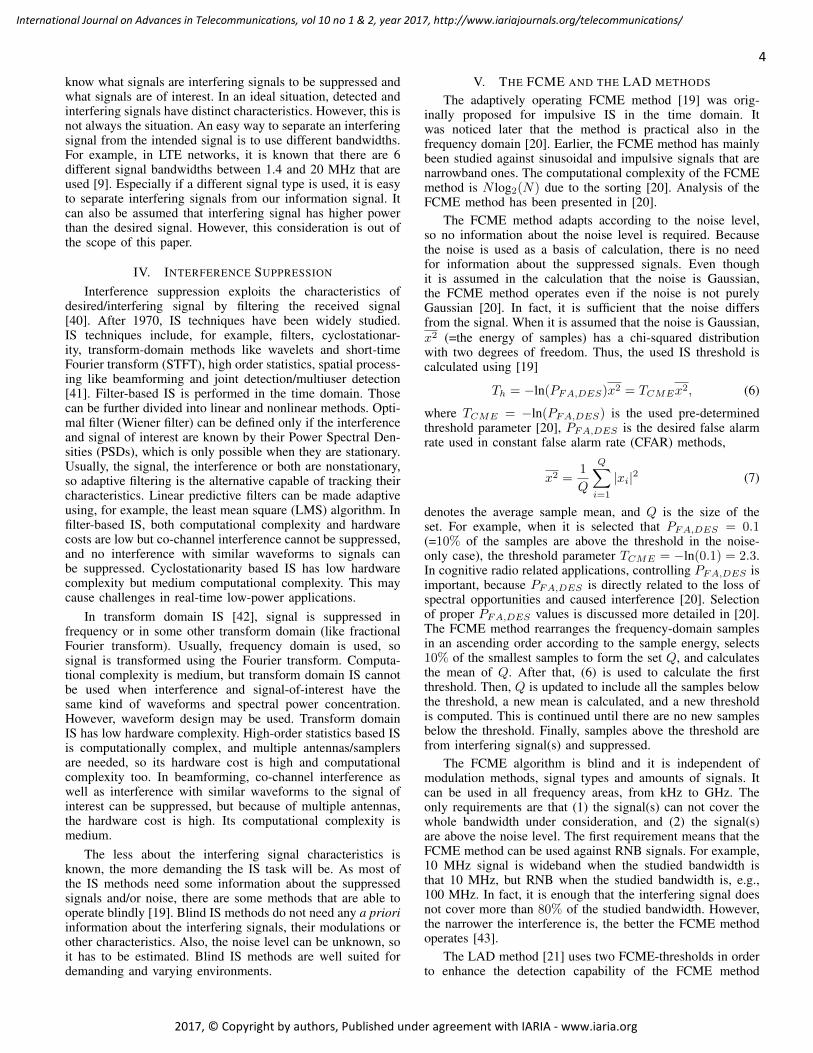
V. THE FCME AND THE LAD METHODS
The adaptively operating FCME method [19] was orig-inally proposed for impulsive IS in the time domain. Itwas noticed later that the method is practical also in thefrequency domain [20]. Earlier, the FCME method has mainlybeen studied against sinusoidal and impulsive signals that arenarrowband ones. The computational complexity of the FCMEmethod is N log2(N) due to the sorting [20]. Analysis of theFCME method has been presented in [20].
The FCME method adapts according to the noise level,so no information about the noise level is required. Becausethe noise is used as a basis of calculation, there is no needfor information about the suppressed signals. Even thoughit is assumed in the calculation that the noise is Gaussian,the FCME method operates even if the noise is not purelyGaussian [20]. In fact, it is sufficient that the noise differsfrom the signal. When it is assumed that the noise is Gaussian,x2 (=the energy of samples) has a chi-squared distributionwith two degrees of freedom. Thus, the used IS threshold iscalculated using [19]
Th = −ln(PFA,DES)x2 = TCMEx2, (6)
where TCME = −ln(PFA,DES) is the used pre-determinedthreshold parameter [20], PFA,DES is the desired false alarmrate used in constant false alarm rate (CFAR) methods,
x2 =1
Q
Q∑i=1
|xi|2 (7)
denotes the average sample mean, and Q is the size of theset. For example, when it is selected that PFA,DES = 0.1(=10% of the samples are above the threshold in the noise-only case), the threshold parameter TCME = −ln(0.1) = 2.3.In cognitive radio related applications, controlling PFA,DES isimportant, because PFA,DES is directly related to the loss ofspectral opportunities and caused interference [20]. Selectionof proper PFA,DES values is discussed more detailed in [20].The FCME method rearranges the frequency-domain samplesin an ascending order according to the sample energy, selects10% of the smallest samples to form the set Q, and calculatesthe mean of Q. After that, (6) is used to calculate the firstthreshold. Then, Q is updated to include all the samples belowthe threshold, a new mean is calculated, and a new thresholdis computed. This is continued until there are no new samplesbelow the threshold. Finally, samples above the threshold arefrom interfering signal(s) and suppressed.
The FCME algorithm is blind and it is independent ofmodulation methods, signal types and amounts of signals. Itcan be used in all frequency areas, from kHz to GHz. Theonly requirements are that (1) the signal(s) can not cover thewhole bandwidth under consideration, and (2) the signal(s)are above the noise level. The first requirement means that theFCME method can be used against RNB signals. For example,10 MHz signal is wideband when the studied bandwidth isthat 10 MHz, but RNB when the studied bandwidth is, e.g.,100 MHz. In fact, it is enough that the interfering signal doesnot cover more than 80% of the studied bandwidth. However,the narrower the interference is, the better the FCME methodoperates [43].
The LAD method [21] uses two FCME-thresholds in orderto enhance the detection capability of the FCME method
4
International Journal on Advances in Telecommunications, vol 10 no 1 & 2, year 2017, http://www.iariajournals.org/telecommunications/
2017, © Copyright by authors, Published under agreement with IARIA - www.iaria.org

Figure 3: Detection difference between the FCME and LADmethods. The LAD method finds one signal, as FCME findsfive.
Figure 4: The LAD and LAD ACC methods.
[20]. One threshold is enough for interference suppressing, butcauses problems in intended signal detection. If the thresholdis too low, too much are detected. Instead, if the threshold istoo high, not all the intended signals are detected. In the LADmethod, the FCME algorithm is run twice with two differentthreshold parameters
TCME1 = −ln(PFA,DES1) (8)
andTCME2 = −ln(PFA,DES2) (9)
in order to get two thresholds,
Tu = TCME1x2j (10)
andTl = TCME2x2l . (11)
Selection of proper values of PFA,DES1 and PFA,DES2 ispresented in [20] and in references therein. Usually, TCME1 =13.81 (PFA,DES1 = 10−4) and TCME2 = 2.66 (PFA,DES2 =0.07) are used [20].
After having two thresholds, a clustering is performed.Therein, adjacent samples above the lower threshold aregrouped to form a cluster. If the largest element of that clusterexceeds the upper threshold, the cluster is accepted and decidedto correspond a signal. Otherwise the cluster is rejected anddecided to contain only noise samples. The detection differencebetween the FCME and LAD methods is illustrated in Figure 3.There is one raised cosine binary phase shift keying (RC-BPSK) signal whose bandwidth is 20% of the total bandwidthand signal-to-noise ratio (SNR) is 10 dB. The LAD method isable to find one signal. Instead, the FCME algorithm finds 5signals if the upper threshold is used. If the FCME algorithmuses some other lower threshold, it still finds at least 5 signalsbecause of the fluctuation of the signal.
The LAD method with adjacent cluster combining (ACC)[44] enhances the performance of the LAD method. Therein,if two or more accepted clusters are separated by at most psamples below the lower threshold, the accepted clusters arecombined together to form one signal. The value of p is, forexample, 1, 2 or 3 [20]. This enhances the correctly detectednumber of signals as well as bandwidth estimation accuracyof the LAD method [22]. In Figure 4, there are two RC-BPSKsignals whose bandwidths are 5 and 8% of the total bandwidth.SNRs are 5 and 4 dB. The LAD method finds four signals, asthe LAD ACC method finds two signals.
When considering IS, the LAD lower threshold may betoo low thus suppressing too much. In addition, the LADupper threshold may be too high thus suppressing too less.This problem can be solved when extending the LAD methodinclude three thresholds instead of two. Then, the FCMEalgorithm is run three times with three values of PFA,DES toget three thresholds: the lowest one is the LAD lower thresholdTl, the highest one is the LAD upper threshold Tu, and thethreshold in the middle Tm is the threshold used in the IS.Note, that the LAD method corresponds the FCME algorithmwhen PFA,DES1 = PFA,DES2(= PFA,DES3).
When both IS and detection are performed, it is possibleto perform(a) both IS and detection at the same time,(b) first IS and then detection, or(c) use IS only for detecting interfering signal(s).Case (a) saves some time because the algorithm is run onlyonce. IS part can be done using only one (Tu, Tm or Tl) orboth the thresholds (Tu and Tl). In case (b), IS uses only onethreshold (Tu, Tm or Tl) as detection uses both the thresholds(Tu and Tl). Case (c) can be used when the interferencesituation is mapped, so only one (Tu, Tm or Tl) or both thethresholds (Tu or Tl) can be used. In the latter case, interferingsignal characteristics can also be estimated.
VI. SIMULATIONS AND MEASUREMENTS
In this paper, both simulations and real-life measurementsare considered.
A. SimulationsThe IS and signal detection ability of the extended LAD
method that uses three thresholds was studied using MATLAB
5
International Journal on Advances in Telecommunications, vol 10 no 1 & 2, year 2017, http://www.iariajournals.org/telecommunications/
2017, © Copyright by authors, Published under agreement with IARIA - www.iaria.org
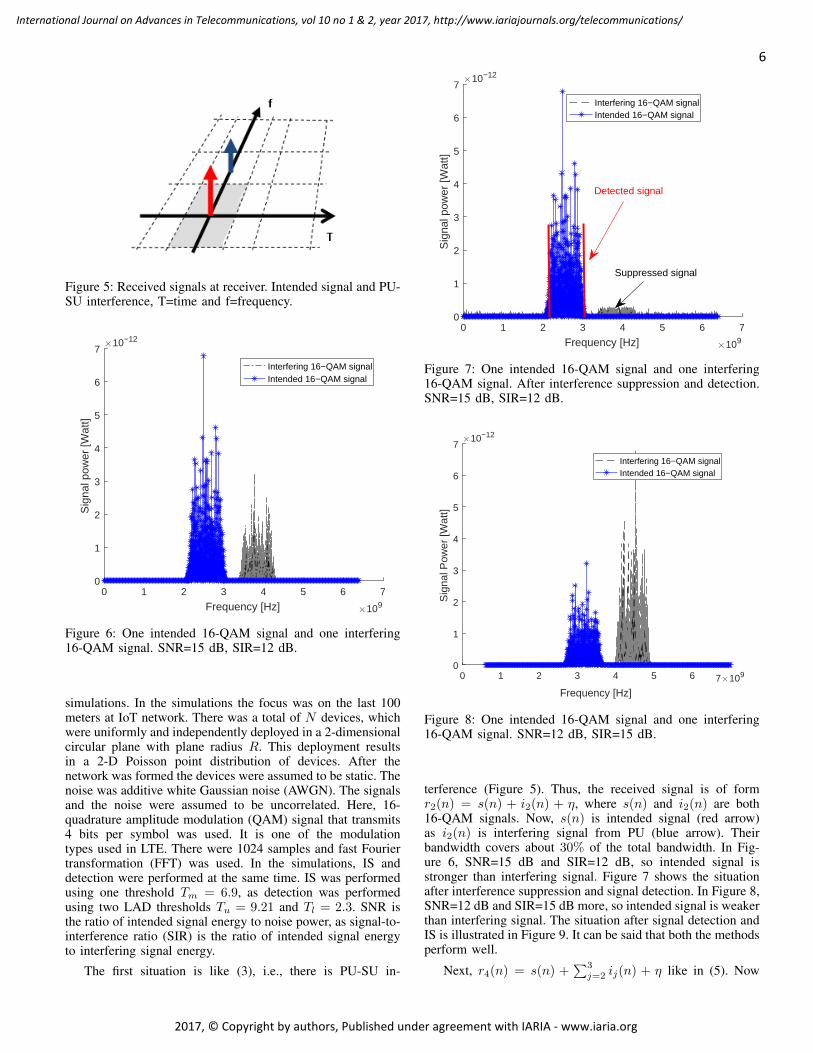
Figure 5: Received signals at receiver. Intended signal and PU-SU interference, T=time and f=frequency.
0 1 2 3 4 5 6 7
Frequency [Hz] 109
0
1
2
3
4
5
6
7
Sig
nal p
ower
[Wat
t]
10−12
Interfering 16−QAM signalIntended 16−QAM signal
Figure 6: One intended 16-QAM signal and one interfering16-QAM signal. SNR=15 dB, SIR=12 dB.
simulations. In the simulations the focus was on the last 100meters at IoT network. There was a total of N devices, whichwere uniformly and independently deployed in a 2-dimensionalcircular plane with plane radius R. This deployment resultsin a 2-D Poisson point distribution of devices. After thenetwork was formed the devices were assumed to be static. Thenoise was additive white Gaussian noise (AWGN). The signalsand the noise were assumed to be uncorrelated. Here, 16-quadrature amplitude modulation (QAM) signal that transmits4 bits per symbol was used. It is one of the modulationtypes used in LTE. There were 1024 samples and fast Fouriertransformation (FFT) was used. In the simulations, IS anddetection were performed at the same time. IS was performedusing one threshold Tm = 6.9, as detection was performedusing two LAD thresholds Tu = 9.21 and Tl = 2.3. SNR isthe ratio of intended signal energy to noise power, as signal-to-interference ratio (SIR) is the ratio of intended signal energyto interfering signal energy.
The first situation is like (3), i.e., there is PU-SU in-
0 1 2 3 4 5 6 7
Frequency [Hz] 109
0
1
2
3
4
5
6
7
Sig
nal p
ower
[Wat
t]
10−12
Detected signal
Suppressed signal
Interfering 16−QAM signalIntended 16−QAM signal
Figure 7: One intended 16-QAM signal and one interfering16-QAM signal. After interference suppression and detection.SNR=15 dB, SIR=12 dB.
0 1 2 3 4 5 6 7 109
Frequency [Hz]
0
1
2
3
4
5
6
7S
igna
l Pow
er [W
att]
10−12
Interfering 16−QAM signalIntended 16−QAM signal
Figure 8: One intended 16-QAM signal and one interfering16-QAM signal. SNR=12 dB, SIR=15 dB.
terference (Figure 5). Thus, the received signal is of formr2(n) = s(n) + i2(n) + η, where s(n) and i2(n) are both16-QAM signals. Now, s(n) is intended signal (red arrow)as i2(n) is interfering signal from PU (blue arrow). Theirbandwidth covers about 30% of the total bandwidth. In Fig-ure 6, SNR=15 dB and SIR=12 dB, so intended signal isstronger than interfering signal. Figure 7 shows the situationafter interference suppression and signal detection. In Figure 8,SNR=12 dB and SIR=15 dB more, so intended signal is weakerthan interfering signal. The situation after signal detection andIS is illustrated in Figure 9. It can be said that both the methodsperform well.
Next, r4(n) = s(n) +∑3j=2 ij(n) + η like in (5). Now
6
International Journal on Advances in Telecommunications, vol 10 no 1 & 2, year 2017, http://www.iariajournals.org/telecommunications/
2017, © Copyright by authors, Published under agreement with IARIA - www.iaria.org

0 1 2 3 4 5 6 7 109
Frequency [Hz]
0
1
2
3
4
5
6
7S
igna
l Pow
er [W
att]
10−12
Suppressed signal
Detected signal
Interfering 16−QAM signalIntended 16−QAM signal
Figure 9: One intended 16-QAM signal and one interfering16-QAM signal. After interference suppression and detection.SNR=12 dB, SIR=15 dB.
Figure 10: Received signals at receiver. Intended signal, PU-SU and SU-SU interference, T=time and f=frequency.
there are two suppressed signals: one is from PU and one isfrom other SU so there is both PU-SU and SU-SU interference(Figure 10). Now, s(n) is intended signal (red arrow), i2(n)is interfering signal from PU (blue arrow), and i3(n) is inter-fering signal from other SU (green arrow). Their bandwidthcovers about 45% of the total bandwidth. In Figure 11, all thethresholds Tu, Tl and Tm are presented. As the intended signalis detected using theresholds Tu and Tl, the IS is performedusing threshold Tm. As can be seen, all the signals are foundand both the interfering signals are suppressed.
B. MeasurementsThe IS performance of the FCME method against RNB
signals was studied using real-world wireless data. The re-sults are based on real-life measurements. Measurements wereperformed using spectrum analyzer Agilent E4446 [45] (Fig-ure 12). Three types of signals were studied, namely theLTE uplink, LTE downlink, and WLAN signals. All thosesignals are commonly used wireless signals. Both LTE1800
0 1 2 3 4 5 6
Frequency [Hz] 109
0
0.5
1
1.5
2
2.5
3
3.5
4
Sig
nal p
ower
[Wat
t]
10−12
Upper threshold Tu
Lower threshold Tl
Middle threshold Tm
Detected signalSuppressed signals
Interfering 16−QAM signalIntended 16−QAM signal
Figure 11: One intended 16-QAM signal and two interfering16-QAM signals. Interference suppression (Tm) and detection(Tu and Tl) thresholds. SNR=15 dB, SIR=12 dB.
Figure 12: Agilent E4446. LTE1800 network downlink signals.
network frequencies and WLAN signals were measured atthe University of Oulu, Finland. IS was performed using theFCME method with threshold parameter 4.6, i.e., desired falsealarm rate PFA,DES = 1% = 0.01 [20].
LTE1800 network operates at 2 × 75 MHz band so thatuplink is on 1.710− 1.785 GHz and downlink is on 1.805−1.880 GHz [46]. LTE downlink uses OFDM signal as uplinkuses SC-FDMA. LTE assumes a small nominal guard band(10% of the band, excluding 1.4 MHz case).
One measurement at 1.7− 1.9 GHz containing 1000 timedomain sweeps and 1601 frequency domain points is seen inFigure 13. Therein, yellow means strong signal power (=signal)as green means weaker signal power (=noise). Therein, onlydownlink signaling is present. Downlink signals have largerinterference distance than uplink signals. Interfering signalscover about 30% of the studied bandwidth. In Figure 14,situation after the FCME IS is presented. Therein, yellowmeans strong signal power as white means no signal power.It can be seen that the signals (white) have been suppressedand the noise is now dominant (yellow). On uplink signalfrequencies where no signals are present (600 first frequency
7
International Journal on Advances in Telecommunications, vol 10 no 1 & 2, year 2017, http://www.iariajournals.org/telecommunications/
2017, © Copyright by authors, Published under agreement with IARIA - www.iaria.org
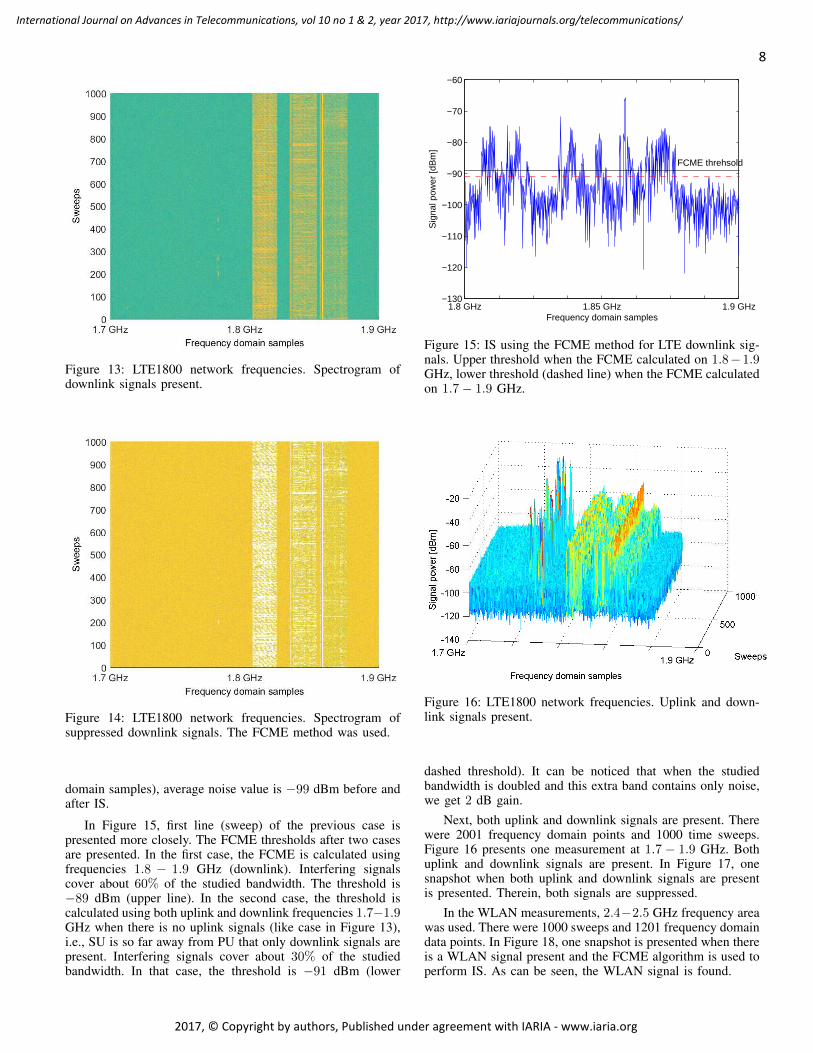
Figure 13: LTE1800 network frequencies. Spectrogram ofdownlink signals present.
Figure 14: LTE1800 network frequencies. Spectrogram ofsuppressed downlink signals. The FCME method was used.
domain samples), average noise value is −99 dBm before andafter IS.
In Figure 15, first line (sweep) of the previous case ispresented more closely. The FCME thresholds after two casesare presented. In the first case, the FCME is calculated usingfrequencies 1.8 − 1.9 GHz (downlink). Interfering signalscover about 60% of the studied bandwidth. The threshold is−89 dBm (upper line). In the second case, the threshold iscalculated using both uplink and downlink frequencies 1.7−1.9GHz when there is no uplink signals (like case in Figure 13),i.e., SU is so far away from PU that only downlink signals arepresent. Interfering signals cover about 30% of the studiedbandwidth. In that case, the threshold is −91 dBm (lower
1.8 GHz 1.85 GHz 1.9 GHz−130
−120
−110
−100
−90
−80
−70
−60
Frequency domain samples
Sig
nal p
ower
[dB
m]
FCME threhsold
Figure 15: IS using the FCME method for LTE downlink sig-nals. Upper threshold when the FCME calculated on 1.8−1.9GHz, lower threshold (dashed line) when the FCME calculatedon 1.7− 1.9 GHz.
Figure 16: LTE1800 network frequencies. Uplink and down-link signals present.
dashed threshold). It can be noticed that when the studiedbandwidth is doubled and this extra band contains only noise,we get 2 dB gain.
Next, both uplink and downlink signals are present. Therewere 2001 frequency domain points and 1000 time sweeps.Figure 16 presents one measurement at 1.7 − 1.9 GHz. Bothuplink and downlink signals are present. In Figure 17, onesnapshot when both uplink and downlink signals are presentis presented. Therein, both signals are suppressed.
In the WLAN measurements, 2.4−2.5 GHz frequency areawas used. There were 1000 sweeps and 1201 frequency domaindata points. In Figure 18, one snapshot is presented when thereis a WLAN signal present and the FCME algorithm is used toperform IS. As can be seen, the WLAN signal is found.
8
International Journal on Advances in Telecommunications, vol 10 no 1 & 2, year 2017, http://www.iariajournals.org/telecommunications/
2017, © Copyright by authors, Published under agreement with IARIA - www.iaria.org

1.7 GHzFrequency domain samples
−130
−120
−110
−100
−90
−80
−70
−60
−50
−40
−30S
igna
l pow
er [d
Bm
]
FCME threshold
LTE uplink LTE downlink
Figure 17: LTE1800 network frequencies. Uplink and down-link signals present. IS using the FCME method.
2.4 GHz 2.45 GHz 2.5 GHz−125
−120
−115
−110
−105
−100
−95
−90
−85
−80
−75
Frequency domain samples
Sig
nal p
ower
[dB
m]
FCME threshold
Figure 18: IS using the FCME method at frequencies 2.4−2.5GHz where WLAN signals exist. Threshold is −90 dBm.
Next, the desired false alarm rate (PFA,DES) values arecompared to the achieved false alarm rate (PFA) values inthe noise-only case. Figure 19 presents one situation whenthere is only noise present. According to the definition ofthe FCME method, threshold parameter 4.6 means that 1%of the samples is above the threshold when there is only noisepresent. Here, there are 1201 samples so PFA,DES = 1% = 12samples. In Figure 19, 12 samples are over the threshold, soPFA,DES = PFA. We had 896 measurement sweeps in thenoise-only case at WLAN frequencies. Therein, minimum 1sample and maximum 19 samples were over the threshold asthe mean was 10 samples and median value was 9 samples.Those were close of required 12 samples. Note that thedefinition has been made for pure AWGN noise.
2.4 GHz 2.45 GHz 2.5 GHz−125
−120
−115
−110
−105
−100
−95
−90
−85
−80
−75
Frequency domain samples
Sig
nal p
ower
[dB
m]
FCME threshold
Figure 19: IS using the FCME method at frequencies 2.4−2.5GHz where are no signals present. Threshold is −91 dBm.1% = 12 samples are above the threshold, as expected.
VII. CONCLUSION
In this paper, the performance of the forward consecutivemean excision (FCME) interference suppression method wasstudied against relatively narrowband interfering signals exist-ing in the novel cognitive radio networks. The focus was oninterference suppression in secondary user receiver sufferinginterfering signals caused by primary and other secondaryusers. In addition, the extension of the FCME method calledthe localization algorithm based on double-thresholding (LAD)method that uses three thresholds was proposed to be used forboth interference suppression and intended signal detection.LTE simulations confirmed the performance of the extendedLAD method that uses three thresholds. Real-world LTE andWLAN measurements were performed in order to verify theperformance of the FCME method. It was noted that theextended LAD method that uses three thresholds can be usedfor detecting and suppressing LTE signals, and the FCMEmethod is able to suppress LTE OFDM and SC-FDMA signalsas well as WLAN signals. Our future work includes statisticalanalysis, more detected and suppressed signals, as well ascomparisons to other methods.
ACKNOWLEDGMENTThe research of Johanna Vartiainen was funded by the
Academy of Finland.
REFERENCES
[1] J. Vartiainen and R. Vuohtoniemi, “LTE and WLAN interferencesuppression in CR applications,” in Proc. The Sixth International Con-ference on Advances in Cognitive Radio (COCORA), Lisbon, Portugal,Feb. 2016, pp. 33–38.
[2] J. Mitola III and G. Q. M. Jr., “Cognitive radio: making software radiosmore personal,” IEEE Pers. Commun., vol. 6, no. 4, 1999, pp. 13–18.
[3] S. Haykin, “Cognitive radio: Brain-empowered wireless communica-tions,” IEEE J. Select. Areas Commun., vol. 23, no. 2, Feb. 2005, pp.201–220.
[4] V. Chakravarthy, A. Shaw, M. Temple, and J. Stephens, “Cognitiveradio - an adaptive waveform with spectral sharing capability,” in IEEEWireless Commun. and Networking Conf., New Orleans, LA, USA,Mar.13–17 2005, pp. 724–729.
9
International Journal on Advances in Telecommunications, vol 10 no 1 & 2, year 2017, http://www.iariajournals.org/telecommunications/
2017, © Copyright by authors, Published under agreement with IARIA - www.iaria.org
[5] S. N. Shankar, C. Cordeiro, and K. Challapali, “Spectrum agile radios:Utilization and sensing architectures,” in IEEE Int. Symposium on Dy-namic Spectrum Access Networks (DySpAN) 2005, vol. 1, Baltimore,USA, Nov. 2005, pp. 160–169.
[6] T. Yucek and H. Arslan, “A survey of spectrum sensing algorithms forcognitive radio applications,” IEEE Commun. Surveys and Tutorials,vol. 11, no. 1, 2009, pp. 116–130.
[7] J. Mitola III, “Cognitive radio architecture evolution,” IEEE Proceed-ings, vol. 97, no. 4, 2009, pp. 626–641.
[8] S. Haykin, D. J. Thomson, and J. H. Reed, “Spectrum sensing for cog-nitive radio - the utility of the multitaper method and cyclostationarityfor sensing the radio spectrum, including the digital tv spectrum, isstudied theoretically and experimentally,” Proc. of the IEEE, vol. 97,no. 5, May 2009, pp. 849–877.
[9] 3GPP, “The mobile broadband standard,” (2013), http://www.3gpp.org[retrieved: May, 2017].
[10] K. Ashton, “That ’internet of things’ thing,” RFID Journal, June 2009,http://www.rfidjournal.com/articles/view?4986 [retrieved: May, 2017].
[11] J. Voas, “Networks of ’things’,” NIST Special Publication 800-183,July 2016. http://dx.doi.org/10.6028/NIST. SP.800-183 [retrieved: May,2017].
[12] O.-C. Iacoboaiea, B. Sayrac, S. B. Jemaa, and P. Bianchi, “SON coordi-nation in heterogenous networks: A reinforcement learning framework,”IEEE Trans. Wirel. Commun., vol. 15, no. 9, 2016, pp. 5835–5847.
[13] R. F. Shigueta, M. Fonseca, A. C. Viana, A. Ziviani, and A. Munaretto,“A strategy for opportunistic cognitive channel allocation in wirelessinternet of things,” in IFIP Wireless Days, Rio de Janeiro, Brazil, Nov2014.
[14] A. Alja and A. H. Aghvami, “Cognitive machine-to-machine communi-cations for internet-of-things: A protocol stack perspective,” IEEE IoTJournal, vol. 2, no. 2, 2016, pp. 103–112.
[15] A. Nordrum, “Popular internet of things forecast of 50 billiondevices by 2020 is outdated,” in IEEE Spectrum, Aug. 2016,http://spectrum.ieee.org/tech-talk/telecom/internet/popular-internet-of-things-forecast-of-50-billion-devices-by-2020-is-outdated [retrieved:May, 2017].
[16] Z. Chen, “Interference modelling and management for cogni-tive radio networks,” Ph.D. dissertation, Doctoral Thesis (sub-mitted), Apr. 2011, http://www.ros.hw.ac.uk/bitstream/10399/2421/1/ChenZ 0511 eps.pdf [retrieved: May, 2017].
[17] K. Nishimori, H. Yomo, and P. Popovski, “Distributed interferencecancellation for cognitive radios using periodic signals of the primarysystem,” IEEE Trans. Wirel. Commun., vol. 10, no. 9, 2011, pp. 2971– 2981.
[18] J. Peha, “Spectrum sharing in the gray space,” TelecommunicationsPolicy Journal, vol. 37, no. 2-3, 2013, pp. 167–177.
[19] H. Saarnisaari, P. Henttu, and M. Juntti, “Iterative multidimensionalimpulse detectors for communications based on the classical diagnosticmethods,” IEEE Trans. Commun., vol. 53, no. 3, Mar. 2005, pp. 395–398.
[20] J. Vartiainen, “Concentrated signal extraction using consecutive meanexcision algorithms,” Ph.D. dissertation, Acta Univ Oul Technica C 368.Faculty of Technology, University of Oulu, Finland, Nov. 2010, http://jultika.oulu.fi/Record/isbn978-951-42-6349-1 [retrieved: May, 2017].
[21] J. Vartiainen, J. J. Lehtomaki, and H. Saarnisaari, “Double-thresholdbased narrowband signal extraction,” in Proc. IEEE Veh. Technol. Conf.(VTC) 2005, Stockholm, Sweden, May/June 2005, pp. 1288–1292.
[22] J. Vartiainen, J. J. Lehtomaki, H. Saarnisaari, and M. Juntti, “Two-dimensional signal localization algorithm for spectrum sensing,” IEICETrans. Commun., vol. E93-B, no. 11, Nov. 2010, pp. 3129–3136.
[23] J. A. Stankovic, “Research directions for the internet of things,” IEEEInt. of Things Journal, vol. 1, no. 1, Feb. 2014, pp. 3–9.
[24] A. H. Ngu, M. Gutierrez, V. Metsis, S. Nepal, and Q. Z. Sheng, “IoTmiddleware: A survey on issues and enabling technologies,” IEEE Int.of Things Journal, vol. 4, no. 1, Feb. 2017, pp. 1–20.
[25] P. Karunakaran, T. Wagner, A. Scherb, and W. Gerstacker, “Sensing forspectrum sharing in cognitive LTE-A cellular networks,” cornell Uni-versity Library. http://arxiv.org/abs/1401.8226 [retrieved: May, 2017].
[26] L. Zhang, L. Yang, and T. Yang, “Cognitive interference managementfor LTE-A femtocells with distributed carrier selection,” in Proc. IEEEVeh. Technol. Conf. (VTC) Fall, 2010, pp. 1–5.
[27] V. Osa, C. Hearranz, J. F. Monserrat, and X. Gelabert, “Implementingopportunistic spectrum access in LTE-advanced,” EURASIP Journal onWireless Communications and Networking, vol. 99, 2012, pp. 1–17.
[28] Q. Wu et al., “Cognitive internet of things: A new paradigm beyondconnection,” IEEE Journal of Internet of Things, vol. 1, no. 2, 2014,pp. 1–15, [retrieved: May, 2017].
[29] J. Tervonen, K.Mikhaylov, S. Pieska, J. Jamsa, and M.Heikkila, “Cogni-tive internet-of-things solutions enabled by wireless sensor and actuatornetworks,” in IEEE Conf. on Cognitive Infocommun. (CogInfoCom),2014, pp. 97–102.
[30] F. Xia, L. T. Yang, L. Wang, and A. Vine, “Internet of things,” Int.Journal of Commun. Systems, vol. 25, 2012, pp. 1101–1102.
[31] LoRa, http://lora-alliance.org/ [retrieved: May, 2017].[32] Neul, www.neul.com [retrieved: May, 2017].[33] SigFox, www.sigfox.com [retrieved: May, 2017].[34] Nokia, “LTE M2M - optimizing LTE for the internet of things,” in White
paper, 2014, http://networks.nokia.com/file/34496/lte-m-optimizing-lte-for-the-internet-of-things [retrieved: May, 2017].
[35] J. Gozalvez, “New 3GPP standarf for IoT,” IEEE Vehicular TechnologyMagazine, vol. 11, no. 1, Mar. 2016, pp. 14–20.
[36] 3GPP16, “Standardization of NB-IOT completed,” (2016),http://www.3gpp.org/news-events/3gpp-news [retrieved: May, 2017].
[37] Z. Feng and Y. Xu, “Cognitive TD-LTE system operatingin TV white space in china,” ITU-R WP 5A, Geneva,Switzerland, (2013), http://studylib.net/doc/13258156/cognitive-td-lte-system-operating-in-tv-white-space-in-china[retrieved: May, 2017].
[38] J. Mitra and L. Lampe, “Sensing and suppression of impulsive interfer-ence,” in Canadian Conference on Electrical and Computer Engineering(CCECE), Canada, May 2009, pp. 219–224.
[39] Y. Ma, D. I. Kim, and Z. Wu, “Optimization of OFDMA-based cellularcognitive radio networks,” IEEE Trans. on Commun., vol. 58, no. 8,2010, pp. 2265–2276.
[40] J. Andrews, “Interference cancelation for cellular systems: a contempo-rary overview,” IEEE Wireless Comm., vol. 12, no. 2, Apr. 2005, pp.19–29.
[41] X. Hong, Z. Chen, C.-X. Wang, S. A. Vorobyov, and J. S. Thompson,“Cognitive radio networks - interference cancelation and managementtechniques,” IEEE Veh. Technol. Magazine, Dec. 2009, pp. 76–84.
[42] L. B. Milstein and P. K. Das, “An analysis of a real-time transformdomain filtering digital communication system - part I: Narrowbandinterference rejection using eral-time Fourier transforms,” IEEE Trans.Commun., vol. 28, 1980, pp. 816–824.
[43] J. Vartiainen, J. J. Lehtomaki, H. Saarnisaari, and M. Juntti, “Analysisof the consecutive mean excision algorithms,” J. Elect. Comp. Eng.,2011, pp. 1–13.
[44] J. Vartiainen, H. Sarvanko, J. Lehtomaki, M. Juntti, and M. Latva-aho,“Spectrum sensing with LAD based methods,” in Proc. IEEE Int. Symp.Pers., Indoor, Mobile Radio Commun. (PIMRC), Athens, Greece, Aug.2007, pp. 1–5.
[45] Agilent, http://www.agilent.com [retrieved: May, 2017].[46] Nokia Siemens Networks, “Introducing LTE with max-
imum reuse of GSM assets,” in White paper, 2011,http://www.gsma.com/spectrum/introducing-lte-with-maximum-reuse-of-gsm-asset/ [retrieved: May, 2017].
10
International Journal on Advances in Telecommunications, vol 10 no 1 & 2, year 2017, http://www.iariajournals.org/telecommunications/
2017, © Copyright by authors, Published under agreement with IARIA - www.iaria.org