Embed Size (px)
Citation preview
1
Hydroinformatics Support to Flood Forecasting and Flood Management
ADRI VERWEY
WL | Delft Hydraulics, Delft, The Netherlands [email protected]
Abstract This keynote lecture describes state-of-the-art hydroinformatics support to the water sector. A few examples are worked out in some detail, whereas for other examples the reader is guided to recent literature. The focus is on flood forecasting and flood management, with a brief description of the potential of changing technologies to support studies and facilities in this area. Examples are: new data collection methods; data mining from these extensive new sources of information, e.g. the use of genetic programming; data driven modelling techniques, e.g. artificial neural networks; decision support systems; and the provision of a hydroinformatics platform for flood forecasting. Particular attention is given to advances in numerical flood modelling. Over the past years the robustness of numerical models has increased substantially, solving for example, the flooding and drying problem of flood plains and the computation of supercritical flows. In addition, the emergence of hybrid 1D2D models is discussed with their different options of linking model components of flood prone areas. Key words Hydroinformatics; flood management, flood forecasting, unsteady flow modelling; flood simulation modelling; flow resistance; data mining; Open MI; open source; proprietary software. INTRODUCTION
Hydroinformatics covers the application of information technology applied to the water sector
in the widest sense. The continuously increasing speed of computers and increased density of
information storage, the increased communication potential through internet and the creative
power of scientists have brought us rapidly forward in the way in which water related studies
can be executed, currently based upon a much better understanding of underlying processes
and descriptive means than some decades ago. For a better awareness of what is being opened
up with these developments it is recommended to participate in the two-yearly
Hydroinformatics Conferences (e.g. Nice, 2006; www.hic06.org). This paper also gives a
number of references to contributions published in the proceedings of the Hydroinformatics
Conference Singapore, 2004. Another recent source of information is a number of
2
contributions related to hydroinformatics, published in the Encyclopaedia of Hydrological
Sciences, e.g. Werner et al. (2005), Minns and Hall (2005), Stelling and Verwey (2005) etc.
In this introduction we will give an outline of various interesting developments and treat in
subsequent paragraphs, on a selective basis and in more detail, some more specific issues in
relation to flood forecasting and flood management.
HYDROINFORMATICS TOOLS The focus on hydroinformatics emerged from the field of computational hydraulics, when it
was understood and felt desirable that around the modelling systems developed in the last
three decades of the last century, a complete infrastructure of informatics support existed and
that its potential had to be explored and expanded to improve service to society. It comprises
data acquisition and data management techniques; new simulation techniques based upon
cognitive sciences and pattern recognition, such as artificial neural networks; data mining and
knowledge discovery techniques; evolutionary algorithms; decision support and management
systems; forecasting and data assimilation methods; fuzzy logic; cellular automata; integration
of systems and technologies; and emerging internet based technologies. A state-of-the-art
description of new technologies applied in the area of ecohydraulics was given by Mynett
(2004). Historically, balance equations or empirical relationships were developed by
scientists, e.g. Newton, Navier, Poisson, de Saint Venant, Stokes, Darcy, de Chézy, Strickler,
Manning etc., by trying to define fundamental relationships between various system state
variables on the basis of observations and by setting up balance principles, partly based upon
the empirical relationships found. A thorough presentation of the role of various scientists is
included in the work of Chanson (1999). Hydroinformatics can now be seen as providing an
extension to these developments, partly by using the computer power to guide and process
new and massive data collection techniques and partly by leaving it to computational power to
3
establish best fitting new relationships, often in areas which could not be explored before. The
change that hydroinformatics really brings is a change in the role of scientists, from those who
establish laws to those who guide the establishment of laws and relationships by mobilizing
computer power.
A good example is the use of artificial neural networks (ANN), which can be seen as an
extension of the traditional use of regression techniques, e.g. Minns and Hall (2005).
However, whereas in regression techniques formulae have to be prescribed and parameters
calibrated, ANN provides the additional flexibility that the relationships between state
variables, or the formulae, are left open, in fact never defined, as all relationships established
are based upon signals passed on through a sequence of (neural) cells with weightings
established by the so-called learning process through numerous trials. Compared with the
human mind, only one thing is missing: the ability to extrapolate the knowledge outside the
range where the learning process took place and even many human beings have difficulties
with such extrapolations. Although ANN’s have opened up the way to new simulation
techniques, the learning process shows clearly their limitation, for example in rainfall-runoff
modelling, where physically based balance models, equipped with appropriate limiters, can be
used more trustfully in extreme situations that go beyond earlier observations.
A step beyond ANN is the employment of sets of data to establish empirical relationships
in the form of mathematical expressions by using evolutionary algorithms. Unlike ANN’s,
where the development process of knowledge in the human brains serves as an example for
computer based knowledge development, evolutionary algorithms take the biological
reproduction process as the blueprint for the derivation of mathematical relationships. By
seeing state variables, operators and parameters as components of DNA strings,
recombinations of sub strings, together with the process of mutation leads, in a learning
process, to continuously better matching of mathematical relationships in a “survival of the

4
fittest” process. A recent example that serves flood modelling is given by Baptist et al.
(2005). For a number of years, Baptist (2005) has been working on the development of
empirical relationships defining the resistance of flow, expressed as a de Chézy value as a
function of flow depth and height and type of vegetation. For submerged vegetation, Baptist
derived the relationship
32
03
22
( ) ln1
2
κ−
⎛ ⎞−− ⎜ ⎟⎝ ⎠= +
+r
Db
g h kh kez
C C mDk hCg
(1)
where Cr = depth dependent Chézy coefficient [m½ s-1], Cb = Chézy value for the bottom
friction alone [m½ s-1]; CD = drag coefficient for flow around the vegetation stems [-]; m =
vegetation density [m-2]; D = representative stem diameter [m]; g = acceleration due to gravity
[m s-1]; k = representative vegetation height [m]; κ = von Kármán’s constant [-]; e = base of
the natural logarithm [-] and z0 = roughness height of the top of the vegetation [m]. The
equation was checked on a set of 990 results obtained with a 1-DV (1-dimensional in the
vertical) model based upon the Delft3D code, including a description of turbulence developed
around the stems of vegetation.
Rodriguez Uthurburu (2004, and to be published further in Baptist et al., 2005) used the
same set of data to train a genetic programming code and came up with the equation
22 ln
⎧ ⎫⎪ ⎪⎛ ⎞= + ⎨ ⎬⎜ ⎟⎝ ⎠⎪ ⎪⎩ ⎭
r
D
C hc mDk kg
(2)
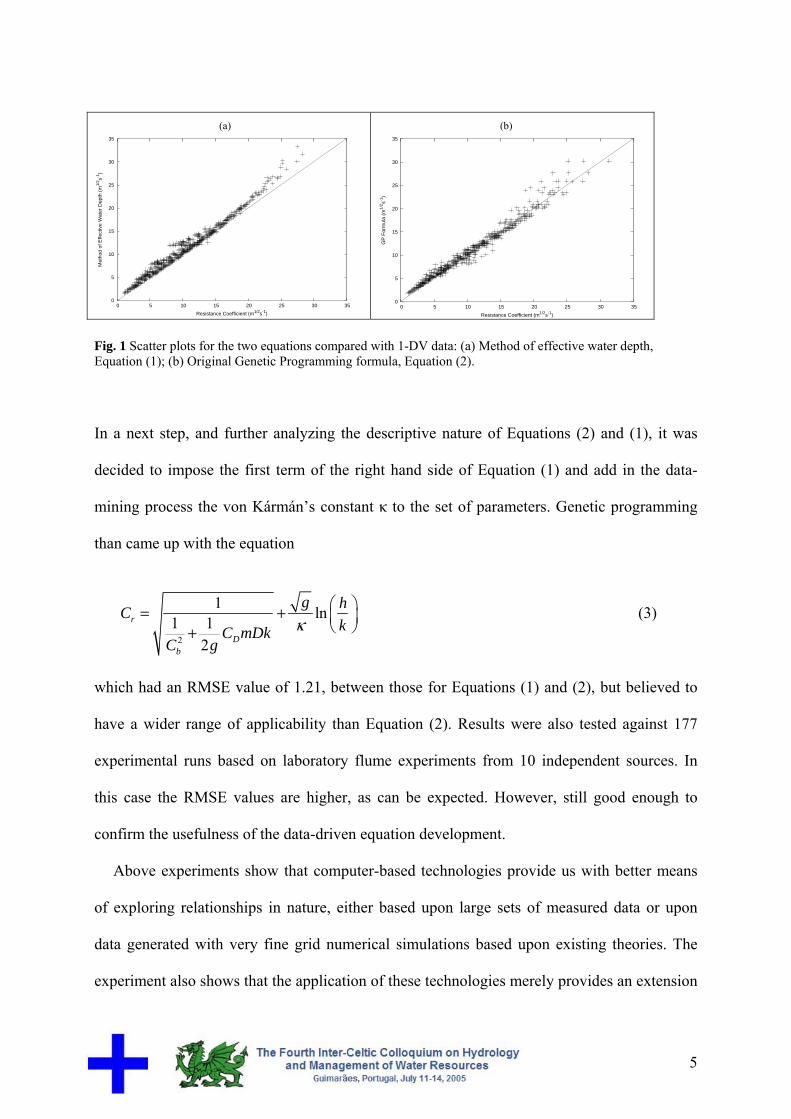
Figure (1) shows the scatter plots for both equations. Also based upon RMSE values for
both sets: 1.30 for Equation (1) and 0.97 for Equation (2), respectively, it can be concluded
that the data-driven discovery process has led to a better fitting equation than the equation
derived on the basis of existing theoretical knowledge.
5
(a)
0
5
10
15
20
25
30
35
0 5 10 15 20 25 30 35
Met
hod
of E
ffect
ive
Wat
er D
epth
(m
1/2 s-1
)
Resistance Coefficient (m1/2s-1)
(b)
0
5
10
15
20
25
30
35
0 5 10 15 20 25 30 35
GP
For
mul
a (m
1/2 s-1
)
Resistance Coefficient (m1/2s-1) Fig. 1 Scatter plots for the two equations compared with 1-DV data: (a) Method of effective water depth, Equation (1); (b) Original Genetic Programming formula, Equation (2).
In a next step, and further analyzing the descriptive nature of Equations (2) and (1), it was
decided to impose the first term of the right hand side of Equation (1) and add in the data-
mining process the von Kármán’s constant κ to the set of parameters. Genetic programming
than came up with the equation
2
1 ln1 12
κ⎛ ⎞= + ⎜ ⎟⎝ ⎠+
r
Db
g hCkC mDk
C g
(3)
which had an RMSE value of 1.21, between those for Equations (1) and (2), but believed to
have a wider range of applicability than Equation (2). Results were also tested against 177
experimental runs based on laboratory flume experiments from 10 independent sources. In
this case the RMSE values are higher, as can be expected. However, still good enough to
confirm the usefulness of the data-driven equation development.
Above experiments show that computer-based technologies provide us with better means
of exploring relationships in nature, either based upon large sets of measured data or upon
data generated with very fine grid numerical simulations based upon existing theories. The
experiment also shows that the application of these technologies merely provides an extension
6
of our scientific minds and certainly not a replacement. With the current floods of data
collected with remote sensing, for example, there must be many ways in which data-mining
will assist us in deriving relationships in such complex areas as environmental process
description, ecology and unsaturated ground-water zone analysis.
OPEN SOURCE VERSUS PROPRIETARY SOFTWARE Dealing with hydroinformatics, a continuous discussion point is the question of open source
against proprietary software, which is generally provided in the form of compiled executables.
This form also implies that the software codes cannot be modified by staff other than that of
the software vendors. Discussions on open source come down to the question of how water
resources agencies are best served and how providers of hydroinformatics services are
stimulated to provide the best tools. The point of view of the agency is extensively described
by Khatibi et al. (2004) with inputs from hydroinformatics tool providers. A number of aspects
will be presented briefly here. For water resources agencies, interested only in the use of
software, the following aspects are of interest:
a)economic overall solutions for their hydroinformatics infrastructure, e.g. the overall costs
for the development of a flood forecasting system, including the forecasting platform, costs
for underlying software, costs for model development and calibration etc.;
b) reliability of the software products, through good development practices and maintenance
of the codes, based upon extensive testing procedures;
c) openness of the software, enabling the coupling of various components;
d) reproducibility of results through good version management;
e) state-of-the-art scientific basis for the methods implemented in the software;
f) quick response to development needs.
Most of these requirements also apply to vendors of hydroinformatics software, as it is in their
interest to provide good service to clients and this in a competitive environment. Open source

7
is definitely not in the interest of this group, unless special factors play, such as market
penetration for other services (e.g. consultancy), name branding and free co-developments by
third parties. This last interest sometimes leads to adopting the concept of “open source in
closed community”, based upon co-development of codes by a limited group of participating
organisations and the right for one or more of these partners to distribute the code
commercially.
It is not the place here to draw definite conclusions on what is best practice. With a
common sense mind for advantages and disadvantages, the best solution can be found for
each case. However, regarding point (3) the difference between open and closed source will
be reduced in the near future. Water management agencies, in general, have a strong interest
in openness of software, so that various components can be linked without the need to
contract the original developers of such software components. This service is now being
developed through the European OpenMI concept, which facilitates coupling both of open
source and proprietary software components.
OPEN MI Dealing with water authorities, different consultants and own staff are implementing
continuously bits and pieces of software and often there is neither a contractual obligation nor
the means to embed these new service tools into a consistent hydroinformatics infrastructure
for the organisation. For this reason, the concept of OpenMI (Open Modelling Interface) was
developed through the European HarmonIT project, initiated by the Ministry of Transport,
Public Works and Water Management in The Netherlands as an important stakeholder.
OpenMI has been designed as a generic set of communication rules for linking all kinds of
software components available to the water sector. For example, OpenMI facilitates the
transfer of data in a generic way and at any moment in time, from one model, e.g. a rainfall-
runoff model, to another model, such as a hydrodynamic model, vice versa. More in general,
8
OpenMI facilitates the flexible linking of a wide variety of simulation models, generic
modelling systems, databases, GIS, decision support systems, web based services etc.
(Gijsbers, 2004).
OpenMI is primarily a set of rules on how to exchange data in a pre-defined way. Ideally,
within an organisation, all software tools should be linkable through a common platform.
With the current trend of developing integrated models of hydraulic, hydrologic and
environmental systems, the development of such platforms becomes even more desirable.
Currently, the definition stage of the OpenMI standard has been completed
(http://www.harmonit.org) and it is expected that this initiative will lead to a European
standard on data exchange. In addition, the HarmonIT project is finalizing a utility library,
which is available as public domain software on http://www.OpenMI.org. This library will
facilitate application builders with the responsibility of connecting various software codes via
OpenMI standards. The various organisations in the HarmonIT project are also composing
additional tool sets, such as event loggers and data visualizers, which will remain their own
proprietary software.
In order to improve the integration of software systems, various groups have to contribute.
Fortune (2004) identifies the following OpenMI user groups: non-specialist end user,
specialist end user, model integrator, model builder, model coder, application builder and tool
coder. In particular, it is important that the demand for better communication between
hydroinformatics components is enforced in contracts. As an example, recently the
Bundesanstalt für Wasserbau (BAW) in Germany demanded OpenMI compliance for the
delivery of the generic Delft3D modelling system of WL | Delft Hydraulics. There is a clear
trend now that the principal participants in the HarmonIT project, such as DHI, Wallingford
Software and WL | Delft Hydraulics are opening up their standard software packages with
OpenMI communication links. In principle, all existing modelling systems can be made
9
OpenMI compliant. Fast connections can only be made if the source code is available. The
adaptation is relatively easy if the code has been programmed in an object oriented way.
Executables can be made OpenMI compliant by encapsulating them within a wrapper, a
communication layer which transfers data that are accessible through the standard input- and
output routines of the code. This, however, may lead to slower communication links.
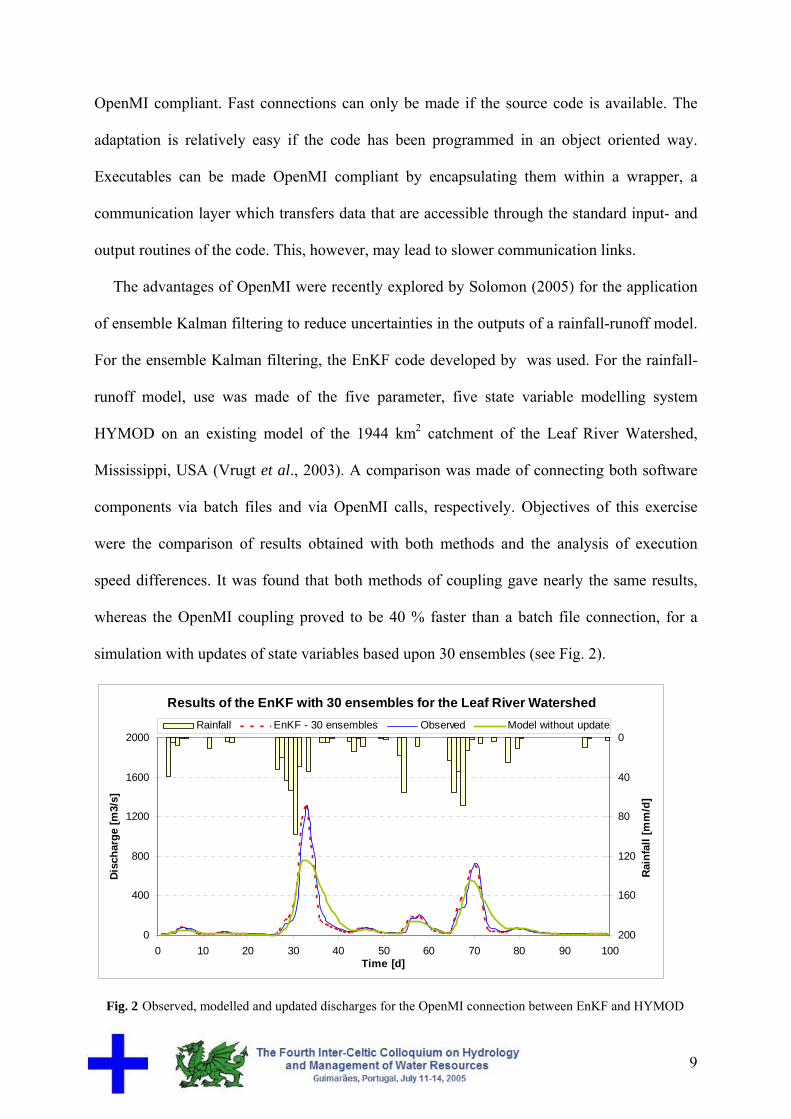
The advantages of OpenMI were recently explored by Solomon (2005) for the application
of ensemble Kalman filtering to reduce uncertainties in the outputs of a rainfall-runoff model.
For the ensemble Kalman filtering, the EnKF code developed by was used. For the rainfall-
runoff model, use was made of the five parameter, five state variable modelling system
HYMOD on an existing model of the 1944 km2 catchment of the Leaf River Watershed,
Mississippi, USA (Vrugt et al., 2003). A comparison was made of connecting both software
components via batch files and via OpenMI calls, respectively. Objectives of this exercise
were the comparison of results obtained with both methods and the analysis of execution
speed differences. It was found that both methods of coupling gave nearly the same results,
whereas the OpenMI coupling proved to be 40 % faster than a batch file connection, for a
simulation with updates of state variables based upon 30 ensembles (see Fig. 2).
Results of the EnKF with 30 ensembles for the Leaf River Watershed
0
400
800
1200
1600
2000
0 10 20 30 40 50 60 70 80 90 100Time [d]
Disc
harg
e [m
3/s]
0
40
80
120
160
200
Rai
nfal
l [m
m/d
]
Rainfall EnKF - 30 ensembles Observed Model without update
Fig. 2 Observed, modelled and updated discharges for the OpenMI connection between EnKF and HYMOD
10
No effort was made to test the speed of a direct implementation of the ensemble Kalman
filtering code inside HYMOD. This would go against the trend of designing modelling
systems in a modular way by developing different functionalities in separate executables.
However, other experiments with OpenMI have revealed that the speed difference between
simulation with a fully integrated code and with separate codes in a modular design with
exchange of data based upon OpenMI data exchange is not very significant.
FLOOD FORECASTING PLATFORM Quoting Fortune (2004): Perhaps the most advanced approach to flexible model integration is
taken for flood forecasting applications. This is, indeed, the area where the need of coupling
of components of a hydroinformatics systems is most pronounced. As shown in the sequel,
flood forecasting requires many operations between a wide variety of components to be
orchestred in a short time. This leads to the explicit need to create a generic flood forecasting
platform, where existing components can be connected and new components be added in a
flexible manner. With this objective, the Delft-FEWS (Flood Early Warning System) was
developed and implemented in various places in the world.
The Delft-FEWS system takes care of executing the following tasks: a) import of external sources of data, such as meteorological forecasts, including those based
upon numerical weather models, radar data, rainfall, discharge and water level time series
from telemetric systems and data from external databases;
b) validation and interpolation of incoming data, using extensive data validation options with
gap filling and hierarchy rules to allow alternative data sources to be used as a fallback for
ensuring continuity in the forecasting process;
11
c) data transformation in order to prepare the required inputs for reporting and for the
forecasting models, such as weighting of precipitation from distributed point sources, from
radar and from numerical weather models, as input to rainfall-runoff modelling;
d) execution of the hydrologic and hydraulic forecasting models. These models may be
provided by various suppliers and cover a wide range of methods, from simple regression
analysis, lumped hydrological models, spatially distributed hydrological models, artificial
neural networks, hydrological routing models to 1D and integrated 1D-2D hydrodynamic
models;
e) updating the state of the models through a feedback mechanism to minimize the gap
between observed and forecasted data. Delft-FEWS provides some of the possible data
assimilation models, such as the ARMA error correction method and ensemble Kalman
filtering. Delft-FEWS also facilitates the implementation of other updating techniques;
f) visualisation of results on maps, which can be imported from various sources, such as GIS,
aerial photo’s etc., including geographic navigation on these maps;
g) dissemination of forecasts through maps and HTML formatted reports, allowing easy
communication to relevant authorities and public through intranet and internet.
An example of the typical requirements of a forecasting agency is described by Werner et al.
(2004). In 2002, the Environment Agency in the UK commissioned to WL | Delft Hydraulics
and Tessella Scientific the development of the National Flood Forecasting System (NFFS) as
flood forecasting platform for the complete area of England and Wales. A requirement given
was the openness of the system to allow the continued use of various calibrated models which
were already operational in flood forecasting systems for a number of river catchments in the
area. So far, these comprised the rainfall-runoff models based upon PDM, MRCM, TCM and
NAM, the hydrologic routing models based upon DODO and KW and the hydrodynamic
modelling systems ISIS and Mike11. Currently, Delft-FEWS also has links to the rainfall-
12
runoff software HBV, Sacramento, PRMS and VFlo and the hydrodynamic modelling system
SOBEK.
NFFS replaces, among others, the earlier FFS2 system developed for the UK Midlands
region (Dobson and Davies, 1990). It comprises the MCRM lumped conceptional rainfall-
runoff model and the DODO two layer Muskingum routing model, both equipped with
updating techniques. These models had to be retained, as they have been extensively
calibrated over the past years. The existing telemetry system was equipped with 124
meteorological gauges, 147 hydrological gauges and 272 forecasting points that may or may
not coincide with gauge locations. The whole system represents a substantial asset value, of
which many components are of great value in the newly installed Delft-FEWS. Once the new
system is operational, component models can be replaced by better options if and when these
will be acquired.
An immediate advantage of the new system is that forecast lead times increase through the
link to more advanced weather forecasting, which is part of the overall platform. A longer
term advantage is that gradually the hydrologic and hydraulic models can be replaced by state
of the art products, without being bound to one single manufacturer. Similarly, with the
overall platform in place, the Environment Agency can gradually increase the number of
catchments where forecasting is provided.
EXAMPLE OF FLOOD MANAGEMENT DECISION SUPPORT SYSTEM Decision support systems aim at facilitating the societal, political and managerial decision
making processes with sound engineering knowledge. An interesting example is the Planning
Kit, developed for supporting the decision making process of improved flood management
along the Rhine branches in The Netherlands (de Vriend and Dijkman, 2003). Due to climatic
and land use changes and the increased awareness of their effects, triggered by the 1993 and
13
1995 flood situation along the Rhine, the design discharge for the Rhine Branches has been
increased by about 7 %. At the same time, a policy change was accepted by Parliament to no
longer rely on heightening dikes. The new policy is to provide “room for the river”, with dike
heightening only as a last resort. As a result, various measures have to be taken to achieve
safety against flooding for these new criteria. In a recent study Room for Rivers, many
alternatives for flood protection were presented as an alternative to the earlier solutions of a
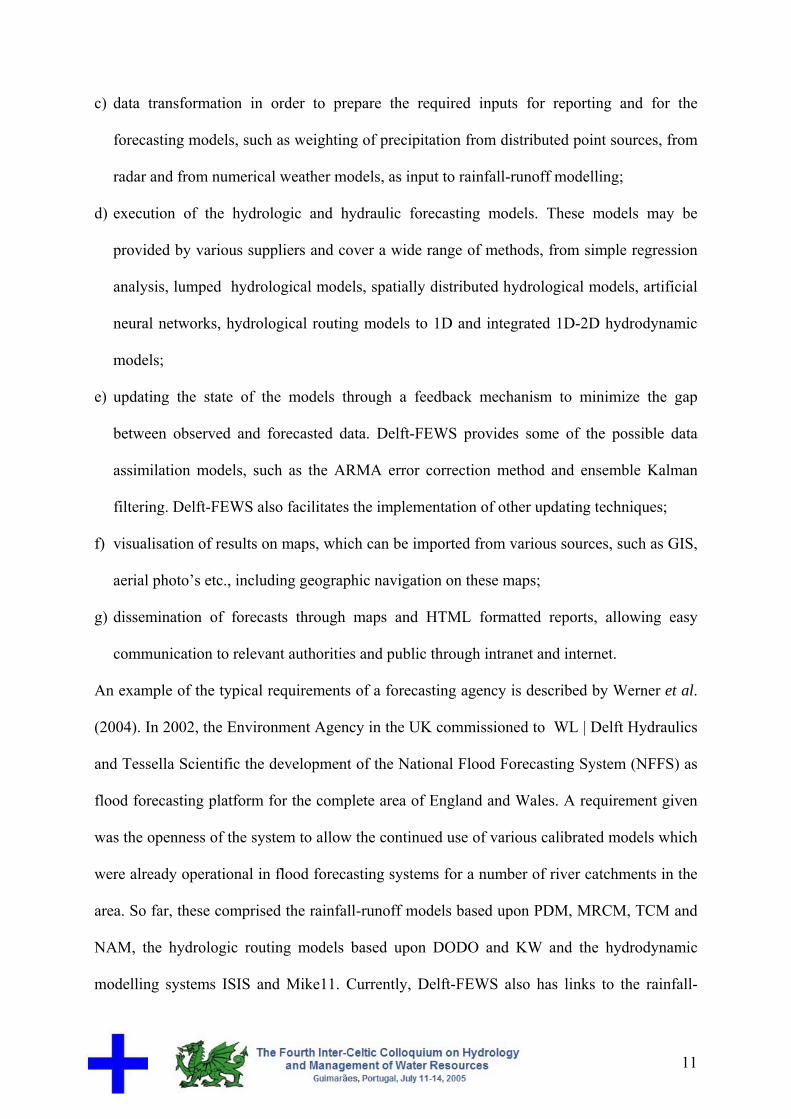
continued raising of dike levels. Examples of such measures are presented in Figure (3).
Fig. 3 Flood control measures in the river bed [from Silva et al., 2000]
Many of these measures can be taken to enrich simultaneously the ecological state of the
flood plain. Most of these measures, however, also have a negative impact on the population
living along the rivers. This leads to a complex decision making process with many actors
and stakeholders, both public and private. After an extensive investigation of possible
measures, including the creative inputs provided by stakeholders and local authorities, a set of
some 700 potential measures along the Lower Rhine branches emerged. The objective of the
Planning Kit has been the visualisation of the effects of these measures to facilitate the
participation and planning process. As a first step, these measures were implemented in a GIS
environment.
Limiting ourselves here to the flood level aspects, GIS was used to compute the changes in
flood conveyance. These changes were introduced in a 2D depth averaged hydrodynamic
14
model of the entire Lower Rhine system. Subsequently, sub models were run to study the
impacts of local measures on the surrounding flood levels. These impacts were stored in a
database as water level changes along the river, compared to the reference situation. During
public hearings and meetings with local authorities, the measures could be discussed on the
basis of the presentations in GIS, combined with other database information, such as photos,
visualisation of the area with and without the measures and the scores of individual measures
on more than 50 criteria (costs, ecological effects, etc.). The use of the database enabled the
instantaneous visualisation of the superimposed effect of any selected combination of
measures on the maximum flood levels along the river. This selection could be made just by
clicking on the map, in the list of measures or on a graph. Such effects could not be produced
during the actual meetings by using real models. This would simply take far too much time.
With the Planning Kit, a preferred set of actions could be defined by the public and decision
makers who cannot be expected to have an in-depth knowledge of river hydraulics.
The question arises whether the superposition principle of measures is justified, as the
hydrodynamic process is non-linear. Such justification is based upon the evaluation of
measures in a relatively narrow range of water level variations around the design flood level.
In addition it can be stated that rating curves, though by definition non-linear, show up as
monotonically rising and rather smooth functions at these levels.
Obviously, after reaching agreement on a set of measures using the Planning Kit, a 2D
calculation with all measures implemented is realised to check the combined water level
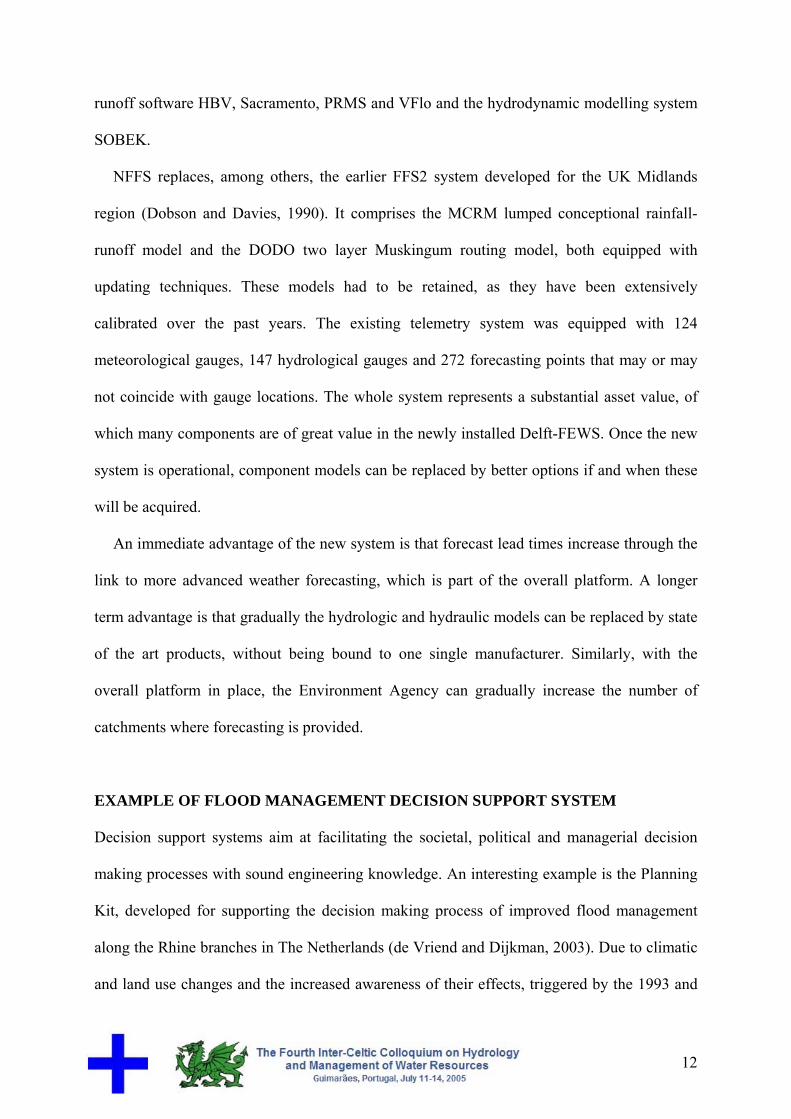
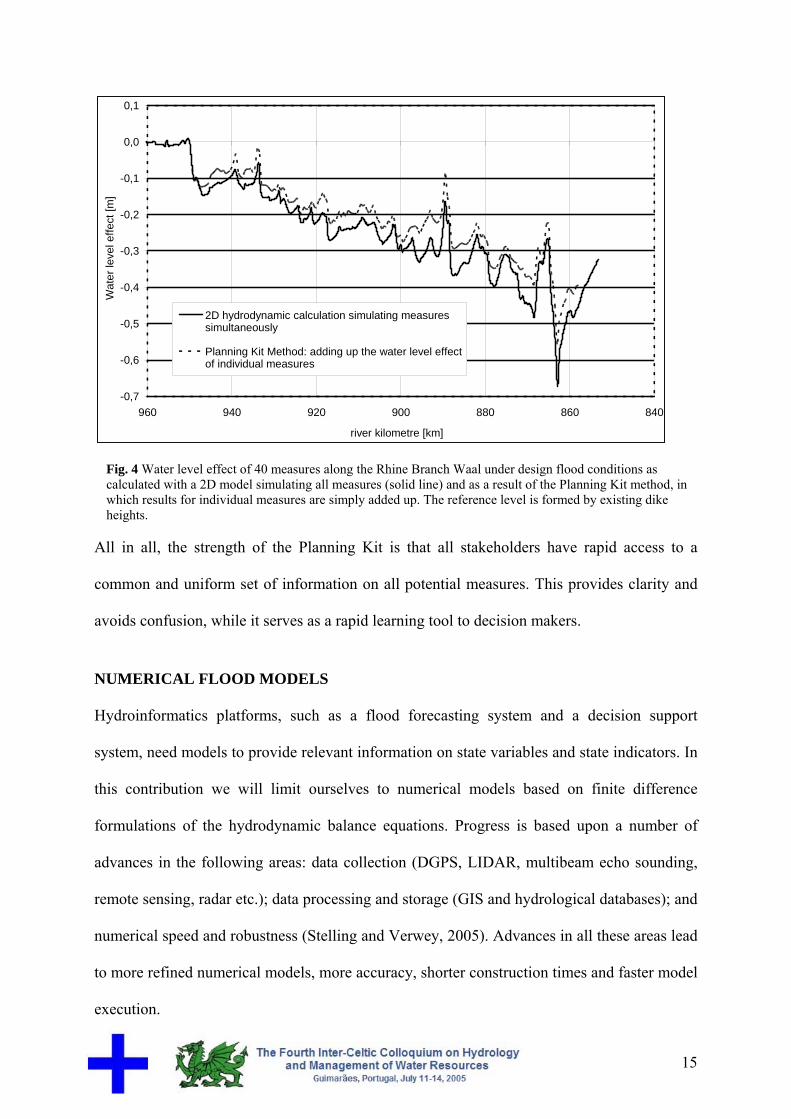
effect. Figure (4) appears to justify the use of the Planning Kit, by showing that a combination
of 40 measures along the Rhine branch Waal provides water level effects which differ not
more than 10 cm from those obtained with a full 2D hydrodynamic model.
15
-0,7
-0,6
-0,5
-0,4
-0,3
-0,2
-0,1
0,0
0,1
840860880900920940960
river kilometre [km]
Wat
er le
vel e
ffect
[m]
2D hydrodynamic calculation simulating measuressimultaneously
Planning Kit Method: adding up the water level effectof individual measures
Fig. 4 Water level effect of 40 measures along the Rhine Branch Waal under design flood conditions as calculated with a 2D model simulating all measures (solid line) and as a result of the Planning Kit method, in which results for individual measures are simply added up. The reference level is formed by existing dike heights.
All in all, the strength of the Planning Kit is that all stakeholders have rapid access to a
common and uniform set of information on all potential measures. This provides clarity and
avoids confusion, while it serves as a rapid learning tool to decision makers.
NUMERICAL FLOOD MODELS Hydroinformatics platforms, such as a flood forecasting system and a decision support
system, need models to provide relevant information on state variables and state indicators. In
this contribution we will limit ourselves to numerical models based on finite difference
formulations of the hydrodynamic balance equations. Progress is based upon a number of
advances in the following areas: data collection (DGPS, LIDAR, multibeam echo sounding,
remote sensing, radar etc.); data processing and storage (GIS and hydrological databases); and
numerical speed and robustness (Stelling and Verwey, 2005). Advances in all these areas lead
to more refined numerical models, more accuracy, shorter construction times and faster model
execution.

16
Focussing on the use of hydrodynamic flood simulation models, there is a gradual shift from
the use of 1D to 2D depth averaged models and further to the integration of these two types of
schematisation. Both 1D and 2D models have advantages and disadvantages, as follows:
a) in terms of model construction time, the construction of 2D models is generally faster
when reliable digital elevation models are available and use can be made of land use maps
to support roughness parameter estimation;
b) 1D models, on the other hand, are faster in simulation, which is of particular advantage in
flood forecasting;
c) the accuracy of 1D models can be higher than that of 2D models for flow in the main river,
including the flow between river embankments;
d) 2D models are usually more accurate and cheaper in construction when flow in flood
plains has to be modelled;
e) 1D modelling software is generally available at lower cost than 2D modelling software, as
there is more choice in the market.
The third point, in particular, requires further comments. Limiting ourselves to finite
difference methods, detailed modelling of the main river bed requires at least 10 2D grid cells
over the width of this bed in order to model the flow in the usually meandering channel with
sufficient accuracy. For long river stretches, this usually leads to an excessive number of 2D
grid cells. Although, at first sight, the 1D schematisation of a meandering river is complex, it
is relatively easy to compensate for the effects of short cuts over the flood plain in the
integration of the flow conveyance parameters along the 1D cross-sections. On the other hand,
when large flood plain areas are to be included in the model, a 1D model schematisation
becomes quite inaccurate. For a number of decades the 1D flood plain cell technique has been
used. Although this technique allows for a correct schematisation of storage, it is difficult to
estimate reliable conveyance parameters as the flow directions may vary significantly during

17
the passage of a flood wave. In this case a 2D schematization is superior (statement 4),
especially with the possibility to implement depth-dependent roughness descriptions based on
vegetation classes.
As both 1D and 2D schematizations have particular advantages and disadvantages, an
integration of both types of schematisations will be attractive. There are, indeed, numerous
practical examples where flows are best described by an integration of 1D and 2D
schematizations. An obvious example is the flooding of deltaic areas, often characterized by a
flat topography with complex networks of natural levees, polder dikes, drainage channels,
elevated roads and railways and a large variety of hydraulic structures. Flow over the terrain
is best described by the 2D equations, whereas channel flow and the role of hydraulic
structures are satisfactorily described in 1D. Flow over higher elevated line elements, such as
roads and embankments can be modelled in 2D reasonably well by raising the bottom of
computational cells to embankment level. To increase the accuracy, however, adapted
numerical formulations have to be applied, such as the energy conservation principle
upstream of overtopped embankments. For the hybrid 1D, 2D schematization, basically there
are two approaches: one with interfaces defined between 1D and 2D along vertical planes and
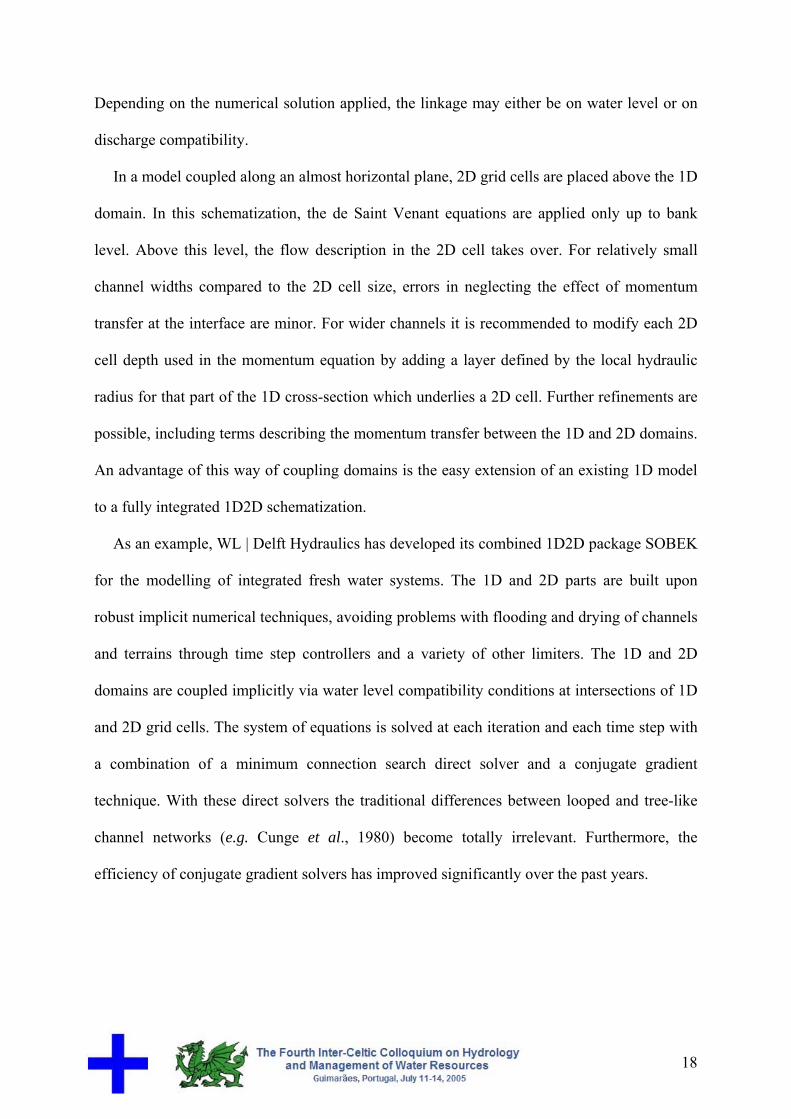
the other approach with schematization interfaces in almost horizontal planes.
Coupling along vertical planes, gives a full separation in the horizontal space of the 1D and
2D modelled domains. In the 1D domain the flow is modelled with the de Saint Venant
equations applied over the full water depth. The direction of flow in the 1D domain is
assumed to follow the channel x-axis and in the model it carries its momentum in this
direction, also above bank level. Without special provisions, there is no momentum transfer
accounting applied between the 1D and 2D domains. Momentum and volume entering or
leaving the 2D domain at these interfaces, are generated by the compatibility condition
applied. As a result, the coupling cannot be expected to be momentum conservative.
18
Depending on the numerical solution applied, the linkage may either be on water level or on
discharge compatibility.
In a model coupled along an almost horizontal plane, 2D grid cells are placed above the 1D
domain. In this schematization, the de Saint Venant equations are applied only up to bank
level. Above this level, the flow description in the 2D cell takes over. For relatively small
channel widths compared to the 2D cell size, errors in neglecting the effect of momentum
transfer at the interface are minor. For wider channels it is recommended to modify each 2D
cell depth used in the momentum equation by adding a layer defined by the local hydraulic
radius for that part of the 1D cross-section which underlies a 2D cell. Further refinements are
possible, including terms describing the momentum transfer between the 1D and 2D domains.
An advantage of this way of coupling domains is the easy extension of an existing 1D model
to a fully integrated 1D2D schematization.
As an example, WL | Delft Hydraulics has developed its combined 1D2D package SOBEK
for the modelling of integrated fresh water systems. The 1D and 2D parts are built upon
robust implicit numerical techniques, avoiding problems with flooding and drying of channels
and terrains through time step controllers and a variety of other limiters. The 1D and 2D
domains are coupled implicitly via water level compatibility conditions at intersections of 1D
and 2D grid cells. The system of equations is solved at each iteration and each time step with
a combination of a minimum connection search direct solver and a conjugate gradient
technique. With these direct solvers the traditional differences between looped and tree-like
channel networks (e.g. Cunge et al., 1980) become totally irrelevant. Furthermore, the
efficiency of conjugate gradient solvers has improved significantly over the past years.
19
CONCLUSIONS Continuing development of the speed and the data storage capacity of computers have a large
impact on the methods used to support studies in the water sector. In the first place, this
potential leads to new measuring techniques providing us with large amounts of information
(LIDAR, remote sensing, multibeam echo sounding, ADCP, radar technology etc.). The
increased and more accurate sets of data also facilitate the construction and calibration of
simulation models. In the second place, the large sets of data can be explored with new data-
mining techniques to extract new knowledge from these massive sets of individual numbers
or pixels, for example in the form of new empirical equations. This new knowledge, in turn,
can either reinforce existing numerical models or provide an alternative to the balance
equation based modelling methods, e.g. artificial neural networks. In the third place, there is a
trend to use the increased computer power to achieve a better integration of hydroinformatics
components, such as models for different physical subsystems, databases, GIS, telemetry etc.
Especially water resources agencies feel the need to arrive at better integration of these
various components. In this context, the Open MI standard developed recently through an EU
initiative may prove to be very useful, facilitating the development of hydroinformatics
platforms such as flood forecasting systems and decision support systems.
ACKNOWLEDGEMENTS The work described in this paper represents to a large extent research and development work
at WL | Delft Hydraulics. In particular, I have appreciated the supportive role of my
colleagues Jos Dijkman, Micha Werner, Rene Brocatus, Stef Hummel, Peter Gijsbers, Vladan
Babović, Guus Stelling and Arthur Mynett. The same holds for the UNESCO-IHE MSc
participants Rodriguez Uthurburu and Solomon Dagnachew Seyoum, who did their thesis
work jointly with the Strategic Research and Development Department of WL | Delft
Hydraulics. Finally, the text has benefitted from discussions on open source software with
20
Aad Dollee and Leo Voogt of the Ministry of Transport, Public Works and Water
Management in The Netherlands.
REFERENCES Baptist. M.J. (2005). Modelling floodplain bio geomorphology. Ph.D. thesis, ISBN 90-407-
2582-9, 193 pp., Delft University of Technology, Faculty of Civil Engineering and Geosciences, Section Hydraulic Engineering.
Baptist, M.J., Babović, V., Rodríguez Uthurburu, J., Keijzer, M., Uittenbogaard, R., Mynett, A. and Verwey, A. (2005). On inducing equations for vegetation resistance. To be published in the Journal of Hydraulic Research, IAHR, Madrid.
Chanson, H. (1999). The Hydraulics of Open Channel Flow, Arnold Publishers/Wiley, Paris/New York.
Cunge, J.A., Holly, F.M. and Verwey, A. (1980). Practical Aspects of Computational River Hydraulics (420 pages), Pitman Publishing Ltd., London, Great Britain, 1980. Reprinted at Iowa Institute of Hydraulic Research, USA, 1986. (Also translated into Russian).
Dobson, C., and Davies., G.P. (1990). Integrated real time data retrieval and flood forecasting using conceptual models. In International Conference on River Flood Hydraulics, White, W.R. (Ed.), 21-30, John Wiley & Sons Ltd., UK.
Fortune, D. (2004), in Proceedings of the 6th International Conference on Hydroinformatics, Liong, Phoon and Babović (Eds.), World Scientific Publishing Company, Singapore, 1835-1842.
Gijsbers, (2004), in Proceedings of the 6th International Conference on Hydroinformatics, Liong, Phoon and Babović (Eds.), World Scientific Publishing Company, Singapore, 1819-1826.
Hesselink, A.W., Stelling, G.S., Kwadijk J.C.J. and Middelkoop, H. (2003). Inundation of a Dutch river polder, sensitivity analysis of a physically based inundation model using historic data. Water Resour. Res., 39(9), 1234.
Khatibi, R., Jackson, D., Curtin, J., Whitlow, C., Verwey, A. and Samuels, P. (2004). Vision Statement on Open Architecture for Hydraulic Modelling Software, Journal of Hydroinformatics, 06.1
Mynett, A., (2004). Hydroinformatics tools for ecohydraulics modelling, in Proceedings of the 6th International Conference on Hydroinformatics, Liong, Phoon and Babović (Eds.), World Scientific Publishing Company, Singapore, 3-12.
Minns, A.W. and Hall, M.J. (2005). Artificial neural network concepts in hydrology, Encyclopaedia of Hydrological Sciences, John Wiley & Sons Ltd., UK.
Rodriguez Uthurburu, R, (2004). Evaluation of physically based and evolutionary data mining approaches for modelling resistance due to vegetation in SOBEK 1D-2D, M.Sc. thesis HH 485, UNESCO-IHE, Delft, The Netherlands.
Serban, P., Crookshank, N.L. and Willis, D.H. (2005). Intercomparison of Forecast Models for Stream flow Routing in Large Rivers, WMO, Geneva.
Silva, W., Klijn, F. and Dijkman, J., 2001. Room for the Rhine Branches in The Netherlands: what the research has taught us. Rijkswaterstaat / WL|Delft Hydraulics, report RIZA-2001.031 / WL - R 3294, 162 pp.
Solomon, D.G. (2005). A generic software tool for OpenMI compliant ensemble Kalman
filtering, M.Sc. thesis HI.05-04, UNESCO-IHE, Delft, The Netherlands.
21
Stelling, G.S. and Duinmeijer, S.P.A. (2003). A staggered conservative scheme for every Froude number in rapidly varied shallow water flows. Int. J. for Numer. Meth. Fluids, 43, 1329-1354.
Stelling, G.S. and Verwey, A. (2005). Numerical flood simulation, Encyclopaedia of Hydrological Sciences, John Wiley & Sons Ltd., UK.
Uittenbogaard, R. (2003). Modelling turbulence in vegetated aquatic flows, presented at the International workshop on RIParian FORest vegetated channels: hydraulic, morphological and ecological aspects, Trento, Italy.
Verwey, A. (2001). Latest Developments in Floodplain Modelling - 1D/2D Integration, keynote lecture in : Proceedings of the 6th Conf. on Hydraulics in Civil Engineering, Hobart, Australia.
de Vriend, H.J. and Dijkman, J.P.M. (2003). A new method of decision support to river flood management. Proceedings of the International Yellow River Forum on River Basin Management, Zhengzhou, China.
Vrugt, J.A., Gupta, H.V., Bouten, W. and Sorooshian, S. (2003). A shuffled complex evolution metropolis algorithm for optimization and uncertainty assessment of hydrologic model parameters, Water Resour. Res., 39(8), 1201.
Werner, M.G.F., van Dijk, M. and Schellekens, J., (2004). DELFT-FEWS: An open shell flood forecasting system, in Proceedings of the 6th International Conference on Hydroinformatics, Liong, Phoon and Babović (Eds.), World Scientific Publishing Company, Singapore, 1205-1212.
Werner, M.G.F., Schellekens, J. and Kwadijk, J.C.J. (2005). Flood early warning systems for hydrological (sub) catchments, Encyclopaedia of Hydrological Sciences, John Wiley & Sons Ltd., UK.