Embed Size (px)
Citation preview

1
How to calculate Confidence Intervals and
Weighting Factors
Christina Blakey

2
Useful definitions
• Weighting Factors make the achieved sample match the population
• Grossing Factors make the sample the size of the population
• Confidence Intervals show how accurate our estimates are

3
Weighting FactorsFor example, we have an unequal
number of male and female
respondents in our sample (e.g. 70%
female and 30% male) but we know
that the population is 50% female and
50% male.
In order to ensure that our results
represent the population each “male”
answer would be given more weight
than each “female” answer.

4
How do we calculate Weighting Factors?
Achieved Sample Known Population Weighting Factor
Men 150 (36%) 4500 (45%) 45/36 = 1.25
Women 270 (64%) 5400 (55%) 55/64 = 0.86
Total 420 9,900

5
Grossing FactorsOtherwise known as population based weighting, grossing up weights
Form of weighting used to “gross up” results to the population being studied so we can make
statements about the population rather than just the sample
The grossing factor is the known population divided
by the achieved sample size
6
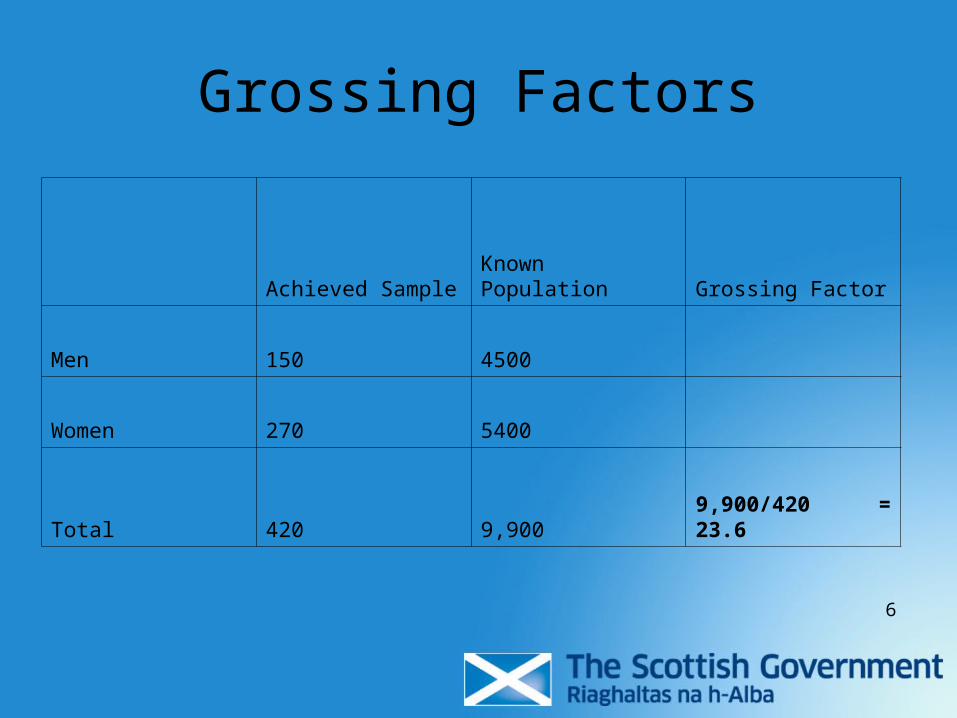
Grossing Factors
Achieved Sample Known Population Grossing Factor
Men 150 4500
Women 270 5400
Total 420 9,900 9,900/420 = 23.6
7
Combining Weighting and Grossing Factors
Usually weighting and grossing factors are used togetherHow do we combine them?
There are two waysBoth methods achieve the same result so we will only focus on one

8
Weighting and Grossing Factors
Achieved Sample Known PopulationWeighting and
Grossing Factor
Men 150 4500 4,500/150 = 30
Women 270 5400 5,400/270 = 20
Total 420 9,900
9
How to apply weights in practice?
How do we add this information to our data set?
There are a number of different statistical packages available and each have different methods of adding weights to the data.
The simplest way is too add a column to your data set entitled weight.
Each individual response can then be multiplied by this column.

10
Confidence Intervals (CI’s)
• Confidence intervals are one of the most important ways that statisticians quantify the error in an estimate
• They show how accurate our results are.• The narrower the intervals the more accurate
our estimates are.

11
Calculating Confidence Intervals
So using our example from before
Our weighted result shows that 70% of people prefer dogs to cats.
How do we calculate a 95% Confidence Interval?
A 95% confidence interval is 1.96 multiplied by the
standard error
There are different ways to calculate Standard Error for
Means and Proportions
12
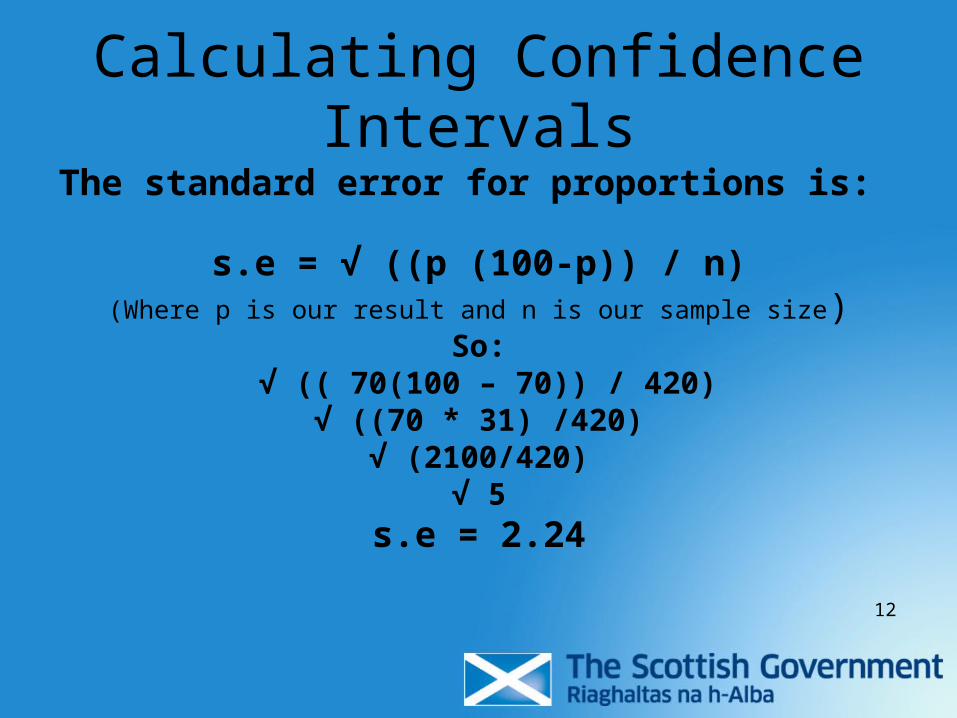
Calculating Confidence Intervals
The standard error for proportions is:
s.e = √ ((p (100-p)) / n)(Where p is our result and n is our sample size)
So: √ (( 70(100 – 70)) / 420)
√ ((70 * 31) /420)√ (2100/420)
√ 5s.e = 2.24

13
Calculating Confidence Intervals
CI = 2.24 * 1.96
CI = 4.4
70 – 4.4 = 65.6
70 + 4.4 = 74.4
Therefore we are 95% confident that the true percentage of people who prefer dogs to cats is
between 65.6% and 74.4%
14
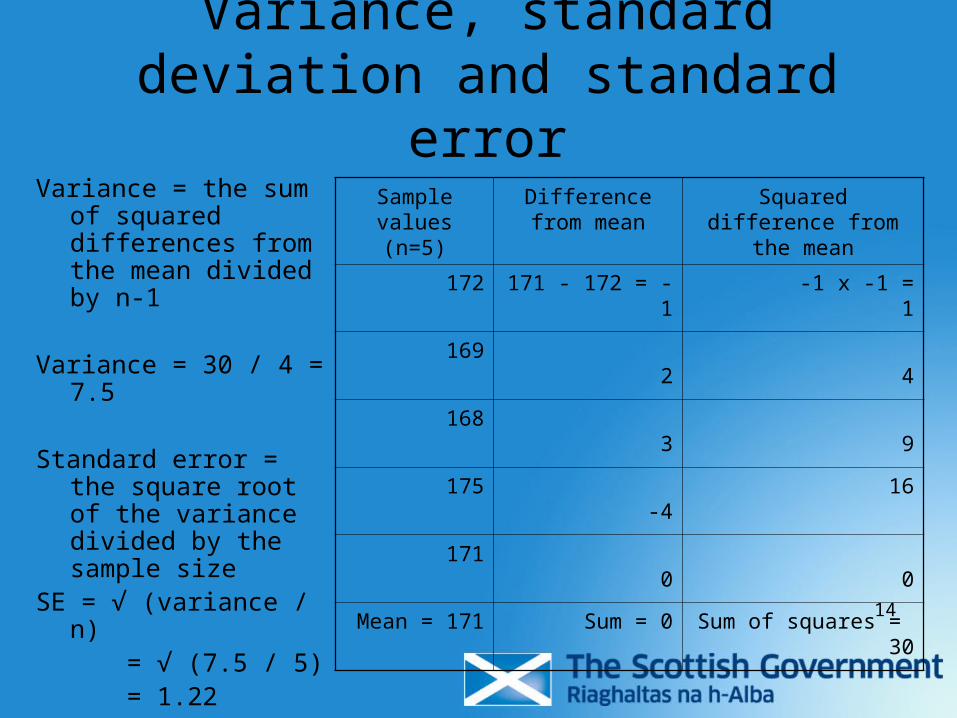
Variance, standard deviation and standard error
Variance = the sum of squared differences from the mean divided by n-1
Variance = 30 / 4 = 7.5
Standard error = the square root of the variance divided by the sample size
SE = √ (variance / n) = √ (7.5 / 5) = 1.22
Sample values (n=5)
Difference from mean
Squared difference from the mean
172 171 - 172 = -1 -1 x -1 = 1
169 2 4
168 3 9
175 -4 16
171 0 0
Mean = 171 Sum = 0 Sum of squares = 30

15
Confidence Intervals
So 1.96 times the standard error gives us the 95% confidence limits.
Our standard error is 1.22. 1.96 x 1.22 = 2.4
Our sample mean is 171.0 171.0 – 2.4 = 168.6
171.0 + 2.4 = 173.4
We can be 95% confident that the true mean (the population mean) lies between 168.6 and 173.4.

16
Confidence Interval Calculator
Microsoft Office Excel Worksheet