Embed Size (px)
Citation preview
1
Emission projections
Norwegian approachProjection Expert PanelDublin, Oct 25th 2007
Anne Kristin Fosli, Ministry of Finance Senior Adviser
2
Finansdepartementet
Outline
• Methodologies and models
• Authorities involved
• Main characteristics
• Challenges

3
Finansdepartementet
Demand for projections increases..
• Emission projections are carried out minimum every fourth year in conjunction with the preparation of the White Paper to the Parliament: ”Long Term Economic Prospective”
• Projections and analysis regularly published as a part of the White paper ”Long Term Prospective”
• Projections are carried out and coordinated by Ministry of Finance in close cooperation with The State Pollution Control Authorities
• The need for updates and partially updates have increased for policy purposes, as Kyoto- and Gothenburg commitment years approaches
• Updates are published in National Budgets and Revised National Budgets
• Lately, huge focus on ”without measure scenarios” to document action and effects of policies
4
Finansdepartementet
Methodology
• Projections both for GHG gases and LRTAP (nmVOC, SO2 and NOX) are based on a macroeconomic model called MSG (Multi Sectoral Growth)
• An emission calculation model and electricity demand model are included in MSG
• Supplemented by micro-information and branch studies • Projections for non- CO2 GHG- gases emissions are based on
information from concerned sectors and consistent with macroeconomic projections
• NH3 projections based on projections on animal stock and agriculture policies

5
Finansdepartementet
Authorities involved
• Ministry of Finance is responsible for the production and publishing of the official emission projections, and activity data fed into the MSG (including energy data)
• The Norwegian State Pollution control is responsible for the production of emission projections of non- CO2 GHG gases
• Ministry of Oil and Energy is responsible for the annual projections of the emissions from the Petroleum sector
• Ministry of Agriculture and The Norwegian State Pollution are responsible for projections of NH3

6
Finansdepartementet
Characteristics of the MSG model
• A general equilibrium model• All resources fully utilized• Producer behaviour is characterized by monopolistic
competition in the domestic market. Pricetakers on the world market
• Highly disaggregated• Detailed description of the markets for energy and transport• 40 private production sectors• 7 public sectors • 17 private consumption sectors• Four energy carriers • Long term projections are sensitive to assumptions on
population growth, technological progress and the development of prices in international markets
7
Finansdepartementet
Assumptions – supply and use of electricity
•99% of Norwegian mainland electricity production based on hydropower •The production of renewables (water and wind power) is exogenously determined•Marginal long term cost of electricity produced by natural gas decides long term electricity prices in the reference scenario •Requirements of CO2 capture and storage on natural gas fired power plants in Norway make natural gas fired power plants not profitable in Norway•Assumptions on electricity demand, particularly from energy intensive, are important•Imports covers up electricity balance
8
Finansdepartementet
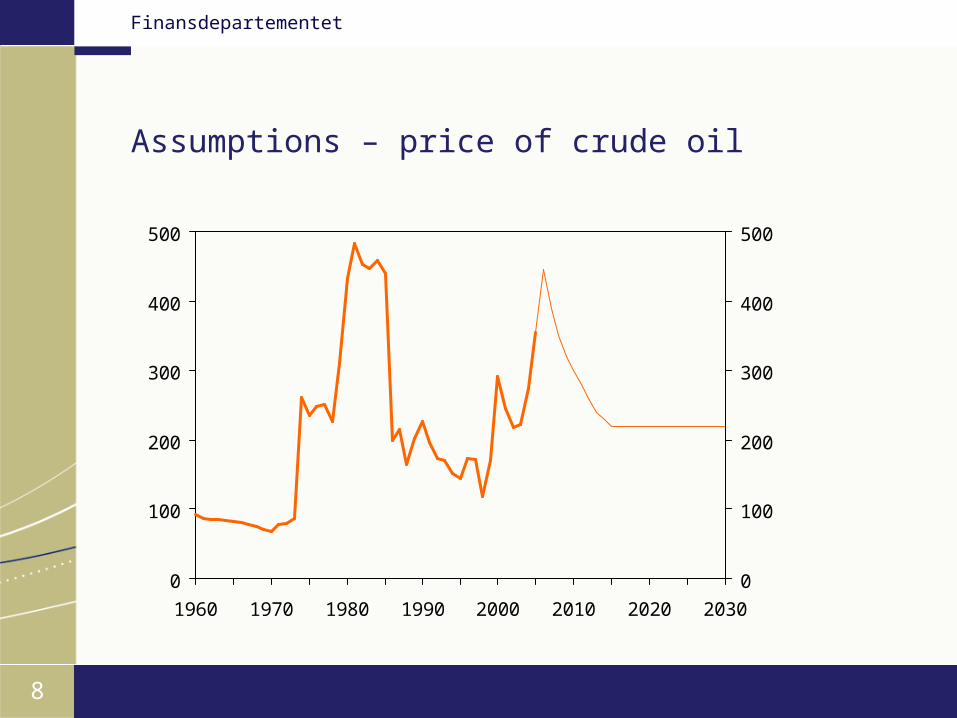
Assumptions – price of crude oil
0
100
200
300
400
500
1960 1970 1980 1990 2000 2010 2020 2030
0
100
200
300
400
500
9
Finansdepartementet
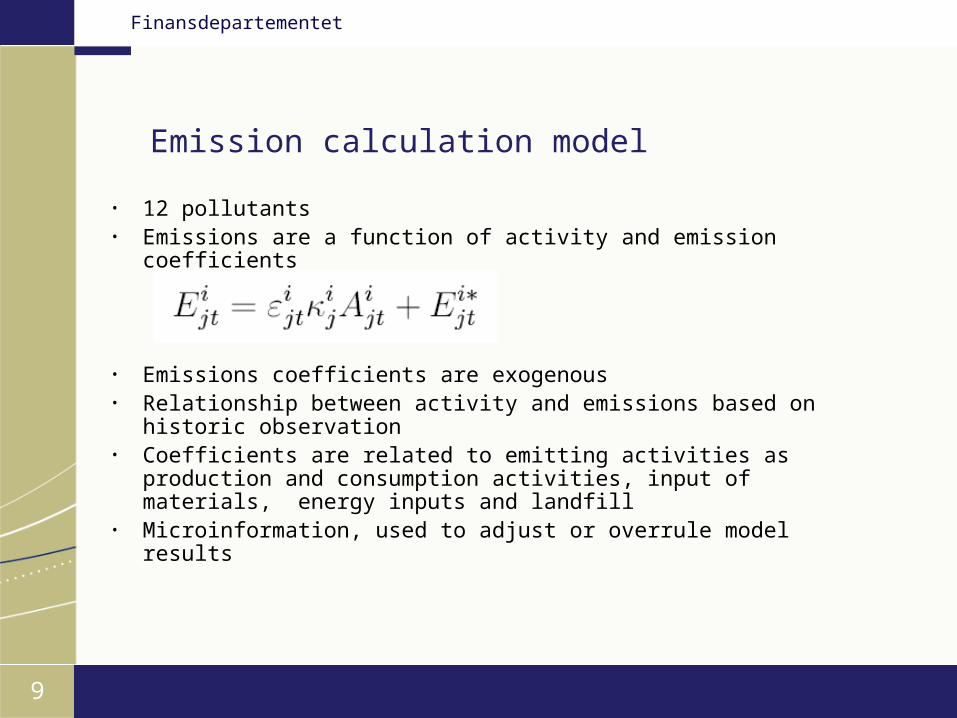
Emission calculation model
• 12 pollutants• Emissions are a function of activity and emission coefficients
• Emissions coefficients are exogenous• Relationship between activity and emissions based on
historic observation• Coefficients are related to emitting activities as production
and consumption activities, input of materials, energy inputs and landfill
• Microinformation, used to adjust or overrule model results
10
Finansdepartementet
Emission model..cont.
• Statistics Norway develop and update the Emission calculation model in collaboration with The Norwegian State Pollution Control
• Emission calculation model are updated on the basis of historical emission data and takes into account the effects of adopted environmental policies, technological change etc.
• Update of model is done every fourth or fifth year
11
Finansdepartementet
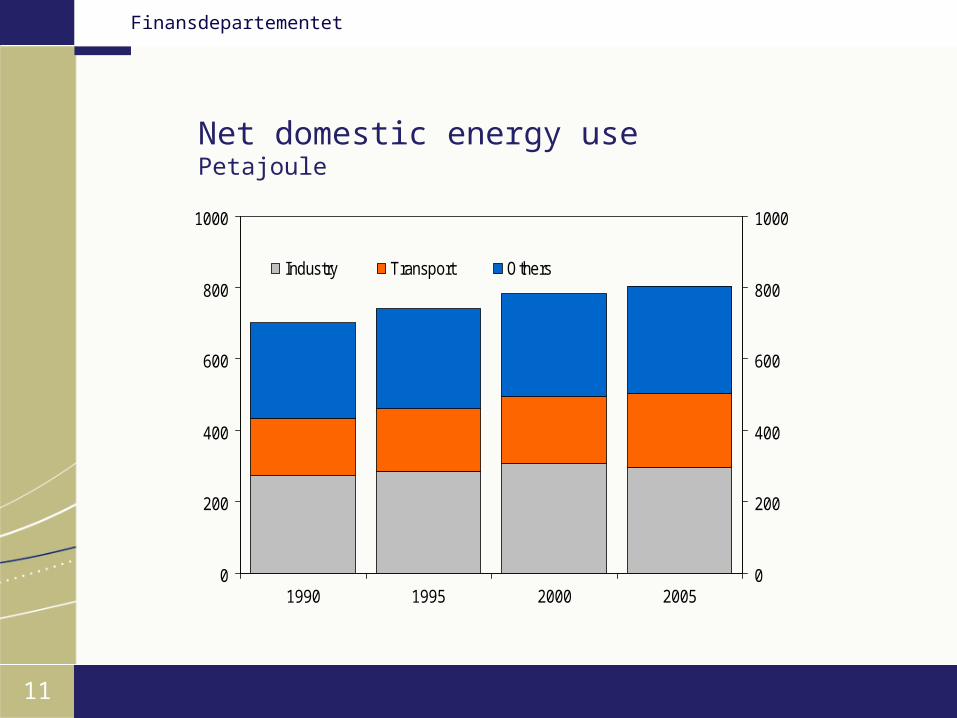
Net domestic energy usePetajoule
0
200
400
600
800
1000
1990 1995 2000 20050
200
400
600
800
1000
Industry Transport Others

12
Finansdepartementet
Energy use in Norway. 2005Petajoule
0
50
100
150
200
250
Energyproducers
Energyintensive
manufacturing
Woodprocessing
Other industry Primary andserviceindustry
Households Transport0
50
100
150
200
250
Coal, coke Gas
Petroleum products Bio energy
Electricity Remote heating
13
Finansdepartementet
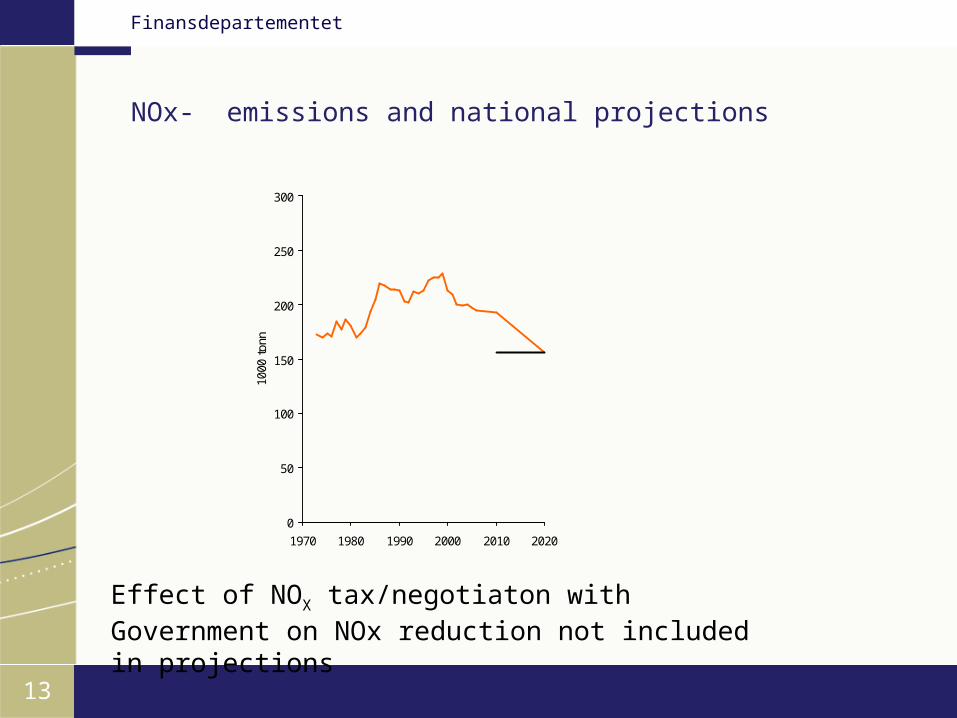
NOx- emissions and national projections
Effect of NOX tax/negotiaton with Government on NOx reduction not included in projections
0
50
100
150
200
250
300
1970 1980 1990 2000 2010 2020
1000
ton
n

14
Finansdepartementet
Challenges• Conflict of interest: Economic projections versus emission
projections (level of aggregation)• Intersection between macro and micro level in the medium
term• Scenario analyses – definition of BAU ? • How to deal with ”voluntary agreements” in projections and
scenarios when measures and emission reductions would be achieved anyway?
• Reporting issues- Compiling energy projections from emission projections for
various formats Level of details
15
Finansdepartementet
Summing up
• Emissions projections consistent with overall macroeconomic projections
• Combination of a top down and a buttom up approach
• Macroapproach to emissions mainly driven by energy use
• Microaproach: non- CO2, GHG- emissions processing industry road traffic petroleum sector
• Micro level and micro information more relevant and available for medium term than long term