Embed Size (px)
Citation preview
1
CLIMATE CHANGECLIMATE CHANGE
Assoc. prof. Jānis ZaļoksnisAssoc. prof. Jānis Zaļoksnis
2
The United Nations Framework Convention on Climate ChangeThe United Nations Framework Convention on Climate Change
The United Nations Framework Convention on Climate Change (UNFCCC) is an international environmental treaty produced at the UN Conference on Environment and Development (UNCED), held in Rio de Janeiro from June 3 to 14, 1992.
The objective of the treaty is to stabilize greenhouse gas concentrations in the atmosphere at a level that would prevent dangerous anthropogenic interference with the climate system.
The treaty itself set no mandatory limits on greenhouse gas emissions for individual countries and contains no enforcement mechanisms. In that sense, the treaty is considered legally non-binding.
Instead, the treaty provides for updates (called "protocols") that would set mandatory emission limits. The principal update is the Kyoto Protocol (1997), which concluded and established legally binding obligations for developed countries to reduce their greenhouse gas emissions.
As of 2011, UNFCCC has been signed by 194 parties (countries).One of its first tasks was to establish national greenhouse gas inventories of greenhouse
gas (GHG) emissions and removals, which were used to create the 1990 benchmark levels for accession of Annex I countries to the Kyoto Protocol and for the commitment of those countries to GHG reductions.
3
The United Nations Framework Convention on Climate ChangeThe United Nations Framework Convention on Climate Change
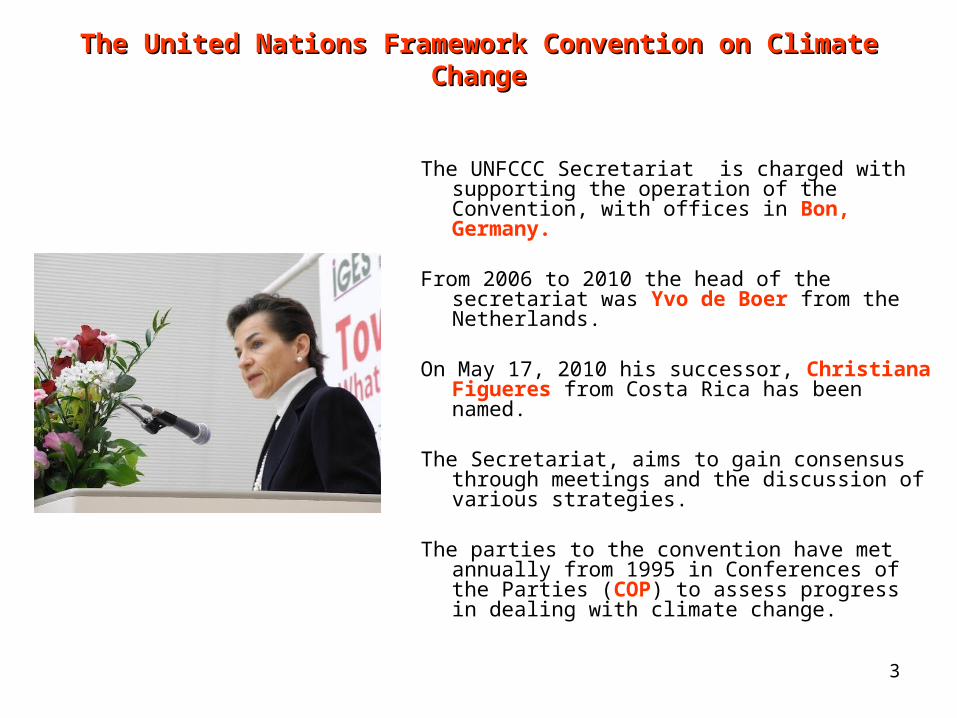
The UNFCCC Secretariat is charged with supporting the operation of the Convention, with offices in Bon, Germany.
From 2006 to 2010 the head of the secretariat was Yvo de Boer from the Netherlands.
On May 17, 2010 his successor, Christiana Figueres from Costa Rica has been named.
The Secretariat, aims to gain consensus through meetings and the discussion of various strategies.
The parties to the convention have met annually from 1995 in Conferences of the Parties (COP) to assess progress in dealing with climate change.
4
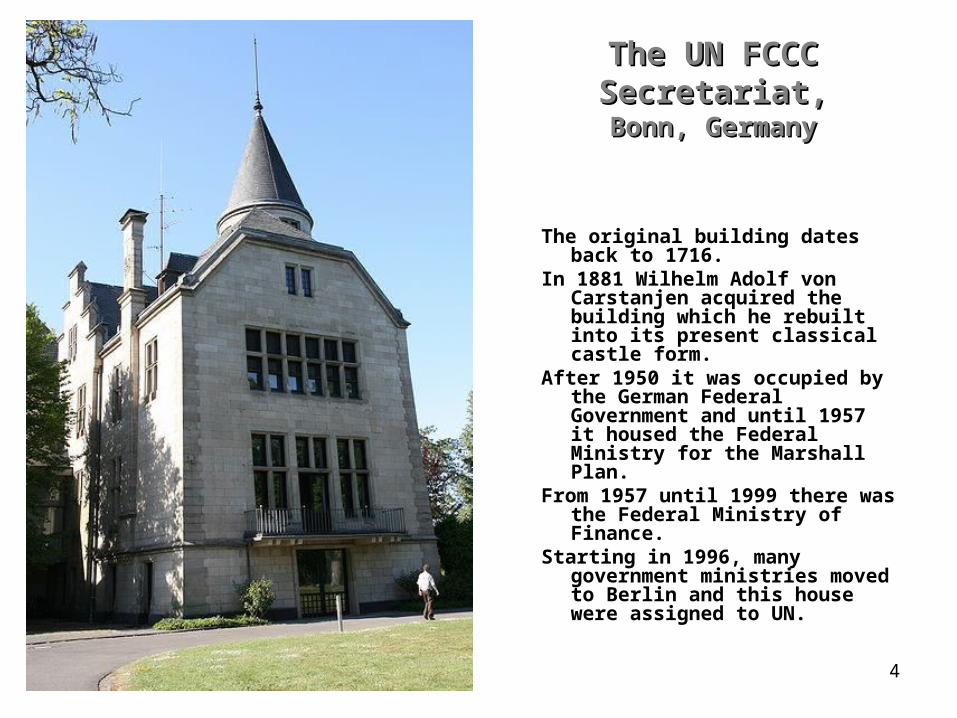
The UN FCCC Secretariat,The UN FCCC Secretariat,Bonn, GermanyBonn, Germany
The original building dates back to 1716.
In 1881 Wilhelm Adolf von Carstanjen acquired the building which he rebuilt into its present classical castle form.
After 1950 it was occupied by the German Federal Government and until 1957 it housed the Federal Ministry for the Marshall Plan.
From 1957 until 1999 there was the Federal Ministry of Finance.
Starting in 1996, many government ministries moved to Berlin and this house were assigned to UN.
5
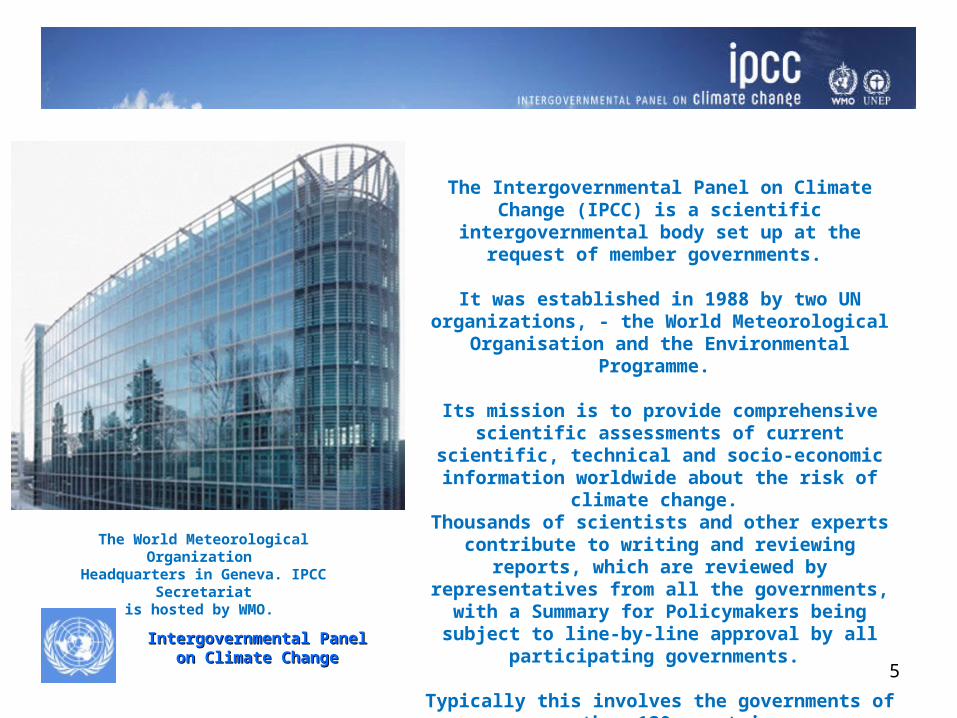
The Intergovernmental Panel on Climate Change (IPCC) is a scientific intergovernmental body set up
at the request of member governments.
It was established in 1988 by two UN organizations, - the World Meteorological Organisation and the
Environmental Programme.
Its mission is to provide comprehensive scientific assessments of current scientific, technical and
socio-economic information worldwide about the risk of climate change.
Thousands of scientists and other experts contribute to writing and reviewing reports, which are reviewed by representatives from all the governments, with a Summary for Policymakers being subject to line-by-
line approval by all participating governments.
Typically this involves the governments of more than 120 countries.
The World Meteorological Organization Headquarters in Geneva. IPCC Secretariat
is hosted by WMO.
Intergovernmental PanelIntergovernmental Panel on Climate Changeon Climate Change
6
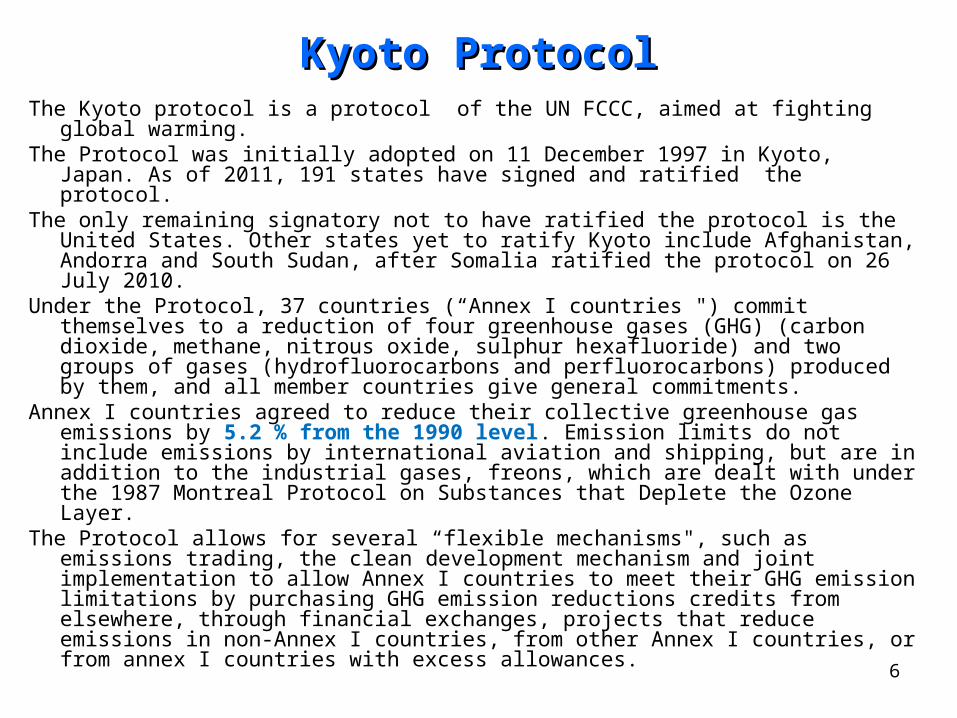
Kyoto ProtocolKyoto ProtocolThe Kyoto protocol is a protocol of the UN FCCC, aimed at fighting global warming. The Protocol was initially adopted on 11 December 1997 in Kyoto, Japan. As of
2011, 191 states have signed and ratified the protocol.The only remaining signatory not to have ratified the protocol is the United States.
Other states yet to ratify Kyoto include Afghanistan, Andorra and South Sudan, after Somalia ratified the protocol on 26 July 2010.
Under the Protocol, 37 countries (“Annex I countries ") commit themselves to a reduction of four greenhouse gases (GHG) (carbon dioxide, methane, nitrous oxide, sulphur hexafluoride) and two groups of gases (hydrofluorocarbons and perfluorocarbons) produced by them, and all member countries give general commitments.
Annex I countries agreed to reduce their collective greenhouse gas emissions by 5.2 % from the 1990 level. Emission limits do not include emissions by international aviation and shipping, but are in addition to the industrial gases, freons, which are dealt with under the 1987 Montreal Protocol on Substances that Deplete the Ozone Layer.
The Protocol allows for several “flexible mechanisms", such as emissions trading, the clean development mechanism and joint implementation to allow Annex I countries to meet their GHG emission limitations by purchasing GHG emission reductions credits from elsewhere, through financial exchanges, projects that reduce emissions in non-Annex I countries, from other Annex I countries, or from annex I countries with excess allowances.

7
Participation in the Kyoto ProtocolParticipation in the Kyoto Protocol
Green = Countries that have signed and ratified the treaty (Annex I & II countries in dark green).Grey = Countries that have not yet decided.Brown = No intention to ratify at this stage.
8
9
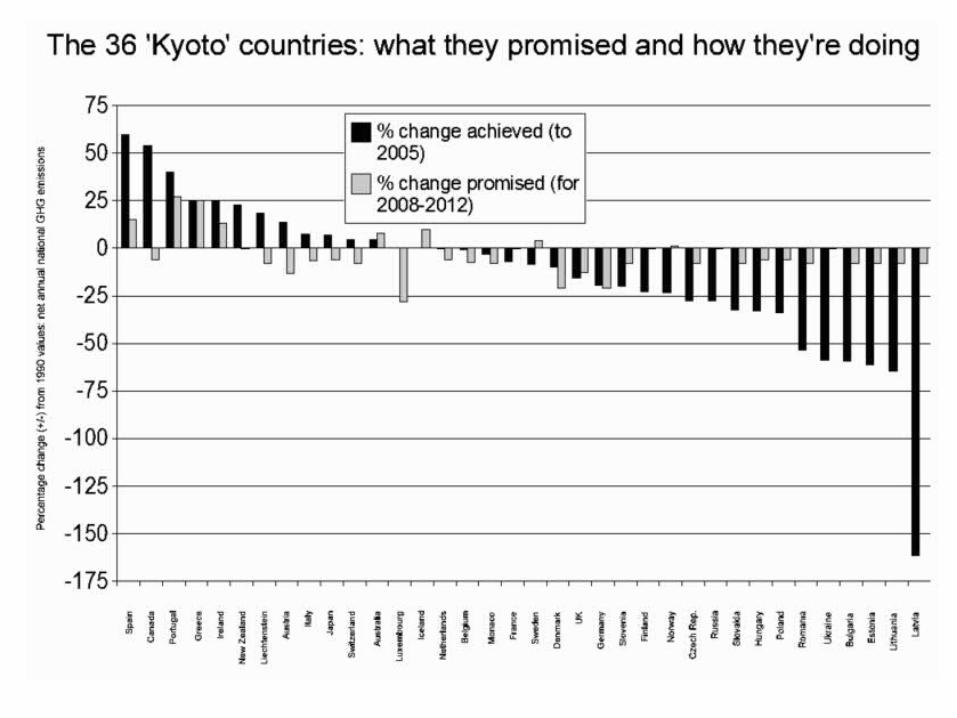
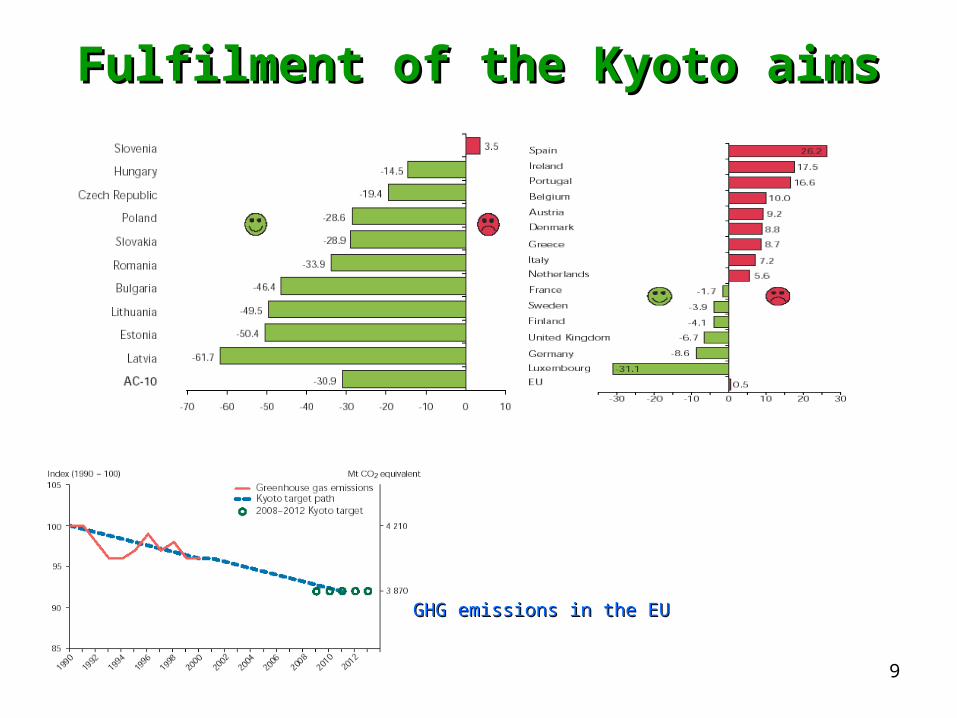
Fulfilment of the Kyoto aimsFulfilment of the Kyoto aims
GHG emissions in the EUGHG emissions in the EU

10
Kyoto is intended to cut global emissions of Kyoto is intended to cut global emissions of greenhouse gasesgreenhouse gases

11
Ranking of the world's top ten emitters of GHGRanking of the world's top ten emitters of GHG’’ss The first figure is the country's or region's emissions as a percentage of the global total. The second
figure is the country's/region's per-capita emissions, in units of tons of GHG per-capita.
1. China – 17%, 5.8 2. United States – 16%, 24.1 3. European Union – 11%, 10.6 4. Indonesia – 6%, 12.9 5. India – 5%, 2.1 6. Russia – 5%, 14.9 7. Brazil – 4%, 10.0 8. Japan – 3%, 10.6 9. Canada – 2%, 23.2 10. Mexico – 2%, 6.4
12
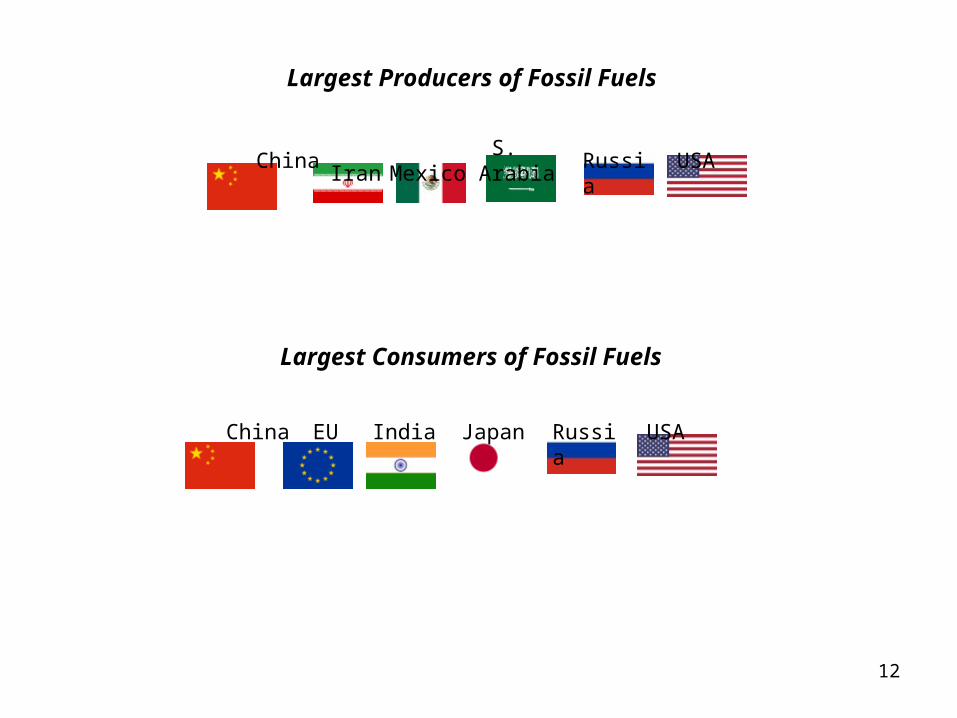
Largest Producers of Fossil Fuels
Largest Consumers of Fossil Fuels
China Iran Mexico S. Arabia Russia USA
China EU India Japan Russia USA
13
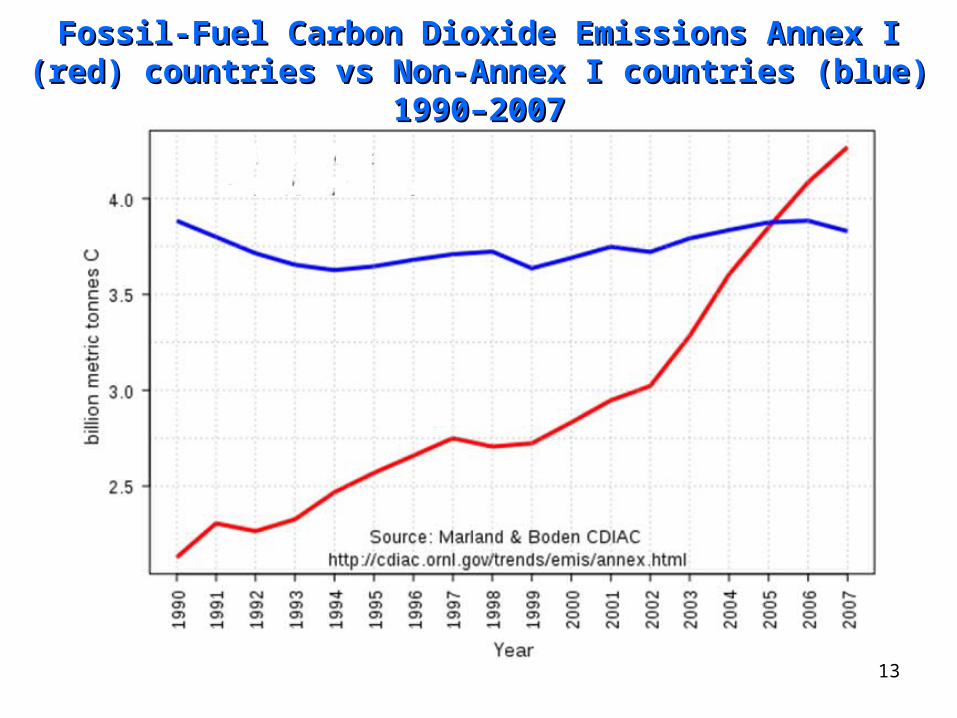
Fossil-Fuel Carbon Dioxide Emissions Annex I (red) Fossil-Fuel Carbon Dioxide Emissions Annex I (red) countries vs Non-Annex I countries (blue) 1990–2007countries vs Non-Annex I countries (blue) 1990–2007

14
India’s Prime Minister Manmohan Singh (blue) and Indian Minister of Environment and Forests Jaraim Ramesh (behind) during a multilateral meeting with U.S. President Barack Obama, Chinese Premier Wen Jiabao, Brazilian President Lula da Silva and South African President Jacob Zuma at
the United Nations Climate Change Conference.
Connie Hedegaard, former President of the UN Climate Change
Conference 2009 in Copenhagen. Now EU commissioner for Climate
Action.

15
Information
Date: 29 Nov.–10 Dec. 2010
Location: Cancun, Mexico
Participants: UN FCCC member countries
COP-16 decides:COP-16 decides:- to strengthen in relation to a global average temperature rise of 1.5°C,
- to shift paradigm towards building a low-carbon society, - to look forward to a second commitment period for the Kyoto Protocol,
- to provide resources, approaching USD 30 billion for the period 2010-2012,- to affirm a goal of mobilizing jointly USD 100 billion per year by 2020 to address the needs of developing countries,
- to establish a Green Climate Fund, to be designated as an operating entity of the financial mechanism of the Convention,- to establish a Technology Mechanism, which will consist of a Technology Mechanism Committee, a Climate Technology
Centre and Network.
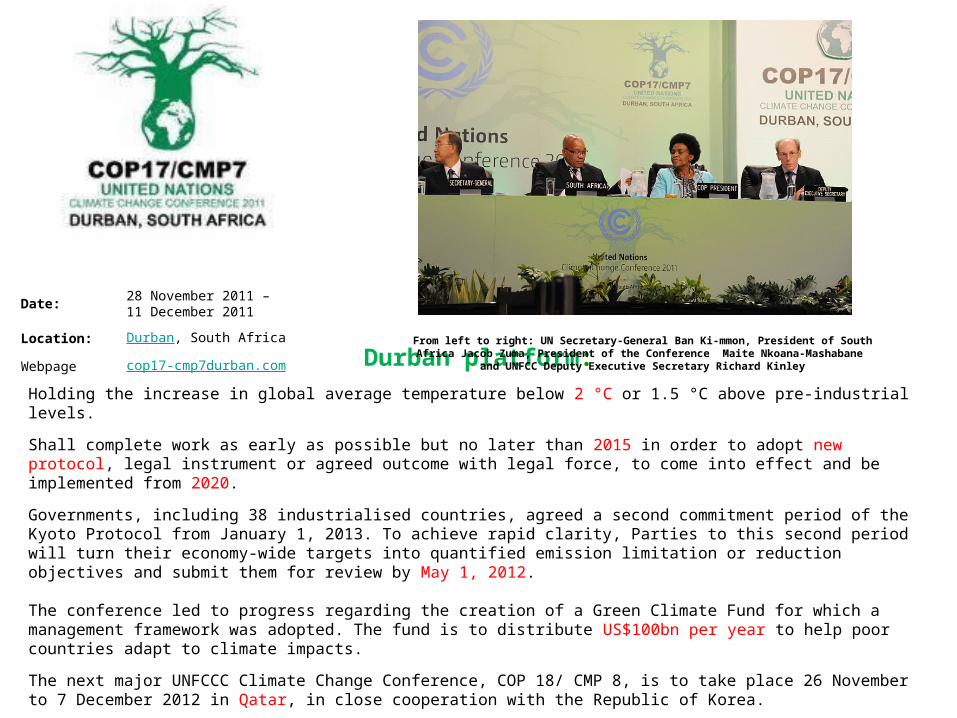
Durban platform:
Holding the increase in global average temperature below 2 °C or 1.5 °C above pre-industrial levels.
Shall complete work as early as possible but no later than 2015 in order to adopt new protocol, legal instrument or agreed outcome with legal force, to come into effect and be implemented from 2020.
Governments, including 38 industrialised countries, agreed a second commitment period of the Kyoto Protocol from January 1, 2013. To achieve rapid clarity, Parties to this second period will turn their economy-wide targets into quantified emission limitation or reduction objectives and submit them for review by May 1, 2012.
The conference led to progress regarding the creation of a Green Climate Fund for which a management framework was adopted. The fund is to distribute US$100bn per year to help poor countries adapt to climate impacts.
The next major UNFCCC Climate Change Conference, COP 18/ CMP 8, is to take place 26 November to 7 December 2012 in Qatar, in close cooperation with the Republic of Korea.
Date:28 November 2011 –11 December 2011
Location: Durban, South Africa
Webpage cop17-cmp7durban.com
From left to right: UN Secretary-General Ban Ki-mmon, President of South Africa Jacob Zuma, President of the Conference Maite Nkoana-Mashabane and UNFCC Deputy
Executive Secretary Richard Kinley
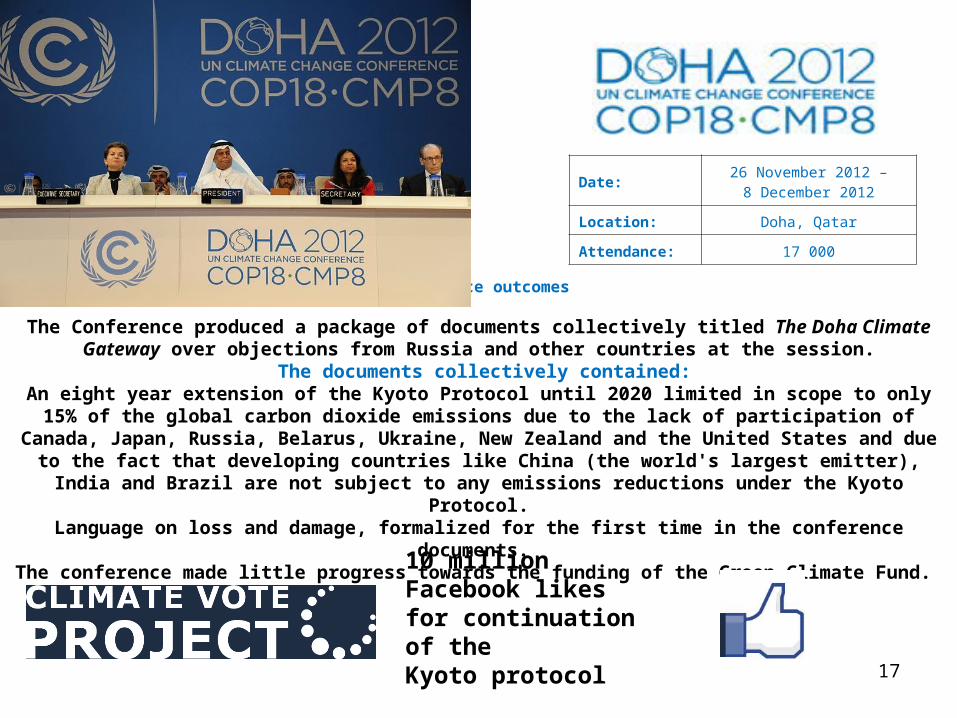
Conference outcomes
The Conference produced a package of documents collectively titled The Doha Climate Gateway over objections from Russia and other countries at the session.
The documents collectively contained:An eight year extension of the Kyoto Protocol until 2020 limited in scope to only 15% of the global carbon dioxide
emissions due to the lack of participation of Canada, Japan, Russia, Belarus, Ukraine, New Zealand and the United States and due to the fact that developing countries like China (the world's largest emitter), India and Brazil are not subject to
any emissions reductions under the Kyoto Protocol.Language on loss and damage, formalized for the first time in the conference documents.
The conference made little progress towards the funding of the Green Climate Fund.
17
Date:26 November 2012 –
8 December 2012
Location: Doha, Qatar
Attendance: 17 000
10 million Facebook likesfor continuation of the Kyoto protocol

18
COP-19; COP-19; 11 - 22 Nov 201311 - 22 Nov 2013
The United Nations climate conference in Warsaw marked a step forward in the international fight against climate change.
The conference agreed a time-plan for countries to table their contributions to reducing or limiting greenhouse gas emissions under a new global climate agreement to be adopted in 2015. It also agreed
ways to accelerate efforts to deepen emission cuts over the rest of this decade, and to set up a mechanism to address losses and damage caused by climate change in vulnerable developing countries.
The National Stadium in Warsaw, the main venue of the conference
Over 10,000 participants from 189 countries have registered to attend the conference, but only 134 ministers announced participation. Four countries that are among the most vulnerable to climate change are represented by their president or prime minister: Tuvalu, Nauru, Ethiopia, and Tanzania.

19
Climate Change – Natural and Antrophogenic ProcessesClimate Change – Natural and Antrophogenic Processes
20
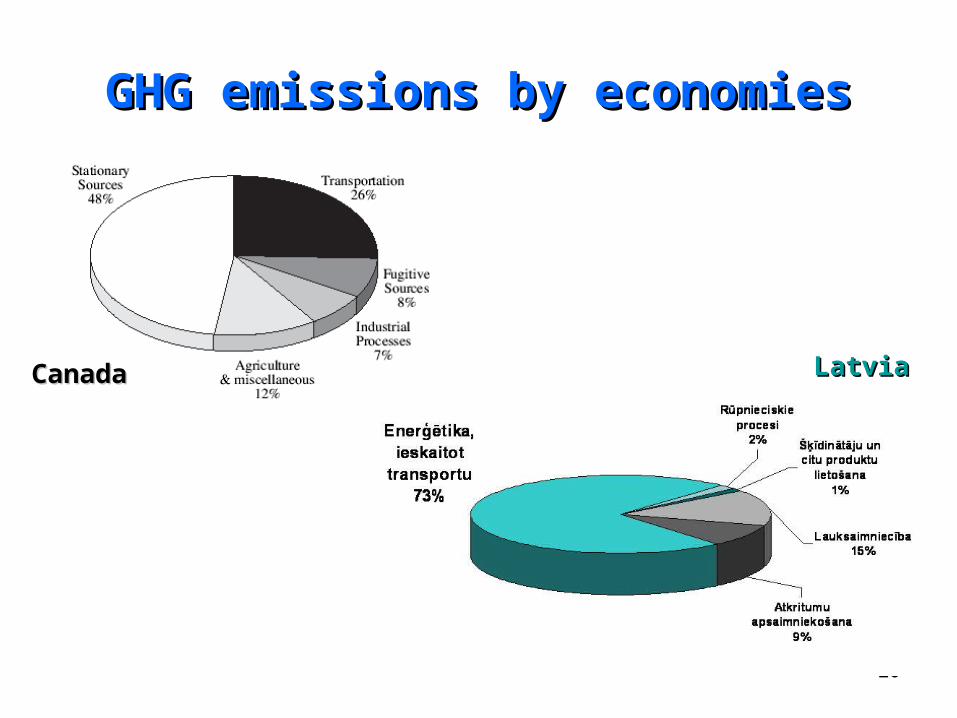
GHG emissions by economiesGHG emissions by economies
Linda Leja, 2005
CanadaCanada LatviaLatvia

22
GHG emissions per person in the WorldGHG emissions per person in the World

23
GLOBAL WARMINGGLOBAL WARMINGClimate is the statistical summary of weather and meteorological phenomena
and occurrences over a long period of time, ranging from a few years or decades to thousands of years.
Climate is expressed in averaged long-term atmospheric physical parameter values characteristic of the Earth as a whole (global climate) or of a specific territory (a country or region).
There is no doubt that human activities (air, water and soil pollution, overpopulation) do influence climate.
However, it is quite difficult to distinguish clearly and unambiguously the climate change processes stimulated by human activities from those that are part of natural development.
A sharp increase in the concentration of various gases in the atmosphere is indicative of the increase of anthropogenic influence.
It is evident that the concentrations of gases were considerably lower in the period when industrial production was not yet intense, while they have substantially increased during the last centuries.

24
A new climate study shows that since the mid-1950s, global average temperatures over land have risen by 0.9 degrees Celsius, confirming previous studies that have
found a climate that has been warming – in fits and starts – since around 1900.
Climate study confirms what sceptics scoffed at: global warming is real !Climate study confirms what sceptics scoffed at: global warming is real !The Christian Science Monitoring, 10/22/2011

25
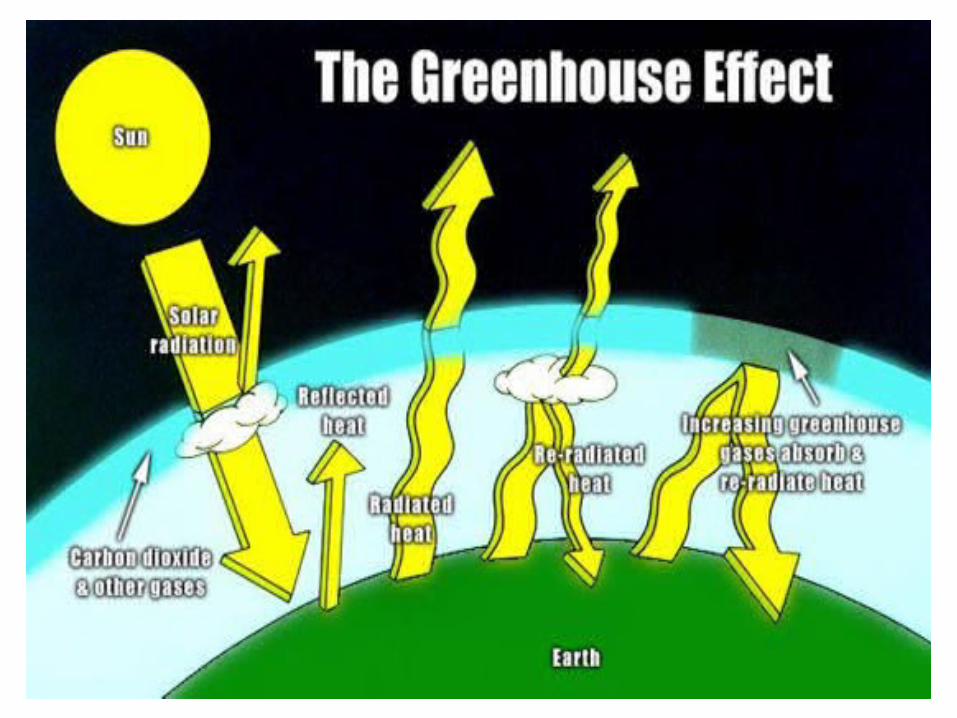
The greenhouse effect is a process by which thermal radiation from a planetary surface is absorbed by atmospheric greenhouse gases, and is re-radiated in all directions. Since part of this re-radiation is back towards the surface, energy is transferred to the surface and the lower atmosphere. As a result, the temperature there is higher than it would be if direct heating by solar radiation were the only warming mechanism.
Solar radiation at the high frequencies of visible light passes through the atmosphere to warm the planetary surface, which then emits this energy at the lower frequencies of infrared thermal radiation.
Infrared radiation is absorbed by greenhouse gases, which in turn re-radiate much of the energy to the surface and lower atmosphere.
The mechanism is named after the effect of solar radiation passing through glass and warming a greenhouse, but the way it retains heat is fundamentally different as a greenhouse works by reducing airflow, isolating the warm air inside the structure so that heat is not lost by convention.
The greenhouse effect was discovered by French mathematician Joseph Fourier in 1824, first reliably experimented on by British physicist John Tyndall in 1858, and first reported quantitatively by Swedish scientist Svante Arrhenius in 1896.
If an ideal thermally conductive blackbody was the same distance from the Sun as the Earth is, it would have a temperature of about 5.3 °C. However, since the Earth reflects about 30% of the incoming sunlight, the planet's effective temperature is about −18 °C, or 33°C below the actual surface temperature of about 15 °C.
The mechanism that produces this difference between the actual surface temperature and the effective temperature is due to the atmosphere and is known as the greenhouse effect.
Greenhouse effectGreenhouse effect

26
A representation of the exchanges of energy between the source (the Sun), the Earth's surface, the Earth's atmosphere, and the ultimate sink outer space. The ability of the atmosphere to capture and recycle energy
emitted by the Earth surface is the defining characteristic of the greenhouse effect.
Greenhouse effectGreenhouse effect
27

28
GREENHOUSE GASESGREENHOUSE GASESBy their percentage
contribution to the greenhouse effect on Earth the four major gases are:
- water vapour, 36–70%,- carbon dioxide, 9–26%,
- methane, 4–9%,- ozone, 3-7 %.
The major non-gas contributor to the Earth's greenhouse effect, clouds, also absorb and emit infrared radiation and thus have an effect on
radiative properties of the atmosphere.

29
Climate change is a significant and lasting change in the statistical distribution of weather patterns over periods ranging from decades to millions of years. It may be a change in average weather conditions or the distribution of events around that average (e.g., more or fewer extreme weather events). Climate change
may be limited to a specific region or may occur across the whole Earth.
The concentration of greenhouse gases has increased just within the last 500 years – especially with beginning with the industrial revolution and affecting climate change.
Consequently, the current climate change process could be untimely and unnatural, and it may also lead to many global climate problems that we already witness today.
The phrase ‘global warming’ denotes not only the increase of the Earth’s average temperature, usually measured as the average temperature per year, but also substantial changes in the entire climate system.
Top: Arid ice age climate.Middle: Atlantic Period, warm and wet.Bottom: Potential vegetation in climate now.

30
Variations in COVariations in CO22, temperature and dust from the , temperature and dust from the
VostokVostok ice core over the last 450,000 year ice core over the last 450,000 year
Vostok – a Russian Antarctic research station at the southern Pole of Cold, with the lowest reliably measured natural temperature on Earth of −89.2 °C

31
Increase in Atmospheric COIncrease in Atmospheric CO22 Levels Levels
32
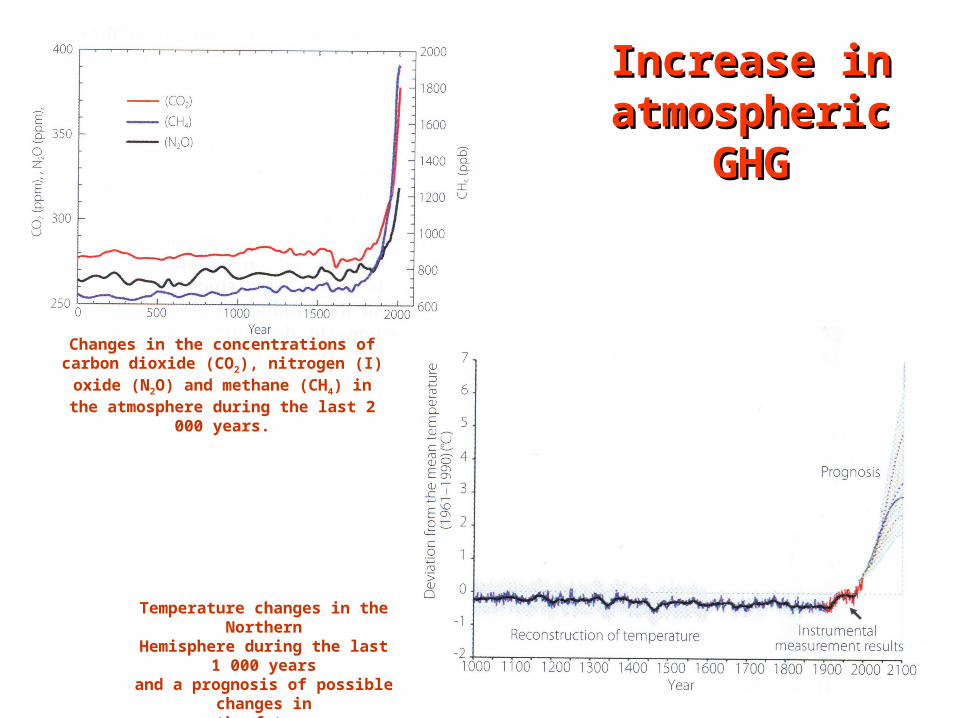
Increase in Increase in aatmospheric tmospheric
GHGGHG
Changes in the concentrations of carbon dioxide (CO2), nitrogen (I) oxide (N2O) and methane (CH4)
in the atmosphere during the last 2 000 years.
Temperature changes in the NorthernHemisphere during the last 1 000 yearsand a prognosis of possible changes in
the future.
33
ORBITAL VARIATIONSORBITAL VARIATIONSSlight variations in Earth's orbit lead to changes in the seasonal distribution
of sunlight reaching the Earth's surface and how it is distributed across the globe.
There is very little change to the area-averaged annually averaged sunshine; but there can be strong changes in the geographical and seasonal distribution.
The three types of orbital variations are variations in Earth's eccentricity, changes in the tilt angle of Earth’s axis of rotation, and precession of Earth's axis. Combined together, these produce Milankovitch cycles which have a large impact on climate and are notable for their correlation to glacial and interglacial periods, their correlation with the advance and retreat of the Sahara, and for their appearance in the stratigraphic record.
The IPPC notes that Milankovitch cycles drove the ice age cycles; CO2 followed temperature change "with a lag of some hundreds of years"; and that as a feedback amplified temperature change.
The depths of the ocean have a lag time in changing temperature (thermal inertia on such scale). Upon seawater temperature change, the solubility of CO2 in the oceans changed, as well as other factors impacting air-sea CO2 exchange.

34
Effects of apsidal precession on the seasonsEffects of apsidal precession on the seasons(tuvākais un tālākais attālums no Saules)(tuvākais un tālākais attālums no Saules)
35
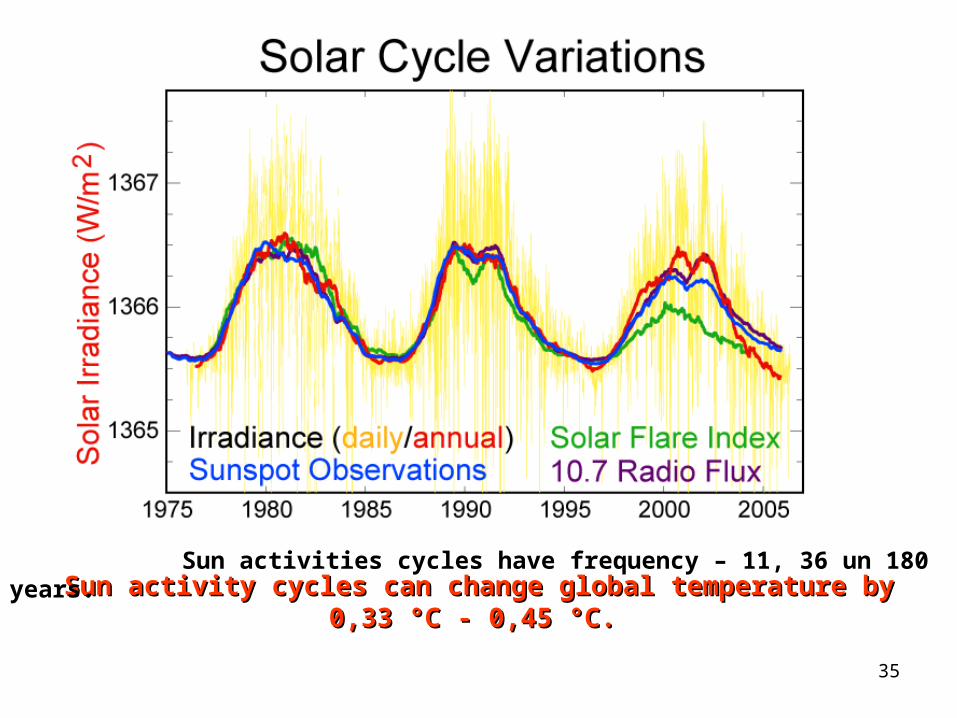
Sun activity cycles can change global temperature by 0,33 °C - 0,45 °C.Sun activity cycles can change global temperature by 0,33 °C - 0,45 °C.
Sun activities cycles have frequency – 11, 36 un 180 years.

36Circular orbit, no eccentricity Orbit with 0.5 eccentricity

37
In atmospheric temperature from 1979 to 2010, determined by NASA satellites, effects appear from aerosols released by major volcanic eruptions.
Volcanic eruptions release gases and particulates into the atmosphere. Eruptions large enough to affect climate occur on average several times per century, and cause cooling (by partially blocking the transmission of solar radiation to the Earth's surface) for a period of a few years.
The eruption of Moun Pinatubo in 1991, the second largest terrestrial eruption of the 20th century (after the 1912 eruption of Navarupta) affected the climate substantially. Global temperatures decreased by about 0.5 °C.
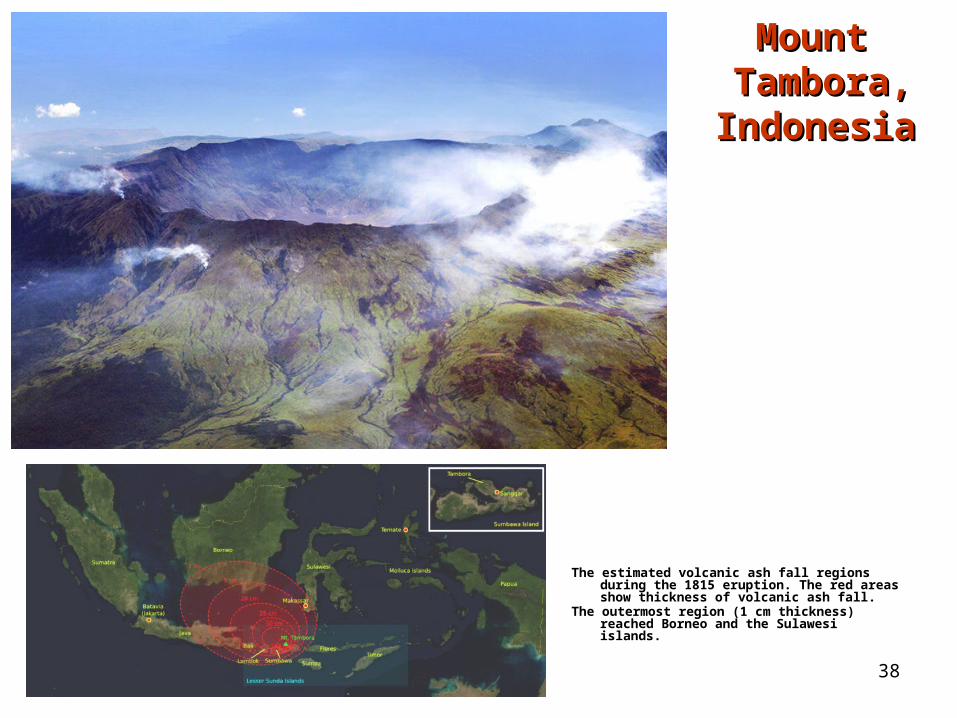
The eruption of Mount Tambora in 1815 caused the “Year Without a Summer”. Much larger eruptions, known as large igneous (vulkaniskas) provinces, occur only a few times every hundred million years, but may cause global warming and mass extinctions.
Volcanoes are also part of the extended carbon cycle. Over very long (geological) time periods, they release carbon dioxide from the Earth's crust and mantle, counteracting the uptake by sedimentary rocks and other geological carbon dioxide sinks.
The US Geological Survey estimates are that volcanic emissions are at a much lower level than the effects of current human activities, which generate 100-300 times the amount of carbon dioxide emitted by volcanoes.
A review of published studies indicates that annual volcanic emissions of carbon dioxide, including amounts released from mid-ocean ridges, volcanic arcs, and hot spot volcanoes, are only the equivalent of 3 to 5 days of human caused output.
The annual amount put out by human activities may be greater than the amount released by supereruptions, the most recent of which was the Toba eruption in Indonesia 74,000 years ago.
Although volcanoes are technically part of the lithosphere, which itself is part of the climate system, the IPCC explicitly defines volcanism as an external forcing agent.
VOLCANISMVOLCANISM
38
Mount Mount Tambora, Tambora, IndonesiaIndonesia
The estimated volcanic ash fall regions during the 1815 eruption. The red areas show thickness of volcanic ash fall.
The outermost region (1 cm thickness) reached Borneo and the Sulawesi islands.
39
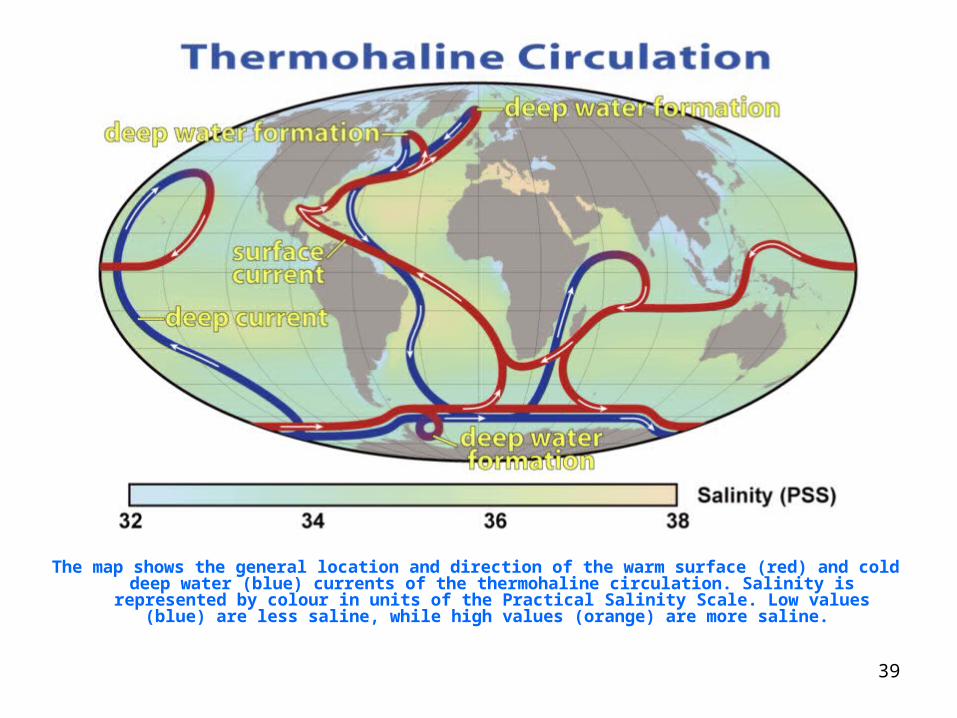
The map shows the general location and direction of the warm surface (red) and cold deep water (blue) currents of the thermohaline circulation. Salinity is represented by colour in units of the Practical Salinity Scale. Low values (blue) are less saline, while high values
(orange) are more saline.

40
In atmospheric temperature from 1979 to 2010, determined by NASA satellites, effects appear from aerosols released by major volcanic eruptions.

41
Evidence for climatic changeEvidence for climatic change
Comparisons between Asian Monsoons from 200 A.D. to 2000 A.D. (staying in the background on other plots), Northern Hemisphere temperature, Alpine glacier extent (vertically inverted as marked), and human history as
noted by the U.S.
42
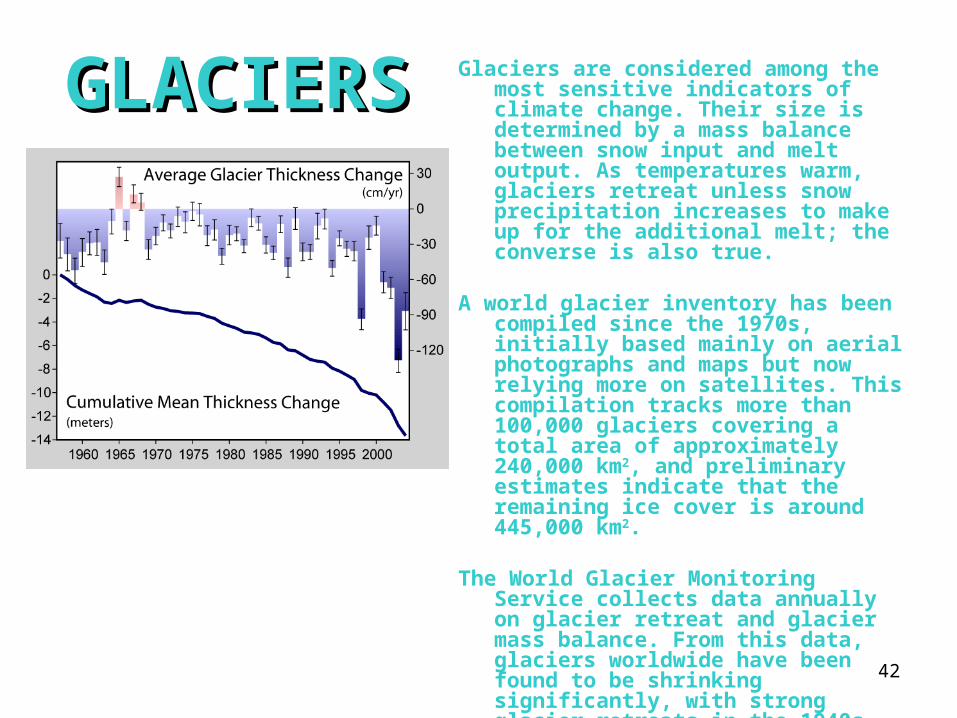
Glaciers are considered among the most sensitive indicators of climate change. Their size is determined by a mass balance between snow input and melt output. As temperatures warm, glaciers retreat unless snow precipitation increases to make up for the additional melt; the converse is also true.
A world glacier inventory has been compiled since the 1970s, initially based mainly on aerial photographs and maps but now relying more on satellites. This compilation tracks more than 100,000 glaciers covering a total area of approximately 240,000 km2, and preliminary estimates indicate that the remaining ice cover is around 445,000 km2.
The World Glacier Monitoring Service collects data annually on glacier retreat and glacier mass balance. From this data, glaciers worldwide have been found to be shrinking significantly, with strong glacier retreats in the 1940s, stable or growing conditions during the 1920s and 1970s, and again retreating from the mid 1980s to present.
GGLACIERSLACIERS

43
Aletsch Aletsch glacierglacier
The largest glacier of the Alps
(Bernese Alps), in Switzerland.
The retreat of Aletsch Glacier in in 1979, 1991 and 2002.

44
Melting of the mountain glaciers Whitechuck glacier, the Cascade Range, US.
1973.
2006, glacier retreat by 1,9 km.
45
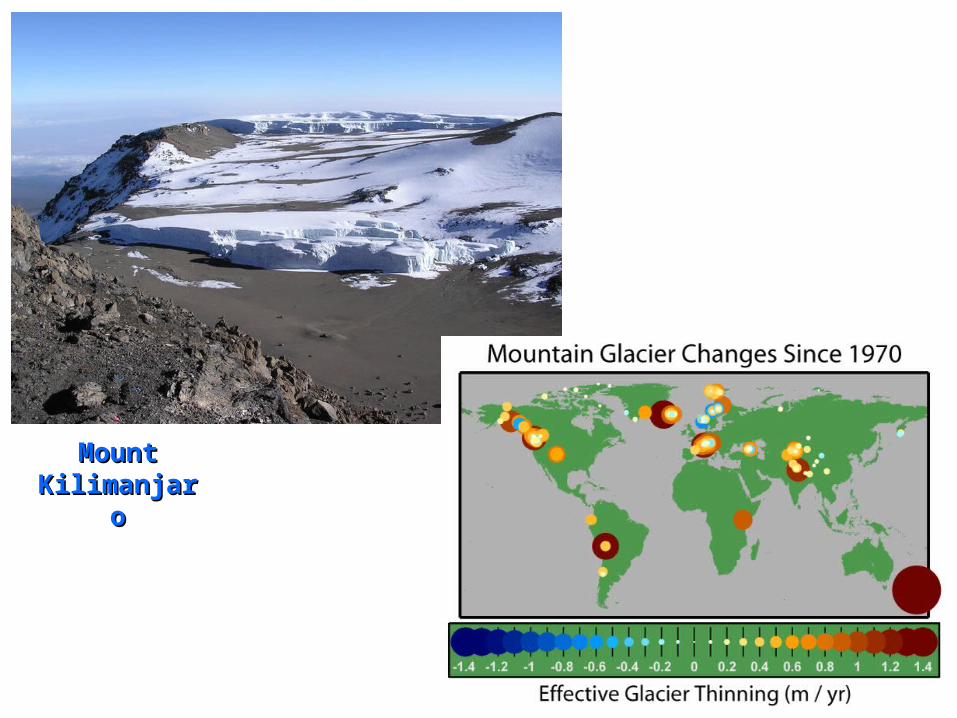
Mount Mount KilimanjaroKilimanjaro
46

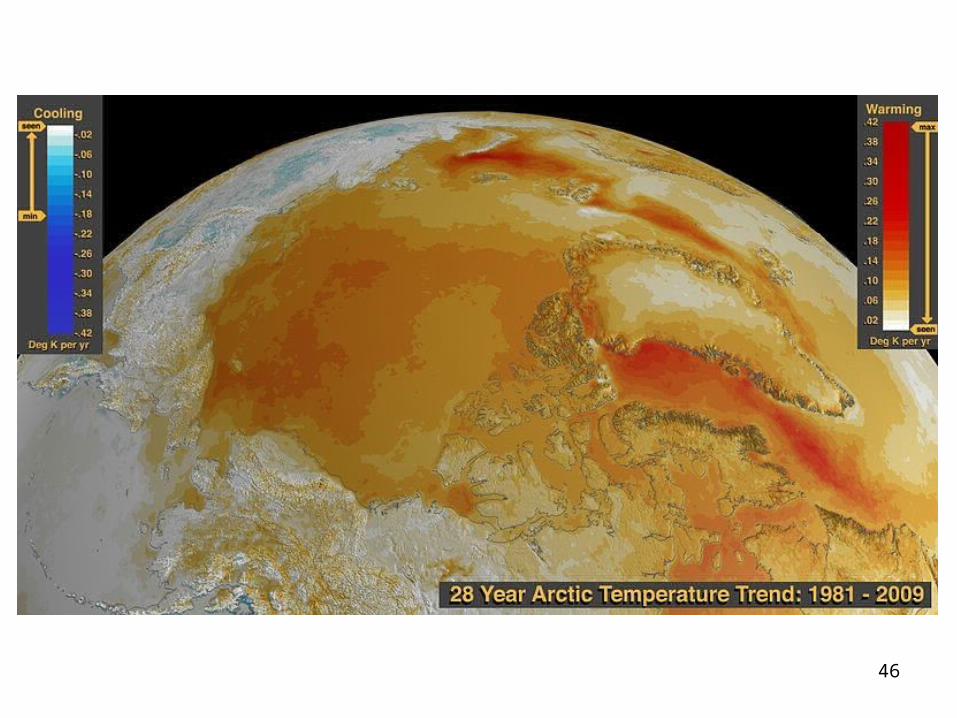
47Arctic sea ice loss
48
ClimateClimate ChangesChanges
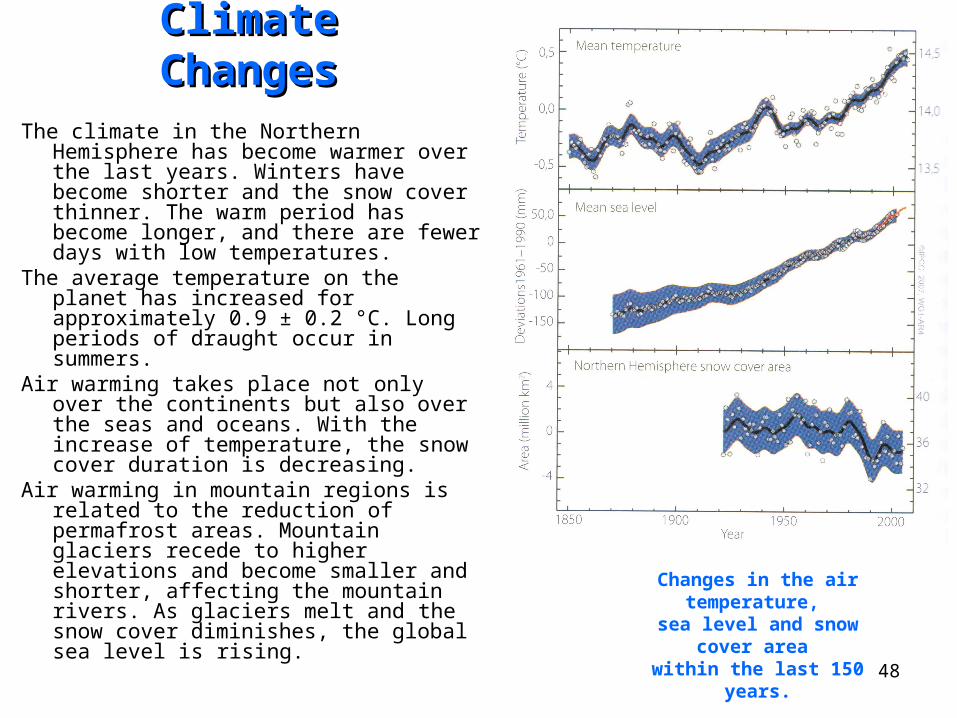
The climate in the Northern Hemisphere has become warmer over the last years. Winters have become shorter and the snow cover thinner. The warm period has become longer, and there are fewer days with low temperatures.
The average temperature on the planet has increased for approximately 0.9 ± 0.2 °C. Long periods of draught occur in summers.
Air warming takes place not only over the continents but also over the seas and oceans. With the increase of temperature, the snow cover duration is decreasing.
Air warming in mountain regions is related to the reduction of permafrost areas. Mountain glaciers recede to higher elevations and become smaller and shorter, affecting the mountain rivers. As glaciers melt and the snow cover diminishes, the global sea level is rising.
Changes in the air temperature, sea level and snow cover area
within the last 150 years.
49
ClimateClimate ChangesChanges
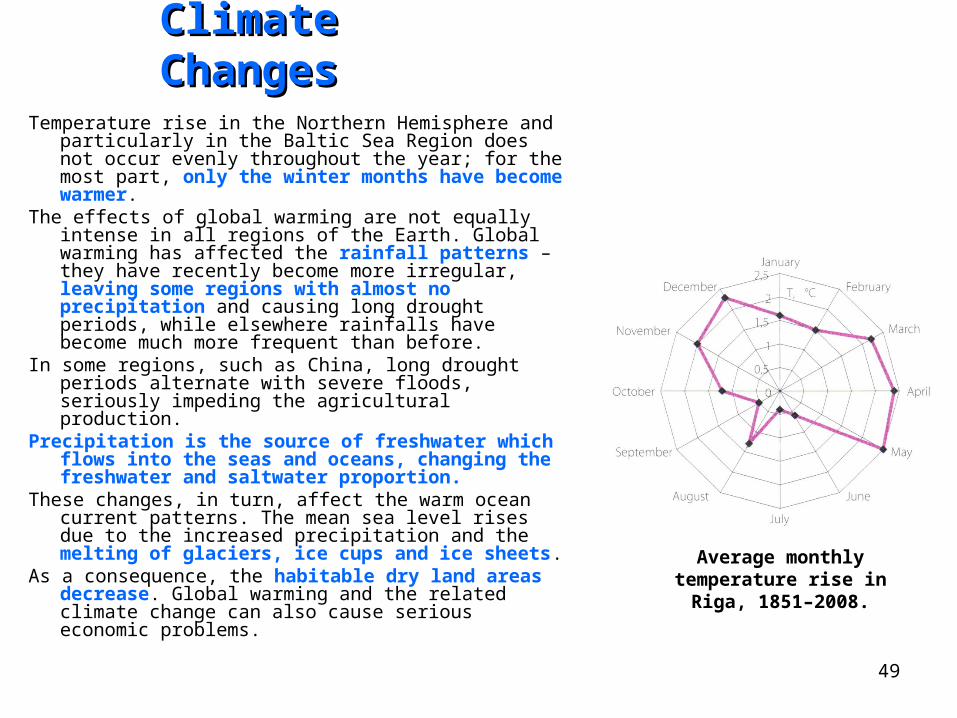
Temperature rise in the Northern Hemisphere and particularly in the Baltic Sea Region does not occur evenly throughout the year; for the most part, only the winter months have become warmer.
The effects of global warming are not equally intense in all regions of the Earth. Global warming has affected the rainfall patterns – they have recently become more irregular, leaving some regions with almost no precipitation and causing long drought periods, while elsewhere rainfalls have become much more frequent than before.
In some regions, such as China, long drought periods alternate with severe floods, seriously impeding the agricultural production.
Precipitation is the source of freshwater which flows into the seas and oceans, changing the freshwater and saltwater proportion.
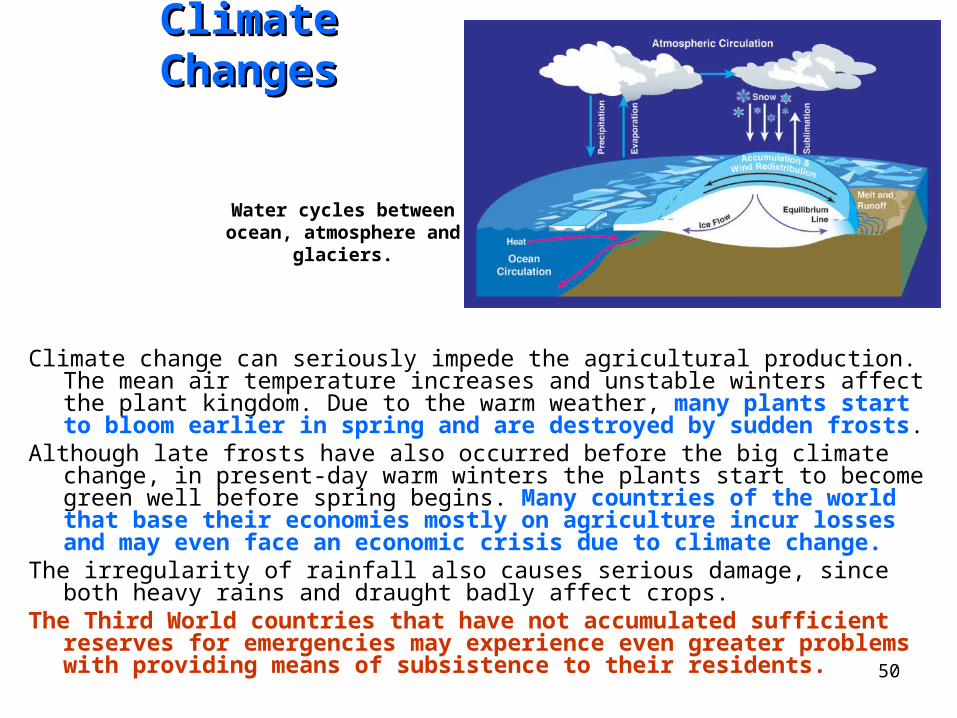
These changes, in turn, affect the warm ocean current patterns. The mean sea level rises due to the increased precipitation and the melting of glaciers, ice cups and ice sheets.
As a consequence, the habitable dry land areas decrease. Global warming and the related climate change can also cause serious economic problems.
Average monthly temperature rise in Riga, 1851–2008.
50
ClimateClimate ChangesChanges
Climate change can seriously impede the agricultural production. The mean air temperature increases and unstable winters affect the plant kingdom. Due to the warm weather, many plants start to bloom earlier in spring and are destroyed by sudden frosts.
Although late frosts have also occurred before the big climate change, in present-day warm winters the plants start to become green well before spring begins. Many countries of the world that base their economies mostly on agriculture incur losses and may even face an economic crisis due to climate change.
The irregularity of rainfall also causes serious damage, since both heavy rains and draught badly affect crops.
The Third World countries that have not accumulated sufficient reserves for emergencies may experience even greater problems with providing means of subsistence to their residents.
Water cycles between ocean, atmosphere and glaciers.

51
UN IPPC alternativeUN IPPC alternative models for the prospective models for the prospective development of societydevelopment of society and climate changeand climate change
▪ Scenario A1 (“zero” growth). Greenhouse gas concentration in the atmosphere remains at the level of year 2000; there is no economic and population growth, and climate change is driven by the climate system inertia only.
▪ Scenario B1 (sustainable development). Natural growth continues until the middle of the 21st century, then the population declines; the economic development continues.
▪ Scenario A2 (“everything goes on as before”). This scenario describes a differentiated world, in which each nation relies on its own powers and resources; the population is constantly growing; economic development is regionally-oriented.
Scenario A1B (technological progress). This scenario describes a world of rapid economic development, population growth and technological progress that allows to reduce the consumption of material resources.
52
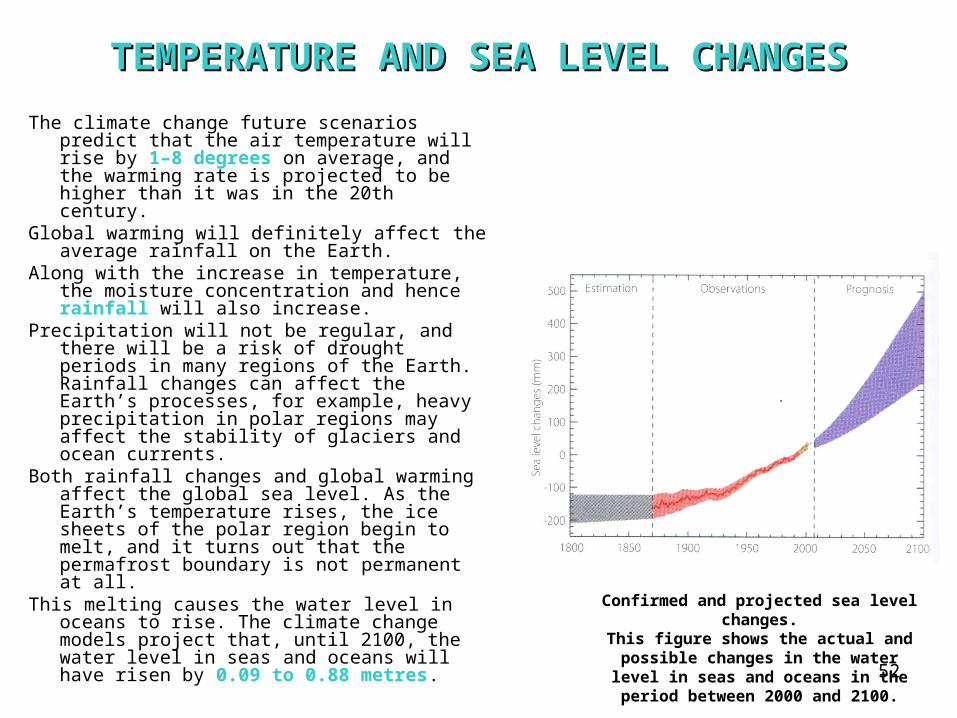
TEMPERATURE AND SEA LEVEL CHANGESTEMPERATURE AND SEA LEVEL CHANGES
The climate change future scenarios predict that the air temperature will rise by 1–8 degrees on average, and the warming rate is projected to be higher than it was in the 20th century.
Global warming will definitely affect the average rainfall on the Earth.
Along with the increase in temperature, the moisture concentration and hence rainfall will also increase.
Precipitation will not be regular, and there will be a risk of drought periods in many regions of the Earth. Rainfall changes can affect the Earth’s processes, for example, heavy precipitation in polar regions may affect the stability of glaciers and ocean currents.
Both rainfall changes and global warming affect the global sea level. As the Earth’s temperature rises, the ice sheets of the polar region begin to melt, and it turns out that the permafrost boundary is not permanent at all.
This melting causes the water level in oceans to rise. The climate change models project that, until 2100, the water level in seas and oceans will have risen by 0.09 to 0.88 metres.
Confirmed and projected sea level changes.This figure shows the actual and possible changes
in the water level in seas and oceans in the period between 2000 and 2100.

53
54
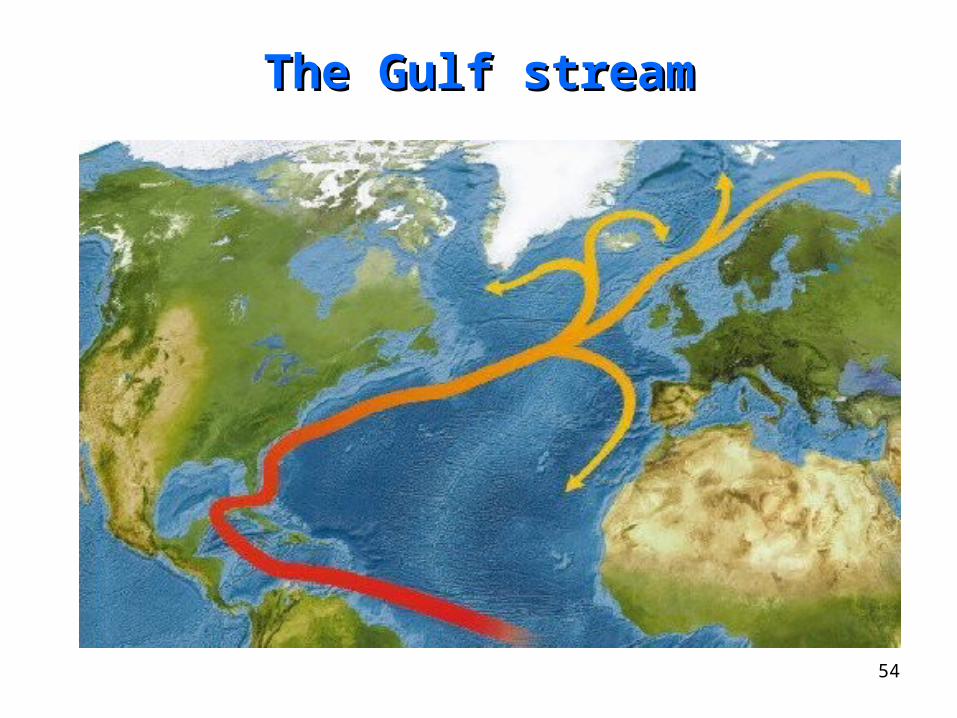
The Gulf streamThe Gulf stream

55
COCO2 2 emissionsemissions
2000. 2000.
2025. 2025.

56
TemperatureTemperatureand and
precipitationprecipitationchange bychange by
2050. 2050.
57
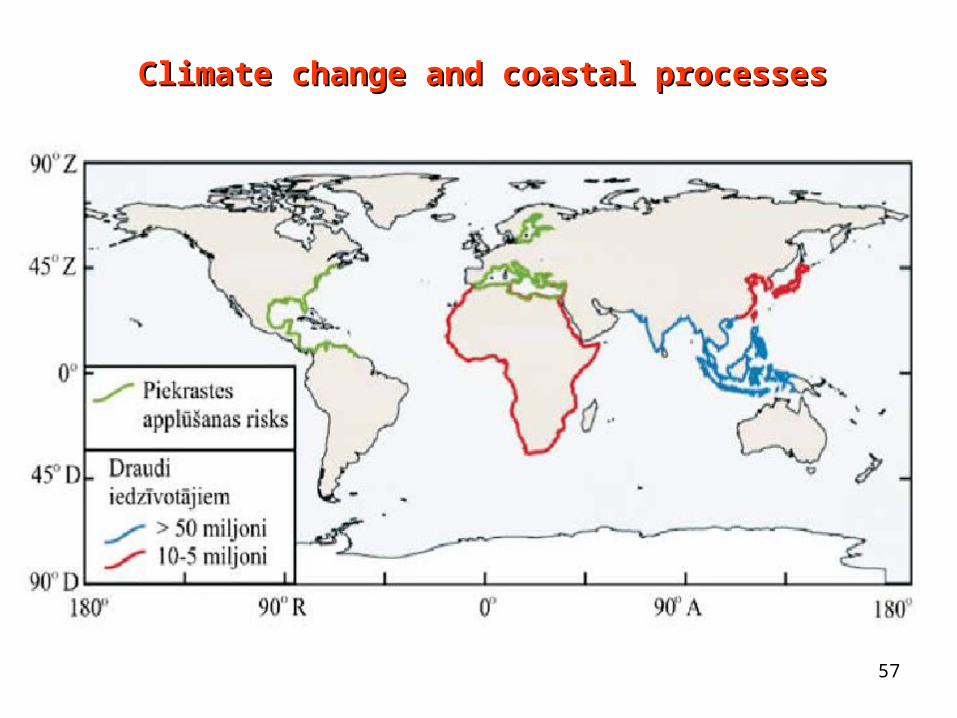
Climate change and coastal processesClimate change and coastal processes

58
Climate change and Climate change and productivity of productivity of
agricultural species agricultural species

59
Average annual temperature in the Baltic Sea region: Average annual temperature in the Baltic Sea region: (A) – (1961.– 2000.); (B) – 2100.(A) – (1961.– 2000.); (B) – 2100.

60
Global Climate Change in the WorldGlobal Climate Change in the World
61
62
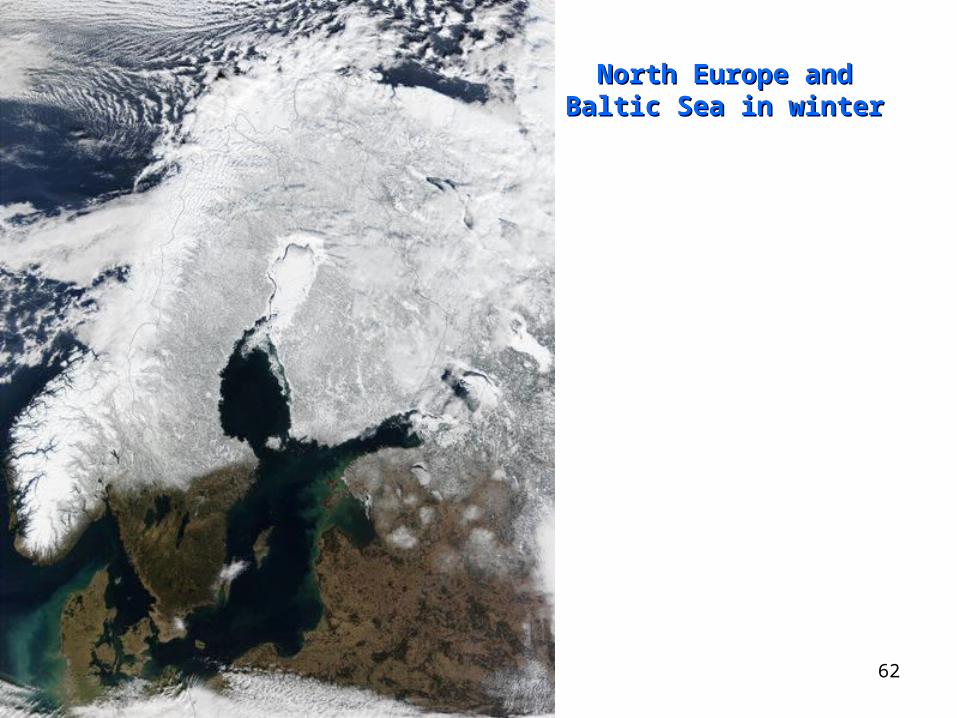
North Europe and Baltic North Europe and Baltic Sea in winterSea in winter

63
64
65
Take care !Take care !