Embed Size (px)
Citation preview

1
CARE High-Usage Strategy2012-2014 Proposal
October 28, 2011Workshop #7

2
Strategic Vision
Ensure qualified households continue
to be aware of the CARE program,
can easily enroll and can remain on
the program as long as they continue
to be qualified and require its benefits
3
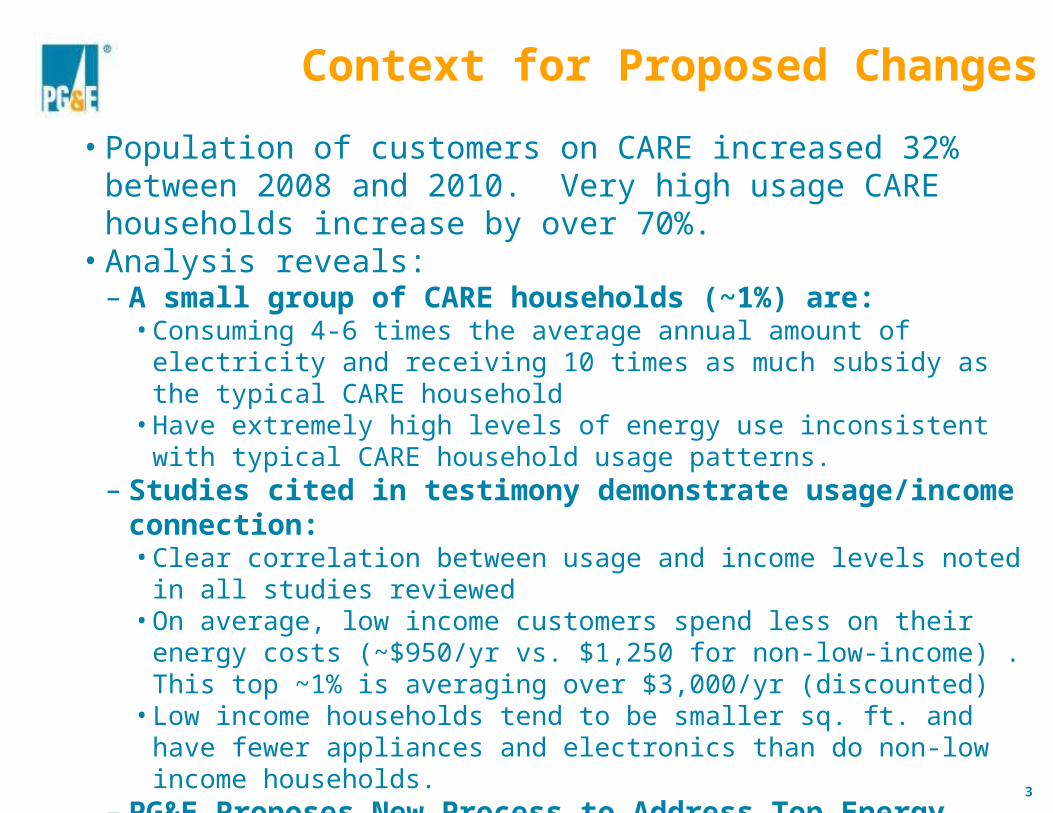
Context for Proposed Changes
• Population of customers on CARE increased 32% between 2008 and 2010. Very high usage CARE households increase by over 70%.
• Analysis reveals:– A small group of CARE households (~1%) are:
• Consuming 4-6 times the average annual amount of electricity and receiving 10 times as much subsidy as the typical CARE household
• Have extremely high levels of energy use inconsistent with typical CARE household usage patterns.
– Studies cited in testimony demonstrate usage/income connection:• Clear correlation between usage and income levels noted in all studies reviewed• On average, low income customers spend less on their energy costs (~$950/yr vs.
$1,250 for non-low-income) . This top ~1% is averaging over $3,000/yr (discounted)
• Low income households tend to be smaller sq. ft. and have fewer appliances and electronics than do non-low income households.
– PG&E Proposes New Process to Address Top Energy Users on CARE• Households with usage between 400-600% of baseline annually• Households with usage greater than 600% of baseline annually

4
Proposed Strategy to Address High CARE Users
Households between 400% and 600% of Baseline
Households above 600% of baseline
Description of Proposal:
In order to continue receiving CARE benefits:•Must complete enhanced PEV process•Agree to participate in the ESA program
Customers provided 45 days to respond (reminder phone calls before and after notice)
In order to continue receiving CARE benefits:•Must decrease usage below 600% of baseline within 180 days of notification (excludes Med Baseline)
Number: ~10,200 (~3k already treated in ESA) ~5,400
Subsidy: ~$34.4 million ~$42.4 million
Benefits of Position:
• Message: This level of usage is not typical and help is going to be provided to assess the situation, potentially address problems and further lower bills
• Ensures qualified customers willing to become more efficient remain on the program
• Site visit creates opportunities to promote other eligible programs (i.e. Medical Baseline)
• Message: It is unlikely that households with this level of usage truly income qualified.
• Customers with conspicuously high usage removed
• CARE benefits more equitably distributed to truly eligible customers
Top ~1% of CARE households receiving ~12% of Subsidy
Figures reflect 9/30/11 program statistics, including subsidy estimates based on actual11/01/11 rates and 09/01/10 to 08/31/11 sales
5
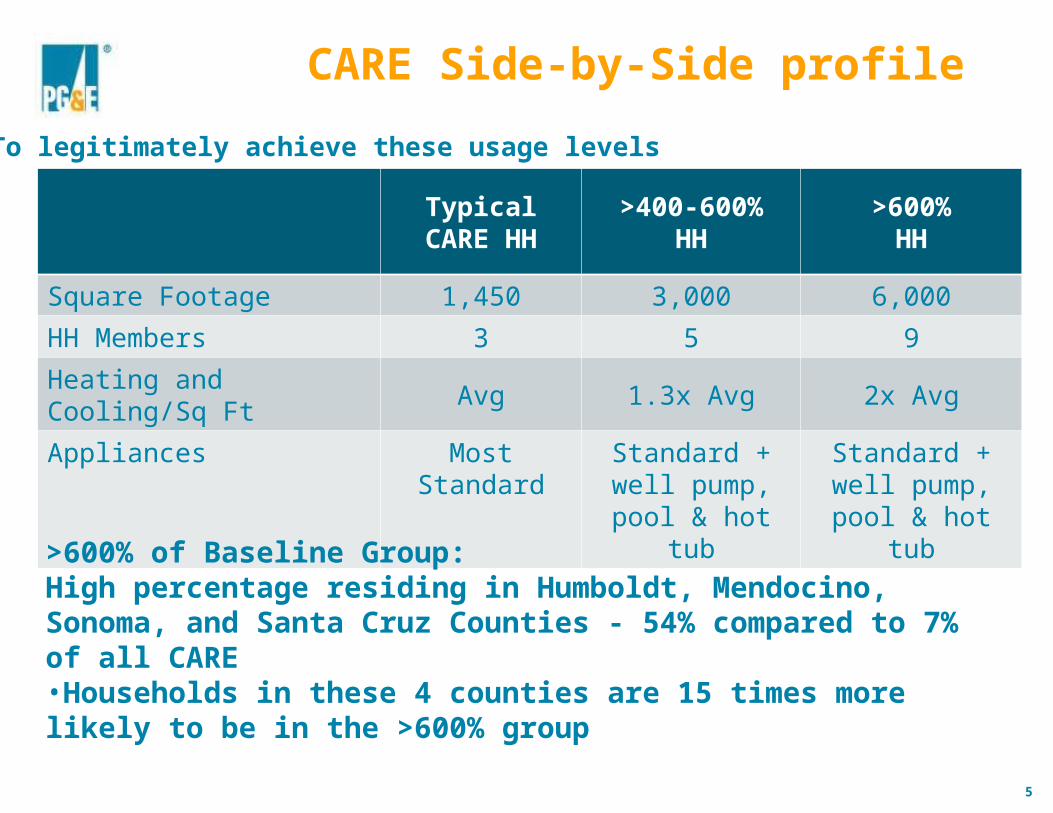
CARE Side-by-Side profile
Typical CARE HH
>400-600%HH
>600%HH
Square Footage 1,450 3,000 6,000
HH Members 3 5 9
Heating and Cooling/Sq Ft Avg 1.3x Avg 2x Avg
Appliances Most Standard Standard + well pump, pool &
hot tub
Standard + well pump, pool & hot
tub
>600% of Baseline Group:High percentage residing in Humboldt, Mendocino, Sonoma, and Santa Cruz Counties - 54% compared to 7% of all CARE •Households in these 4 counties are 15 times more likely to be in the >600% group
To legitimately achieve these usage levels

6
High Usage Statistics
Percentage of Annual Baseline
House-holds
Total Annual Subsidy
% of Total
Subsidy
Avg Monthly
kWh
Avg Annual
kWh
AvgMonthly Discount
Avg Monthly
Bill w/CARE
Avg Annual
Discount
Avg Annual
Bill w/CARE
400% - 600%
~10,200 ~$34.5 Million 5.5% 1,800 21,600 $280 $205 $3,360 $2,460
Above 600% ~5,400 ~$42.5 Million 6.5% 3,600 43,200 $660 $430 $7,920 $5,160
Total (top ~1%) ~15,600 ~$77 Million 12% 2,400 28,800 $410 $280 $4,920 $3,360
All CARE Elec ~1.26 M ~$655 Million 570 6,840 $43 $54 $515 $645
Non-CARE Elec ~3.36M 550 6,600 $100 $1,200
NOTE: Table updated as of 9/30/11 program statistics, including discount and bill estimates based on actual 11/01/11 rates. Usage (kWh) based on 09/01/10 to 08/31/11 sales.
Of the ~5,400 households in the >600% of baseline group 55% are actually using >800% of baseline

7
Examples: 400%-600% of Baseline
Percent of Annual
Baseline CountyTotal HH Members
Reported Annual
Household Income
House Square Footage
Estimated Home Value Bedrooms Bathrooms
Year Built Pool
445% FRESNO 11 $58,500 2,100 $186,000 4 2 1968 yes
470% FRESNO 9 $77,000 3,550 $408,000 3 3 2002 no
438% FRESNO 6 $39,000 2,250 $194,000 4 3 2006 no
408% SANTA CLARA 8 $67,000 2,650 $758,000 4 3 1978 yes
444% SANTA CLARA 4 $40,000 2,088 $887,000 3 3 1986 yes
427% CONTRA COSTA 8 $71,000 2,121 $406,000 4 3 1999 no
Large houses with many household members in the Central Valley are still well below the 600% of Baseline threshold.

8
>600% of Baseline View
Pharmacy San Mateo County ~10,800 Sq Ft Annual Usage: 27,500 kWh, Annual Res Baseline: 665%
Pharmacy Alameda County Sq Ft UnknAnnual Usage: 26,900 kWh, Annual Res Baseline: 890%

9
Residential Comparisons
Comparison #3
All electric single family CARE household
1,705 Sq Ft Placer County
Annual Usage: 56,850 kWh
Annual Baseline: 601%
Annual CARE Discount: $9,900
Comparison #1
Basic single family CARE household
1,015 Sq Ft Solano County
Annual Usage: 24,900 kWh
Annual Baseline: 601%
Annual CARE Discount: $4,400
Comparison #2
Basic single family CARE household
735 Sq Ft Sonoma County
Annual Usage: 24,900 kWh
Annual Baseline: 601%
Annual CARE Discount: $4,400

10
Times-Standard Serving Eureka and California’s North Coast
Keeping the lights on: Indoor pot growers skirt high electric bills through discount program for low incomeThadeus Greenson/The Times-StandardPosted: 10/09/2011 02:39:44 AM PDT
““These lights aren't the lights this program is intended to keep on,” said Arcata Police Chief Tom Chapman. “This program was designed to let a family in a two bedroom apartment keep the lights on, but the system is being abused.”
And, according to Chapman and others in law enforcement, the rate of abuse is only increasing. Of the 20 grow house search warrants his department has served over the last two years, 70 percent have been enrolled in the CARE program, Chapman said, adding that those are only the ones officers were able to confirm.
In many of these cases, officials said, there's also no real argument that the growers should qualify as low income.”
Public Concern Over Abuse

11
Times-Standard
Serving Eureka and California’s North Coast
Follow-up article
Program, Looks to Rein in Abuse of Low-Income Rates by Pot GrowersThadeus Greenson/The Times-StandardPosted: 10/23/2011 02:18:22 AM PDT1
Public Concern Over Abuse
12
Appendix

13
Yes…through PEV activities, reports from law enforcement, employees (field and office), CBO’s and other ratepayers have identified actual and potential ineligible households enrolled in the CARE program.
Reported cases are selected for PEV, but PG&E is unable to remove customers from CARE rate unless reported income is found to be above guidelines, documents are falsified or strong evidence that no one is living in the household.
Indications of ineligible household on CARE
Are there indications that show that ineligible households may be enrolled in the CARE Program?

14
Examples of ineligible household on CARE
Example 1•Arrested by police for growing marijuana•Selected for post-enrollment verification and provided qualifying documents on 3/14/11•5,000 sq. ft. house, high-end vehicles, and over $80,000 in cash found onsite•Annual usage nearly 200,000 kWh – 6,400% of Baseline•Annual CARE discount of over $41,000•Even on CARE, monthly bill averaged over $2,000
Example 2•Narcotics Task Force warrant on 7/5/11 evidence shows nobody living in home•Selected for post-enrollment verification and provided qualifying documents on 3/31/11•Detective found forged income documents while executing warrant•Annual usage over 200,000 kWh – 3,700% of Baseline•Annual CARE discount of over $42,000•Even on CARE, monthly bill averaged over $2,000