Embed Size (px)
Citation preview

F A C T S H E E TApril 2014
1
CEO speak
Dear Investors and my dear Advisor friends;
At the outset, let me wish you a very happy and prosperous new financial year.
I have been writing to you about our investment philosophy of BUY RIGHT : SIT TIGHT which we follow so
as to manage your money in a disciplined; process oriented manner targeted at not just generating returns
but for creating wealth. This month, I would like elaborate a bit about this and explain to you why in the
Indian context this is critical to follow over the next few years.
Wealth Creation by investing in equity requires two traits
1. The ability to identify good companies and
2. The discipline to stay invested over a long period of time in order to realize the full growth potential of the stock.
Good quality companies are in business for decades but investors change their views about these companies every year, every quarter,
every month and sometimes every day! While many investors get the first part of identifying good stocks, hardly anyone stays invested
for a long enough time. The temptation to book profits at 25% or 50% or even 100% returns in a 1 to 3 year period is so natural that
people miss out the chance of multiplication in wealth that happens only over long periods of say 5 to 10 years. The findings of 18th
Motilal Oswal Wealth Creation Study-2013 shows that quality stocks have grown ~200 to 300 times over a period of two decades. If you
wish to see the video of Mr. Agrawal's presentation and the panel discussion please click on the link below:
Videos: http://www.motilaloswal.com/Financial-Services/Knowledge-Centre/Videos/17
http://www.motilaloswal.com/Financial-Services/Knowledge-Centre/Videos/18
Needless to say, one would have benefitted from this growth only if he or she had remained invested instead of making attempts at
cashing out and trading in alternatively.
Why is this important for investing in Indian stock markets? In a recent interview when I was asked about the long term view for India, I
had stated that over the next five to seven years I am expecting today's Sensex value to be actually the Nifty value! Favorable
demographics remain the underlying driver of growth for India. While consumption has contributed disproportionately to economic
growth in India in the last 6 years, we believe a more focused leadership at the state and central levels will be critical to remove policy
road-blocks and help drive investment-led growth. Favorable policy environment should also help exports pick up steam. The economic
situation is in a turnaround mode and likely political consolidation happening at the same time should result in a huge upward move in
equity markets.
While some of this analysis tends to be more technical in nature, I am going to share two slightly long but logical calculations on why
todays Sensex value may be the Nifty value in the foreseeable future.
Our Investment philosophy - BUY RIGHT. SIT TIGHT
Quality : Quality of business and management
Growth : Growth in earnings and sustained RoE
Longevity : Longevity of the competitive advantage /economic moat of the business
Price : Buying a good business for a fair price rather than buying a fair business for a good price.
Buy and Hold: We are strictly buy and hold investors and believe that picking the right business needs skill and holding onto these business to enable our investors to benefit from the entire growth cycle, needs even more skill.
Focus: Our portfolios are high conviction portfolios with 20 to 25 stocks being our ideal number. We believe in adequate diversification but over-diversification results in diluting returns for our investors and adding market risk.
Buy Right Sit Tight
(Continued overleaf)

2
Analysis 1:
I) Today, the size of our economy (GDP) is approx. Rs. 110 lakh crores
ii) Economic (GDP) growth rate at conservative estimates like last 5 years is equal to 6% real growth + 7% inflation which sums
up to 13% nominal growth.
iii) Size of the economy (GDP) after 10 years at the same pace might be approx. Rs. 373 lakh crores.
iv) During last 10 years, the range of Corporate Profits / GDP ratio has been approx. 2.7% to 6.0%. Corporate Profits / GDP
means the total profits of all listed companies as a percentage of the size of the economy as a whole.
v) Currently it is at 4% to the GDP, thus Corporate Profits may be quantified at approx Rs. 4.4 lakh crores.
vi) Long Term average PE ratio is 16 times.
vii) Current Market Cap is approximately 16 times multiplied by Rs. 4.4 lakh crores is higher than Rs. 70 lakh crores (which is
indeed close to current market cap).
viii) 10 years hence, assuming corporate profit to GDP remains unchanged at 4%, the corporate profits in such case would be
approx Rs. 15 lakh crores. (4% of Rs 373 lac crores)
ix) Assume PE also remains as per long term average of 16 times, market cap may become Rs. 239 lakh crores
x) With market cap at Rs. 70 lakh crores today, Nifty is at 6500 points. So if market cap goes to Rs. 239 lakh crores, what will Nifty
be???? By simple multiplications it will be approximately 22000 points.
You may now calculate the Nifty if the following extremes are tested in the market which are always tested depending on whether
we are in bull or bear market:
1) What if GDP grows at 9% real growth instead of 6% growth?
2) What if corporate profits to GDP ratio is 6% instead of 4%?
3) What if market's PE is 24 times as in past peak instead of current 16 times average?
You will find that Nifty will be equal to today's Sensex in worst case. For best case, I leave the calculations to you !
Analysis 2:
In the market peak of FY08 the size of the economy (GDP) was Rs 45 lakh crores and the market cap of India was Rs 75 lakh crores. Today the GDP is Rs. 110 lakh crores but market is still between Rs 70 lakh to Rs. 75 lakh crores.
Historically the range of market cap to GDP ratio has been between 0.5 to 1.75 times.
Over the next 5 years at say 13% nominal growth rate take above the GDP may be Rs 202 lakh crores. In this period if the market cap to GDP ratio is 0.5 you will get 6% return on equity, if market cap to GDP ratio is 1 time you may get 22% return on equity and if you are in an equity party where market cap to GDP gets to its peak of 1.75 times, you may get 36.5% return on your equity investment.
Should you be in any asset class other than equity? And what should your percentage allocation to equity?
As always, I would love to hear from you. Incase of any further clarifications sought or feedback, please feel free to write back to me at [email protected]
Aashish P SomaiyaaManaging Director and CEOMotilal Oswal Asset Management Company Ltd.

Product Suitability
RR
00
00
4_4
01
12
_01
0
3
Risk Disclosure and Disclaimer
IISL Disclaimer: MOSt Shares M50: The MOSt 50 Basket is not sponsored, endorsed, sold or promoted by India Index Services & Products Limited (IISL). MOSt 50 Basket has been developed by MOAMC and IISL has
calculated and maintained as per the specifications and requirements of MOAMC. IISL does not make any representation or warranty, express or implied regarding the advisability of investing in the products linked to
MOSt 50 Basket and availing the services generally or particularly or the ability of MOSt 50 Basket to track general stock market performance in India. Please read the full Disclaimers in relation to the MOSt 50 Basket in
the Scheme Information Document. MOSt Shares Midcap 100: MOSt Shares Midcap 100 offered by Motilal Oswal Asset Management Company Limited (MOAMC) or its affiliates is not sponsored, endorsed, sold or
promoted by India Index Services & Products Limited (IISL) and its affiliates. IISL and its affiliates do not make any representation or warranty, express or implied (including warranties of merchantability or fitness for
particular purpose or use) to the owners of MOSt Shares Midcap 100 or any member of the public regarding the advisability of investing in securities generally or in the MOSt Shares Midcap 100 linked to CNX Midcap
Index or particularly in the ability of CNX Midcap Index to track general stock market performance in India. Please read the full Disclaimers in relation to the CNX Midcap Index in the Scheme Information Document.
NASDAQ-100 Disclaimer: MOSt Shares NASDAQ 100: NASDAQ®, OMX®, NASDAQ OMX®, NASDAQ-100®, and NASDAQ-100 Index®, are registered trademarks of The NASDAQ OMX Group, Inc. (which with its
affiliates is referred to as the “Corporations”) and are licensed for use by MOAMC. MOSt Shares NASDAQ 100 (the Product) has not been passed on by the Corporations as to their legality or suitability. The Product are not
issued, endorsed, sold, or promoted by the Corporations. THE CORPORATIONS MAKE NO WARRANTIES AND BEAR NO LIABILITY WITH RESPECT TO THE PRODUCT. NSE Disclaimer: It is to be distinctly
understood that the permission given by NSE should not in any way be deemed or construed that the Scheme Information Document has been cleared or approved by NSE nor does it certify the correctness or
completeness of any of the contents of the Scheme Information Document. BSE Disclaimer: It is to be distinctly understood that the permission given by Bombay Stock Exchange Ltd. should not in any way be deemed or
construed that the SID has been cleared or approved by Bombay Stock Exchange Ltd. nor does it certify the correctness or completeness of any of the contents of the SID. The investors are advised to refer to the SID for
the full text of the Disclaimer Clause of the Bombay Stock Exchange Ltd.
Statutory Details: Constitution: Motilal Oswal Mutual Fund has been set up as a trust under the Indian Trust Act, 1882. Trustee: Motilal Oswal Trustee Company Ltd. Investment Manager: Motilal Oswal Asset
Management Company Ltd. Sponsor: Motilal Oswal Securities Ltd. Risk Factors: (1) All Mutual Funds and securities investments are subject to market risks and there can be no assurance that the Scheme's
objectives will be achieved (2) As the price / value / interest rates of the securities in which the Scheme invests fluctuates, the Net Asset Value (NAV) of units issued under the Scheme may go up or down
depending upon the factors and forces affecting the securities market (3) Past performance of the Sponsor/AMC/Mutual Fund and its affiliates does not indicate the future performance of the Scheme and
may not provide a basis of comparison with other investments (4) The name of the Schemes does not in any manner indicate the quality of the Schemes, its future prospects and returns. Investors are
therefore urged to study the terms of offer carefully and consult their Investment Advisor before they invest in the Scheme (5) The Sponsor is not responsible or liable for any loss or shortfall resulting from
the operation of the Mutual Fund beyond the initial contribution made by it of an amount of Rs. 1 Lac towards setting up of the Mutual Fund (6) The present Schemes are not guaranteed or assured return
Schemes. Mutual Fund investments are subject to market risks, read all scheme related documents carefully
Name of the Scheme This product is suitable for investors who are seeking*
Motilal Oswal MOSt Focused 25 Fund (MOSt Focused 25 Fund)
• Return by investing in upto 25 companies with long term sustainable competitive advantage and growth potential
• Investment in Equity and equity related instruments subject to overall limit of 25 companies
• High risk (BROWN)
Motilal Oswal MOSt Focused Midcap 30 Fund (MOSt Focused Midcap 30)
• Long-term capital growth• Investment in equity and equity related instruments in a maximum of 30 quality mid-
cap companies having long-term competitive advantages and potential for growth• High risk (BROWN)
Note: Risk is represented as
(BLUE) investors understand that their principal will be at low risk
(YELLOW) investors understand that their principal will be at medium risk
(BROWN) investors understand that their principal will be at high risk
*Investors should consult their financial advisors if in doubt about whether the product is suitable for them.
Motilal Oswal MOSt Ultra Short Term
Bond Fund
•• Investment in debt securities and money market securities with average maturity less
than equal to 12 months • Medium risk (YELLOW)
Optimal returns consistent with moderate levels of risk

4
Motilal Oswal Mutual Fund
Mosl ULTRA SHORT TERM BOND FUND
Security Issuer % of holding(as on 31.03.14)
IDBI BANK CD
AXIS BANK CD
BANK OF MAHARASHTRA CD
CANARA BANK CD
STATE BANK OF HYDERABAD CD
STATE BANK OF MYSORE CD
Reverse REPO/Cash/Others
IDBI BANK
AXIS BANK
BANK OF MAHARASHTRA
CANARA BANK
State Bank of Hyderabad
State Bank of MYSORE
10.24
21.06
10.53
10.61
31.38
10.20
5.99
(Data as on 31st March 2014)
Portfolio
Scheme Name
Type of Scheme
InvestmentObjective
Benchmark
ContinuousOffer
Motilal Oswal MOSt Ultra Short Term Bond Fund
An Open Ended Debt Scheme
The investment objective of the Scheme is to generate optimal returns consistent with moderate levels of risk and liquidity by investing in debt securities and money market securities.
However, there can be no assurance or guarantee that the investment objective of the Scheme would be achieved.
CRISIL Short Term Bond Fund Index
Minimum Application Amount : `5,000/- and in multiples of `1/- thereafter.
Additional Application Amount : `1000/- and in multiples of `1/- thereafter.
About the SchemeDate of Allotment
Scheme Details
NAV Direct Plan- Growth
Direct Plan-Daily Dividend Option
Direct Plan-Fortnightly Dividend Option
Regular Plan- Growth
Regular Plan-Daily Dividend Option
Regular Plan-Fortnightly Dividend Option
Regular Plan-Monthly Dividend Plan
Regular Plan-Weekly Dividend Option
Regular Plan - Quarterly Dividend
`10.5078
`10.0093
`10.0374
`10.4629
`10.0090
`10.0347
`10.0738
`10.0190
`10.0840
6 September 2013
Entry / Exit Load Nil
Fund Manager
Experience He has over 6 years of experience in the Financial Services Industry.He has been managing this fund since inception.
Mr. Abhiroop Mukherjee
Fund Manager
Quantitative Indicators Average Maturity *
YTM
(Data as on 31st March 2014) *For USTBF Modified Duration is equal to its Average maturity.
0.17 Years / 62.90 days
9.5601%
(An open ended Debt Scheme)
Returns for MOSt Ultra Short Term Bond Fund are not provided because the scheme has not completed 1 year.
NOTE : Mr. Abhiroop Mukherjee is also fund manager for MOSt 10 Year Gilt Fund. The returns for which are mentioned below.
`56.02 (` crores)Quarterly AAUM (Mar. 31st, 2014)
Total Expense Ratio^Regular Plan
Direct Plan
1.00% p.a.
0.25% p.a.
(Data as on 31st March 2014)^Year-to-date, excluding applicable taxes.
Returns for one year are absolute, ^ Past performance may or may not be sustained in the future
Period Scheme
Performance
Benchmark
-2.63%December 31 2013 toDecember 31 2014
-2.26%
MOSt 10 Year Gilt FundReturns^
CRISIL 10 Year GiltIndex

5
24 Feb 2014Date of Allotment
Scheme Details
Quarterly AAUM (Mar. 31st, 2014)
Scheme Name
Type of Scheme
InvestmentObjective
Benchmark
Continuous Offer
Motilal Oswal MOSt Focused Midcap 30 Fund (MOSt Focused Midcap 30)
An Open Ended Equity Scheme
The investment objective of the Scheme is to achieve long term capital appreciation by investing in a maximum of 30 quality midcap companies having long-term competitive advantages and potential for growth.
However, there can be no assurance or guarantee that the investment objective of the Scheme would be achieved.
CNX Midcap Index
Minimum Application Amount: Rs. 5,000/- and in multiples of Re. 1/- thereafter.
Additional Application Amount: Rs. 1,000/- and in multiples of Re. 1/- thereafter.
Entry Load: Nil
Exit Load: 2% if redeemed/switched-out on or before 1 year from date of allotment, Nil, if redeemed/switched-out after 1 year from the date of allotment.
The entire exit load (net of service tax) charged, if any, shall be credited to the Scheme.
About the Scheme
Entry / Exit Load
`10.7327Growth Plan
Direct Dividend Plan
`10.7327Dividend Plan
`10.7432
NAVDirect Growth Plan `10.7432
`15.63 (` crores)
Standard Deviation# 4.12 (per month)
-0.05 (per month)
0.03
0.66
1.00
Sharpe Ratio
Portfolio Turnover Ratio
Beta*
R-Squared*
Total Expense Ratio^
Regular Plan 2.50% p.a.
1.00% p.a.Direct Plan
(An open ended Equity Scheme)
^Since inception till date, excluding applicable taxes. (Data as on 31st March 2014)
*Against the benchmark CNX Midcap . # Risk free returns based on 365-days T-bill cut-off of 8.89% as on the last
auction.
Index
(Data as on 31st March 2014)
Motilal Oswal Mutual Fund
MOSl Focused MIDCAP Fund30 I
Fund Manager Mr. Taher Badshah
Fund Manager
ExperienceHe has 18 years of experience in fund management and investment research. He has been managing this fund since inception.
Bata India Limited
IPCA Laboratories Limited
CRISIL Limited
Thermax Limited
Page Industries Limited
Engineers India Limited
Sundaram Finance Limited
ING Vysya Bank Limited
Tvs Motor Company Limited
City Union Bank Limited
Repco Home Finance Limited
Voltas Limited
Gujarat Pipavav Port Limited
Ajanta Pharma Limited
MphasiS Limited
Astral Poly Technik Limited
7.48%
6.76%
6.46%
6.36%
6.20%
5.95%
5.71%
5.60%
5.54%
5.53%
5.45%
4.67%
4.60%
4.45%
3.67%
3.21%
(Data as on 31st March 2014)
Scrip
1
2
3
4
5
6
7
8
9
10
11
12
13
14
15
16
Sr. No. Weightage in F30
Holdings
Returns for MOSt Focused Midcap 30 Fund are not provided because the scheme has not completed 1 year.
Mr. Taher Badshah is also the fund manager for the scheme, Motilal Oswal MOSt Focused 25 Fund. Returns for which has not been provided as the scheme has not completed 1 year.
(Data as on 31st March 2014) Industry classification as recommended by AMFI
Industry Allocation
12.36%
3.21%
3.67%
4.60%
5.54%
6.20%
6.36%
7.48%
10.62%
11.13%
11.21%
17.62%
Cash & Equivalent
Industrial Products
Software
Transportation
Auto
Textile Products
Industrial Capital Goods
Consumer Durables
Construction Project
Banks
Pharmaceuticals
Finance

6
Motilal Oswal Mutual Fund
MOSl Focused Fund25
HDFC Bank Limited
Container Corporation of India Limited
Tata Consultancy Services Limited
Housing Development Finance Corporation Limited
Kotak Mahindra Bank Limited
ITC Limited
Pidilite Industries Limited
Tech Mahindra Limited
Tata Motors Limited
Divi's Laboratories Limited
Colgate Palmolive (India) Limited
Cairn India Limited
Maruti Suzuki India Limited
Larsen & Toubro Limited
Infosys Limited
Eicher Motors Limited
Idea Cellular Limited
Cummins India Limited
Hero MotoCorp Limited
CRISIL Limited
8.97%
7.50%
7.22%
6.37%
6.01%
5.87%
5.55%
5.47%
5.32%
5.28%
5.16%
4.64%
4.60%
3.94%
3.58%
3.25%
3.23%
2.67%
2.56%
1.46%
(Data as on 31st March 2014)
Scrip
1
2
3
4
5
6
7
8
9
10
11
12
13
14
15
16
17
18
19
20
Sr. No. Weightage in F25
Holdings
Fund Manager Mr. Taher Badshah
Fund Manager
ExperienceHe has 18 years of experience in fund management and investment research. He has been managing this fund since inception.
13 May 2013Date of Allotment
Scheme Details
Quarterly AAUM (Mar. 31st, 2014)
Scheme Name
Type of Scheme
InvestmentObjective
Benchmark
Continuous Offer
Motilal Oswal MOSt Focused 25 Fund
An Open Ended Equity Scheme
The investment objective of the Scheme is to achieve long term capital appreciation by investing in upto 25 companies with long term sustainable competitive advantage and growth potential. However, there can be no assurance or guarantee that the investment objective of the Scheme would be achieved.
CNX Nifty Index
Minimum Application Amount : `5,000/- and in multiples of ̀ 1 /- thereafter.
Additional Application Amount : `1,000/- and in multiples of ̀ 1/- thereafter.
Nil
About the Scheme
Entry / Exit Load
`11.0581Growth Plan
Direct Dividend Plan
`11.0581Dividend Plan
`11.2122
NAVDirect Growth Plan `11.2122
`127.91 (` crores)
Standard Deviation# 4.08 (per month)
0.05 (per month)
0.45
0.82
0.85
Sharpe Ratio
Portfolio Turnover Ratio
Beta*
R-Squared*
Total Expense Ratio^
Regular Plan 2.50% p.a.
1.00% p.a.Direct Plan
^Since inception till date, excluding applicable taxes. (Data as on 31st March 2014)
Returns for MOSt Focused 25 Fund are not provided because the scheme has not completed 1 year.
Mr. Taher Badshah is also the fund manager for the scheme, Motilal Oswal MOSt Focused Midcap 30 Fund. Returns for which has not been provided as the scheme has not completed 1 year.
(Data as on 31st March 2014) Industry classification as recommended by AMFI
Industry Allocation
(An open ended Equity Scheme)
*Against the benchmark CNX Nifty . # Risk free returns based on 365-days T-bill cut-off of 8.89% as on the last
auction.
Index
(Data as on 31st March 2014)
1.35%
2.67%
3.23%
3.94%
4.64%
5.28%
5.55%
7.50%
7.83%
11.03%
14.98%
15.73%
16.27%
Cash & Equivalent
Industrial Products
Telecom - Services
Construction Project
Oil
Pharmaceuticals
Chemicals
Transportation
Finance
Consumer Non Durables
Banks
Auto
Software
MOTILAL OSWAL MOSt FOCUSED 25 FUND(An open ended equity scheme)
7
Insights
HDFC Bank
• HDFC Bank is the second largest private sector bank, with a balance sheet size of Rs. 4.16 trillion and is rated as one of the best banks in India; it has a network of over 3,100 branches.
• It provides corporate banking and custodial services and is active in the treasury and capital markets.
• The Loan Book is consistently growing at the rate of over 20 percent for last several quarters.
• Despite being an aggressive lender, the net Non Performing Assets (NPAs) of 0.2 percent in Financial Year 2013 is one of the lowest in the industry standard of ~4.2 percent during FY 2012-13. This indicates superior risk management skills.
• It is one of the better placed banks in current environment with CASA (Current Account Savings Account) ratio of 44.7 percent, growth outlook of 1.3x of industry growth, improving operating efficiency, strong expansion in branch network and best in class asset quality
• The biggest risk to earnings for private banks is the implementation of dynamic provisioning by RBI. However, HDFC Bank is best placed due to floating provisions created during the last three years.
• HDFC Bank posted 25% growth in the net profit to Rs 2,325.7 crore for the quarter ended December 2013, crossing the Rs 2,000 crore mark for quarterly net profit. The performance of the bank was supported by strong advances growth, healthy growth in non-interest income and stable asset quality.
Stock Returns (in percentage)
MTD : 11.83CYTD : 12.46 FYTD : 20.03
Container Corporation of India
• Container Corporation of India Limited (CCRI) is engaged in providing inland transport by rail for containers, ports, air cargo complexes and establishing cold-chain.
• It operates in two divisions; ExIm (export-import) and Domestic. Both ExIm and domestic divisions of the Company are engaged in handling, transportation and warehousing activities.
• Its business includes three distinct activities, that of a carrier, a terminal operator, and a warehouse operator.
• CCRI maintains its strong competitive edge in form of terminal infrastructure and strategic alliances.
• By virtue of its legacy of low cost pan India strategic assets, CCRI enjoys an inimitable resource advantage over its peers, which is steadily increasing with time.
• CCRI is a debt-free company (net cash of INR 29 billion as at March 2013) and enjoys steady Operating Cash Flow (OCF) and Free Cash Flow (FCF).
• CCRI registered strong 14% growth in revenue to Rs 1,239.25 crore for the quarter ended Dec 2013. But with operating margin contracting by 130 bps, the growth at operating profit restricted to 9% to Rs 285.64 crore. Hit by higher depreciation, higher tax incidence and prior period tax the growth at net profit was restricted to 5% to Rs 249.57 crore.
Stock Returns (in percentage)
MTD : 27.04CYTD : 32.95 FYTD : 37.61

8
HDFC
• HDFC is one of the market leader in the housing mortgage segment.
• It has evolved as a financial conglomerate with interests in the banking, insurance and mutual funds business by having stakes in its group companies.
• HDFC's performance in last three years (FY 2010-11, 2011-12 and 2012-13) has been healthy with average growth in net loans of 20.3 percent, total assets of 19 percent and PAT (Profit After Tax) of 20 percent.
• It enjoys strong brand equity and has a strong customer base of 4.4 million.
• Working Indian population is on the rise. This will create more demand for HDFC's business as the housing affordability will be directly impacted.
• Mortgage penetration as a percentage of GDP in India stands at only 8 percent and is among the lowest even within many developing nations, implying wide untapped opportunity in India.
• HDFC is expected to maintain its consistent growth trajectory as observed over the past 3 years.
• HDFC has recorded healthy 12% increase, on YOY basis, in the net profit at Rs 1,277.71 crore for the quarter ended December 2013. The PAT growth showed improvement in Q3 of FY2014 from Q2 of FY2014 with better spreads on loans, despite decline in other income.
• The company has also witnessed slight improvement in asset quality in the quarter ended December 2013. The loan growth remained healthy in the quarter with retail loan book maintaining the momentum.
Stock Returns (in percentage)
MTD : 7.88CYTD : 11.23 FYTD : 7.11
Tata Consultancy Services
• Tata Consultancy Services Limited (TCS) was set up in 1968, since then it pioneered IT services exports and is India's largest exporter. It provides a comprehensive range of IT services to industries such as banking and financial services, insurance, manufacturing, telecommunications, retail, and transportation.
• TCS is well placed to gain market share and continues to enjoy strategic vendor status with most of its top customers. Over the last five years, TCS has almost doubled its revenue contribution from the top 10 as well as non top 10 clients.
• Its aggressive deal-making capability helps it in achieving industry- leading growth and its focus on high employee utilization and on improving operational efficiencies helps it in being amongst the highly profitable Indian IT companies.
• With the recovery of the US economy, client spending on discretionary IT services is expected to increase. This could lead to both volume and margin growth for the company.
• The INR depreciation would also work positively in favour TCS.
• TCS is a key beneficiary of increased global sourcing. It stands out for all round growth across verticals, geographies and service lines. It is also increasingly winning larger and more transformational deals. TCS' strong leadership and tight execution are its key strengths.
• The Sales grew by 2% QoQ to Rs 21,293.96 crore for the quarter ended December 2013. The Sales growth was on the back of 1.8% volume growth coupled with the 74 basis points improvement in the Realizations during the quarter.
Stock Returns (in percentage)
MTD : -6.27CYTD : -1.79 FYTD : 37.02

9
Kotak Mahindra Bank
• Kotak Mahindra Bank Limited (KMB) is a full service commercial bank.
• KMB has successfully transformed itself from a mere NBFC/capital market proxy into a full-fledged credible banking franchise over the last decade with lending business contributing around ~83 percent of earnings in FY 2013 vs. ~40 percent in FY08.
• Since its inception, the bank has always followed a risk adjusted return strategy on both its retail and wholesale loan book.
• The asset quality has remained stable across business cycles.
• The bank has an extremely diversified, granular loan book. In retail loans, car, tractor and commercial vehicle financing are its key niches while in wholesale loans it focuses on primarily working capital and trade financing.
• We believe that the bank is well positioned to participate in the next credit cycle given well capitalized position, stable asset quality, scalable business model and good execution.
• KMB has reported 6%, on YoY basis, decline in the Net Profit to Rs 339.98 crore, over moderate 11% increase in Net Interest Income to Rs 912.74 crore for the quarter ended December 2013. Net interest margin was steady at 4.9% on sequential basis in the quarter under review, while improved from 4.6% in the corresponding quarter last year.
Stock Returns (in percentage)
MTD : 14.11CYTD : 7.25 FYTD : 19.79
ITC
• ITC Limited is engaged in FMCG, Hotels, Paperboards and Specialty Papers, Packaging and Agri-Business.
• The FMCG segment includes Cigarettes, which consists of cigarettes, cigars, smoking mixtures, branded packaged foods, garments and personal care products.
• ITC has an 84 percent value market share in Cigarette business implying virtual monopoly in this segment. The cigarette business is cash cow and generates huge cash for the company.
• Management has intentions to become an important player in FMCG business especially in processed food and also want to enter into Beverages and Diary Segment.
• We believe that India has good scope in Food process and Diary business but it requires massive investment in back end for sourcing and storage, ITC is one of the players who has sufficient cash generation from existing business and can continuously invest in this business.
• During Q3FY14, the net sales have increased by 13% to Rs 8,726.85 crore driven primarily by FMCG and Paper Business. The cigarette sales was up by 13% to Rs 4,116.07 crore, FMCG by 17% to Rs 2,077.82 crore, Hotel business grew by 2% to Rs 315.44 crore, agri-business by 10% to Rs 1,786.37 crore and Paper & Paperboard by 18% at Rs 1,257.43 crore.
Stock Returns (in percentage)
MTD : 7.69CYTD : 9.63 FYTD : 14.86
10
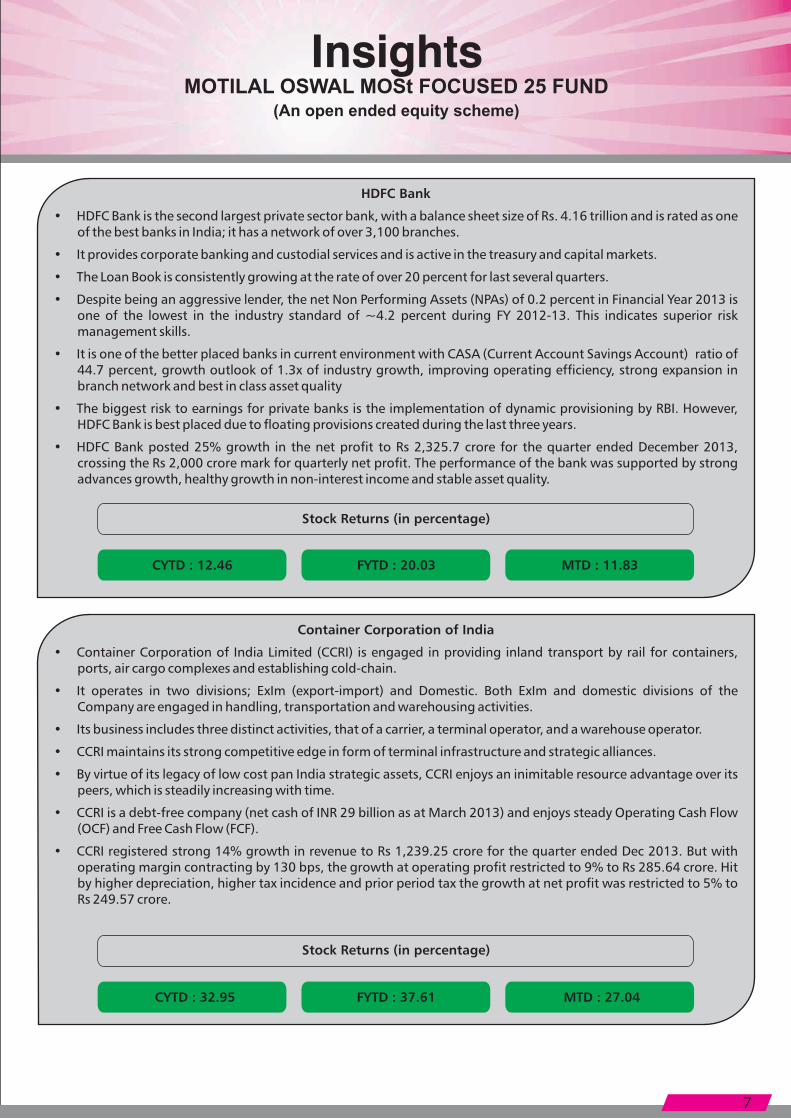
Pidilite Industries
• Pidilite Industries Ltd. (Pidilite) manufactures products which can be segmented into:
i) Consumer Products which includes art materials and stationary, publications, food and fabric care, car products, adhesives and sealants.
ii) Specialty Industrial Products which includes industrial adhesives, industrial pigments, industrial and textile resins and leather chemicals.
• Its product portfolio includes strong brand names like Fevicol, Fevi Kwik, Dr. Fixit, M-Seal, Fevi-Stik, Hobby Ideas, Moto Max etc.
• Construction chemical is one of the fastest growing business units for the company. Pidilite broadly has two segment consumer bazaar (80 percent of sales) and industrial (20 percent of sales) with products that cater to various industries.
• It has been able to grow its topline and bottom-line at 21 percent CAGR for last 10 years.
• Pidilite has a very healthy dividend payout ratio of almost 33 percent currently which indicates that the company is commanding higher valuations compared to its peers.
• Pidilite Industries posted a 15% rise in consolidated topline to Rs 1,068.79 crore in quarter ended December 2013 compared to corresponding previous year period with 110 bps decrease in operating profit margins to 14.9% leading operating profit growth of 7% to Rs 159.16 crore.
Stock Returns (in percentage)
MTD : 7.23CYTD : 7.45 FYTD : 16.44
Tech Mahindra
• Tech Mahindra (Tech M) is a $2.7 billion company (Post merger with Satyam Computers Services) with over 80,000 professionals across 49 countries, helping over 560 customers including Fortune 500 companies.
• Its consulting; enterprise and telecom solutions, platforms and re-usable assets connect across a number of different technologies to derive tangible business value.
• Merger of Tech M with Mahindra Satyam (Satyam) will derive synergies from scale as this will help the company to qualify for larger deals, cross sell services and cut cost.
• Integration with Satyam Computers Services and reduced dependency on its top client, British Telecom, de-risks the revenue profile of the company and also balances the geography mix.
• With the merger, cross functional bidding is now a reality and with a topline of USD $2.7 bn, they can attempt larger deal bids as well. With relevance of mobility and data analytics cutting across sectors, Tech M's expertise in telecom can now be leveraged within Satyam's clientele as well.
• Sales and Marketing has been a weak area for Tech M due to captive business legacy of BT. This is now being strengthened by Satyam's entrance.
• While one company was debt laden, the other was cash rich. However, now with consolidation and a year of cash flows, they will not only be cash positive on a consolidated basis but also cut interest costs significantly.
• The Revenues came in at Rs 4,898.5 crore, up by 3% QoQ (3.3% QoQ volume growth) in December 2013 quarter. The growth in Sales was on the back of continued execution on the back of large deal pursuits and ability to expand services line in existing customers especially in the enterprise management. It has one large deal win during the quarter. The Active Client count stood at 605 in Q3FY14 vs 576 in Q2FY14.
Stock Returns (in percentage)
MTD : -3.85CYTD : -2.31 FYTD : 69.19

11
Stock Returns (in percentage)
MTD : -4.39CYTD : 5.91 FYTD : 50.15
Divi's Laboratories
• Divi's Laboratories Ltd. (Divi's) manufactures pharmaceutical products which include generic drugs and their intermediates.
• Divi's also undertakes contract research activities for other pharmaceutical companies.
• Currently, Divi's enjoys global market leadership in some of the technically complex Active Pharmaceutical Ingredients (APIs) where it holds 50 percent market share.
• Despite being a late entrant in some of these products, Divi's now commands a majority share of the global market, led by its low cost of manufacturing and exit of certain competitors.
• Divi's is expected to be a key beneficiary of the increased pharmaceutical outsourcing from India, given its strong relationships with global innovator pharmaceutical companies.
• Key growth drivers for Divi's include
i) Favorable environment for Contract Research and Manufacturing Services (CRAMS),
ii) Expertise in process chemistry, and
iii) Strong relationship with innovator due to non-compete business model.
• For quarter ending December2013, Divi's posted notable growth in Sales and came up with sharp growth in PAT on the back of strong operating performance during the quarter. The Company Standalone Sales grew by 29% YoY in Q3'FY14 to Rs 689.27 crore.
Stock Returns (in percentage)
MTD : -4.12CYTD : 11.84 FYTD : 37.18
Tata Motors
• Tata Motors designs, manufactures and sells heavy commercial, medium and small commercial vehicles, small cars and sports utility vehicles.
• Tata motors acquired Jaguar Land Rover (JLR), the business comprising the two iconic British brands.
• It also distributes Fiat cars in India and has an industrial joint venture with Fiat in India.
• A positive outlook for luxury vehicles and JLR's limited presence will drive secular growth. While JLR is strong in the SUV segment, its weakness in the luxury car segment offers significant headroom to grow driven by a refreshed product portfolio and planned launches over the next 2-3 years.
• JLR's 20 percent increase in H1FY 2014 volumes matched our expectations, but sales mix was superior with China contribution rising to ~23 percent (20.6 percent in FY 2013). We expect momentum to sustain due to:
i) Positive economic indicators in key markets, and
ii) Good response to new model launches.
• Tata Motors reported consolidated revenues (net of excise) of Rs 63,877 crore for the third quarter ended December 2013, a growth of 39% over Rs 46,090 crore for the corresponding quarter of the previous year, on the back of strong demand, growth in volumes and favourable product mix and geographic mix at Jaguar Land Rover (JLR).
• Jaguar Land Rover wholesale and retail volumes for the quarter ended December, 2013 grew by 22.7% and 26.5%, respectively, over the corresponding period last year and stood at 116,357 units and 112,172 units, respectively.
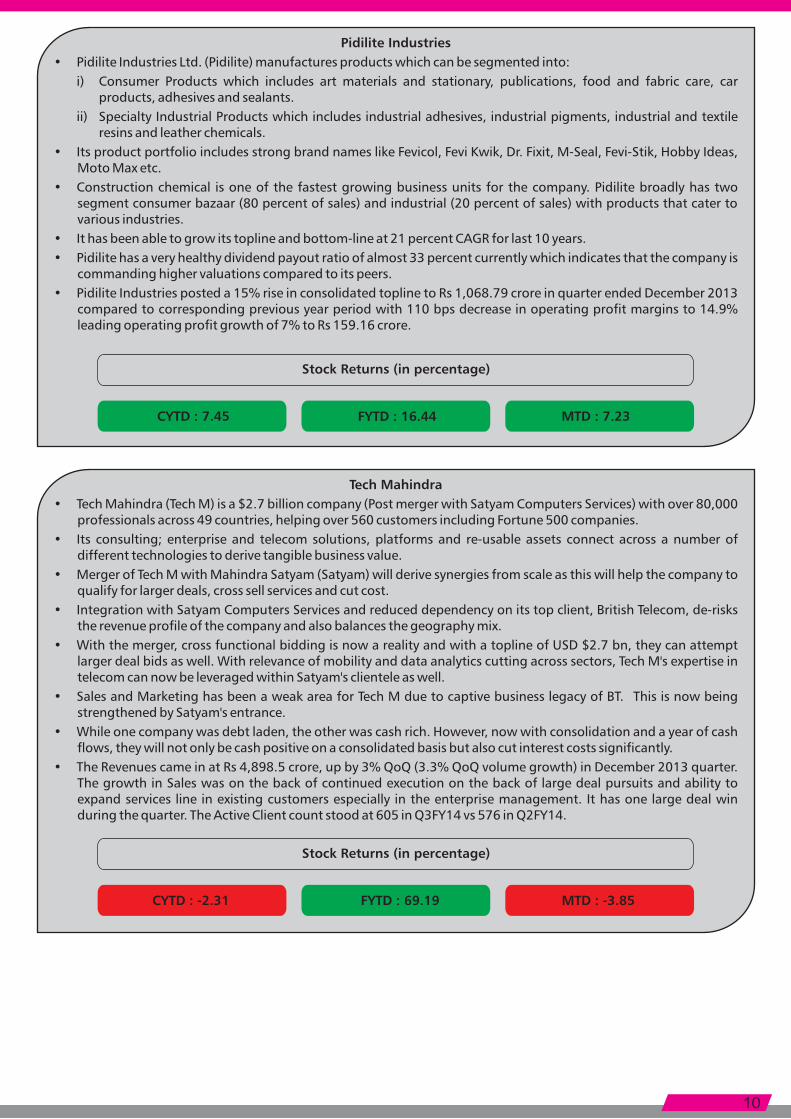
Colgate Palmolive
• Colgate-Palmolive (India) Limited (Colgate) is amongst India's one of the leading provider of scientifically proven oral care products with multiple benefits at various price points. The range includes toothpastes, toothpowder, toothbrushes and mouthwashes under the "Colgate" brand, as well as a specialized range of dental therapies under the banner of Colgate Oral Pharmaceuticals.
• In domestic market it enjoys 50% of market share. It is spread across 4.5 million retails outlets out of which 1.5 million are direct outlets.
• In November 2007, it acquired a 75% equity interest in Advanced Oral Care Products, Professional Oral Care Products and SS Oral Hygiene Products, the company is the fastest growing and one of the oldest companies catering to the personal care products. The company is regularly coming up with new products and has been a consistent financial performer.
• Colgate is setting up a state of the art toothpaste manufacturing facility at Sanand in Gujarat. The new factory will be the best in class manufacturing facility which is scheduled to commence commercial production in the current year.
• Colgate is at an advanced stage of obtaining various permissions for a new toothbrush manufacturing facility at Sricity in Chittoor District in Andhra Pradesh. This new toothbrush manufacturing facility is expected to commence commercial production in the year 2014.
• The net sales for December 2013 quarter have increased by 14% to Rs 891.11 crore. Colgate has achieved a volume growth of 10% led by a strong growth of 11% in toothpaste category wherein it further enhanced its leadership position by registering a 56% volume market share for Jan'13 - Dec'13 compared to 54.5% in Jan'12 - Dec'12. The company's net profit slightly increased to Rs. 112.83 crores against Rs. 111.05 crores in the corresponding quarter ending of previous year, an increase of 1.60%.
Stock Returns (in percentage)
MTD : 4.49CYTD : 1.42 FYTD : 7.50
12
Cairn India
• Cairn India (Cairn) is engaged in oil and gas exploration and production business.
• It accounts for over 25 percent of the country's oil production and contributing more than 80 percent of domestic production growth.
• Cairn operates the largest producing oil field in the Indian private sector.
• It has pioneered the use of cutting-edge technology to extend production life and have a world-class resource base, with an interest in 15 blocks in India.
• Oil production is expected to rise sharply by FY 2014, from 125,000 barrels per day to 242,000 barrels per day.
• Cairn India reported 17% increase in revenue to Rs 4,999.98 crore in Q3FY'14 post profit sharing with the GoI and the Rajasthan block royalty expense compared to Q3FY'13 driven by increased volumes. The profit petroleum and the royalty paid in the Rajasthan block (net to the company) was Rs 1,279 crore and Rs 1,113 crore respectively.
• Profits of the company fell 14% to Rs 2,884.04 crore mainly due to a foreign exchange loss on the dollar deposits with the strengthening of the Rupee to US dollar and due to extraordinary items impact.
Stock Returns (in percentage)
MTD : 2.71CYTD : 2.86 FYTD : 16.41
13
Maruti Suzuki India
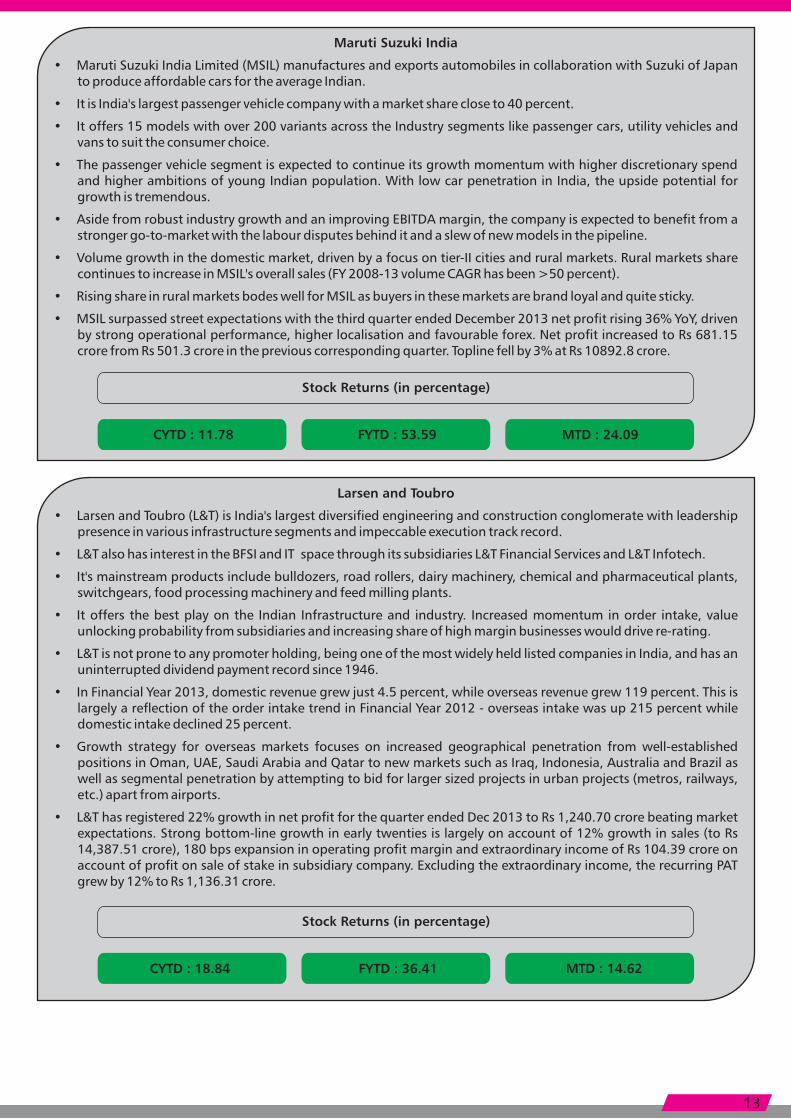
• Maruti Suzuki India Limited (MSIL) manufactures and exports automobiles in collaboration with Suzuki of Japan to produce affordable cars for the average Indian.
• It is India's largest passenger vehicle company with a market share close to 40 percent.
• It offers 15 models with over 200 variants across the Industry segments like passenger cars, utility vehicles and vans to suit the consumer choice.
• The passenger vehicle segment is expected to continue its growth momentum with higher discretionary spend and higher ambitions of young Indian population. With low car penetration in India, the upside potential for growth is tremendous.
• Aside from robust industry growth and an improving EBITDA margin, the company is expected to benefit from a stronger go-to-market with the labour disputes behind it and a slew of new models in the pipeline.
• Volume growth in the domestic market, driven by a focus on tier-II cities and rural markets. Rural markets share continues to increase in MSIL's overall sales (FY 2008-13 volume CAGR has been >50 percent).
• Rising share in rural markets bodes well for MSIL as buyers in these markets are brand loyal and quite sticky.
• MSIL surpassed street expectations with the third quarter ended December 2013 net profit rising 36% YoY, driven by strong operational performance, higher localisation and favourable forex. Net profit increased to Rs 681.15 crore from Rs 501.3 crore in the previous corresponding quarter. Topline fell by 3% at Rs 10892.8 crore.
Stock Returns (in percentage)
MTD : 24.09CYTD : 11.78 FYTD : 53.59
Larsen and Toubro
• Larsen and Toubro (L&T) is India's largest diversified engineering and construction conglomerate with leadership presence in various infrastructure segments and impeccable execution track record.
• L&T also has interest in the BFSI and IT space through its subsidiaries L&T Financial Services and L&T Infotech.
• It's mainstream products include bulldozers, road rollers, dairy machinery, chemical and pharmaceutical plants, switchgears, food processing machinery and feed milling plants.
• It offers the best play on the Indian Infrastructure and industry. Increased momentum in order intake, value unlocking probability from subsidiaries and increasing share of high margin businesses would drive re-rating.
• L&T is not prone to any promoter holding, being one of the most widely held listed companies in India, and has an uninterrupted dividend payment record since 1946.
• In Financial Year 2013, domestic revenue grew just 4.5 percent, while overseas revenue grew 119 percent. This is largely a reflection of the order intake trend in Financial Year 2012 - overseas intake was up 215 percent while domestic intake declined 25 percent.
• Growth strategy for overseas markets focuses on increased geographical penetration from well-established positions in Oman, UAE, Saudi Arabia and Qatar to new markets such as Iraq, Indonesia, Australia and Brazil as well as segmental penetration by attempting to bid for larger sized projects in urban projects (metros, railways, etc.) apart from airports.
• L&T has registered 22% growth in net profit for the quarter ended Dec 2013 to Rs 1,240.70 crore beating market expectations. Strong bottom-line growth in early twenties is largely on account of 12% growth in sales (to Rs 14,387.51 crore), 180 bps expansion in operating profit margin and extraordinary income of Rs 104.39 crore on account of profit on sale of stake in subsidiary company. Excluding the extraordinary income, the recurring PAT grew by 12% to Rs 1,136.31 crore.
Stock Returns (in percentage)
MTD : 14.62CYTD : 18.84 FYTD : 36.41

14
Stock Returns (in percentage)
MTD : -14.17CYTD : -5.82 FYTD : 11.50
Eicher Motors
• Eicher Motors limited (EML) is promoted by the Delhi-based Vikram Lal Group, is present in commercial vehicles, two wheelers and related components. It's a leader in Cruise bikes in India and No.2 player in Medium Commercial Vehicles.
• Royal Enfield Touted as the Indian Harley Davidson, It is the biggest beneficiary of this emerging leisure biking trend in India.
• The management has increased its production target to 280,000 units in CY2014 (from 250,000 units) and is expected that demand can reach 500,000 units in 3-4 years.
• Eicher Motors will invest Rs. 6 bn over the next two years in the Royal Enfield business to expand capacity in the Oragdum plant.
• Eicher Motors reported better-than expected results at the operating level, driven by strong performance by Royal Enfield.
• Consolidated net sales rose by 2% y-o-y and EBITDA grew by 41% y-o-y in 4QCY13.
• Royal Enfield reported 208% y-o-y EBITDA growth while the VECV business reported a 2% y-o-y EBITDA decline.
• The Royal Enfield business reported net profit of 118% y-o-y in 4QCY13, driven by 78% y-o-y growth in net sales and 850 bps y-o-y growth in EBITDA margin. Volumes increased by 72% y-o-y and demand continued to exceed expectations.
• The company reported 4QCY13 standalone EBITDA margin of 20.1%, versus 19.3% in 3QCY13 and 11.6% in 4QCY12, led by improvement in gross margins and positive operating leverage.
Stock Returns (in percentage)
MTD : -4.12CYTD : 19.81 FYTD : 133.61
Infosys
• Set up in 1981, Infosys in India is the second largest IT services' exporter with FY13 revenues of over US$ 7.4bn and employing nearly 157,000 people.
• Infosys has a global footprint in 23 countries and its key markets are north America & Europe. It also has development centers in India, China, Australia, UK, Canada and Japan.
• Its service offerings span from IT consulting to BPO, with bulk of revenues from software application dev & maintenance.
• Infosys posted muted (but inline) sales growth in a soft quarter but surprised the street with higher than expected improvement in margins during the quarter. The Company Consolidated Sales grew by 0.5% QoQ in Q3'FY14 to 13026 crore on the back 0.7% volume growth coupled with stable pricing environment during the quarter.
• In USD terms, the revenues grew by 1.7% QoQ to USD 2.1 billion for the quarter ended December 2013 and Net profit grew by 21% QoQ to USD 463 million for the same period.

15
Idea Cellular
• Idea Cellular (Idea) is an Aditya Birla Group Company and operates in two business segments: Mobility Services and Long Distance.
• As of March 31, 2013, it has a network of over 70,000 cell sites and 3,000 Service Centers servicing Idea subscribers across the country.
• Amongst the large listed players Idea is favorably placed, given its sole focus on domestic market and quality management.
• Furthermore, Idea is currently a small player in key metro markets like Mumbai/ Delhi - it is well placed to leverage on its established brand to make inroads into these markets, which is likely to allow it to benefit disproportionately to other industry players.
• Idea also enjoys low debt/equity ratio which makes the stock further attractive as an investment option.
• The key rationale for Idea is the positive industry outlook. Telecom industry after having gone through fierce competition has started to witness slow consolidation.
• While the telecom industry in India is experiencing the closure and downsizing of smaller and regional operators, bigger operators are likely to get benefit of this in their market shares. Idea is certainly a beneficiary of this change and consolidation.
• This is likely to have positive impact on industry profitability and bode positively for key established players. The reason we feel this is likely to sustain is that while mobile density was ~22 percent in FY08, it is now ~80 percent.
• Idea's consolidated sales in Q3'FY14 grew by 5% QoQ to Rs 6613.06 crore led by steady growth in voice minutes, exponential data volume growth coupled with further improvement in voice realized rate during the quarter. The Average Realization rate per Minute (ARPM) is improved by 0.2 paisa QoQ (up by 3.8 paisa YoY) to Rs 44.9 on the back of increased contribution from value added services.
Stock Returns (in percentage)
MTD : 6.63CYTD : -17.65 FYTD : 19.57
Cummins India
• Cummins India Limited (CIL) manufactures internal combustion engines, including diesel, reciprocating piston, gas turbine and gasoline engines.
• It also manufactures generating sets and public transport-type passenger motor vehicles, including luxury coaches and air-field buses.
• In addition, Cummins India Ltd. operates a computerized and fully-equipped research and development facility.
• CIL manufactures and sells around 40,000 engines per year used for various industrial sectors and ~10,000 engines for power generators.
• It has developed strong market position over 4 decades in diesel engines. CIL has strong business franchise in high horsepower engines due to product reliability, diverse product range, strong brand recall and after sales support services.
• It has leadership in power Genset market which is expected to grow faster due to power deficit. It has diversified revenue stream - 35% from Power back up genset, 7% Auto, 15% Industrial, 20% after sales services and 26% exports mainly to parent.
• CIL has registered 6% fall in revenue to Rs 1,023.01 crore. But the operating margin has expanded by modest 20 bps to 19.3% and that has marginally limited the impact at operating level restricting the de-growth at operating profit to 5% to Rs 197.56 crore. Eventually the net profit was lower by 37% to Rs 147.23 crore.
Stock Returns (in percentage)
MTD : 18.06CYTD : 24.55 FYTD : 19.10

16
Data Source for Stock Returns: www.nseindia.com;
CTYD: Calendar Year to Date (1st Jan 2014 to 31st Mar 2014) • FYTD: Financial Year to Date (1st Apr 2013 to 31st Mar 2014) • MTD: Month to Date (1st Mar 2014 to 31st Mar 2014)
Source for write ups : MOAMC Internal Research
Disclaimer: The statement contained herein may include statement of future expectations and other forward looking statements that are based on external views and assumptions and involve known and unknown risks and uncertainties that could cause actual results, performance or event to differ materially from those expressed or implied in such statement. The above information/news/data are already available in public. Motilal Oswal Asset Management Company Ltd. (MOAMC) does not take the responsibility for the authenticity of the above information/news/data. The above mentioned Stocks are part of Motilal Oswal MOSt Focused 25 Fund. The Stocks mentioned above are only for the purpose of information and should not be construed as recommendation from MOAMC. The Fund Manager retains the flexibility to increase or decrease the exposure of a stock or to exit a stock.
Mutual Fund Investments are subject to market risks, read all scheme related documents carefully.
Hero MotoCorp
• Hero MotoCorp Limited (HMCL), formerly Hero Honda Motors Limited is engaged in the manufacture of motorcycles and its parts and ancillary services.
• HMCL has 17 different products across 100 cubic centimeter (cc), 125cc, 150cc, 225cc and scooter category.
• Two wheeler sector a key beneficiary of discretionary spend increases, is likely to display healthy growth. With sector controlled by just three major players all incremental growth set to be shared by incumbents. HMCL's dominant market share puts it in a strong position.
• It enjoys a strong distribution network with over 3,500 outlets and equally strong brand equity.
• Company has also started exporting to certain markets Central America and Africa, along with starting its first overseas assembly line in Kenya.
• During the festive month of October 2013, HMCL has reported sales of 625,420 units which is highest ever during a month achieved in the 2 Wheeler Industry in India.
• HMCL is expected to improve its domestic growth and market share led by new product launches and dominance in rural areas which will likely benefit from the good monsoon.
• Hero MotoCorp reported 8% rise in net profit at Rs 524.66 crore for its third quarter ended Dec 2013. Net sales during Q3FY14 was up 11% at Rs 6,877 crore over the year-ago period. Market had expected profit of Rs 620 crore on revenues of Rs 6,900 crore for the quarter.
Stock Returns (in percentage)
MTD : 15.64CYTD : 9.61 FYTD : 48.36
CRISIL Limited
• CRISIL is India's leading rating agency and pioneered the concept of credit ratings in the country in 1987. The offices of the company have its global presence in New York, Argentina, Singapore, Poland, London and China.
• CRISIL's ratings revenue has grown at CAGR of 24% over CY 2006 to CY 2013 on the back of its fast growing client relationships. It has over 60,000 client relationships across bonds, BLR and SME. While the proportion of client are skewed towards low-margin businesses such as BLR and SME, it is expected that these clients will over the time become prospective clients for bond business. CRISIL's strong SME relationship provides an edge over the peers since they enjoy negligible presence in this segment.
• CRISIL has been able to scale up its research business from mere 13.8 Crs in FY2004 to 640 Crs in CY2013, largely aided by successful acquisitions spread over last 10 years.
• It acquired INFAC in 2000, IREVNA in 2004, Pipal in 2010 and Coalition in 2012. These acquisitions have strengthened its product bouquet as well as its presence in research. The acquisition have not only helped the company to reduce its dependence on ratings, but also improved its overall profitability.
• CRISIL has been able to successfully diversify its business model without straining its profitability. On the contrary, with every acquisition its profitability has improved which is much evident from the rise in its RoE from 21% in FY2004 to 40% in CY2013.
• Higher dividend payouts and frequent buybacks have helped the company to maintain higher profitability. This clearly reflects the capability of management and its intent to maximize returns to the shareholders.
• During December 2013 quarter, on consolidated basis, CRISIL registered a 16% increase in consolidated revenues to Rs 305.10 crore. OPM improved from 34.1% to 35.2% taking OP up 20% to Rs 107.26 crore. Other income fell 58% to Rs 3.39 crore and depreciation down 3% to Rs 9.08 crore, after which PBT grew 15% to Rs 101.57 crore.
• Provision for taxation was up 9% to Rs 30.65 crore after which PAT rose 18% to Rs 70.92 crore.
Stock Returns (in percentage)
MTD : 9.55CYTD : 2.42 FYTD : 35.11