Embed Size (px)
Citation preview

S1
Supplementary Information
Polydiacetylene Liposomes with Phenylboronic Acid
Tags: A Fluorescence Turn-On Sensor for Sialic Acid
Detection and Cell Surface Glycan Imaging
Dong-En Wang,ab Jiahang Yan,a Jingjing Jiang,a Xiang Liu,a Chang Tian,c Juan Xu,a Mao-Sen Yuan,a
Xiang Han,a Jinyi Wang*,a
a College of Chemistry & Pharmacy, Northwest A&F University, Yangling, Shaanxi 712100, P. R.
China
b School of Life Sciences, Northwestern Polytechnical University, Xi’an, Shaanxi 710072, P. R. China
c College of Veterinary Medicine, Northwest A&F University, Yangling, Shaanxi 712100, P. R. China
* Corresponding author. Tel: +86-29-87082520; fax: +86-29-87082520
E-mail address: [email protected].
Electronic Supplementary Material (ESI) for Nanoscale.This journal is © The Royal Society of Chemistry 2018
S2
Characterization and general methods. 1H-nuclear magnetic resonance (NMR) and 13C-NMR spectra
were recorded using a Bruker Avance DMX 500 MHz/125 MHz spectrometer. Peaks were based on a
tetramethylsilane (TMS) internal standard. Electrospray ionization mass spectroscopy (ESI-MS) data
were obtained using a Thermo Scientific LCQ FLEET mass spectrometer equipped with an electrospray
ion source and controlled by Xcalibur software (Thermo Fisher Scientific, Waltham, MA, USA).
Steady-state fluorescence spectra and decay curves were obtained using an Hamamatsu C11367-11
fluorescence spectrometer equipped with a 450 W Xe lamp and a time-correlated single photo counting
card.
HO
O
7
8
Cl
O
7
8
O
O
7
8
Thionyl chloride
PCDA-Cl
PCDA-pBA
THF, 6 h, RT
BHO
HO
PCDA
4-Hydroxyphenylboronic acid,THF, RT, 12 h
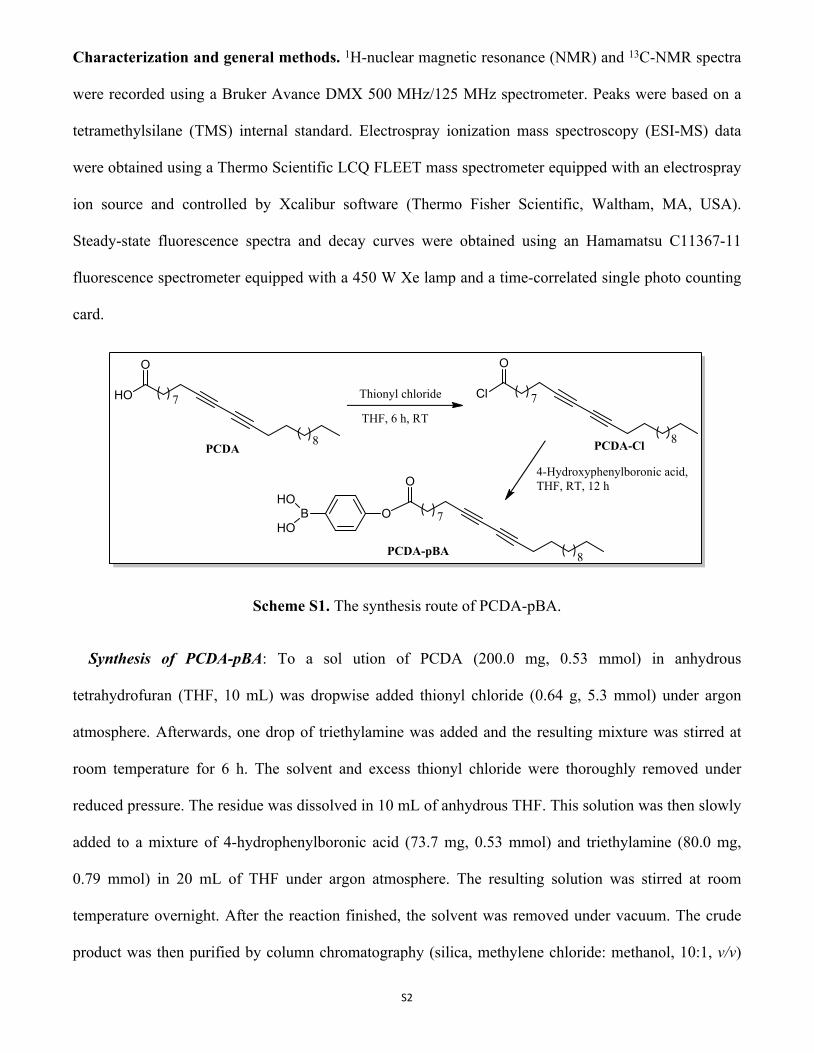
Scheme S1. The synthesis route of PCDA-pBA.
Synthesis of PCDA-pBA: To a sol ution of PCDA (200.0 mg, 0.53 mmol) in anhydrous
tetrahydrofuran (THF, 10 mL) was dropwise added thionyl chloride (0.64 g, 5.3 mmol) under argon
atmosphere. Afterwards, one drop of triethylamine was added and the resulting mixture was stirred at
room temperature for 6 h. The solvent and excess thionyl chloride were thoroughly removed under
reduced pressure. The residue was dissolved in 10 mL of anhydrous THF. This solution was then slowly
added to a mixture of 4-hydrophenylboronic acid (73.7 mg, 0.53 mmol) and triethylamine (80.0 mg,
0.79 mmol) in 20 mL of THF under argon atmosphere. The resulting solution was stirred at room
temperature overnight. After the reaction finished, the solvent was removed under vacuum. The crude
product was then purified by column chromatography (silica, methylene chloride: methanol, 10:1, v/v)
S3
to obtain the desired compound PCDA-pBA as a white solid (170.0 mg, 64.4%). 1H NMR (500 MHz,
CDCl3) δ (ppm): 8.28 (d, J = 8.4 Hz, 2H), 7.28 (d, J = 8.5 Hz, 2H), 2.64 (t, J = 7.5 Hz, 2H), 2.27–2.32
(m, 4H), 1.80–1.86 (m, 2H), 1.59–1.54 (m, 4H), 1.30–1.38 (m, 26H), 0.93 (t, J = 7.0 Hz 3H). 13C NMR
(125 MHz, CDCl3) δ (ppm): 171.94, 154.59, 137.14, 121.32, 77.65, 77.43, 65.41, 65.28, 34.49, 31.94,
29.67, 29.65, 29.63, 29.50, 29.36, 29.12, 29.08, 28.93, 28.89, 28.78, 28.39, 28.33, 24.89, 22.71, 19.24,
14.13. ESI-MS m/z: calculated for C31H47BO4, 494.36, found [M+Na]+, 517.34.
O
O
OEtOH, 60 oC, ref lux
N
O
O
Br
NH2O
O
N
O
O
NH
NBr
O
O
2PCDA-NHS
3
Br
DCM, TEA,RT, 12 h
4
8
7
O
8
7
O
8
7NH
NNH
O
O
N
N,N-dimethylethylenediamine, 2-methoxyethanol, ref lux, 24 h
Acetone, CH3I, 56 oC, 5 h
Ethylenediamine
PCDA-Nap
O
8
7NH
NNH
O
O
N
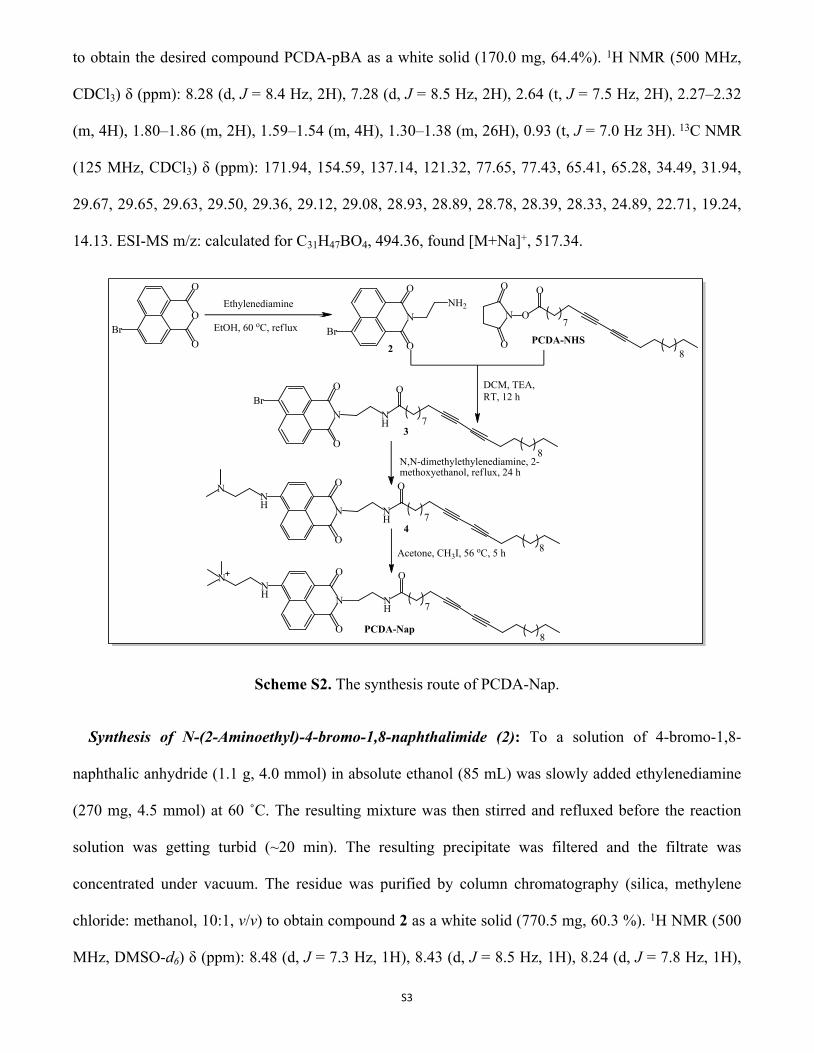
Scheme S2. The synthesis route of PCDA-Nap.
Synthesis of N-(2-Aminoethyl)-4-bromo-1,8-naphthalimide (2): To a solution of 4-bromo-1,8-
naphthalic anhydride (1.1 g, 4.0 mmol) in absolute ethanol (85 mL) was slowly added ethylenediamine
(270 mg, 4.5 mmol) at 60 ˚C. The resulting mixture was then stirred and refluxed before the reaction
solution was getting turbid (~20 min). The resulting precipitate was filtered and the filtrate was
concentrated under vacuum. The residue was purified by column chromatography (silica, methylene
chloride: methanol, 10:1, v/v) to obtain compound 2 as a white solid (770.5 mg, 60.3 %). 1H NMR (500
MHz, DMSO-d6) δ (ppm): 8.48 (d, J = 7.3 Hz, 1H), 8.43 (d, J = 8.5 Hz, 1H), 8.24 (d, J = 7.8 Hz, 1H),

S4
8.13 (d, J = 7.8 Hz, 1H), 7.93 (t, J = 7.5 Hz, 1H), 4.06 (t, J = 6.8 Hz, 2H), 2.84 (t, J = 6.8 Hz, 2H).
Synthesis of compound 3: PCDA-NHS (260 mg, 0.55 mmol) and compound 2 (180 mg, 0.56 mmol)
were dissolved in 10 mL anhydrous dichloromethane (DCM). Then, triethylamine (66.4 mg, 0.58 mmol)
was added into the solution. The reaction was carried out in the dark at room temperature overnight. The
solvent was evaporated in vacuo and the residue was purified by column chromatography (silica,
methylene chloride: methanol, 50:1, v/v) to obtain compound 3 as a white solid (110 mg, 29.7 %). 1H
NMR (500 MHz, CDCl3) δ (ppm): 8.70 (dd, J = 7.3, 1.1 Hz, 1H), 8.64 (dd, J = 8.5, 1.1 Hz, 1H), 8.46 (d,
J = 7.9 Hz, 1H), 8.10 (d, J = 7.9 Hz, 1H), 7.91 (dd, J = 8.5, 7.3 Hz, 1H), 4.47–4.39 (m, 2H), 3.72 (q, J =
5.4 Hz, 2H), 2.31–2.23 (m, 4H), 2.14–2.09 (m, 2H), 1.52 (m, 6H), 1.44–1.15 (m, 26H), 0.92 (t, J = 7.0
Hz, 3H). 13C NMR (125 MHz, CDCl3) δ (ppm): 173.49, 164.26, 133.66, 132.35, 131.52, 131.23, 130.75,
129.11, 128.19, 122.81, 121.93, 77.66, 77.48, 65.37, 65.28, 39.66, 39.18, 36.74, 31.94, 29.67, 29.65,
29.63, 29.50, 29.36, 29.15, 29.13, 28.89, 28.83, 28.77, 28.39, 28.31, 25.53, 22.71, 19.24, 19.21, 14.13.
Synthesis of compound 4: Compound 3 (200 mg, 0.3 mmol) and N,N-dimethylethylenediamine
(523.4 mg, 5.9 mmol) were dissolved in 10 mL of 2-methoxyethanol. The resulting mixture was stirred
and refluxed for 24 h. After cooling to room temperature, the reaction solution was diluted with 30 mL
of chloroform and poured into 50 mL of water. The organic layer was separated and the aqueous layer
was extracted with chloroform (3 × 10 mL). The combined organic layer was dried over anhydrous
Na2SO4 and concentrated under vacuum. The crude product was purified by column chromatography
with methylene chloride/methanol (25:1, v/v) as the eluent to afford compound 4 as a yellow solid (130
mg, 64.1 %). 1H NMR (500 MHz, CDCl3) δ (ppm): 8.63 (d, J = 7.3 Hz, 1H), 8.50 (d, J = 8.4 Hz, 1H),
8.24 (d, J = 8.3 Hz, 1H), 7.68 (t, J = 7.5 Hz, 1H), 6.72 (d, J = 8.5 Hz, 1H), 6.45 (m, 2H), 4.50–4.37 (m,
2H), 3.73–3.63 (m, 2H), 3.53–3.41 (m, 2H), 2.82 (t, J = 5.8 Hz, 2H), 2.41 (s, 6H), 2.26 (m, 4H), 2.15 (t,
J = 7.6 Hz, 2H), 1.59–1.51 (m, 4H), 1.50–1.44 (m, 2H), 1.44–1.20 (m, 26H), 0.92 (t, J = 7.0 Hz, 3H).
13C NMR (125 MHz, CDCl3) δ (ppm): 173.48, 165.38, 164.90, 150.05, 135.00, 131.53, 129.99, 127.00,
124.76, 122.62, 120.47, 109.60, 104.48, 77.64, 77.55, 65.32, 56.89, 44.98, 40.13, 40.08, 38.99, 36.83,

S5
31.93, 29.66, 29.64, 29.63, 29.50, 29.36, 29.16, 29.12, 28.89, 28.83, 28.40, 28.35, 25.60, 22.70, 19.24,
19.21, 14.13.
Synthesis of PCDA-Nap: To a solution of compound 4 (130 mg, 0.19 mmol) in 10 mL of acetone
was added methyl iodide (114 mg, 0.8 mmol). The reaction solution was stirred and refluxed at 56 ˚C
for 5 h. After cooling to room temperature, the resulting yellow precipitate was filtered and wash with
cold acetone to obtain the desired PCDA-Nap as a yellow solid (129 mg, 97.3 %). 1H NMR (500 MHz,
DMSO-d6) δ (ppm): 8.65 (d, J = 8.1 Hz, 1H), 8.48 (d, J = 6.8 Hz, 1H), 8.34 (d, J = 8.4 Hz, 1H), 7.85 (t,
J = 6.0 Hz, 1H), 6.97 (d, J = 8.6 Hz, 1H), 4.13 (t, J = 6.1 Hz, 2H), 3.91–3.95 (m, 2H), 3.71 (t, J = 6.5 Hz,
2H), 3.44–3.36 (m, 2H), 3.25 (s, 9H), 2.29 (t, J = 6.9 Hz, 4H), 1.96 (t, J = 7.4 Hz, 2H), 1.29–1.47 (m,
6H), 1.35–1.16 (m, 26H), 0.87 (t, J = 6.9 Hz, 3H). 13C NMR (125 MHz, DMSO-d6) δ (ppm): 172.67,
164.36, 163.58, 149.82, 134.25, 131.17, 129.85, 128.57, 125.26, 122.77, 120.89, 109.88, 104.84, 78.49,
78.45, 65.84, 63.20, 53.31, 40.48, 37.43, 37.00, 35.94, 31.77, 29.48, 29.42, 29.34, 29.18, 29.13, 29.03,
28.87, 28.76, 28.70, 28.65, 28.23, 28.18, 25.56, 22.57, 18.80, 18.77, 14.42. ESI-MS m/z: calculated for
C44H65N4O3+, 697.51, found [M]+, 697.41.
S6
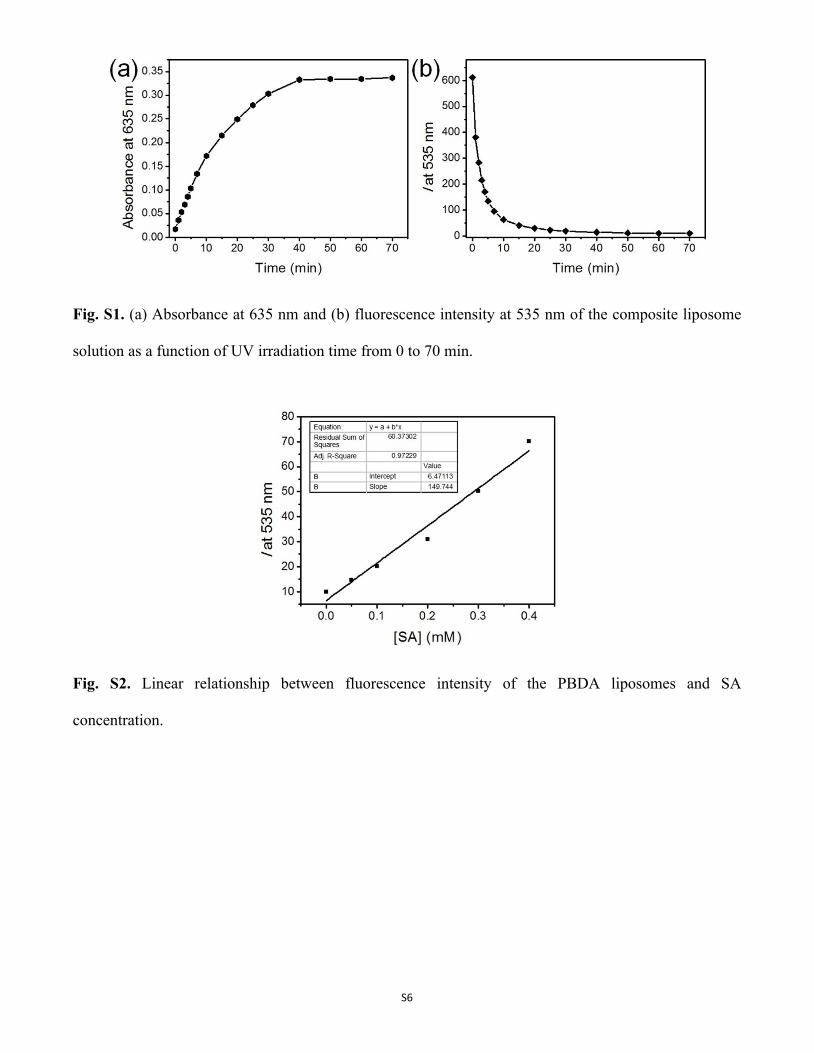
Fig. S1. (a) Absorbance at 635 nm and (b) fluorescence intensity at 535 nm of the composite liposome
solution as a function of UV irradiation time from 0 to 70 min.
Fig. S2. Linear relationship between fluorescence intensity of the PBDA liposomes and SA
concentration.
S7
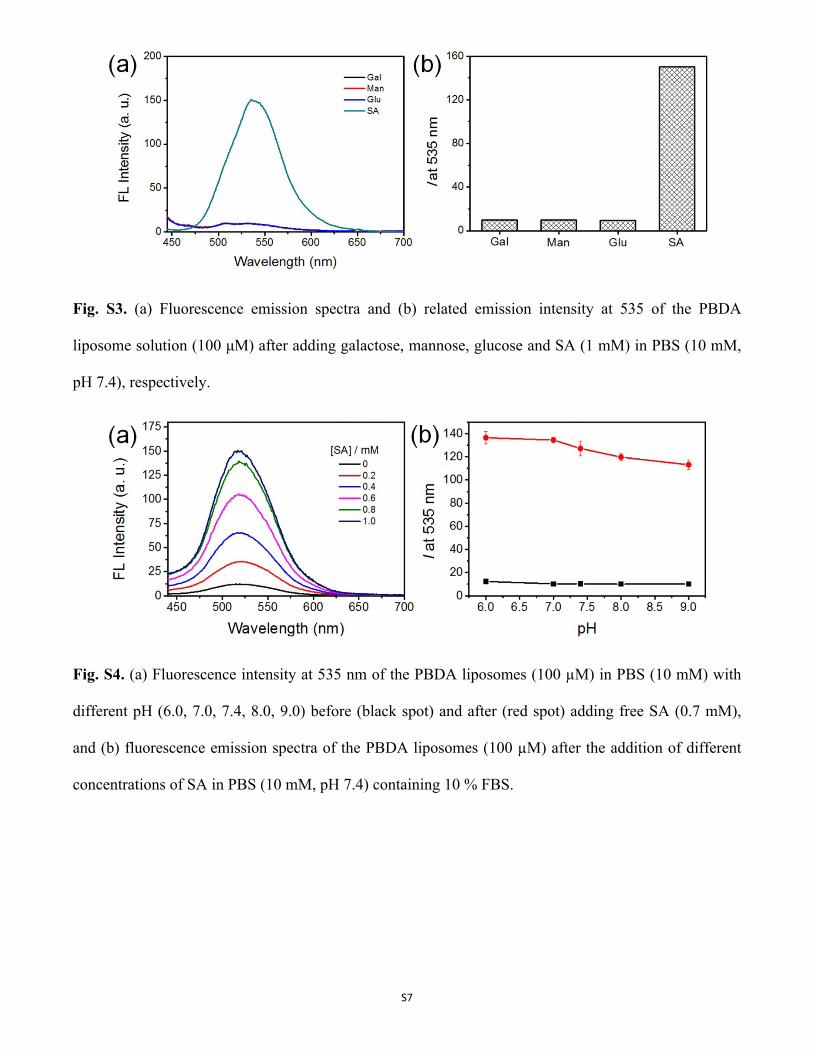
Fig. S3. (a) Fluorescence emission spectra and (b) related emission intensity at 535 of the PBDA
liposome solution (100 μM) after adding galactose, mannose, glucose and SA (1 mM) in PBS (10 mM,
pH 7.4), respectively.
Fig. S4. (a) Fluorescence intensity at 535 nm of the PBDA liposomes (100 µM) in PBS (10 mM) with
different pH (6.0, 7.0, 7.4, 8.0, 9.0) before (black spot) and after (red spot) adding free SA (0.7 mM),
and (b) fluorescence emission spectra of the PBDA liposomes (100 µM) after the addition of different
concentrations of SA in PBS (10 mM, pH 7.4) containing 10 % FBS.

S8
Fig. S5. (a) Fluorescence emission spectra of the PDA liposomes (100 µM) prepared from PCDA-pBA
and PCDA-Nap (molar ratio of 9:1) after adding different concentrations of free SA in PBS (10 mM, pH
7.4), and (b) fluorescence emission spectra of the PDA liposomes (100 µM) prepared from PCDA-EA
and PCDA-Nap (molar ratio of 9:1) after adding different concentrations of free SA in PBS (10 mM, pH
7.4).
Fig. S6. Time-resolved fluorescence decays of the PBDA liposomes before polymerization, after
polymerization and then after SA addition.

S9
Fig. S7. Confocal fluorescence images of HepG2 cells (a) and AML-12 cells (b) after being treated with
the PBDA liposomes, and corresponding overlapped fluorescence and bright-field images of HepG2
cells (b) and AML-12 cells (d) after being treated with the PBDA liposomes, scale bar: 20 μm. (e) and (f)
Flow cytometry profile (e) and MFI (f) of HepG2 and AML-12 cells incubated with the PBDA
liposomes, red line: control, orange line: AML-12 cells and blue line: HepG2 cells.

S10
Fig. S8. 1H NMR spectrum of PCDA-pBA in CDCl3.
Fig. S9. 13C NMR spectrum of PCDA-pBA in CDCl3.

S11
Fig. S10. 1H NMR spectrum of PCDA-Nap in DMSO-d6.
Fig. S11. 13C NMR spectrum of PCDA-Nap in DMSO-d6.


![Electronic Supporting Information (ESI)Ru[4,4’-(HO2C)2-bpy]3 Cl2 (LRu) (0.005 mmol, 4.6 mg) and YbCl3 6H2O (0.0065 mmol, 2.52 mg). The red precipitates were isolated by washing with](https://img.dokumen.tips/doc/110x75/5ec422da018dad7b2618be23/electronic-supporting-information-esi-ru44a-ho2c2-bpy3-cl2-lru-0005.jpg)


![1 8 · · 2014-09-16(profil Brod) byla vletech 2011 ... [6] a doporučeným ... mg/l mg/l mg/l mg/l mg/l mg/l mmol/l mmol/l Dešťový odtok 15 80 3 0.5 160 1 0,4 7,4 0,43](https://img.dokumen.tips/doc/110x75/5afb7d347f8b9ad22090acb1/1-8-profil-brod-byla-vletech-2011-6-a-doporucenm-mgl-mgl-mgl-mgl.jpg)


![0DWHULDO (6, IRU1DQRVFDOH+RUL]RQV Splitting 7KLV ... · Synthesis ofCONNi(OH) 2 and Ni3Se4 microsized sheets. In a typical synthesis of Ni(OH)2 nanosheets, NiCl2·6H2O (1.5 mmol),](https://img.dokumen.tips/doc/110x75/5e14d102bd7a59612d52b70a/0dwhuldo-6-iru1dqrvfdohrulrqv-splitting-7klv-synthesis-ofconnioh-2-and.jpg)