Embed Size (px)
Citation preview

Code Comparison of Structural Design Actions Part 4: Earthquake Actions in Australia AS1170.4 – 1993 & 2007
Deborah G Hegarty ME (Hons), B.Sc. (Eng), Dip. Eng, MIEAust CPEng
September 2009
ABSTRACT:
With the introduction of the new code AS1170.4 – 2007 Earthquake Actions in Australia, it was vital to establish the consequences to the design of structures.
This paper investigates the differences between the old AS1170.4:1993 code and the new AS1170.4:2007 code. With a detailed comparison of the differences between the Notation, Factors and the calculation of the Design Base Shear.
The assumptions made for site soil class, structural system and performance for calculating the percentage of seismic loading that the lateral resisting system are subjected to have significant implications to structures. Also revision in the calculation of the natural period of the structures has a bearing in relation to the height of structures that are most effected.
The magnitude of the design base shear applied for all structural system types and for all sub-soil classes has been calculated. Graphs showing the percentage of seismic weight applied to structural systems for all the sub-soil classes have been produced which allows immediate implication recognition.
Comparison of Structural Design Actions Part 4: Earthquake Actions in Australia AS1170.4 – 1993 & 2007
September 2009
1 INTRODUCTION
An increased global awareness of natural disasters due to environmental changes has influenced our assessment of risk. Historically seismic risk in Australia was considered to have low seismicity and that events have mainly effect unpopulated areas. Due to Australia’s low seismicity, buildings have not been designed for the ductility required for higher return period events which increases vulnerability to a catastrophic disaster. Risk is the combination of the event and the vulnerability of structures.
The prevention of structural failure due to natural disaster events such as earthquakes in Australia has been of utmost concern since the development of the first code in the 1970’s. Since then there has been development in understanding the physical geological element, structural behaviour and risk assessment. Further to the unexpected disaster in Newcastle, NSW, in 1989 there was an updating of the AS2121 1979 code which was the AS1170.4:1993 code, which has been developed further into the AS1170:2007 code of today.
Why, How and So What? Are all questions that must be answered to understand the reasons there have been revisions and the implications of them for the safe design of structures to withstand a seismic event.
It was originally considered to develop a new code to replace the AS1170.4:1993 code in combination with the earthquake codes of New Zealand and Australia but due to extreme difficulties in the drafting stages due to differences in the seismicity of the two countries it was decided to draft two individual documents. In the new AS1170.4:2007 code the design methods have been simplified and where possible similar notation has been used to the New Zealand code [28] [29].
The old and the new codes [4] [7] vary in notation and therefore the revisions will be described in detail prior to the implications being examined for structural systems in Section 10. It should be noted that a comprehensive list is presented of all the revisions that have been made in the preface to the new code. There have been 20 revisions noted.
2 SITE HAZARD
The acceleration coefficient, a, “an index related to the severity of earthquake ground motion” in the old code [4], is now notated as the Hazard Factor, Z in the new code [7].The maps used represent the 10% chance of exceedance in 50 years of the derived force, corresponding to the average recurrence level of approximately 500 years. Therefore there is a 10% chance that a 500-year earthquake will occur during a 50 year period, and a 90% chance that it won’t.
Six cities around Australia have revised site hazard factors however the contour maps have remained the same. Darwin for example in both the old and new maps was located on the 0.09 contour therefore this revision is more a correction of the old table than an increase in the hazard factor.
In AS1170.0:2002 Appendix D, the probability factor allows for the use of annual probability of exceedance as a means of setting the level of performance. The structure type reference was replaced by importance level. The probability factor is required to scale spectra to return periods

Comparison of Structural Design Actions Part 4: Earthquake Actions in Australia AS1170.4 – 1993 & 2007
September 2009
other than 500 years, as required for the serviceability limit state and for various combinations of structural importance level and reference periods. A portion of the probability factors are shown below and compared
Probability Factor (kp) Annual Probability of
Exceedance 2002 2007
1:2500 1.80
1:1500 1.50
1:1000 1.40 1.30
1:800 1.25 1.25
1:500 1.00 1.00
1:250 0.75 Table 2-1 this table shows the differences between the Probability factor (kp) for AS1170.0:2002 Appendix D [6] and the
AS1170.4:2007 Values [7]
Table 2-1 shows the difference in the values of the probability factor kp for the AS1170.0:2002 code [6] and the new code [7]. The values shown in Table 2-1 are similar to the New Zealand Return Period Factor Rs and Ru, Refer to Figure 2-1 (extract from NZS 1170.5 Supp1:2004 [29]). This is contrary to beliefs that for a low seismic country such as Australia, a ratio of the hazard factor between the 2500yr and the 500yr event would be greater than the same ratio for a high seismic country such as New Zealand.
Figure 2-1 Comparison of proposed R-Factors for New Zealand with Hazard curves for 0.5s Spectral Accelerations [29]
In Figure 2-1 the values for kp have been derived by drawing a representative line through the hazard curves (response spectrum acceleration as a function of return period) normalized by the 500 year values for various structural periods for a range of locations. An equivalent representative line for Australia would be expected to have been chosen. This response factor does not consider the magnitude of the event and therefore is a scaling factor only.

Comparison of Structural Design Actions Part 4: Earthquake Actions in Australia AS1170.4 – 1993 & 2007
September 2009
There has also been significant revision to the BCA [11] decreasing the annual probability of exceedance values for importance level 3 and 4 structures, see Table 2-2.
BCA Table B1.2b
Annual probability of exceedance
Importance Level 2007 Previous
1 1:250 1:500 2 1:500 1:500 3 1:1000 1:500 4 1:1500 1:800
Table 2-2 this table shows the differences between the current and previous annual probability of exceedance values from the BCA [11].
With the decrease of the 3 and 4 Importance level to an annual probability of exceedance of 1:1000 and 1:1500 respectively means a multiplication factor of 1.3 and 1.5 on the base shear value rather than a 1.0 and 1.25 previously used. In the new code [7] a special study is required for importance level 4 classification to ensure that they remain serviceable for immediate use following the design event for importance level 2 structures. That is to say that the building deflections are to be calculated using a kp factor of 1.0 for the seismic load.
3 SITE FACTOR / SUB SOIL CLASS AND SPECTRAL SHAPE FACTOR
Both the new and old codes use response spectra to define the magnitude of peak response of a single degree of freedom system to a given seismic event. In earthquake engineering, response spectra for a defined level of strong ground shaking are commonly used to define peak structural response in terms of peak acceleration, velocity and displacement. The response spectrum used to define the site classification in the new code has been revised.
3.1.1 Response Spectra and Spectral Shape Factor (Ch(T)) In the new code the spectral shape factor is introduced and is the combined multiplication factor taking into account the sites condition and the structural period of the building. The resonance of the site has large implications on the amplifying of the ground motion.
Wilson et al. [34] have shown that the old code [4] is conservative, as velocity and displacement responses increase indefinitely with increasing natural period, which does not reflect the physical reality. Equations for the calculation and producing of response spectra are shown in Figure 3-1.
In Figure 3-1, Fa is the site coefficient for the acceleration controlled region of the response spectrum and Fv is the site coefficient for the velocity and displacement controlled region of the response spectrum. This maximum acceleration can be obtained in the new code [7] using the constant values of Ch(T) for each sub-soil class, from Table 6.4, multiplied by the Z factor.

Comparison of Structural Design Actions Part 4: Earthquake Actions in Australia AS1170.4 – 1993 & 2007
September 2009
Figure 3-1 shows the demand curve consistent with the AS1170.4 model [34] [35]
In AS1170.4 1993: RSVmax = 1.8(PGV)S
In AS1170.4 2007: RSVmax = 1.8(PGV)Fv
In both codes RSDmax = (T2 / 2π) RSVmax
Where PGV is the peak ground velocity was 750 a and is now 750KpZ.
Lam and Wilson specify a value for RSAmax = 3(kpZ)Fa where “3” (instead 2.5) reflects the well known phenomenon of high spectral amplification in the short period range with interplate earthquakes. In calculating the acceleration response spectrum model the formulae have been revised to obtain a more realistic response level to take account the resonance. These response spectra have been adopted into the code and the implications to the base shear multiplier has been presented in Section 10.
3.1.2 Site Classification The new code [7] defines the Site class according to both soil type and depth, which determines the site’s dynamic stiffness and period. The soil type and depth are major factors in determining the site’s dynamic response characteristics, along with the impedance contrast with underlying rock, the damping of the soil, and its degree of nonlinearity.
1997 2007
Site Factor S Sub-Soil Class
0.67 Strong Rock Ae (0.8 Fa) (0.8 Fv)
1 Rock Be (1.0 Fa) (1.0 Fv)
1.25 Shallow Soil Ce (1.25 Fa) (1.4 Fv)
1.5 Deep or Soft Soil De (1.25 Fa) (2.3 Fv)
2 Very Soft Soil Ee (1.25 Fa) (3.50 Fv) Table 3-1 shows the difference in the Sub-Soil Class values [22]
Comparison of Structural Design Actions Part 4: Earthquake Actions in Australia AS1170.4 – 1993 & 2007
September 2009
Values for S, in the Table 3-1 are from Wilson and Lam’s paper [22] and are the recommended values for a return period of 500yr.
The Sub-Soil Class Factors S values in the new code [7] have been increased significantly compared to the old code [4] Site Factor, S. However the new values of S have not been defined in the new code [7]. The Sub-Soil class factor has now been combined in the spectral shape factor.
4 SELECTION OF EARTHQUAKE DESIGN CATEGORY
The design requirements are constructed to reflect the relationship between the use of a structure and the level of earthquake motion it may be exposed. The main concern with earthquake design is the protection of life and the degree of exposure of the public to earthquake risk.
In the new code [7], there are three earthquake categories, I through to III. The intensity of the event predicted gets more severe as you move from I to III. The simple description of requirements for each category is as follows:
I – a minimum static check
II – static analysis
III – dynamic analysis
As in the 1993 code, each design category relates the soil type, ground acceleration and importance factor based on type of structure but they have also considered the height of the structure.
As the new code gives general requirements for all structures (regular or irregular), the inclusion of height in the definition of earthquake design category allows for the definition of analysis type to be selected. For importance level 2 structures a minimum of static analysis is required for all buildings between 12m and 50m irrespective of the soil classification. For buildings over 50m in height a dynamic analysis must be carried out. This is a significant increase in the number and types of structures requiring dynamic analysis.
For importance level 3 structures static analysis is required for all buildings less than 50m irrespective of the soil classification. For the most onerous soil classification static analysis is required for buildings less than 25m. For buildings over 50m in height and for structures greater than 25m on soil class Ee, a dynamic analysis must be carried out.
Although importance level 4 structures require a special study to ensure that they remain serviceable for immediate use following a design earthquake event, it should be noted that all importance level 4 structures greater than 12m in height require dynamic analysis.
With height restrictions governing the analysis method, a more onerous but practical determination of structural behaviour than previously considered is required. The engineer gains a greater understanding of modal response and building irregularities when a computer generated model is produced and analysed.

Comparison of Structural Design Actions Part 4: Earthquake Actions in Australia AS1170.4 – 1993 & 2007
September 2009
There are an increased number of structures requiring dynamic analysis with the new height classifications used and this ensures that analysis is carried out for buildings, however regular they were once considered. It will be seen in the comparison of building systems in Section 10 that the loadings for buildings within the longer period ranges have been reduced. However, it is vital that the dynamic behaviour is understood for sensitive deflection demands.
The height of a structure is therefore a justified method for design analysis classification and the revision will guarantee all structural implications have been considered by the engineer.
5 PERIOD CALCULATION
The most significant revision is that structures with first mode periods greater than 5 s have been excluded by this new code.
In calculating the periods of vibration, the influence of the flexibility of the supporting soils has been considered, however, the topic of calculating the natural period for the structure is still to be expanded. The calculation of natural period of a structure, with reasonable accuracy, is very difficult.
The old and the new codes [4] [7] differ in the calculation of the natural period for structures. The empirical methods used in both codes, as seen below, do not use material and sectional properties appropriate to the limit state under consideration.
As it is the period associated with elastic response at just below flexural yield which is of relevance, the period should not be based on properties of un-cracked concrete. However, the estimates in both the old and new codes are likely to be conservative for multi-storey frames in so far as they are likely to predict a shorter natural period and as a consequence increase response.
These methods also do not take into account the actual shape or properties of each structure. Hence it should be noted that these approximate methods can be used for initial estimates in preliminary design, or in structural checking. It is strongly recommended that a refined estimate be made based on Rayleigh’s method once member sizes have been selected.
The values obtained from the empirical formulae of the two codes vary significantly as can be see in the Figure 5-1. It can be seen in Figure 5-1 that the value for the natural period of most structures calculated using the new code [7], are less conservative than the old code. It should be noted that the calculation method detailed in the new code [7] is an empirical method set out in the NZS 1170.5:2004 [29] commentary. The New Zealand [29] code specifies the Rayleigh method, this is due to the fact that the formulae used in the new code are derived from a high-seismicity region and are considered conservative. When used in a region of moderate - or low- seismicity they are even more conservative, where structures have lower required earthquake resistance and hence are less stiff.

Comparison of Structural Design Actions Part 4: Earthquake Actions in Australia AS1170.4 – 1993 & 2007
September 2009
Figure 5-1 this figure shows the variation in the Periods with heights for the AS1170.4:1993 and 2007 Codes [4][7]
It is shown that the periods are longer for moment resisting frame structures and eccentrically braced frames have increased period values until an approximate height of 140m. A less conservative view is taken for “all other structures”, including building frame systems with reinforced concrete walls, having a lower value of fundamental period when greater than approximately 65m.
The new code [7] tries to bring the results of the lateral force method closer to those of modal response spectrum analysis. Due to the variation in period calculation for different structural systems, a direct comparison of the base shear multiplier can not be carried out on a period basis. The base shear multiplier will be compared in Section 10 on a structural height basis.
6 RESPONSE FACTOR (RF), STRUCTURAL DUCTILITY FACTOR, µ, AND THE STRUCTURAL PERFORMANCE FACTOR, S P
The theory of the structural response is a complete topic that could be described in depth but a quick, rather than detailed, discussion of the old and the new notation with relevance to code revisions will be looked at here. Figure 6-1 shows the relationship of the reduction factor Rf with the ductility to structural performance ratio.
Wilson and Lam [36] demonstrate that the structural response factor (Rf) was previously proposed to be defined in the new AS1170.4:2007 code [7] by using a ductility factor µ and an over-strength factor Ω but notation similar to the New Zealand [28] code has been used.

Comparison of Structural Design Actions Part 4: Earthquake Actions in Australia AS1170.4 – 1993 & 2007
September 2009
Figure 6-1 shows the comparison of the Rf and µ/Sp relationship [34]
In design using reduced or inelastic spectra it is vital that the design includes ductility capacity to at least equal to that corresponding to the assumed force reduction factor. As the Sp/µ value reduces (i.e. Rf and µ/Sp increase), the structure will absorb increasing energy and therefore is designed for less direct load but for more plastic capacity.
System Ductility ( µ) Over-strength ( Ω) Rf = µxΩ URM 1.25 1.3 1.6 Limited Ductility 2 1.3 2.6 Moderate Ductility 3 1.5 4.5 Ductile 4 1.5 6
Table 6-1 shows the revised ductility and over-strength factors used in the code but not in used notation [36].
“Limited ductility” classification in the new code [7], with µ=2, requires basic detailing as specified in the material standard [8]. While “Moderate ductility”, with µ=3, requires special detailing set-out in the appendices of the material code [8]. Fully ductile structures, with µ=4, are out of the scope of the new Australian standards and reference to the NZ 1170.5 [28] standards is required, where sophisticated methods are employed to establish the plastic capacity and ductility available at the joints and designated hinges. Detailing rules to achieve these levels of ductility can be highly complex. At the other extreme, for the value of µ = 1.0 the structure is designed to remain fully elastic under the full loads. A relationship between strength and ductility is shown in Figure 6-2 below.
Figure 6-2 Shows the relationship between strength and ductility [30].

Comparison of Structural Design Actions Part 4: Earthquake Actions in Australia AS1170.4 – 1993 & 2007
September 2009
7 EARTHQUAKE BASE SHEAR
The equation for base shear has been aligned with international standards and therefore notation and factors have been revised.
The horizontal equivalent static shear force acting at the base of the structure (base shear) in the direction being considered is calculated from the following equations;
7.1.1 AS1170.4: 1993 Earthquake Base shear V = I (CS/Rf) Gg
C = 1.25a/T2/3 n=2/3; Factor=1.25
Base shear multiplier = V/Gg = 1.25aIS/RfT2/3
There is a lower limit of V >0.01Gg and an upper limit of V< I (2.5a/Rf) Gg.
Also it should be noted that kp replaced I in AS1170.4:2002 Appendix D.
7.1.2 AS1170.4: 2007 Earthquake Base shear V = Cd(T1)Wt
Cd(T1) = C(T1) (Sp/µ)
C(T1) = Ch(T1)kpZ
Base shear multiplier = V/Wt = Ch(T1)kpZ(Sp/µ)
There is no lower limit for the value of seismic weight to be applied to structures in the 2007 code. For comparison of the earthquake base shear, the percentage of seismic weight of the structure to be used for calculating the base shear was obtained and graphed for structural system types in Section 10. This percentage will be referred to as the base shear multiplier within this report.
Loading and combinations for gravity loads to be assumed for static analysis have been included in Section 6 of the new code, however there are discrepancies of the live load multiplication factor ψc stated in AS1170.4 as 0.3 and that defined in AS/NZS 1170.0 as 0.4. These two codes are to be aligned.
The structural components to be included in the calculation of the seismic weight and the position of application have been described in Section 1.5 of the new code with provision of illustrations for easy reference.
8 TORSION
A structures response in plan has large implications to the forces induced in the lateral support system due to torsion effects.

Comparison of Structural Design Actions Part 4: Earthquake Actions in Australia AS1170.4 – 1993 & 2007
September 2009
8.1.1 AS1170.4:1993 Approximated Formulae In the old code [4] the actual response of the structure is calculated by applying the earthquake actions through the shear centre obtaining the static eccentricity and then factoring it to include dynamic amplification of the response.
ed1 = A1es + 0.05b and ed2 = A2es - 0.05b
Where, A1 = [2.6– 3.6(es/b)] or 1.4, whichever is greater
A2 = dynamic eccentricity factor = 0.5
The accidental eccentricities are added and subtracted from the appropriate factored case to ensure that the more unfavourable case for the resisting elements on each side of the structure is included.
8.1.2 AS1170.4:2007 Approximated Formulae Unlike the old code [4], amplification or de-amplification of the static eccentricities between the centre of mass and stiffness is not required. This is convenient because normally the storey stiffness centre cannot be uniquely defined with accuracy and in reality the amplification factor calculation requires tedious analyses.
For buildings with full symmetry of stiffness and nominal masses in plan, the analysis for the horizontal components of the seismic action gives no torsional response at all. However, variations in stiffness and uncertainty of possible torsional components of ground motion may produce a torsional response even in the most fully symmetrical building.
Therefore to ensure a minimum torsional resistance and stiffness and limit the consequence of unforeseen torsional response, the new code [7] introduces accidental torsion effects by applying the earthquake actions at a position ± 0.1b from the nominal centre of mass, where b is the plan dimension of the structure at right angles to the direction of the action.
It is conservative to assume that all the masses of the structure are displaced along the same horizontal direction and in the same sense (+/-) at a time, however orientated to produce the most adverse torsion moment must be considered.
It is completely impractical to study the effects of displacing the masses through dynamic analysis: the dynamic characteristics of the system will change with the location of the masses. Therefore accidental eccentricity of the total horizontal seismic component is considered with respect to the centre of all the masses.
8.1.3 Torsion Comparison There is not a direct comparison to be drawn between these two figures as discussed above. However it should be noted that for theoretically complete symmetrical buildings (in plan), there is a significant doubling of the accidental torsional moment. Conversely, for the most onerous unsymmetrical buildings the torsional effects produced by the two codes correlate well.

Comparison of Structural Design Actions Part 4: Earthquake Actions in Australia AS1170.4 – 1993 & 2007
September 2009
It is clear that in the new code [7] a more conservative method for calculating the torsional effects has been provided for symmetrical buildings while maintaining similar presentation of effects for largely unsymmetrical buildings.
It should be noted that the simplified method for buildings less than 15m in the earthquake II category, eliminates requirement for torsion calculations by conservatively increasing load multipliers.
9 DRIFT AND P-DELTA EFFECTS
As can be seen in Table 9-1 and Table 9-2 there are revisions to the storey drift and inter-storey coefficient values. The percentage differences are calculated using the following equations;
Storey drift % difference = [(µ/Sp) - Kd] / Kd
Inter-storey Stability Coefficient % difference = [(1/µ) - (1/Kd)] / (1/Kd)
The percentage difference for the design deflection multiplier (amplification factor) is significantly reduced for all “limited” ductile reinforced concrete wall systems but with a 30% increase for ordinary moment resisting frames in concrete.
1993 Kd
2007 µ/Sp
% Difference in Design Deflections Multiplier
System Steel RC Limited Ductile Limited Ductile
Bearing Wall 4 2.6 4.5 -35% 13%
Building Frame with RC Shear Walls 5 2.6 4.5 -48% -10%
Building Frame with CB Frames 4.5 4.5 2.6 4.5 -42% 0%
Ordinary Moment Resisting Frames
Steel 4 2.6 -35%
Concrete 2 2.6 30%
Intermediate Moment Resisting Frames
Steel 4.5 4.5 0%
Concrete 3.5 4.5 29% Table 9-1 Shows the percentage difference in the design deflections multiplier for storey drift calculation
For “ductile” bearing wall systems there is an increase of 13% in the design deflection multiplier and an increase of 29% for intermediate moment resisting frames of concrete.
It can be seen that the multiplier for the inter-storey stability coefficient has been significantly increased for all systems by using the ductility factor rather than the deflection amplification factor in the denominator. This more conservative approach has been used by proposing the use of ductility alone, but note that this isn’t as conservative as the New Zealand code which does not use the ductility factor at all.

Comparison of Structural Design Actions Part 4: Earthquake Actions in Australia AS1170.4 – 1993 & 2007
September 2009
1993 1/Kd
2007 1/ µ
% Difference in inter- storey Stability Coefficient
Multiplier
System Steel RC Limited Ductile Limited Ductile
Bearing Wall 0.25 0.5 0.33 100% 33%
Building Frame with RC Shear Walls 0.2 0.5 0.33 150% 67%
Building Frame with CB Frames 0.22 0.22 0.5 0.33 125% 50%
Ordinary Moment Resisting Frames
Steel 0.25 0.5 100%
Concrete 0.5 0.5 0% Intermediate Moment Resisting Frames
Steel 0.22 0.33 50%
Concrete 0.29 0.33 17% Table 9-2 Shows the percentage difference in the inter-storey stability coefficient for P-delta effects multiplier
The increasing of the inter-storey stability coefficient increases the possibility of p-delta effects having to be considered within the design.
10 CODE REVISION IMPLICATIONS TO STRUCTURAL SYSTEMS
“All buildings are not created equal when response to earthquake-induced forces is of concern” [30]
The challenge in seismic design of building structures is primarily to conceive and detail a structural system that is capable of surviving a given level of lateral ground shaking with an acceptable level of damage and a low probability of collapse. The choice of structural system and its ability to perform under earthquake induced forces is of paramount importance in the early design stages of a project. The geometry and occupation requirements, set-out by the architectural intensions can have large influence on the selection of system and construction type.
The best way to understand implications to structural design is in terms of loading magnitude (either increasing or decreasing), the comparison of the horizontal design action coefficient was calculated using both codes and the differences compared for structural systems. In this study each of the following three structural systems were investigated, a brief description is as follows:
Bearing wall systems These are a structural system with load bearing walls providing support for all or most of the vertical loads, where shear walls or braced frames provide the horizontal earthquake resistance. The presence of minor load bearing walls in a structure that would normally be classified as a building frame system does not necessarily mean that the structure should be categorized as a bearing wall system, as their contribution to lateral force resistance, if any, is often negligible.
Building Frame systems, with shear walls and concentrically braced frames Are structural systems in which an essentially complete space frame supports the vertical loads and the shear walls or braced frames provided the horizontal earthquake resistance. While there is no requirement to provide horizontal resistance in the vertical-load framing, it is strongly recommended that nominal moment resistance be incorporated in the vertical-load frame design. The vertical-load frame provides a nominal secondary line of defence, although all required horizontal forces are

Comparison of Structural Design Actions Part 4: Earthquake Actions in Australia AS1170.4 – 1993 & 2007
September 2009
resisted by other earthquake resisting structural systems. However, consideration should be given to the deformation compatibility between individual members. The presence of a frame can provide vertical stability to the structure and prevent collapse after damage to shear walls or braced frames. The frame also acts to tie the structure together and redistribute the horizontal force to undamaged elements of the horizontal force resisting system.
Moment Resisting Frame System, Ordinary and Intermediate A structural system in which an essentially complete space frame supports the vertical loads and the total prescribed horizontal earthquake forces by the flexural action of the members. The beams, supporting floors, and columns are continuous and meet at nodes, often called “rigid” joints. The entire horizontal force stipulated should be capable of being resisted by moment resisting frames.
Figure 10-1 Shows three of the structural systems used for supporting lateral loads. A dual system uses a combination of these systems [13].
Figure 10-1 above shows diagrammatically the three structural systems and their deflection response under lateral loading.
Graphs were produced for each structural system with the base shear multiplier will be represented for the systems by a varying structural height rather than by structural period, due to the differences in calculation of period, for sub-soil classes Ae and De.
It should be noted that the following comparisons use a hazard factor Z, of 0.08 and a probability factor kp of unity and therefore if the location differers or the annual probability of exceedance is greater or less than 1/500 years, refer to the BCA [11], then the base shear multiplier will have to be revised to suit.
It should also be noted that the robustness limit of 2.5%, AS1140.0 Clause 6.2.2, has not been considered in this study. There is a proposal to reduce this figure to 1.0% robustness limit for buildings less than 15m in height and 1.5% robustness limit for buildings taller than 15m in height which has also not been considered here, but it should be noted that the 1.5% limit will then be the more onerous loading for longer period buildings.

Comparison of Structural Design Actions Part 4: Earthquake Actions in Australia AS1170.4 – 1993 & 2007
September 2009
Outside the scope of this study are the simplified methods allowed for in the new code.
For Earthquake Category I, a simple analysis load factor of 0.10Wt can be applied to structures less than 12m in height, unless a more detailed analysis is carried out. Note that this only applies for sub-soil class Ae, Be and Ce for Importance Level 2 structures.
For Earthquake Category II, a simplified design method allows for the application of conservative factors to structures less than 15m in height, where torsion has been allowed for, unless a more detailed analysis is carried out. This factor may require as much as 0.18Wt to be applied at the storey under consideration for soil classes De and Ee. (For Z= 0.08 and kp = 1.0)
10.1.1 Bearing wall systems
Figure 10-2 shows the difference in the base shear multiplier for a bearing wall systems, for soil class Ae. In the old code [4] the reinforced shear walls were considered to be ductile if they are designed, detailed and constructed to AS 3600 [8] and no additional detailing was required for consideration in its Appendix A. In the new code [7] concrete elements are not categorised into structural systems, therefore allowing both “limited” and “ductile” detailing for any choice of system. “Limited” ductility has been defined as design and detailing to the standard without Appendix A requirements and the definition of “Ductile” is to include detailing to Appendix A of the material standard. This begs the question; is the requirement of no additional detailing, as stated in A10 of Appendix A, satisfactory for the assumed ductility level?
As “limited” elements in the new code are considered to have no specific detailing requirements and act relatively elastically, this is reflected in the increased loading that is applied to these elements as seen in the Figure 10-2. The total percentage of the seismic weight of the building applied to “limited” ductile shear walls in base shear is 7.23%. That is an increase of 2.88% of the seismic load being applied to these elements for buildings less than 8m in height.
Figure 10-2 it is shown that for ductile walls, there is a decrease in the base shear multiplier for both short and long period structures. The total percentage of the seismic weight of the building applied to “ductile” shear walls in base shear is 4.18%. The loading applied in the old code is 4.35% therefore no significant decrease (0.18%).
In Figure 10-2 for bearing wall systems on soil class De, for “limited” ductility elements it is shown that there is large increased loading applied for buildings less than 100m in height. The total percentage of the seismic weight of the building applied to “limited” ductile shear walls in base shear is 11.32%. That is an increase of 6.88% of the seismic load being applied to these elements for buildings less than 16m in height (i.e. an approximate doubling of the load)

Comparison of Structural Design Actions Part 4: Earthquake Actions in Australia AS1170.4 – 1993 & 2007
September 2009
Figure 10-2 this figure shows the comparison of the base shear multiplier for BWS, for Soil Class Ae and De.
Although the applied value of 11.32% of the seismic weight applied for buildings situated on sub soil class De, which is considered the “worst” founding material for Sydney’s Quaternary sands, this is also the value applied to buildings below 8m for sub-soil class Ce.
If for earthquake category I, a simple application of 10% of the seismic weight is applied, for buildings under 12m in height, the building may not be conservative in its design.

Comparison of Structural Design Actions Part 4: Earthquake Actions in Australia AS1170.4 – 1993 & 2007
September 2009
10.1.2 Building Frame systems, with shear walls and concentrically braced frames
Similar to the bearing wall systems it can be seen in Figure 10-3 and Figure 10-4, that there is an increase in the applied base shear multiplier for building framed systems for soil class Ae.
Even on soil class Ae (Rock), the increases within the short period range for the “limited” ductility case have large implications for 1 and 2 storey buildings using this structural building system. However, the simplified application of 10% of the seismic weight seems too conservative for design.
Figure 10-3 this figure shows the comparison of the base shear multiplier for Building frame systems with Shear walls, for Soil Class Ae.
The old 1993 code [4] limited the height of a building frame system to a structural height limit of 70m in design category E. However, this is only defined for importance level 4 structures on the worst soil classification Ee. It can be seen in Figure 10-4 that for limited ductility walls and frames there is an increase in the multiplier for buildings less than 87m in height. The previous height limit for the application of 1% of the seismic weight to be applied has been reduced from 69m and 87m, in the fundamental and orthogonal direction respectively, to 51m for “moderately ductile” structures; implying that taller buildings experience a reduced seismic loading applied and is maintained at 87m for the “limited” ductile concentrically braced frame.

Comparison of Structural Design Actions Part 4: Earthquake Actions in Australia AS1170.4 – 1993 & 2007
September 2009
Figure 10-4 this figure shows the comparison of the base shear multiplier for Building frame systems with CBF, for Soil Class Ae.
Figure 10-5 this figure shows the comparison of the base shear multiplier for building frame systems with Shear walls, for Soil Class De.
In Figure 10-5 and Figure 10-6 below it can be seen that for “limited” ductility elements there is large increased loading applied for buildings less than 145m in height on soil class De. It should be noted that for “Moderately ductile” braced frames in the new code [7], there is an increase in the base shear multiplier for short period structures, however after a height of 29m the difference is only

Comparison of Structural Design Actions Part 4: Earthquake Actions in Australia AS1170.4 – 1993 & 2007
September 2009
0.44% and after a height of 75m (corresponding to a natural period of 1.6secs), decrease can be seen in the longer period range.
Figure 10-6 this figure shows the comparison of the base shear multiplier for building frame systems CBF, for Soil Class De.
10.1.3 Moment Resisting Frame System, Ordinary and Intermediate
Ordinary Moment Resisting Frames (OMRF) – Moment resisting frame with no particular earthquake detailing, specified in the relevant material standard AS 3600 [8] and AS4100 [9]. In the old code [4], a height limitation of 50m above the structural base of the structure, applied for ordinary moment resisting frames where the product of acceleration coefficient and site factor (aS) is greater than or equal to 0.1 (1993) i.e. kpaS (2002). This height restriction is not applied in the new code.
Intermediate Moment Resisting Frames (IMRF) – Moment resisting frame of concrete or steel which is designed and detailed to achieve moderate structural ductility.
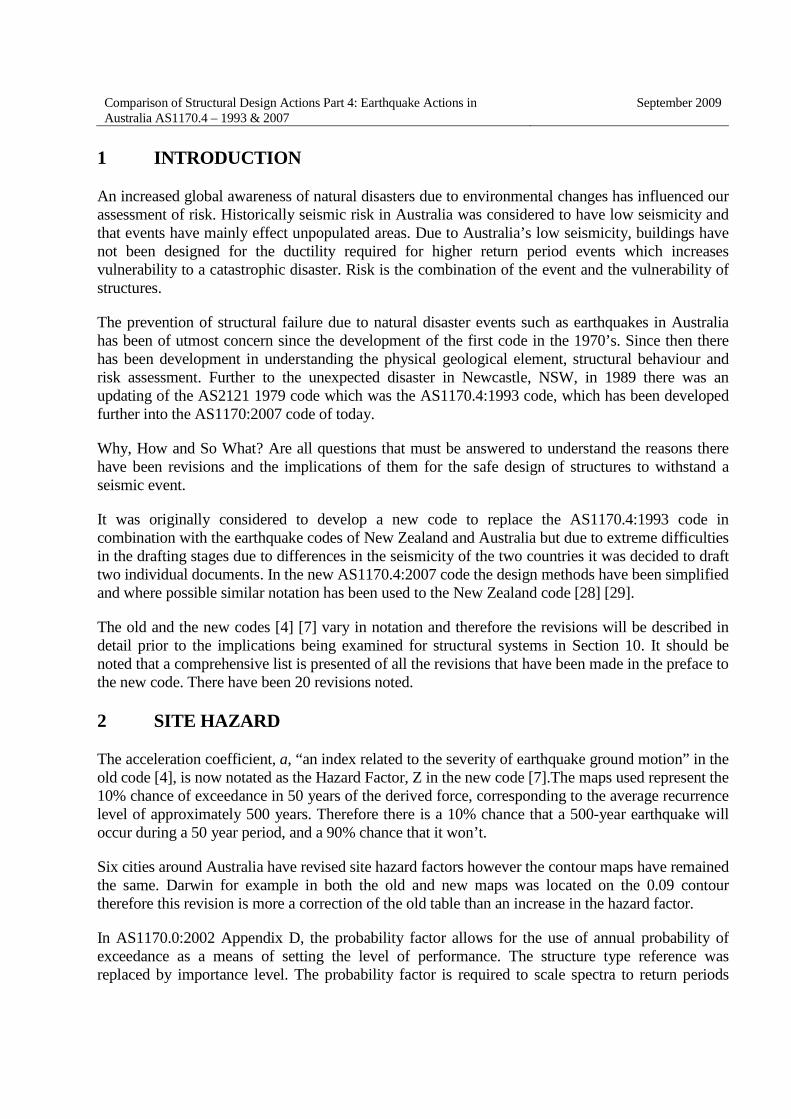
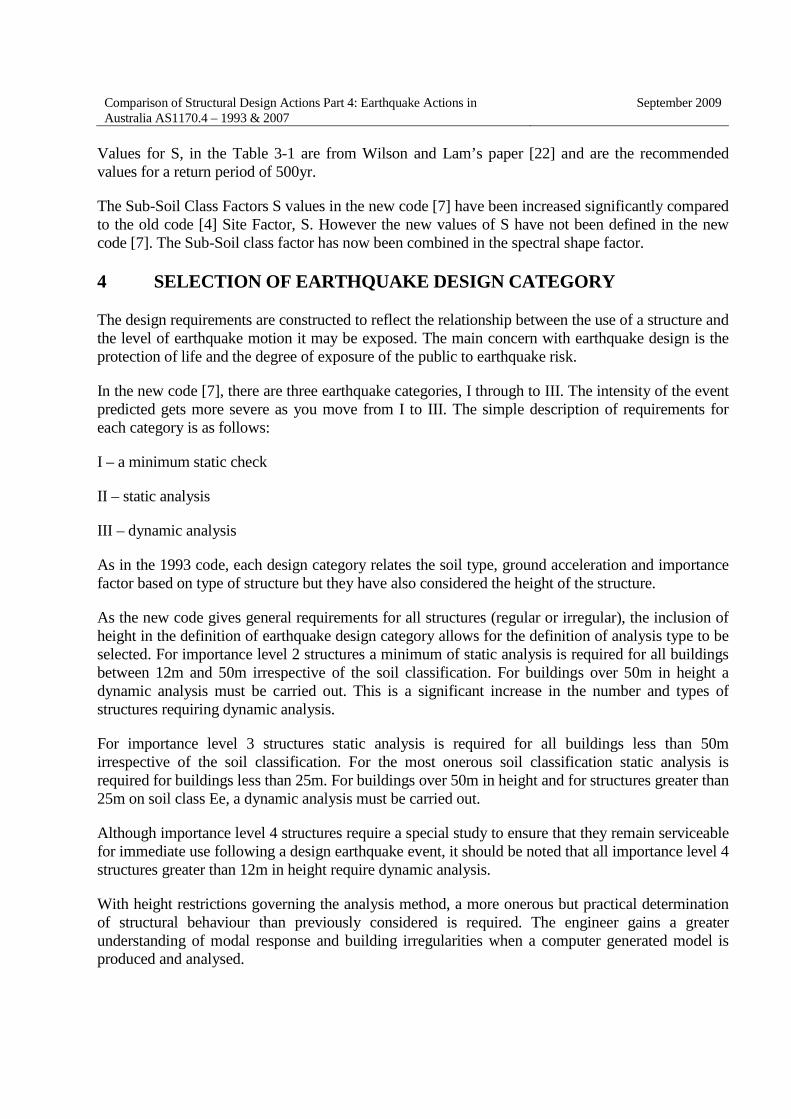
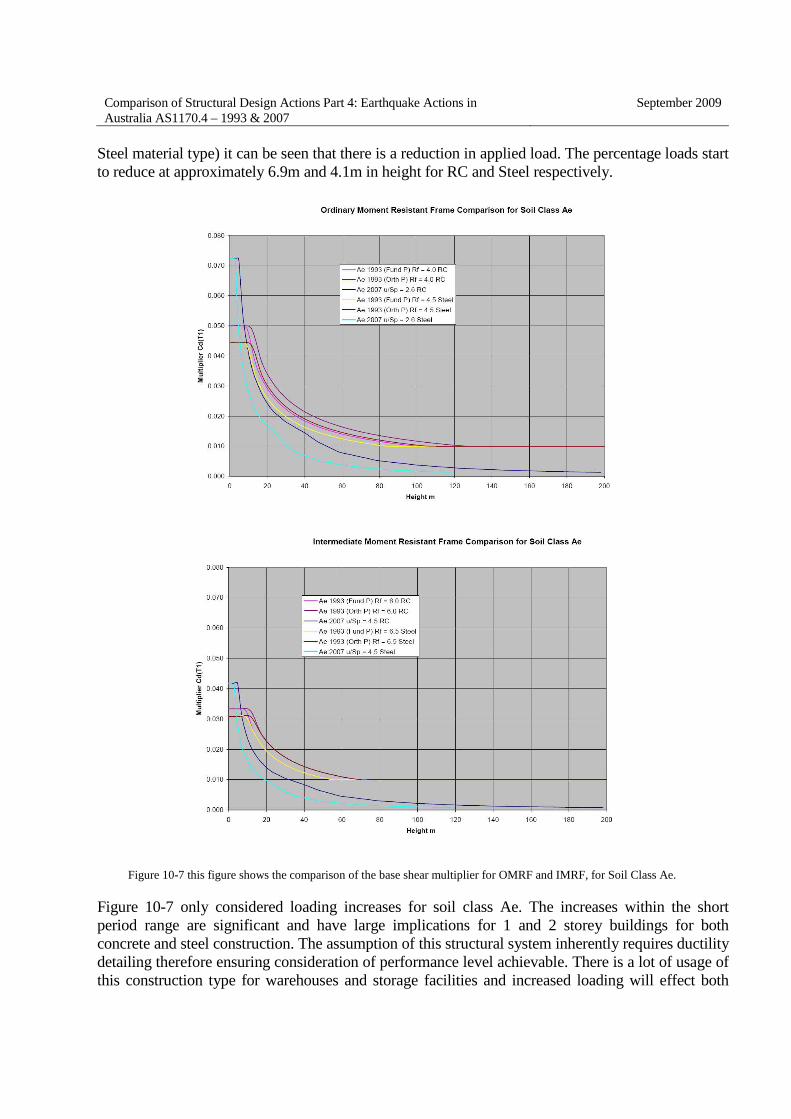
In Figure 10-7 it can be seen that there is a difference in the base shear multiplier for both steel and concrete ordinary and intermediate moment resisting frames on soil class Ae.
For OMRF the total percentage of the seismic weight of the building applied to both material ordinary moment resisting frames is 7.23%, an increase of 2.23% (a total of 30% increase). For IMRF the total percentage of the seismic weight of the building applied to both materials is 4.18%, an increase of 0.91%.
In Figure 10-7, it is shown that this increased loading has a very steep decrease rate within the short period range, and at the 12m height (corresponding to a period of 0.6 sec and 0.9 sec for RC and
Comparison of Structural Design Actions Part 4: Earthquake Actions in Australia AS1170.4 – 1993 & 2007
September 2009
Steel material type) it can be seen that there is a reduction in applied load. The percentage loads start to reduce at approximately 6.9m and 4.1m in height for RC and Steel respectively.
Figure 10-7 this figure shows the comparison of the base shear multiplier for OMRF and IMRF, for Soil Class Ae.
Figure 10-7 only considered loading increases for soil class Ae. The increases within the short period range are significant and have large implications for 1 and 2 storey buildings for both concrete and steel construction. The assumption of this structural system inherently requires ductility detailing therefore ensuring consideration of performance level achievable. There is a lot of usage of this construction type for warehouses and storage facilities and increased loading will effect both

Comparison of Structural Design Actions Part 4: Earthquake Actions in Australia AS1170.4 – 1993 & 2007
September 2009
connection design and deflection and sway considerations. If the simplified method is used a far more conservative loading will be applied to these structures and full analysis would ensure a much more economical design.
In Figure 10-8 and Figure 10-9 the total percentage of the seismic weight of the building applied to ordinary and intermediate moment resisting frames, on soil class De, is 11.32% and 6.54% (for RC and Steel) respectively. That is an increase of 6.32% and 6.88% OMRF and 3.2% and 3.5% for IMRF, of the seismic load being applied to this construction type for 2 to 3 storey buildings (a doubling of load).
For OMRF it is shown that this increased loading has a very steep decrease rate within the short period range with reductions in loading occurring at 30m and 22m (corresponding to a period of 1.3 sec and 1.4 sec) for RC and Steel. In the old code the minimum loading of 5% and 4.44% for both RC and Steel was applied for all structures under 35m in height (corresponding to a period of 0.8 sec and 0.6 sec for the fundamental and orthogonal direction for both material types).
Figure 10-8 this figure shows the comparison of the base shear multiplier for OMRF, for Soil Class De.
In IMRF it is shown that this increased loading has a very steep decrease rate within the short period range with reductions in loading occurring at 26m and 16m for RC and Steel. In the old code the minimum loading of 3.33% and 3.08% for both RC and Steel was applied for all structures under 28m and 35m in height (corresponding to a period of 0.8 sec and 0.6 sec for the fundamental and orthogonal direction for RC and steel respectively).
As stated previously soil class De requires design for Earthquake Category II not allowing simplified application of 10% to be used. It should be noted also that in the old 1993 code a moment resisting frame in a dual system had a restriction that if over a structural height of 30m then a special

Comparison of Structural Design Actions Part 4: Earthquake Actions in Australia AS1170.4 – 1993 & 2007
September 2009
moment resisting frames had to be provided down to the footing, which are outside the scope of the new 2007 code.
Figure 10-9 this figure shows the comparison of the base shear multiplier for IMRF, for Soil Class De.
11 DISCUSSION
The assumptions made for site soil class, structural system and performance have large implication to the percentage of seismic loading that the lateral resisting system are subjected to. Where as revision in the calculation of the natural period of the structures also has a bearing in relation to the height of structures that are most effected.
Again, please note that the kp factor has been taken as equal to unity for this comparison and the Z factor has been taken as 0.08, representing implications for Sydney structures.
A summary of the comparisons for the increased load within the short period range are shown in Table 11-1 below. It should be noted that there is large reductions for buildings within the longer period ranges.
It should be noted that in the case of building frame systems there has been a tripling of the load previously applied to a limited system.
Although loadings have been increased dramatically, especially for the more onerous soil classes the actual cost of designing a structure to survive a seismic event is a fraction of the overall cost of a building.

Comparison of Structural Design Actions Part 4: Earthquake Actions in Australia AS1170.4 – 1993 & 2007
September 2009
The basis of a buildings survival during a seismic event is in the ductility detailing of the lateral supporting system and the behaviour of framing elements whether structural or non structural to deformations and stresses induced by the event.
By using the comparison tables of the earthquake base shear multiplier above for the calculation of applied lateral loads to a structural system, implications of the new AS1170.4: 2007code have been demonstrated.
Structural System Comparison of the Base Shear Multiplier (Percentage of Seismic Weight)
AS1170.4:1993 AS1170.4:2007 Difference
Kp=1.0 & Z=0.08 Ae De Ae De Ae De
Bearing Wall System
Limited 4.35% 4.44% 7.23% 11.32% 2.88% 6.88%
Ductile 4.35% 4.44% 4.18% 6.54% -0.17% 2.10%
Building Frame System with Shear Walls
Limited 3.27% 3.33% 7.23% 11.32% 3.96% 7.99%
Ductile 3.27% 3.33% 4.18% 6.54% 0.91% 3.21%
Building Frame System with Concentrically Braced Frames
Limited 4.00% 3.97% 7.23% 11.32% 3.23% 7.35%
Moderately ductile 4.00% 3.97% 4.18% 6.54% 0.18% 2.57%
Ordinary Moment Resisting Frames
Concrete 5.00% 5.00% 7.23% 11.32% 2.23% 6.32%
Steel 4.35% 4.44% 7.23% 11.32% 2.88% 6.88%
Intermediate Moment Resisting Frames
Concrete 3.27% 3.33% 4.18% 6.54% 0.91% 3.21%
Steel 3.08% 3.08% 4.18% 6.54% 1.10% 3.46% Table 11-1 shows the comparison (percentage differences) of the seismic weight loading multiplier for AS1170.4:1993 and
2007 code [4] [7] for all the structural systems.
Structures designed to the new code are more likely to survive and have less damage for seismic events with larger reoccurrence intervals than existing structures. Therefore the next step in the comparison of the AS1170.4:1993 and 2007 code in the establishing the implications to existing buildings and to develop as assessment method for renovations required, with critical limits determined and defined.

Comparison of Structural Design Actions Part 4: Earthquake Actions in Australia AS1170.4 – 1993 & 2007
September 2009
12 BIBLIOGRAPHY
[1] AS/NZS 1170.0:2002 Structural design actions Part 0: General Principles [2] AS/NZS 1170.1:2002 Structural design actions Part 1: Permanent, imposed and other
actions [3] AS/NZS 1170.2:2002 Structural design actions Part 3: Wind Actions [4] AS/NZS 1170.4:1993 Minimum design loads on structures Part 4: Earthquake loads [5] AS/NZS 1170.4 Supp 1:1993 Minimum design loads on structures Part 4: Earthquake
loads - Commentary [6] AS/NZS 1170:2002 Structural design actions Part 0: General Principles General Principles,
Appendix D, Factors for use with AS1170.4-1993 [7] AS 1170.4:2007 Structural design actions Part 4: Earthquake actions in Australia [8] AS 3600:2001 Concrete Structures [9] AS 3826:1998 Strengthening existing buildings for earthquake [10] AS 4100:1998 Steel Structures [11] Building Code of Australia [12] Bungum, H., Project 3: Hazard, Risk and Loss. ICG Assessment,
http://www.geohazards.no/projects/project3_08/project_3_earthq.htm, Accessed November 2008
[13] Corus in Construction, Teaching resources, Structural Principles, http://www.corusconstruction.com/en/reference/teaching_resources/architectural_studio_reference/design/choice_of_structural_systems_for_multi/structural_principles/, Accessed November 2008.
[14] Dowrick, J.D. Earthquake Resistant Design, SJohn Wiley & Sons, Ltd., 1977. [15] European Steel Designers Education Program. ESDEP. http://www.esdep.org Accessed
November 2008. [16] Fardis et al. Designers’ guide to EN1998-1 and EN1998-5 Eurocode 8: Design of
structures for earthquake resistance. Thomas Telford, 2005. [17] Gibson, Gary. Seismological contributions to earthquake risk mitigation. In Proceedings of AEEC
Conference, November 2006. [18] Gurley, Colin. Protecting life and reducing damage in earthquakes and terrorist attacks. In
Proceedings of AEEC Conference, November 2006. [19] Kayvani, K. and Barzegar, F. Influence of local inertia on seismic response of offshore jackets.
Engineering Structures, Vol 18, No 2, pp. 93-101, 1996. [20] Kayvani, K. and Barzegar, F. Hysteretic modelling of tubular members and offshore platforms. Journal
of Structural Engineering, Vol 123, No 1, January 1997. [21] Kayvani, K., Schmidt, B., Steele, J. and Sidwell, G. HSeismic Engineering for Replacement
Research Reactor in Australia. EIn Proceedings of Earthquake Engineering, Pacific Conference, 2003.
[22] Lam, N. and Wilson, J. The new response spectrum model for Australia. eJSE International Special Issue, Earthquake Engineering in the low and moderate seismic regions of Southeast Asia and Australia, http://www.ejse.org/Archives/Fulltext/2008/Special1/200801.pdf, Accessed November 2008.
[23] Li, B., Duffield, C.F. and Hutchinson G.L. A parametric study of the lateral performance of a high-rise structure. In Proceedings of ASEC Conference, June 2008.

Comparison of Structural Design Actions Part 4: Earthquake Actions in Australia AS1170.4 – 1993 & 2007
September 2009
[24] Lumantarna, E.,Vaculik, J., Griffith, M., Lam, N. and Wilson, J. Seismic fragility curves for un-reinforced masonry walls. In Proceedings of AEES Conference, November 2006.
[25] McPherson, A. and Allen, T. An improved understanding of earthquake ground shaking in Australia. In Proceedings of AEES Conference, November 2006.
[26] McPherson, A. and Hall, L. Site Classification for earthquake hazard and risk assessment in Australia. In Proceedings of AEES Conference, November 2006.
[27] National Geographic. Large earthquake “Bounces” are stronger than gravity. http://news.nationalgeographic.com/news/2008/10/081030-earthquake-bounce.html?source=rss Accessed November 2008.
[28] NZS 1170.5:2004 Structural Design Actions Part 5: Earthquake actions – New Zealand [29] NZS 1170.5 Supp 1:2004 Structural Design Actions Part 5: Earthquake actions – New
Zealand - Commentary [30] Paulay, T. and Priestley, M.J.N. Seismic Design of Reinforced Concrete and Masonry Buildings. John
Wiley & Sons, Inc., 1992. [31] Rodsin, K., Lam, N., Wilson, J. and Goldsworthy, H. Seismic fragility curves for soft-storey
buildings. In Proceedings of AEES Conference, November 2006. [32] SAI Global, AS1170.4 Earthquake Actions in Australia. In Proceedings of SAI Seminar, May
2007. [33] Venkatesan, S., Lam, N. and Wilson, J. Simple model accounting for the soil resonance phenomenon.
In Proceedings of AEES Conference, November 2006. [34] Wilson, J. and Lam, N. Earthquake design of buildings in Australia using Velocity and Displacement
Principles. In Proceedings of SAI Global Training, May 2007, Australian Journal of Structural Engineers, Vol 6, No 2, 2006
[35] Wilson, J. and Lam, N. A recommended Earthquake Response Spectrum Model for Australian. In Proceedings of SAI Global Training, May 2007, Australian Journal of Structural Engineers, Vol 5, No 1, 2003
[36] Wilson, J. and Lam, N. Recent developments in the research and practice of earthquake engineering in Australia. In Proceedings of AEES Conference, November 2006.