Embed Size (px)
Citation preview
8/3/2019 03GWEC - Global Wind 2007
http://slidepdf.com/reader/full/03gwec-global-wind-2007 1/72
GLOBAL WIND
2007 REPORT

8/3/2019 03GWEC - Global Wind 2007
http://slidepdf.com/reader/full/03gwec-global-wind-2007 2/72
Table of conTenTs
Few 1
The gaisatin the win inust 2
The status ga win we in 2007 6
Maket ecast 2008-2012 11
Instae caacit egin 15
Cunt et
Australia 20Brazil 22
Canada 24Chile 26China 28Egypt 32European Union 34France 36Germany 38India 40Iran 42Italy 44 Japan 46
Mexico 48Morocco 50New Zealand 52Poland 54Republic o Korea 56Spain 58Turkey 60United Kingdom 62U n i t e d S t a t e s 6 4
Cncusin 66
Aut GWEC 68

8/3/2019 03GWEC - Global Wind 2007
http://slidepdf.com/reader/full/03gwec-global-wind-2007 3/72
1GWEC – GLOBAL WIND 2007 REPORT
Frewr2007 was yet another banner year or the wind industry,with a 27% increase in installed capacity, bringing the globaltotal to more than 94,000 MW The increasingly mature andglobal industry installed more than 20,000 MW o clean,emissions ree wind energy capacity in the course o the year, representing about€ 25 billion (about $US 37 billion)o investment, and by the time this publication is released,the total global capacity will no doubt have passed the100,000 MW mark
With the price o oil hovering around $US 100 per barrel,and the price o coal and gas at historically high levels,the advantages o an energy source independent rom thevagaries o the international commodities markets has neverbeen clearer ‘Resource depletion’ will never be a problem orwind power We have only just begun to scratch the suraceo its potential
This is good news not only or energy planners seekingto achieve security o supply, but also or politicians and
diplomats searching or solutions to the global crisis ohuman-induced climate change As governments ranticallynegotiate a new agreement or the period ater 2012, thewind industry stands ready to make a very substantialcontribution to solving what most now acknowledge is thegreatest long term threat to our civilization
The wind energy industry is also playing a major role inanother kind o boom: regional economic (re)developmentFrom the Texas Panhandle to Inner Mongolia, and romSchleswig-Holstein to Andalucía, the wind industry is
building new actories, expanding local tax bases and creatingthousand o new ‘green collar’ jobs at an ever-expanding rateAt the local, regional, and national level as well as globally,wind power is more and more oten the answer to questionsabout our energy uture
2007 will be remembered as the year when the globalcommunity nally started to get to grips with the climateissue Most notably, the release o the IPCC’s 4th AssessmentReport put all reasonable doubts to rest about the natureand causes o climate change The thousands o scientists,
reviewers and editors who volunteer their time to make upthe Panel were the much deserved recipients o the Nobel
Peace Prize, shared with ormer US vide-President Al Gore orhis lm ‘An Inconvenient Truth’
One clear ‘take home’ message rom the IPCC report is thatregardless o long term targets, i we are going to have anychance o avoiding the worst ravages o climate change, thenthe one thing we must do is to stop increasing greenhousegas emissions: they must peak and begin to decline globallybeore the end o the next decade.
While the power sector is ar rom being the only culpritwhen it comes to climate change, it is the largest singlesource o emissions, accounting or about 38% o CO2 emissions, and about 25% o overall emissions Our optionsor making major emissions reductions in the power sectorbetween now and 2020 are basically three: energy eciencyand conservation; uel switching rom coal to gas; andrenewable energy, primarily wind power
As policy makers become more aware o this reality, they
appreciate more and more wind power’s technologicalmaturity, widespread availability, speed o deployment, andthe act that there is a robust, growing industry becomingmore and more global with every passing year The windindustry is ready, willing and able to ulll these growingexpectations and responsibilities
This is the third annual report on the status o the globalwind industry by the Global Wind Energy Council, and itprovides a comprehensive snapshot o this global industry,which is now present in more than 70 countries The data
and country proles or this report have been collectedthrough GWEC’s member associations around the world andadditional government and industry contacts The Councilwishes to thank the contributors and is looking orward to anequally ruitul cooperation or uture editions
Arthouros Zervos
ChairmanGlobal Wind Energy Council
Steve Sawyer
Secretary GeneralGlobal Wind Energy Council

8/3/2019 03GWEC - Global Wind 2007
http://slidepdf.com/reader/full/03gwec-global-wind-2007 4/72
2 GWEC – GLOBAL WIND 2007 REPORT
The last ew years have witnessed a sea change in boththe scale and extent o the international wind industry’soperations Individual wind arms have grown in size rom aew dozen megawatts capacity up to several hundred Outat sea, giant wind parks o 1,000 MW capacity or more are
now waiting or construction Successul wind turbine modelsare pouring out rom manuacturing acilities much likeother mass produced hardware And the continued growth indemand or clean, emissions-ree wind power has outstrippedthe available supply, creating a demand or very largeinvestments in manuacturing capacity, long term equipmentpurchase arrangements and project development
The structural changes which have accompanied thisexpansion have concentrated around two key trends One
The glbalisatin the wininustry
has been the involvement in the business o companiesrom outside the traditional wind turbine manuacturingand project development community The other has beenthe spread o the wind power market well beyond its coregeographical centres o Europe and the United States
Signicantly, the two trends have overlapped with eachother
Increasing involvement o new players in the market is in parta refection o wind power’s success This is now a businessrom which it is clearly possible to make a secure andprotable return In most countries where the technologyhas been successul there is a structural ramework inplace which supports renewable energy because o theenvironmental benets it brings, especially in the battleagainst climate change They also help counter the eects
o the massive subsidies over many decades to conventionalenergy generation These rameworks have in some casesstood the test o time over a number o years
An additional actor is the pressure rom some nationalgovernments to place an obligation on energy producersto source an increasing percentage o their electricity romrenewables This is the case or instance in the UnitedKingdom, with its Renewables Obligation, and in the UnitedStates, with its state by state Renewable Portolio StandardsAt an international level, the European Union has led the way
by introducing a legally binding target or 20% o the region’senergy to come rom renewable sources by 2020
These twin encouragements have generated a surge ointerest in renewable energy, and particularly wind power,rom companies whose previous investment portolio hadbeen mainly concentrated in ossil uels or nuclear or evenoutside the energy sector Most importantly, these newerentrants have both the advantage o the available balancesheet to consider large investments and the incentive todiversiy away rom increasingly uncertain traditional power
sourcesSottevast wind arm, Manche, France© Pascal Lecoeur

8/3/2019 03GWEC - Global Wind 2007
http://slidepdf.com/reader/full/03gwec-global-wind-2007 5/72
3GWEC – GLOBAL WIND 2007 REPORT
Changing wneshi
The result has been a shit in the type o companiesdeveloping and owning wind arms - rom relatively smallindependent project developers towards general powergeneration and supply companies (utilities) and largeIPPs (Independent Power Producers), oten nanced byinvestment banks At the same time there has been animportant commitment to wind energy rom a number othe largest multinational oil companies, most notably Shelland BP Shell, or example, is a partner in the proposed 1,000MW London Array oshore wind arm in the UK’s ThamesEstuary as well as an even larger project in the US state
o Texas According to market analysts Emerging EnergyResearch, seven o the top ten global owners o operatingwind power capacity are now either European utilities or IPPs
The most prominent example rom Europe o utilityinvolvement is the Spanish electricity company Iberdrola,which had previously concentrated on its gas, nuclear andhydro generation businesses Starting less than ten years agoit began to invest seriously in wind, mainly in Spain using thedomestically produced Gamesa turbines
Last year Iberdrola merged with the Scottish utility ScottishPower, which owned a number o wind arms in the UK aswell as the US wind developer PPM Energy It has since madeurther US acquisitions By the end o 2007 the company hadreached a total o 7,704 MW o renewable capacity,7,362 MW o which was wind power This made it the worldleader in wind capacity Its current target is to increasethis at a rate o 2,000 MW a year, reaching 13,600 MW orenewables by the end o the decade
Other large utilities which have moved into wind in a serious
way, by investing in large project development, are FloridaPower and Light (FPL) in the United States, the ormerstate power company Energias de Portugal (EdP), Endesarom Spain, DONG rom Denmark, Vattenall rom Sweden,Enel rom Italy, EdF rom France and EON and RWE romGermany
On the manuacturing side, the increase in the size o themarket and the requirement or a substantial investment inexpanded production acilities has also brought new playerson board The rst major example was General Electric, which
purchased the Enron Wind business, with assembly plantsin both Germany and the US GE Energy is now the third
largest supplier o wind turbines Three years ago, the giantengineering company Siemens acquired Bonus, one o theoriginal Danish turbine makers Siemens is currently the mostsuccessul supplier o turbines or the oshore market
An indication o how successul these acquisitions have beenwas the conrmation rom General Electric at the beginningo 2008 that it would increase its investment in renewablesto $6 billion by 2010 The majority o that is likely to go
into wind This gure represents about a quarter o thecorporation’s total investment in energy and water assets
More recently, with the oshore market beginning toseriously take o, the French energy/nuclear company Arevaacquired a majority shareholding in Multibrid, a German-based manuacturer developing a 5 MW turbine specicallydesigned or operating out at sea Engineering giant Alstomhas meanwhile taken over Ecotecnia, the Spanish turbinemanuacturer with a long and impressive track record Thesemoves are seen as signicant examples o broader industrial
conglomerates wanting to gain a toehold in the attractivewind market
Wind park, Germany
© Bundesverbansd WindEnergie e.V.
8/3/2019 03GWEC - Global Wind 2007
http://slidepdf.com/reader/full/03gwec-global-wind-2007 6/72
4 GWEC – GLOBAL WIND 2007 REPORT
Another actor which has encouraged the involvement olarger companies is the current shortage o turbines, a result
o the global boom in wind power development Projectdevelopers now need to make orders or their turbinesin large blocks up to several years in advance, requiring asubstantial nancial commitment in order to ensure a rmdelivery date rom the manuacturers At the same time themanuacturers themselves are having to invest large sums toexpand their production acilities so that they can meet thesoaring demand
Geate gaisatin
The involvement o these larger players has in turnencouraged a greater globalisation o the industry, althoughother actors are involved here as well as the simple drive toexploit new markets In the US, or example, the explosiono the wind power market has been driven by a mixtureo attractive state and ederal incentives, encouraging the
supply o green energy, and the competitiveness o windcompared with increasingly expensive gas There is also much
more space or large projects than in the more crowdedEuropean landscape
In Asia, on the other hand, the market has been spurred asmuch by the sheer growth in demand or more electricity toeed new industries as by wind’s environmental credentialsIndian businesses are also investing in their own windgenerators as a more reliable source o power than the over-stretched and temperamental grid
As a result, both Asia and the United States have witnessed
a recent burst o activity by mainly Europe-based companiesto gain a slice o their burgeoning wind markets In the USthis has seen Energias de Portugal acquire the developerHorizon Wind Power and EON buy developer Airtricity’sNorth American assets In Asia the activity has mainlybeen in the orm o joint ventures established by Europeanand US turbine manuacturers with Chinese companies toestablish local production acilities Under its bidding rulesor development sites the Chinese government has decreedthat 70% o the hardware used in any commercial windarm built in the country must be sourced rom a domestic
manuacturer
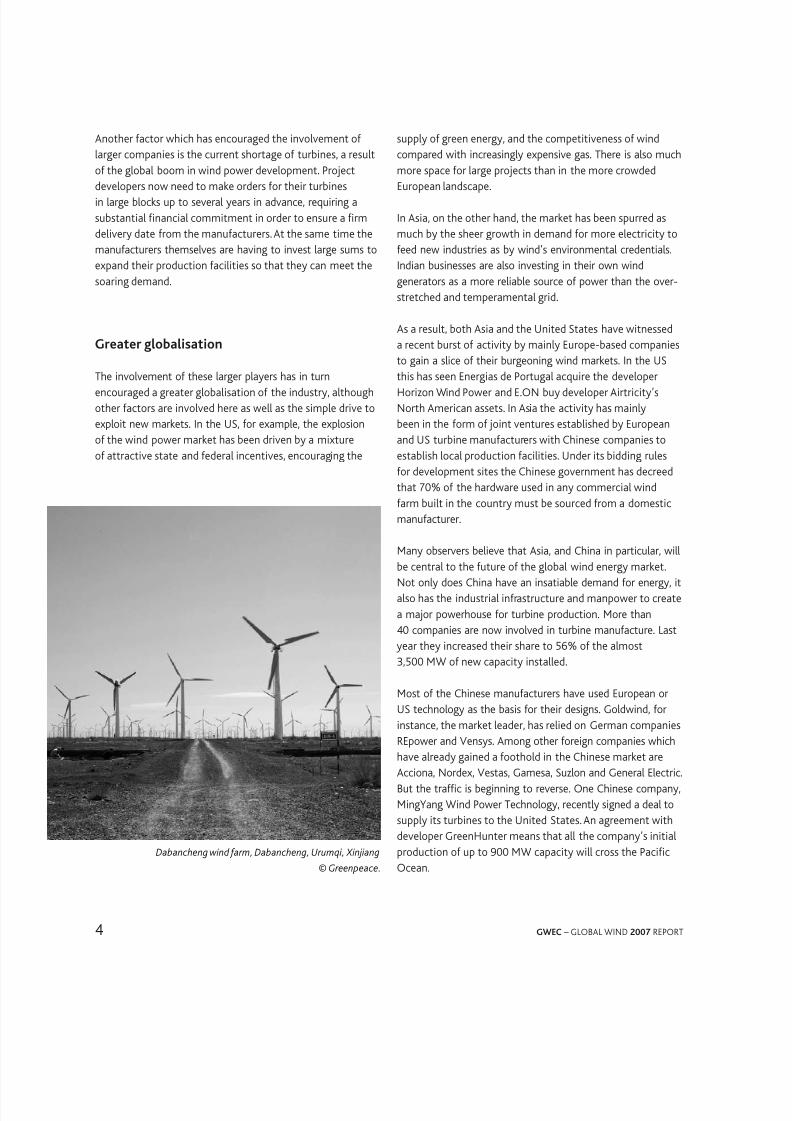
Many observers believe that Asia, and China in particular, willbe central to the uture o the global wind energy marketNot only does China have an insatiable demand or energy, italso has the industrial inrastructure and manpower to createa major powerhouse or turbine production More than40 companies are now involved in turbine manuacture Last year they increased their share to 56% o the almost3,500 MW o new capacity installed
Most o the Chinese manuacturers have used European orUS technology as the basis or their designs Goldwind, orinstance, the market leader, has relied on German companiesREpower and Vensys Among other oreign companies whichhave already gained a oothold in the Chinese market areAcciona, Nordex, Vestas, Gamesa, Suzlon and General ElectricBut the trac is beginning to reverse One Chinese company,MingYang Wind Power Technology, recently signed a deal tosupply its turbines to the United States An agreement withdeveloper GreenHunter means that all the company’s initialproduction o up to 900 MW capacity will cross the Pacic
Ocean
Dabancheng wind arm, Dabancheng, Urumqi, Xinjiang
© Greenpeace.

8/3/2019 03GWEC - Global Wind 2007
http://slidepdf.com/reader/full/03gwec-global-wind-2007 7/72
5GWEC – GLOBAL WIND 2007 REPORT
Meges an acquisitins
At the same time, wind developers and manuacturers havebeen expanding their international horizons through a serieso mergers and acquisitions Spanish group Acciona andItalian utility Enel, or example, jointly bought Spanish utilityEndesa during 2007, dividing up its wind power assets
The most dramatic example has been that o Suzlon, the
Indian wind turbine manuacturer created in 1994 by TulsiTanti, then running a amily textile business Ater achievinga strong position in the Indian wind market using importedGerman technology, Suzlon moved abroad, opening newheadquarters in Denmark and manuacturing capacity inthe US In 2005 it acquired the Belgian gearbox companyHansen Transmissions, which has about 30% o the windpower market, and last year took over German turbinemanuacturer REpower It is now knocking on the door othe world’s top ve turbine suppliers
Melanchton wind arm in Shelburne, Ontario
© CanWEA
On the project development side, according to Danishconsultants MAKE Consulting, “large IPPs and utilities areaggressively seeking to increase their own portolios owind power by acquiring smaller developers The end resultwill be seen in a couple o years’ time, when the number ocompanies active in project development will be reduced, asthe market is moving towards ewer, but larger, players”
But whilst current trends might point to North America and
Asia as the ront-runners in the globalisation o wind, othermarkets are certain to emerge soon Within Europe, investorsare turning to the potential o the new EU member states,especially in Eastern Europe, with Turkey another giant marketon Europe’s doorstep In South America, a number o countriesare on the verge o take-o, including Brazil and MexicoMeanwhile, with a new government elected on a mandateto sign up to the Kyoto Protocol, Australia could soon see itsmassive wind power opportunities nally realised What iscertain is that the changes o the last ew years mean that agrowing list o large globalised companies are ready, waiting
and have the nancial muscle to exploit these new markets assoon as the starting gun is red
8/3/2019 03GWEC - Global Wind 2007
http://slidepdf.com/reader/full/03gwec-global-wind-2007 8/72
6 GWEC – GLOBAL WIND 2007 REPORT
The status glbal win pwerin 2007
US, China & Sain ea w maket
In its best year yet, the global wind industry installed over20,000 MW in 2007 This development was lead by the US,China and Spain, and it brought the world-wide installedcapacity to 94,123 MW This is an increase o 31% comparedwith the 2006 market, and represents an overall increase inglobal installed capacity o about 27%
“The growth rates we are experiencing in wind energy
continue to exceed our most optimistic expectations,” saidGWEC Secretary General Steve Sawyer “Globally, windenergy has become a mainstream energy source and animportant player in the world’s energy markets, and it nowcontributes to the energy mix in more than 70 countriesacross the globe
The top ve countries in terms o installed capacity areGermany (223 GW), the US (168 GW), Spain (151 GW),India (8 GW) and China (61 GW) In terms o economicvalue, the global wind market in 2007 was worth about
25bn EUR or 37bn US$ in new generating equipment
US maket cntinues its m
The US reported a record 5,244 MW installed in 2007,more than double the 2006 gure, accounting or about30% o the country’s new power-production capacity in2007 Overall US wind power generating capacity grew by
45% in 2007, with total installed capacity now standing at168 GW
American wind arms will generate around 48 bn kWh oelectricity in 2008, just over 1% o US electricity supply,powering the equivalent o over 45 million homes
In 2007, 34 US states were producing electricity with windpower The states with the most cumulative installed windpower capacity are: Texas (4,356 MW), Caliornia (2,439MW), Minnesota (1,299 MW), Iowa (1,273 MW) and
Washington (1,163 MW)
It is expected that the US will overtake Germany as theleader on wind energy by the end o 2009 AWEA’s initialestimates indicate that another 5GW o new wind capacitywill be installed in 2008 Developers report that with strongdemand or wind power across the country, wind turbinesare sold out or the year However, AWEA projects that withmore companies entering the market, more turbines willbecome available The pace o growth in 2008 and beyond isexpected to largely depend, not on turbine availability, but
on the timing and duration o an extension o the ederalproduction tax credit (PTC), which is due to expire at the endo 2008
“This is the third consecutive year o record-setting growth,establishing wind power as one o the largest sources onew electricity supply or the country,” said AWEA ExecutiveDirector Randall Swisher “This remarkable and acceleratinggrowth is driven by strong demand, avorable economics,and a period o welcome relie rom the on-again, o-again,boom-and-bust cycle o the ederal production tax credit
(PTC) or wind power”
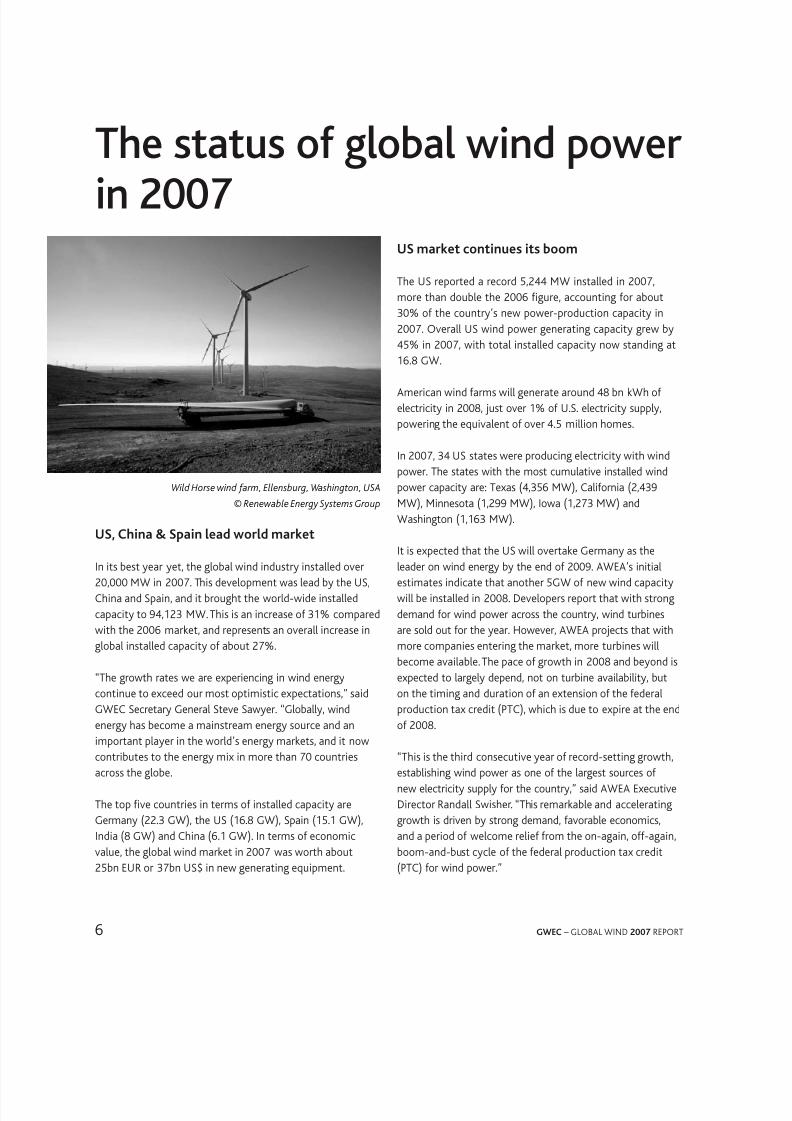
Wild Horse wind arm, Ellensburg, Washington, USA
© Renewable Energy Systems Group
8/3/2019 03GWEC - Global Wind 2007
http://slidepdf.com/reader/full/03gwec-global-wind-2007 9/72
7GWEC – GLOBAL WIND 2007 REPORT
“The extension o the production tax credit (PTC) is urgentlyneeded to protect tens o thousands o US manuacturing
and construction jobs and create tens o thousands more,and to keep investment fowing into one o the astest-growing and brightest sectors o our economy: renewableelectricity,” he adds
China sees uing annua maket - again
China added 3,449 MW o wind energy capacity during 2007,representing market growth o 156% over 2006, and nowranks th in total installed wind energy capacity with over
6,000 MW at the end o 2007 However, experts estimatethat this is just the beginning, and that the real growth inChina is yet to come Based on current growth rates, theChinese Renewable Energy Industry Association (CREIA)orecasts a capacity o around 50,000 MW by 2015 Theregions with the best wind regimes are located mainly alongthe South-East coast and Inner Mongolia, Xinjiang, GansuProvince’s Hexi Corridor and in some parts o North-EastChina, North-West China, Northern China and the Qinghai-Tibetan Plateau
The wind manuacturing industry in China is booming Whilein the past, imported wind turbines dominated the Chinesemarket, this is changing rapidly as the growing wind powermarket and the clear policy direction have encourageddomestic production
At the end o 2007, they were 40 Chinese manuacturersinvolved in wind energy, accounting or about 56% o theequipment installed during the year, up rom 41% in 2006
“This percentage is expected to increase substantially in the
uture Total domestic manuacturing capacity is now about5,000 MW, and is expected to reach 10-12 GW by 2010,”predicts GWEC President Pro Arthouros Zervos Establishedmajor Chinese manuacturers are Goldwind, Sinovel Windtec,Windey and Dongeng Electrical
While in 2006, only about 400 MW o new capacity wasmanuactured by Chinese manuacturers, in 2007, thetop two Chinese companies (Gold Wind and Sinovel)alone accounted or 1,460 MW o the new installedcapacity,representing about 42% o the annual market This
compares to only 37% provided by the top three oreignmanuacturers (Gamesa, Vestas and GE)
Natina gwth incnsistent in Eue, Saineaing the wa
The capacity o new wind turbines brought on line acrossEurope last year was 8,662 MW Total wind power capacity
installed by the end o 2007 reached 57,135 MW, which willavoid about 90 million tonnes o CO2
annually and produce119 TWh in an average wind year Wind energy is nowincreasing more than any other power technology in Europe,making up 40% o total new power installations in 2007,according to EWEA
The big surprise in the European market was Spain with3,522 MW o new capacity installed in 2007, the highestamount o any European country ever, earning it secondplace globally ater the US Total installed wind energy
capacity now stands at over 15 GW in Spain There was alsosustained growth in France with 888 MW o added capacityto reach 2,454 MW and Italy, with 603 MW added or a totalo 2,726 MW The new Member States perormed well andincreased installed capacity by 60%, with Poland, the mostsuccessul, reaching a total o 276 MW The Czech Republicinstalled 63 MW, its best year ever, and Bulgaria 34 MW
Nevertheless, a handul o markets pulled in the oppositedirection, including Germany, whose annual market shrank by25% compared to 2006 Portugal and the UK also slumped
As a result, the overall annual market growth in Europe in2007 o 11% was not what the industry had hoped or
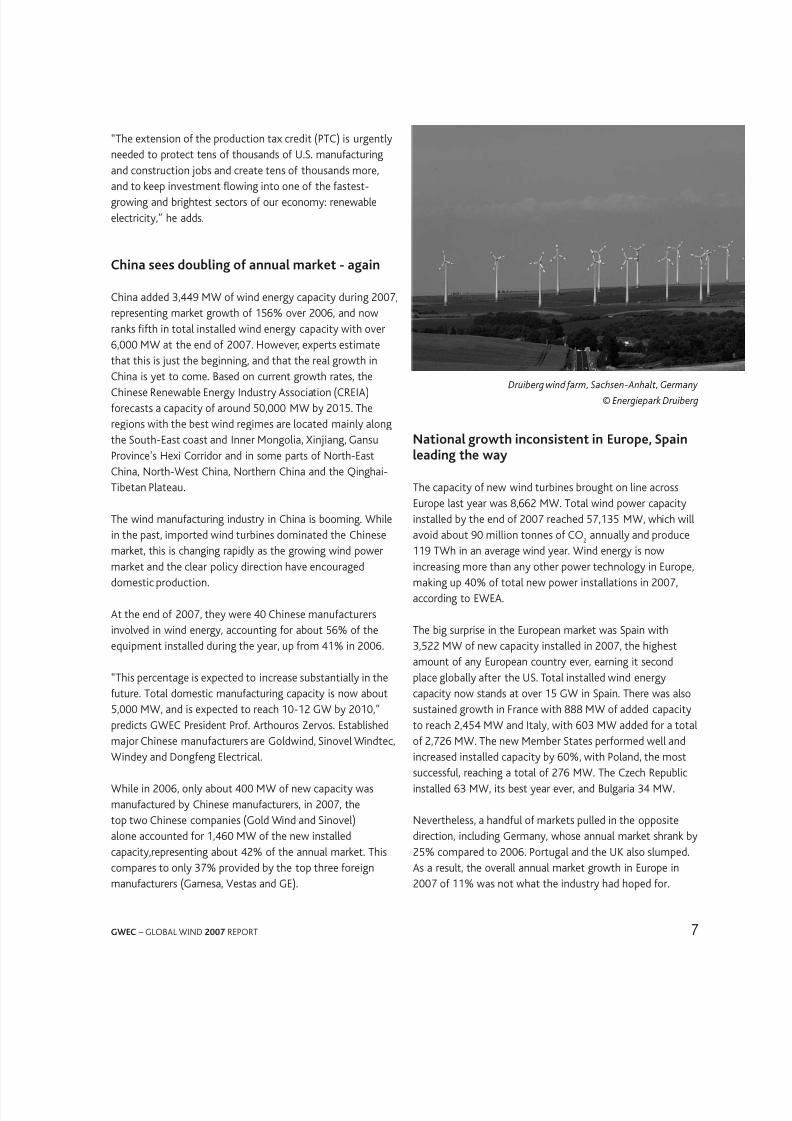
Druiberg wind arm, Sachsen-Anhalt, Germany
© Energiepark Druiberg

8/3/2019 03GWEC - Global Wind 2007
http://slidepdf.com/reader/full/03gwec-global-wind-2007 10/72
8 GWEC – GLOBAL WIND 2007 REPORT
Mait new instaatins in 2007 utsie Eue
While Europe remains the leading market or wind energy,new installations represented just 43% o the global total,down rom nearly 75% in 2004 For the rst time in decades,more than 50% o the annual wind market was outsideEurope, and this trend is likely to continue into the uture
While Europe, North America and Asia continue to see themost important additions to their wind energy capacity, theMiddle East/North Arica region increased its wind powerinstallations by 42%, reaching 538 MW at the end o 2007
New capacity was added in Egypt, Morocco and Iran
Growth in the Pacic region was led by New Zealand with151 MW in new capacity, which nearly doubled the country’s
total installations, reaching 322 MW While Australia had anexceptionally weak year with only 7 MW o new installations,the change in government at the end o 2007 spurs hopesor a brighter uture or wind energy Within hours o beingsworn in to oce, the new Labour Prime Minister Kevin Ruddsigned the ratication o the Kyoto Protocol, and the newgovernment is now making good on its promise o a targeto 20% power production by renewables by 2020 This islikely to have positive long-term impacts or wind energydevelopment on the continent
MW %
US 5,244 261
Spain 3,522 175
China 3,449 172
India 1,730 86
Germany 1,667 83
France 888 44
Italy 603 30
Portugal 434 22
UK 427 21
Canada 386 19
Rest o world 1,726 86
Tta t 10 18,350 914
Tta 20,076 1000
Top 10 NEW CApACITy
MW %
Germany 22,247 236
US 16,818 179
Spain 15,145 161
India 8,000 85
China 6,050 64
Denmark 3,125 33
Italy 2,726 29
France 2,454 26
UK 2,389 25
Portugal 2,150 23
Rest o world 13,019 138
Tta t 10 81,104 862
Tta 94,123 1000
Top 10 ToTAl INSTAllEd CApACITy

8/3/2019 03GWEC - Global Wind 2007
http://slidepdf.com/reader/full/03gwec-global-wind-2007 11/72
9GWEC – GLOBAL WIND 2007 REPORT
GlobAl CUMUlATIvE INSTAllEd CApACITy 1996-2007
1996 1997 1998 1999 2000 2001 2002 2003 2004 2005 2006 20076,100 7,600 10,200 13,600 17,400 23,900 31,100 39,431 47,620 59,091 74,141 94,123
90,00080,000
70,000
60,000
50,000
40,000
30,000
20,000
10,000
0
20,000
18,000
16,000
14,000
12,000
10,000
8,000
6,000
4,000
2,000
0
ANNUAl INSTAllEd CApACITy by rEGIoN 2003-2007
1996 1997 1998 1999 2000 2001 2002 2003 2004 2005 2006 2007
1,280 1,530 2,520 3,440 3,760 6,500 7,270 8,133 8,207 11,531 15,318 20,076
GlobAl ANNUAl INSTAllEd CApACITy 1996-2007
MW
MW
8,000
7,000
6,000
5,000
4,000
3,000
2,000
1,000
0
Europe Latin America Africa & Middle East Pacic
20032004
2005
2006
2007
MW
AsiaNorth America

8/3/2019 03GWEC - Global Wind 2007
http://slidepdf.com/reader/full/03gwec-global-wind-2007 12/72
10 GWEC – GLOBAL WIND 2007 REPORT
GlobAl INSTAllEd WINd poWEr CApACITy (MW) – rEGIoNAl dISTrIbUTIoN
1 Cape Verde, Israel, Jordan,Nigeria, South Arica;
2 Bangladesh, Indonesia,Sri Lanka;
3 Bulgaria, Croatia, Cyprus,Czech Republic, Estonia,Faroe Islands, Finland,Hungary, Iceland, Latvia,Liechtenstein, Lithuania,Luxembourg, Malta, Norway,Romania, Russia, Slovakia,
Slovenia, Switzerland,Ukraine;4 Austria, Belgium, Bulgaria,
Cyprus, Czech Republic,Denmark, Estonia, Finland,France, Germany, Greece,Hungary, Ireland, Italy, Latvia,Lithuania, Luxembourg,Malta, Netherlands, Poland,Portugal, Romania, Slovakia,Slovenia, Spain, Sweden, UK;
Please note: project
decommissioning o 93 MW and
rounding aect the fnal sums
*These numbers are provisional
and are awaiting nalconrmation
Source: GWEC
AFRICA & MIDDLE EAST
ASIA
EUROPE
LATIN AMERICA
& CARIBBEAN
NORTH AMERICA
PACIFIC REGION
Revised end 2006 New 2007 Total end 2007
Egypt 230 80 310
Morocco 64 60 124
Iran 48 19 67Tunisia 20 0 20
Other 1 16 1 17
Tta 378 160 538
India 6,270 1,730 * 8,000 *
China 2,604 3,449 * 6,050 *
Japan 1,394 139 1,538
Taiwan 188 100 282
South Korea 173 18 191
Philippines 25 0 25
Other 2 5 0 5
Tta 10,659 5,436 16,091
Germany 20,622 1,667 22,247
Spain 11,623 3,522 15,145
Denmark 3,136 3 3,125
Italy 2,123 603 2,726
France 1,567 888 2,454
UK 1,962 427 2,389
Portugal 1,716 434 2,150
Netherlands 1,558 210 1,746
Austria 965 20 982
Greece 746 125 871
Ireland 746 59 805
Sweden 571 217 788
Norway 325 8 333Belgium 194 93 287
Poland 153 123 276
Rest o Europe 3 556 263 812
Tta Eue 48,563 8,662 57,136
o which EU-27 4 48,069 8,554 56,535
Brazil 237 10 247
Mexico 87 0 87
Costa Rica 74 0 74
Caribbean (w/o Jamaica) 35 0 35
Argentina 27 2 29
Colombia 20 0 20
Jamaica 20 0 20Chile 2 18 20
Cuba 5 0 5
Tta 507 30 537
USA 11,575 5,244 16,818
Canada 1,460 386 1,846
Tta 13,035 5,630 18,664
Australia 817 7 824
New Zealand 171 151 322
Pacic Islands 12 0 12
Tta 1,000 158 1,158
W tta 74,141 20,076 94,123

8/3/2019 03GWEC - Global Wind 2007
http://slidepdf.com/reader/full/03gwec-global-wind-2007 13/72
11GWEC – GLOBAL WIND 2007 REPORT
GWEC is predicting the global wind market to grow byover 155% rom its current size to reach 240 GW o totalinstalled capacity by the year 2012 This would represent
an addition o 146 GW in 5 years, equaling an investmento over 180bn EUR (277 bn US$, both in 2007 value) Theelectricity produced by wind energy will reach over 500 TWhin 2012 (up rom 200 TWh in 2007), accounting or around3% o global electricity production (up rom just over 1% in2007)
The main areas o growth during this period will be NorthAmerica and Asia, and more specically the US and China
This orecast exceeds previous estimates by GWEC, and the
total installed capacity or 2010 has been corrected upwardsto reach 1719 GW (rom 1495 GW) These gures also lie
above GWEC’s most ambitious scenario as outlined in theGlobal Wind Energy Outlook in 2006, which orecast a totalglobal installed capacity o 221 GW in 2012, ie 193 GW
below the current estimate
The reasons or this adjustment are twoold: Firstly, boththe US and the Chinese market have been growing andwill continue to grow at a much aster rate than expectedeven a year ago Secondly, the emergence o signicantmanuacturing capacity in China will have a more importantimpact on the growth o the global markets than originallythought While tight production capacity is going to remainthe main limiting actor o urther market growth, machines‘made in China’ will help take some o the strain out o the
current supply situation
Market recast r 2008-2012
Fujian Dongshan Wujiao Wan wind arm, Dongshan, Fujian, China
© Greenpeace
8/3/2019 03GWEC - Global Wind 2007
http://slidepdf.com/reader/full/03gwec-global-wind-2007 14/72
12 GWEC – GLOBAL WIND 2007 REPORT
The average growth rates during this ve year period interms o total installed capacity are expected to be 206%,compared with 234% during 2003-2007 In 2012, Europewill continue to host the largest wind energy capacity, withthe total reaching 102 GW, ollowed by Asia with 66 GW andNorth America with 613 GW
The additions in installed capacity every year are predicted
to grow rom 20 GW in 2007 to 361 MW in 2012, withan average growth rate o 124% Considering that annualmarkets have been increasing by an average o 247% overthe last 5 year, growth could be much stronger also in theuture, were it not or continuing supply chain dicultieswhich considerably limit the growth o annual marketsor the next two years This problem should be overcomeby 2010, and along with the development o the oshoremarket, growth rates are expected to recover in the nextdecade
Asia is predicted to overtake Europe as the biggest annualmarket, with as much as 125 GW o new wind generatingcapacity installed during the year 2012, up rom 54 GWin 2007 This growth will be mainly led by China, whichhas since 2004 doubled its total capacity every year,thereby consistently exceeding even the most optimisticpredictions
By 2010, China is expected to be the biggest national annualmarket globally This development is underpinned by a rapidlygrowing number o domestic manuacturers operating in the
Chinese market, delivering home made turbines to large scalewind energy projects Already in 2007, 40 domestic suppliers
supplied 56% o the new installations in the domesticmarket, up rom 41% in 2006
While China will emerge as the continental leader in Asia,sustained growth is also oreseen in India, while other marketssuch as Japan, South Korea and Taiwan will also contribute tothe development o wind energy on the continent
The European market will by 2012 have allen to third placein terms o annual installations (103 GW), behind NorthAmerica (105 GW) Overall, this means that over 71% onew installations will occur outside o Europe in 2012, uprom 28% in 2004 and 57% in 2007 While in terms o totalinstalled capacity, Europe will continue to be the biggestregional market, its share will have allen to 424%
The large scale development o oshore wind energy isurther delayed and will only start to have a signicantimpact on European market growth towards the end o the
time period under consideration However, it is expected thatoshore development will lend new momentum to growth inEurope during the next decade
In Europe, Germany and Spain will remain the leadingmarkets, but their relative weight will decrease as a largernumber o national markets emerge on the scene While thespectacular growth o the Spanish market in 2007 with over35 GW o new installations will not be sustained, a stablepace o 2-25 GW per year on average can be expected,enabling Spain to reach the government’s 2010 target o
20 GW The size o the German annual market will continueto decrease, but it will remain the second strongest European
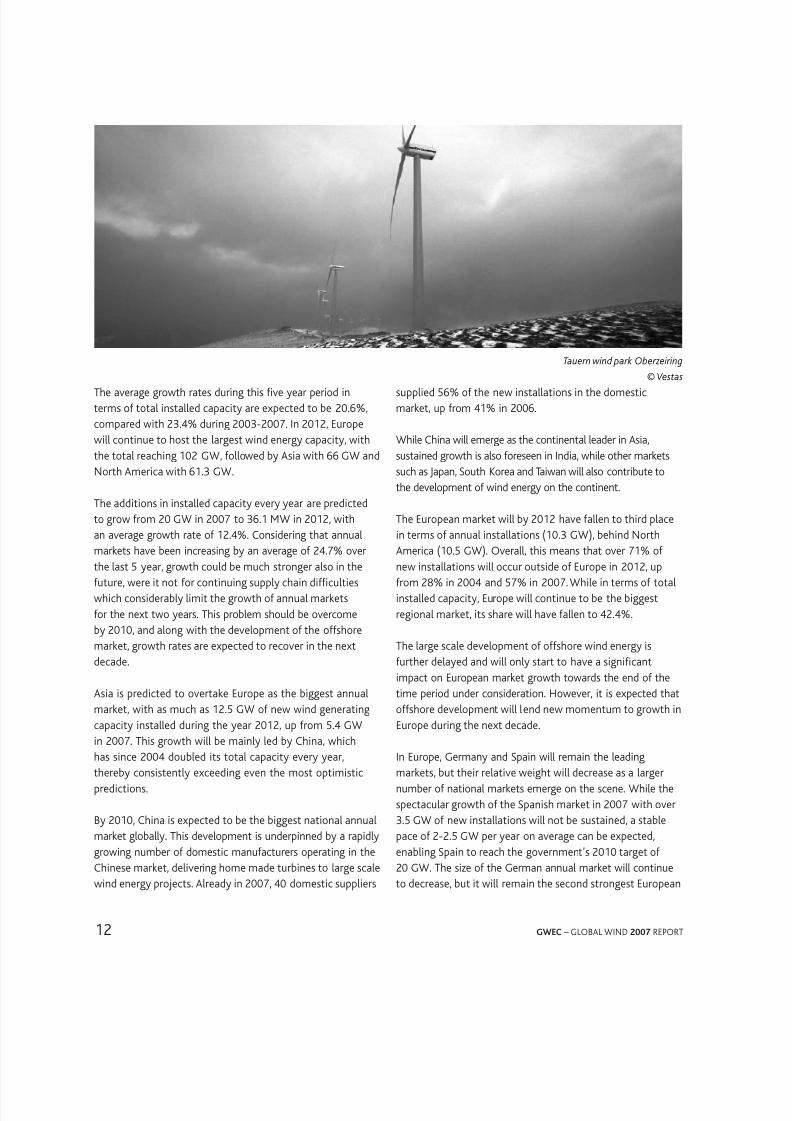
Tauern wind park Oberzeiring
© Vestas

8/3/2019 03GWEC - Global Wind 2007
http://slidepdf.com/reader/full/03gwec-global-wind-2007 15/72
13GWEC – GLOBAL WIND 2007 REPORT
ANNUAl INSTAllEd CApACITy 2008 - 2012
2008 2009 2010 2011 2012
14.4 % 12.6 % 11.6 % 11.8 % 11.8 %
23259
289
323
36140
35
30
25
20
15
10
5
0
GW
Growth rate
CUMUlATIvE CApACITy 2008 - 2012
2008 2009 2010 2011 2012
24.4 % 22.1 % 20.2 % 18.8 % 17.7 %
1173
143
1719
2042
2403300
250
200
150
100
50
0
GW
Growth rate
market or the 2008-2012 period, and the biggest in termso total installed capacity By 2010, oshore developments
will give new impetus to the German market, resulting instronger growth Other important markets in Europe willbe France and the United Kingdom, each increasing by anaverage o 1 GW per year
The North American market will grow even stronger thanpreviously thought, led by signicant growth in the US, aswell as sustained development o the Canadian market Intotal, North America will see an addition o 426 GW in thenext ve years, reaching 613 GW o total capacity in 2012This represents an average o 85 GW o new capacity added
every year, the bulk o which will be in the US
These gures assume that the US Production Tax Credit (PTC)will continue to be renewed in time or the current stronggrowth to continue Moreover, high level engagement o anincreasing number o US states, 24 o which have alreadyintroduced Renewable Portolio Standards, will also assuresustained growth A change in US administration may urtherunderpin this development
Latin America is expected to contribute to the global total in
a more substantial way in the uture, mainly driven by Brazil,Mexico and Chile By 2012, the total installed capacity inLatin America and the Caribbean will increase 8-old to reach
45 GW, with an annual market o 14 GW However, despiteits tremendous potential, Latin America is likely to remain a
small market until the end o the period under consideration,progressing towards more signicant development in thenext decade
The Pacic region will see around 23 GW o newinstallations in 2008-2012, bringing the total up to 35 GWWhile in Australia, wind energy development slowed downconsiderably in 2006 and 2007, the outlook or the utureis more optimistic, mainly thanks to the change in ederalgovernment at the end o 2007, the ratication o the KyotoProtocol and the pledge to implement a new target or
20% o electricity to come rom renewables by 2020 NewZealand, however, got new impetus with 151 MW o newinstallations, and many more projects are at various stages odevelopment
Arica and the Middle East will remain the region with thesmallest wind energy development, with a total installedcapacity o 3 GW by 2012, up rom 500 MW in 2007However, it is expected that market growth will pick up inthe coming ve years, with annual additions reaching around800 MW by 2012 This development will be driven by Egypt
and Morocco, with some development also predicted in otherNorth Arican and Middle Eastern countries
8/3/2019 03GWEC - Global Wind 2007
http://slidepdf.com/reader/full/03gwec-global-wind-2007 16/72
14 GWEC – GLOBAL WIND 2007 REPORT
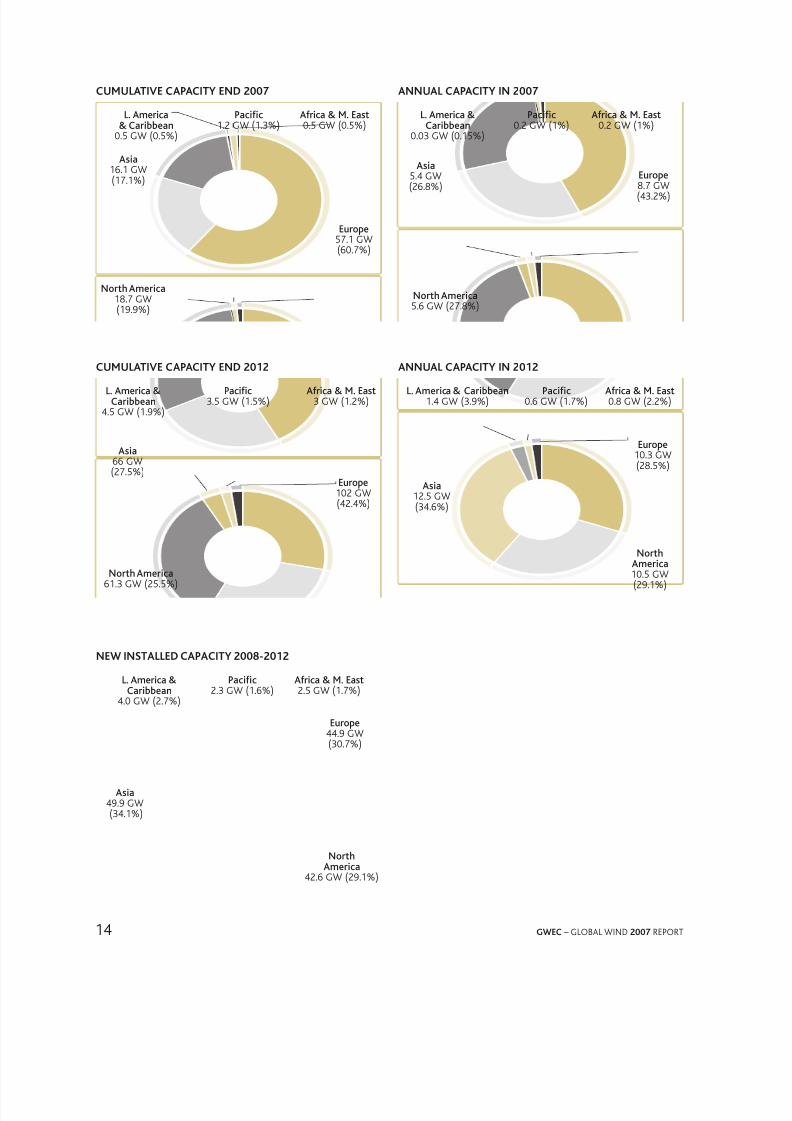
CUMUlATIvE CApACITy ENd 2007 ANNUAl CApACITy IN 2007
L. America& Caribbean
05 GW (05%)
Asia
161 GW(171%)
Pacifc12 GW (13%)
Arica & M. East05 GW (05%)
Pacifc02 GW (1%)
Arica & M. East02 GW (1%)
Eurpe87 GW(432%)
L. America &Caribbean
003 GW (015%)
Asia
54 GW(268%)
Nrth America56 GW (278%)
Eurpe571 GW(607%)
Nrth America187 GW(199%)
CUMUlATIvE CApACITy ENd 2012 ANNUAl CApACITy IN 2012
L. America &Caribbean
45 GW (19%)
Pacifc35 GW (15%)
Arica & M. East3 GW (12%)
L. America & Caribbean14 GW (39%)
Pacifc06 GW (17%)
Arica & M. East08 GW (22%)
Eurpe103 GW(285%)
NrthAmerica105 GW(291%)
Asia125 GW(346%)
Eurpe102 GW(424%)
Nrth America613 GW (255%)
Asia66 GW(275%)
NEW INSTAllEd CApACITy 2008-2012
L. America &Caribbean
40 GW (27%)
Pacifc23 GW (16%)
Arica & M. East25 GW (17%)
Eurpe449 GW(307%)
Nrth
America426 GW (291%)
Asia499 GW(341%)

8/3/2019 03GWEC - Global Wind 2007
http://slidepdf.com/reader/full/03gwec-global-wind-2007 17/72
15GWEC – GLOBAL WIND 2007 REPORT
Installe capacity by regin
Eue
>5,000 MW
2,000 - 5,000 MW
500 - 2,000 MW
50 - 500 MW
<49 MW
0 MW

8/3/2019 03GWEC - Global Wind 2007
http://slidepdf.com/reader/full/03gwec-global-wind-2007 18/72
16 GWEC – GLOBAL WIND 2007 REPORT
Nth Ameica, latin Ameica & Caiean
>5,000 MW
2,000 - 5,000 MW
500 - 2,000 MW
50 - 500 MW
<49 MW
0 MW

8/3/2019 03GWEC - Global Wind 2007
http://slidepdf.com/reader/full/03gwec-global-wind-2007 19/72
17GWEC – GLOBAL WIND 2007 REPORT
CAPACITY BY REGION
Asia & pacifc regin
>5,000 MW
2,000 - 5,000 MW
500 - 2,000 MW
50 - 500 MW
<49 MW
0 MW

8/3/2019 03GWEC - Global Wind 2007
http://slidepdf.com/reader/full/03gwec-global-wind-2007 20/72
18 GWEC – GLOBAL WIND 2007 REPORT
Aica & Mie East
>5,000 MW
2,000 - 5,000 MW
500 - 2,000 MW
50 - 500 MW
<49 MW
0 MW

8/3/2019 03GWEC - Global Wind 2007
http://slidepdf.com/reader/full/03gwec-global-wind-2007 21/72
19GWEC – GLOBAL WIND 2007 REPORT
CAPACITY BY REGION
Cuntry reprts

8/3/2019 03GWEC - Global Wind 2007
http://slidepdf.com/reader/full/03gwec-global-wind-2007 22/72
20 GWEC – GLOBAL WIND 2007 REPORT
AustraliaWith some o the world’s best wind resources, Australia is aprime market or wind energy The growing industry can takeadvantage o a stable, growing economy, good access to gridinrastructure and well organised nancial and legal servicesA change in government in late 2007 signalled a majorshit or climate change policy – placing the Australian windindustry in a strong position with a very positive outlook orgrowth in 2008 and beyond
The ic eninment
2007 was a watershed year in terms o Australia’s approachto climate change policy that will result in positive long-termimpacts or the wind industry
Bipartisan acceptance o the need or strong supportivepolicies or technology deployment, not just researchand development programs, is a major shit in the policylandscape and will drive deployment in the near term toensure the lowest cost in the long-term to meet emissionstargets
Despite little movement in ederal policy or most o 2007 –particularly in relation to extending the national MandatoryRenewable Energy Target (MRET) – momentum to supportrenewable energy deployment was building at the stateand territory level By August 2007, the states o Victoria,New South Wales, Queensland, Western Australia and theAustralian Capital Territory were all at various stages oimplementing state-based mandatory renewable energydeployment schemes
There were initial ears that the previous Liberal Governmentwould move to wind-up technology deployment policiessuch as MRET and attempt to abolish state schemes,including the Victorian Renewable Energy Target However, inSeptember they surprised many by announcing that ratherthan scrapping all renewable energy deployment schemesthey would consolidate all schemes into a national CleanEnergy Target scheme o 15% o electricity coming rom ‘lowemissions technologies’
However, the overwhelming breakthrough o the year or the
Australian wind industry came during the election campaignwhen the Labor Party, now the new government, met one o
the key asks o the Clean Energy Council – committing to anexpanded national target o 20% o electricity coming romrenewable energy by 2020 The new renewable energy targetwill underpin a strong and consistent growth in renewableenergy projects over the coming decade
Bipartisan support or a domestic emissions trading systememerged in 2007, with both major parties going into theederal election pledging to implement a domestic emissionstrading program The Labour Party had also announced itscommitment to a long term emissions reduction target o60% (compared with year 2000 levels) by 2050 as part otheir campaign These policies will gradually begin to levelthe playing eld between wind and other renewable energyand coal power, which holds a 77 per cent share o Australia’selectricity generation
2007 also saw the amalgamation o the Australian WindEnergy Association (Auswind) and the Australian BusinessCouncil or Sustainable Energy to orm the Clean EnergyCouncil - a single powerul industry voice or the cleanenergy sector in Australia
It is expected that 2008 is going to be an exciting andchallenging year The Clean Energy Council is ocussing onensuring that the details o the RE support scheme deliverinvestment certainty to wind and clean energy developersKey issues include: the build-up o electricity retailer liabilities
(ie the amount o renewable energy each retailer must buyand surrender under the scheme); project eligibility (ie which
Cathedral Rocks wind arm, South Australia
© Roaring 40s
8/3/2019 03GWEC - Global Wind 2007
http://slidepdf.com/reader/full/03gwec-global-wind-2007 23/72
21GWEC – GLOBAL WIND 2007 REPORT
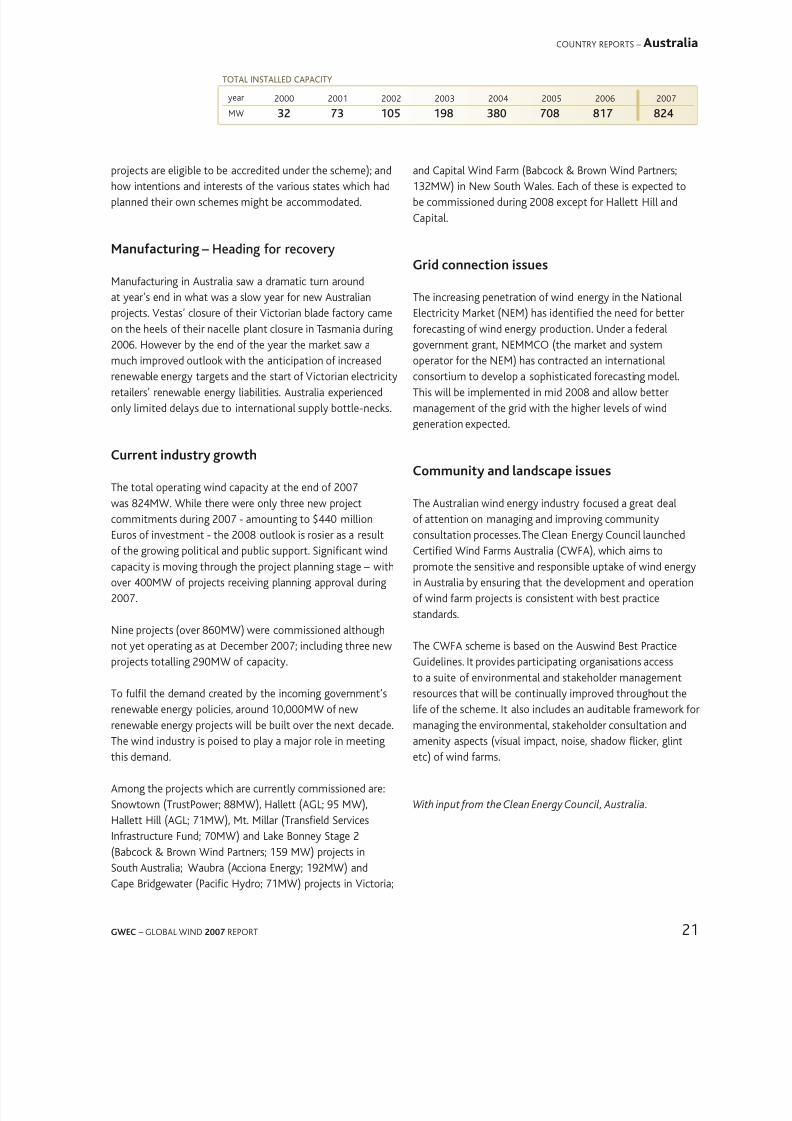
2000 2001 2002 2003 2004 2005 2006 2007
32 73 105 198 380 708 817 824
year
MW
ToTal InsTalleD caPacITY
COUNTRY REPORTS – Australia
projects are eligible to be accredited under the scheme); andhow intentions and interests o the various states which hadplanned their own schemes might be accommodated
Manuactuing – Heaing r recvery
Manuacturing in Australia saw a dramatic turn aroundat year’s end in what was a slow year or new Australianprojects Vestas’ closure o their Victorian blade actory cameon the heels o their nacelle plant closure in Tasmania during
2006 However by the end o the year the market saw amuch improved outlook with the anticipation o increasedrenewable energy targets and the start o Victorian electricityretailers’ renewable energy liabilities Australia experiencedonly limited delays due to international supply bottle-necks
Cuent inust gwth
The total operating wind capacity at the end o 2007was 824MW While there were only three new project
commitments during 2007 - amounting to $440 millionEuros o investment - the 2008 outlook is rosier as a resulto the growing political and public support Signicant windcapacity is moving through the project planning stage – withover 400MW o projects receiving planning approval during2007
Nine projects (over 860MW) were commissioned althoughnot yet operating as at December 2007; including three newprojects totalling 290MW o capacity
To ull the demand created by the incoming government’srenewable energy policies, around 10,000MW o newrenewable energy projects will be built over the next decadeThe wind industry is poised to play a major role in meetingthis demand
Among the projects which are currently commissioned are:Snowtown (TrustPower; 88MW), Hallett (AGL; 95 MW),Hallett Hill (AGL; 71MW), Mt Millar (Transeld ServicesInrastructure Fund; 70MW) and Lake Bonney Stage 2(Babcock & Brown Wind Partners; 159 MW) projects in
South Australia; Waubra (Acciona Energy; 192MW) andCape Bridgewater (Pacic Hydro; 71MW) projects in Victoria;
and Capital Wind Farm (Babcock & Brown Wind Partners;132MW) in New South Wales Each o these is expected tobe commissioned during 2008 except or Hallett Hill andCapital
Gi cnnectin issues
The increasing penetration o wind energy in the NationalElectricity Market (NEM) has identied the need or betterorecasting o wind energy production Under a ederal
government grant, NEMMCO (the market and systemoperator or the NEM) has contracted an internationalconsortium to develop a sophisticated orecasting modelThis will be implemented in mid 2008 and allow bettermanagement o the grid with the higher levels o windgeneration expected
Cmmunit an anscae issues
The Australian wind energy industry ocused a great deal
o attention on managing and improving communityconsultation processes The Clean Energy Council launchedCertied Wind Farms Australia (CWFA), which aims topromote the sensitive and responsible uptake o wind energyin Australia by ensuring that the development and operationo wind arm projects is consistent with best practicestandards
The CWFA scheme is based on the Auswind Best PracticeGuidelines It provides participating organisations accessto a suite o environmental and stakeholder management
resources that will be continually improved throughout thelie o the scheme It also includes an auditable ramework ormanaging the environmental, stakeholder consultation andamenity aspects (visual impact, noise, shadow ficker, glintetc) o wind arms
With input rom the Clean Energy Council, Australia.

8/3/2019 03GWEC - Global Wind 2007
http://slidepdf.com/reader/full/03gwec-global-wind-2007 24/72
22 GWEC – GLOBAL WIND 2007 REPORT
Brazil
Mucuripe wind arm, Ceará
© A WOBBEN WINDPOWER Ind. e Com. Ltda
The power generation mix in Brazil consists o 84%renewables (mainly hydropower), and renewables willcontinue to play an important role in the country’selectrication plans As high oil prices, electrical shortagesand air pollution problems are putting pressure on theauthorities to provide sustainable solutions, biomass,hydroelectricity, wind and solar power generation are in astrong position to be the main sources or rural electricationprojects
According to a wind atlas published by the Brazilian Wind
Energy Centre (CBEE) the total wind potential in Brazil isestimated to be about 143,500 MW However, at this stage,wind still plays a secondary role in Brazil Areas with thegreatest wind energy potential are in the North Eastern,Southern and South Eastern regions
Between 1999 and 2005, wind energy capacity in Brazilincreased only in very small increments, until in 2006, when208 MW were installed in one year, bringing the total to237 MW In 2007, only one wind arm o 102 MW cameonline: Eólica Millennium, a project acquired by Pacic Hydro
rom local company Bioenergy The total now stands at247 MW
The main obstacles to Brazilian wind power are signicantimport duties and taxes making projects less protable,unless complete local production and sourcing areestablished Also, the country has prioritised the developmento its biomass potential in the past ew years Wind power,however, is expected to grow substantially in the near uture
The proINFA gamme
Due to the high dependency on Brazil’s large but alreadymostly exploited hydro resources, the country aced a powershortage in 2001 In order to remedy the situation and avoidmore severe power crises in the uture, the governmentlaunched incentive programmes to encourage thermal andrenewable power generation
In 2002, the Brazilian government passed a programme calledPROINFA to stimulate the development o biomass, wind
and small hydro power generation This law was revised inNovember 2003
In the rst stage (up to 2008), the programme guaranteedpower sale contracts o 3,300 MW o projects using thesetechnologies The Brazilian state-controlled electricityutility Eletrobrás will buy power produced by RES underpower purchase agreements (PPAs) o 20 years at pre-setpreerential prices
As some projects under construction at the present stagemay not reach the PROINFA time limit o 2008, Eletrobrás isconsidering the possibility o extending the deadline to June
2009
The incremental costs o the RES power will be passed on tothe end-use consumers The Brazilian National DevelopmentBank (BNDES) will make special nancing programmesavailable or renewables projects that are eligible orPROINFA
PROINFA stipulates that a minimum o 60% o constructioncosts have to be spent domestically As a result, thegovernment expects the programme to generate 150,000
jobs and to attract private investments worth some26bn USD

8/3/2019 03GWEC - Global Wind 2007
http://slidepdf.com/reader/full/03gwec-global-wind-2007 25/72
23GWEC – GLOBAL WIND 2007 REPORT
2002 2003 2004 2005 2006 2007
22 29 29 29 237 247
ToTal InsTalleD caPacITY
COUNTRY REPORTS – Brazil
Originally, a second stage o PROINFA was oreseen once the3,300 MW objective had been met, with the aim to increasethe share o the three renewable sources to 10% o annualelectricity consumption within 20 years Renewable energygenerators would then have been required to issue a numbero Renewable Energy Certicates proportional to the amounto clean energy produced
However, despite the high expectations raised by the PROINFAprogramme, the scheme has to date ailed to deliver the greatnumber o wind projects the government had aimed or As
a result, the current government is showing little interestin taking PROINFA to its second stage, and is consideringreplacing it with an auction system The Brazilian Wind PowerAssociation (ABEEolica) is lobbying to proceed with PROINFA IIwhile at the same time introducing an auction process
Predictions or 2008 are quite optimistic: there are 14 windenergy plants under construction nanced by the PROINFAprogramme, amounting to 1073 MW o installed capacityIn addition, experts estimate that another 27 wind armsrepresenting 90129 MW could be added to the grid in 2009,
provided that PROINFA is extended until the rst semestero 2009
Ke aes in the baiian maket
In 2008, the largest players are expected to be Ventos do SulEnergia (SPC), Energias Renováveis do Brasil and SIIF Énergiesdo Brasil All players are in the process o constructing largewind arms in the regions o Rio Grande do Sul, Rio Grandedo Norte and Ceará SIIF Energies do Brasil intends to install
928 MW o wind energy by 2010
There are also a number o oreign groups looking orproject development opportunities as well as acquisitiono developed projects Fortuny intends to install 223 MWo wind energy in the south by 2011 Enercon is the largestsupplier o wind generators in Brazil, while Suzlon enteredthe market in 2007, signing two large contracts or a totalo 350 MW (or ‘nationalisation’ requirements, tower andother components will be bought rom Brazilian actories)Argentinean Impsa has also started building a actory in
Pernambuco to produce Vensys turbines, and is planning tomanuacture its own machines in the uture
Financing is typically done via the National Economic &Social Development Bank (BNDES), the Development Agencyo the Northeast (ADENE) and the Bank o the Northeast(BNB), all o which ocus on ethical and environmentallyriendly projects Furthermore the PROINFA also assures low-interest loans rom BNDES
Grid operators include Centrais Elétricas Brasileiras(Eletrobras) and Operador Nacional do Sistema Elétrico(ONS)
More than 5,000 MW o wind energy projects have alreadybeen registered with Brazilian Electricity RegulatoryAgency (ANEEL), awaiting approval or supply contractswith utilities in order to move orward with planning andconstruction These projects are non-PROINFA, but they arebeing developed in the anticipation o an auctions scheme,despite the act that the conditions o this scheme are as yetunknown
WINd FArMS IN brAzIl
Win pakrate pwe
(MW)
1 Eólica de Prainha 10
2 Eólica de Taíba 5
3 Eólica-Elétrica Experimental do Morro do Camelinho 1
4 Eólio - Elétrica de Palmas 25
5 Eólica de Fernando de Noronha 0225
6 Mucuripe 24
7 Rio do Fogo 493
8 Eólica de Bom Jardim 06
9 Eólica Olinda 0225
10 Parque Eólico do Horizonte 48
11 Macau 18
12 Eólica Água Doce 9
13 Parque Eólico de Osório 50
14 Parque Eólico Sangradouro 50
15 Parque Eólico dos Índios 50
16 Eólica Millennium 102
Tta 24710
With input rom AEEolica and Greenpeace Brazil.
year
MW
8/3/2019 03GWEC - Global Wind 2007
http://slidepdf.com/reader/full/03gwec-global-wind-2007 26/72
24 GWEC – GLOBAL WIND 2007 REPORT
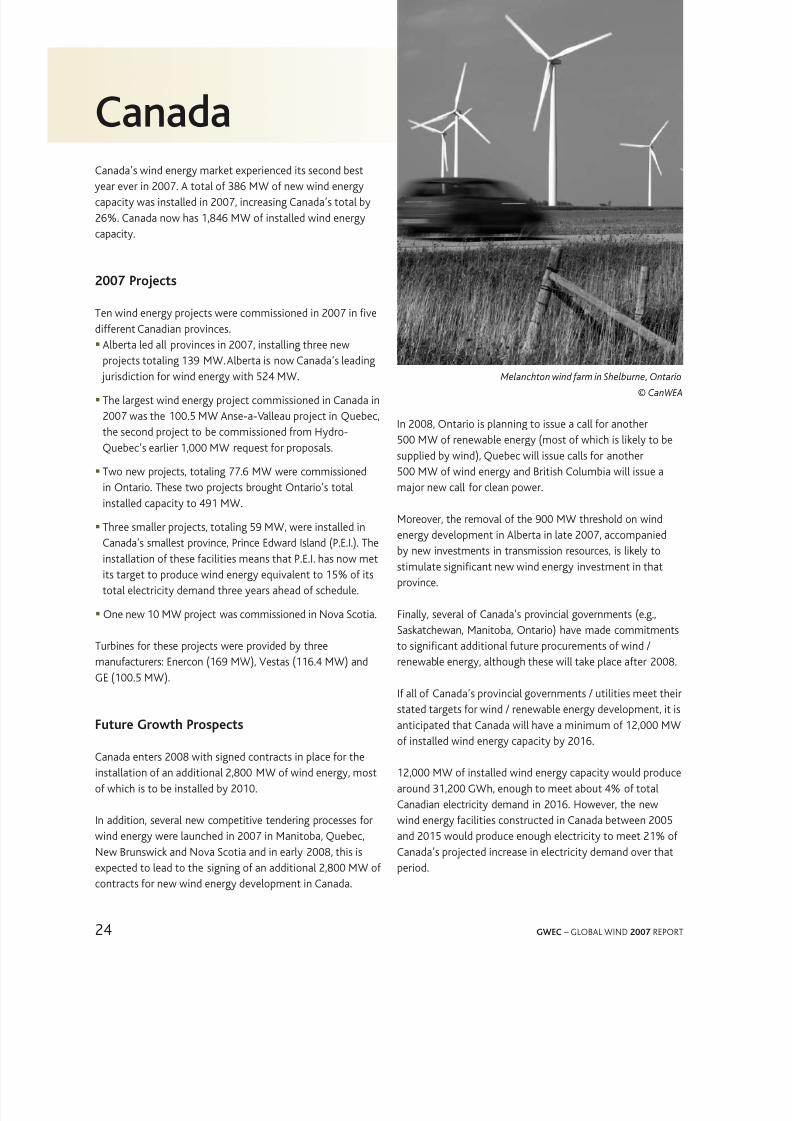
Canaa
Melanchton wind arm in Shelburne, Ontario
© CanWEA
Canada’s wind energy market experienced its second best year ever in 2007 A total o 386 MW o new wind energycapacity was installed in 2007, increasing Canada’s total by26% Canada now has 1,846 MW o installed wind energycapacity
2007 pects
Ten wind energy projects were commissioned in 2007 in vedierent Canadian provinces
Alberta led all provinces in 2007, installing three newprojects totaling 139 MW Alberta is now Canada’s leading jurisdiction or wind energy with 524 MW
The largest wind energy project commissioned in Canada in2007 was the 1005 MW Anse-a-Valleau project in Quebec,the second project to be commissioned rom Hydro-Quebec’s earlier 1,000 MW request or proposals
Two new projects, totaling 776 MW were commissionedin Ontario These two projects brought Ontario’s totalinstalled capacity to 491 MW
Three smaller projects, totaling 59 MW, were installed inCanada’s smallest province, Prince Edward Island (PEI) Theinstallation o these acilities means that PEI has now metits target to produce wind energy equivalent to 15% o itstotal electricity demand three years ahead o schedule
One new 10 MW project was commissioned in Nova Scotia
Turbines or these projects were provided by threemanuacturers: Enercon (169 MW), Vestas (1164 MW) andGE (1005 MW)
Futue Gwth psects
Canada enters 2008 with signed contracts in place or theinstallation o an additional 2,800 MW o wind energy, mosto which is to be installed by 2010
In addition, several new competitive tendering processes orwind energy were launched in 2007 in Manitoba, Quebec,New Brunswick and Nova Scotia and in early 2008, this is
expected to lead to the signing o an additional 2,800 MW ocontracts or new wind energy development in Canada
In 2008, Ontario is planning to issue a call or another500 MW o renewable energy (most o which is likely to besupplied by wind), Quebec will issue calls or another500 MW o wind energy and British Columbia will issue amajor new call or clean power
Moreover, the removal o the 900 MW threshold on windenergy development in Alberta in late 2007, accompaniedby new investments in transmission resources, is likely tostimulate signicant new wind energy investment in thatprovince
Finally, several o Canada’s provincial governments (eg,Saskatchewan, Manitoba, Ontario) have made commitmentsto signicant additional uture procurements o wind /renewable energy, although these will take place ater 2008
I all o Canada’s provincial governments / utilities meet theirstated targets or wind / renewable energy development, it isanticipated that Canada will have a minimum o 12,000 MWo installed wind energy capacity by 2016
12,000 MW o installed wind energy capacity would producearound 31,200 GWh, enough to meet about 4% o totalCanadian electricity demand in 2016 However, the newwind energy acilities constructed in Canada between 2005and 2015 would produce enough electricity to meet 21% oCanada’s projected increase in electricity demand over that
period
8/3/2019 03GWEC - Global Wind 2007
http://slidepdf.com/reader/full/03gwec-global-wind-2007 27/72
25GWEC – GLOBAL WIND 2007 REPORT
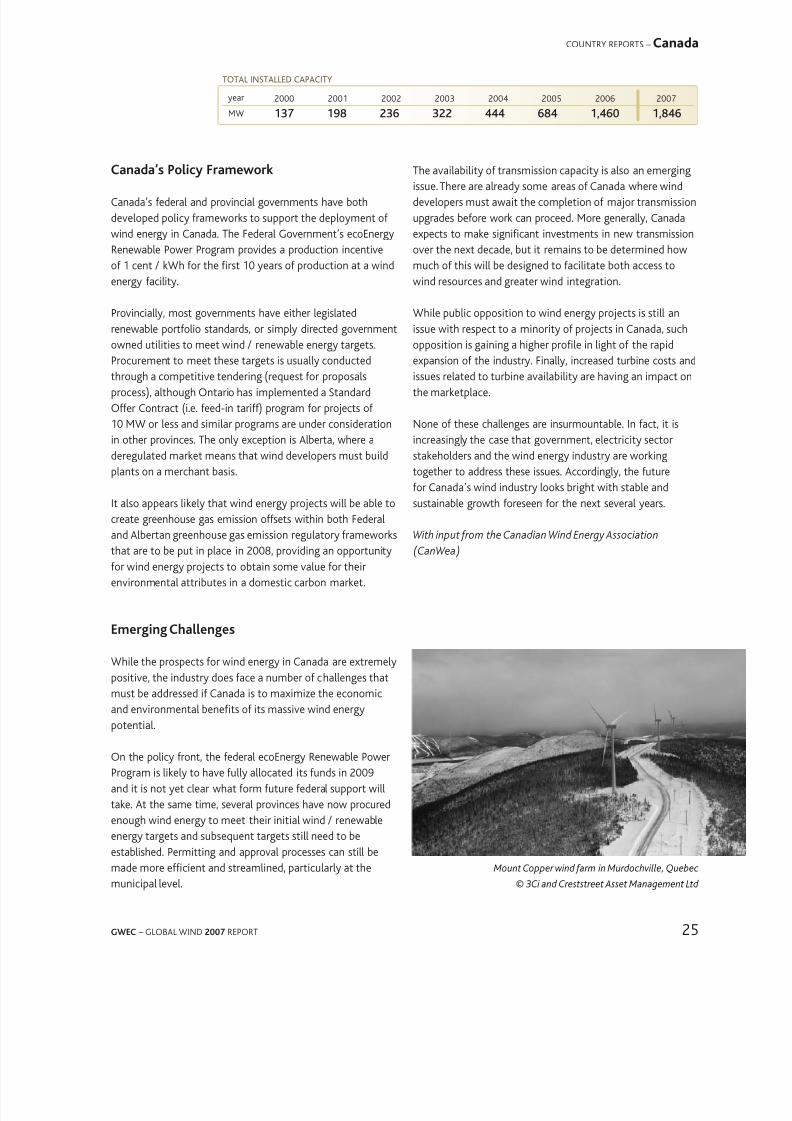
2000 2001 2002 2003 2004 2005 2006 2007
137 198 236 322 444 684 1,460 1,846
ToTal InsTalleD caPacITY
COUNTRY REPORTS – Canada
Canaa’s pic Famewk
Canada’s ederal and provincial governments have bothdeveloped policy rameworks to support the deployment owind energy in Canada The Federal Government’s ecoEnergyRenewable Power Program provides a production incentiveo 1 cent / kWh or the rst 10 years o production at a windenergy acility
Provincially, most governments have either legislatedrenewable portolio standards, or simply directed government
owned utilities to meet wind / renewable energy targetsProcurement to meet these targets is usually conductedthrough a competitive tendering (request or proposalsprocess), although Ontario has implemented a StandardOer Contract (ie eed-in tari) program or projects o10 MW or less and similar programs are under considerationin other provinces The only exception is Alberta, where aderegulated market means that wind developers must buildplants on a merchant basis
It also appears likely that wind energy projects will be able to
create greenhouse gas emission osets within both Federaland Albertan greenhouse gas emission regulatory rameworksthat are to be put in place in 2008, providing an opportunityor wind energy projects to obtain some value or theirenvironmental attributes in a domestic carbon market
Emeging Chaenges
While the prospects or wind energy in Canada are extremelypositive, the industry does ace a number o challenges that
must be addressed i Canada is to maximize the economicand environmental benets o its massive wind energypotential
On the policy ront, the ederal ecoEnergy Renewable PowerProgram is likely to have ully allocated its unds in 2009and it is not yet clear what orm uture ederal support willtake At the same time, several provinces have now procuredenough wind energy to meet their initial wind / renewableenergy targets and subsequent targets still need to beestablished Permitting and approval processes can still be
made more ecient and streamlined, particularly at themunicipal level
The availability o transmission capacity is also an emergingissue There are already some areas o Canada where winddevelopers must await the completion o major transmissionupgrades beore work can proceed More generally, Canadaexpects to make signicant investments in new transmissionover the next decade, but it remains to be determined howmuch o this will be designed to acilitate both access towind resources and greater wind integration
While public opposition to wind energy projects is still anissue with respect to a minority o projects in Canada, such
opposition is gaining a higher prole in light o the rapidexpansion o the industry Finally, increased turbine costs andissues related to turbine availability are having an impact onthe marketplace
None o these challenges are insurmountable In act, it isincreasingly the case that government, electricity sectorstakeholders and the wind energy industry are workingtogether to address these issues Accordingly, the utureor Canada’s wind industry looks bright with stable andsustainable growth oreseen or the next several years
With input rom the Canadian Wind Energy Association
(CanWea)
Mount Copper wind arm in Murdochville, Quebec© 3Ci and Creststreet Asset Management Ltd
year
MW

8/3/2019 03GWEC - Global Wind 2007
http://slidepdf.com/reader/full/03gwec-global-wind-2007 28/72
26 GWEC – GLOBAL WIND 2007 REPORT
Chile
Canela wind arm
©EndesaEco
At the end o 2007, the rst wind park was connected tothe main grid system in Chile, adding 182 MW o powergenerating capacity There is another small wind park inthe ar south o the country Since May 2006, anothersix projects totalling 257 MW are being evaluated by theenvironmental authorities The construction o three o themhas already been approved and the rest are waiting or ananswer
renewae eneg icies in Chie
President Bachelet has committed her government to atarget or 15% o new power capacity to come rom newrenewable energy between 2006 and 2010
The previous government already eliminated some o thebarriers to renewable energy in 2004 and 2005:
the right to provide renewable energy to distributors whosupply small consumers;
the obligation o the distribution operators to allow the
connection o small power stations to their networks;
the elimination o the obligation to pay dispatching coststo the system operator;
priority access to the grid without a specic generationrequirement;
the partial exemption rom transmission costs; thisexemption applies only i small generators o renewableenergy do not exceed 5% o the total demand o smallconsumers, who are regulated separately A distinction is
also made between power stations smaller than 9 MW thathave the ull exemption and power stations smaller than20 MW that can claim partial exemption
These changes in legislation have encouraged the study oseveral wind power stations, supported by a und establishedby the government, which provides support o up to150,000 dollars per project To speed up the development onew renewable energy projects, the government introduceda new modication o the law governing electricity at thebeginning o 2007
This law, which is currently still being discussed, obliges thebig power companies to purchase 5% renewable energyby the end o 2010 until the year 2035; this percentageobligation will increase gradually, by 0,5% each year, until itreaches 10%
Failure to ull this requirement will invoke a ne o about30 USD or each MWh that was not purchased each yearThese nes will be turned over to the consumers who buypower rom companies that did ull the requirement
baies t win eneg eement
These legal modications are insucient support topromoters and investors in new renewable energy, asthis law does not incorporate mechanisms or xing orsupporting taris, which would increase certainty orinvestors Furthermore the new renewables generatorshave the same obligations in their supply contracts as a bigthermal or hydroelectric power stations; they have to pay
the transmission costs which are highly variable but can bevery substantial, and are obliged to assume the costs o gridconnection
Another barrier to the development o wind energy is thelack o good publicly available resource mapping Mostmeasurements have been done on a commercial basis andare thereore not available or public planning purposes Thegovernment is looking to do resource assessment in thoseareas that have been identied as suitable: the coastal zoneso the regions o Atacama, Coquimbo and Maule Other areas
8/3/2019 03GWEC - Global Wind 2007
http://slidepdf.com/reader/full/03gwec-global-wind-2007 29/72
27GWEC – GLOBAL WIND 2007 REPORT
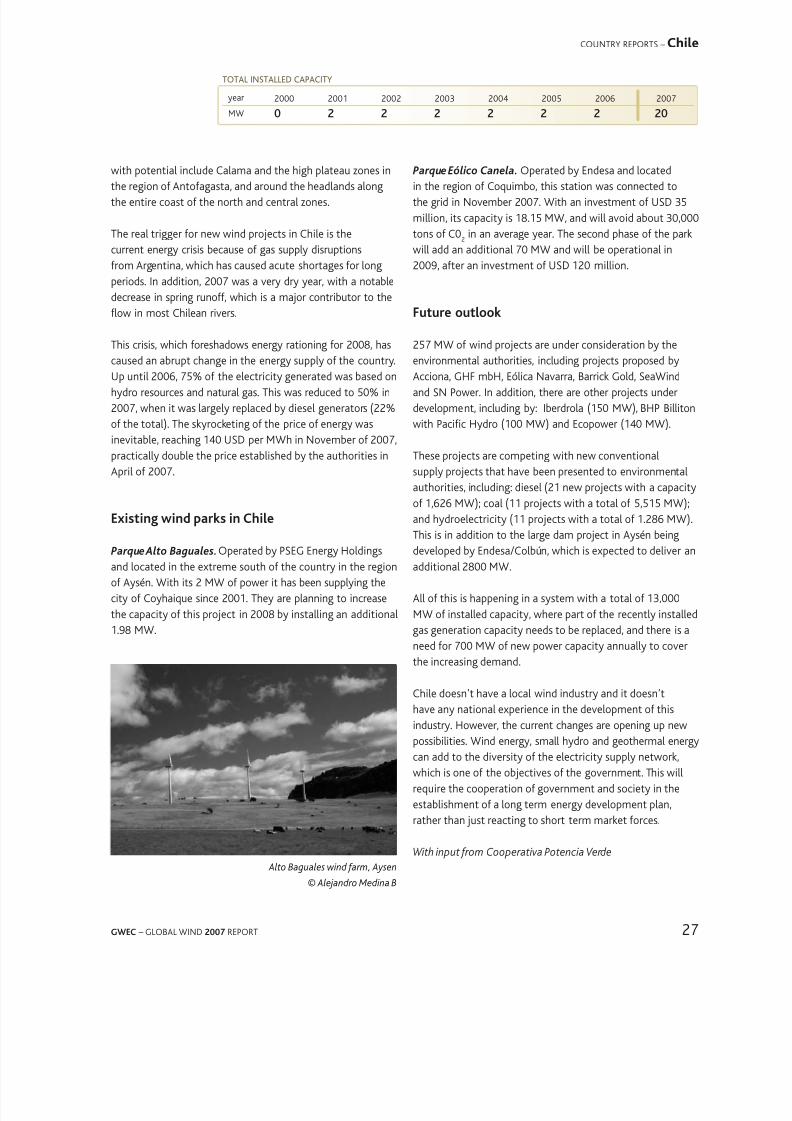
Alto Baguales wind arm, Aysen© Alejandro Medina B
2000 2001 2002 2003 2004 2005 2006 2007
0 2 2 2 2 2 2 20
ToTal InsTalleD caPacITY
COUNTRY REPORTS – Chile
with potential include Calama and the high plateau zones inthe region o Antoagasta, and around the headlands alongthe entire coast o the north and central zones
The real trigger or new wind projects in Chile is thecurrent energy crisis because o gas supply disruptionsrom Argentina, which has caused acute shortages or longperiods In addition, 2007 was a very dry year, with a notabledecrease in spring runo, which is a major contributor to thefow in most Chilean rivers
This crisis, which oreshadows energy rationing or 2008, hascaused an abrupt change in the energy supply o the countryUp until 2006, 75% o the electricity generated was based onhydro resources and natural gas This was reduced to 50% in2007, when it was largely replaced by diesel generators (22%o the total) The skyrocketing o the price o energy wasinevitable, reaching 140 USD per MWh in November o 2007,practically double the price established by the authorities inApril o 2007
Existing win aks in Chie
Parque Alto Baguales.Operated by PSEG Energy Holdingsand located in the extreme south o the country in the regiono Aysén With its 2 MW o power it has been supplying thecity o Coyhaique since 2001 They are planning to increasethe capacity o this project in 2008 by installing an additional198 MW
Parque Eólico Canela. Operated by Endesa and locatedin the region o Coquimbo, this station was connected tothe grid in November 2007 With an investment o USD 35million, its capacity is 1815 MW, and will avoid about 30,000tons o C0
2in an average year The second phase o the park
will add an additional 70 MW and will be operational in2009, ater an investment o USD 120 million
Futue utk
257 MW o wind projects are under consideration by theenvironmental authorities, including projects proposed byAcciona, GHF mbH, Eólica Navarra, Barrick Gold, SeaWindand SN Power In addition, there are other projects underdevelopment, including by: Iberdrola (150 MW), BHP Billitonwith Pacic Hydro (100 MW) and Ecopower (140 MW)
These projects are competing with new conventionalsupply projects that have been presented to environmentalauthorities, including: diesel (21 new projects with a capacityo 1,626 MW); coal (11 projects with a total o 5,515 MW);
and hydroelectricity (11 projects with a total o 1286 MW)This is in addition to the large dam project in Aysén beingdeveloped by Endesa/Colbún, which is expected to deliver anadditional 2800 MW
All o this is happening in a system with a total o 13,000MW o installed capacity, where part o the recently installedgas generation capacity needs to be replaced, and there is aneed or 700 MW o new power capacity annually to coverthe increasing demand
Chile doesn’t have a local wind industry and it doesn’thave any national experience in the development o thisindustry However, the current changes are opening up newpossibilities Wind energy, small hydro and geothermal energycan add to the diversity o the electricity supply network,which is one o the objectives o the government This willrequire the cooperation o government and society in theestablishment o a long term energy development plan,rather than just reacting to short term market orces
With input rom Cooperativa Potencia Verde
year
MW

8/3/2019 03GWEC - Global Wind 2007
http://slidepdf.com/reader/full/03gwec-global-wind-2007 30/72
28 GWEC – GLOBAL WIND 2007 REPORT
China
The w’s astest gwing win enegmaket
China is the world’s astest growing wind energy market,with an average annual growth rate o 56% in the pastseven years The country has now reached the th placeor installed wind energy capacity, with over 6 GW at theend o 2007 However, experts estimate that this is just thebeginning, and that the real growth in China is yet to comeBased on the current growth rates, the Chinese RenewableEnergy Industry Association (CREIA) orecasts a capacity o
around 50 GW by 2015
With its large land mass and long coastline, China isexceptionally rich in wind energy potential In 2007, nationalresearch showed that the on-shore technically easible windresource in China is around 1,000 GW In addition to that,the o-shore potential is estimated at around 300 GW Theregions with the best wind regimes are located mainly alongthe South-East coast and Inner Mongolia, Xinjiang, GansuProvince’s Hexi Corridor and in some parts o North-EastChina, North-West China, Northern China and the Qinghai-
Tibetan Plateau
The rst Chinese wind arm went online in 1986 as ademonstration project, ollowed by urther projects nancedby oreign grants or sot loans In 1994, the ormer Ministryo Electric Power took the decision to develop wind energy asa new clean power source or the country Regulations wereissued to address issues o grid connection and paymentmechanisms
The main ies win eneg
Satisying rocketing electricity demand and reducing airpollution are the main driving orces behind the developmento wind energy in China However, given the country’ssubstantial coal resources and the still relatively low costo coal-red generation, cost reduction o wind poweris a crucial issue, which is being addressed through thedevelopment o large scale projects and boosting localmanuacturing o wind turbines
The Chinese government estimates that the localisationo wind turbine manuacturing brings benets to the local
economy and helps keep costs down Moreover, since mostgood wind sites are located in remote and poorer rural areas,wind arm construction benets the local economy through
the annual income tax paid to county governments, whichrepresents a signicant proportion o their budget Otherbenets include grid extension or rural electrication as wellas employment in wind arm construction and maintenance
The gwth the mestic inust
The wind manuacturing industry in China is booming Whilein the past, imported wind turbines dominated the Chinesemarket, this is changing rapidly as the growing wind power
market and the clear policy direction have encourageddomestic production
Fujian Dongshan Wujiao Wan wind arm, Dongshan, Fujian
© Greenpeace
8/3/2019 03GWEC - Global Wind 2007
http://slidepdf.com/reader/full/03gwec-global-wind-2007 31/72
29GWEC – GLOBAL WIND 2007 REPORT
2000 2001 2002 2003 2004 2005 2006 2007*
346 402 469 567 764 1,260 2,604 6,050
ToTal InsTalleD caPacITY
COUNTRY REPORTS – China
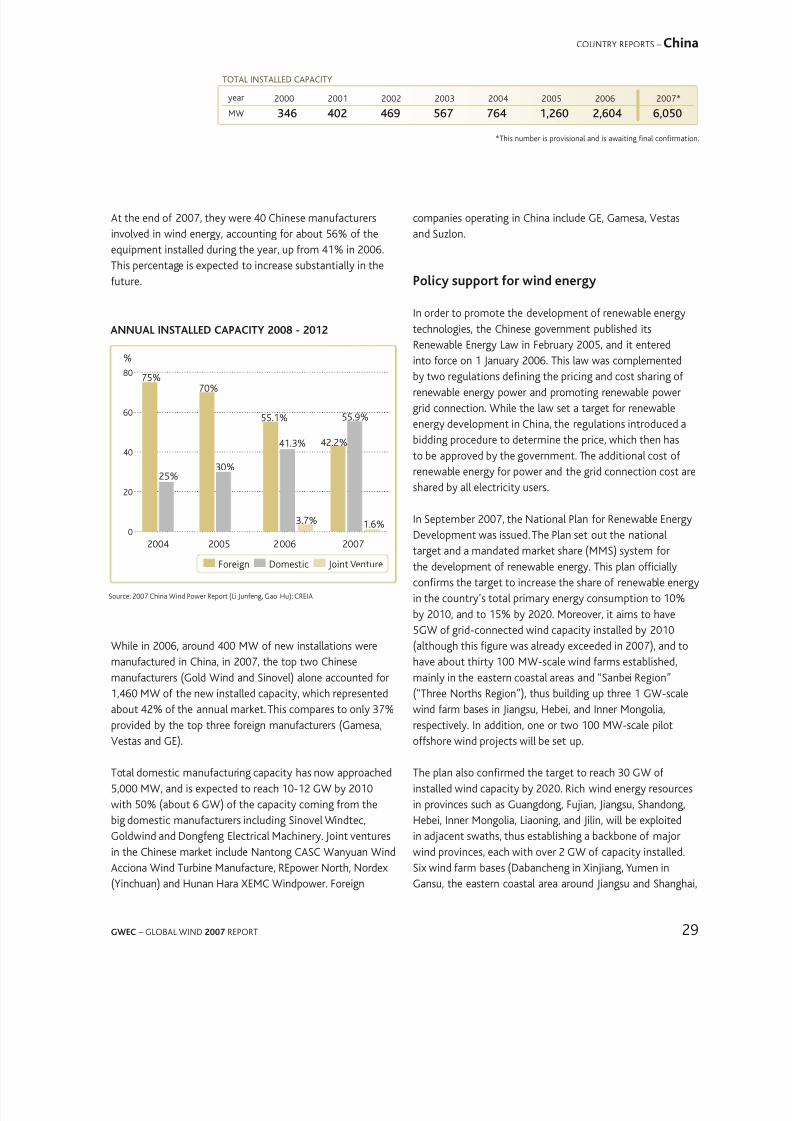
At the end o 2007, they were 40 Chinese manuacturersinvolved in wind energy, accounting or about 56% o theequipment installed during the year, up rom 41% in 2006This percentage is expected to increase substantially in theuture
companies operating in China include GE, Gamesa, Vestasand Suzlon
pic sut win eneg
In order to promote the development o renewable energytechnologies, the Chinese government published its
Renewable Energy Law in February 2005, and it enteredinto orce on 1 January 2006 This law was complementedby two regulations dening the pricing and cost sharing orenewable energy power and promoting renewable powergrid connection While the law set a target or renewableenergy development in China, the regulations introduced abidding procedure to determine the price, which then hasto be approved by the government The additional cost orenewable energy or power and the grid connection cost areshared by all electricity users
In September 2007, the National Plan or Renewable EnergyDevelopment was issued The Plan set out the nationaltarget and a mandated market share (MMS) system orthe development o renewable energy This plan ociallyconrms the target to increase the share o renewable energyin the country’s total primary energy consumption to 10%by 2010, and to 15% by 2020 Moreover, it aims to have5GW o grid-connected wind capacity installed by 2010(although this gure was already exceeded in 2007), and tohave about thirty 100 MW-scale wind arms established,mainly in the eastern coastal areas and “Sanbei Region”
(“Three Norths Region”), thus building up three 1 GW-scalewind arm bases in Jiangsu, Hebei, and Inner Mongolia,respectively In addition, one or two 100 MW-scale pilotoshore wind projects will be set up
The plan also conrmed the target to reach 30 GW oinstalled wind capacity by 2020 Rich wind energy resourcesin provinces such as Guangdong, Fujian, Jiangsu, Shandong,Hebei, Inner Mongolia, Liaoning, and Jilin, will be exploitedin adjacent swaths, thus establishing a backbone o majorwind provinces, each with over 2 GW o capacity installed
Six wind arm bases (Dabancheng in Xinjiang, Yumen inGansu, the eastern coastal area around Jiangsu and Shanghai,
Source: 2007 China Wind Power Report (Li Juneng, Gao Hu); CREIA
ANNUAl INSTAllEd CApACITy 2008 - 2012
2004 2005 2006 2007
75%
25%
70%
30%
551%
422%
559%
16%
413%
37%
80
60
40
20
0
Foreign Domestic Joint Venture
%
While in 2006, around 400 MW o new installations weremanuactured in China, in 2007, the top two Chinesemanuacturers (Gold Wind and Sinovel) alone accounted or
1,460 MW o the new installed capacity, which representedabout 42% o the annual market This compares to only 37%provided by the top three oreign manuacturers (Gamesa,Vestas and GE)
Total domestic manuacturing capacity has now approached5,000 MW, and is expected to reach 10-12 GW by 2010with 50% (about 6 GW) o the capacity coming rom thebig domestic manuacturers including Sinovel Windtec,Goldwind and Dongeng Electrical Machinery Joint venturesin the Chinese market include Nantong CASC Wanyuan Wind
Acciona Wind Turbine Manuacture, REpower North, Nordex(Yinchuan) and Hunan Hara XEMC Windpower Foreign
year
MW
*This number is provisional and is awaiting nal conrmation

8/3/2019 03GWEC - Global Wind 2007
http://slidepdf.com/reader/full/03gwec-global-wind-2007 32/72
30 GWEC – GLOBAL WIND 2007 REPORT
Huitengxile in Inner Mongolia, the Zhangbei Region o Hebei,and Baicheng in Jilin) will be developed each with a GW-level
installed capacity In addition, 1 GW oshore wind capacitywill be installed
In December 2007, a White Paper Council on energyconditions and policies by the Oce o the State did not, asexpected, emphasise coal as the main energy source or thecountry, but ocused on energy diversication, environmentalprotection and clean energy
Cncessin ects
Encouraging large scale commercial development o thedomestic wind power industry is a priority or the Chinesegovernment, and wind power projects larger than 50 MW areapproved by the national government through the National
Development and Reorm Commission (NDRC) The NDRCevaluates submissions according to the price per kWh o
power produced and the share o domestic components used
The main elements or wind power concession projects are: Each project should be 100MW and the turbines no smaller
than 600kW
Project investors are selected by public bidding, with thelowest eed-in tari (price per kWh) obtaining the contractThe length o the contract is 25 years
Ater the rst 30,000 ull load hours o operation or aturbine, the eed-in tari is reduced to the average or the
power market at that timeAll electricity produced by the project must be purchased
by the provincial power grid company
The dierence between the wind power price and theconventional power price is shared among the provincialgrids
70% o the wind turbine components should be made inChina
Local authorities are responsible or building access roads
to the wind arm sub-station, and the grid company ortransmission lines to the sub-station
In 2003-2006, our rounds o wind concession tenderingprogrammes have been conducted and by the end o 2006,teen projects were approved, accounting or 255GWo wind energy capacity All the projects have startedconstruction, but only 25% o them have been completedFull completion should be achieved by 2009 A urther3,000 MW have been approved by the local wind biddingprocedures based on the same principles as the wind
concession programme
The aim o the concession scheme has been to encourage areduction in the price o wind power within China’s reormedelectricity industry As a result, the taris oered by winningconcessions have been extremely low, causing the biddersto either overestimate the power output o their project orunderestimate the costs involved It is signicant to notethat successul bidders have been predominantly Chinesestate-run companies prepared to sacrice the short-termprotability o their projects For international market
entrants, however, this provided little incentive or urtherinvestment Jieyuan Yumen wind arm, Yumen, Gansu
© Greenpeace

8/3/2019 03GWEC - Global Wind 2007
http://slidepdf.com/reader/full/03gwec-global-wind-2007 33/72
31GWEC – GLOBAL WIND 2007 REPORT
To remedy this situation, changes were made to theconcession bidding process in the 5th round o tendering
in 2007 with the aim to discourage bidders rom usingan unreasonably low price or their bid The weight o thebidding price is 25% and those bidders with the bidding priceclosest to the average bidding price score the highest
Another major adjustment relates to the specic regulationor wind power equipment manuacturers As a supplier joining the bidding, one manuacturer can sign supplycontracts or a single type o wind turbine with up to threedevelopers In the rst our rounds, a supplier contract hadto be exclusively with one developer This adjustment means
that developers have more choice o turbines, therebyimproving the technical quality o the project plan
Meanwhile, some adjustment has been made to the biddingpapers according to the changes o national policies andrelevant technical regulations and dierent requirementso the bidders At this point in time it is dicult to evaluatethe 5th round o bidding since the results have not yet beenpublished However, the adjustments are promising in termso optimising the wind power pricing mechanism
The 5th round o concession projects called or a totalcapacity o about 2,700 MW, including six wind arms o300 MW, three o 200 MW and two o 150 MW
Futue psects
According to the list o approved projects and those underconstruction, 5,000 MW o new wind capacity could beinstalled in 2008 Based on the “learning curve” theory ocost reduction, this volume could bring the cost o wind
power down closer to that o coal, especially in the currentclimate o rising coal prices
The government target o installing 5 GW o wind power by2010 was already exceeded in 2007, and the 2020 targeto 30 GW is also likely to be exceeded well ahead o timeBy the end o 2020 it is estimated that, in order to satisygrowing demand, the total power capacity in China will reach1,000 GW
Major areas or wind energy development in China in the
next 5 to 10 years are poised to be Inner Mongolia, Jiangsu,Hebei and Jilin
CdM cntiutins win
Since 2005, 90% o the non-concession wind projects inChina have applied or registration under the Kyoto Protocol’sClean Development Mechanism (CDM) About 54 Chinesewind energy projects (with a total capacity o 2,7508 MW)are registered at the CDM Executive Board to date, and149 projects have received approval o the Government oChina The price ranges rom 9 to11 Euros per ton o CERs Intotal, as o 1 March 2008, there were 171 projects totaling8,990 MW in the ‘CDM pipeline’
Additional unding generated through CERs could urther
stimulated the development o wind power in China, andthe international carbon market will continue to provideadditional incentives or the Chinese wind market, both interms o nancing and technology
WINd CdM projECTS (AS oF 1 MArCH 2008)
Cunt pects MW
India 168 3569China 171 8990
Mexico 10 1172
South Korea 9 253
Brazil 7 436
Dominican Republic 3 173
Philippines 2 73
Morocco 2 70
Cyprus 2 44
Egypt 1 120
Panama 1 81
Mongolia 1 50
Jamaïca 1 Costa Rica 1 20
Colombia 1 20
Israel 1 12
Argentina 1 11
Chile 1 19
Ecuador 1 2
Tta 384 15133
With input rom the Chinese Renewable Energy Association(CREIA).
COUNTRY REPORTS – China
Source: http://wwwcdmpipelineorg/cdm-projects-typehtm
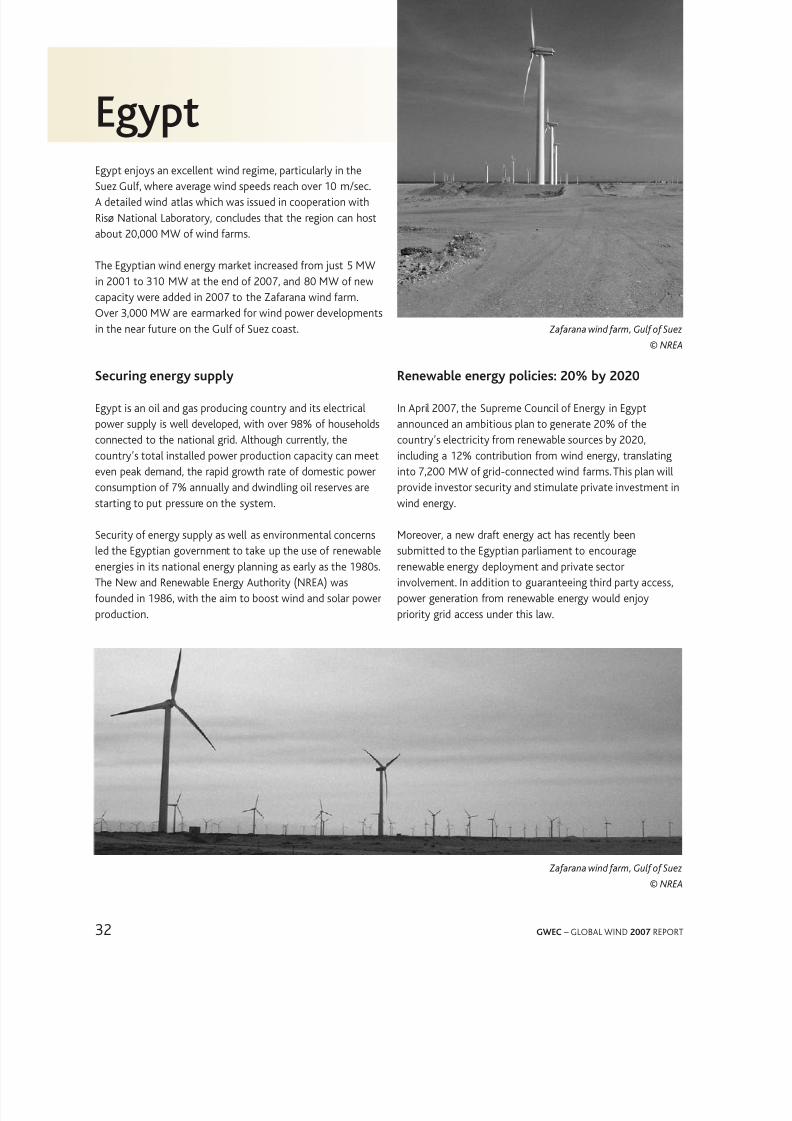
8/3/2019 03GWEC - Global Wind 2007
http://slidepdf.com/reader/full/03gwec-global-wind-2007 34/72
32 GWEC – GLOBAL WIND 2007 REPORT
Egypt
Zaarana wind arm, Gul o Suez
© NREA
Egypt enjoys an excellent wind regime, particularly in theSuez Gul, where average wind speeds reach over 10 m/secA detailed wind atlas which was issued in cooperation withRisø National Laboratory, concludes that the region can hostabout 20,000 MW o wind arms
The Egyptian wind energy market increased rom just 5 MWin 2001 to 310 MW at the end o 2007, and 80 MW o newcapacity were added in 2007 to the Zaarana wind armOver 3,000 MW are earmarked or wind power developmentsin the near uture on the Gul o Suez coast
Secuing eneg su
Egypt is an oil and gas producing country and its electricalpower supply is well developed, with over 98% o householdsconnected to the national grid Although currently, thecountry’s total installed power production capacity can meeteven peak demand, the rapid growth rate o domestic powerconsumption o 7% annually and dwindling oil reserves arestarting to put pressure on the system
Security o energy supply as well as environmental concernsled the Egyptian government to take up the use o renewableenergies in its national energy planning as early as the 1980sThe New and Renewable Energy Authority (NREA) wasounded in 1986, with the aim to boost wind and solar powerproduction
renewae eneg icies: 20% 2020
In April 2007, the Supreme Council o Energy in Egyptannounced an ambitious plan to generate 20% o thecountry’s electricity rom renewable sources by 2020,including a 12% contribution rom wind energy, translatinginto 7,200 MW o grid-connected wind arms This plan willprovide investor security and stimulate private investment inwind energy
Moreover, a new drat energy act has recently beensubmitted to the Egyptian parliament to encouragerenewable energy deployment and private sectorinvolvement In addition to guaranteeing third party access,power generation rom renewable energy would enjoypriority grid access under this law
Zaarana wind arm, Gul o Suez© NREA

8/3/2019 03GWEC - Global Wind 2007
http://slidepdf.com/reader/full/03gwec-global-wind-2007 35/72
33GWEC – GLOBAL WIND 2007 REPORT
2000 2001 2002 2003 2004 2005 2006 2007
5 5 68 98 145 145 230 310
ToTal InsTalleD caPacITY
COUNTRY REPORTS – Egypt
The proposed polices to oster increasing wind powercontribution to the Egyptian electricity mix consist o twophases:
During Phase 1, tenders will be issued requesting the privatesector to supply power rom wind energy The guaranteeo a long term power purchase agreement will reduce theinvestors’ nancial risk The documents relating to the tenderor the Competitive Bids are presently under preparation incooperation with the World Bank
Phase 2 will see the implementation o a eed-in-tari takinginto consideration the prices achieved in phase 1
NREA has taken the decision to urther support the windenergy business by providing resource assessment, necessarydata or easibility studies and technical support or potentialproject developers Besides the already earmarked areas, workis underway to earmark other promising areas; these areaswill be also available or uture wind projects carried out bythe private sector
Win eneg ects in Egt
Hurghaa 5.2 MW win arm
The rst commercial wind arm o 42 turbines o dierenttechnologies (2 blades, 3 blades, tubular & rigid towers)has been operational since 1993 as part o the nationalgrid About 40% o the wind arm components werelocally manuactured, including towers, blades, cables andtransormers
Zaarana 305 MW win armWith the Zaarana project, Egypt has moved on rom limitedexperimental projects to the phase o large scale gridconnected wind arms An area o 80 km2 on the Gul o Suezbesides another area o 64 km2 to the west o the rst site atZaarana were earmarked or NREA’s wind projects, showinginstitutional support and governmental commitment tothe wind energy programme Overall, 305 MW have beeninstalled in stages: 63 MW in 2001 and 77 MW in 2003/2004in cooperation with Denmark and Germany; 85 MW in July2006 in cooperation with Spain; 80 MW in cooperation with
Germany was operational in December 2007 Presently,
a urther 240 MW extension o the wind arm is underimplementation
The electricity production rom the Zaarana arm is about636 GWh at an average capacity actor o 406%, savingabout 146,000 toe and abating emissions o about350,000 tons o CO
2in 2007
Gul El-Zayt
Recently, an area o 656 km2 has been earmarked to hosta 3,000 MW wind arm at Gul o El-Zayt on the Gulo Suez coast Studies are being conducted to assess thesite potential to host large scale grid connected windarms: 200 MW in cooperation with Germany, 220 MW in
cooperation with Japan and 400 MW as a private sectorproject
With input rom the New & Renewable Energy Authority
(NREA), Egypt
year
MW
Zaarana wind arm, Gul o Suez
© NREA

8/3/2019 03GWEC - Global Wind 2007
http://slidepdf.com/reader/full/03gwec-global-wind-2007 36/72
34 GWEC – GLOBAL WIND 2007 REPORT
Eurpean Unin
San’Agata wind arm(FG), Apulia, Italy
© Vestas
The w’s eaing maket
The EU has historically been and continues to be the world’sstrongest market or wind energy development, with over85 GW o new installed capacity in 2007 Industry statisticscompiled by the European Wind Energy Association (EWEA)show that cumulative wind capacity increased by 18% toreach a level o 56,535 MW, up rom 48,069 MW at the endo 2006
In the EU, wind power continues to be one o the most
popular electricity generating technologies Since 2000,the installed wind capacity has increased almost six-oldrom 97 GW to 565 GW The total new power generatingcapacity installed in the EU in this period was158,000 MW,out o which 88,000 MW was new gas and 47,000 MW wasnew wind installations Wind thus represents 30% o thenew generation installations over this eight-year periodAccording to gures rom Platts PowerVision and EWEA, in2007, wind power installations made up 40% o total newpower installations, representing the astest growing power-generating technology in Europe
Over the last ten years, cumulative wind power capacity inthe EU increased by an average o 28 % per year In terms oannual installations, the European market grew by an average21 % per year over the same period
In 2007, the total capacity o new wind turbines brought online across the European Union was 8,554 MW, an increaseo 935 MW on the 2006 total Total wind power capacityinstalled by the end o 2007 will avoid about 90 milliontonnes o CO
2annually and produce 119 Terawatt hours in
an average wind year, equal to 37% o EU power demandIn 2000, less than 09% o EU electricity demand was metby wind power 8,554 MW o new wind power capacity alsorepresents a wind turbine manuacturing turnover o some€ 11 billion
The 2007 capacity increase was driven by Spain whichrepresented more than 40% o the total new installationsIndeed, Spain set a new record in 2007, installing 3,522 MW –the highest amount or any European country in any year ever10% o Spain’s electricity now comes rom wind There was
also sustained growth in France, which added 888 MW to reach2,454 MW, and Italy, with an addition o 603 MW or a total
o 2,726 MW The EU’s new Member States perormed welland increased installed capacity by 60%, with Poland leadingthe way and reaching a total o 276 MW The Czech Republic
installed 63 MW, its best year ever, and Bulgaria 34 MW
Nevertheless, a handul o markets did not grow as expected,including Germany, Portugal and the UK As a result, theoverall market growth in 2007 o 12% in the EU was not asstriking as it could have been Looking beyond Europe, theglobal market or wind turbines grew by 31% last year tomore than 20,000 MW
The change o pace in some countries can be explained by amixture o slow administrative processes, problems with grid
access and legislative uncertainty The gures demonstrate theexistence o continuing barriers to wind energy development
Oshore wind, seen as a key market or European expansion,continues to progress slowly, both in Europe and outside Europe
The cuent EU egisatie amewk wineneg
Up to now, an important actor behind the growth o the
European wind market has been strong policy support bothat EU and at national level The EU’s Renewables Directive

8/3/2019 03GWEC - Global Wind 2007
http://slidepdf.com/reader/full/03gwec-global-wind-2007 37/72
35GWEC – GLOBAL WIND 2007 REPORT
2000** 2001** 2002* 2003* 2004* 2005* 2006* 2007
12,887 17,315 23,159 28,598 34,371 40,511 48,029 56,535
ToTal InsTalleD caPacITY
COUNTRY REPORTS – European Union
(77/2001/EC) has been in place since 2001 The EU aimedto increase the share o electricity produced rom renewableenergy sources (RES) in the EU to 21% by 2010 (up rom152% in 2001), thus helping the Union reach the REStarget o overall energy consumption o 12% by 2010 TheDirective, which set out dierentiated national indicativetargets, has been an historical step in the delivery orenewable electricity and constitutes the main driving orcebehind recent policies being implemented
In the pursuit o the overall target o 21% rom renewable
electricity by 2010, the Renewables Directive gives EUMember States reedom o choice regarding supportmechanisms Thus, various schemes are operating in Europe,mainly eed-in taris, xed premiums, green certicatesystems and tendering procedures These schemes aregenerally complemented by tax incentives, environmentaltaxes, contribution programmes or voluntary agreements
European Commission progress reports in 2005 and 2008 havehighlighted that despite the requirements o the RenewablesDirective, despite the eorts o Member States and despite some
improvements o the regulatory rameworks, major barriers tothe growth and integration o renewable electricity remain Themain causes o the slow development in some Member Statesare not policy-related, but delays in authorization, unair gridaccess conditions and slow reinorcement o the electric powergrid The reports invite the Member States to give a high priorityto removing administrative barriers and improving grid access orrenewable energy producers
Finally, the EC reports conclude that the harmonisation osupport schemes remain a long term goal on economic
eciency, single market and state aid grounds, but thatharmonisation in the short term is not appropriate Byadopting best practices or combining national supportschemes, Member States can continue to reorm, optimise andcoordinate their eorts to support renewable electricity EWEAis o the opinion that real competition in the conventionalpower market must precede a harmonized market orrenewable electricity The association also ears that a hastymove towards a harmonised EU-wide payment mechanism orrenewable electricity would have a proound negative eecton the markets or wind power and put European leadership in
wind power technology and other renewables at risk
The utue EU egisatie amewk wineneg
In March 2006, the European Commission launched aconsultation process to discuss the medium and longterm strategy or an EU energy policy, including renewableenergies The Green Paper “A European Strategy orSustainable, Competitive and Secure Energy” proposedthe preparation o a “renewable energy roadmap” thatwould include an active programme with specic measuresto ensure that existing targets are met; consideration o
which targets or objectives beyond 2010 are necessary; andresearch, demonstration and market replication initiatives
In January 2007, the European Commission released its“Strategic Energy Review” - also called “Energy Package” -, acomprehensive set o 19 documents, which intend to shapethe EU energy landscape in the medium and long termThe package proposes an overall binding target o 20% oEU energy consumption coming rom RES by 2020 withoutspeciying how that overall target should be split among thedierent sectors (electricity, heating & cooling and transport)
In March 2007, the EU Heads o State responded by adoptinga binding 20% target or renewables by 2020 and askedthe European Commission to put orward a legislativepackage On 23 January 2008, the Commission published itsRenewable Energy and Climate Change Package which calls20% o nal energy consumption to come rom RES by 2020The 20% target at the EU level has now been translated intoconcrete gures or the 27 EU Member States The “nationalaction plans” will indicate how the agreed target or eachMember State is going to be achieved and the measures that
will be put into place or that The proposal also containsmeasures which positively address obstacles that windenergy is currently acing, such as heavy administrativeprocedures and grid access issues
The swit approval o the Commission’s proposed directiveby the 27 Member States and the European Parliament isessential or the sustained expansion o wind energy in allcountries o the European Union
With input rom the European Wind Energy Association (EWEA)
** EU 15* EU 25
year
MW

8/3/2019 03GWEC - Global Wind 2007
http://slidepdf.com/reader/full/03gwec-global-wind-2007 38/72
36 GWEC – GLOBAL WIND 2007 REPORT
France
Porz-Piron wind arm, Finistère© Daniel Heureus
The thi agest Euean maket
France enjoys an abundant wind potential, and ater a slowstart, the wind energy market has been progressing steadilyin recent years While in 2000, there were only 30 MWo wind generating capacity in France, the total installedcapacity at the end o 2007 was 2,454 MW, representingan annual growth rate o 57% in terms o total capacityA urther 3,500 MW have been approved
The annual market also grew to 888 MW in 2007, making it
the third largest market in Europe ater Spain and Germany
The average size o an installed wind turbine has increased,rom an average o 12 MW per turbine in 2005 to 17 MW in2007 This is expected to reach 2 MW by 2008
The average size and output o wind arms has beencontinuously increasing, rom 47 MW to 13 MW between2002 and 2007 Average wind arm size could reach 17 MWby 2010
In 2007, the production o wind energy was 4 TWh, with anaverage capacity actor o 24% Wind energy in France nowprovides around 5,000 jobs to the French economy
Wind power has been growing ast in all French regions,except the south west, where the wind regime is lessavourable Since 2006, there has been a shit in wind armdevelopment rom the windiest areas o Bretagne, Midi-Pyrenees and coastal areas to inland regions such as theregions o Centre, Picardy, Lorraine and Champagne-ArdenneThe biggest potential in the coming years is in the north and
the north east areas
The largest wind park in France is in the north o the country(Fruges) with 70 wind turbines producing 140 MW Built in2007, Cormainville wind park in the Eure-et-Loire produces60 MW and La-voie-sacré wind park in Lorraine produces 54MW France has a urther 10 wind arms which exceed 30MW A urther wind parks bigger than 30 MW are scheduledto be built in 2008
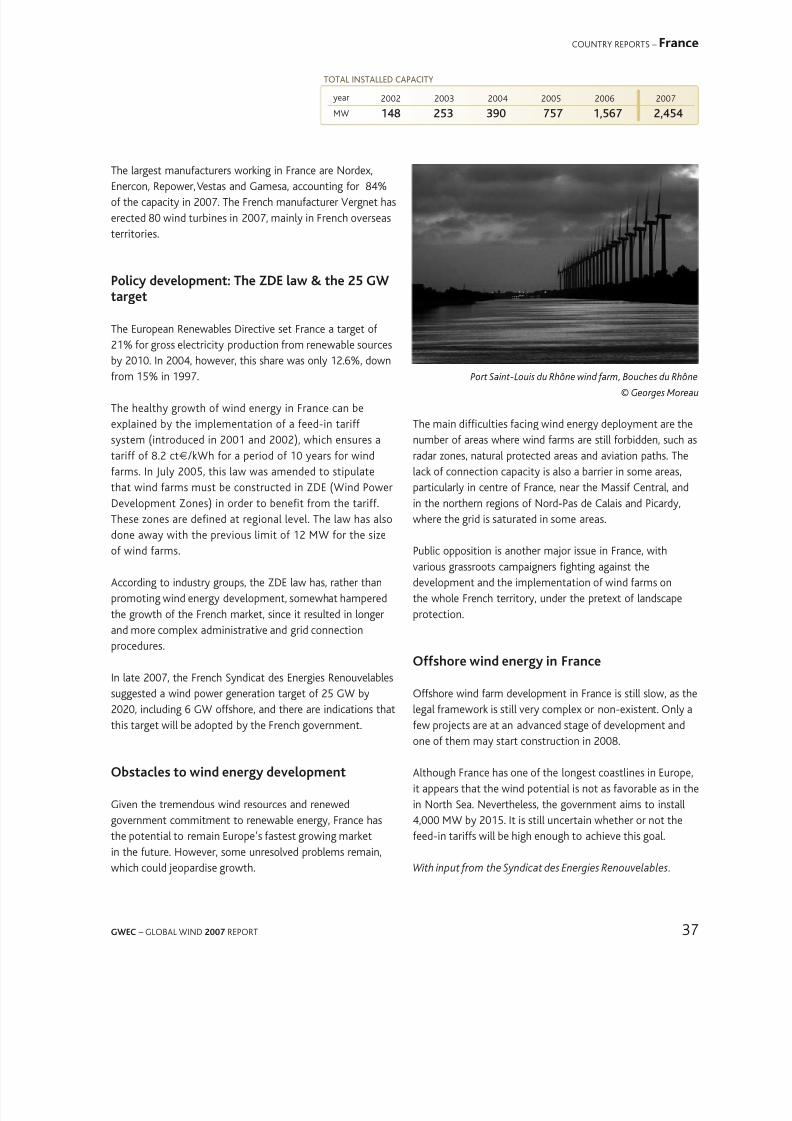
8/3/2019 03GWEC - Global Wind 2007
http://slidepdf.com/reader/full/03gwec-global-wind-2007 39/72
37GWEC – GLOBAL WIND 2007 REPORT
Port Saint-Louis du Rhône wind arm, Bouches du Rhône
© Georges Moreau
2002 2003 2004 2005 2006 2007
148 253 390 757 1,567 2,454
ToTal InsTalleD caPacITY
COUNTRY REPORTS – France
The largest manuacturers working in France are Nordex,Enercon, Repower, Vestas and Gamesa, accounting or 84%o the capacity in 2007 The French manuacturer Vergnet haserected 80 wind turbines in 2007, mainly in French overseasterritories
pic eement: The zdE aw & the 25 GWtaget
The European Renewables Directive set France a target o
21% or gross electricity production rom renewable sourcesby 2010 In 2004, however, this share was only 126%, downrom 15% in 1997
The healthy growth o wind energy in France can beexplained by the implementation o a eed-in tarisystem (introduced in 2001 and 2002), which ensures atari o 82 ct€/kWh or a period o 10 years or windarms In July 2005, this law was amended to stipulatethat wind arms must be constructed in ZDE (Wind PowerDevelopment Zones) in order to benet rom the tari
These zones are dened at regional level The law has alsodone away with the previous limit o 12 MW or the sizeo wind arms
According to industry groups, the ZDE law has, rather thanpromoting wind energy development, somewhat hamperedthe growth o the French market, since it resulted in longerand more complex administrative and grid connectionprocedures
In late 2007, the French Syndicat des Energies Renouvelables
suggested a wind power generation target o 25 GW by2020, including 6 GW oshore, and there are indications thatthis target will be adopted by the French government
ostaces t win eneg eement
Given the tremendous wind resources and renewedgovernment commitment to renewable energy, France hasthe potential to remain Europe’s astest growing marketin the uture However, some unresolved problems remain,
which could jeopardise growth
The main diculties acing wind energy deployment are thenumber o areas where wind arms are still orbidden, such asradar zones, natural protected areas and aviation paths Thelack o connection capacity is also a barrier in some areas,particularly in centre o France, near the Massi Central, andin the northern regions o Nord-Pas de Calais and Picardy,
where the grid is saturated in some areas
Public opposition is another major issue in France, withvarious grassroots campaigners ghting against thedevelopment and the implementation o wind arms onthe whole French territory, under the pretext o landscapeprotection
oshe win eneg in Fance
Oshore wind arm development in France is still slow, as thelegal ramework is still very complex or non-existent Only aew projects are at an advanced stage o development andone o them may start construction in 2008
Although France has one o the longest coastlines in Europe,it appears that the wind potential is not as avorable as in thein North Sea Nevertheless, the government aims to install4,000 MW by 2015 It is still uncertain whether or not theeed-in taris will be high enough to achieve this goal
With input rom the Syndicat des Energies Renouvelables.
year
MW

8/3/2019 03GWEC - Global Wind 2007
http://slidepdf.com/reader/full/03gwec-global-wind-2007 40/72
38 GWEC – GLOBAL WIND 2007 REPORT
Germany
Cuent maket situatin
A total o 883 turbines with a total capacity o 1,667 MWwere installed in Germany in 2007
This brings the total overall installed capacity in Germany to22,247 MW, made up o 19,460 turbines Wind power is theleading renewable energy in Germany, providing around 7%o the country’s total electricity consumption
The installed capacity in 2007 was 25% less than the
2,233 MW installed in 2006, showing a slowdown in theGerman market Nonetheless, German turbine manuacturersare among the market leaders, representing a global marketshare o 22% Furthermore, German turbine and componentmanuacturers generated six billion euros in exports in 2007The sector currently employs more than 100,000 people, uprom 82,100 in 2006
The leading state in Germany in terms o installed capacityis Lower Saxony with over 5,600 MW o wind power In threestates, electricity produced by wind energy now accounts
or over 33% or more o the total power demand: Saxony-Anhalt, Schleswig-Holstein and Mecklenburg–WesternPomerania, while in Berlin-Brandenburg, it is 286%
According to the EU Renewables Directive, 125% oGermany’s electricity consumption is to be met by renewableenergy by 2010, but this target was already exceeded in2007, with a share o 14% In its recent energy and climatepackage, the German government increased its target or2020 to 25-30%, up rom the previous target o 20%
legisatie amewk: Fee-in tai
An early eed-in law or wind-generated electricity hasexisted in Germany since 1991 The Renewable EnergySources Act (Erneuerbare-Energien-Gesetz / EEG) came intoorce in 2000, and it still provides the main stimulus or theGerman wind market It was revised in 2004 and the nextamendment is scheduled or 2008, in order to adapt taris tonew market conditions and technological developments
Under the EEG, electricity produced rom renewable energysources is given priority or grid connection, grid access in
both distribution and transmission grids, and power dispatchThe EEG stipulates a xed eed-in tari or each kWh opower produced and ed into the grid This ‘initial tari’ isxed or at least ve years, and may then be reduced tothe 'basic tari', depending on how local wind conditions
compare to a “reerence yield” Wind installations on verygood sites (reerence yield o 150%) only receive the initialtari or 5 years, while or wind arms on lesser sites, thisperiod can be extended No compensation is granted orturbines with a reerence energy yield o less than 60% Theaim o this rule is to provide a disincentive or installing windturbines on sites with poor wind conditions
The average eed-in tari over 20 years or turbinesinstalled in 2007 ranged rom 819 euro cent/kWh ('initialtari') to 517 euro cent/kWh (‘basic tari’) The initial
tari is reduced by 2% every year, so it will be 803 to507 euro cent/kWh or turbines installed in 2008
Special taris exist or onshore repowering, ie thesubstitution o older, smaller installations by state-o-the-art,high-output turbines, as well as or oshore installations
Another important regulation is the German Federal BuildingCode, under which wind energy plants are regarded asso-called ‘privileged projects’ Local authorities are askedto designate specic priority or preerential zones or wind
energy utilisation However, this means that they can alsorestrict construction to specic areas (exclusion zones)
Fuhrlaender wind park
© Fuhrlaender AG
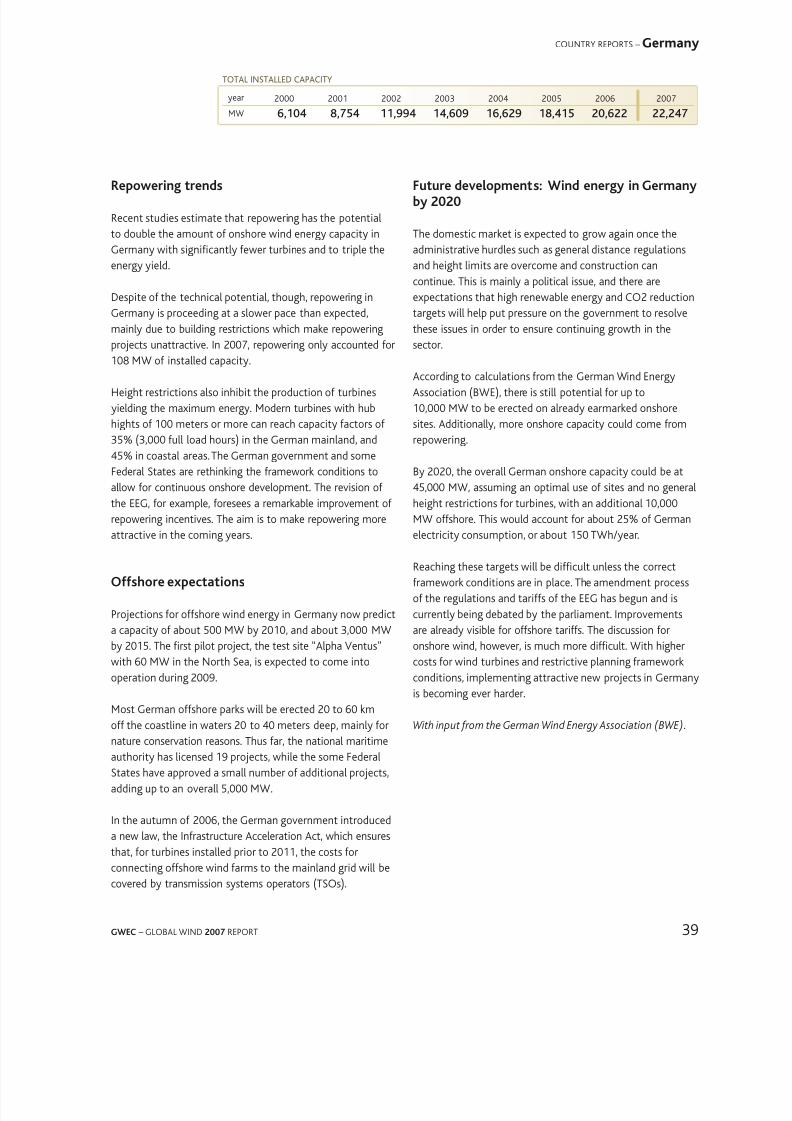
8/3/2019 03GWEC - Global Wind 2007
http://slidepdf.com/reader/full/03gwec-global-wind-2007 41/72
39GWEC – GLOBAL WIND 2007 REPORT
2000 2001 2002 2003 2004 2005 2006 2007
6,104 8,754 11,994 14,609 16,629 18,415 20,622 22,247
ToTal InsTalleD caPacITY
COUNTRY REPORTS – Germany
reweing tens
Recent studies estimate that repowering has the potentialto double the amount o onshore wind energy capacity inGermany with signicantly ewer turbines and to triple theenergy yield
Despite o the technical potential, though, repowering inGermany is proceeding at a slower pace than expected,mainly due to building restrictions which make repowering
projects unattractive In 2007, repowering only accounted or108 MW o installed capacity
Height restrictions also inhibit the production o turbines yielding the maximum energy Modern turbines with hubhights o 100 meters or more can reach capacity actors o35% (3,000 ull load hours) in the German mainland, and45% in coastal areas The German government and someFederal States are rethinking the ramework conditions toallow or continuous onshore development The revision othe EEG, or example, oresees a remarkable improvement o
repowering incentives The aim is to make repowering moreattractive in the coming years
oshe exectatins
Projections or oshore wind energy in Germany now predicta capacity o about 500 MW by 2010, and about 3,000 MWby 2015 The rst pilot project, the test site “Alpha Ventus”with 60 MW in the North Sea, is expected to come intooperation during 2009
Most German oshore parks will be erected 20 to 60 kmo the coastline in waters 20 to 40 meters deep, mainly ornature conservation reasons Thus ar, the national maritimeauthority has licensed 19 projects, while the some FederalStates have approved a small number o additional projects,adding up to an overall 5,000 MW
In the autumn o 2006, the German government introduceda new law, the Inrastructure Acceleration Act, which ensuresthat, or turbines installed prior to 2011, the costs or
connecting oshore wind arms to the mainland grid will becovered by transmission systems operators (TSOs)
Futue eements: Win eneg in Geman 2020
The domestic market is expected to grow again once theadministrative hurdles such as general distance regulationsand height limits are overcome and construction cancontinue This is mainly a political issue, and there areexpectations that high renewable energy and CO2 reductiontargets will help put pressure on the government to resolvethese issues in order to ensure continuing growth in the
sector
According to calculations rom the German Wind EnergyAssociation (BWE), there is still potential or up to10,000 MW to be erected on already earmarked onshoresites Additionally, more onshore capacity could come romrepowering
By 2020, the overall German onshore capacity could be at45,000 MW, assuming an optimal use o sites and no generalheight restrictions or turbines, with an additional 10,000
MW oshore This would account or about 25% o Germanelectricity consumption, or about 150 TWh/year
Reaching these targets will be dicult unless the correctramework conditions are in place The amendment processo the regulations and taris o the EEG has begun and iscurrently being debated by the parliament Improvementsare already visible or oshore taris The discussion oronshore wind, however, is much more dicult With highercosts or wind turbines and restrictive planning rameworkconditions, implementing attractive new projects in Germany
is becoming ever harder
With input rom the German Wind Energy Association (BWE).
year
MW

8/3/2019 03GWEC - Global Wind 2007
http://slidepdf.com/reader/full/03gwec-global-wind-2007 42/72
40 GWEC – GLOBAL WIND 2007 REPORT
Wind energy is continuing to grow strongly in India, withover 1,700 MW o new installed capacity in 2007, hitting8,000 MW in total This represents a year on year growth o28%
The development o Indian wind power has so ar beenconcentrated in a ew regions, especially the southern stateo Tamil Nadu, which accounts or more than hal o allinstallations This is beginning to change, with other states,including Maharashtra, Gujarat, Rajasthan and Karnataka,West Bengal, Madhya Pradesh and Andhra Pradesh starting
to catch up As a result wind arms can be seen underconstruction right across the country, rom the coastal plainsto the hilly hinterland and sandy deserts
The Indian government envisages an annual capacity additiono up to 2,000 MW in the coming years
pic eements at eea an state ee
While there is no country-wide support or renewable
energies, either in the orm o a eed-in tari or a set quota,MNRE has issued guidelines to all state governments tocreate an attractive environment or the export, purchase,
wheeling and banking o electricitygenerated by wind power projects Aterthe Electricity Act 2003, State ElectricityRegulatory Commissions (SERC) were set upin most o the states in the country SERCshave the mandate o promoting renewablesincluding wind energy through preerentialtaris and a minimum obligation on
distribution companies to source a certainshare o electricity rom renewable energy,and 10 out o India’s 29 states have set uprenewable purchase obligations, requiringutilities to source up to 10% o their powerrom renewable sources
There are, however, a number o scalincentives or the wind energy sectorestablished at national level, including:
Inia
Geat win tentia
The original impetus to develop wind energy in India camein the early 1980s with the establishment o the Ministry oNon-conventional Energy Sources (MNES), now renamed theMinistry o New and Renewable Energy (MNRE) Its purposeis to encourage a diversication o uel sources away romthe growing demand or coal, oil and gas required to eedthe country’s rapid economic growth MNRE undertookan extensive study o the wind regime, establishing acountrywide network o wind speed measurement stations
These have made it possible to assess the national windpotential and identiy suitable areas or harnessing windpower or commercial use
The total potential or wind power in India was rstestimated by the Centre or Wind Energy Technology (CWET)at around 45,000 MW This gure was also adopted by theMNRE as the ocial estimate o the wind power potential inthe country However, since 1990, a massive exercise o windmonitoring and wind resource assessment has been carriedout by government agencies and private sector has identied
many more resource areas Currently, the Indian Wind TurbineManuacturers Association (IWTMA) estimates the potentialto be o the order o 65,000 MW
Wind arm located near the Coimbatore Area o Tamil Nadu
© IWTMA
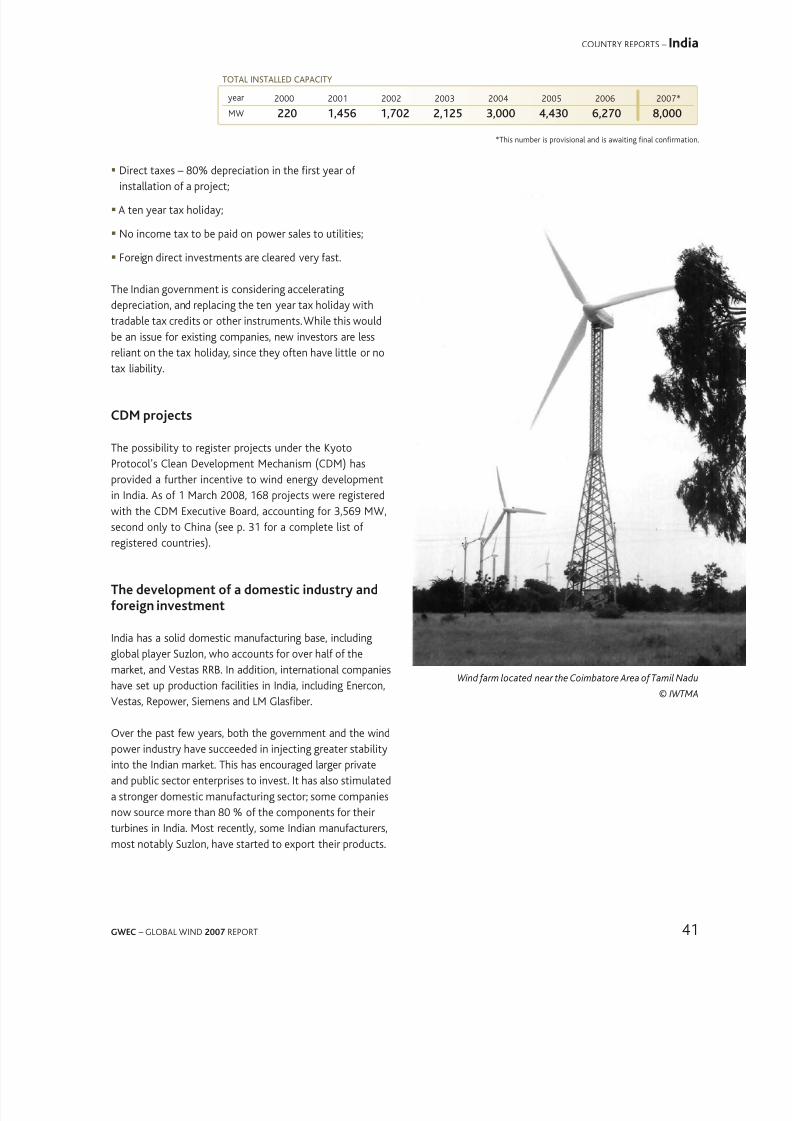
8/3/2019 03GWEC - Global Wind 2007
http://slidepdf.com/reader/full/03gwec-global-wind-2007 43/72
41GWEC – GLOBAL WIND 2007 REPORT
2000 2001 2002 2003 2004 2005 2006 2007*
220 1,456 1,702 2,125 3,000 4,430 6,270 8,000
ToTal InsTalleD caPacITY
COUNTRY REPORTS – India
Direct taxes – 80% depreciation in the rst year oinstallation o a project;
A ten year tax holiday;
No income tax to be paid on power sales to utilities;
Foreign direct investments are cleared very ast
The Indian government is considering acceleratingdepreciation, and replacing the ten year tax holiday withtradable tax credits or other instruments While this wouldbe an issue or existing companies, new investors are less
reliant on the tax holiday, since they oten have little or notax liability
CdM ects
The possibility to register projects under the KyotoProtocol’s Clean Development Mechanism (CDM) hasprovided a urther incentive to wind energy developmentin India As o 1 March 2008, 168 projects were registeredwith the CDM Executive Board, accounting or 3,569 MW,
second only to China (see p 31 or a complete list oregistered countries)
The eement a mestic inust aneign inestment
India has a solid domestic manuacturing base, includingglobal player Suzlon, who accounts or over hal o themarket, and Vestas RRB In addition, international companieshave set up production acilities in India, including Enercon,
Vestas, Repower, Siemens and LM Glasber
Over the past ew years, both the government and the windpower industry have succeeded in injecting greater stabilityinto the Indian market This has encouraged larger privateand public sector enterprises to invest It has also stimulateda stronger domestic manuacturing sector; some companiesnow source more than 80 % o the components or theirturbines in India Most recently, some Indian manuacturers,most notably Suzlon, have started to export their products
year
MW
Wind arm located near the Coimbatore Area o Tamil Nadu
© IWTMA
*This number is provisional and is awaiting nal conrmation

8/3/2019 03GWEC - Global Wind 2007
http://slidepdf.com/reader/full/03gwec-global-wind-2007 44/72
42 GWEC – GLOBAL WIND 2007 REPORT
Iran
19 MW o wind power was installed in Iran in 2007 This is anincrease o 40% compared to 2006, or a cumulative total o
67 MW installed as o December 2007
Win ptentia
Iran has a large wind energy potential due to its geographiclocation, especially oshore in the Persian Gul Thus ar,however, no projects or research programs have beeninitiated to develop Iranian oshore technology
Research by the Iran Renewable Energy Organization (SUNA),
which was established by the Ministry o Energy, shows thatthe country has a signicant potential or wind, biomass,solar and geothermal power This is backed up by studies bythe International Energy Agency and the German WuppertalInstitute, who estimate the potential or wind energy to beat least 6,500 MW, while some sources quote as much as30,000 MW
pic
Despite Iran’s tremendous potential, avorable policyrameworks are not yet in place, partly due to Iran’s large
ossil uel resources o natural gas and crudeoil The situation is changing however, andin 2007, various policy initiatives wereestablished to improve conditions orrenewables
The Iranian government is considering waysin which renewable energies could contributeto the country’s energy mix, and thegovernment's Fourth Five-Year DevelopmentPlan or 2005-2010 set a target o 500
MW o installed wind power generationcapacity by 2010 Progress in research anddevelopment activities or identication osuitable areas to exploit these resources hasbeen set as one o the government’s targets
These measures also include theestablishment o SUNA in 1999 Sincethen, SUNA has commissioned resource
assessments and set up pilot wind arms to test the technicaleasibility o wind energy in Iran Given the viability o
wind energy, the government o Iran plans to invest moreresources in developing it urther
pic Sut Mechanisms
With government support, SUNA not only hopes to increaseincentives or wind energy development but also aims toinvest in research and development to make wind powercommercially viable in Iran
An article on nancing regulations has been introduced intothe government’s National Development program, wherebythe government will purchase a certain amount o electricityproduced by renewables rom state owned or private sourceat guaranteed prices
The government’s main ocus has been on assigningpurchase guarantees or renewable electricity Prices havebeen set at 650 Rials (47 Euro cents) or each kilowatt-houro generated electricity at the peak hours and 450 Rials(33 Euro cents) at the low consuming hours o the day
(maximum our hours in one day)
Binalood wind arm Khorasan Razavi
© Saba Niroo Co. Wind Turbines & Power Plants

8/3/2019 03GWEC - Global Wind 2007
http://slidepdf.com/reader/full/03gwec-global-wind-2007 45/72
43GWEC – GLOBAL WIND 2007 REPORT
2002 2003 2004 2005 2006 2007
12 15 21 22 48 67
ToTal InsTalleD caPacITY
COUNTRY REPORTS – Iran
The low price assigned to wind energy deters privateinvestment Thereore, the Ministry o Energy is reported tointend to increase price o wind energy to equal the pricepaid or ossil uel, which is 73 Euro cents/kWh
reseach an deement pgammes
Several research and development projects in the design andmanuacturing o large capacity wind turbines have beenunded by the Ministry o Energy, Iran’s Power Generation
and Transmission Management Organization (TAVANIR), andthe Deputy o Strategic Planning and Control
Manuactuing base
Iran hopes to establish a sturdy design and manuacturingbase in order to export wind turbines to overseas markets
Saba Niroo is the rst and only wind turbine manuacturer inIran The company, ounded in 2003 by the Energy Industry
& Mines Ministry, aims to design, develop and manuacturewind turbines or international export Saba Niroo’scustomers and upcoming installations include:
SUNA: Contract or manuacture, installation andcommissioning o 143 units o 300, 550 and 660 KWwind turbines or 90 megawatts o wind arms in Manjil,Harzevil and Siahpoosh (Guillan province) These projectswill be completed in March 2009
SUNA: Contract or manuacture, installation andcommissioning o 43 units o 660 KW wind turbines at the
284 MW wind arm in Binalood region-Khorasan Razaviprovince (This contract was transerred rom Tavanir Co toSUNA in 2006) This project will be completed in Jan 2008
SUNIR: Contract or manuacture, installation andcommissioning o 4 units o 660KW wind turbines inArmenia This project has been completed
Moreover, the Iranian government has been reported to planthe development the country’s rst privately nanced windarm with a capacity o 200 MW
Win Fams in Ian
Total installed capacity by the end o 2007: 6736 MW
Manjil, Siahpoosh and Harzevil sites in Manjil region (northo Iran): 4624 MW
Binalood site (north-east o Iran): 2112 MW
outk 2008/2009
11 units 660kW-wind turbines with a total capacity o726 MW in Binalood region will be commissioned by theend o January 2008
Manuacturing o 84 units 660kW-wind turbines with a totalcapacity o 5544 MW will be nished by the rst hal o2009 to be installed in Manjil region
With input rom SUNA and Saba Niroo Co.
Manjil wind arm, Guillan
© Saba N iroo Co. Wind Turbines & Power Plants
year
MW
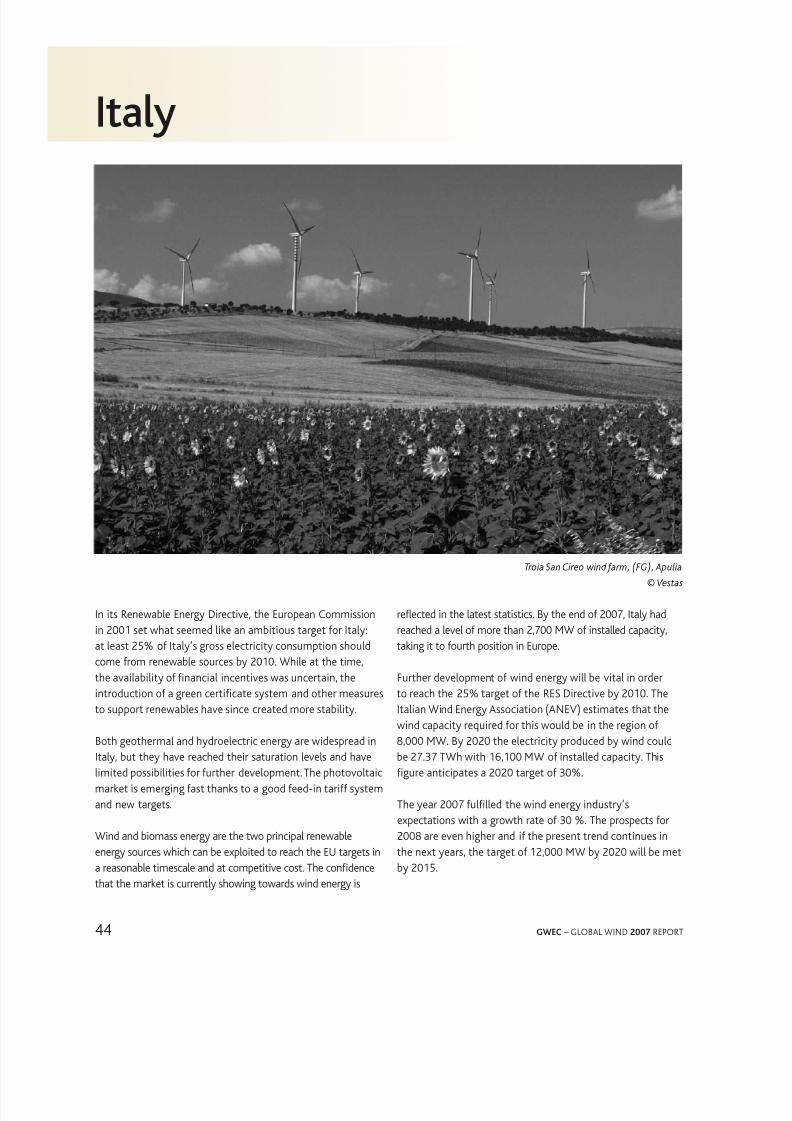
8/3/2019 03GWEC - Global Wind 2007
http://slidepdf.com/reader/full/03gwec-global-wind-2007 46/72
44 GWEC – GLOBAL WIND 2007 REPORT
Italy
Troia San Cireo wind arm, (FG), Apulia
© Vestas
In its Renewable Energy Directive, the European Commissionin 2001 set what seemed like an ambitious target or Italy:at least 25% o Italy’s gross electricity consumption shouldcome rom renewable sources by 2010 While at the time,the availability o nancial incentives was uncertain, the
introduction o a green certicate system and other measuresto support renewables have since created more stability
Both geothermal and hydroelectric energy are widespread inItaly, but they have reached their saturation levels and havelimited possibilities or urther development The photovoltaicmarket is emerging ast thanks to a good eed-in tari systemand new targets
Wind and biomass energy are the two principal renewableenergy sources which can be exploited to reach the EU targets in
a reasonable timescale and at competitive cost The condencethat the market is currently showing towards wind energy is
refected in the latest statistics By the end o 2007, Italy hadreached a level o more than 2,700 MW o installed capacity,taking it to ourth position in Europe
Further development o wind energy will be vital in order
to reach the 25% target o the RES Directive by 2010 TheItalian Wind Energy Association (ANEV) estimates that thewind capacity required or this would be in the region o8,000 MW By 2020 the electricity produced by wind couldbe 2737 TWh with 16,100 MW o installed capacity Thisgure anticipates a 2020 target o 30%
The year 2007 ullled the wind energy industry’sexpectations with a growth rate o 30 % The prospects or2008 are even higher and i the present trend continues inthe next years, the target o 12,000 MW by 2020 will be met
by 2015
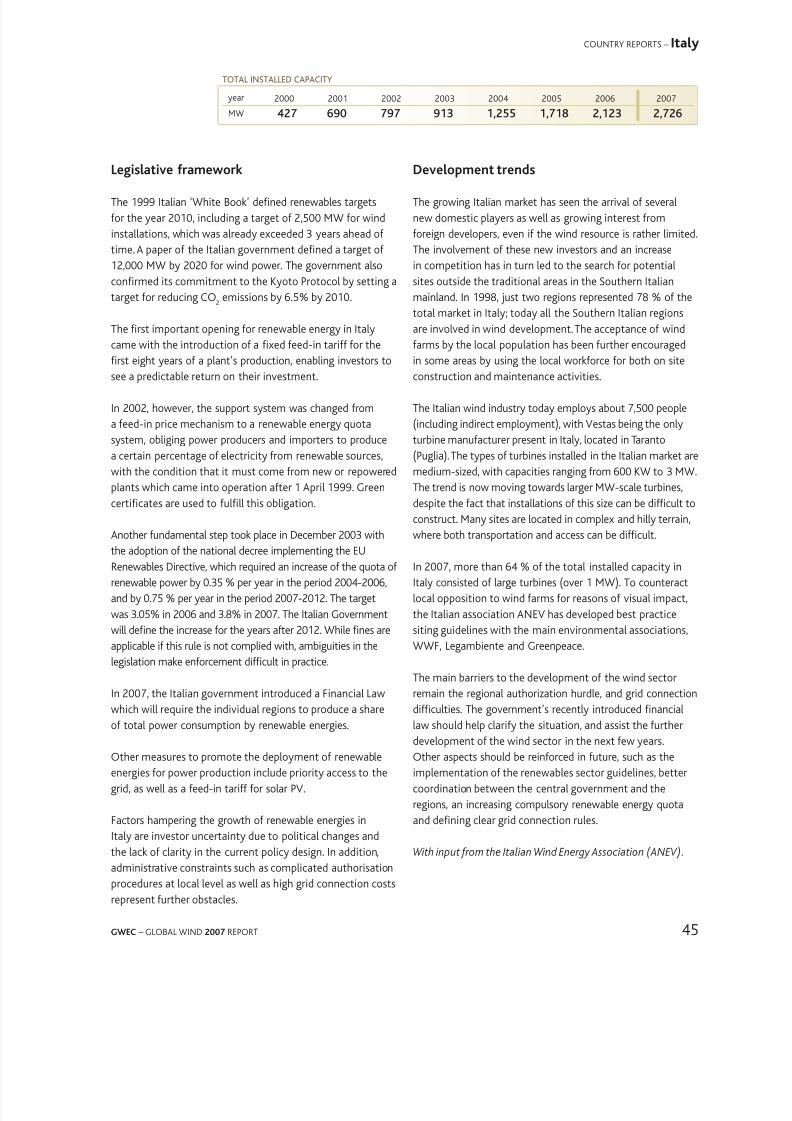
8/3/2019 03GWEC - Global Wind 2007
http://slidepdf.com/reader/full/03gwec-global-wind-2007 47/72
45GWEC – GLOBAL WIND 2007 REPORT
2000 2001 2002 2003 2004 2005 2006 2007
427 690 797 913 1,255 1,718 2,123 2,726
ToTal InsTalleD caPacITY
COUNTRY REPORTS – Italy
legisatie amewk
The 1999 Italian ‘White Book’ dened renewables targetsor the year 2010, including a target o 2,500 MW or windinstallations, which was already exceeded 3 years ahead otime A paper o the Italian government dened a target o12,000 MW by 2020 or wind power The government alsoconrmed its commitment to the Kyoto Protocol by setting atarget or reducing CO
2emissions by 65% by 2010
The rst important opening or renewable energy in Italy
came with the introduction o a xed eed-in tari or therst eight years o a plant’s production, enabling investors tosee a predictable return on their investment
In 2002, however, the support system was changed roma eed-in price mechanism to a renewable energy quotasystem, obliging power producers and importers to producea certain percentage o electricity rom renewable sources,with the condition that it must come rom new or repoweredplants which came into operation ater 1 April 1999 Greencerticates are used to ulll this obligation
Another undamental step took place in December 2003 withthe adoption o the national decree implementing the EURenewables Directive, which required an increase o the quota orenewable power by 035 % per year in the period 2004-2006,and by 075 % per year in the period 2007-2012 The targetwas 305% in 2006 and 38% in 2007 The Italian Governmentwill dene the increase or the years ater 2012 While nes areapplicable i this rule is not complied with, ambiguities in thelegislation make enorcement dicult in practice
In 2007, the Italian government introduced a Financial Lawwhich will require the individual regions to produce a shareo total power consumption by renewable energies
Other measures to promote the deployment o renewableenergies or power production include priority access to thegrid, as well as a eed-in tari or solar PV
Factors hampering the growth o renewable energies inItaly are investor uncertainty due to political changes andthe lack o clarity in the current policy design In addition,
administrative constraints such as complicated authorisationprocedures at local level as well as high grid connection costsrepresent urther obstacles
deement tens
The growing Italian market has seen the arrival o severalnew domestic players as well as growing interest romoreign developers, even i the wind resource is rather limitedThe involvement o these new investors and an increasein competition has in turn led to the search or potentialsites outside the traditional areas in the Southern Italianmainland In 1998, just two regions represented 78 % o thetotal market in Italy; today all the Southern Italian regionsare involved in wind development The acceptance o wind
arms by the local population has been urther encouragedin some areas by using the local workorce or both on siteconstruction and maintenance activities
The Italian wind industry today employs about 7,500 people(including indirect employment), with Vestas being the onlyturbine manuacturer present in Italy, located in Taranto(Puglia) The types o turbines installed in the Italian market aremedium-sized, with capacities ranging rom 600 KW to 3 MWThe trend is now moving towards larger MW-scale turbines,despite the act that installations o this size can be dicult to
construct Many sites are located in complex and hilly terrain,where both transportation and access can be dicult
In 2007, more than 64 % o the total installed capacity inItaly consisted o large turbines (over 1 MW) To counteractlocal opposition to wind arms or reasons o visual impact,the Italian association ANEV has developed best practicesiting guidelines with the main environmental associations,WWF, Legambiente and Greenpeace
The main barriers to the development o the wind sector
remain the regional authorization hurdle, and grid connectiondiculties The government’s recently introduced nanciallaw should help clariy the situation, and assist the urtherdevelopment o the wind sector in the next ew yearsOther aspects should be reinorced in uture, such as theimplementation o the renewables sector guidelines, bettercoordination between the central government and theregions, an increasing compulsory renewable energy quotaand dening clear grid connection rules
With input rom the Italian Wind Energy Association (ANEV).
year
MW

8/3/2019 03GWEC - Global Wind 2007
http://slidepdf.com/reader/full/03gwec-global-wind-2007 48/72
46 GWEC – GLOBAL WIND 2007 REPORT
Japan
Azuchi Oshima wind arm, Nagasaki Preecture
© M&D Greenenergy Co. Ltd
Japan’s wind energy industry has surged orward in recent years, partly spurred by a government requirement orelectricity companies to source an increasing percentage otheir supply rom renewables Development has also been
encouraged by the introduction o market incentives, bothin terms o the price paid or the output rom renewableplants and in the orm o capital grants towards clean energyprojects Power purchase agreements or renewables alsohave a relatively long liespan o 15 to 17 years, which helpsto encourage investor condence The result has been anincrease in Japan’s installed capacity rom 136 MW at theend o 2000 to 1,538 MW at the end o 2007
The ic amewk
In pursuit o its Kyoto Protocol objectives, Japan has a targetto reduce the level o its greenhouse gas emissions by 6%(compared with 1990 levels) in the period 2008-12 To helpachieve this goal, the Japanese government introduced aRenewable Portolio Standard (RPS) law in April 2003 withthe aim o stimulating renewable energy to provide 135 %o total electricity supply in 2010 The ocial governmenttarget or wind power in Japan by 2010 is 3,000 MW
However, the law has a number o weaknesses, including
a very low target, the inclusion o electricity generated bywaste incineration as “renewable” and insucient market
incentives Apart rom the RPS, the Japanese wind industryalso benets rom the government’s initial subsidies such asthe Field Test and New Energy Business Support Programmes
The win maket
Wind power capacity has increased very ast in the pastten years However, the sector has experienced a slowdownrecently, mainly due to Japan’s severe weather conditionsand the reorm o Japan Building Code The country has ahistory o typhoon attacks that blew down turbines, coupledwith lightning incidents, strong gusts and high turbulence Anumber o turbines were severely damaged during 2007
Thereore, a saety standard designed or Japanesemeteorological and geographical conditions is beingdeveloped to provide technical measures against typhoonsand lightning strikes and to help uture wind turbinedevelopments
Improving the integration between the InternationalElectro Technical Commission (IEC) standards and JapaneseIndustrial Standards (JIS) is an important task, because theaorementioned Japanese external conditions dier romthose in IEC Standards The Japan Electrical Manuacturers’
Association (JEMA) supports this task under METI’s initiativein order to develop ‘J (=Japanese)- class wind models’ with

8/3/2019 03GWEC - Global Wind 2007
http://slidepdf.com/reader/full/03gwec-global-wind-2007 49/72
47GWEC – GLOBAL WIND 2007 REPORT
Azuchi Oshima wind arm, Nagasaki Preecture© M&D Greenenergy Co.Ltd
Azuchi Oshima wind arm, Nagasaki Preecture
© M&D Greenenergy Co. Ltd
2000 2001 2002 2003 2004 2005 2006 2007
136 302 338 580 809 1,049 1,394 1,538
ToTal InsTalleD caPacITY
COUNTRY REPORTS – Japan
which any manuacturer can design a turbine at any place in Japan
According to the new Japanese Building Code, a wind turbineo 60m height or more shall be considered as a building,and its height is dened as the top height o a blade romthe ground level Under this revised code, the installationo wind turbines needs the government’s authorisationThe application procedure or planning permission is verycomplicated, time consuming and expensive However, there
are still some open questions regarding the legal applicationo this code or wind arms, and many developers areawaiting a nal decision on this As a result, the net increaseo wind power capacity since April 2007 was very small
Other issues which have created challenges or Japanesewind developers concern grid inrastructure and securityo electricity supply The leading regions or wind powerdevelopment in Japan are Tohoku and Hokkaido in thenorth o the country and Kyushu in the south The greatestelectricity demand is concentrated in the centre o Japan,
while most potential wind power sites are located in remoteareas where grid capacity is relatively small
Limited grid access and the monopolistic hold over the powergrids by regional electricity companies, who use variabilityissues as an excuse or not investing in more capacity, havealso hampered the development o wind generation Both the
Japanese Wind Energy Association (JWEA) and the JapaneseWind Power Association (JWPA) have thereore beensupporting urther R&D activity in the areas o grid stability,technical saety, lightning protection and generation outputprediction
Despite its signicant oshore wind energy potential, Japanhas so ar only developed 11 MW The government has, in thelast couple o years, investigated the easibility o oshoreprojects, and an R&D project is expected to start in 2008 Themain present hurdles to the development o oshore windarms in Japan are social issues, especially public acceptanceand compensation or the shery industry There are alsoplans to start R&D or deep oshore wind technology inorder to capture the huge potential o wind energy in deep
oshore areas around Japan
With input rom the Japanese Wind Power Association.
year
MW
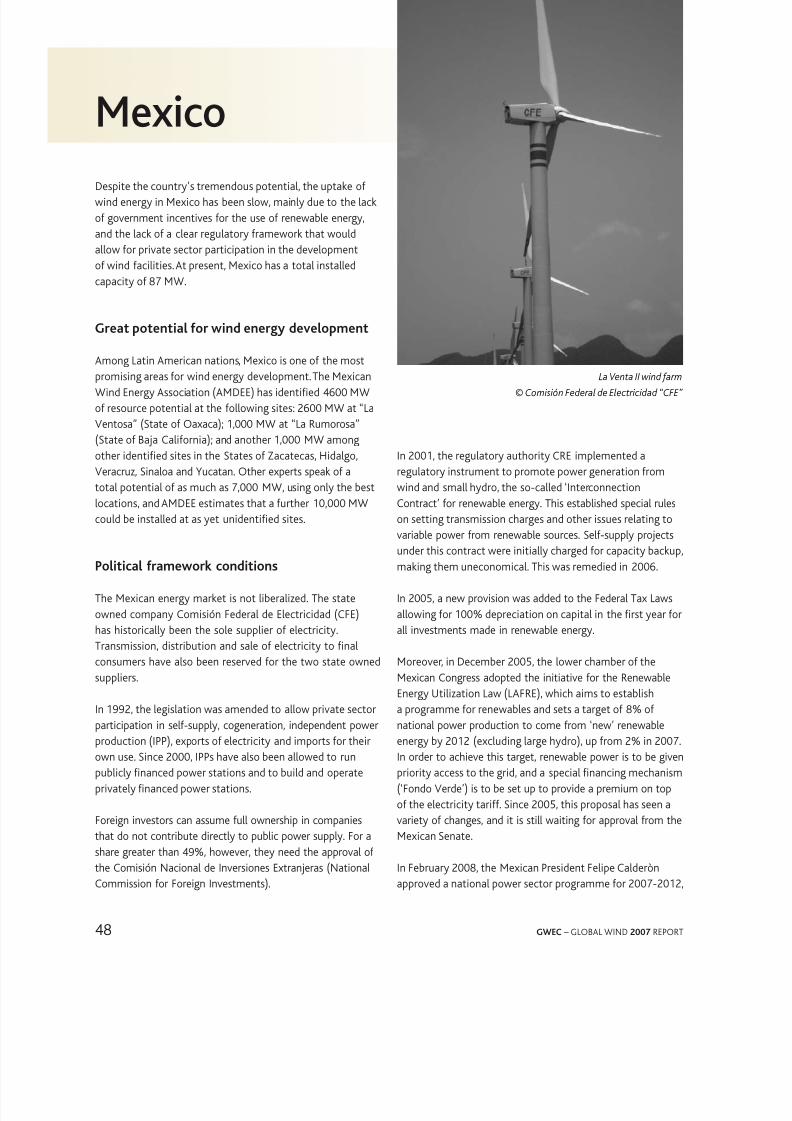
8/3/2019 03GWEC - Global Wind 2007
http://slidepdf.com/reader/full/03gwec-global-wind-2007 50/72
48 GWEC – GLOBAL WIND 2007 REPORT
Mexic
La Venta II wind arm
© Comisión Federal de Electricidad “CFE”
Despite the country’s tremendous potential, the uptake owind energy in Mexico has been slow, mainly due to the lacko government incentives or the use o renewable energy,and the lack o a clear regulatory ramework that wouldallow or private sector participation in the developmento wind acilities At present, Mexico has a total installedcapacity o 87 MW
Geat tentia win eneg eement
Among Latin American nations, Mexico is one o the mostpromising areas or wind energy development The MexicanWind Energy Association (AMDEE) has identied 4600 MWo resource potential at the ollowing sites: 2600 MW at “LaVentosa” (State o Oaxaca); 1,000 MW at “La Rumorosa”(State o Baja Caliornia); and another 1,000 MW amongother identied sites in the States o Zacatecas, Hidalgo,Veracruz, Sinaloa and Yucatan Other experts speak o atotal potential o as much as 7,000 MW, using only the bestlocations, and AMDEE estimates that a urther 10,000 MW
could be installed at as yet unidentied sites
pitica amewk cnitins
The Mexican energy market is not liberalized The stateowned company Comisión Federal de Electricidad (CFE)has historically been the sole supplier o electricityTransmission, distribution and sale o electricity to nalconsumers have also been reserved or the two state ownedsuppliers
In 1992, the legislation was amended to allow private sectorparticipation in sel-supply, cogeneration, independent powerproduction (IPP), exports o electricity and imports or theirown use Since 2000, IPPs have also been allowed to runpublicly nanced power stations and to build and operateprivately nanced power stations
Foreign investors can assume ull ownership in companiesthat do not contribute directly to public power supply For ashare greater than 49%, however, they need the approval o
the Comisión Nacional de Inversiones Extranjeras (NationalCommission or Foreign Investments)
In 2001, the regulatory authority CRE implemented aregulatory instrument to promote power generation romwind and small hydro, the so-called ‘InterconnectionContract’ or renewable energy This established special rules
on setting transmission charges and other issues relating tovariable power rom renewable sources Sel-supply projectsunder this contract were initially charged or capacity backup,making them uneconomical This was remedied in 2006
In 2005, a new provision was added to the Federal Tax Lawsallowing or 100% depreciation on capital in the rst year orall investments made in renewable energy
Moreover, in December 2005, the lower chamber o theMexican Congress adopted the initiative or the Renewable
Energy Utilization Law (LAFRE), which aims to establisha programme or renewables and sets a target o 8% onational power production to come rom ‘new’ renewableenergy by 2012 (excluding large hydro), up rom 2% in 2007In order to achieve this target, renewable power is to be givenpriority access to the grid, and a special nancing mechanism(‘Fondo Verde’) is to be set up to provide a premium on topo the electricity tari Since 2005, this proposal has seen avariety o changes, and it is still waiting or approval rom theMexican Senate
In February 2008, the Mexican President Felipe Calderònapproved a national power sector programme or 2007-2012,
8/3/2019 03GWEC - Global Wind 2007
http://slidepdf.com/reader/full/03gwec-global-wind-2007 51/72
49GWEC – GLOBAL WIND 2007 REPORT
2005 2006 2007
3 87 87
ToTal InsTalleD caPacITY
COUNTRY REPORTS – Mexico
year
MW
which aims at enhancing the country’s energy securityWhile this mainly ocuses on conventional energy sources, italso includes provisions or renewable energy development,notably the goal o increasing the share o total renewableelectricity
Proposed actions towards achieving this include thedevelopment o a national renewable energy programme, theestablishment o institutions to coordinate initiatives, andnew nancing mechanisms to support entrepreneurs
ostaces
The monopolistic position o the state suppliers is the mainobstacle or more wide-spread renewable energy use inMexico In addition, larger projects have ailed to materialisedue to the lack o avourable building and planninglegislation, as well the lack o experienced developers andocials Moreover, strong pressure to provide electricity atvery low prices has ailed to make wind energy installationseconomically viable
Inust
In terms o private sector involvement, a number ocompanies have participated in wind energy developmentin Mexico, including major players such as Cisa-Gamesa,Demex, EDF-EN, Eoliatec, Fuerza Eólica, Iberdrola, Preneal,and Unión Fenosa The combined development portolioin private wind energy acilities could reach 2,600 MW inOaxaca and 1,000 MW in Baja Caliornia or the period rom
2008-2010
pects
In 1984, CFE built the demonstration project La Venta I withseven wind turbines and a total capacity o 16 MW, locatedsouth o the Isthmus o Tehuantepec, 30 km northeast o Juchitán in the state o Oaxaca
Another individual 600 kW plant was put into operation by
CFE at the end o 1998 near Guerrero Negro in the ederalstate o Baja Caliornia Sur, operating in an isolated urban grid
In October 2006, a bid or an 833 MW wind acility, LaVenta II, at the same site as the demonstration project, wasgranted to the Spanish consortium Iberdrola-Gamesa, or 98turbines o 850 kW each The Global Environment Facility(GEF) launched a programme to subsidise the cost per kWho electricity produced at La Venta II in order to allow CFEto comply with its legal obligation to purchase power at thelowest cost This programme is implemented by the WorldBank
panne win ams
CFE has agreed several other 20-year power purchaseagreements with private investors or a urther ve windarms (La Venta III and Oaxaca I-IV), each with an output oabout 100 MW rom 2008 to 2012, generating electricityor public supply The establishment o the planned nationalund ('Fondo Verde') to cover the additional cost o windgeneration will be central to the realisation o these windarms Without this, continuing buy-down like that providedby the GEF will be needed
As a result, the GEF, intends to develop a number o largescale renewables projects through a 70 million US$ donationthrough its Large-Scale Renewable Energies Project (PERGE),implemented by the World Bank This unding would be usedto provide an incentive to the electricity produced during therst ve years o each project La Venta III will be the rst oneo these projects, with 101 MW, set to become operational in2009 Oaxaca I-IV are expected to come online in 2010 with406 MW
With input rom the Mexican Wind Energy Association(AMDEE).
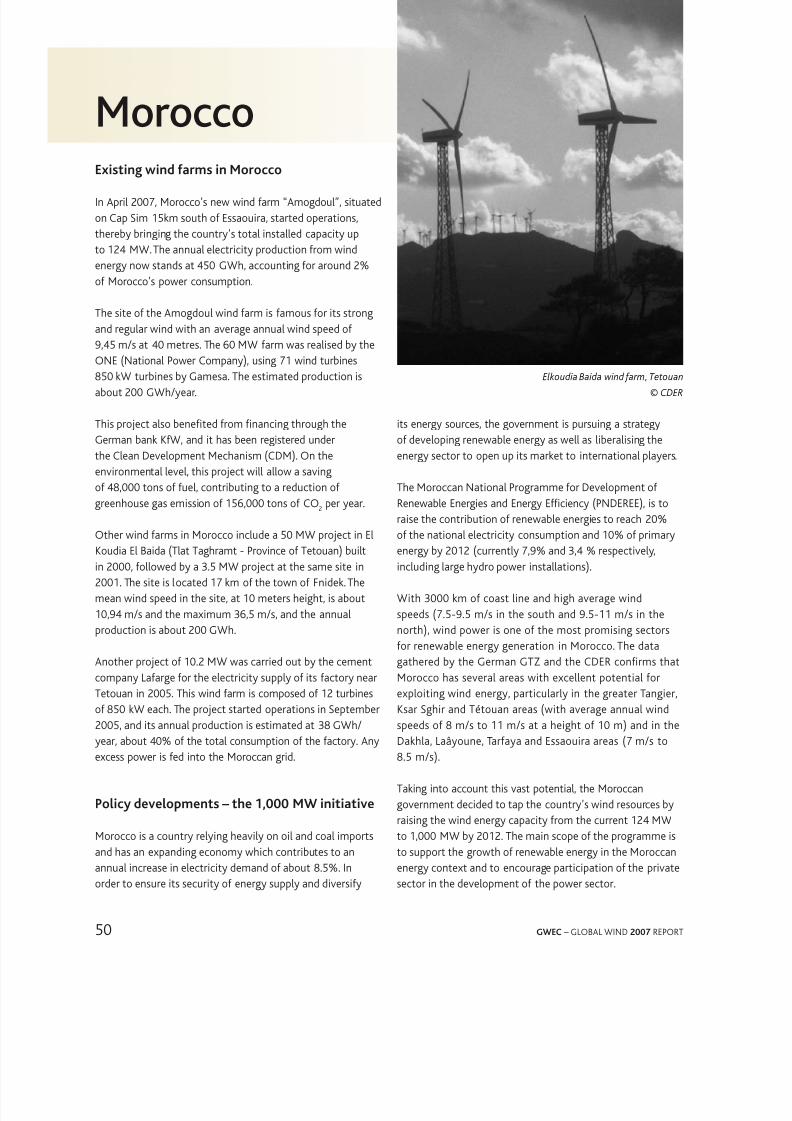
8/3/2019 03GWEC - Global Wind 2007
http://slidepdf.com/reader/full/03gwec-global-wind-2007 52/72
50 GWEC – GLOBAL WIND 2007 REPORT
Mrcc
Elkoudia Baida wind arm, Tetouan
© CDER
Existing win ams in Mcc
In April 2007, Morocco’s new wind arm “Amogdoul”, situatedon Cap Sim 15km south o Essaouira, started operations,thereby bringing the country’s total installed capacity upto 124 MW The annual electricity production rom windenergy now stands at 450 GWh, accounting or around 2%o Morocco’s power consumption
The site o the Amogdoul wind arm is amous or its strongand regular wind with an average annual wind speed o
9,45 m/s at 40 metres The 60 MW arm was realised by theONE (National Power Company), using 71 wind turbines850 kW turbines by Gamesa The estimated production isabout 200 GWh/year
This project also beneted rom nancing through theGerman bank KW, and it has been registered underthe Clean Development Mechanism (CDM) On theenvironmental level, this project will allow a savingo 48,000 tons o uel, contributing to a reduction ogreenhouse gas emission o 156,000 tons o CO2 per year
Other wind arms in Morocco include a 50 MW project in ElKoudia El Baida (Tlat Taghramt - Province o Tetouan) builtin 2000, ollowed by a 35 MW project at the same site in2001 The site is located 17 km o the town o Fnidek Themean wind speed in the site, at 10 meters height, is about10,94 m/s and the maximum 36,5 m/s, and the annualproduction is about 200 GWh
Another project o 102 MW was carried out by the cementcompany Laarge or the electricity supply o its actory near
Tetouan in 2005 This wind arm is composed o 12 turbineso 850 kW each The project started operations in September2005, and its annual production is estimated at 38 GWh/ year, about 40% o the total consumption o the actory Anyexcess power is ed into the Moroccan grid
pic eements – the 1,000 MW initiatie
Morocco is a country relying heavily on oil and coal importsand has an expanding economy which contributes to an
annual increase in electricity demand o about 85% Inorder to ensure its security o energy supply and diversiy
its energy sources, the government is pursuing a strategyo developing renewable energy as well as liberalising theenergy sector to open up its market to international players
The Moroccan National Programme or Development oRenewable Energies and Energy Eciency (PNDEREE), is to
raise the contribution o renewable energies to reach 20%o the national electricity consumption and 10% o primaryenergy by 2012 (currently 7,9% and 3,4 % respectively,including large hydro power installations)
With 3000 km o coast line and high average windspeeds (75-95 m/s in the south and 95-11 m/s in thenorth), wind power is one o the most promising sectorsor renewable energy generation in Morocco The datagathered by the German GTZ and the CDER conrms thatMorocco has several areas with excellent potential or
exploiting wind energy, particularly in the greater Tangier,Ksar Sghir and Tétouan areas (with average annual windspeeds o 8 m/s to 11 m/s at a height o 10 m) and in theDakhla, Laâyoune, Taraya and Essaouira areas (7 m/s to85 m/s)
Taking into account this vast potential, the Moroccangovernment decided to tap the country’s wind resources byraising the wind energy capacity rom the current 124 MWto 1,000 MW by 2012 The main scope o the programme isto support the growth o renewable energy in the Moroccan
energy context and to encourage participation o the privatesector in the development o the power sector
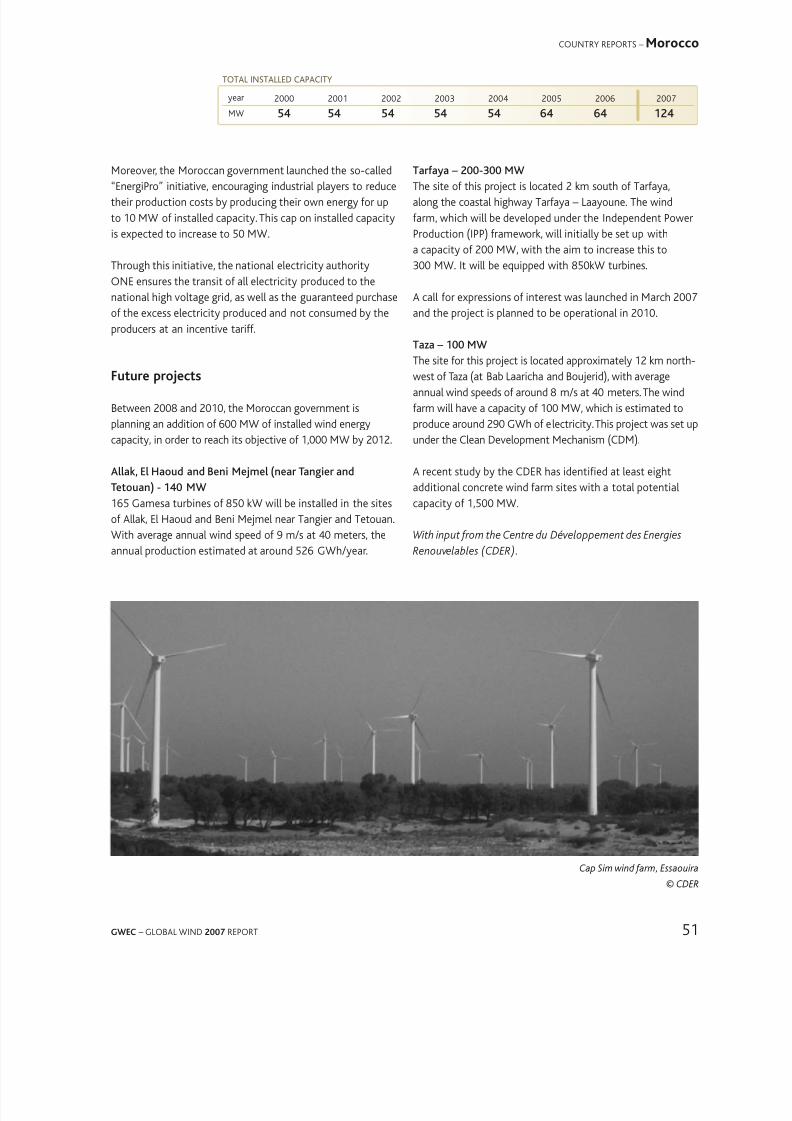
8/3/2019 03GWEC - Global Wind 2007
http://slidepdf.com/reader/full/03gwec-global-wind-2007 53/72
51GWEC – GLOBAL WIND 2007 REPORT
Cap Sim wind arm, Essaouira© CDER
2000 2001 2002 2003 2004 2005 2006 2007
54 54 54 54 54 64 64 124
ToTal InsTalleD caPacITY
COUNTRY REPORTS – Morocco
Moreover, the Moroccan government launched the so-called“EnergiPro” initiative, encouraging industrial players to reducetheir production costs by producing their own energy or upto 10 MW o installed capacity This cap on installed capacityis expected to increase to 50 MW
Through this initiative, the national electricity authorityONE ensures the transit o all electricity produced to thenational high voltage grid, as well as the guaranteed purchaseo the excess electricity produced and not consumed by theproducers at an incentive tari
Futue ects
Between 2008 and 2010, the Moroccan government isplanning an addition o 600 MW o installed wind energycapacity, in order to reach its objective o 1,000 MW by 2012
Allak, El Hau an Beni Mejmel (near Tangier an
Tetuan) - 140 MW
165 Gamesa turbines o 850 kW will be installed in the sites
o Allak, El Haoud and Beni Mejmel near Tangier and TetouanWith average annual wind speed o 9 m/s at 40 meters, theannual production estimated at around 526 GWh/year
Taraya – 200-300 MWThe site o this project is located 2 km south o Taraya,along the coastal highway Taraya – Laayoune The windarm, which will be developed under the Independent PowerProduction (IPP) ramework, will initially be set up witha capacity o 200 MW, with the aim to increase this to300 MW It will be equipped with 850kW turbines
A call or expressions o interest was launched in March 2007and the project is planned to be operational in 2010
Taza – 100 MWThe site or this project is located approximately 12 km north-west o Taza (at Bab Laaricha and Boujerid), with averageannual wind speeds o around 8 m/s at 40 meters The windarm will have a capacity o 100 MW, which is estimated toproduce around 290 GWh o electricity This project was set upunder the Clean Development Mechanism (CDM)
A recent study by the CDER has identied at least eightadditional concrete wind arm sites with a total potentialcapacity o 1,500 MW
With input rom the Centre du Développement des Energies
Renouvelables (CDER).
year
MW

8/3/2019 03GWEC - Global Wind 2007
http://slidepdf.com/reader/full/03gwec-global-wind-2007 54/72
52 GWEC – GLOBAL WIND 2007 REPORT
New Zealan
Tararua Windarm, Manawatu
© NZWEA
New Zealand’s wind energy industry is small, but it isgrowing steadily Wind energy capacity almost doubledin 2007, increasing rom 1708 MW to 3218 MW NewZealand’s exceptional wind resource results in a high capacityactor by international standards In 2006 the averagecapacity actor or New Zealand’s wind arms was 41% Theestimate or 2007 is 45%, with turbines in some wind armsachieving up to 70% capacity in the windier months
New Zealand’s wind industry does not receive direct nancialsupport or subsidies rom the government Nonetheless,
the development o a new wind arm near Wellington, WestWind, and ongoing investigations at other sites shows thatwith the right conditions, wind energy is competitive withother orms o electricity generation
Gwing inust
Two new wind arms were commissioned in 2007, andconstruction commenced on two other sites Stage 3 oTrustPower’s Tararua Wind Farm, in the Manawatu (north o
Wellington), has the capacity to generate 93 MW, makingTararua Wind Farm the largest in New Zealand, with at totalcapacity o 161 MW
Meridian’s White Hill wind arm (29 turbines with a capacityo 58 MW) is the rst wind arm with more than one turbineon New Zealand’s South Island, signalling the expansion o theindustry rom the North Island’s Manawatu region The growingdiversity o wind arm sites enables the use o the excellentwind resource across the country and will increase the industry’sability to provide a greater proportion o NZ’s electricity
Construction began in 2007 on Meridian’s West Wind Project,near New Zealand’s capital city Wellington, and Stage 2 oNew Zealand Windarm’s Te Rere Hau Wind Farm, in theManawatu Meridian expects West Wind to have a capacityactor o 47% Stage 2 o Te Rere Hau (up to 14 MW) is theonly wind arm expected to be commissioned in 2008, asWest Wind (143 MW) will not be commissioned until 2009
In 2007 the government announced its target or NewZealand to generate 90% o its electricity rom renewable
sources by 2025 New Zealand currently generates about65% o its electricity rom renewable sources, primarily rom
hydro To reach 90%, renewable energy capacity needs togrow by about 200 MW each year
Wind provides about 15% o New Zealand’s currentelectricity needs With limited opportunities or theexpansion o hydro and geothermal generation, therenewable energy target gives added impetus to NewZealand’s wind industry Wind energy’s contribution is setto grow over the coming years and developers are currentlyseeking consent to build projects with a combined capacityo more than 1,800 MW
pse cimate change egisatin heu t
win
Proposed legislation and policy developments aimed ataddressing climate change are creating an environment thatis supportive o wind energy The renewable energy targetis not legislated, but the wind industry will benet romproposed legislation that introduces an emissions tradingscheme and restricts building new base-load ossil-uelledthermal generation
Under the proposed legislation, the electricity sector will
enter the emissions trading scheme in 2010 Thermalgenerators will not receive any ree allocation o carboncredits, and so will ace the ull cost o their emissionsIncreasing costs o electricity rom non-renewable sources,combined with the restricted thermal generation, will makewind energy more competitive
2008 is an election year in New Zealand The oppositionNational Party is currently leading in the polls While theNational Party has indicated that it is broadly supportiveo the climate change policies developed by the Labour
government, a change o government has the potential toresult in changes to policy

8/3/2019 03GWEC - Global Wind 2007
http://slidepdf.com/reader/full/03gwec-global-wind-2007 55/72
53GWEC – GLOBAL WIND 2007 REPORT
2000 2001 2002 2003 2004 2005 2006 2007
36 36 36 36 168 168 171 322
ToTal InsTalleD caPacITY
COUNTRY REPORTS – New Zealand
Measues t ease cnsenting issues
Obtaining resource consent or wind arms under NewZealand’s Resource Management Act (RMA) continues to bea major obstacle or developers Developers need to apply orresource consent rom the local council to build a wind armOnce consent is granted, anyone who objects to the consentconditions can lodge an appeal with the Environment CourtEnvironment Court decisions can be appealed to the HighCourt only on a point o law
In recent years, all signicant wind arm projects that havebeen granted consent by local councils have been appealedto the Environment Court The government is developinga National Policy Statement on renewable energy, whichshould be in place by the end o 2008 The Statement willrequire local authorities to more ully recognise the benetso wind energy when considering the positive and negativeimpacts o a project
In addition, the government has indicated that it intendsto make greater use o the RMA’s ‘call-in’ provisions
These provisions can be used to reduce the time involvedin obtaining consent by calling a project directly into theEnvironment Court rather than having the project progressthrough normal local council processes The rst wind armto be called into the Environment Court will be Unison and
Roaring 40s Te Waka project in Hawkes Bay The industry iswaiting with interest to see what precedents this call-in sets
oecming cnnectin an tansmissincnstaints
The Electricity Commission (the regulator o the energymarket) is examining the implications o a signicant increasein the amount o wind energy generation and how any issuescan be resolved Indications are that issues can be resolved
without signicant cost, and solutions are likely to include thedevelopment o a orecasting system and establishing minimumperormance standards or issues such as ault-ride through
The Electricity Commission and Transpower (the transmissionsystem operator) are investigating options to improve theplanning o investment in transmission in order to enablerenewable energy The project should result in a betterunderstanding o where wind arm developments are likelyto occur and the investment required in the transmissionsystem to enable new developments to be easily linked into
the national grid
Combined, the results o the two projects should enable windenergy to be developed on a level playing eld with othergeneration sources
WINd FArMS IN NEW zEAlANd
regin oeat yea cmmissine Caacit
In eatin (with more than one turbine)
White Hill Southland Meridian 2007 580 MWTararua Manawatu TrustPower Stage 3: 2007
Stage 2: 2004
Stage 1: 1999
161 MW
Te Rere Hau Manawatu NZ Windarms Stage 1: 2006 25 MW
Te Apiti Manawatu Meridian 2004 908 MW
Hau Nui Wairarapa Genesis Stage 2: 2004
Stage 1: 1996
87 MW
Une cnstuctin
Te Rere Hau Manawatu NZ Windarms Stage 2: 2008 Up to 14 MW
West Wind Wellington Meridian 2009 1426 MW
With input rom the New Zealand Wind Energy Association (NZWea)
year
MW
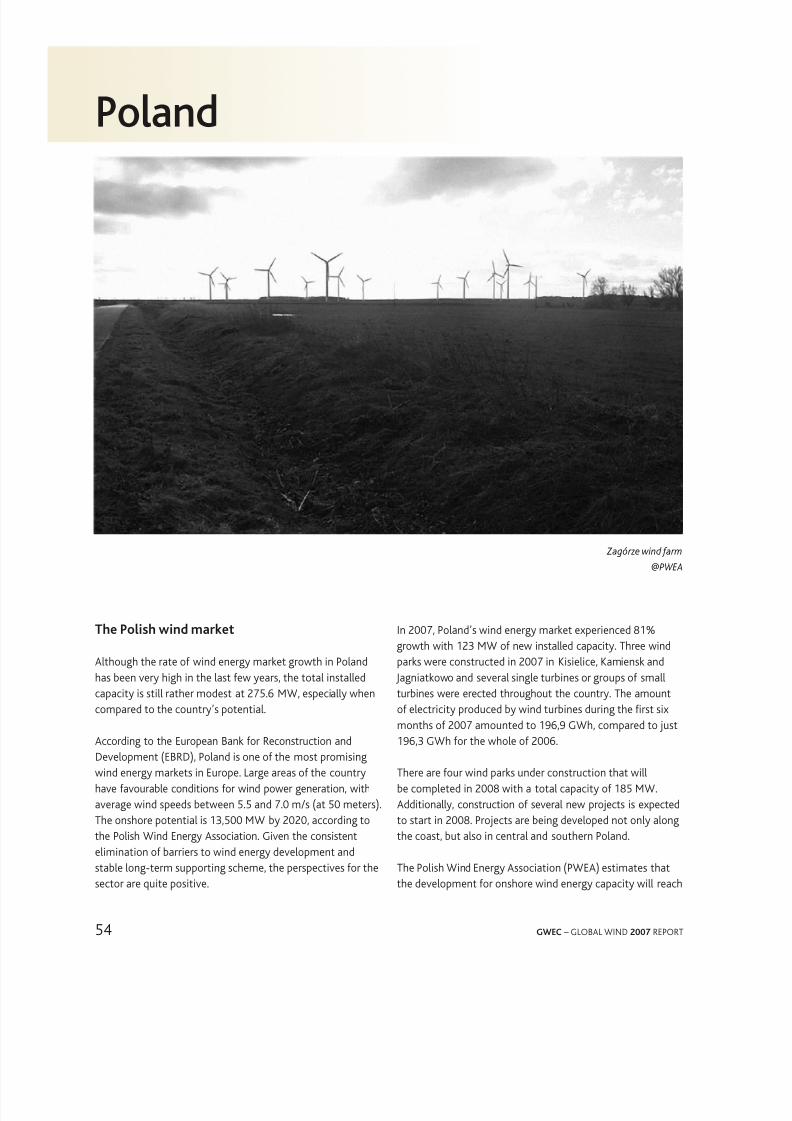
8/3/2019 03GWEC - Global Wind 2007
http://slidepdf.com/reader/full/03gwec-global-wind-2007 56/72
54 GWEC – GLOBAL WIND 2007 REPORT
Plan
Zagórze wind arm
@PWEA
The pish win maket
Although the rate o wind energy market growth in Polandhas been very high in the last ew years, the total installed
capacity is still rather modest at 2756 MW, especially whencompared to the country’s potential
According to the European Bank or Reconstruction andDevelopment (EBRD), Poland is one o the most promisingwind energy markets in Europe Large areas o the countryhave avourable conditions or wind power generation, withaverage wind speeds between 55 and 70 m/s (at 50 meters)The onshore potential is 13,500 MW by 2020, according tothe Polish Wind Energy Association Given the consistentelimination o barriers to wind energy development and
stable long-term supporting scheme, the perspectives or thesector are quite positive
In 2007, Poland’s wind energy market experienced 81%growth with 123 MW o new installed capacity Three windparks were constructed in 2007 in Kisielice, Kamiensk and Jagniatkowo and several single turbines or groups o small
turbines were erected throughout the country The amounto electricity produced by wind turbines during the rst sixmonths o 2007 amounted to 196,9 GWh, compared to just196,3 GWh or the whole o 2006
There are our wind parks under construction that willbe completed in 2008 with a total capacity o 185 MWAdditionally, construction o several new projects is expectedto start in 2008 Projects are being developed not only alongthe coast, but also in central and southern Poland
The Polish Wind Energy Association (PWEA) estimates thatthe development or onshore wind energy capacity will reach
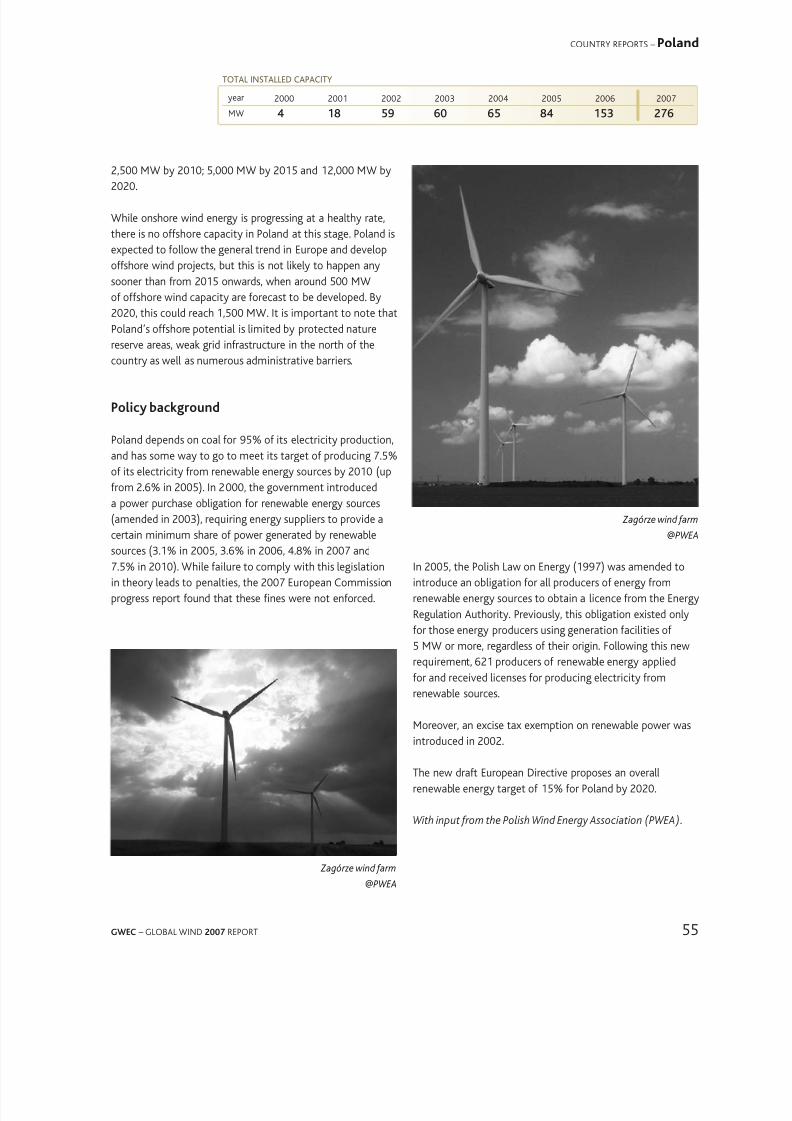
8/3/2019 03GWEC - Global Wind 2007
http://slidepdf.com/reader/full/03gwec-global-wind-2007 57/72
55GWEC – GLOBAL WIND 2007 REPORT
Zagórze wind arm@PWEA
Zagórze wind arm@PWEA
2000 2001 2002 2003 2004 2005 2006 2007
4 18 59 60 65 84 153 276
ToTal InsTalleD caPacITY
COUNTRY REPORTS – Poland
2,500 MW by 2010; 5,000 MW by 2015 and 12,000 MW by2020
While onshore wind energy is progressing at a healthy rate,there is no oshore capacity in Poland at this stage Poland isexpected to ollow the general trend in Europe and developoshore wind projects, but this is not likely to happen anysooner than rom 2015 onwards, when around 500 MWo oshore wind capacity are orecast to be developed By2020, this could reach 1,500 MW It is important to note thatPoland’s oshore potential is limited by protected nature
reserve areas, weak grid inrastructure in the north o thecountry as well as numerous administrative barriers
pic ackgun
Poland depends on coal or 95% o its electricity production,and has some way to go to meet its target o producing 75%o its electricity rom renewable energy sources by 2010 (uprom 26% in 2005) In 2000, the government introduceda power purchase obligation or renewable energy sources
(amended in 2003), requiring energy suppliers to provide acertain minimum share o power generated by renewablesources (31% in 2005, 36% in 2006, 48% in 2007 and75% in 2010) While ailure to comply with this legislationin theory leads to penalties, the 2007 European Commissionprogress report ound that these nes were not enorced
In 2005, the Polish Law on Energy (1997) was amended tointroduce an obligation or all producers o energy romrenewable energy sources to obtain a licence rom the EnergyRegulation Authority Previously, this obligation existed onlyor those energy producers using generation acilities o5 MW or more, regardless o their origin Following this newrequirement, 621 producers o renewable energy appliedor and received licenses or producing electricity rom
renewable sources
Moreover, an excise tax exemption on renewable power wasintroduced in 2002
The new drat European Directive proposes an overallrenewable energy target o 15% or Poland by 2020
With input rom the Polish Wind Energy Association (PWEA).
year
MW

8/3/2019 03GWEC - Global Wind 2007
http://slidepdf.com/reader/full/03gwec-global-wind-2007 58/72
56 GWEC – GLOBAL WIND 2007 REPORT
Republic Krea
Win we taget: 2,250 2012
South Korea is the world’s orth-largest oil importing country,with 97% o its energy consumption provided or by ossiluel imports In order to diversiy its energy supply, theKorean government in 2003 established its Second BasicPlan or New & Renewable Energy Technology Developmentand Dissemination, setting a goal o increasing the country’sshare o total primary energy supply rom 14% to 5% by2011, which was later extended to 10% by 2020
The priority areas or achieving these objectives are windenergy and solar photovoltaics, and a target or wind energywas set at 2,250 MW by 2012 A report by the InternationalEnergy Agency concluded that the country could generateas much as 30% o its electricity rom renewable energysources However, the proportion o renewable power stoodat only 23% in 2007
Since the eed-in-tari system or RE-generated electricitytook eect in May 2002, private investors have beenthe driving orce behind installation o commercial wind
power generators In order to secure private investment, anapplication period or the base price was established as aguarantee
There are currently 12 wind arms in Korea, made up o morethan 120 commercial turbines The total installed capacityincreased by 18 MW in 2007, down rom 77 MW in theprevious year, and the total now stands at 191 MW
Cnstaints t maket eement
Barriers to market development in Korea are publicopposition and the geographic characteristics o onshoresites, where suitable locations are relatively scarce despitethe great wind resource potential Most areas outsidepopulation centers are mountainous, so the inrastructure(road, power grid, etc) necessary or installing wind arms isinadequate In addition, these areas are usually designatedas nature preserves, so obtaining legal permits is dicult, inot impossible Private wind power generation companiesare trying to reduce the unit cost o construction by pursuing
large-scale deployment projects o several 10s o MWs
Various measures are being taken to overcome thesegeographical limitations, such as the construction ooshore wind arms In order to secure o-shore wind powertechnology, Korea constructed a demonstration site in Jejuisland with 4 MW o power capacity
Ceatin a mestic inust
The Korean government is promoting research anddevelopment in renewable energy technologies to create anew hi-tech sector o the economy
At present, our domestic manuacturers are developingMW-class wind power generators with capacities o2 ~ 3 MW The abrications o 2MW-class wind turbineshave been completed in 2007, and the prototypes will betested or the type certication during 2008
The Korean wind power industry is growing rapidly,beneting rom the major wind power generation projectsthat are underway Companies operating wind arms,and manuacturers o wind turbines, turbine towers, andcomponents, are expected to see steady growth into theoreseeable uture
The Hyosung’s HS90 2MW wind turbine

8/3/2019 03GWEC - Global Wind 2007
http://slidepdf.com/reader/full/03gwec-global-wind-2007 59/72
57GWEC – GLOBAL WIND 2007 REPORT
2000 2001 2002 2003 2004 2005 2006 2007
8 8 13 18 68 98 173 191
ToTal InsTalleD caPacITY
COUNTRY REPORTS – Republic of Korea
Win eneg ects in Kea
As a non-annex 1 party to the Kyoto Protocol, Korea canhost Clean Development Mechanism (CDM) projects Thelist below gives some examples o the largest and the mostrecent wind arms, all o which are registered under the CDM
Pyengchang win arm (Gangwn prvince)
The Pyeongchang wind arm is the largest wind energyproject in Korea with 98 MW o installed capacity, made upo 49 2MW Vestas turbines It became operational at the end
o 2006 and generated around 231 GWh in 2007, cuttingCO2
emissions by 141,000 tons The annual wind speedsor the site are in the range o 765 m/s at 60m above theground
Yunguk win arm (39.6 MW)
The Youngduk project is located on the east coast o Korea,where average wind speeds reach 71 m/s at a hub heighto 80m It started operations in June 2006, and it has aninstalled capacity o 396 MW, made up o 24 turbines witha nominal installed capacity o 165 MW each In 2007, the
project provided close to 74 GWh o electricity to the grid,reducing CO2
emissions by 45,000 tons
Hangyeng win arm (6 MW + 15 MW)The Hangyeong wind arm added 15 MW to the Koreanwind capacity on the southern island o Jeju, where annualwind speeds are in the range o 75 m/s at 60m above theground, accounting or capacity actors above 30% In 2007,ve 3 MW turbines were set up at the wind arm to add tothe our 15 MW units built in 2004 The addition is expectedto generate around 40 GWh o electricity per year, reducingCO
2emissions by close to 30,000 tons According to the
Korean government, the new turbines will ulll the powerdemands o 126,000 households in Goyang City, northwest
o Seoul
Yangyang win arm (3 MW)
The Yangyang wind arm is part o a larger renewable energyproject, located in the north eastern region It is composed oa 3MW wind power plant and a 14MW small hydroelectricpower plant The annual power generation o the two windturbines (15MW each) and two small hydroelectric turbines(07MW each) is estimated to be 14 MWh per year, abating8,620 tons o CO
2
year
MW

8/3/2019 03GWEC - Global Wind 2007
http://slidepdf.com/reader/full/03gwec-global-wind-2007 60/72
58 GWEC – GLOBAL WIND 2007 REPORT
Spain
The stngest gwth maket in Eue in 2007
The Spanish wind energy market saw spectacular growthin 2007, partly spurred by new legislation which oreseestransitional arrangements or wind arms that startedoperations beore the end o the year A record 3,522 MWo new capacity were installed in Spain in 2007, morethan doubling the 2006 increase, bringing the total up to15,145 MW
Wind energy now supplies 10% o total power demand
in Spain, with 26,000 GWh produced in 2007, orecast toincrease to around 29,000 GWh or 2008
The Sanish ee-in tai
Support or renewable technologies began in 1980 withthe “Law or Energy Conservation” Since then, variousinstruments have been applied to encourage the deploymento renewable energies, mainly legislative measures andnancial support
In 1999, the Spanish government set a target o achieving12% o total energy consumption and 29% o electricityrom RES by the year 2010 The EU RES Directive o 2001stipulates that by 2010, at least 294% o gross electricity
consumption should be met by renewable sources In 2005,the Spanish government also set a goal or the country’sinstalled wind power capacity to reach 20,000 MW by 2010
The current tari system entered into orce in 1997, throughthe Electric Power Act 54/1997, subsequently modied byRoyal Decrees 436/2004 and 1634/2006 These laws dene aeed-in mechanism or renewable power There are dierentlevels o taris depending on the technology and on the sizeo the installation
According to the law, the power producer can choosebetween a xed price and a premium added to the marketprice The choice is made or the duration o one year, aterwhich the producer can decide to maintain the ormula orchange to the other option
The electricity distributor has an obligation to buy electricityproduced by renewable sources at the dened price andthe National Commission o Energy (CNE) perorms thesettlement o costs incurred by distributors The costs o REelectricity generation are taken into account or the annual
calculation o the electricity price, thereby ensuring thatthe additional cost to consumers is proportional to theirelectricity consumption
pic eements in 2007: rd 661/2007
In 2007, the existing law was reormed, and this processcreated signicant uncertainty in the Spanish marketFinally, at the end o May, the new law (RD 661/2007) waspublished, revealing a similar structure to the old system but
with less avourable taris and a cap and foor mechanismor the xed premium option
Cerro Vicente wind arm, Albacete
© GAMESA
Higueruela wind arm, Albacete© R.MURAD/AEE
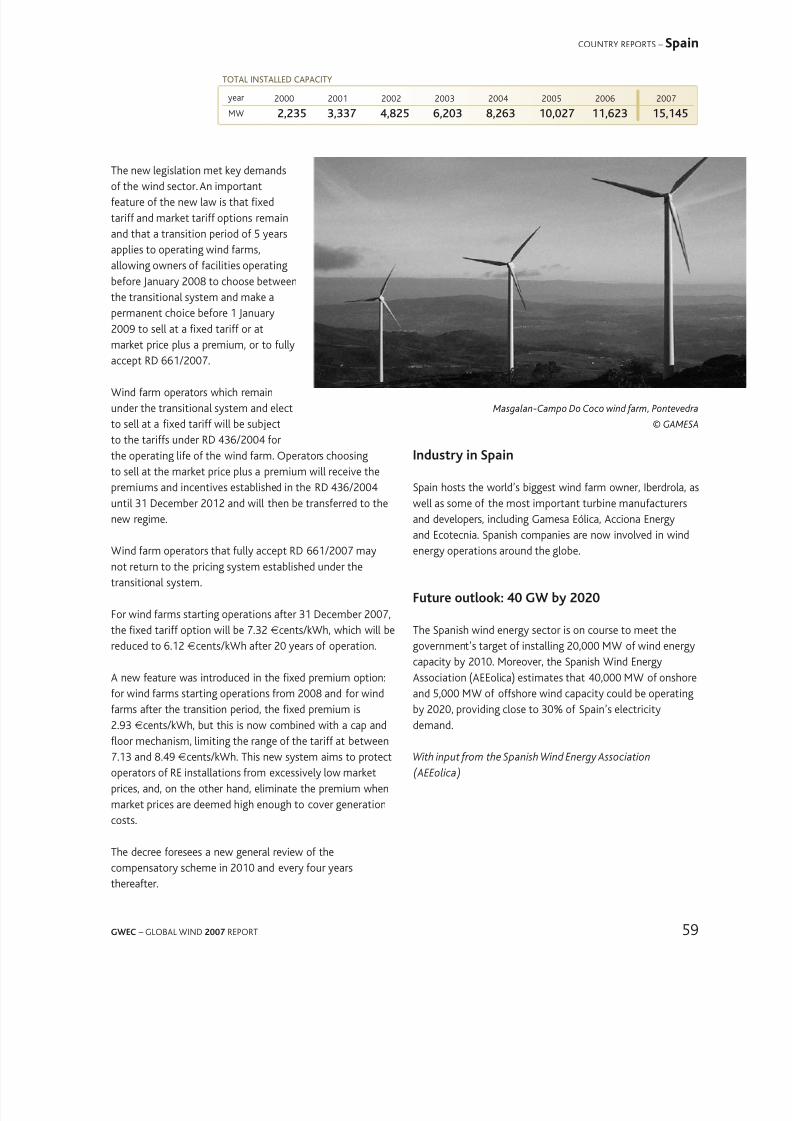
8/3/2019 03GWEC - Global Wind 2007
http://slidepdf.com/reader/full/03gwec-global-wind-2007 61/72
59GWEC – GLOBAL WIND 2007 REPORT
2000 2001 2002 2003 2004 2005 2006 2007
2,235 3,337 4,825 6,203 8,263 10,027 11,623 15,145
ToTal InsTalleD caPacITY
COUNTRY REPORTS – Spain
The new legislation met key demandso the wind sector An importanteature o the new law is that xedtari and market tari options remainand that a transition period o 5 yearsapplies to operating wind arms,allowing owners o acilities operatingbeore January 2008 to choose betweenthe transitional system and make apermanent choice beore 1 January2009 to sell at a xed tari or at
market price plus a premium, or to ullyaccept RD 661/2007
Wind arm operators which remainunder the transitional system and electto sell at a xed tari will be subjectto the taris under RD 436/2004 orthe operating lie o the wind arm Operators choosingto sell at the market price plus a premium will receive thepremiums and incentives established in the RD 436/2004until 31 December 2012 and will then be transerred to the
new regime
Wind arm operators that ully accept RD 661/2007 maynot return to the pricing system established under thetransitional system
For wind arms starting operations ater 31 December 2007,the xed tari option will be 732 €cents/kWh, which will bereduced to 612 €cents/kWh ater 20 years o operation
A new eature was introduced in the xed premium option:
or wind arms starting operations rom 2008 and or windarms ater the transition period, the xed premium is293 €cents/kWh, but this is now combined with a cap andfoor mechanism, limiting the range o the tari at between713 and 849 €cents/kWh This new system aims to protectoperators o RE installations rom excessively low marketprices, and, on the other hand, eliminate the premium whenmarket prices are deemed high enough to cover generationcosts
The decree oresees a new general review o the
compensatory scheme in 2010 and every our yearsthereater
Masgalan-Campo Do Coco wind arm, Pontevedra
© GAMESA
year
MW
Inust in Sain
Spain hosts the world’s biggest wind arm owner, Iberdrola, aswell as some o the most important turbine manuacturers
and developers, including Gamesa Eólica, Acciona Energyand Ecotecnia Spanish companies are now involved in windenergy operations around the globe
Futue utk: 40 GW 2020
The Spanish wind energy sector is on course to meet thegovernment’s target o installing 20,000 MW o wind energycapacity by 2010 Moreover, the Spanish Wind EnergyAssociation (AEEolica) estimates that 40,000 MW o onshore
and 5,000 MW o oshore wind capacity could be operatingby 2020, providing close to 30% o Spain’s electricitydemand
With input rom the Spanish Wind Energy Association
(AEEolica)

8/3/2019 03GWEC - Global Wind 2007
http://slidepdf.com/reader/full/03gwec-global-wind-2007 62/72
60 GWEC – GLOBAL WIND 2007 REPORT
Turkey
Bandirma Bares wind arm
© TWEA
Bandirma Bares wind arm© TWEA
Wind energy has had a slow start in Turkey However, asthe country is preparing to join the European Union andconsidering ratiying the Kyoto Protocol (as an Annex Icountry), there are early indications o promising uturedevelopments
Turkey is a country with very limited gas and oil reservesand is thereore looking at renewable energies as a meansto improve its energy security in order to gain someindependence rom imported gas rom Russia and IranIn addition, Turkish electricity demand is expected to
increase by 7-8% annually, and power shortages are alreadywidespread In this context, policy makers increasinglyrecognise the potential role o wind power as part o thecountry’s uture energy mix
pic
Turkey introduced its rst law on the Use o RenewableEnergy Resources or the Generation o Electrical Energy inMay 2005, introducing tari support or electricity produced
by renewable sources This tari was increased slightly to5 – 55 Euro ct/kWh by a revision o the law in May 2007The support was set out to last or seven years
While the level o support is low in comparison with otherEuropean countries, wind power producers are also reeto sell to the national power pool or engage directly witheligible customers in bilateral agreements where prices aremuch higher than the guaranteed price
A number o additional policy measures have helped toincrease renewables production in Turkey in recent years Theseinclude the obligation o the national transmission companyto provide grid connection to all renewable power projects,and improved transmission links with the EU, which stabilisethe power system Furthermore, most restrictions on oreigninvestment in the Turkish power sector have been lited
Win esuce
Turkey has a large renewable energy potential A Wind
Atlas o Turkey by the Turkish Energy Market RegulatoryAgency (EMRA/EPDK) in May 2002 indicates that theregions with the highest potential or wind speeds atheights o 50 m are the Aegean, Marmara, and EasternMediterranean Regions o Turkey, as well as somemountainous regions o central Anatolia
Maket utk
Turkey installed 97 MW o new wind energy capacity in2007, thereby nearly trebling its market to reach a total o146 MW, mostly located in the North-West o the country
A urther 12 licensed projects with a capacity o over600 MW have signed construction agreements and areexpected to be nalised by the end o 2009, while an
additional 29 projects totaling 982 MW are reported to havebeen granted licenses

8/3/2019 03GWEC - Global Wind 2007
http://slidepdf.com/reader/full/03gwec-global-wind-2007 63/72
61GWEC – GLOBAL WIND 2007 REPORT
Cesme ARES windarm
© TWEA
2000 2001 2002 2003 2004 2005 2006 2007
19 19 19 20 20 20 50 146
ToTal InsTalleD caPacITY
COUNTRY REPORTS – Turkey
In 2006, EMRA stopped accepting applications or new windpower projects without explanation This trend was reversedby a call or wind and solar projects in the autumn o 2007As a result, EMRA received applications or 751 projects or acapacity o 78,151 MW, including 3,791 MW oshore, romover 380 companies This number greatly exceeded all previousestimates It has to be pointed out, however, that many othese applications compete or the same sites Nearly hal othe applications were or projects o under 50 MW
In addition to local companies including Sayres Elektrik,
Akyelres Elektrik, Guneyres Elektrik and Uzay Enerji, majorinternational players such as Iberdrola, BP and Westwind havesubmitted applications EMRA is expected to oer licenses orup to 10,000 MW o wind energy, while saying that30,000 MW would be easible
However, experts have cautioned that only a small share othis capacity would be able to be connected to the powergrid without major investments in upgrading the country’stransmission inrastructure
CAPACITY UNdER oPERATIoN – 146.25 MW
Location Comm. Date MW
Turbine
manuac-
turer
İzmir-Çeşme 1998 15 Enercon
İzmir-Çeşme 1998 72 Vestas
Çanakkale-Bozcaada 2000 102 Enercon
İstanbul-Hadımköy 2003 12 Enercon
Balıkesir-Bandırma 2006 30 GE
İstanbul-Silivri 2007 085 Vestas
İzmir-Çeşme 2007 392 Enercon
Manisa-Akhisar 2007 108 Vestas
Çanakkale-İntepe 2007 304 Enercon
Çanakkale-Gelibolu 2007 149 Enercon
CAPACITY UNdER CoNSTRUCTIoN - 276.9 MW
Location Comm. Date MW
Turbine
manuac-
turer
Hatay-Samandağ 2008 30 Vestas
Manisa-Sayalar 2008 304 Enercon
İstanbul-Gaziosmanpaşa 2008 24 Enercon
İstanbul-Çatalca 2008 60 Vestas
İzmir-Aliağa 2008 425 Nordex
Balıkesir-Şamlı 2008 90 Vestas
CoNTRACTEd PRoJECTS - 558.2 MW
Location Comm. Date MW
Turbine
manuac-
turer
Muğla-Datça 2008 288 Enercon
Aydın-Çine 2008 195 Vensys
Bilecik 2008 666 Conergy AGHatay-Samandağ 2008 351 Nordex
Hatay-Samandağ 2008 225 Nordex
Osmaniye-Bahçe 2009 130 GE
Manisa-Soma 2009 1408 Enercon
Balıkesir-Kepsut 2009 549 Enercon
İzmir-Aliağa 2009 30 Enercon
With input rom the Turkish Wind Energy Association
year
MW
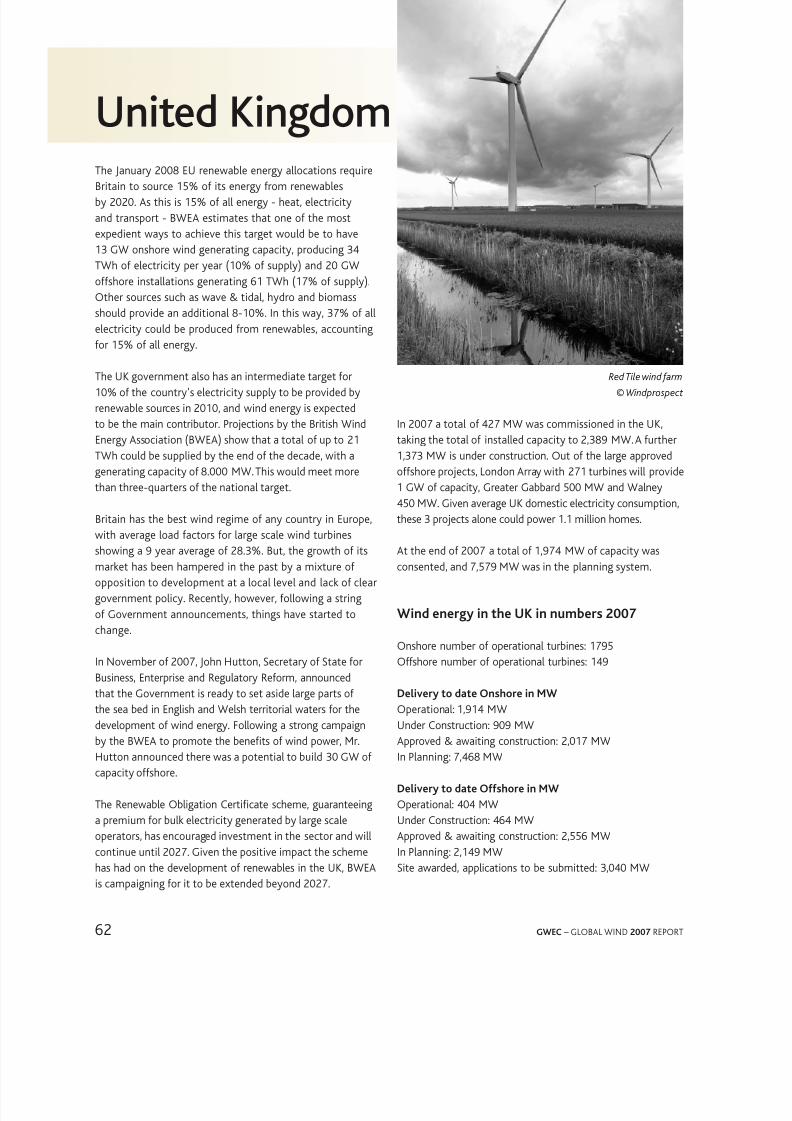
8/3/2019 03GWEC - Global Wind 2007
http://slidepdf.com/reader/full/03gwec-global-wind-2007 64/72
62 GWEC – GLOBAL WIND 2007 REPORT
Unite Kingm
Red Tile wind arm
© Windprospect
The January 2008 EU renewable energy allocations requireBritain to source 15% o its energy rom renewablesby 2020 As this is 15% o all energy - heat, electricityand transport - BWEA estimates that one o the mostexpedient ways to achieve this target would be to have13 GW onshore wind generating capacity, producing 34TWh o electricity per year (10% o supply) and 20 GWoshore installations generating 61 TWh (17% o supply)Other sources such as wave & tidal, hydro and biomassshould provide an additional 8-10% In this way, 37% o allelectricity could be produced rom renewables, accounting
or 15% o all energy
The UK government also has an intermediate target or10% o the country’s electricity supply to be provided byrenewable sources in 2010, and wind energy is expectedto be the main contributor Projections by the British WindEnergy Association (BWEA) show that a total o up to 21TWh could be supplied by the end o the decade, with agenerating capacity o 8000 MW This would meet morethan three-quarters o the national target
Britain has the best wind regime o any country in Europe,with average load actors or large scale wind turbinesshowing a 9 year average o 283% But, the growth o itsmarket has been hampered in the past by a mixture oopposition to development at a local level and lack o cleargovernment policy Recently, however, ollowing a stringo Government announcements, things have started tochange
In November o 2007, John Hutton, Secretary o State orBusiness, Enterprise and Regulatory Reorm, announced
that the Government is ready to set aside large parts othe sea bed in English and Welsh territorial waters or thedevelopment o wind energy Following a strong campaignby the BWEA to promote the benets o wind power, MrHutton announced there was a potential to build 30 GW ocapacity oshore
The Renewable Obligation Certicate scheme, guaranteeinga premium or bulk electricity generated by large scaleoperators, has encouraged investment in the sector and willcontinue until 2027 Given the positive impact the scheme
has had on the development o renewables in the UK, BWEAis campaigning or it to be extended beyond 2027
In 2007 a total o 427 MW was commissioned in the UK,taking the total o installed capacity to 2,389 MW A urther1,373 MW is under construction Out o the large approvedoshore projects, London Array with 271 turbines will provide1 GW o capacity, Greater Gabbard 500 MW and Walney450 MW Given average UK domestic electricity consumption,
these 3 projects alone could power 11 million homes
At the end o 2007 a total o 1,974 MW o capacity wasconsented, and 7,579 MW was in the planning system
Win eneg in the UK in numes 2007
Onshore number o operational turbines: 1795Oshore number o operational turbines: 149
deie t ate onshe in MWOperational: 1,914 MWUnder Construction: 909 MWApproved & awaiting construction: 2,017 MWIn Planning: 7,468 MW
deie t ate oshe in MW
Operational: 404 MWUnder Construction: 464 MWApproved & awaiting construction: 2,556 MWIn Planning: 2,149 MW
Site awarded, applications to be submitted: 3,040 MW

8/3/2019 03GWEC - Global Wind 2007
http://slidepdf.com/reader/full/03gwec-global-wind-2007 65/72
63GWEC – GLOBAL WIND 2007 REPORT
Whitelee wind arm
© Scottish Power
2000 2001 2002 2003 2004 2005 2006 2007
406 474 552 648 888 1,353 1,962 2,389
ToTal InsTalleD caPacITY
COUNTRY REPORTS – United Kingdom
panning issues
According to BWEA’s latest annual survey the time romling an application to planning decision is 24 months Thereis 7,468 MW onshore in the planning system and 2,149 MWoshore, against a total UK electricity generating capacity o83 GW
Partly to address issues arising out o growing electricitydemand and the need or more domestically produced andrenewable energy – as opposed rom energy rom imported
gas and oil – the UK Parliament has started work in 2007on 3 major pieces o legislation o interest to the sector: TheEnergy Bill, The Planning Reorm Bill and The Climate ChangeBill
BWEA hopes that this legislation will help resolve someo the planning issues such as length o determination,access to grid and waiting times or grid connections BWEAhas supported the creation o the Inrastructure PlanningCommission (IPC) which would take decisions on projectsover 50 MW; and it has also successully campaigned or
wording in the Planning Reorm Bill which gives the Secretaryo State the option to reer projects o less than 50 MWdirectly to the IPC
oshe eement
BWEA sees UK oshore wind as rapidly becoming one othe most exciting sectors in the global renewable energyindustry Britain is set to overtake Denmark as leader in theeld, with projects now in construction approaching hal o
the current global installed oshore capacity
The UK’s th oshore Round 1 project, Burbo Bank
(90 MW), is in commissioning, and oshore constructionwork has started on three other sites These are Robin Rigg(180 MW), Rhyl Flats (90 MW) and Lynn and Inner Dowsing(194 MW) which, when completed, will become the world’smost powerul oshore wind arm,
Also, the deeper water Beatrice demonstration project(10 MW) will reach ull operation this year
The increase in oshore wind ROC multiple to 15, coupledwith continuity in the onshore wind ROC multiple, has
been accepted positively, though many advise that theimprovement in oshore project economics is not assignicant as might be expected
Though the multiple is higher than generally expected, mostdevelopers advised signicant supply chain cost increaseswithin the last 18 months, partly in response to new marketconditions as well as increased commodity prices In general,the mood o developers o UK oshore sites is more upbeatthan 18 months ago
With input rom the British Wind Energy Association (BWEA).
UK plANNING AvErAGES 2004-2007 2004 2005 2006 2007
Number o applications (MW) 2,934 2,709 2,330 1,022
Number o decisions (MW) 787 1,121 1,321 1,722
Number o approvals (MW) 613 695 838 1,070
Time to decision (months) 18 17 22 24
Approval rate (%) 82 71 67 62
year
MW

8/3/2019 03GWEC - Global Wind 2007
http://slidepdf.com/reader/full/03gwec-global-wind-2007 66/72
64 GWEC – GLOBAL WIND 2007 REPORT
Unite States
Wild Horse Wind Power Project, Kittitas County, Washington
© Power Climber Wind US win we suges 45% in 2007
The US wind energy industry shattered all previous recordsin 2007, installing 5,244 megawatts (MW) and expandingUS wind power generating capacity by 45%
US wind power capacity now stands at 16,818 MW andspans 34 states, with Texas clearly in the lead American windarms will generate an estimated 48 billion kilowatthours
(kWh) in 2008, just over 1% o US electricity supply Thecurrent US electricity mix consists o about 50 % coal, 20%nuclear, 20 % natural gas, 6 % hydropower, with the restgenerated rom oil and non-hydro renewables, according tothe US Energy Inormation Administration
Most interestingly, perhaps, is how quickly wind is growingas a share o current investment: new wind projects accountor about 30% o the entire new power-producing capacityadded in the US in 2007, establishing wind power as amainstream option or new electricity generation
2007 was the third consecutive year o record-settinggrowth, establishing wind power as one o the largest sourceso new electricity supply or the country This remarkable andaccelerating growth is driven by strong demand, avorableeconomics, and a period o welcome relie rom the on-again,o-again, boom-and-bust, cycle o the ederal production taxcredit (PTC) or wind power
But the PTC and tax incentives or other renewable energysources will expire at the end o 2008, and i an extension does
not occur early in the year, the US wind industry could seeinstallations plummet in 2009 Previously, when the credit wasnot extended well beore its expiration date, installations haveallen by 93% (2000), 73% (2002) and 77% (2004)
The US wind industry is urging Congress and the President toquickly extend the PTC—the primary US incentive or windpower—in order to sustain this remarkable growth along withthe manuacturing jobs, resh economic opportunities, andreduction o global warming pollution that it provides
The PTC provides a 2 cent-per-kilowatt-hour (kWh) tax creditor electricity generated with wind turbines over the rst
ten years o a project’s operations, and is a critical actor innancing new wind arms In order to qualiy, a wind armmust be completed and start generating power while thecredit is in place The energy sector is one o the most heavilysubsidized in the US economy, and this incentive is neededto help level the playing eld or wind and other renewableenergy sources
The industry is also calling or long-term support, including anational renewable electricity standard requiring that utilitiesgenerate more o their power rom renewable sources
Top TEN STATES by MEGAWATTS oF WINd poWEr GENErATINGCApACITy, AS oF 31 dECEMbEr 2007
State Existing Under
Construc-
tion
% o total
instal-
lations
(Existing)
Rank
(Existing)
Texas 4,35635 1,23828 259% 1
Caliornia 2,43883 45 145% 2
Minnesota 1,29975 464 77% 3
Iowa 1,27308 1167 76% 4
Washington 1,16318 1262 69% 5
Colorado 1,06675 0 63% 6
Oregon 88539 15 53% 7
Illinois 69936 1083 42% 8
Oklahoma 689 0 41% 9
New Mexico 49598 0 29% 10
Texas cnsiates ea
Texas again provided the lion’s share o new installationsin 2007 The state is in eect providing a model or whatcould happen at the national level in the country: it has avast wind resource, it has enacted a renewable electricityportolio standard that jump-started the wind power marketin the state, it has a large, competitive market that helpsremove barriers to market access or new technologies like
wind, and, most importantly perhaps today, it is resolving thetransmission challenge
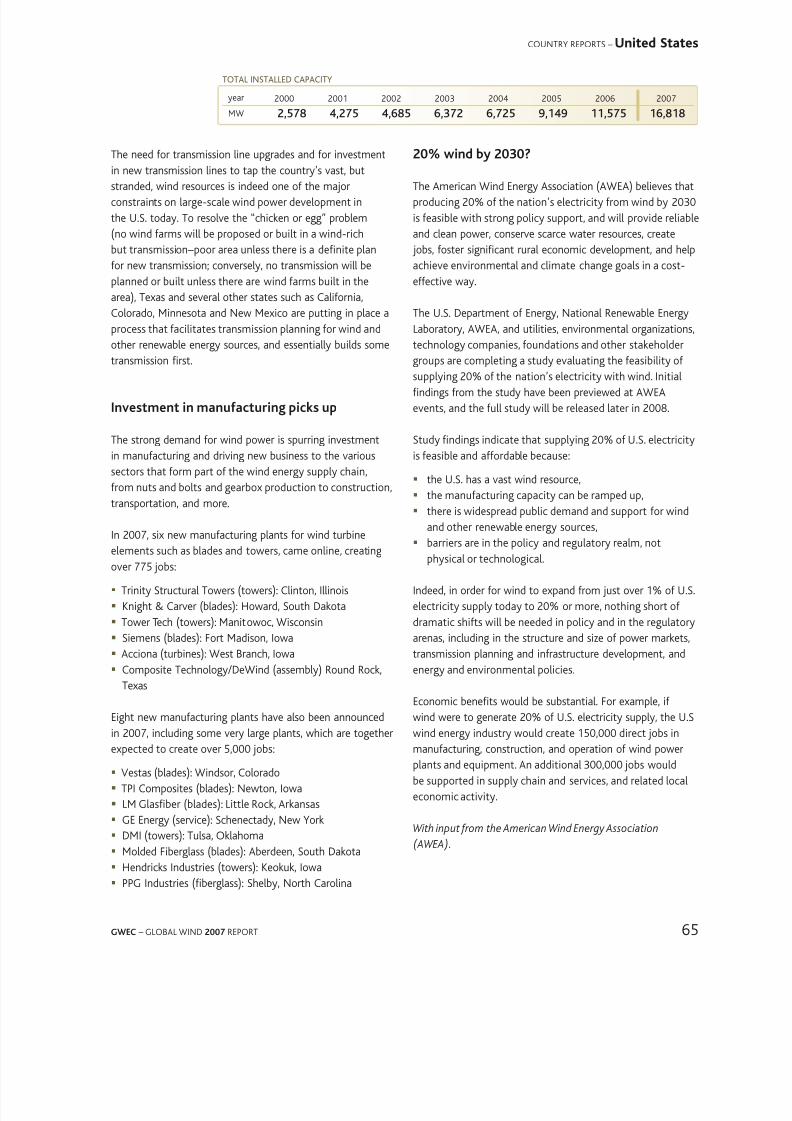
8/3/2019 03GWEC - Global Wind 2007
http://slidepdf.com/reader/full/03gwec-global-wind-2007 67/72
65GWEC – GLOBAL WIND 2007 REPORT
2000 2001 2002 2003 2004 2005 2006 2007
2,578 4,275 4,685 6,372 6,725 9,149 11,575 16,818
ToTal InsTalleD caPacITY
COUNTRY REPORTS – United States
The need or transmission line upgrades and or investment
in new transmission lines to tap the country’s vast, butstranded, wind resources is indeed one o the majorconstraints on large-scale wind power development inthe US today To resolve the “chicken or egg” problem(no wind arms will be proposed or built in a wind-richbut transmission–poor area unless there is a denite planor new transmission; conversely, no transmission will beplanned or built unless there are wind arms built in thearea), Texas and several other states such as Caliornia,Colorado, Minnesota and New Mexico are putting in place aprocess that acilitates transmission planning or wind and
other renewable energy sources, and essentially builds sometransmission rst
Inestment in manuactuing icks u
The strong demand or wind power is spurring investmentin manuacturing and driving new business to the varioussectors that orm part o the wind energy supply chain,rom nuts and bolts and gearbox production to construction,transportation, and more
In 2007, six new manuacturing plants or wind turbineelements such as blades and towers, came online, creatingover 775 jobs:
Trinity Structural Towers (towers): Clinton, Illinois Knight & Carver (blades): Howard, South Dakota Tower Tech (towers): Manitowoc, Wisconsin Siemens (blades): Fort Madison, Iowa Acciona (turbines): West Branch, Iowa Composite Technology/DeWind (assembly) Round Rock,
Texas
Eight new manuacturing plants have also been announcedin 2007, including some very large plants, which are togetherexpected to create over 5,000 jobs:
Vestas (blades): Windsor, Colorado TPI Composites (blades): Newton, Iowa LM Glasber (blades): Little Rock, Arkansas GE Energy (service): Schenectady, New York DMI (towers): Tulsa, Oklahoma Molded Fiberglass (blades): Aberdeen, South Dakota
Hendricks Industries (towers): Keokuk, Iowa PPG Industries (berglass): Shelby, North Carolina
20% win 2030?
The American Wind Energy Association (AWEA) believes thatproducing 20% o the nation’s electricity rom wind by 2030is easible with strong policy support, and will provide reliableand clean power, conserve scarce water resources, create jobs, oster signicant rural economic development, and helpachieve environmental and climate change goals in a cost-eective way
The US Department o Energy, National Renewable EnergyLaboratory, AWEA, and utilities, environmental organizations,
technology companies, oundations and other stakeholdergroups are completing a study evaluating the easibility osupplying 20% o the nation’s electricity with wind Initialndings rom the study have been previewed at AWEAevents, and the ull study will be released later in 2008
Study ndings indicate that supplying 20% o US electricityis easible and aordable because:
the US has a vast wind resource, the manuacturing capacity can be ramped up, there is widespread public demand and support or wind
and other renewable energy sources, barriers are in the policy and regulatory realm, not
physical or technological
Indeed, in order or wind to expand rom just over 1% o USelectricity supply today to 20% or more, nothing short odramatic shits will be needed in policy and in the regulatoryarenas, including in the structure and size o power markets,transmission planning and inrastructure development, andenergy and environmental policies
Economic benets would be substantial For example, iwind were to generate 20% o US electricity supply, the USwind energy industry would create 150,000 direct jobs inmanuacturing, construction, and operation o wind powerplants and equipment An additional 300,000 jobs wouldbe supported in supply chain and services, and related localeconomic activity
With input rom the American Wind Energy Association
(AWEA).
year
MW
8/3/2019 03GWEC - Global Wind 2007
http://slidepdf.com/reader/full/03gwec-global-wind-2007 68/72
66 GWEC – GLOBAL WIND 2007 REPORT
CnclusinThe Global Wind 2007 Report is a snapshot o the dynamicwind energy industry at a particular moment in time Likemost reports about this industry, by the time it is printed itwill be out o date In this case, the publication o the reportwill coincide roughly with the installation o the 100,000thmegawatt o clean, emissions-ree wind power, and we’reprojecting that we’ll reach the 200,000th MW by sometimein late 2011 But i the past is in act a guide to the uture,we will reach that next milestone well ahead o time
Prognostication is a dangerous business The ailure toreauthorize the US Production Tax Credit in the rst hal othis year, the global credit crisis and creeping recession orother unoreseen events will undoubtedly mean that we willcontinue to live in ‘interesting times’, in the Chinese sense,with rapid changes and discontinuities that no one couldpredict rom this vantage point
However, it is clear that wind energy has hit the mainstream,and that it is an increasingly mature and global industry,
destined to play a major role in meeting the electric powerneeds o a world undergoing rapid economic, social, politicaland environmental change
The actors are changing as well as the scenery There weremany ‘rsts’ in 2007: this was the rst year in decades thatthe majority o the annual installations o wind powerwere outside o Europe; at the same time, this was the rst year that wind power was the largest net supplier o newpower generating capacity in Europe This was the rst yearthat domestic Chinese turbine manuacturers supplied the
majority o turbines in the world’s most dynamic market;and it was the rst year in which the majority o the top tenowners o wind (including #s 1-3) were utilities
But wind power, just like any other orm o generation, isradically dependent upon the right policy rameworks; andthose policy rameworks are a refection o the desires ogovernments and energy planners at the time Just as thedrive or electrication in the early part o the last centurysaw the creation o government-unded hydroelectricprojects, and led to hundreds o billions o dollars per year
in subsidies or the ossil uel industry, all in search o cheapelectricity to power their rapid industrialization; just as the
victors o World War II, having unleashed the nuclear geniesought to tame it to their uses, spending untold billions todevelop electricity that would be ‘too cheap to meter’, sopolicymakers today are turning elsewhere
They increasingly seek energy sources that provide securityo supply, local industrial development and re-development,and or energy sources that avoid the ‘external’ costs opower generation, whether they be the costs o increased
health care, lost productivity and damage to ecosystemsand inrastructure through air pollution, or costs associatedwith the control and avoidance o that new commodity,‘carbon’, which is unique in that its value is in its absenceThey seek energy sources which decrease the vulnerabilityrom dependence upon imported uels, and which ease theeconomic insecurity when the engine o their economy isexposed to the wild swings and inexorable rise o ossil uelprices on international commodity markets
Wind power ts the bill in all cases
The next two years are critical or our energy uture Duringthis period, the EU will enact the legislation which enshrinesthe 20% by 2020 target into law, and along with it pledgeto reduce greenhouse gas emissions by 20%, 30%, or moreby that same deadline A new US administration will beunder immense pressure to not only grapple with limiting USgreenhouse gas emissions, but also to lend some long termstability to the ederal support measures or wind power andother renewable sources China’s wind industry will emergerom its dynamic local markets to become a major player
on the global stage Brazil, Mexico, Argentina and other LatinAmerican economies will make undamental energy choiceso their own in the ace o looming crises, and one or more othem may host the next major wind boom The same couldbe said o the Middle East/North Arica region
The backdrop to all o this will be the development andconclusion o the multilateral climate change negotiationsthat were begun in Bali last December, and which are set toconclude in Copenhagen at the end o 2009 While it is stillthe case that energy policy is largely determined nationally,
the global climate regime has begun to play a part, andthat role is set to increase dramatically as the world agrees
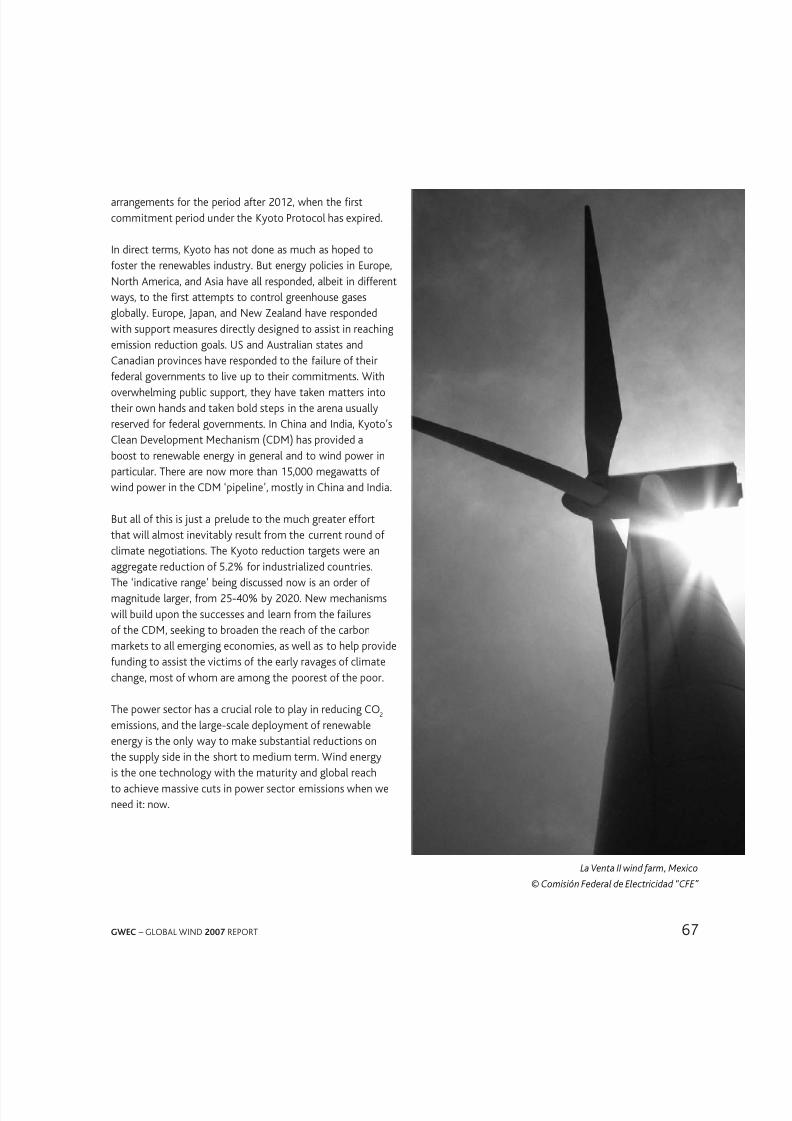
8/3/2019 03GWEC - Global Wind 2007
http://slidepdf.com/reader/full/03gwec-global-wind-2007 69/72
67GWEC – GLOBAL WIND 2007 REPORT
arrangements or the period ater 2012, when the rstcommitment period under the Kyoto Protocol has expired
In direct terms, Kyoto has not done as much as hoped tooster the renewables industry But energy policies in Europe,North America, and Asia have all responded, albeit in dierentways, to the rst attempts to control greenhouse gasesglobally Europe, Japan, and New Zealand have respondedwith support measures directly designed to assist in reaching
emission reduction goals US and Australian states andCanadian provinces have responded to the ailure o theirederal governments to live up to their commitments Withoverwhelming public support, they have taken matters intotheir own hands and taken bold steps in the arena usuallyreserved or ederal governments In China and India, Kyoto’sClean Development Mechanism (CDM) has provided aboost to renewable energy in general and to wind power inparticular There are now more than 15,000 megawatts owind power in the CDM ‘pipeline’, mostly in China and India
But all o this is just a prelude to the much greater eortthat will almost inevitably result rom the current round oclimate negotiations The Kyoto reduction targets were anaggregate reduction o 52% or industrialized countriesThe ‘indicative range’ being discussed now is an order omagnitude larger, rom 25-40% by 2020 New mechanismswill build upon the successes and learn rom the ailureso the CDM, seeking to broaden the reach o the carbonmarkets to all emerging economies, as well as to help provideunding to assist the victims o the early ravages o climatechange, most o whom are among the poorest o the poor
The power sector has a crucial role to play in reducing CO2
emissions, and the large-scale deployment o renewableenergy is the only way to make substantial reductions onthe supply side in the short to medium term Wind energyis the one technology with the maturity and global reachto achieve massive cuts in power sector emissions when weneed it: now
La Venta II wind arm, Mexico© Comisión Federal de Electricidad “CFE”

8/3/2019 03GWEC - Global Wind 2007
http://slidepdf.com/reader/full/03gwec-global-wind-2007 70/72
68 GWEC – GLOBAL WIND 2007 REPORT
Abut GWEC
GWEC brings together the major national and regionalassociations representing the wind energy sector, and theleading international wind energy companies and institutionsto provide a credible and representative orum or the entirewind energy sector at the international level
Our mission is to ensure that wind power establishes itsel
as one o the world’s leading energy sources, providingsubstantial environmental and economic benets Wepromote the development and growth o wind energyaround the world through:
Plicy evelpment
To participate in policy and regulatory orums that helpcreate rameworks or wind power development
Business leaership
To provide the strategic and business leadership needed to
engage external stakeholders
Glbal utreach
To work with emerging markets to transer know-how andstrengthen the development o wind energy world-wide
Inrmatin an eucatin
To serve as a platorm or providing quality inormation,expertise, analysis and data about wind energy
With a combined membership o over 1,500 organisationsinvolved in hardware manuacture, project development,power generation, nance and consultancy, as well asresearchers, academics and associations, GWEC’s membersrepresent the entire wind energy community The memberso GWEC represent:
Over 1,500 companies, organisations and institutions inmore than 60 countries
The world’s major wind turbine manuacturers
99 % o the world’s 94 GW o installed wind powercapacity
Join GWEC today
The Ga Win Eneg Cunci is the ice the ga win eneg sect

8/3/2019 03GWEC - Global Wind 2007
http://slidepdf.com/reader/full/03gwec-global-wind-2007 71/72
For more inormation, please contact:
Global Wind Energy CouncilRenewable Energy HouseRue d’Arlon 63-651040 BrusselsBelgium
Tel: +32 2 400 1029Fax: +32 2 546 1944
ino@gwecnetwwwgwecnet
Text edited by Angelika Pullen and Steve SawyerDesign by wwwinextremisbeCover photo courtesy o Vestas

8/3/2019 03GWEC - Global Wind 2007
http://slidepdf.com/reader/full/03gwec-global-wind-2007 72/72


![Module Handbook Master “Wind Engineering” · help Guide. Springer, 2007 Module Handbook - Master „Wind Engineering“ 6 Module number [2]: Global Wind industry and environmental](https://img.dokumen.tips/doc/110x75/5eaa6805c6c64676ff4bba1d/module-handbook-master-aoewind-engineeringa-help-guide-springer-2007-module.jpg)