Embed Size (px)
Citation preview
1
Status of Global Wind Power
World Energy Solutions ConferenceSao Paulo
23 November 2007
Steve SawyerSecretary General
Global Wind Energy Council

2
GWEC: Uniting the Global Wind Industry
Associations:
Companies:

3
Overview
• Massive investment in renewables globally; wind getting the lion’s share of asset investment;
• Wind power growth rate globally continues very strong – at the upper range (or above) projections;
• Industry becoming global – European dominance lessening
• Massive investment in new manufacturing capacity – China and the US - but supply still lags demand;
• Climate Imperative – eyes on 2020

4
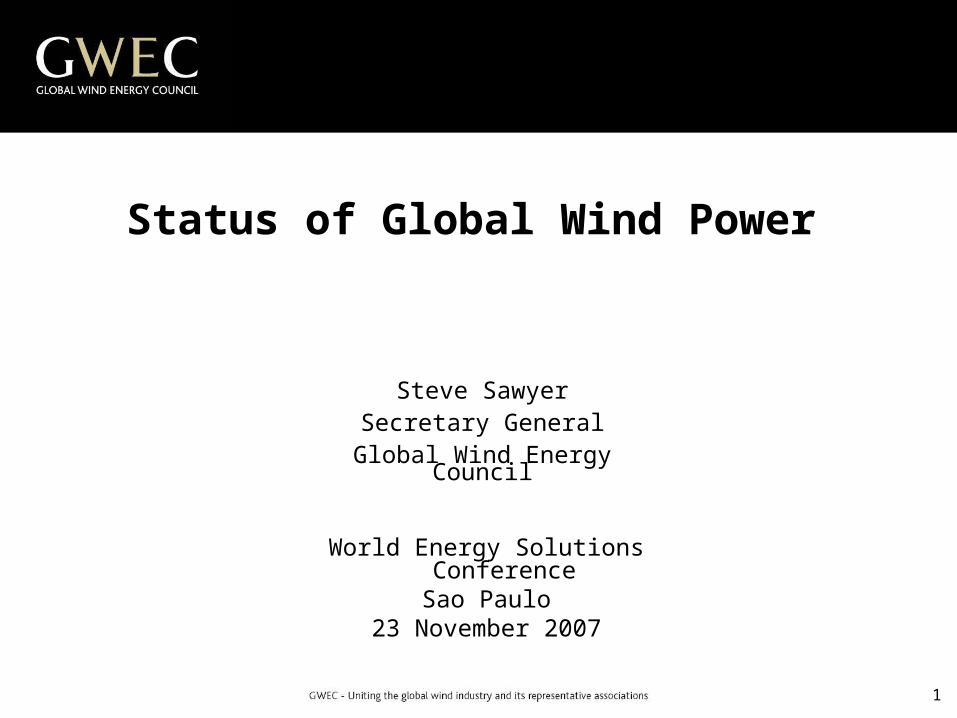
Global Cumulative Installed Capacity 1995-2006
5
Global Cumulative Installed Capacity 1995-2006
-> Growth in 2006: 25.6%
6
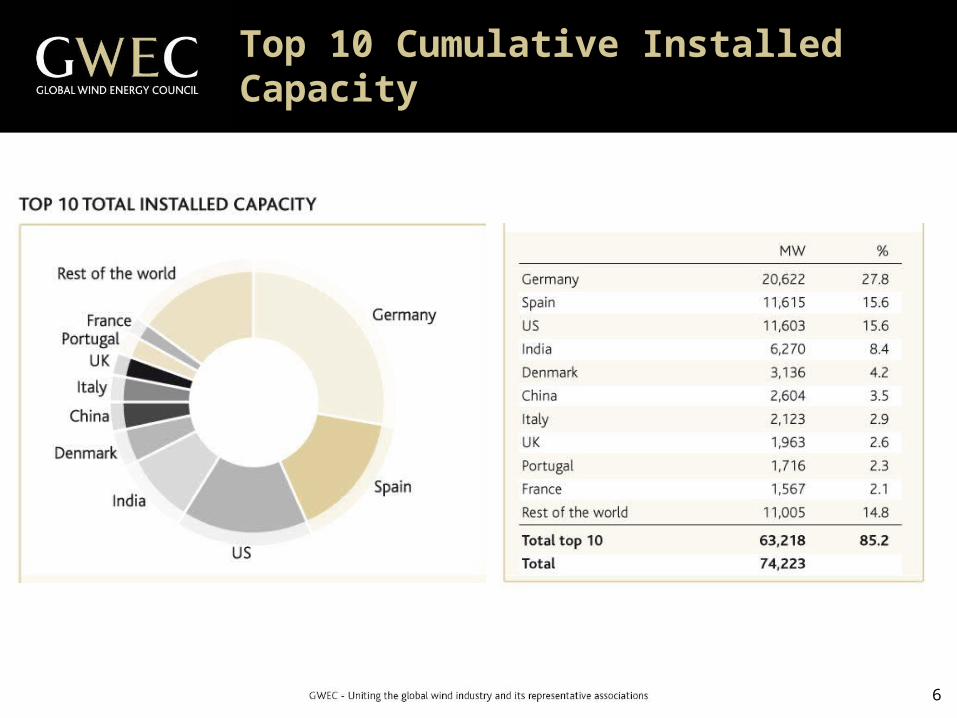
Top 10 Cumulative Installed Capacity

7
Top 10 Cumulative Installed Capacity
Spain and US neck and neck

8
Top 10 Cumulative Installed Capacity
Spain and US neck and neck
China on 6th place (up from
8th)
9
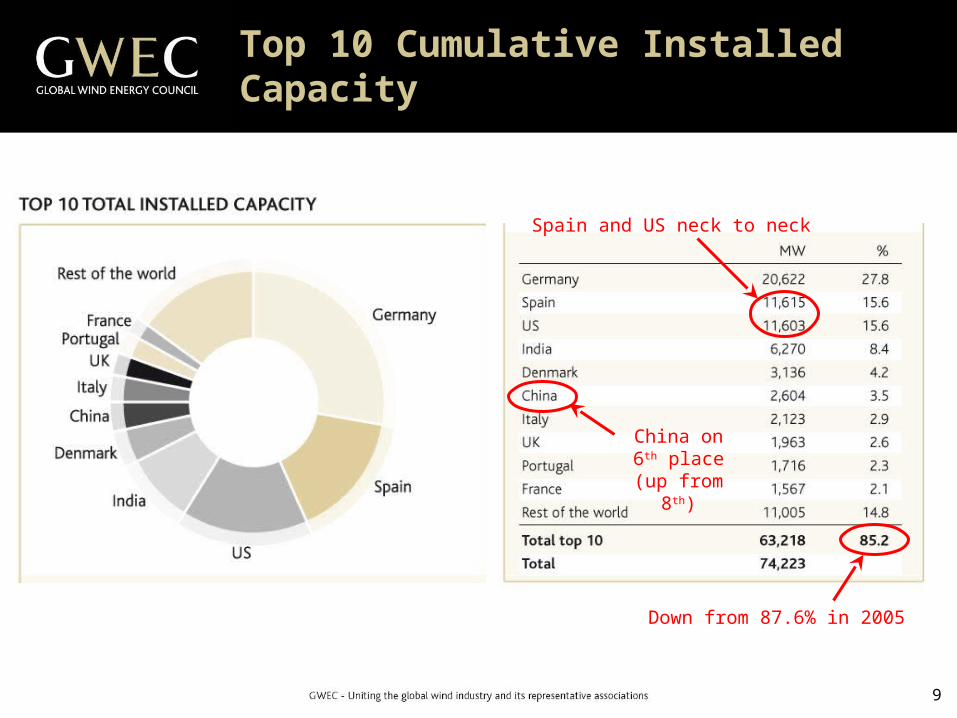
Top 10 Cumulative Installed Capacity
Down from 87.6% in 2005
Spain and US neck to neck
China on 6th place (up from
8th)

10
Global Annual Installed Capacity 1995-2006
11
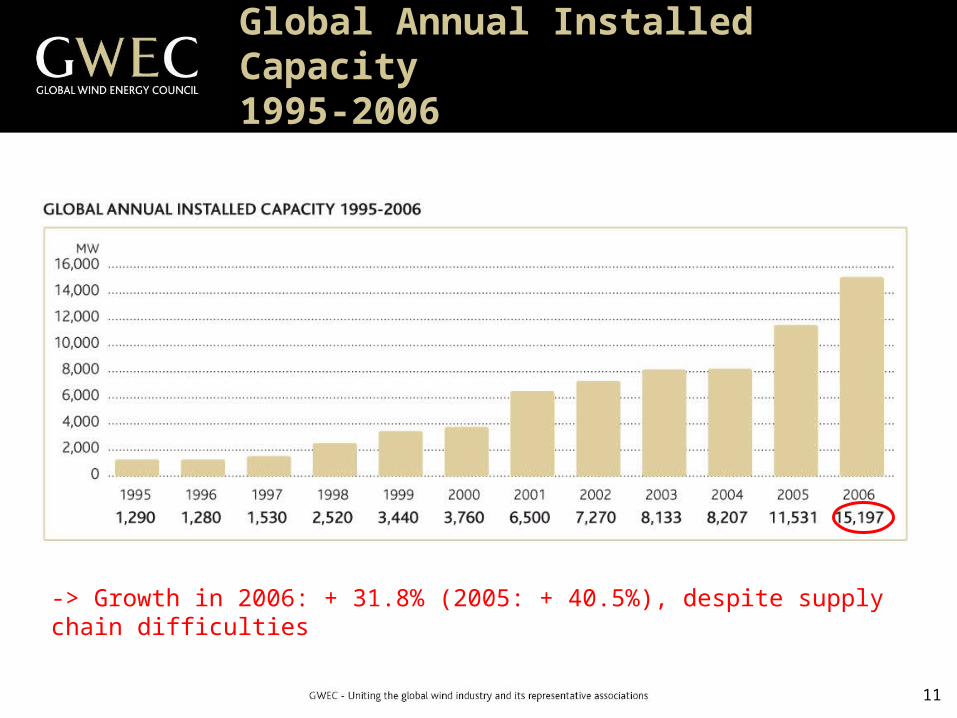
Global Annual Installed Capacity 1995-2006
-> Growth in 2006: + 31.8% (2005: + 40.5%), despite supply chain difficulties

12
Top 10 New Installed Capacity 2006

13
Top 10 New Installed Capacity 2006
New in top 10
China 2nd in 2007?
Down from 86.9% in 2005

14
Annual Installed Capacity by Region
50.1%
21.3%
1.9% 1.3% 0.7%
24.2%

15
Global Development to 2050

16
% of Global Electricity Supply
1500 million tonnes of CO2/annum
After 2 years, actual performance is ahead of
Advanced Scenario

17
Conclusions
• Advanced Scenario is closest to reality at the moment; 2006/07 ahead of advanced scenario;
• Growth rates since 2000 have averaged 28%.
• Capital costs: demand and commodity markets driving prices up…and will continue to as long as there’s very high demand and more investor interest than available projects;
• China and US becoming major markets – US firmly in place as market leader – expected to install 4 GW in 2007; China exceeding advanced scenario, will meet its 2010 target this year;
• Three dominant markets: China, US, Europe.
18
Conclusions (2)
Impact of Climate Policy:
• Imperative for global emissions peak prior to 2020;• Power sector is largest source of emissions - 38% of
CO2, and about 25% of overall emissions;• In practical terms, there are 3 options for making major
emissions reductions in the power sector out to 2020: Efficiency; Fuel switching from coal to gas; and Wind Power;
• Wind energy is most cost-effective and timely option on the supply side out to 2020;
• Post 2012 carbon market design will have major impact;• Will 2600 Twh/year be sufficient?