Embed Size (px)
Citation preview

Shamil Popat, Chris Curry, Tim Pike, Ciaran Ellis
Pensions Policy Institute – November 2015
www.pensionspolicyinstitute.org.uk
Modelling Collective Defined Contribution Schemes
1

Contents
Topic Slide Number
• Executive Summary 3
• Background / Introduction 6
• Modelling the long term 11
• Modelling the short term 19
• Summary of results 25
• Appendices 31
2

Executive Summary
3

Executive Summary
• The UK government has introduced legislation within the PensionsSchemes Act which will enable companies to provide pensions with anelement of risk sharing between members. The regulations required toenable these schemes to be set up has recently been delayed.
• Previous industry modelling has suggested that some of these schemes –and in particular Collective Defined Contribution (CDC) schemes – resultin better outcomes for members than traditional DC schemes. However,there has also been analysis using different models that suggest that theseout-performances are over-stated.
• The PPI has produced a bespoke CDC model to look at a potential CDCscheme under different assumptions, to determine whether CDCproduces better results compared to DC and in what circumstances.
• In the scenarios modelled, with the assumptions used, the PPI modelledCDC scheme produces better replacement rates compared to DC in allvariants assuming a mature scheme.
4Executive Summary

Executive Summary (cont.)
• In the long term, once the scheme is mature and the scheme population isstable, CDC produces better outcomes (a replacement rate of between27% and 30%) than DC (a replacement rate of between 12% and 21%,assuming a 10% contribution rate). The PPI modelled CDC scheme alsorequires a relatively low contribution rate to maintain these outcomes.
• In the short term, with no initial pre-funding (which is likely to be thecase for a new scheme), the benefits of the modelled CDC scheme aresimilar to that of a DC scheme with an aggressive drawdown (7% peryear). However, the modelled CDC scheme would be less likely to runout, and the outcomes are still higher than a DC scheme with an annuity.
• The modelled CDC scheme has a narrower distribution of outcomes thanDC.
• The width of the funding gates (the target funding level for the scheme)affects the volatility of outcomes, with a narrower gate increasing thevolatility.
• The median outcome is only very slightly affected by the width of thefunding gate. 5
Executive Summary

Background / Introduction
6

Background to CDC
• The UK government has introduced legislation within the PensionsSchemes Act which will enable companies to provide pensions with anelement of risk sharing between members.
• The legislation allows for the development of new structures offeringcollective benefits that allow for the pooling of investment, inflation andlongevity risks between members within a workplace pension structure,and allows for pensions in payment to fluctuate.
• CDC will be possible when regulations are made, although the date forthis has recently been postponed.
• Schemes offering collective benefits do already exist, or are indevelopment, in a number of other countries, including the Netherlands,Nordic countries and Canada.
7Background/Introduction

Previous CDC work
• In an Aon publication (Aon Hewitt (2013) The case for collective DC), thereport found that CDC produces outcomes ranging from a third higher toover double than that achieved from DC. This corroborated findings froman earlier report by the RSA (RSA (2013) Collective pensions in the UK II).
• However, in a Cardano and PPI roundtable with Dutch experts inDecember 20141, the benefit was calculated as 1% higher for CDCschemes compared to DC. There was also other disagreements on thebenefits of CDC based on the technique used to compare the results.
8
1 http://www.pensionspolicyinstitute.org.uk/event-reports/cardano-and-ppi-policy-seminar-the-dutch-experience-of-cdc-pensions-and-lessons-for-the-uk
Background/Introduction

Project Outline
• The DWP commissioned the PPI to:
Produce two Briefing Notes on the Dutch and Canadian (NewBrunswick) CDC systems and experiences.
Develop a CDC model (similar to the one created by Aon Hewitt(2013) The case for collective DC) to seek to independently replicate theapproach taken by Aon, and to test the results against a wider rangeof counterfactuals.
• The Briefing Notes were published in October 2014.
• This presentation outlines the results from the PPI modelling using PPI’sbespoke CDC model.
• Details of the PPI CDC model are given in Appendix 1.
9Background/Introduction

The PPI model
• All the findings in this report are based on a specific interpretation and aparticular design of CDC model. It is possible to design different modelsand use alternative assumptions that could lead to different outcomes.
• The PPI modelling is designed to give an indication of outcomes from aspecific modelled CDC scheme, but as it was designed to closely replicatethe Aon approach (which predated UK legislation) it does not match updirectly against the provisions of the Pension Schemes Act 2015.
• For example PPI have used funding gates to maintain the current fundingbalance in the scheme, whereas the legislation requires an actuary toassess the ability of the scheme to meet its target benefits within aprobability range.
10Background/Introduction

Modelling the long term
11

In the long term, with the assumptions used, the modelled CDC scheme produces better replacement rates compared to DC
• The models have been run on the assumption that the scheme is fullyfunded in the first year (as made in the Aon Hewitt model). This isrepresentative of a mature CDC scheme that has been in operation for anumber of years.
• For the CDC schemes modelled, with the assumptions used (Appendix2), the central outcome (with funding gates 90-110%) is a replacement rateof 29%. The range of replacement rates that were achieved for othervariants were between 27% and 30% (Appendix 3).
• Based on the assumptions used for the DC schemes modelled (Appendix4), the range of replacement rates achieved are between 12% and 21%(Appendix 5).
• For the CDC and DC schemes modelled, CDC produces betterreplacement rates.
12The long term

29%
18%14%
21%
12%
0%
10%
20%
30%
40%
CDC - FG 90-110% DC - Level Annuity at 65
DC - CPI Annuity at 65 DC - Drawdown - aggressive (7% per year)
DC - Drawdown - cautious (4% per year)
Re
pla
cem
en
t R
ate
sThe modelled CDC schemes deliver a higher replacement rate compared to DC
Median replacement rates in the first year after retirement based on different DCincomes invested in a lifestyle investment strategy compared the modelled CDCscheme
13The long term

The modelled CDC scheme has a narrower distribution of replacement rates compared to DC
• Modelled CDC schemes have a lower spread of outcomes compared toDC decumulation paths.
• The reason for this is a smoothing effect. For an individual in a DCscheme, a run of bad returns just before retirement heavily affects theirincome in retirement.
• For CDC, the funding gates allows it to absorb some of the bad returnsbefore cutting benefits. Also, the contributions being made each year canoffset some of the bad returns, whilst a retiree in a DC scheme stopsmaking contributions.
• This smoothing also means that in good return years, not all the benefitsare transferred to the retiree in CDC.
14The long term

0%
10%
20%
30%
40%
50%
0% 5% 10% 15% 20% 25% 30% 35% 40% 45% 50%
Replacement Rate first year after retirement
DC - Level Annuity at 65 DC - CPI Annuity at 65
DC - Drawdown - cautious DC - Drawdown - aggressive
CDC - FG 90-110%
Pro
po
rtio
n o
f m
em
bers
The distribution of outcomes is less spread for the modelled CDC scheme
Distribution of replacement rates for each variant in the first year of retirement
15The long term

The funding gate has minimal effect on the median replacement rate achieved from the modelled CDC schemes, but changes the volatility of outcomes
• Changing the funding gates in the CDC modelling does not change themedian outcome significantly (Appendix 6).
• By increasing the size of the funding gates, the narrower the distributionbecomes. This is caused by the extra smoothing that can occur. However,this means the funding level can move significantly below 100% andrelies much more on subsidisation by the younger cohort and also hopingthat future returns on assets will be positive enough to fill this gap.
• This model assumes a constant flow of new entrants. If this was not thecase, the volatility of the modelled CDC schemes may increase.
16The long term

0%
10%
20%
30%
40%
50%
60%
Replacement Rate first year after retirement
CDC - FG 90-110% CDC - FG 95-105% CDC - FG 75-125%
Pro
po
rtio
n o
f m
em
bers
Funding gates influence the distribution of outcomes
Distribution of replacement rates for each modelled CDC funding gate (FG) variant in the first year of retirement
17The long term

In the long run, a 10% contribution rate is sufficient to maintain the modelled CDC scheme
• In the long run, once the scheme has become mature, stable and fullyfunded, the 10% contribution rate is more than sufficient to achieve the1% accrual per year in this modelling.
• With an initial injection to ensure the scheme is running at a fully fundedlevel, in the model used, higher replacement rates can be achieved.
• The initial funding injection allows the CDC scheme to generate greaterincome from investment returns compared to a scheme where there is noinitial funding and the scheme is underfunded in the first few years.
• For a new CDC scheme without initial extra funding to provide forsmoothing, a higher contribution rate might be required to support a 1%accrual rate.
18The long term

Modelling the short term
19

An initial fully funded scheme is a very strong assumption
• The fully funded assumption may be more valid where, for example,significant assets are transferred from existing DB/DC schemes intoCDC, or where an initial capital injection is provided. However, this maynot be the case in the UK.
• To illustrate the importance of the fully funded assumption, the modelwas run with no initial funding, simulating the setting up of a new CDCscheme. Replacement rates were then generated over the same timeperiod as used in the fully funded variants.
• The median modelled CDC scheme replacement rate was 21% in thisscenario, which is equivalent to the aggressive DC drawdown strategy.However, the income from the modelled CDC scheme is less likely to runout during retirement and it has a narrower distribution of outcomes,meaning outcomes are more certain.
20The short term

The initial funding allows the CDC scheme to access extra accruals
• In the median scenario with no initial funding, the scheme is underfunded in the first few years, so the median proportion of CPI provided isless than 100% in those years.
• Having an initial 100% funded scheme allows the modelled CDC schemeto access extra accruals (larger absolute amounts generated by investmentreturns on the initial pre-funded assets) that would not be achievedwithout the funding injection. A modelled CDC scheme without thisinjection has a lower funding position, as the contributions are notsufficient to reach the same level and so is at greater risk of underfunding in the initial years. This has a large influence on the outcomesobtained by the modelled CDC scheme.
21The short term

Without an initial funding injection, the modelled CDC scheme is under funded on average in the short term
40%
50%
60%
70%
80%
90%
100%
1 2 3 4 5 6 7 8 9 10 11 12 13 14 15
Me
dia
n P
rop
ort
ion
of
CP
I
Years after reaching maturity
100% Funding Not Initial Funded
Median proportion of CPI provided each year once the mature population has been established for the initially fully funded and not initially funded CDC variants
• This chart shows that the modelled non initially funded CDC scheme takes8 years to become fully funded and provide full CPI increases.
• The fully funded scheme provides full CPI increases from the first year(caused by the 100% funded assumption)
22The short term

The ‘100% initial funding level’ causes unequal comparisons in the short term
• Without initial full funding, the modelled CDC scheme would require ahigher initial contribution rate to enable it to meet the targeted accrualrate. In the PPI model, this is a contribution rate of 14% (Appendix 7)compared to the 10% contribution rate over the long term. For a validcomparison with DC schemes, the same contribution rate should be usedin both types of schemes.
• Based on a 14% contribution rate for DC, modelled CDC outcomes arestill better in most cases but the benefits are slightly smaller. Theaggressive drawdown is the only DC decumulation pattern that producesoutcomes similar/better compared to modelled CDC, but this is morelikely to run out during retirement.
23The short term

29%26%
20%
30%
17%
0%
5%
10%
15%
20%
25%
30%
35%
CDC - FG 90-110% DC - Level Annuity at 65
DC - CPI Annuity at 65 DC - Drawdown - aggressive
DC - Drawdown - cautious
Re
pla
cem
en
t R
ate
sBased on a 14% contribution rate for DC schemes, the benefit of the modelled CDC scheme is reduced
Median replacement rates in the first year after retirement based on different DC incomes on a contribution rate equivalent to the 100% funded CDC scheme (14% contributions) compared to a modelled CDC scheme
24The short term

Summary of results
25

The design of the CDC scheme used in the PPI model allows it to achieve better outcomes
There are several design factors identified which can contribute to the modelled CDCscheme achieving better outcomes than DC:
• With drawdown, there are no future contributions after retirement and the amountleft to earn investment returns decreases. By contrast, in the modelled CDCscheme, returns can be earned on the whole asset pool aggregated acrossindividuals.
• As the returns on equities vary more than on gilts, in years of low equity returnspre-retirement the modelled CDC scheme is affected to a lesser extent than DC,which is 100% invested in equities pre-retirement.
• Post-retirement the modelled CDC schemes can remain invested in 60% equitiesand continue to benefit from the higher returns, while in DC drawdown schemes,funds are de-risked to reduce the equity exposure.
• In the modelled CDC scheme, assets taken by the retired cohort are being replacedby new entrants. In drawdown, the core asset amount is reducing, thus the returnon this amount is also reducing.
• The size of the modelled CDC schemes are large, with a mature population. Thismeans there can be cross subsidisation as the younger cohort fund the retired andcontinuous new entrants ensure the funding level is sufficient.
26Summary of results

The assumptions used in the CDC model are also responsible for the better outcomes
There are several assumptions which contribute to the modelled CDCscheme achieving better outcomes than DC:
• The CDC model responds to low return years by cutting the benefitspaid. With drawdown, a constant drawdown assumption is made, so inlow return years, drawdown will deplete at the same rate, reducingassets faster, thus reducing future returns.
• As only people aged over 40 are considered, the contributions receivedare significantly higher than those that would be received from youngermembers. Additionally, mortality is only considered after retirement sothese contributions are guaranteed in this model.
• If we assume the model is not fully funded in the first year, medianoutcomes are reduced. It would take a longer time to reach the sameoutcomes as a fully funded CDC scheme. The results are heavilydependent on what we assume the starting position to be.
27Summary of results

Summary of key findings
• In the scenarios modelled, with the assumptions used, the modelled CDCscheme produces at least equal or (in most cases) better replacement ratescompared to DC in all variants.
• In the long term, a modelled CDC scheme which is mature, large andfully funded may achieve a better replacement rate compared to DC. A10% contribution rate was also sufficient to maintain this scheme.
• In the short term, if there is no initial funding injection, the modelledCDC scheme can be underfunded. The replacement rate outcomes, afterthe same period of time as the fully funded modelled CDC scheme, arestill better than a CPI linked annuity and is similar to the outcomes ofaggressive drawdown. However, the CDC scheme does benefit comparedto drawdown in that it is less likely to run out so it can be considered tobe more secure.
28Summary of results

Further findings from the modelling
• With the same assumptions used for the modelled CDC and DC,modelled CDC outcomes are less spread compared to DC.
• The width of the modelled CDC funding gates affects the volatility ofoutcomes, with a narrower gate increasing the volatility.
• The median modelled CDC outcome is only very slightly affected by thewidth of the funding gate.
29Summary of results

Conclusions
• Based on the options modelled:
The modelled CDC scheme produced long-term outcomes ranging from 40% higher to over double that of the DC variants modelled compared to our central modelled CDC scenario (funding gate 90-110%).
But the size of the advantage depends on a number of assumption,including initial funding levels. In a model with no pre-funding, themodelled CDC scheme produces outcomes similar to an aggressivedrawdown. However, the modelled CDC scheme would be lesslikely to run out, and the outcomes are still higher than in a DCscheme with an annuity.
CDC produces less volatile outcomes than DC.
30Summary of results

Appendices
• Appendix 1 – CDC Model
• Appendix 2 – CDC assumptions and variations
• Appendix 3 – CDC replacement rates
• Appendix 4 – DC assumptions and variations
• Appendix 5 – DC replacement rates
• Appendix 6 – Funding gates
• Appendix 7 – Equivalent funding rates
• Appendix 8 – Outcome distribution
• Appendix 9 – Funding gates / outcome distribution
• Appendix 10 – Consistent investment strategies
• Appendix 11 – Mean base benefit cut
• Appendix 12 – AON Hewitt
31
Additional analysis,for information

CDC Model Flow
Mature PopulationEconomic Scenarios
Earning Distribution
10% Contributions 1% CARE Benefits Accrued Liabilities
Funding Level Check
Change Revaluation Target
Base Benefit Increase/Decrease
32Appendices
Appendix 1

The CDC Model
• In order to start the projection with a mature population, the model runsfrom 1958 to 2060, with 1000 new entrants each year. From 1958 to 2013,individuals from 40 to 65 accrue pension rights, thus by 2014 individualsfrom 65 to 96 are being paid pensions (individuals above age 96 make up1% of the retired population at this point and so the absence ofindividuals at these higher ages at the beginning of the projection isassumed to have little effect on the final outcomes).
• Scenarios are brought in from the “Economic Scenario Generator”, whichare fixed for all variants. It provides economic data for things such as CPI,Gilt yields, earnings, equity returns etc. for all future years. These vary byyear and for each scenario. Historical data is used for years before 2015.
• From 2014 onwards, liabilities are evaluated yearly and subjected to afunding check against the assets. Liabilities are valued at gilt yields andindexed at CPI.
• The model CDC scheme includes 10% contribution rate, and targets 1%CARE benefits (revalued at CPI).
33Appendices
Appendix 1

The CDC Model (cont.)
• The assets and liabilities are evaluated each year and the funding level isrequired to be between the upper and lower funding gates. The modelattempts to increase benefits by 100% of CPI at the start of the year. If thefunding level is too low, the liabilities are recalculated using differentrevaluation targets (CPI – 1% etc.).
• If the funding level is still too low, a lower revaluation target is soughtuntil the funding level is met. If the target falls to 0 revaluation, and thefunding level is still not met, then a percentage cut is made to the basebenefits. The new lower level of base benefits is the level which enablesthe funding criteria to be met.
• The base benefits are carried forward to the following year, i.e. the newbenefit level becomes the new normal.
• Replacement rates are output from the year 2039 to 2048.
34The Pensions Policy Institute is grateful for input from Gary Heslop of APR LLP.Appendices
Appendix 1
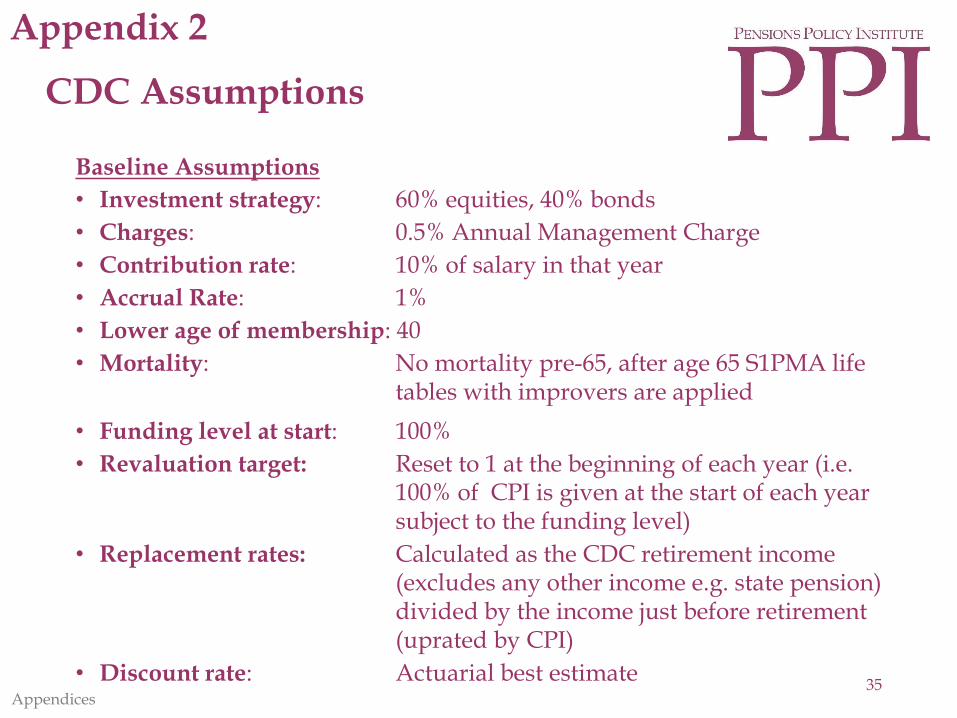
CDC Assumptions
Baseline Assumptions
• Investment strategy: 60% equities, 40% bonds
• Charges: 0.5% Annual Management Charge
• Contribution rate: 10% of salary in that year
• Accrual Rate: 1%
• Lower age of membership: 40
• Mortality: No mortality pre-65, after age 65 S1PMA life tables with improvers are applied
• Funding level at start: 100%
• Revaluation target: Reset to 1 at the beginning of each year (i.e. 100% of CPI is given at the start of each year subject to the funding level)
• Replacement rates: Calculated as the CDC retirement income (excludes any other income e.g. state pension) divided by the income just before retirement (uprated by CPI)
• Discount rate: Actuarial best estimate35
Appendices
Appendix 2

CDC Variants
Baseline: Funding gates 90-110%
Variants
• Variant 1: Funding gates 95-105%
• Variant 2: Funding gates 75-125%
• Variant 3: Funding gates 90-110%, 8% contributions
• Variant 4: Funding gates 90-110%, 5% contributions
• Variant 5: Funding gates 90-110%, 75% initial funding
• Variant 6: Aon comparison – this is a comparison to the results published by Aon Hewitt (Aon Hewitt (2013) The case for collective DC). The assumptions which have been changed, compared to our baseline assumptions, to match AON are:
• The revaluation target is not reset, it is carried over from theprevious year and works out the revaluation target fromthat point.
• Gilt discount rate.
• 90-110% funding gate.36
Appendices
Appendix 2

29% 29% 29% 29% 28% 27%30%
0%
5%
10%
15%
20%
25%
30%
35%
CDC - FG 90-110% CDC - FG 95-105% CDC - FG 75-125%
CDC - 8% Contrib FG 90-110% CDC - 5% Contrib FG 90-110% CDC - 75% Funded FG 90-110%
CDC - Aon
Re
pla
cem
ent
Ra
tes
CDC schemes can deliver a replacement rate between 27-30% in the first year of retirement with 10% contributions during working life
Median replacement rates for the first year after retirement based on different CDC assumptions
37Appendices
Appendix 3

DC Assumptions
• Investment strategy: Lifestyle glide-path (40% still saved inequities post-retirement for drawdownstrategies)
• Charges: 0.5% annual management charge
• Contribution rate: 10% of salary in that year
• Lower age of membership: 40
• Mortality: No mortality pre-65, after age 65 S1PMA lifetables with improvers are applied
• Replacement rates: Calculated as the DC retirement income (excludes any other income e.g. state pension) divided by the income just before retirement (uprated by CPI).
38Appendices
Appendix 4

DC Variants
Variants
• Level annuity at age 65
• CPI linked annuity at age 65 (annuity income increases by CPI)
• Aggressive drawdown (7%)
• Cautious drawdown (4%)
39Appendices
Appendix 4

18%
14%
21%
12%
0%
5%
10%
15%
20%
25%
DC - Level Annuity at 65 DC - CPI Annuity at 65
DC - Drawdown - aggressive DC - Drawdown - cautious
Re
pla
cem
en
t R
ate
sDC schemes can deliver a replacement rate between 12-21% in the first year of retirement with 10% contributions during working life
Median replacement rates in the first year after retirement based on different DCincomes invested in a lifestyle investment strategy
40Appendices
Appendix 5

The funding gate changes the distribution with minimal changes in outcomes
CDC -FG 90-110%
CDC -FG 95-105%
CDC -FG 75-125%
CDC –8% Contrib
CDC –5% Contrib
CDC –75% funded
CDC –Aon
MedianReplacement Rates 29.3% 29.3% 29.2% 28.8% 27.9% 27.2% 29.6%
Proportion of years
More than CPI Increase 25.0% 30.5% 18.0% 22.3% 18.4% 12.9% 49.0%
CPI Increase54.0% 42.2% 70.0% 53.8% 52.5% 50.9% 2.9%
Less than CPI Increase (including base benefit cuts) 21.0% 27.3% 12.0% 23.9% 29.1% 36.2% 48.0%
Mean Base Benefit cuts across all years 0.2% 0.2% 0.1% 0.3% 0.9% 0.7% 0.1%
41Appendices
Appendix 6

The contribution rate equivalent to a fully funded modelled CDC scheme has been calculated as 14%
• The contribution rate required for a non initially funded scheme in theshort term to meet the required accrual rate is higher compared to a fullyfunded scheme.
• The initial contribution rate required over the build up of a CDC schemebefore the membership becomes stable as a fully funded scheme (i.e. inthe short term) has been assessed at 14%
This is based upon the contribution required to be made by anindividual to fully meet their own pension liability at retirement (inthe same year that the funding injection is made).
The liability is calculated as the cost of a CPI linked annuity at theexpected accrued level.
The difference is due to the timing effect of the accruing of benefitsagainst the increase in earnings and investment returns.
42Appendices
Appendix 7

Distribution of outcomes with different assumptions
Replacement Rate
CDC -FG 90-110%
CDC -FG 95-105%
CDC -FG 75-125%
CDC –8% Contrib
CDC –5% Contrib
CDC –75% funded
CDC -AON
Less than 20% 1% 1% 1% 2% 6% 5% 2%
20-25% 15% 15% 11% 19% 24% 27% 15%
25-30% 40% 41% 49% 40% 38% 43% 36%
30-35% 29% 28% 28% 26% 23% 19% 31%
35-40% 11% 11% 9% 10% 7% 5% 12%
40%+ 4% 4% 2% 3% 2% 1% 4%
Distribution of replacement rates for the variants used in the modelling
43Appendices
Appendix 8

0%
10%
20%
30%
40%
50%
60%
Replacement Rate first year after retirement
CDC - FG 90-110% CDC - FG 95-105%CDC - FG 75-125% CDC - 8% Contrib FG 90-110%CDC - 5% Contrib FG 90-110% CDC - 75% Funded FG 90-110%CDC - Aon CDC - Not funded FG 90-110%
Pro
po
rtio
n o
f m
em
bers
Funding gates influence the distribution of outcomes
Distribution of replacement rates for each variant in the first year of retirement
Non initially funded CDC Scheme
44Appendices
Appendix 9

With the effect of different investment strategies removed, the CDC model outperforms DC to an even greater extent
• The modelled CDC schemes have 60% invested in equities and 40%invested in bonds throughout.
• DC schemes are assumed to follow a lifestyle glide path. Initially investedentirely in equities and de-risked approaching retirement to 40% inequities and 60% in bonds (which is maintained over any drawdownperiod).
• To remove the effect of different investment strategies, the DC schemeswere run using the same investment profile as the CDC schemes.
• The modelled CDC schemes further outperform DC if the sameinvestment strategy is used for the DC scheme.
45Appendices
Appendix 10

17%
13%
18%
11%
0%
5%
10%
15%
20%
DC - Level Annuity at 65 DC - CPI Annuity at 65
DC - Drawdown - aggressive DC - Drawdown - cautious
Re
pla
cem
en
t R
ate
sWith the effect of different investment strategies removed, the CDC model outperforms DC to an even greater extent
Median replacement rates in the first year after retirement based on different DC incomes on the same investment strategy as CDC
46Appendices
Appendix 10

Mean base benefit cuts
• In cases where reducing the amount of inflation given in that year is notsufficient to bring the funding level between the funding gates, the basebenefit is then cut i.e. benefits are cut more than inflation.
• The next slide shows the mean base benefit cut, when there is a cut to thebase benefit (i.e. excluding years where there is no cut).
• This is not directly comparable to the benefit cut shown in the tableshown previously. Appendix 7 shows the mean cut averaged over allyears (including those years with no benefit cut).
• The slide after the mean base benefit cut shows the proportion of CPIgiven for each year i.e. 100% means benefits were increased by 100% ofCPI. If it is less than 100%, then the full amount of CPI was not given,which means benefits did not increase in line with inflation.
47Appendices
Appendix 11

4.2% 4.2% 4.5% 4.2% 4.3% 4.2% 4.4%
0%
2%
4%
6%
8%
10%
CDC - FG 90-110% CDC - FG 95-105%CDC - FG 75-125% CDC - 8% Contrib FG 90-110%CDC - 5% Contrib FG 90-110% CDC - 75% Funded FG 90-110%CDC - Aon
Av
era
ge B
en
efi
t C
ut
The mean base benefit cut for years where there are cuts are all very similar in size
Mean real base benefit cut for each variant (when there is a benefit cut)
48Appendices
Appendix 11
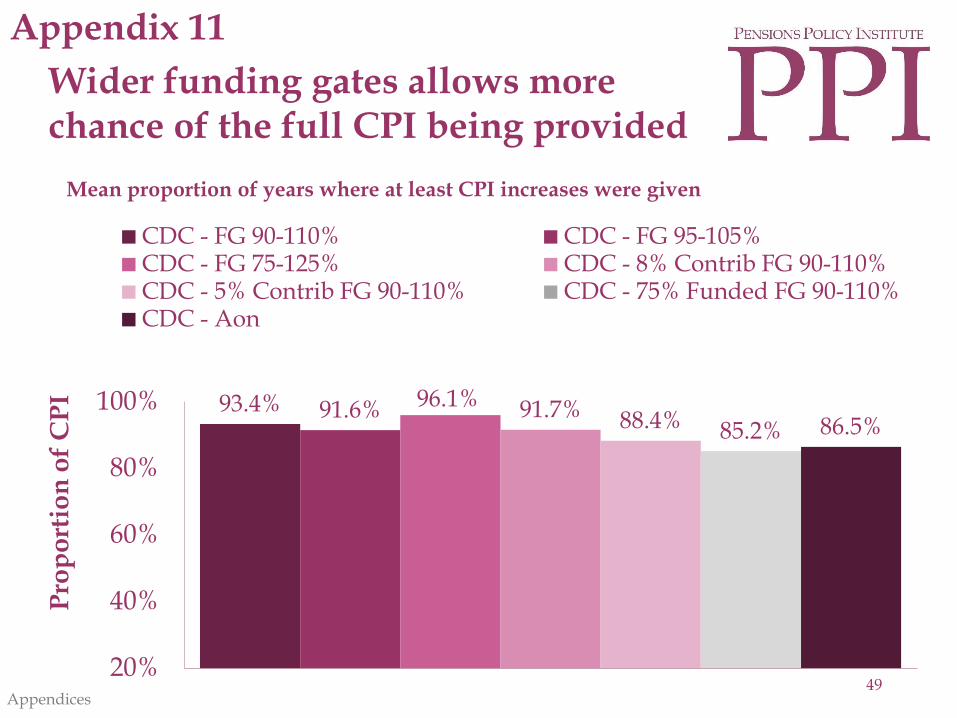
93.4% 91.6% 96.1% 91.7% 88.4% 85.2% 86.5%
20%
40%
60%
80%
100%
CDC - FG 90-110% CDC - FG 95-105%CDC - FG 75-125% CDC - 8% Contrib FG 90-110%CDC - 5% Contrib FG 90-110% CDC - 75% Funded FG 90-110%CDC - Aon
Pro
po
rtio
n o
f C
PI
Wider funding gates allows more chance of the full CPI being provided
Mean proportion of years where at least CPI increases were given
49Appendices
Appendix 11

The PPI model produces a similar replacement rate to Aon Hewitt when similar assumptions are used
• Chart 9 of the Aon published results looks at the median replacement ratewith a funding gate of 90-110% and with 60% of assets invested inequities and 40% in bonds (as with our simulations). The medianreplacement rate reported for their CDC simulation was 33% (AonHewitt (2013) The case for collective DC).
• When the assumptions are set similar to AON, the PPI’s model producesa median replacement rate of 29.6% in the first year of retirement.
• The other variants modelled have different results as liabilities arediscounted by an actuarial best estimate (which is higher than gilt yields).Also, in the PPI model, the revaluation target is reset to 100% every yearwhereas the AON version carries forward the revaluation target from theprevious year (i.e. if 50% of CPI was provided in the previous year, theAON model used 50% of CPI the next year as the starting point, whilstthe PPI model starts from 100% of CPI).
50Appendices
Appendix 12

CDC outperforms DC to a lesser extent compared to AON Hewitt’s reported results
• From the PPI model using the baseline assumptions, in the first year ofretirement CDC outcomes are at least 40% higher than DC. Aon includesa 50% contingent spouse pension in the DC and CDC schemes, which wehave not included.
• If we compare our CDC result against Aon’s reported median DClifestyle outcome (20%), CDC produces results approximately 48% higherthan DC. Aon found this result to be 66%.
51Appendices
Appendix 12