Embed Size (px)
Citation preview

ELECTRODE KINETICS OF A WATER VAPOR ELECTROLYSIS CELL
tel ¸
Final Report for the Period
August 15, 1971 - June 30, 1974 __)_7>_
National Aeronautics _and Space Administration
Grant # NGR-39-009-123
"= prepared by
Geoffrey Jacobs
ProJeGt Director
Alfred J..Engeli
July 1974
-i L_.
..... I: ['ICS OF A I17q'1']411_(NASA-CI<'I lu lh';) L.Lb,. I{ODZ i<kN_/,_l,t.l¢ V,_l,)}_ .-I.:']L/I'I_OL_;J[;] tl'_[ I. t'iiL_i
(p,,!_h.,yiV,l:,l,_ S_ It._ univ.) 157 !: liCcstL 10;_ t;J/(J ] li_t(-I<'+<l %
00000001
https://ntrs.nasa.gov/search.jsp?R=19740021301 2018-07-16T00:11:01+00:00Z

TABLE OF ONIJ,NIb
t , . ,LIST Ol" F,.GURES .........
,iIAST OF 'I'_h_IES ...... v_l
I. SUM_L_RY....... 1,% J
il, INTRODUCTION ......... 3
I]I, STATEblENT OF PROBLEM ......... 5
IV. ELECTROCHEMICAL THEORY OF GENERALIZED REACTION Ox+ ne = Red 7
A. A Thermodynamic and Equilibrium Relationship . . /
i- i. Kinetle and Non-Equilibrium Potentials. . . 9
B. Hass Transfer P/ocesses ....... ii
I. Semi-infinite Linea_ Diilusion to a Plane Electrode ';
Surlace at Constant Voltage . . . . . 12
,, 2. Semi-infinite Linear Dilfusion to a Plane Elec.tzode:
Continuously Changing Voltage ........ , 16
'-- " 3, Orhe_ Mass T_ansier Cont_olled Systems ....... 18L -
' _._ C, Electron Trans£e_ Cont_olled Processes , • 20
). D, Othe[ Factors Iniluenclng Current-Voltage Relaticnsb1[. 24
], Reaction Over voltage .... 2a
'i1_._2.,i 2. C_ystallizat ion Over vol_ age ...... 25I
'!" I E, Othe_ Sou_e_- ot Potential Â)i/£e_ences ..... 26
1. Elect_Ical Double l,ayel: ....... 26
',: 2. Oh ¢r,t( Drop .......... 21]
I -" 3- L.q.,ld-l, iquld l'otentials. , . 28
' V. LITERATURE SEARCH OF WAIER VAPOR EI.ECTROLYSIS RE_CrLON 3z
i
: " A General ........... 32
00000001-TSA03

- lit
TABLE OF CONTENTS (Continued)
B, Oxygen Electrode at Rest . . 33
I. Oxides ..... 33
2, Adsorbed Oxygen Films. , 35
3. Mixed Potential Theory . 38
4. Conclusions ...... 40
C. Anodlc Evolution of Oxygen 40
i, Effects of pH and Adsorbed Ions, 42
D. Cathodic Reduction of Oxygen , 46
E. Anodic _volution of 0 2 in Sulfuric Acid. 48
i. "Dependence of Oxygen-Evolutlon Overvoltage on Smooth
Platinum on the Sulfuric Acid Concentration." 48
2. "Electrolysis of Concentrated Sulfuric Acid Solutions
Using Tagged Oxygen.". • • 50-.#
_' 3. "Investigation of the Kinetics of'the Electro-
oxidation of Sulfuric Acid." 53
_ F. Ware_ Vapor Electrolysis on Platinum Electrode with an
Acid Gel Electrolyte .... 58
I. "Design and Development of a Water Vapor Electrolysis
Unit " 58• ooi_.t ..6
-_" 2. "A Water-Vapor Eleccrolysls Cell with Phosphoric Acid
I Electrolyte." ...... 61
3. "Cycled Operation of a Water Vapor Electrolysis
Cell '_ 66. • • . . . • a
VI, EXPERIMENTAL APPARATUS AND PROCEDURE ......... 73
A. Apparatus ............ 73
;_"_'_-_'_ i. Controlled Humld-Air Supp_ System ..... 74
2. Electrochemical Cell ........ 76
3. Electrochemical Measurement and Control .... 8[
00000001-TSA04

TABLE OF CONTENTS _Con¢luded)
B. General Procedure .... 83p.'
C. Automatic Potential and Current Control 84 _
VII. RESULTS AND DISCUSSION OF RESULTS ..... 86
4
A. Experimental Results and Discussion • 86
i. "Free Electrolyte" Resui£s .... 94 ,_
2, Standard Cell Results .... 98
3. Comparison of "Fzee Electrolyte" Results and Standard
Cell Results ......... 99
I B. Phys±cal and Electrochemical Implications of Experimental
Results ................. i01
i. Concentration Polarization. . , I01
2. IR Losses ....... 104
4. Adsorption ...... i07
5. O_gen Coverage .... iii
VIII. CONCLUSIONS AND RECOMMENDATIONS , . 119
IX. NOMENCLATURE ..... , ° . 121
X. BIBLIOGRAPHY ........ 124
A. Appendix A - Experimental Data 129
B. Appendlx B - Sample CalculatLons .... 147
_-
00000601-TSA05

- V -
LIST OF FIGURES
i. Variation of current ration i/i d with electcode
potential ................. 15 _
2. Current-potential curve with continuously changing
__ potentlal ............... 19
3. Electrieal double_l_er ...................... 25
4. Adsorption current-voltage behavior ...... 30
(a) Adsorption causlng constant current°
(b) Adsorption causing peak current.
5. Potentlal sweep obtained on P_ in 2_3 M H2SO4 at 25CCand a sweep rate of 0.5 V/sec ........... 37
6. Oxygen overvcltage on a Pt anode in 0.01 N H_SO.after cathodic and anodlc pre-electrolysis° ? 4 . 41
7. Oxygen overvoitage cur_,es on a bright Pt anode in 02 "*
saturated 2 N H2SO 4 .......... 43
8. Anod_c polarization curVeS on Pt in solutions of
HCIO 4 of various concentracions .... 45
9. Oxygen overvoltage curves of V,L. Khei£ets andI, ¥a, Rlvlin ........ 49
I0, Oxygen overvoltage curves of Kagancvlch. st,al. 52
ii. Oxygen overvoltage curves oi g A, E£imov and
N. A. Izgrayshev ......... 56
_._.._ 12. Electrode polarization characteristics in
[ 9.5 M H2SO 4 ............. 59
13, Curlent-voltage behavior in phosphoz_c acid • 65
14, Constant flow/humidity air supply . _ , 75
15. Disassembled wate_ vapoz electrolysis cell, 77
16, Standard cell, _eference electrode, and cathode
assembly ....... 78
17 Electrochemical measurement and contzol circuit , , 82
18, "Free Elect_olyte" Tafel plct, #i , , • 87
00000001-TSA06

i" - VI -
LISI Ol_ FICUI{ES (Concluded)
19. "F_ee Electrolyte" Tafel pl._t, #2 and _/3 . 88
20. Standard Cell Tafel plot, _/_ and #2 .... 89
21o Standard Cell Tafel plot, _/3 and #4. 90
22. Standard Cell Tafel plot, _/5 and #6 ..... 91
23_ Comparison of different Standazd Cells 92
24. Comparison of Standa=d Cell and "Free Electrolyte" 93
25. Watez absorptzon zaue on H2SO 4 at different gas flowrates .............. 149
L
{.
iI"i*J
I
I
00000001-TSA07

L.sr O_ TASLES
TXble Page
1, Potentials of platinum oxide couples . . . 3_
2, Oxygen evolution ei_iciency, ....... 51
3; Chara_tezis'::i_ constants 0£ water _apor elecerolysls ........5_ .......................
40 Voltage analysis for free liquid and liquld/matrix62 ,!,
cel_s ...........
5. Cyclic operation pc_ez consumption data . 68
6. Free Eleetroylte ~ Downward _can-Figure IB, #i. 130 '_
7, Free Elecrzoiyse - Upward-Scan-Figure 19, #2 • 132
%
-. 8o Free Eleetrol}te - Downward Scan-Figure 19, @3 134
9 Starda_d Cell - Upward Scan-F_gu[e 20, #i. 136
i0, Standard Cell - Downward Scan-Figure 2C, #2. 138
ii, Standard Cell - Downward Scan-Figure 21, #3. 140
12. Standard Cell - Upward Scan-Figure 21, #4. , 142
13 Standard Cell - Upward Scau-Figu=e 22, #5. . , 144i
_( 14. Standard Cell - Dc_n_wa_d Scan-_iguce 22, #6. 146
00000001-TSA08

I. SU_hMARY
An investigation of the anodic electrochemical behavior of the
water vapor electrolysis cell was undertaken. A theoretical review of
various aspects of cell overvoltage is presented with special emphasis
on concentration overvoltage and activation overvoltage. Other sources
of overvoltage are described in less detail. An understanding of these
electrochemical fundamentals is of primary importance.in explaining the
i experimental results of this work.The actual water vapor electrolysis cell consists of a bright
platinum a_ode screen immersed .in.a thick, viscous sulfuric acid silica
gel electrolyte. The cathode was a gray platinum screen and the refer-
ence electrode was a mercury-mercurous sulfate sleeve junction electrode.
A humid air stream flowed over the anode assembly, and water was absorbed
from the airstream by the high•concentration sulfuric acid. Although the
I major investigation was performed on th_s cell, results are compared to
the current-voltage results of a "fmee electrolyte" cell, using only
sulfuric acid as the electrolyte,
i The experimental apparatus controlled and measured anode
L[._ potential and eell current. Potentials between I.i0 and 2.60 V (vs NHE)
_(_- and currents between 0.i and 3000 mA were investigated. Different be-
i havior was observed betwe0n the standard cell and the "free electrolyte"
cell. The "free electrolyte" cell followed typical Tafel behavior (i.e.
activation overvoltage) with Tafel slopes of about 0.15, and the exchangeI
-__ current densiLies of 10-9 A/cm 2, both in good agreement with literature
values, l_e standard cell exhibited this same Tafel behavior at lower
current densities hut deviated toward lower than expected current
densities at higher potentials. This behavior and other results were
-I _ ii b I ....
l II d i i m,I
00000001-TSA09
- 2-
cx_nnined to determine their origin. After a one by one elimination of
possible explanations (e.g. concentration polarization, IR losses, and
adsorption), a theory of "oxygen entrapment" was shown to be compatible
with experimental results. This included the results of this work and
the results of others, especially Bloom's work (69) on cycled op6ratlon
(i,e. turning the cell "on," "off," 8nd "on" again). Considerable ..... ,_
indirect evidence is presented for proof of the "oxygen entrapment"
proposition which states that evolved oxygen is trapped on the electrode _
surface by the thick gel electrolyte and this reduces the area available
for electrolysis, Much of the diseusstion of this theory revolves
around the ease of removal of the trapped bubbles and the subsequent
changes in surface coverage.
Some limited direct evidence for the existence of trapped oxygen
,, is presented although it is not entirely conclusive. Reco_endatlons for
, future experiments suggest work on investigating the nature of the
trapped oxygen.
I - I I I rr II I I I I | I a ,.m
00000001-TSA10

4.
- 3 -
];, INTRODUCTION
Of the several oxygen producing life support systems investi-
gated by NASA_ tllewater vapor electrolysis cell still remains a strong
possibility for actual use in out.or space. The water vapor electrolysis
cell operates by absorbing water from a passing humid air stream and
electrolyzing the water into gaseous oxygen and hydrogen. The oxygen is
inhaled by astronauts and is excreted as water vapor by breathing and
perspiration, This water is subsequently electrolyzed again and the
cycle is complete. Recycle of oxygen avoids the necessity of storing
._ large quantities of oxygen for extended space flights.i .
The water vapor electrolysis cell is attractive from several
standpoints. Possibly the foremost advantage is its zero gravity
characteristic. By maimtalning the •electrolyte in the form of a thick,
viscous gel the cell can be used easily under zero gravity conditions.
I By using concentrated sulfuric acld in the gel, a gradient exists for!
tbe absorbtlon of water from a passing air stream.
The major disadvantage of the water vapor electrolysis cell is
its power requirement. At the present state of research, a small decrease
Ii_w+ in the power requirement would make the water vapor electrolysis cell
even mere attractive for actual use in outer space. Therefore, research
." directed at determining the major component of the cell overvoltage is
- of primary importance By identifying the nmjor source of power con-
sumption, reseerch can be directed toward improving that particular
=2._! aspect of Lhe cell. Previous studies (8, 13,14) have produced conflic-
ting results as to the major cause of the large reqmred c-ell veltagc.
Moreover, these studies have produced other snema_ous results regarding
ceil operation which must be explained In order te exactly desc[ibe the
II I I | III I I II _._ "
00000001-TSA11

- 4-
hehavJoi" of the water vapo1" electrolysis cell.
W1lereas previous work has primarily investigated tilephy,q|ct_l
behavior of the water vapor electrolysis cell (e,g, heat ,nn(lmass
transfer)) this work attempts to explain the eleetzochemleal behavior.
£
M,
I
I
O0000001-TSA12

5 -
]] i, WI'ATEMI_NTOF IH_OI_,I.EH
l?re_llous ._tad:le.q (8+ 13,i4) o[ Ihe water vapor eleet_roly_ls
cell have produced some contradictory and unexplained results, It was
the purpose of this thesis to investigate this ee.ll f_om an electro-
chemistry perspect.lve so that more understanding coold be given t-o
previous claims about the behavior of the cell. In particular, there
have been contradictory statements regarding the nature of the large
observed cell overvoltage, Some claim that this overvoltage is due to'! •
electrochemical kinetics. Others claim that the large observed over-
voltage is doe to mass transfer phenomena. It was the direct task of
the experimental work of tllia thesis to setLle this dispute, The
experimental analysis consists of measurement of cell eurren_ sad anode
potential. The nature of the cell's overvoltage is described by the
¢ relationship between curren_ and potential, as will be shown in thef! "Electrochemical Theory" section of this tbesls. Comparison of experi-I
mental results wlth literature _flndlngs further aids proper in_erpreta-
tlon of the experimental data.
Another _ask of this work was to apply the understanding of
i,_, _.... the electrochemical behavior of the water vapor electrolysis cell to
t other unexplained phenomena repo_ted in previous stud.e,_ Of foremost
-i .... concern was the unusual behavior of the r.ell observed by Bloom (69)
during cycled operation. Here, cycled operation of the cell is trrntog
the cell "on", then "off"_ then "on" again. Bloom obser_od that thi_
_--.,_ type of operation bad _ beneficial ef[ect on the power requirements of
:: tile cell. Hereo,,er, Blooln fe,sld that tbete we'e optimum values of tl_e
I_ontl and "off 't parameters, Marry t_tIior experimental observations fromL
previous studios were also kept in mind doting the work c,n tills the ¢ _.
L _ h
00000001-TSA13

'l'he_;eare too m_my to be described here, but will be described In dei:nl]
in tile"Discussion" section ef this work.
Finally, reeommendal'|on_ were to be. made as to wbat can be done
in future work to fully determine the behavior of the "later-vapor
electrelysis cell,
I
00000001-TSA14

IV. EI,E£1ROCIIEMICAL TIIEOhY OF THE GENEI_ALIZED REA6_ toN: Ox + ne _ R_d
C_ncept_ and equation; are devol_pL:d he_c J.,_rtbc genern]1_ed
fedoM electrochemical lec_c:tl,,nj cxtdlzed rofm _ s[oich.ometIie Uulnbcr OI
electrons = reduced forum (Ox + ne _ Red). rheae concepts and equations
can be used experlmentally to lnves£Jgate such Teaetions; in particulac,
the water vapor electrolysls teacticn will later be iavestlgated using
an understanding of the fundamentals presented here,
First, the thermodynamic and equilibrium =elationshlp_ a_e
• investigated and electrochemical kinetics are discussed. Finally, an
assortment o£ other factors are presented.
A. Thermodynamic and Equilibrium Relationships.
Consider the electrochemical reaction
aA + bB + ne = eC * dD [i]
where i is the stoichiometric number of moles of component I and n is
the total number of electrons involved in the reactlon. The Gibbs freeenergy change for the reaction is
I %ie d aAG = _G _ + RT in a CaD / a A i2]
i In the above equation
i AG change in Gibbs free energy to reaction, cal/moldue
_._ AG _= change in Gibbs free energy due to reaction withl
i all constituents in their standard states, cal/mol
R = gas law constant, 1.98 cal/mol - °K
T = absolute temperature, "K
1
aI = activity cf component i raised to the ith power.
Since tilereaetion takes place at an electrode su[tace_ the
activities of the reaction constituents are tbuse at the electrode
sulface.
00000001-TSB01

- g -
Tile Gibbs flee energy change as ret;_ted to the equllibrJom
potentlal I el the cell by:
where
_ _ eqailibrtum cell voltage, volt
n = numbec of equivalents o_ _eac_ants converted in the
_eaetion as written ""
F = Faraday constant, 23060 cal/volt-eqaivalent
nF = charge flow accompanymng reaction as w_itten,
coulomb (converted to ¢al/volt)
The equilibrium Fotential of the cell is, then
b)
_ = E° - R--_TnFin (ca_/ac a_ aB! [4]
where E° is the standard potential of the cell. The standard potential
;The dlf£erentlation made by Vetter (79) between three types
of equilibrium potentials will be adopted here.
i. Metal/fen potentials, created when ions of tilesame metal
are bouod to dit£erent llgands in two phases which are in
equillhtlum w_th each other, For example, copper ion bound
in copper metal and hydrated (or complexed in an electro-lyte, )
t potentials (oxidation-reduction potentials),2, Redox created
when the two phases e_change electrons with one another and
whereby the electrons of both phaees ate in equilibrium.
3. Donnan and membrane potentials, created % _en sevelal types
el ions, which may be in the same or different valence
states, are present in both phases; o! these at least onetype must be able to pass through tbe boundary (by mechan-
' ical means, vo(h as bonding by los-exchangers). Tile ,cns,E_l_' capable of passing l. rom one phase tc tile other must be
bound in the same mnnner _n beth phases riot example, they
must be hydrated in both phases).
Study ol tile_ote[ vapor eteetrolysls [eactlon invclves only
the use uf redox potentials.
' %.
00000001-TSB02

ts simply the equllibrsum potentla], when all activities are made unity,
For each electrode E° is a ehara.:te_i_tic standard potentlal which is
referenced to the normal hydrogen electrode (NHE), arbitrarily set at
0,0 volts. The above equation, co_nonly called the Nernst equation, was _)
thermodynamically derived, and is an expression el electrochemical
equilibrium.
The equilibrium cell potenuial is defined as the potential of
the cell when no net _urrent flows, i.e. he anodic and cathodic
currents identically compensate for each other. This state must be
attainable from both directions, a requirement analogous t_ that of
thermodynamic reversibility. This latter restriction takes care of the
case of extremely slow klneties where essentially no current flows in
either direction.
For a redox system the metal _lectrode acts only as a source
or sink of electrons, The metal electrode is therefore completely inert
mn the reaction sequence,
l. Kinetic and Non-Equilibrium Potentlals,
When a net curren_ flo_:s in an electrochemical cell, the
1
_,_ potential is dlfierent from the equil_btium potential (ire. when no net
I current i].ows). This difference, _-E_, is defined as the overvoltage.
There are several possible causes of the existence el _ p_.rtieulat
overvoltage. These can best be explained by examining the net processi
by which an electrochemical reaction occurs.
__-_ Consider the general _edex reaetlon:
Ox + ne = Red [5J
00000601-TSB03

- I0-
where Ox is the oxidized io_m of the electroactive species and Red is
tilereduced form For'lowing the simplified approach of Adams i2), this
reaction is actually composed of three consecutive 'individual processes:
(OX)bulk _rode[6]
'_ (OX)eleetrode 4he ->(Red)electrode [7]
4
(Red)electlode _(Red)bulk [8i
These equations actually represent a series of reaction steps.
The first equation is a mass transfer process and the second equation is
an electron or charge transfer process. These processes have finite
rates and determine the actual _eaction rate (l=e° current).
The mass transfer p_ocess can occur via three common _.
mechanisms: migration, convection, and dii£usion. The migration current
results from the force exerted on a charged parnicle by an electric field
I (e.g. negative ions being a=trac_ed re a positively charged electrode).I
In a large excess of supporting electrolyte, the migration current i_
negliglble.
Convection occurs as a result of nhetmal_ mechanical o_ other
- I!m_; disturbances. Common examples are stlrling, vibration, and density
I variations. Diffusion current occurs _hen the_e is a concentration
-- gradient ot the species which is being eeduced or oxidized.
i_--; Th£ electron or cha_ge transfer step is the electrochemical
_eaction itseli. The rate of electron transier is an exponential
_F__ tuuctiol, of tileapplied potential.
Overvoltage resulting from the mass tlansf(._ rate dete_mlnlngi
I process Is often called dilthslon Gf concentre,tlon evetvoltage, Ouec-
[
1 '
- O000000i-TSBOi

-- ll .-
,,oltageresulting from electron transfer as the rate determinlng process
is called activation overvoltage or charge transfer overvoltage.
Mass transfer and electron transfer processes will now be
discussed in detail The appropriate equations will be derived whereby
the important variables (i.e. current, voltage, concentration, and
temperature) are related,
B. Mass Transfer Processes "
If the rate of an electrochemical reaction is determined by the
rate of mass transfer to the electrode surface, this reaction is often
called reversible or Nernstian. This terminology results because the
Nernst equation applies to the cell conditions at the electrode surface,
i.e. the electron transfer is fast, hence electrochemical equilibrium is
established at the electrode surface, The actual current is limited by
how fast the oxidized or reduced species can reach the electrode surface.
#
t Mass transfer controlled processes ate sometimes referred t_ as reversibleI
processes. Conversely, a process which is controlled by electron
transfer and where the Nernst equation does not apply at the electrode
surface Ks often called an irreversible process. Charge transfer
I controlled processes therefore are sometimes referred to as irreversible
processes.
_n general, the particular equations which relate current,
voltage, concenrratfon_ etc. in mass transfer controlled processes
result from the partlcul_r mode of transport and the particular geometry
of the cell. In other words, the equatlons describing linear diffusion
to a spherical electrode are dlffere_t fro,n those describing hydrodynamic
transport past a wire electrode. Each particular ca_.e of mass Iran_p¢-_t
must be solved separately The case of semi-lnftnlte linear dilf,tsionI
:e{
O0000"O01_TgB05

-. ]2 -
to a plane electrode surface wll] he dlscrs,_;edhere in derail, Other
cases which have been solved will .be listed wlth references.
i. Seml-infinlte Linear Diffusion to a }'lane E]edtrode
Surface at Constant Voltase.
Consider the cathodic reduction
Ox + ne = Red [5]
where- the concentration of .the oxidized form in the bulk phase is Cbx._
Similarly CRed'b is the concentration of the reduced form in the bulk
phase.
According to Fick's second law, one can write
Cox (x,t) 8 Ix{8 COx (x,t)l,= -- DO [9]
for the oxidized form of the e]ectroactive species and
CRed(X,t) 8 DRed [8 CRed(X,t)"[-- . [10]'_ 8t 8x _ 8 x iI [ J
for the reduced form. In these equations x is the distance from theJ
electrode surface, _ is time, and Dox and DRe d are the diffusion
eeefflcients of the oxidized and reduced forms respectively- Tbe
diffusion coefficient is a function of concent_atlon and consequently
x, but in the presence of a large excess of..suppotting electrolyte the
diffusion coefficient, can be considered to be independent of x, Hence
, tile above eqtta_ions can be written
• _ Cox (x,t) 8_ Cox (x,t)= D [n]
8 t ox _ x2
'. [or the oxidized form An analogous expre._slon exists fat tbe reduced
[arm Two initial and two boundary conditions are required for solution
these equstlon_. The Initial conditions are: Cox(X,O)=Co_ b andO[
00000001-TSB06

- ]3-
CRe d (x,O) = 0 if the reduced £o_m is not p_esenn before electrolysis.
The first boundary condttlon is deLleed from the Nernst
- equation. Since electrochemical equilibrium is assumed at the electrode
surface,
Fox COx (O,t) IRT i,, [12]
-4 E = (_=) = E: *_-_ In [FRed CRed (O,t)J
where F's are.the activity coefficients,
The second boundary condition is derived from the conservation
of mass, i.e. one mole of the reduced form is produced by transformation
of a mole of the oxidized for_. The sum of the fluxes of the oxidized
and reduced forms at the surface is equal to zero_
I ] I ....Cox(X,t) 3 CRed(X,t) i
DOx _x ] x = 0 + DRed 8x J x = 0 = 0[13].t
Finally_ for semi-infinlte conditions,I
as x _ _ [14]" COx (x,t)+ Cb
and
CRe d (c,t)_ 0 as x _ _. [15]
i Solution for the concent_atlons of the oxidized and reduced
forms yields:
Ioo:,!_6+erf 1/'2 .I
COx (x,t) _ Cb 2 tOx 1 + _ ' [16]
' and _ erfc x 1/2 _l/2
i CRe d (x,t) = Cb 2 DRe d tOx " _ [17]
where
1/2_, _ = [Dox/DRed] [18]
00000001-TSB07

I !O = COx (0,t) FRe d nF, , --- exp |R--T(E-s°) I19]CRed (0, .) FOx ! ]
The most useful expressions of the above equations are thosei
which gi_e current (i,e. reaction rate) as some functLon of potential,
"7 ( or vice-_Tersa. Tbe above relationship lot the concentration profile of
the oxidized form can thus be transformed: _*'
Idi =
1 + _0 [20]
which, upon proper substitution is equivalent to the following
equation :
E = E° RT in Red[ (DOx RT id - i
In the above expressions i d is the maximum diffusion current
possible, i. e. when the concentration of the oxidized species at the
electrode surface is essentially equal to zero and the maximum concentra-
tion gradient exlsts. The current-voltage relationship for the reduction
•eaction is given graphically in Figure I.
Qualitatively in Flgute I one notices the exister_ee of a
f limiting current, id The limiting current is rea_'hed at potentials
I where the term
• DOx I/2 FOx nF
_0 = -- -- exp _¥ (E-E)DRed FRed
• becomes small. In other words, as the potential becomes more negative
with respect to the standard potentla], E , the (cathodic) reduction of
the oxidized species reaches a limiting (ratbodic) current The
c,ppostte holds true for the reverse (i e. o×[d[z_tion) roac,lon. The
cathodic ]|miting current ts directly proportional to the concentration
O0000001-TSB08

- _.5 M
"1"_
O0000001-TSB09

-. 16 ._
ol the (_xidized _oem; stmllaLly, the ,mo(h_: llmttlng cur_eu[ ts d[_ectly
proportional to the concentration of the _eduec.(?I_tm In genecnl, for
all dlfLusion controlled proc.esses_ the lim±tlng _.uI1ent is dL_ectly
p_oporLional to the bulk concentL_(ion of the elect_oactive species,
Note: [n Figure i, ehe current ratio 1/£ d is plotted'$ RT
-- $
•_,etsus El/2 + 2.3 nF.
El/2 is called the half-wave potential, as Equation 21 can
he rewritten
idR__r i
E = El/2 ¢ [22]nF in i
i_ The half-wave potential is defined as the potential at which
i = id/2, For many situations El/2 is a characteristic constant of a
particular system_ By naklng nhe second declvative of _he current-
vol2age equation El/2 can be shown to cor':'espond_o the Inliectlon point
oi the cu_ent-voltag_ equatlon_
Finally, many _edox _eac_ions a_e _'ep_esented by the form:
+
, Ox + _ * ne ._Red + Z H20_ _23]
In this case
• _"" ,/2
= E° + m RT _ IFNedi _Ox '1 [24]El/2 _ i_ aH e - _ In [Fox ][DEed _
I 2. Seml-lnflnlte L_o.ea_ Diffusion to a Plane Ele_t:ode;
Ccntlnuousl_ Chan_in_ Volta$_e
A constant voltage electrochemical p_ocess tefecs to a _teady
sta_e p_ocess, In parttee, depending on _he par_i(uls_ phys|cal
_._ p_ope_ties o_ the elect_oactlve species., steady state measurements can
be made while changlng the po_en[lal very slcw.[_ Julian o[_d Ruby (49)
found current-pot_nti_l cu_e_ lh agleemen_ with the constant voltage
O0000001-TSBIO-

-']7"-
equations derived above for sweep rates up to 40 mv/mln. This maximum
sweep rate was recommended for a p].atinum-wJl'e electrode in an unstlrred
solution.
One can obtain unsteady state behavlo_ by varying the voltage
at a constant rate such that41
E = Ei - vt [25]
where E. is the initial potential and v is the sweep rate In volts/min.1
j In practice if v is 200 mv/min or greater, unsteady state behavior will
be observed.
For the ea6e of semi-inflnite linear diffusion to a planeelectrode, equations can be derived similar to that obtained above for
the constant voltage case. Only important.results together with a _
qualitative description are presented here.
One finds that the current-potentlal curve reaches a maximum,i
l! current and then decreases. In the constant voltage case, recall thatI
the current reached a maxlmum value and maintained that value. In the
case of constantly changing potential a peak _lue of the current is
reached which is given by
_ " = 3/2 D I/2C b 1/2_ ..... ip k n A Ox Ox v [26]
I M_ere
i = peak current, ampe: P.....
A = area of electrode, cm
: : v = rate of potential change, V/min.
[_$_ k = Randles-Sevcik constant.
The important charac.terlstlcs of equation 26 are:
I. The peak current is proportional to the bulk concentraf(ou. _.
.)..
00006001-TSB11
13 ---
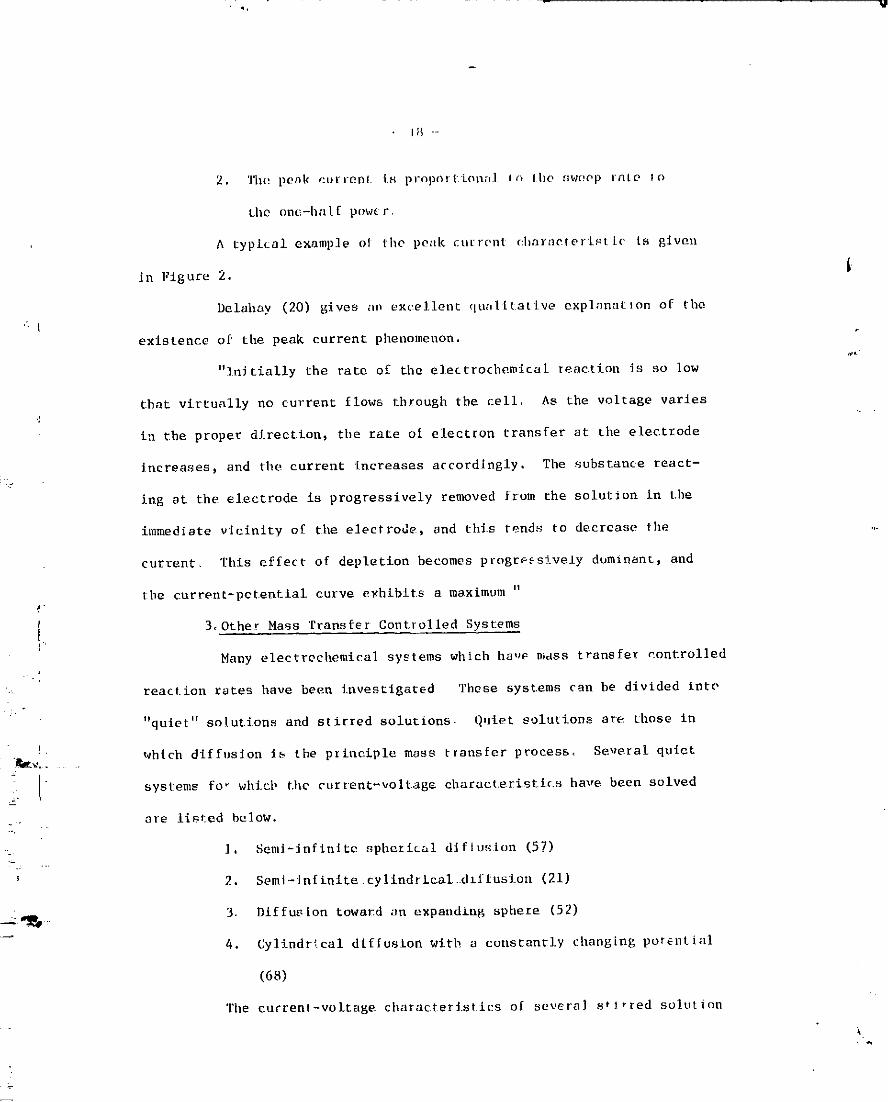
2, 'l'[n'+ po<++k ctJl+ieDl. Is proporti.enal In lhe +qwtmp F?ILO to
tJ+e one-half p,,w_ r,
A typical example of the peal++ CUFFOUI c:h;irae|er|.+t [(' ts given
Jn Figure 2. I
Delahay (20) gives ,no excellent qsalttatl.ve explanation of the.: {
existence of the peak current phenomenon.
"]tlJtially the rate of the electrochemical reae.tion is so low
that virtually no current flows through tbe cell, As the voltage varies
i,_ the proper direction, the rate of electron _ransfer st the electrode
increases_ and the current increases accordingly. The substance react-
ing at the electrode is progressively removed from the solution in the
immediate vlclnity of the electrode, and this tends to decrease the
eurrent_ This effect of depletion becomes progr*,=sively duminann, and
the current-pctential curve exhibits a maximum "
I 3+ Other Mass Transfer Cent,rolled SystemsI["
Many electreehemical systems which ha-e mass transfer controlledi
reaction rates have been I.nvestlga_ed rl'he_e syst.ems can be divided inte
"quiet" solut.ions and stirred solutions. Q,]iet solu[ions are those in
,_,_.j . which diffusion is the plinciple mass transfer process, Several quiet
I systems fo _ whicb the eurrent-volt.ag_ charaet.eristics haws been solved
. are list:ed below.
1. Send-infinlte spherical difiuslon (57)
2. Seml- Inf inite .ey lindr £_al ..drffusion (21)
_: 3. Diffusion toward un expand£ng sphere (52)
4. Cylindrleal diffusion with a constantly changing potential
(68)
Tile current-voltage characteristics of several s't_red solution
k
00000001-T$B12

- .I9 -
Current
r
lPotential
Figure 2. CURRENT-POTI'_NTIAL CURVE WITH CONTINUOUSLY CHANGING
POTENT [AL
00000001-TSB13

-- 2(1 -.
systen%s and syntems with moving clect_ode_ have been luvest_gated.
Some of these are ifsted below.
I. Rotating disc electrode in the case uf laminar
flow(59)
2. Plane electrode in the case of laminar flow (60)
3, Limiting currents for turbulent flow (61)
4_ Rotating wire electrode (78)
5. Rotating mercury electrode (58)
Electrochemical literature concerning stirred solutions is
replete with the concept of the Nernst diffusion layer Essentially,
th_sls a theory which proposes the existenee of a small stagnant
-3diffusion layer (order of 5 x l0 cm) at the electrode surface. A ._
linear concentration gradient of the electrosctive species is assumed
across the completely still diffusion layer. Both of these assumptions
have been shown to be grossly incorrect (7); nevertheless, the concept
of a diffusion layer proves to be a useful one. This concept (the
diffusion layer) can be used to predict the effect of speed of rotation
of the electrode and bulk concentration on the limiting current. The
t
,.i_-,, relationship between the limiting current and the speed of rotation is
I often given in the form:
iL = a rb [27]
where r is the speed of rotation (rpm) and a and b are constant.;
C. Electron Transfer Controlled Processes
:--_ If the kinetics of an electrochemical reaction are rate
determining then this is called an clot:iron or charge transfer process
The equ, itions governing this process a_c developed below.
t
O0000001-TSB14

"-21
'l'ileelecl,l:ocllolllJ-(;_l]redox ri.:_iciioD
Ox 4- ne = R_d [5]
i._ assumed to have I:_r_t order kinetJe._.
Itence
dNox dNRe d
:: - -'d[-- = kf,h COx "- at = kb,h CRed [2g]
whe ret,.r _
Nox = flux of oxidized species, moles/cm 2
NRed = flux of reduced species, moles/em 2
kf,h= forward heterogenous rate eonst.., em/sec.
kb,h= backward heterogeneous rate constk_ cm/see.
and COx, CRe d, and t have their usual significance.
The cathodic current is.obtained by multiplying the rate of
reduction of the oxidized form by the area- and-the charge required (toI
i reduce one mole. of the oxidlzed..fomn). Hence1' dNo_
ic _ -_dt (nF4) = kf,hCox (nFA), [29]
Similarly, one con write for the anedtc current:
dNRed
t = (nFh) = - CRe d (nFA). [30]a dt kb,h
_. The net current is simply the sum of the anodfc and cathodlf'
I currents :
-' i = l + i [311c a
ori
i = kf, h COx nFA - kb, h CRed nFA_ [321
"-'_"_*_ The rate constants are exponevttal functions of the applied
potential. These are given iP. Equations 3_ and 34 belo_:
q
kf,. I-:'--' i= R'r E 1331
00000001-TSC01

- 22 -
and
where kf°'a are the rate constants at E = O versus the normal hydrogen I,
electrode,
_-- { The postulate that the reaction is an exponential function el
the appl_ed potential was first formulated by Eyring (32) from the _'
absolute raaction rate theory. This postulate was further verified in
: a quantum theoretical treatment by Gerisher (30).
Alpha, _, is a constant called the transfer coefficient.
There. is considerable controversy over the physical significance of the
transfer coefficient. The.most common interpretation is that the
fraction of the potential _E favors the cathodic reduction reaction and
_he fraction (I-_)E favors the anodic oxidation reaction. Typical values
%1
f for _ are between. 0,15 and-0,65, most values of the transfer coefficienLIi befng close to 0.5,
.a
: : At the equilibrlum potential there is no net current and
hence,
1 kf, h COx nFA = _,h _ed DFA [35]
and " t to i _nF
Ef,h COx exp i- R-Y-"e = k_'b CRe d exp _£I RT
{36]
It is a simple matter to reduce this expression to a statement
of the Nernst equation, Note here that there are catbodlc and anodlc
currents at the equilibrium potential; however, the cathodic and anodlc
currents identically cancel each other, Tbe value oI the eathodlc ( or
anodic) current density at the equillbrlmn potential is called the ex-
00000001-TSC02

- 23 -
ohange current density, I. The relaklve magnitude of the exchange
current density is often used In ,letermine the :stalytic ac.tlvit.y of a
part'i.oular electrode material; the higher the aet_vtVy, the hJgher the
exchange current density.
A eemblnati_:n of equations yields the equation:
q I.
i = nFA ks, h_t COx exp - RT (E -£,.)|%
- CRed exp RT (E -J
where k is the standard mate constant ag the equ±llbrJum potential,sin
A still more carmen expression of the sufferer-voltage relationship is
' ii --l_ exp L_-_-- - exp I [381 _t
where n Is deflned as the over_oltage, i, e, I_= E - [.
4" TMs equation can be written In the following slmpllfled form:
[ -I = i_ (e -An _ eB q) [391i
where A and-g, are constant.n, It, Js easily seen that as F. varies in thei
- i
proper d_reetion one eomponevt of Eqn.39 (i-e, either /.as -An or t. e Bn )
becomes large whfle tba other , beeome_ small In general, if the potential
t 0.012m_'_;, is more that_ ----- volts different f:om the equilibrium potential the
n
I current will be either 99% cathedl.c or 99% anodic Therefore, at large
positive or uega_ive values of the o_,ervcltage_ r_ is a logatt.thmt(
function of i,
q = a + b log t [401
_ Such a plot of n velsus log ] Js known as a Tale} plot and b! Is known as the 'rafel slope In geDe-al, If a Tafe] ._lot (] e, a plot
I of T] vs log J which yiehls ;_ vttatght line) is obtained from __xperimental ."
data, then it can be concluded that tl:_ overvoltap=e is charge transfr"
• t-
00000001-TSC03

- 24 -
overvolta_e. Furthermore, extenslon of the Tafel line to q = 0 yields a
value of the exchange current density. Often the slope of the Tafcl line
is characteristlc of a certain type of mechani[m, e.g, _f b = ,12, tben
a one-electron transfer step is often assumed to be rate determln_ng.
The value of the Tafel slope also yields a value of the transfer coef-
ficient_ _,
Equation 40 is very important in electrochemical studies.
Tafel plots are powerful analytical tools for.determining the nature ofL .
_' electrochemical cell overvoltageso This type of plot is used extensively
in the analysis of the experimental .results presented in this thesis_
D. Other Factors Influencin_ Current-Voltase Relationship.
Unfortunately_ the world of electrochemistry is not governed J_
solely by the Nernst equation, diffusion overvoltage, and charge-
transfer overvoltage. There are many complicating factors which come
into play; some of these are more dominant under ee=tain conditions than
under other conditions. In many instances, these other factors can bet
safely overlooked. Nevertheless, it is necessa[> to understand what they
are. where they derive from, and hew significant they are, Tbese ot[ler
I factors include other sources ef ove_voltage and other sources of
I potential drop, These factors are discussed below in a less-than-
rigorous fashion.
1 Reaction Overvolta_e.
Reaction ovsrvoltage exlsts when a _epu;a_e chemical re-_tlon
is the _ate deterndning step in the overall electrochemical reaction,
In other words, _f an electroactive spedes must undergo a chemical
reaction whlch has a much smaller rate constant than the other partla7
rate p,'oeesses, (e.g. diffusion or electron transfer), then there exists
O0000001-TSC04

- 25 -
reaction overvoltage. By definition, a chemical reaetlon Is independent
of the applied cell petentlal.
Vetter (80) gives a quantitative expression fox the reaction
overvoltage:
RT' n = 771n a [41]
where 9 is the stoichiometric factor of tilereactant ,pecies being _.
produced or consumed by a particular partial electrode reaction, a is
! the activity of the substance an equilibrium. The activity, a(i), is •I,
the activity of the substance at any current density, i. Reaction over-
volatge is generally accompanied by diffusion since the activities ofi
the species are changing. However, the concurrent dif£usion overvoltage
is generally very small. In the literature, reaction overvoltage plus
difussion overvoltage is called concentration overvoltage.
A distinction is made between homogeneous and heterogeneousI! reaction overvoltage For a homogeneous rate-limiting step, the over-[.
, voltages will be independent of the properties and state of the electrode
surface. Conversely_ a heterogeneous chemical reaction process will be
highly dependent on the properties and grate, of the electrode surfa:e
In practice, the existence of s dominant reaction overvol_age
I _s rare, although there are definite cases where it does e_ist, e.g.
lINO_/lINO2redox electrode and the cathodic generation of hydrogen.
Although _eactJon overvoltage does not play a role in the study
of water va_or elertrolysis_ [t is nevertheless worthwhi]e fo be aware
_ _a_!7 of i_s existen,'e in th_s pre_en_allon of the general_zed ele_r:_c"-
chemical reac_ ion
2. _]ization Overvolta$_.
Since this paper deals almost ex<ioslvely wltb redox reactions,
M
00000601-TSC05

- 26-
no discussion of crystallization overvoltage is presented here, as It
occurs only at metal/Ion electrodes. Crystallization ove_voltage is
related to the dilficulEy in the inclusion or _elease oi! "ad-atoms"
into and from_ respectively, the lattice o_ the solid metal electrode.
Quantitative expressions of crystallization ovetvoltage have been de-
veloped and aze presented by Vetter (81)_ As in the case of _eactlon
overvoltage_ crystallization overvoltage plays no part in water vapor
electrolysis°
E. Other Sources of Potential Differences,
' i. Electrical Double .Layer.
At an electrode which is positively chargsd an adjacent layer
of negatively charged ions will form. This layer of ions is characterized
as compact or diffuse, depending on the relative concentration of ionic
. charge near the surface of the electrode. For any other negative ion
-- I diffusing or migrating to the positive electlode surface, a repulsive|
force will arise between the negative ion and the negatively chargedi
laye_ of ions. The existence oL the two layers (i.e° the positively
charged electrode surface and the surrounding layer el negatively charg-
ed ions) is called the electrical double layer. See Figure 3,
It
" + 0+ 0
* 0
0
_ + 0
Figure 3. ELECTRICAL DOUBLE LAYER .
4
O000()O01-TSC06

i
! --27 -
Tbc electrical double layer ]_ characterized by the double
layer capacitance, Cdl and the double layer zeta potential, _, Vetter (82)
_ . gives quantitative expression_ to evaluate.these parameters. Experi-
mental values of the double-laver capacity of brigbt platinum .lie
between-10 to 40 ljFlcm2. The act,ml value .depends on _he electrolyte,
its composltlon_ and the potential. It can be shown that for electro-
chemical cells operating at relatively large current densities (e,g.
> i0-_ A/cm2),. the effect of the.electrlcal double layer is negligible.
also, at high concentrations (e,g. _ i0-_ M) of the electroactive species_
the capacity current, i. e., due to the double layer can be neglected.
On the other hand, at low current densities one cannot neglect the double
layer. Because studies of water vapor electrolysis are carried out in
aqueous solutions (water being a concentrated electroactive species),
the effect of the double layer can be neglected. This is true even at
I low.current densities.
I
2. Ohmic Drop
"" ' The actual potential of a particular system includes the ohmic
drop due to the rasistanceof the cell and connections. The ohmic d{op
I is simply equal to the product of the total resistance aP.d the cell
I current. In general, the zeslstance of the cell and connections is of
the order of 100 ohms and the net contribution to the overall potential
drop can most often be neglected. Usually_ selection of a supporting
electrolyte of high concentration assures a minimal ohmic drop.
- ]1_enet potential drop, g is given simply byr_
Er = Ei + IR [42]
where E is the initial potential and R the total resistance. In
practice, however, the potential is often varied as a linear function
00000001-TSC07

28-
of time, rot where v is the sweep rate in _,olt_qnln. Since, the
current ).is a flmetion oi the potential, _, the actual potential
dependence on time can be complex if the ohmic drop Is not small,
Delahay gives an approximate mathematical interpretation (22).
At high currents_ when the contribution of ohmic drop is.L
signfficant_ current-voltage curves must be corrected to account for
this IR drop. A measureable [R d_op occured in the experimental work
of this- thesis and an analysis of the data includes corrections for these
ohmic losses.
3. Liquid - Lip_nid Potentials.
A common, eomplicatinB lector in electrolytic cells is the
potential diffecence which exists at the contact zone between two
different electrolytes. This is often the ease at the contact zone
between-the celt electrolyte _od the reference electrode 8olutJon.
I Th_s added potential d_fferen,_e must be taken into account, as it can
be Yelatively large, The pot.-"ntJalwhicb exists as described ab.'ve is
I called the liquid - liquid ju.lction potential, E .I-L
: The general expressicn for th_s potential is:
t_&'_; n _j ,2t.
I RT __l d In a. 143Ji EL_L = _-j _i zj ]
aj,l
where a. is the activity of the jth species in phase I_ t. is the--'_ I j,1 l
transference ntunber of the jr3 specles, and _.Is the charge number of the" J
"_i jth species. The transferenc_ is the fraction of current carried by the
, thJ species, 'l'._eexact solution of this equation depend_ on tbe par-
[icu]sr characteristics of ths diffuslon zone.
In the special ease cf a Itquld junction potent/el at
&
O00000"01-TSC08-

- 29 -
dlfferent concentrations o_ the same dissolved, species, _he above
equation'can'be-slmpllfied to give:
ii ZnzEL_ L = -_ Z in
_j aj,l [44]
This equation is commonly called the Henderson equation.
By placing a common ionic solution between two different
electrolytes, one can greatly reduce the magnitude of the liquid -
liquid Junction potential. This is frequently dene in practice by
insertion of a concentrated KCI solution "salt bridge" between the two
electrolytes. Vetter (83) gives the corresponding equations.
Awareness of the liquld - liquid potentfai influenced the
selection of a proper reference electrode for the experimental work of
this thesis. -Details of this particular problem are given later.
4. Adsorption.
Ralph Adam_ has written a recent text on the electro-
-_ chemistry of solid electrodes (i). In the preface o_ the text he writes,
"Also_ more important to the concept of the book, there is'no organized
treatment of adsorption phenomena. Critics may well ask,. WHow ... can
one write a book on solid electrodes and not adequately treat adsorption?'
.... Unlike some, I do not feel that adsorption is thef slngle, most
-. inlportant part of everx electrode reaction ... When adsorption processes
are better undemstmod, and particularly when their role _n the overall
electrode process can be assessed better, then these discussions can be
properly modified ..."
At this point in tlme_ reliable quantitative expressions of
the, effect of adsorption on current-voltage relationships are still non-
existent. In fact_ recent publicatlon_; (15_ 16) have shown that previous%,
00000001-TSC09

.. 30 -
Interpretations o[ adsorption phenomena at so]Ad electrodes are olteu
Ill-founded. Conway (16) bas concluded that in "complex anodic reactions
it seems, therefore, that the method (i,e. potential) sweep must be
applied with cauLion and that only qualitative o_ semi-quantltative
kinetic and coverage information can be derived.''}I
in general_ a current-voltage euzve will exhibit a leveling
off o£ the cu:rent at the potenLials whele adsorption is occurring on the
electrode. Depending on the magnlnude o£ the potential sweep rate,.a
"adsorption peaks" may even be descerned, Figure 4 gives typical ex-
amples of adsorption processes.
Adsorption processes generally scour at potentials preceding
the potentials at which the klnet±c currents occur. This is so because
the adsorbed intermediates often act as the new catalytic surface at
which the electrochemical reaction occurs.
II
(a) (b)
I
± l 'i
E -_ E�:
_. Adsorptlon causing constant Adso_ptlon causing peak
current current
Figure 4. ADSORPTION CURRENT-VOLTAGE BE|[AVIOR
00000001-TSCl 0

31 .-
The qoantitat!vo expressions wh[ch do exist are extremely
complex; _;'lleadsorption laye_ is characterized by its capacitance, LAd,
and the electrode surface is cl)aracterized by its frBctlonnl (:overage, 8.
Simple expressions do not exist to evaluate these properties. Conway (26) _'
glves quantitative expresslona, for what they are worth.¢.
S_nce an adequate theory of adsorption phenomena at electrodes ................. ;
does not exist, present practice is the individual interpretation of each
particular electrode process This is true in the case of the water vapor
electrolysis reaction and is an important part of the zelated discussion
which is presented later in thls thesis.
-!
¢
°
• L
O0000001-TSCl 1
~ 32 -
V. 1,f I 1.1_A]111_1SEAI_CII" (11,"TI,IE 14A'I'EI_VAPOI_ I._LI_CTI_;iI,VSIS I_I,_AC'I'IfIN
A, (;eneral,
The oxygen electrode has been the subject of much controversy
throughout its study. This is still true today, as Vetter (82) writes,'7
"The mechanism of the oxygen electrode is simply not clear at present,"i'
Nevertheless_ several aspec_-s of the oxygen electrode have been fruit-
fully studied, Some of these observations include:
i. The equilibrium potential is unattainable except under
very special conditions.
2, The evolution of oxygen occurs at high overvoltages.
3, The current-voltage characteristics are depende_,t on the
pre-treatmen_ of the electrode.
4. Oxides and adsorbed layers affect the current-voltage
relationship,
Determination of the actual mechanism of the oxygen electrode
has been the heart of most research on it,
'['hiswork investigates only the anod[c evolution of oxygen in
l_"_i concentrated (approx. 8M) sulfuric acid in a silica gel matrix at a
brite p]atint_ electrode. However, the observations of other conditions
• of the exygen electrode add much insight to the Inve_tigatfon of the
afore-nientioned system. Therefore, the oxygen electrode at re_ and tbe
_-_ lTile bulk of the materlal in _.his section is taken from the
excellent revlew of the oxygen electrode by J P. llea_e_ entitled
TheElectroc[lenlistrffl of Oxygen. Since this book was copyrighted in1968_ it was only necessary to search from 1968 to 1972 for ether
pertinent literature, lloare's basic format in explaining the o×yge.electrode is followed here.
7
#.
00000001-TSC12
- 33 "-
toduclloll of oxygt_n at'e alsc_ d.tscu,%sed below. Jn otdeJ: to shorten l:he
(]_&Ctlfl_l.Oll _;omew[lat_ Ollly Gb_iel'vabioe8 ai piagJllltm el_ctr<)dei_ tr, acid
solut.ions are presenLed.
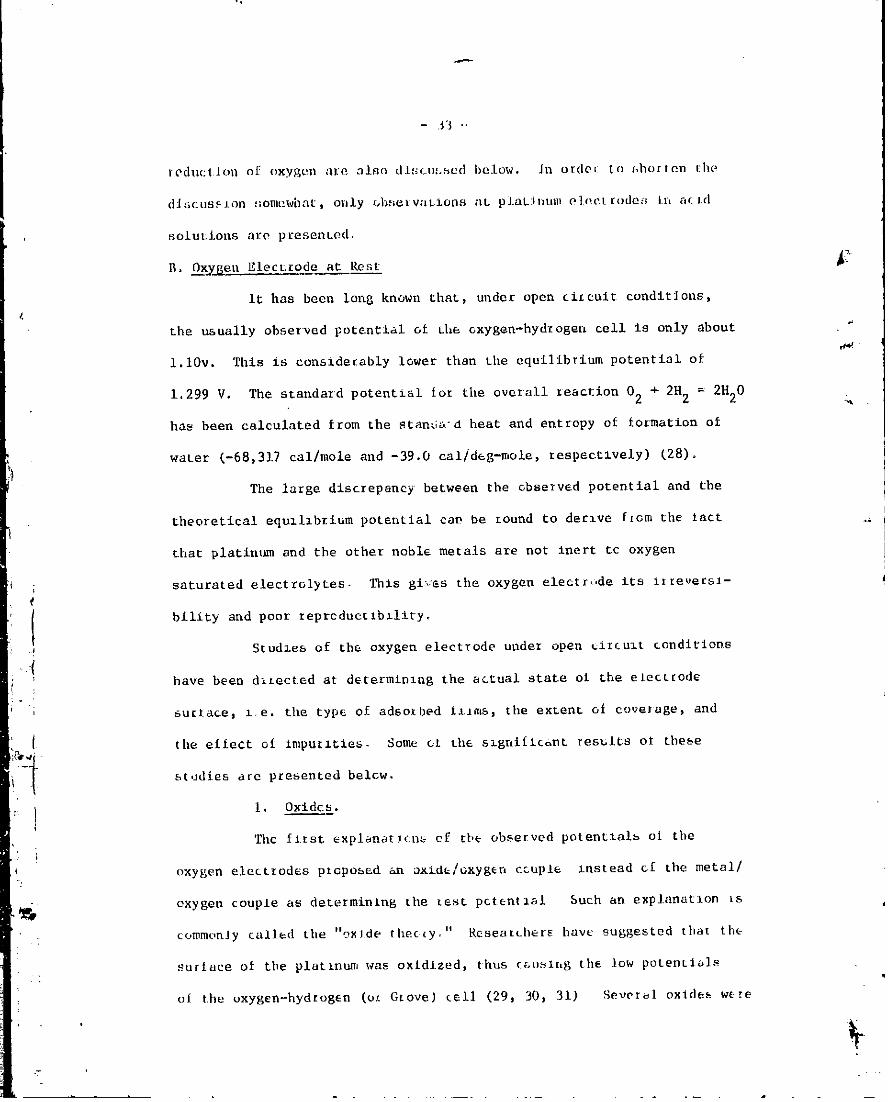
a:B° Oxygen glect._ode at Rest
it has been long known that, under open ciLcuit condlt_ons,
the usually observed potential o£ the oxygen-hydrogen cell is only about
i.lOv. This is consldeeably lower than tbe equilibrium potentlai of
1.299 V. The standard potential io_ tlle overall _eaction 02 + 2H 2 = 2H20
has been calculated from the standa'd heat and entropy of £o_mation o£
water (-68,317 cal/mole and -39.0 cal/deg-mole, respectively) (28).
The large dlscrepaney between the observed potential and the
theoretical equlllb_ium potential ca_ be round to derive from the tact ..
that platitude and the other noble metals are not inert tc oxygen
saturated electrolytes- This gi,:es the oxygen electr,.,de its l_te_ersl-
bility and poor zepreduct_bzlity.
Studies of the oxygen electrode under open circuzt cenditiops
:{
have been d_Lect.ed at determlnlng the actual state el the electrode
surface, i:e. the type of adsorbed £1Jms, the exnent el covetage, and
[ the eliect o£ imput_xe_. Some o_. the szgnl£1cant results o_ tbe_e
1, Oxides.
The first explanations cf _be observed potentlals oi the
oxygen electrodes pc=posed an oxide/oxygen couple instead cf the metal/
L_ oxygen couple as determinlng the test pctentlal Such an explanation ts
'" commonly called the "oxide theccy," Reseats_herE have suggested that the
sur/aee ot the platlnt_, was oxtdlzed, thus (&llsl[tg the low potentials
Vel the oxygen-hydrogen (o.,.Grove) cell (29, 30_ 31) Se et_l oxldea were
T
00000001-TSC13

- 34 -
Table 1
POTENTIALS OF PI,A[']NUbIOXIDE C()tlPI,I,:S
L._Imer
Lorenz Nagel (55)and and and
{ Electrode Spie imann Grube Dietz de Berhune Hoa_ecouple _ (33) (67) (18) , (45)
PL/Pt.-O 0.88 V
Pt/PLO 0.9 V
pt/Pt(OH)2 0.98 V 0 98 V
Pt/PtO.2H20 0.95 V 1.04 V
pt/Pt02.2H20 0,96 V
pt/Pt02.3H20 0_98 V
pt/Pt02o4H20 1.06 V
pt/PtO 3 1.5 V
pt/PtO 4 1,6 V
pt/Pt304 i°Ii V
p[(OH)2/Pt02 I.I V I.I V
n ........
-00000()01-TSC14

.. 35 -
sobsequenLly :talent:if led and the p¢:Lentials of the meta.|-metal oxide were
dotermil'Aod. These a'ce gi_e_ in Tab]e 1.
Foe_,,_ter (26) argued t.ha_ the open-circuit potentials wore the
result ol a combination of oxides, Pto ,x
The oxide theory is generally considered to be Inccrzect due
to the following observations:
I, Plateaus an the poten_lal-tlme curves can not be found "'
which correspond to any of the measured oxide potenti£1s (26).
• 2. Oxzdes of ocher noble metals (Pd, Au, Rh, Os, ir_ and Ru)
i had potentials which approached a common value with time,
instead of different values as one would expect wlth the
oxide theory (4).
2, Adsorbed Oxygen Films,
The technique o£ uslng constant current curves to investigate
the formation and reduction of adsorbed films on platlnum has been widely
I used. lloare (37) cites 33 papers on this technique. In general, it has
-_ been found that the adsorbed 16yet of oxygen is a monolaye_ of atom1(
oxygen (6). The thickness of the oxygen layer has been detetmlned by
I analysis el ehacglng cu_es (II, 73) and, more recentiy_ by elllpsomettit
i methods (69, 70).
I Constant current ch_tglng cut_ee yield Infcr_stion _n th_
number of coulombs required to Iorm a monolayer c_ oxygen, Qa_ and the
i- number of coulombs tcqulted to reduce 3t_ Q( It is _lways iound
experimentally that Qa . Q(. Slow chargang techniques (54) show r}lat
Qa . Qc, while fast rh_lglng technlques (I0) yleld Qa _ Qc AIc6_ about
20 cycles of anod_c and cathodic pclalizac_on in 8m HCIO between 5 and4
1.4 V, Feldb_rg, Enke, and B_icke[ (tO) ,epc_ed that QalQc approached a
-- - " - - O0ooo'oo'JITsDol-

- _;6 -
va]uc of l, whereas initially Q_/Q¢ = 2, iL is now generally accepted
that the reason Qa , Qc for last cha_ging techniques and for repeated
cycling is the dissolution oi oxygen iato nhe platinlm, metal itself_
Only a monolsyer exists on the surface; the feet is dissolved into the
body of the m_tal. Schuldiner and Warner (74) showed that with rapid
charging, only the adsorbed oxygen was measured to determine Qa and Qc,
on the other hand_ with slow charging both the oxygen dissolved in the
platinum and the adsorbed oxygen were measured. $1milazly, repeated
cyollng tends to saturate the platinum metal with oxygen; the equivalent
of several monolayels of oxygen can be dissolved in platinum metal before
it is saturated. Once it is saturated, only the adsorbed layer determines
Qa and Qc (dissolved oxygen is difficult to remove), hence, Qa = Qc
when the platinum metal is saturated. Thacker and Hoare (76) distinguish
between oxygen on the surface, dermasorbed oxygen (in the "skin" of the
metal), and oxygen absorbed into the bulk metal
Rapid potential sweep methods have also yielded information
about the nature ef the adsorbed f£1ms of oxygen_ A typleal curve (38)
[o_ the oxygen-hyd:ogen cell in acid solution is given in Figure 5.
The interpretation of this curve is as follows: oxygen
adsorption begins at about 0.85 V and oxygelt e%olutlon at about 1.4 V;
hydrogen peaks exist below 0,4 V. Note that the anodie and cathodic
peaks for hydrogen occur at the same potentials, implying a reversible
pro_ess. On the other hand, the cathodic sweep must proceed [urther
than the anodic oxygen adsorption potentlal to reduce the oxygen. This
indicates an activation ba_rie_ in the adsozptlon of oxygen, The same
p_inciple of oxygen dissolutlcn into the platlnum metal applies to east
potential sweeps as well as constant charging curves
00000001'TSD02-

I
_ 37-
00000"001-TSD03
- 38 -
Unfortunately fast triangular sweep curves are difficult to
interpret quant_tatlvely. Conway (15_ 16) points out that many of the
present interpretations of _apld potential sweep euLves a_e somewhat
incorrect because the capacitance of the adsorbed intermediates has e
complex effect on the current-voltage relationship. Furthermore, the
_ I eapaeltanoe is a function of the magnitude oI the potential sweep rate.
Hence, quantitative interpretations of rapid potential sweep eu_es are
suspect. Conway cautions that qualitative or semi-quantltatlve inter-
i prorations are all that can be made, based on the present state of the
knowledge of adsorbed intermediates.
Bockris and Huq (9) war6 able to maintain a complete
electronically conducting monolayer of oxygen on a platinum electrode.
The reversible potential was obtained for an hour in oxygen saturated
H2SO 4 solutions (.001N to 0.1N). Impurities were rigorously controlled.
This is especially important for the oxygen electrode because the
exchange current density, io, is very low (spprex. 10-9 A/cm2)_ Impurity
J
_'_ reactions could, therefore, be potentlal-de_ermining at poLentials below
the reversible potentlal (1.23V). Bockris and Huq calculated an impurity
level of less than IO-IIM fez their experiments, The platinum electrodes
were pre-treated to insure a complete monelayer of electronically
conducting oxygen. The electrodes were prepared fez two hours at 500_C
before plunging them into the pre-purifled, oxygen-saturated sulfulic
acid solutions. After about an hour, the potential dropped to lower
values.
3. Mixed Potential Theory.
The most widely held explanation of the low value el the rest
potential of the o_ygen electrode is the mixed potentlal theory 2_e
00000601-TSD04

- 39
prominen_ versions of what the combining _eactlons mlght be are
p_esented below, Others are given by Hoa_e (40),
Hoar (36) was the first to suggest a mxxed potential, mechanism.
He proposed that cracks exist _n an oxide surface film whereby oxygen is _
reduced and a platinum oxide is formed on the platinum surface, i. e. a
local cell is set up. By applying a eounte_ourrent o£ 2 x I0-7 A/cm2-
the reversible potential has been maintained. This countL[current is '_
equal to the local cell current.
A mixed potential theory of two zeamtlons occurzing at
different points on the surface of th_ electrode has been p_opoeed by
Lewartowicz (62). Hoare (39) suggests the 02/H20 reaction and a
Pt/Pt-0 _eaction:
+
Pt-O _ 2H + 2e = Pt _ H20 E_ = 0.88V. [45]
Pt-0 is a layer of adsorbed oxygen atoms (as opposed to Pt0_
I an oxide layer). (Further discussion of the oxidation of Pt is given
by Applehy (3)) Oxygen is reduced on the Pt0 slres_ and Pt-O sites
1 ate formed by reacting with water (Eqn.45). This should ultlma_ely
i produce a ¢omplete Pt-0 layer and the reversible petentlal_ 1.23V,
Ii would be obtained. However, Hoaze concludes that a complete Pt-O
laye_ _s unstable in acid solutlon_, hence some bare Pt sites alway_
[ exist. Therefore, the mlxsd potential of the 021H20 and Pt/Pt-0I
i reactions is determining. [Note that the mlxed potential, Em, mus[ lie
between the values of the two comblnlng potentlals).
The mlxed potential _an thus be used to explain the dependence
-- of the rest potential en the extent e_ surface coverage Th_s dependence
has been reported by several worke[s <I0, 31, 71) and Is a function o].
electrode pretreatment, Therefo[e, the mixed potent:a± thecty can also
k
00000001-TSD05

- 40 -
be u_ed to explain the dependence o[ the rest potantlal on electrode
pretreatment, Unfortunately, the_e £s little positive evidence for the
eKis_ence o_ a mixed potential at the oxygen electrode. It has not been
proven to exist nor has it been disproveno It can explain_ however_
the many anomalies of the oxygen electrode° The only positive evidence
thus far is that cathodic stripping measuremenLs have shown that the
maximum quantity of oxygen str±pped is l_ss than a complete monolayer_
This means that there must be some bare Pt si_es available=
4. Coneluslonso
In summary of the phenomena of the oxygen electrode at rest_
the following Important facts have been determlned:
i. The reverslble potential is attalnable only under
strict control of impurities.
2. The reversible potential Is attainable only when a
I complete adsorbed layer of Pt-0 exiets.
3o Oxygen is dissolved into massive platinum.
4, The existence of bare Pt si_es glves zlse to lowe_
rest potentials_
l C. Anodic Evolution o£ Qx_$en.
I o_ervoltage curves (i.e. log i vs. E) of oxygen ev_lutlon at
Pt electrodes a_e =ha_aete_ized by high oveLvoltages_ Unde_ ozdlns_y
conditions Tafel behavior begins at an eye,voltage of about 0 4V,
Between current densiLies of 10-6 A/cm 2 and 10-2 A/cm 2, a typical Ta_el
slope is 0.I0 to 0_13_ and the extrapolated exchange current density is
• about l0-9 A/cm 2 ior systems with controlled impu_Itle_. A typical plot
Is given below (9) in Figure 6
Note tha_ the Jnltlal potential sweep does not _ollow Tafel
00000001-TSD06

2.0 "
1.8
1.4
-10 -8 -6 -4 -2
• -log i (Alcm 2)
Flgute 6. OXYGEN OVERVOLTAGE ON APt ANUDE IN 0.01 N []_SO, AFTERCATHODIC AND ANODIC PRE-ELECTROLYS_S (A) increasing
current followed b_ (B) decreasing cuft_nt _llowed by
(C) Increasing cu_lent [ollowed by (D) decreasing turlent
_L
J
00000001-TSD07

- 42 -
behavlo_, ThLs is due to tile fact that the adsorbed monolayer of oKygen
is still being formed. Once it has been termed, the curves become
reproducible_
Hoare (41) points our that the anodic evolution of oxygen on
platinum is activation (or ¢ha_ge transfer) eont_olled because a Tafel
'_ region is observed and because _he eye,voltage, _, decreases as the
temperature increases, while the value of the Tafel slope remains the
same.
An oxygen overvoltage curve shows the changes in the surface
of the Pt electrode. Figure 7 below, is interpreted as follows (42).
In the region BC a limiting current i_ observed and is
considered to be the potential range where the Pt-0 film is being built
up. Oxygen evolution begins at point C and the £agion DE has been
Interpreted to represent a conversion of Pt-0 _o PrO 2 (desplte the{
i previous arguments against an oxide theory). At point E, a stable Pt-0
1 film has been formed and the subsequent EF region is _he Tafel _egion.
A slope of 0.14 is obtained and the exchange euzzen_ density, io, Ls
8,5 x 10⁻⁹ A/cm 2 in good agreement with c_he_ results.
I Although most workers believe that the rate dete_mlnlng step
I' is an electron t_ans_e_, the mechanlsm of the ox_d_tion o_ osygen (i.e.
evolution o_ oxyge_is still unknown Various facLo_e which affect th_
evolntlon of oxygen have been stud_ed to he]p date[mine the mechanism.
7Although these studies have not succeeded in pinning down a particula_
mechanism, they have been llluminatlng Some of _he tmpoltant aspects
of these studies are presented below
I, Effects el pH and AdsoLbed ions
I_ has been Jound (9) that on bzlght platinum, the overvoltage
i
00000001-TSD08

- 43 -
Potential i.5
vs NIIE
(volts)
B
_r .... 1. ]
I I I-6 -5 -4 -3
Log apparent current density (A/cm 2)
Figure 7. OXYGEN OVERVOLTAGE CURVES ON A BRIGHT
Pt ANODE IN 02- SATURATED 2N H2SO 4.
.e
m
(
00000001-TSD09
- 44 -
decrease;_ [oz the lower pll's but ±nc_ease_ In very strong acid sohLtlons.
As acid strength increases, the elfect J.sol.t.enclouded hy the adsorption
on ions and the presence of other reactions, in pat tlcular, high concentra-
tions of H2SO 4 [51) produce H2S208 and H2SO 5 and also cause an oxygen
exchange wz_h the water (29), whereas high cancentraClons of EIClO4 do not
exhibit these problems. In both cases, the anions (SO4= and CI04 ) are
rapidly adsorbed and an abrupt shift in the overvoltage curve is noticed.
An example of this is given in _£gut'e 8 (54)
Frumkin (28) found using HCIO 4 with tagged oxygen, 018 , that
018 did not exist in the lower Tafel region, but did exist in the upper
region. This behavior led him to conclude that CI04- ions are speci-
fically adsorbed° _.
- Two distinct Tafel legions separated by a limiting current
region were also found by Beck and Moulton (5). By showing that the
limiting current was identical on rotating and stationary electrodes,
they concluded that the process was nee di£fus_on controlled° The_,
- too, concluded that the break was due to the specific adsoLption ol
i . C104. At high current dens_tles o_he_ reactions weze found to o6¢u_,
_i_, namely
L,_ I cl0 c102 02 i46}and
3 CI014 * H30'_" + e " 3 HCI03 202 • [47]
Note that the effect of these reactions is tc produce mo_e oxygen than
i_ can be accounted for from the electrolysis of water•
The foz_%ation ol ozone, 03, is also common to the elect_olysls
o_ _ery high acid concentratlons, Brlnez [12) has detected ozone in the
?
00000001-TSDI0

,- Ii'_ .-
O0000001-TSDll

",6 -"
electro]ysis of concenl.[atcd solutions of H3PO4, KOH, H2SO , and IICJ.04o
Addition of reducing agentsj e.g, NaNO 2 and Na2S_ have been
[ound to increase the ovezvo]tage (35); howeve[, Bockris and |{uq (9)
found that the addition of Na2SO 4 lowers _. All worker's agree chat the _,
actual effect of adsorbed ions is difficult to interpret.
,'7
D. Cathodic Reduction of Oxygen.
Although the reaction under investigation by the research is "_'_
the anodic oxidation of oxygen_ the cathodic reduction is discussed here
because it sheds light on the nagging problem of the p[esenee of H202.
The generally accepted reaction mechanism consists of the
following slow step:
slow
(02) ads + e _ (02") ads [48]
and the subsequent fast steps:
' (02-) ads _ H+ = (HO2) ads [49]
I -(H02) ads + e = (HO2) ads[50]
(HO2) ads + H+ = (H202) ads [51)
The formation of H202 is an important step of this mechanism°r
_,rv, The maln evidence for this theory is that the cathodic reduction is
I- accompanied by the presence ol the stable intermedlate, H202. (This
-_ intermediate is neve_ _ound, under propel control of imputlties in the1
oxidation reaction.) The H202 is then decomposed a_ the elects'ode by
ca[ 2H20 + 022(H202) ads _ [52]
_u-_j_ Typical D vs. log i curves y_eld a Tafel region in the current
density range from 10-6 to 10-3 A/cm 2 with a slope approximately 0.I_
The co_zesponding exchange current density, i_, is about 10-9 A/¢m 2 (86)
t
00000001-TSD 12

- 47-
A plot of overvoltage versus log P02 shows change of D of 60 mv for a
unit step in log P02. This has been interpreted (46) to mean.that .the ....
rate determining step is an electron transfer with 02 .
The presence of H202 has been found experlmentaliy to depend on _
the magnitude of the current density (43). In particular, for i less
than 10-4A/em2_. H202 does accumulate and reaches a steady state value
around 10-6 to 10-5 M. The observations have been interpreted as being '_"
due to the relative ability of the platinum surface to decompose H202.
The platinum surface changes with current denslties, having more bare
sites at higher current densities_ and having fewer bare sites at lower
current densities. The presence of adsorbed oxygen inhibits the
reduction of 02 to H20 but promotes the decomposition of H202 to 02 (53). ..
It is on the bare Pt surface that steady-state reduction occurs.
One other significant reaction scheme has been proposed, in
which H202 is a side product rather than an intermediate (17). Theexperimental evidence for this is that H202 is not found present when
-- i_ impurities are removed from the system. Hoare (44) argues that, in the
absence of impurities, the Pt surface.can decompose the H202 as fast as
i it is fo_med; consequently H202 is not detected,__.Obviously the point
'_'_I_ of whether H202 is a side product or an intermediate is a c_£tical one,1
j and as yet, has not been unequivocably resolved.
Study of the nature of the electrode surface in contact with
the 02, has revealed that 02 dissolved in the Pa surface enhances the
reduction of 02, but an adsorbed layer of oXygen inhibits the _eduetion
of 02 (47). On the other hand, an adsorbed layer enhances the de-
composition of H202. This phenomenon of the adsorbed layer of 02
inhibiting the reduction of 02 is exactly contrary to the oxidation
L
-O0000001-TSDi3

teaetlon. For the oxidation reacLion potentials apl)ronch[ng tlle
theoretical reverslhle potential have only been obtained in the presence
ol an adsorbed oxygen layer,
E. Anodic Evolution of 02 in Sulfuric Aci_d,
There are many studies of oxygen evolution which have been
carried out in sulfuric acid solutions. In fact, sulfuric acid is the
most common solution to be used on oxygen electrode studies, However,
almost all studies in sulfuric acid are li_Lited to one or two concen-
trations of H2SO 4 and these are concentrations less than 2N H2SO 4.
There are three excellent zevlews which do cover the spectrum
of sulfuric acid _onceutratlons_ These reviews are discussed here
separately,
i. "Dependence of Oxygen-Evolution Overvolta_e on Smooth
Platinum On the Sulfuric Acid Concentratlon" by V. L. Kheifets and
I. Ya. Rivlin (51)
Several important observations are made in this paper. First_
reproducible overvoltage curves are attainable only after p_olonged
preenodizationo l_itlal experiments showed a continuous shlf_ toward
{ more positive potentials with 8u_cesslve experiments° Long interruptions
I also a_fected the repzoduclbility o_ the _urrent voltage eu[ves. Fig, 9
presents the results of their steady state overvoltage detetmlnations.
Increasing the sulfurlc a_id concentration has the effect of
shifting the overvoltage cur_e toward more positlve potentials, This
is expected because the activity of water decreases as the concentration
of sul_u_ic acid increases Aceordin S to Equation 53 below,
4
2.3RT log aN___!_+6o = Eo + ----4F 2 [53]
alt20
• , k L
........ 00000()01-TSD14


- 50 -
where _;o is the particular cqui].ib_lum potential, Eo is the standard
potential (1.23 V), all+ Is the activity of the hydrogen ion, and all20
is the activity of water. The equiIZbrium potential increases as
aH20 decreases. The observed shi£t in the overvoltage curves is much
greater tkan that due simply to the shift in the equilibrium potential.
Therefore, strong polarization must be occurzing, i.e. there is a
strong increase in the activation energy required to make the reaction "":
Occur.
Finally, Kheifets and Rivlin point out that at high concen-
trations of sulfuric acid (_6.6M), there is an inflection in _he over-
voltage curves. Two distinct slopes can be distinguished from these
curves. While other authors attribute the inflection in these curves
to a change in the reactlon mechanism (50), Khelfets and Rivlin
attribute this to a strengthening of the bond between the oxygen and
I the platinum. They also note that, at high concentrations, persulfurlc• acid is formed by
I2 HSO4 - 2e H2S208. [54]
Table 2 gives the information desctlbing thei_ observatlons
I
i_, of the efficiency of 02 production° The increased produeclon of H2S208
I causes a decrease in the produo_ion of 02, as one would expect from
_" _ stoichiometric considerations.
2. "Electrolysis of,Concentrated Sulfuric Acid Solutions
Using Tagged Oxygen" by Kaganovich et.al. (50).
___,: A break exists in the Tafel plots which yields two distinct
Tafel lines of essentially the same slope (see Fig. 10), In contras_
to the paper discussed above, Kagannvieh et.al, suggest that the break
corresponds to a change in mechanism, namely, that oxygen evolution at
i-
.......... L
00000001-TSE02

.5].-
0
00000001-TSE03

- 52 -
00000001-TSE04

- 53-
the higher current densi[J,.s involves anlons in some fashion. Analysis
for tagged oxygeB. 018, supports this view. They conclude that tagged
oxygen is found at increasing concentrations in the evolved gas in the
break raqse and bayond_ This is attributed to surface isotopic ex-
change which is possible because of strong anion adsorption at high
'?Iovervoltagss and high anion concentlat_on,
Table 3 gives the constants charaetarlstie of the electro-
chemical system which was used.
Kaganoviah ec,al, pretreated a smooth platinum electrode by
repeated anodlc and cathodic pola_izatlon. The anodic current density
was kept less than 7 x 10⁻⁶ A/cm 2 before measurements. The current was
changed continuously and the potential was measured two minutes after a
current change,
3. "Investigation of the Kinetics of the Electro-oxidation of
Sulfuric Acid" by E. A. Efimov and N. A. Izgatyshev (23).
This study of the electro-oxldatJ.en of sulfuric acid to per-
sulfurlc and monope_sulfu_ic acld is the most thorough and highly regard-
ed study of the polarization of high concentrations of sulfuric acid.
The basic reaction in question was:
i 2HSO4- - 2 e _ H2$208 (pe_sulfu_ic acis) [55]
_[ with the following side _eact_ons:
2H20 - 4e _ _H_ + 02 [56]
H2S208 + H20 _ H2SO 5 Imonopersulfuzic acid) [57]
:_g_-_- _O5 4 H20 - 2e = H2SO 4 _ 02 [58]
H2505 + H20 = H2SO 4 + H202 [59]
i. H2SO5 * H202 = H2bO4 + H20 + 02 [60} -"
O0000001-TSE05

- 5t_-
Table 3
CHA[_ACTERISTIC CONSTANTS OF WATER VAPOR ELECTROLYSIS
Concentration io (A/¢m2)
IN H2SO 4 3 x 10⁻⁹ 0.39 6,.
7N H2SO 4 i x 10-7 0.32
I0N H2SO 4 2 x 10⁻⁷ 0,.29,i
15N N2S04 2 x 10⁻⁷ " 0o28
00000001-TSE06

- 55-
He 2- - 2a = H+ + 02 [61J
H2S208 + H20 = 2H2SO 4 • i/2 02 . [62]
Efimov and Izgaryshev found that reactions 57 - 62 were
unimportant. However, the existence o£ }[2S208 and H2S205 was found to be
charaeterlstic of the variables of the electrochemzcal system.
Their polarization data are presented in Figure ii. These data _..
were obtained on smooth platinum in sulfuric acld concentrations from 5.0
to 36,0 N. The anode was a platinum wit:e, 0.3mm dlameter: Analysis for
H2S20 _ was made in the current density range of 4.2 x 10⁻³ to 2.0 A/cm 2,t
as H2S208 and H2S % were not detected below i = 4.2 x 10⁻³ A/cm 2, The
electrode was preanodlzed fez 30 minutes at i = 2.1 x 10⁻³ A/cm 2. Three
minutes after a particular current density was established, the anode
potential was measured_ At each sulfuric acld concentratlon_ 3 to 6
plots were made_ and average values were taken. The repoduclbility oft the potentials we8 5 to 20 mV. This is reasonably good repoduclbility
-: and ft mlght have been _mproved h> extending the preanodlzatlon time.
Efimov and Izgaryshev made several _ignl_icant observations
and conclusions:
i I- The current effieleney foz the production of H2S208passes through an &ptim_s. These optima lie in the
|12804 concentzaslon range of approximately 15 - 27 N
H2SO 4. Lower concentlatlons _equlze higher potentials to
produce H2S208.
2. The optimum production of H28205 is independent o_ current
de_ity (hence _oten[lal) and depends cnly o_. H2SO 4
concentration and occurs at app_oximately 25 N H2SO 4,
?
00000601-TSE07

56-
f 2.3
.... 2.2
_" .....i 2.f
----7
2. a
-2.5 -2.0 -1.5 -i.0 -0 5 0 0.5
Y
_/.__ Log current density (A/cm 2)
Ftgu[e 11. OVERVOLTAGE CURVES OF E. A, EF1MOV AND N A
IZGARYSIIEV. VAR1OUS CONCENTRATIONS OF 1t2SO 4AT BRIGHT Pt ANODE.
00000001-TSE08

- 5/ -
Th£s can be expected be.cause Equatlcrl 57 _,s a dlenUcal (not
an electroahemicaZ) process.
3. Tafel behavior £er Ehe pro4nction of oxygen is ohsezved
until i = 10 -3 to 10-2 A/Cm2o At this poant the curves
bend toward higher poKentials_ after whleh time another
inflection is reached and the curves bend back.
4. Efimov and Izgazyshev agree with the explanation of
Kagano_ich e.al. (50) that the upwazd bend results from
.d
_ a change in the mechanism of oxygen evolution.• They
disagree wZ_h Kheifets and Rivlln (51) that the break is
caused by the production of H2S208 (which Efxmov and
Izgaryshev had also believed earlier (48)).
5. The second bend is attributed to the depolarizing effect
of the decompostion of SO5-2. Although mixing the
i solution before the second inflection produced no change
I in potential, mixing above this point increased the
potential 20-30 mV_ This e_fect results from the excess
accumulation of S205 near the electzode. As the _205 is
t dispersed, the potential incr.eases.
I 6. In extremely concentrated H2SO 4 solutions, there was a
physical hindrance to any increase in current (e.g. 35.9 N
at 0.3A/cm2). This occurzed because of obstruction by
oxygen bubbles. The surface of the anode was cove_ed by
these bubbles which could only be removed by the application
of a tremendous ovezvoltage (approx, 18.5 V) This
obstruction phenomenon occurred at 3.4 to 3,_ V.
7. The most zapid change in culrent with potentlal occurs
in the middle concentration range, 5N to 20N
/
.... h
00000001-TSE09

- 58-,
F. Water V,_._i_o_l,lectrolysls on Platlnum glect,ocie_ with an Ac|d Gel.
Electro.[_ire.
Previous studie_ of water vapor eleetzolysls on pratt.hum
electrodes with acld gel electrolyte have p_oduced c._nt_adic_ory
conclusions regarding the charac_:e_istlcs of the electrode processes.
Xhree studies address rhemselvee to the problem above. These are by
Conno_ et,al (14J_ Clifford et,al, (13), and Bloom (8). These studies _'
are discussed separately below.
i: "Design and Development of a Wat:el 9spot Electrolysis
Uni_____t"by W. J. Conner et,al. (14).
Conner's report give experimental information on cell operation
with liquid electrol_te and with an acid impregnated gel electrolyte
matrix.
Polarization data taken in the l_q_id electtol_te are presented
. in Figurel2 _ L_o_me.lhydLogen electrode _:th 6 I M H2SO 4 was therele:enee cell, There a_e several questionable aspects cl the relis-
h' bility of these data. First. of all, Ccanor notes a hysteresis in the
.:- anodic and cathodic sweeps and a difference In polartzatinn values when
_ I the system is left idle. These a_e typical "_mptoms" of the afole-
=
I mentioned ±rreproduclbllity of oxygen electrode _ve_voltage data It is
appament that Connor dld not sufflnlently preanod_ze the system s,}as
: to _nsure a complete electrgr_cslly conduetlng layer cl oxygen on the
--_ .. electrode surface. Moreover, oxygen ma_ have been continu_lly absorbed
-_ into the massive Pt during his measurements and neve. have ('eached
saturation.
Secondly, Con_ot notes that the aolutlons ol the _attous
el.ectr,_de_ystems were Ci app[oxlmatel.y the _dme concentration Pre_,iou_
00000001-TSE10

i
" - 59-
00000001-TSE11

- 60 -
ligulre_*have shown that ovcrvo]tagc data depend strongly on the electro-
lyte concentration_ especially at high concenttatl.ons and hlgh current
densities0
Finaily_ although, correct£on was made for nhe ohmicj or IR t
losst no calculations are gmven or data presented to assure tha_ this
.'7
was done properly. The net polarizatiQn is thus attributed to activation
overvoltage and IR losses. In light of the above factor'st the reliability
of Connor's overvolt:age data is suspect°
Conner investigated the performance o_ the water _apq_ elec-
trolysis cell using an immobilized silica gel electrolyte matrix. The
gel consieted of 20 wt % fine silica; end 90 wt % 8.1 M H2SO 4, Initial
cell operating conditions were 1.96 V and 35 mA/cm2_ After six hours,
operation was at 2.06 V and 35 mA/cm2; the voltage requirement had
increased to maintain a current density of 35 mA/cm 2, The electrode
r material used in these experiments was not speelfled by Conner; hence,
1comparison with data for operation with liquid electr'olyLe is not
t
possible.
Conner snares than failure of the gel matrix cell occurred
I because of severe cross-leakage. This cross-leakage resulted _rom local-
I ized drying and cracking of the matrix, Appareatly_ the matrix was
so immobilizing that water could not creep from wetter aleas re drierL"
areas
Finally_ sepa=ate tests on the silica gel gave a mixture-to-
_ liqufd conductivity ratio of 67% (specific reslstanee = 4.4 ohm-em).
The gel resistance was measured by a I000 cps impedance b_idge Conner
_Cab~o-sfl_ Cabot Cotpocatlonj Boston_ Massachusetts,
O0000001-TSE12

- 61-
repotted (|n J,_!.t:l.o_ _q_e<_ll¢ _es]_t_nce of ].15 ehm-cm for t:he ge.I
during tile cell operations.
2, "A Wate_-Vapo_ E_qettoly_Is Cell wILh Phosphoric Aeld
I,
Electrolyte" by Cllffo_d eL.el,, (].3). "
Cl[ffocd et.al, alsc performed experimental work on both the
liquld electrolyte system and the acid gel system° The bulk el their
experiments were performed on phosphoric acid systems, Clifford's group
analyzed the electrode overvoltage in terms of its components in order
to determine the dominant sout¢.es of overvoltage_
, A ourrent-interruptlon technique (77) was used whereby voltage-
i) time curves were obtained. The variations in the slopes of the curves
determined the magnitude oi the various components of the cell over- ...
voltage.
li lhe working elect:rode was a platlnized platinum sheet and
I overvoltage data were recorded versus an autogeneous hydrogen electrode_No mention was made of correction for the llquid-llquld potential
'('J between the reference electrode and the test solution. This could
K
!i introduce serious error, The au_len_-Inte_L'uptlon _eohnlque yielded
i
I velues of ohml¢ losses which agreed well with calculated values using
_I" a speeilic conductivity of 0.105 ohm-l-cm -I [or 83% ll3PO 4iA component evervoltage analys£_ is givcE in Table 4 fol bothI
I
the free-lxquid and liquid-matIix cell_. Clear'IF, the most lntere_ting!.
iaspect of Table 4 is the magnitude of anodi¢ concenttat.lon polarization:
k'_ _. 1.09 to 1_18 V. All previous indications would point tO no concenttatlen
.. overvoitage at all or very little at most; nevertheless, Cl£_ford et ai
have interpreted their data to say that the ma3or ¢omponet,t of _he over-
voltage is concentration eve;voltage A simple e_pe_iment el changing
00000001-TSE13

I - 62-
O0000001-TSE14

"' (_3 -
)I
00000001-TSF01

- 64-
the rsto ol _tl.[rIn_ wouJd have to.ld them st.L:l:ightnway it their analysis
was correct, Moreover_ tile value of concentration overuo!rage was htgher
J.n tile free-liquid cell _han in tile tmmobJ.lized ltquid-matrJx cell_ This
ineans that it is easier for Ehe water to diffuse to the electrode surface i
[n the gel than in the free liquid, This seems extremely unlikely.i'7
The above discussion pertained to a phosphurlc acid elec-
trolyte| Clifford et.al, arrived at identical conclusions for over-
voltage data on a free-liquid sulfuric acid electrolyte (50 and 77 wt. %
concentrations).
During extended operational testing of the water _apor elec-
trolysis cell, current-voltage data were recorded. Since the cell had
been operating for more than 1000 hours, it can be safely assumed that
the cell was more than sufficiently pre-anodlzed. Therefore, the data
can safely be considered to be repoduclbleo These data are presented
in Fig, 13, with Clifford's component overvoltage bzeakdo_rn. The IR
loss Was not calculated, lnstead_ a value for specific resislance wash
selected by which the straight dotted line could be obtained.
Note that despite the exlsteece of a sir'eight dotted line,
f
_J#r_ Clifford still analyzed the overvoltage components as being almost
entirely ccnceni_atlon ove_voltage (1.05 V) and practically no activation
:- overvoltage (,04V), In other words, a Tafel plot is obtained clearly
indicating a charge transfer controlled system_ yet Clifford i_iterprets
this as mass transfer control, Furthelmore, no limiting current has
_Mj_ been reached, Clearly, the analysis of Clifford et.al must be inco_tecto
Finally, this authnl (not Clliford) calculated all exchange
"current denslty_ io_ of i_i x I0-7 A/cm 2 from an ex%rapolatlon of tile
straight dotted llne ol Fig, 13. This value o[ i. Is in good agreement
00000001-TSF02

. _ _ _ __ _ (s_loA) a_llo^ IlaD
00000001-TSF03

- 66 -
with the data of l<aganovteh.. Similarly, the semi-log slope of h = 0.196
(_ = 0.40) is in reasonably good agreement wlth other oxygen electrode
Tafel slopes. Both of these findings support an activation controlled
electrode process.
3. "Czeled Operation of a Water Vapor Electrol_sis Cell"
by A, M. Bloom (8).
f.
Bloom's investigation dealt mainly with cycled opexation of
the water vapor eleetrolysls cell, i.e. turning the cell on and off. Hei •
r also treated theoreLieally the topic of concentration polarization. The
experimental work of Bloom is presented below.
All experimental results were performed on bright platinum
screen electrodes and platinum-tantulum screen electrodes in a sulfurle
acid slcila gel electrolyte. Water was constantly added to the system
via a humid air stream passing over the sillca gel, The gel consisted of
10% by weight fine silica and 90% by weight 8.1 m H2SO 4. Gas cross-
leakage between the anode and cathode was prevented by a microporous
PVC membrane' inserted in the electrolyte. Steady state operation was
carried out at 2.60 V and .92 amps fo_ the bright platinum and 2.20 V
r and 1.00 amps for the platinum-tantulum. VoLtage measurements were only_--._
within _ 50 de_ermined from the _ategood Lo inV. Current efficiency was
of hydrogen collection. Bloom made the following observations and
conclusions:
i, The Pt-Ta electrodes were unsultahle for long operation
_ because of detelioratlon ot the electrode.
2.: Bright platinum electrodes have a con_iderabl} hlgh_x
"oynpor, Electie Storage Battery, Yarldley, Pa.
00000001-TSF04

- 67
overvoltage (approx. 0.3 _o 0.4 V) than the piatlnum-
tantulum.
3. Proper cyclic opeIation was found to decrease speclflc
power consumpt£ono _-
4. Both "on" and "off" times were found to have optin*al
_ values, i. e. 5 minutes "on'[ and 5 seconds "off" fo[
r¢_'
the bright platinum electrode. This caused a 12.9%
decrease in specific power coDsumption (see Table 5).
5, "Off" times were followed by a current surge (sometimes
greater than 5 amps) at the beginning of the "on" times.
6. Spurt8 of excess water into the system caused a sudden
rise in cell current which required considerable time .a
(e.g. two hours) to dlssipste.
7. Doubling the humid air supply flow rate (from 25 to 50
¢ co/see) caused a decrease in specific power consumption
(from 12.7 to 17.6%).!
"-! 8. Speciflc power consumption increased as "on" time goes
toward zero. This results from _he reduction (or "fuel
i cell") zeaction which occurs while an adsorbed layer of
mm_'r_I oxygen (and hydrogen) is still present on the electzode.
This layer is gradually stripped as the cell is "off" or
grounded,
9. Pt-Ta and bright platinum electrodes exhlbited opposite
tendencies in specilio power consumption characteristics
near zero "off" time This was attributed to dilferences
in specific surface area of the two eletttodes,
I0. Cutcent efficiency measuzements assured that the oleo-
%
00000001-TSF05

- 68 -
Table 5
CYCLIC OPERATION POWER CONSUMPTION DATA
Cells No. 3 through 8, BRITE Anodes, E = 2.60 V
Cell ON 1 OFF 2 N3 Woz_ Error 5 Coll 6 WOrkT 7 _8Noo <min) (see) <watt-see) Efl (wad,-see) IMP
3 3 1.5 I0 1242 14 0.95 1175 -4.9
4 19 1104 Ii 1044 6_8
5 8 1075 8 1017 9°2
6 12 1107 19 1047 6.5
7 8 i162 12 1099 1.8
4 2 5 6 1034 4 0.99 1025 8,5
3 6 1023 2 1013 9.6
4 7 1005 3 996 11.1
5 14 988 4 979 12.7
6 10 1004 1 995 ii.2
7 4 1013 3 1004 10.4
5 5 0.5 Ii I054 8 0.9S 1036 7_5
3 9 1013 4 996 11,i
6 10 4 1140 2 0.97 I106 1.3
6 3 7 4 1076 i0 0.97 1049 6,3
_ 7 3 12 1064 5 Io00 1064 5,0
6 5 3 1026 6 1.00 1026 8,4
6 7 6 1050 4 O,97 1023 8 l
7 7 12 1021 5 1 O0 t021 8 8
? 9 6 1032 13 1032 7,9
8 5 5 5 976 2 I 00 976 12 9I
• _ • k
00000001-TSF06

- b9 -
Table 5 (Concluded)
I"ON" cycle time.
2"OFF" cycle time.
3Number of measurements.
!_I 4Ave, measured electrical work to produce 50 standard cc H2. .,
5Estimate of maximum error in measurement to 95 percent confidence,
assuming data follow t-distrihutlon.
6Hydrogen collection system efficiency
7Average electrical work corrected for H2 collection efficiency.
8percent improvement in powerconsumption efficiency, related to
steady state power consumption of 1120 watt-sec for production of
50 standard em3H 2 at 2.60 V.
:- L
00000001-TSF07

- 7(J -
t);oly_is ot wate£ was the only rea_tlon occs_ritlg.
'['he previous studies of Kaganovich et,al. (50) and EiJmov and
Izgaryshev (23) give sufficient ewtdence to doubt the Feliabllity ol
point 10, If H2S208 and H2S205 are produced in Bloom's electrochemical
cell the proper amount (i.e. ~ 100%) of hydrogen will still be produced,
'_{ but less oxygen will be evolved as 02 .
Bloom, himself, admits that his conclusion of point 9 is very
tenuous. He cites "incomplete data" and a decomposing electrode surface
':_ as the prime sources for his skepticism. In the final conclusions of hls
report he is only willing to state that "incomplete data showed measured
efficiency increases of up to ten percent" and that "it is believed that
cyclic operation efficiency improvement will be observed with any elec-
trode displaying oxygen overvoltage." Bloom is unwilling to make
specific statements about the nature o£ this improvement in his final
presentation of results, although he has made such tenuous claims inII1 the body of his discussions. Similarly, point 7, the effect of air flow
-I rate, is questionable. Only six measurements were taken to make this
sta[tling conclusion. No further investlgaEion of this matneL was unde_-
taken by Bloom, Furthermore, evaluation of the significance of the sitf
_ flow effect is the comparison of inc=aases in efficiency Bloom cites a
-- i
17.6% Increase in efficiency due to a doubling of air flow rate as
# compared to a 12.7% increase due to normal ai_ flow _ate (and optimum
- cycling parameters). The tendency here is to compare 17_6% to 12,7% and
cite a 40% impTovement due to doubling air flow rate, by the ratio of
17.6 tc 12.7. This is a tempting_ but Incorrect, appToach, the actual
_mptovement is the ratlo of 117,6% to 112.7% o_ a 4_3%. A 4.3%
Imp_ovement due a doubling of alr flow _ate is not as startling as a
i
00000001-TSF08

: - 71 -
4o_ improvement. As for the reason for this improvement, Bloom states
that what "caused the efficiency increase _s not understood." lie then
states that the "increased supply of feed water, causing electrolyte
dilution9 was apparently the reason for the performance increase with
increased feed air flow rate." In light of investigations presented
-i' above and given the finite amount of electrolyte in Bloom's cell, it is
probably true that any increase in cell current improvement from _
: increased air flow resulted from electrolyte dilution and larger currentsI
. in general. This ties in well with point 6, i.e. that increased currents
were observed with attendant spur_s of water into the system. This is
still more credible when one is considering a 4% improvement and not a
40% improvement. Further discussion of this point is given later in
thl8 thesis.
Bloom offers no explanation for 3, 5 and 6. He does point
tl"
r_ out that IR loss is decreased as water is adsorbed because the resist-!
ante of the gel decreases with increasing water content. However, it
:_ ' hardly seems likely that the small change which occurs in the IR loss in
5 seconds could cause a 12.9% decrease in specific power consumption
i over 5 minutes (300 seconds). Engel (24) has hypothesized some sort of
I "electrode regeneration" end Bloom has simply stated he does not know
what causes improved behavior of the electrolysis cell wlth cyclich
operation.
Finally_ Bloom's theoretical investigation of concentration
cvervoltage leads to the conclusion that concentration overvoltage is
negligible. This is in direct conflict with the experimental analysis
of Clifford et.al. (13).
00000001-TSF09

- i2 -
The critical equations _n Bloom's analysis a_e given below:
= - n RTin (1.0 - ±/5) 163]and
iL = nFDCbl6. ]64]
Where Ec is the concentration evervoltage, iL is the limiting current
density, D is the diffuslvlty of the electroactlve species in the elec-
trolyte, Cb is the concentration of the electroactive species in the "'
bulk solution, and _ is the thickness of the Nernst diffusion layer
(see "Theory" secgion). In particular Bloom investigated the dllfusion
i_ of 11+ ions to the cathode surface to form H2. The calculated value for
Ec is 0.0002 V,i.e. negligible concentration overvoltage. The following
values were used for the variables:
:" T = 25°C
....... = .005cm
D = 2.7 x 10⁻⁵ cm21sec
i = 0.I A/cm 2i
'-' These values yield iL = 24 A/om 2 and consequently i/iL is very
small and E is very small. The value of the dlfiusivlty which Bloome
i used was that of H+ in 60 wt % H2SO4, it is not unreasonable to expect
I that the value of the diffusivlty of H+ in an immobilizing silica gel
matrix could he considerably less than 2.7 x 10⁻⁵ cm2/aec. Moreovel, fo[
the evolution of 02, the electzoact_ve species is H20 (a much large_
species than H+). It is difficult to guess at the zeal value of DH20 o_
D}|+ in a silica gel mairix_ but it could be orders ol magnitude smaller
than in the free-electrolyte solution. In that case, iL would be much
smaller, hence i/iL would be larger and Ec would be large_. Whethe[
or not E would be larger enough to be signlliciant (e.g, 50 mv)_ i8c
d[f|icult to say,
00000001-TSF10
- 73 -
VI0 EXPERIMENTAL APPARATUS AND PROCEDURE
The basic scheme of the experimental work oi this thesis was
to produce current-voltage data for the water vapor electrolysis system
which Bloom (8) studied. The experiments themsel_es were designed to
_ I provide accurate measurements of cell current and anode potential on a
continuous basis. The analysis of such data provided the information
necessary to solve the problems set forth at the beginning of this work°
, For example, an exponential dependence of cell eulrent on _node potential
indicates that the anode overvoltage is electron transfer controlled.
It was impossible to use Bloom's total experimental system for
this purpose because of the new requirement of a reference electrode.
A reference electrode must have an electrolytic connection with the
workJ_ig electrode, in this case the oxygen electrode (anode). In Bloom's
system the electrochemical cell was enclosed in a tight, compact unit.f
There was no way to place a reference electrode inside this u,lit or to
.... make an electrolytic connection, e.g. a salt bridge, with it.
I The new. system which was developed not only had a reference
electrode but also had more sophisticated electronic monitoring equip-
4 ment than Bloom used. The new system also had an essentially infinite
supply of electrolyte as compared to the £1nite supply of Bloom's
system.
The experimental apparatus and experimental procedure are
detailed below.
A. Apparatus.
The experimental apparatus was designed to duplicate [hat o£
Bloom (8) wherever possible. The reason for this was that it made
comparison of the present results with those of Bloom mo_e meaelngful.
00000001-TSF11

- 74 -
There are three basic systems of appora_us which make up the
total experimental assembly. These arc the cont_o].led i_umJd-alr supply
system, the electrochemical cell, and the eontrolllng and monltoriug
electronic equipment. Each of these systems is described separately
below.
i. Controlled Humld-Air Supply System.
This is the same system as that used by Bloom (8). The fep"
air stream was monitored as to its temperature, humidity, and flow rate.
Since it was known beforehand that temperature has a negligible!
effect on the cell reactlon_ no great care was taken to control the feed
air temperature. It was allowed to be at room temperature. Experiments
were performed during the late summer and the room temperature ranged
from 75 ° F to 85 ° F. The temperature was measured on a precision
potentiometric-output hygrometer I to +I'F accuracy,
I The humidity of the feed alr stream was measured by the same{
hygrometer. Control of the humidity was maintained by the apparatus.I
- L
shown sehematlcally in Figure 14. Dried compressed air passed through
two-stag_ pressure zeduction and regulation and entered the humidiflea-
[ tlon section. The air stream was then spllt_ part to be passed-through
a second container filled with calcium chloride particles. The humidified
and dry air streams were then reeomblned_ forming a mixture whose
relative humidity depended upon the proportion of the total stream which
passed through each container. Control of humidity and flow rate was
effected by the two-stage pressure regulator and needle valves in each
stleam of the humidification system. The humidity was maintained at 50%
_Model 15-3001, Hygrodynamlcs inc., Silver Spring, Hatyland
O0000001-TSF12

00000001-TSF13

- 76 -
relative humidity _ 1%. Within the operating _emperature range of the
experiments, the relative humidity was very Insensitive to temperature
changes. Bloom (8) noted the occurrence of slugs of water in tile airJ
supply system. This caused a simultaneous ine_ease in cell current.
Although Bloom noted the increase in current, he failed to state that
it was due to the decrease in sullurie acid concentration. This had the
attendpnt effect of decreasing the anode overvoltage, as Efimov and
Izgaryshev (48) have shown conclusively. No slugs o£ water in the air
' feed stream occurred during the experimental stages of this work_
Air flow rate was measured with a rotameter and was held
constant at 24 ¢c/sec. at room temperature and atmospheric pressure.
Variation in air flow rate was + i cc/sec. This small variation had a
negligible effect on the experimental data.
Finally, no measurements were taken on the pressure of the
I entering or ambient air streams. As with temperature, it was known
beforehand that minor variations in pressure (in this case pressure
of 02) had no measurable effect on the experimental data.
2. Elec_rochemical Cell.
_v_ The electrochemical cell consisted of a PVC compartment to
which a platinum screen was secured. Silica gel, impregnatedwith
sulfuric acid, was spread on the platinum screen. A miezoporous PVC
I, membrane covered the silica gel and screen. The entire sandwich oi
platinum scr_en_ silica gel, and membrane was secured in the PVC anode
compartment by a PVC block clamped tightly to the PVC anode compartment,
Figure 15 and 16 show the unassemhled and assembled units tespectlvely,
The entire unit was submerged in sulfuric acid. A mercury-mercurous
sulfate reference electrode (+0.61 V vs NHE) was attached to the anode
O0000001-TSF14
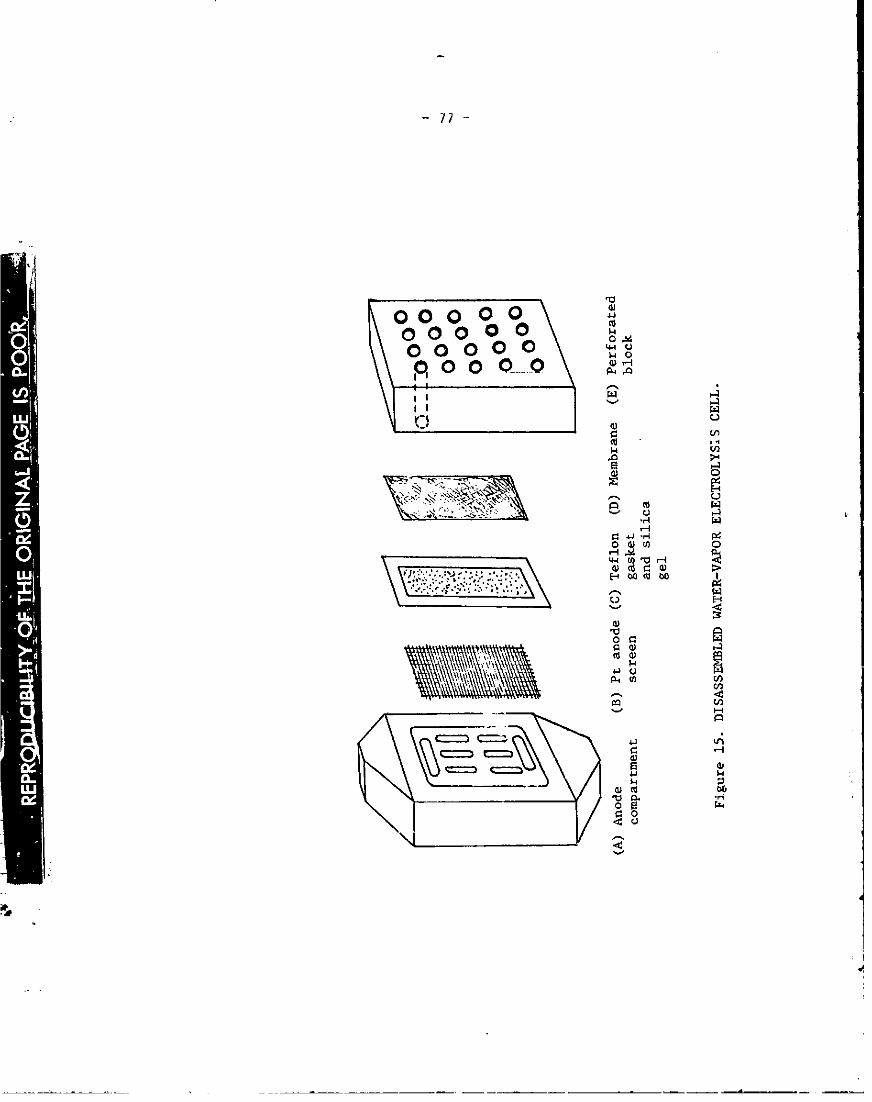
: 7_ -
00000001-TSG01

Air +Humid
evolved 02 air
_Referenee
electrode
Standard
cell anode
• compartment
Cathode
l-F_gure 16. STANDARD CELL, REFERENCE ELECTRODE, AND CATHODE ASSFIMBLY.
00000001-TSG02

- /9-
assembly. Another platinum screen, suspendea at a variable distance
from the anode_ acted as _he ¢_ithode
The anode compar[meee was a machined block of PVC which not
only served to hold the cell anode_ but also pro_ided passage for the
humid air supply. Air entered through the top of the air manifold (anode
compartment) and flowed ove_ the anode screen and silica gel before pass-
ing out through the bottom of the air man_fold and out a long sta£nless "'_'-
_teel tube. The air manifold section was 4.75 cm square by 0.159 ¢m
deep. Small supports protruded from the wall of the air manlfold_ These
supports kept the anode screen at a _ixed distance from the compartment
wall. Two small holes were p_ovided in the compartment wall so that wire
leads could be drawn from the screen to the outside of the cell assembly. 1
These small holes were sealed by ¢lcar silicone _ubber.
The anode was a 4.-inch by 4-inch 45-mesh bright platinum
screen, a The leads from this screen were also platinum wire, The cathode
sc_c_n was gray platinum as supplied by NASA. Its dlmensions and type
were net investigated, as they were i_elevcst to the e_pe_imental data.
The silica gel consisted of 90% by weight of 8 I M H2SO 4 and
the remaining 10% dry fine sillea. _
The silica wos preheated to i00" F for a minimum of two daysii
pzlor to mixing with H2SO4, This ensured a true dEy weight of szlica.
"_ _The original supply of th_ cell compartments was obtained from NASA.However_ these were made of methyl methac_ylate. The PVC replicas were
[_ made by Miero_ol Cezporatlon_ State College, Penesylavnla.
_Englehard Indust_les, 700 Blair Re=d, Cat te_et, New Jersey.
_Cabot Corporation, Boston_ Mass_chusett_
L . .
00000001-TSG03

- 80-
(Bloom (8) pointed 0_ tlle significant effects o£ adsorbed water on the
silica,) The silica gel was applied to the surface of the platinum anode
screen wlth a stainless steel spatula. The gel was "pushed" through the
pores in the screen and the sc_een was entirely covered by the gel, The ,
thickness of the gel was of the order of one millimeter A teflon gasket
was placed over the edges of the screen and made water-tlght with an
0-ring situated in the PVC compartment.
The mieroporous membrane was stored in 8,1 M H2SO 4 for a
minimum of two weeks to use in the cell. This ensured saturation of the
membrane by the electrolyte. The purpose of the membrane was to prevent
02 and H 2 gas from cross-leaklng within the cell, It is assumed that the
membrane added no additional resistance to the electrochemical cell, as
it was saturated with electrolyte.
Since the entire system operated immersed in 8.1 M H2SO4,d
I.. great care was exercised in choosing the materials which made up theI
entire electrochemical cell assembly, Consequently, the cell anode
compartment and the perfo[ated cover were made of PVC. This was found
i to be entirely resistant to attack by 8.1 M H2SO 4. Similarly, the
_w_ .. clamps were made of the same PVC, The entrance and exit tubes and
I stainless steel which found resist attack. Screwsfittings were was to
made of a different %ype of stainless steel were found to dfssolve in
the acid; therefore_ they were ¢ove_ed wl_h silicone glease _after they
wers screwed in the clamps), This prevented furthe[ dissolution of the
__ screws. The support for the cathode screen was made of teflon. Screws
for this support were also tKeated wlth sill,3one grease to prevent
dissolutlon.
Similar care wa& exercised in chooslng a p_oper re_erence
00000001-TSG04

- Sl -
electrode. Not only was the cor_oslveness of 8.1 M H2SO 4 a facto[, but
the high concentration of sulfuric acid can also result in a llquid-
liquid junction potential. A meroury-meroarous sulfate re_erence elec-
trode with a sleeve Junction* solved both of these problems, First of
all_ the sleeve junction is simply a ground glass _olnt which is not
"_isusceptible to corrosive atta¢k. Secondly, the electrolyte of the
reference electrode was concentrated potassium sulfate_ There was_
therefore_ only a minor difference in the activities of the electrolyte
I' of the cell and the electrolyte of the reference electrod_ (i.e. both
were concentrated sulfate ion). Hence, there was no measurable liquid-
liquid junction potential.
3. Electrochemical Measurement and Contro[.
The overall experimental system is shown schematically in
Figure 17. This system was a simple potentiostat with current measure-?
mont. The voltage control was a direct variable voltage source 2 and!,
controlled the voltage drop across the anode and cathode. The cellr
current was measured on a standard ammeter. The other piece of equip-
ment was a high impedance digital voltmeter 3 which measured the voltage
I drop between the anode and the reference electrode.
r Although the variable voltage source contained _ts own volt-....
meter and ammeter_ these meters were not used, The ammeter only had an
_ accuracy of + 0.2 amps. Mozeover_ the voltmeter gave only the potential
= ! difference between the anode and cathode. Since the cathode did not have
a fixed potential_ this could not be used to measure the anode potential,
IBeckman Instruments_ Pittsbuzg, Pennsylavnia.
_Kepro, 0-SV, Nodel CKS-SM.
_Honeywell "Digitest"_ Model 333.
:v
00000001-TSG05

- 82 -
eferenee electrode
,II7 '
I
t iI" Anode Cathode
I
I
- 1/'_ Voltage supply
Figure 17, ELECTROCHEMICAL MEASUREMENT AND CONTROL CIRCUIT.
00000001-TSG06

- _3 -
Therefore, the voltage source was only used to adjust the potential
difference betweeu the anode and the reference electrode. The digital
voltmeter which measured this potential drop was accurate to + I0 mV.
In practice, the potential difference between the anode and )
the reference electrode was set at some initial potential. This was
either 1.16 V o_ 2.00 V) depending on the direction the potential was
to be changed, The potential difference was changed by 20 mV for each
data point, After each potential step the current was recorded. After",k
_| approximately 15 seconds the potential was changed again, and the current
was recorded within ten seconds after the step change. Each step change
in potential required about fifteen seconds to attain a new stable
potential. A sequence of increasing potentials was followed, without
pause) by a sequence of decreasing potentials. Potentials were scanned
between 1.16 V and 2.00 V against the mercury-mercurous sulfate electrode
I (MMSE) (+0.61 V). This range was chosen because oxygen evolution gener-
ally does not occur below l,g V versus NHE, and 2,6 V versus NHE was the
! maximum operatlng voltage used by Bloom.
Current was recorded with an accuracy of + 3%. The largest
part of any inaccuracy was due to minor fluc_uatlons in the current at
,_,t_(-t a particular current level, This was especially noticeable at the higher '
currents. Currents were recorded in a range of O.imA to IA.
B. General Procedure.
Two reliable sets of current-voltage data were required. One
"--_Y4v: set of experiments was perfozmed on the electrochemical cell as described
above. The second se_ was carried out on the "free-electrolyte") i.e°
in 8.1 H sul£uric acid solution only. This was neeessazy for comparison
with a reference system. The same procedure was used in varying the
)
00000001-TSG07

- 84-
potential in both cases, In the free electrolyte, tileanode and cathode
screens were suspended at a known distance fiom each other, The reference
electrode (MMSE) was placed between tile two platinum screen electrodes.
The distance between the electrodes was measured with a ruler
to am. This infomation was required to calculate the cell IR'_I
drop. Although the distance between electrodes varied between experi-
mental data sets, the usual distance was approximately 2.5 cm.
The information obtained from experiments on the free elee-,q
trolyte turned out to be very important to the conclusions of this
thesis.
C. Automatic Potential and Current Control.
At this point it should be pointed out that a considerable "_
amount of effort went into development of another experimental system
which has not been dlscussed thus far° The reason for the lack of
I discussion about it is that the system turned out to be unworkable. AI
Heath polarograph was purchased for current and potential measurement°
This device had the capability of very accurate potential sweep control,
i.e. varying the applied potential at a known constant rate. A sophisti-
I
_, eared dual channel linear recording device was attached to the Heath
• I polarograph for current and potentlal recording. Preliminary experiments
- were performed with this apparatus on known electrochemical systems_
e,g. the fer_ocyanide-ferricyanide redox couple. These experiments were
performed in order to familiarize this author with pola_ographic teeh-
___ nlques. It was also desirable to reproduce a known electrochemical
system to assure that the apparatus was functioning properly, The pa_-
tlcular experiments that were perlo_med weze measurements o£ hal£-wave
potentials. In general, for a given _edox system in which both the
00000001-TSG08

i
I.• - 85 -
reduced and oxidized forms are soluble the potential cot_espoudlng to
one hall tlte limiting current has a cha_cteti_tlc values The e_perl-
ments periormed on known systems were very successful. The halt wave
potentials found expe_imentally agreed well with literature values° The
wo_klng electzode in these experiments was a rotating platinum drop
!4electzode and the reference electrode was..a _e_yTmercurous sulfate
Lr•
electrode, These experiments were successful in acquainting this author
' with polarographic technique.l
The reason, why-thls apparatus was not used for the experimental
' _ work in studying the water vapor electrolysis reaction was that the maxi-
mum current attainable on the Heath polarograph was one milliamp. Since
the currents of the water vapor electrolysis cell are roughly about one
amp_ the apparatus was unsuitable as it was purchased° Considerable
ef£ort was made by the electronics group of the Department of Chemistry
of the Pennsylvania State University to adjust the current measurement
range to two amps, These attempts proved unsuccessful, hence the auto-
matlc current-potential appazatus was not used: A manual set up, as
desc[ibed prevlously_ was assemhled_ This info_matlon is presented here
I so that others might not make the same mistake._vr
t
00000001-TSG09

- 86-
VII. RESULTS AND DISCUSSION OF RESULTS
This section is organized in a format such that the experi-p
mental results are first presented, then analyzed from an experimental
viewpoint. This is followed by a discussion of the physical and electro-
chemical implications of these experimental results, i.e. what were the ....
real electrochemical phenomena which caused the observed results, and
howeould these phenomena also explain the experimental results of
others, especially Bloom's (69) cycling experiments.
Several "theories" are proposed in order to explain the
experimental results. The argumentative approach adopted to evaluate
these theories is to i) assume that a particular theory is correct,
2) find evidence which supports that particular theory, 3) find
evidence which negates that particular theory, and 4) weigh and evaluate
the various evidence to arrive at whatever conclusions are possible for
--__. ! a particular theory.
A. Experimental Results and Discussion.
The experimental results are presented graphically in Figures
18 - 24. Figures 18 and 19 are the results of current-voltage experi-
apparatus section, consists of a bright platinum screen anode in
8.1MH2SO 4 electrolyte solution. The electrochemical reaction is the
electrolysis of water into oxygen gas and hydrogen gas. The "free
electrolyte" results serve as the "base case", i.e. this is the behavioz
one would expect without any complicating factors.
Figures 20, 21, and 22 present the results of the same experi-
ments on a standard cell. The standard cell, as described in the
apparatus section, consists of the same anode, but in a 8 ]M H2SO 4 silica
00000001-TSG 10

- 8i-
0,-I
O0000001-TSG11

: - 88-
1 i I , | 1 I I I [ I lo i,
00000001-TSG12

00000001 -TSG 13

- 90-',0
I
1°
1,4
I I I I I I ! I I I o0 0 0 ¢_ _ 0 0 0 0 0 0 _-_
• " " ,4( o_^) _ ,4 _ _ _ ..i
00000001-TSG14

4
I f I I I I I l ,,I,, 1 oo o o o o o o o o o o-4 0 _'* O0 _ kO u_ -z,l" r_ ¢"1 ,-4
('-,limb".) t:lqI'_'_ m".
00000002

•- 92 -_O
O
I I I } I I I I I ,I , .0 Q _ _'_ O o _ _ 0 O 0
(_lOA) 3Shg__t, 3
00000002-TSA03

,a9
I o
00000002-TSA04

" 94 -
gel electrolyte, 'lhi_ cell operates with humic air at loom tempe_at.ume
and pressure flowing over the gel and anode scmeeu, Flgu_e 23 is a
Comparison of two different standard cell cu_ent-voltage curves,
FlguKe 24 is a comparison of the lesults of the standard cell
and the "free electrolyte" cell. It is this comparison which is the
most significant aspect of the experimental work.
All figures are semi-logarithmic plots of current density
versus ancde potential. These are the usual Tafel graphs, voltage being
the linear coordinate and current density the logarithmic coordinate.
i. "Free Electrolyte" Results.
Figure 18 is a downward scan of potential between 2.00 V and
1.12 versus the reference electrode. I The actual results are the ,,
solid line; the dashed line represents the IR-cerrected results. The
correction was made by subtracting the IR loss from the measured
potential difference. The value of the IR loss was calculated using
a specific resistance of 1.91 ohm cm (72) for 55 weight per cent sulfuric
aeld at 25°C_ an interelectrode distance of 2°0 to 2.5 cm, and an elac-
2trode surface area of 61,9 em . A sample calulation is given in the
_wi Appendix.
I- A straight llne can be readily drawn with a Taiel slope o£
0.163 and an intercept at E_ = 1,23 V versus NHE of 9.5 x 10⁻⁹ A/¢m 2,
This intercept iS the exchange curzent density, i . These values of
the Taiel slope and exchange current density agree well with litera-
ture values of 0.14 and 10-9 to ]0-I0 A/cm 2_ respectively (9. 41, 42)
fez the anodlc evolution o£ oxygen. Exact literatuze values of the
lThe reference electrode was a mercury-mercurous sulfate electrode (5_|SE)
with a constant potentla] of + 0 61 V versus the normal hydrogen elec-
trode (NHE). The potential of the normal hydrogen electlode is 0,0 Vby uonventiom.
00000002-TSA05
- 95 .-
Tafe). slope and :t._ do not exist due to wide 9arlatlon in experimental
conditions. Coupled with visual observations of the evolution el gases
at the anode and cathode, the experimental results mark the electro-
chemical reaction unmistakably as the electrolysis of water.
The existence of a straight line of the io_ i-E plot denotes
that the electrochemical !eaction is activation qontrolled, i.e. the
slowest step in the evolution of 02 under these experimental conditions
is the transfer of an electron at the anode surface. This is an expected
result ( 41, 42).
Figure 19 gives results of an upward voltage scan followed by
i'a downward scan. Two Tafel lines are observed, with equal slopes ot
0.17. The upward scan has an exchange current density of 7 x 10⁻⁹ A/cm2;
the downward scan's io is 1.5 x 10⁻⁸ A/em 2.
The upward scan produces higher curzent densities than the
I downward scan. This behavior is exactly opposite to what is expected (9),I
namely, during the upward scaD_ an electronically conducting monolaye[
el oxygen is being built up. During the downward scan, therefore, this
layel should already exist_ hence the current should be higher, Un-
J
_v,' • doubtedly_ the oxygen layer is being built up during the upward voltage
I scan Hewever_ its effect is small compared to the other consldetatlons
of the experimental technique. In particular, the tlme between current
measurement and voltage adjustment is an important [acto_, in p_actice,
it was observed that _n increase in the voltage ga_e an initial rise i_
_ current which _raduall_ deczease_ In order to maintain a ¢onslstent
basis for obtainlng data, a set procedure had to be established, This
assured obtaining contlnuous ot "smooth" data, Time was not avallable
to follow some of the el:*br_rate technlques g_ven _n the llte_a_u_e (23,
00000002-TSA06

- 96 -
29, 50, 5].) to obtain exact current-voltage data.
The problem of developing a standard technique for data taking
is very common with the oxygen electrode (9). _arylng techniques were
often used in the early studies of the oxygen electrode. Many times the
exact technique was not described accurately. _he consequence of this,%
was Irreprodueibil_ty of data. With this in mind, the data taking
procedure of these experiments is exactly specified in the apparatus
section. Moreover, it should be recognized that the exact current-
voltage curves were not necessary for solution of the thesis problem,
i.e. the nature of the type of oxygen overvoltage at the anode can be
determined without exact data.
The difference in the upward and downward scans is actually ,_
due to a certain amount of "overshoot" from changing the potential and
, recording the current at a fixed time (30 seconds) after the ehange¢
i The same argument applies to both the downward scan and the upward scan;f
however_ in practice, the downward scan was much more stable, Stability,I
here, is defined as the rate at which the current responded to a voltage
ehange_ So_ even though the current density values for the upward scan
_wi are higher, the results of the downward scan are more reliable. This is
I further supported as ic for the downward scan is closer to the literature
values than is the i_ for the upward scan, (The same behavior is
I present in experiments with the standard cell, i.e. in all eases_ the
! upward scan produced higher currents. The same explanation for this
_i phenomenon applies to the standard cell as to the "flee electrolyte"
cell.)
The exact comparison of Tatel slopes end I's with l_terature
values is very difficult_ as noted ea[ller. ]n particular, experimental
%+%
i
i
00000002-TSA07

--97
condltions as given in the literature are gene_ally control]ed much more
rigorously than was feasible_ or even desirable D for the_e experiments°
An example of the extreme in control of experimental conditions is that
of Kheifets and Rivlln (52). These authors used twice distilled water
for preparation of the sulfuric acid solution. The sulfuric acld was
chemically pure, distilled twiee_ and only the middle fraction of the
j_final distillation was used. All apparatus was made of glass. The
temperature was controlled to + 0.I = C_ P_eanodization was carried out
for 10-15 days to ensure a stable, constant oxygen layer on the anode°
, In contrast te these conditions, the experiments of this work were per-
formed in a cell open to the air; preanodization was 25 minutes; singly
distilled water was used with stockroom H2SO 4 (98.5% by weight)_ Con-
- tamination of the solution and the electrode surface was inevitable.
However, when one considers the ultimate use of the water electrolysisj-
{ cell, the lack of purity of experimental conditions is easily justified,
The actual cell in space cabla operation w_ll be operating ou ai[ whichi
contains water vapor exhaled by the cabin's occupants. This is certainly
i not a pure system. Therefore_ experimental tests were performed without
I strict regard for system purity. The excellent agreement of experimental
..
results with literature values shows that system purity was a minor
! experimental factor; this was most likely dt_e to the large electrode azea,2
61,9 cm , which would "average out" any impurlty effects.
Finally, with regard to the "free e!ectr¢lyte" cell results,
_, one notes that IR losses only become signi£1cant at a current density
above 10-2 A/cm 2 or 700 mA, Minor e_rors ±n calculation _esult from the
inaccuracy of the measurement of the d_stance between _he anode and
cathode, in general, a distance of 2,5 cm was used The actual cell
" 00000002-TSA08

- 98 -
in spaceship operation has a design anode-caLhode separation of approxi-
mately 0.i em, This small separation gives a negligible IR loss, and
only a ver_ dry electrolyte could cause a measurable IR loss. However,
as will be demonstrated later, a dry electrolyte has more serious
consequences than an increased IR loss. Therefore, in the actual cell,
IR losses do not constitute a significant portion of cell overvoltage.
2. Standard Cell Results°
The results of experiments performed on the standard cell
IL apparatus are presented in Figures 20 to 22. There was no need to
eorreet these curves for IR loss because the current was never high
enough (approximately one amp) for IR loss to have a significant effect
(greater than i0 mY). ._
Two features of these results are immediately evident:
1. A difference in the current-voltage curves of the upward
I and downward voltage scans.I
2. A linear semi-log region and a non-linear, sharply
increasing high-voltage region.
The difference between the upward and downward scan results
{ is due to experimental technique as described in the discussion of the
I free electrolyte.
The second evident feature, namely the existence of two regions
of the current-voltage curve, is unexpected. The initial lineal semi-log
region has the typical oxygen egolution parameters. Slopes range ftom
0.15 to 0.177; exchange current densities range from 8.5 x 10⁻⁹ to9-
9.2 x 10 -10 . These are in good agreement wlth the literature values for
anodie oxygen evolution.
There is no reason, a priori, te expect the non-linear semi-log
L
i-
00000002--I-SA09--

- 99 -
region of tilecurrent-voltage curves. This _eglon begins at cuLrent
densities between 10-3 and 10-4 A/cm 2. It is characterized by an in-
creasingly steep rise in voltage with respect to current density.
There is one signlfleant feature of the standard cell current-
voltage curves which is not readily apparent. The magnitude o£ the
current densities at h_gher potentials varied significantly among ther_
standard cells. In other words_ the eharacter'istios of the non-linear
semi-log region vary widely among the various standard cell assemblies. L.
For example, at a potential of 2.61 V vs NHE the current density is
1.3 x 10⁻² A/em 2 in one case and 3.6 x 10⁻³ A/cm 2 in another. Similarly,
the deviation from linear sem_-log behavior begins at significantly
different current densities. -.
The explanation of this non-linear section of the standard
cell's Tafel plots is the heart of the discussion section of this work
Such an explanation if pursued below in the comparison of results of
the "free electrolyte" cell and the standard ¢ell_..(
3. Comparison of "Free Elect_olyte" Results and Standard
Cell Results.
_ Flgure 24 is a comparison of the downward scan current-voltageI.I curves of the "free electrolyte" cell and the standard cell The "free
electrolyte" cell displays a llnear Tafel plot which is explained above.
The standard cell has a linear Tafel region and a non-linear region. The
standard cell current-voltage curve is essentially the same as that of
the "free electrolyte" cell at lower current densities (10-6 to i0-4 A/cm 2)[
but diverges at higher current densities. The standard cell _h:_s
lo_e_ current densities at the same voltage than that of the "f_ee elec-
trolyte". Moreover, the dlve£gence increases with Increasing cu[rent
i • . | II I • Im • , • , m,
00000002-TSA10

- i00-
densities (or increasing voltages). For example_ at an anode potential
of 2.13 volts vs NLIE the free electrolyte eurrent density ls
1.30 x 10"3A/cm 2 and that of the standard cell is 5.6 x 10⁻⁴ A/cm 2,
while at an anode potential of 2.33 V vs NHE the free electrolyte current
density is 1.85 x IC-2 A/cm 2 and that of the standard cell is,!
2.10 x 10⁻³ A/am 2.
One notices that the current-voltage curves of both cells
are not identical at lower ou_ent densities. The difference is very
minor and is due to different anode pretreatment conditions. Although
all cells were operated with 25 minutes of preanodlsatlon at approxi-
mately 0.8 aI_s, other preanodlzation conditions effeeted minor differ-
ences in the Tafel slopes and intercepts. For exampled the standard
cell apparatus was disassembled after a set of data had been obtained,
which caused the anode to be removed from the sulfuric acid solution for
I a time. This had minor effect the nature of the platinum surface;a on
l
consequently, a minor difference in the Tafel slope and intercept is-i
observed.
At this point it is henefiolal to briefly summarize the
I. experimental results of this work, before interpreting them. These
I results oan be listed as follows:
i. The "free electrolyte" exhihits Tafel behavior throughout
the current density range investigated, when the results
ere corrected from IR losses.
2. The standard cell follows Tafel behavior below _0-3 to
10-4 A/cm 2 and then deviates fzom the linearity of the
semi-lot plot, This deviation is toward lower current den-
sities than the "free electzolyte" c_ll exhibits at a given
_1 il II II ] I I
I fl II I I I I I
00000002-TSA11

- JOI -
potcnt:la.l..
3, The standard cells exhibit _<tgnl_icantly different be-
havior in the non-linear portlon of the semi-log current-
voltage plots.
B. Physical and Electrochemical implications of Experimental Results,
'!{Why does the standacd cell behave as described above? Appar-
ently, the sole limiting step in the electrochemical process is not
electron transfe_ at the anode surfacer because the standard cell does
not exhibit Tafel behavior at all potentials investigated. There are
several possible reasons which might explain the aforementioned phenomena.
The possibilities are:
i. Concentration polarization.
, _ 2. IR losses.
" q 3. Adsorption.
I 4. Absorption of water.I
i_ 5. Surface coverage by oxygen.[ -
It i_ important to be certain that any explanation co_ers not:
only the experimental Kesults o_ this work but also the findings o£
I previous studies, especially those of Bloom (8). lu particular, any
I e planst onor"theory"mostta eintoaccoontthapositivee eotswhich resulted from cycling Bloom's standard cell.
i: .....
_,: Each of the above possibilities is discussed in detail below
_', by I) assuming the theory i8 correct_ 2) presenting evidence to support
the theory, 3) presenting evidence to negate the theory, and, 4) evaluat-
_ " ing the theory by weighing the evidence.
i. Concentration Polarization.
The possibility and likelihood of concentration polarization at
00000002-TSA12

- 1.02-
Ihe anode has been discussed above in "l,ite_sture Sea[ca" section. In
partlcu].ar, Bloom (8) gives an approximate mathematical approach to show
that concentration polarization is negligible. This author has already
pointed out in the"Litelature Search" section that one of Bloom's assump-
tions is possibly incorrect, namely that the dlffuslvlty of H+ in a{
silica gel matrix could be considerably different from its diffusivlty
in sulfuric acid, Because of thls-posslble erroz_ Bloom's conclusion
that negligible concentration polarization exists is suspect.
Clifford et.al. (13) claim that there is strong concentration
polarization. They present data_ which, when corrected for !R loss_
strongly negate their claim. Clifford gives a Tafel plot with a slope
and intercept which agree well with the literature values for the anodlc
evolution of oxygen; yet, he does not recognize this and still claims
eonoentratlon polarization to be the major component of anode overvoltage.?
I His data clearly support eleotron transfer control. One must conclude
that he has misinterpreted his _esults_ This has also been discussed in
the "Literature Search" section.
Suppose that concentration polarization does indeed exist in the
4 experiments presented in this work end in Bloomfs work. Then coneentra-
tion polarization must explain the follGwing phenomena:
i. Current densities ere lower than expected.
2. There is improvement of the electrochemical system after
it has been turned off for five secends.
As the anode potentlal Increases from 1,7 V vs NHE toward
higher poteatlals_ clectrochemleal kinetics dleta£e that oxygen must be
evolved faster and faster. The higher the voltage, the higher is the
current and evolution of oxygen. This requlres_ also, that a given
• i
00000002-TSA13

- ].O3-
water molecule must ba able to diifuse to the anode as rapidly as It
reacts at the surface. If the diffusion p_oeess _s slow compared to th_
rate of reaction, tilecurrent will be limited by the rate of diffusion.
This rate will necessarily be slower than the electrokinetic process,
and hence a lower current is obtained. This agrees with the experlmantal
results of this work.
Consider now the second pointj that of improvement of cell con-
d:!tions b_ turning the cell off. Suppose that Bloom's eel3 is operating
and n concentration gradient of water exists near the surface of the
electrode. What happens when the cell is turned off? The d_ffosion
process contlnues_ independent of whether or not the cell is connected
or disconnected; the diffusion process occurs in a dlrec_ion so as _o ..
relieve the concentration gradient. More water molecules become
available at the surface. When the cell is reconnected the initial
current is higher due to the presence of more water molecules at the
anode surface. This agrees with Bloom's expezimental results,
! Conceivably, then, concentration can be seen to explain the
i observed phenomena. However, closer consideration of what should|
_J&'_ii:I actually occur if concentration polarization were the eontrolllagfactor leads to some further hypotheses, First of all, if diffusion
" I controls the rate of reaction (l.e. cuzrent), then the cu_rent must reach
i a constant or limiting value (see "Theory" section)_ As the water
2
-- i diffuses toward the 8urfa&e, its rate depends only on the physical
_ properties of the system, not the anode potential. As the poten_iaI is
increased_ the reactlen rate can only be as great as the rate cf di£fuslon
of water molecules to the anode surface. This depends solely on the4
diffusion coefficient and mixing effects_ which are not funetlens of the
00000002-TSA14

- ¸1.04-
po_eN_!n], No llmlting eurteILt was eve_ reache_l Jn dlese experiments;
the potential was increased a_, hlgh a_ 3 volts w NHE. Although Ehe
standard cell current-voltage plots seem to approach a limit:leg current,
one must real_ze _hst these are sem1-1og plot_; on linear coordinates,
no semblance of a limiting cu_ent is approached.,!
Secondly_ consider the relieving of concentration "stresses"L,
whleh would occur while the cell is disconnected. The diffusion of
water molecules to the surface of the electrode must be rapid enough so
that significant improvemen_ of the power characteristics occurs in five
seconds. Clearly, creation of a diffusion gradient in five minutes can-
not be relieved by diffusion in five seconds.
! In light of the above considerations, the existence of signifi- .-
cant concentration polarization can safely be discounted.
2. IR looses.
I Although IR losses are discussed above, not all aspects ofI
this phenomenon have been investigated to this point. In particular_
in the standard cell experiments of this work, a membrane is present in
the cell which is not present in the "free electrolyte" call. Secondly,
I_, in Bloom's experiments water is absorbed by the gel from the passing air
stream and this decreases cell resistance. These two points aze con-
sldered separately below.
Although there is an additional resistance due to the presGnce
of the membrane_ this was originally as3umed to be negligible. The
membrane was saturated with 8M H2S0 4 fo_ two weeks prlot its use In d
experiments. Suppose, howeveL, that the membrane does have a large
resistance. This could account _or a decrease in current (compared to
the "free electrolyte"). This could no___taecount_ however, for any
O0000002-TSB01

- 105 -
improvement obtained by cyc;_,ng. The memhzane resistance I_ noc a func-
tion of time; hence, no improvement in current would be expected from
cyclic oFeratton of tlle¢ell_ In conclnsion_ lazge membrane [as,stance
is not a real poBsibility in explaining improvement in cell performance
due to cyclic operation.
Consider what happens =o the gel electrolyte during the "off"
cycle of Bloom's experiments. Watez" is abeozbed from the passing humid "
air stream. This has the effect of lewerlng the reslstance of the elec-!
trolyte, hence increasing the current through it once the cell is re-i' connected. However, a simple mass balance I shows that during the five
:seconds in which the cell is disconnected, the total amount of water in
the cell increases by less than 0.005% of the original amount. This
increase in water content is negligible and has no measurable effect on
i J the electrolyte resistivity. Another negative consideration is the
j i =rratic current behavior at high currents, as observed In the expert-
!
ments of this work. A slmple IR loss is a smooth, continuous effect.
Furthermore_ one should consider the wide variance in &ell behavior
among standard cells. One could azgue that the cells were prepared
I_ diflerently in terms of the amount of gel applied and that thls could
I account for the IR loss being different among s_anda[d cells Bl::om (8),
however has shown that the amount of silica in the gel (i0 welght per
cent) has very little effect on the reslstiv_ of the elect:oiy_e:
Therefore, the resistance due to the gel is essentially the bame among
standard cells. Likewlse_ the membrane resistance is Idential fzom cellt
LT. ....
IThls mass balance was performed by using the late of water absorption
data of Conner (14). These data ware checked (by Faraday's law) against
Bloom's steady state current of 0.92 amps. Agreement was found to be
within 3%_ hence verifying both Connoz's data and Bloom's current mea_uze- ,,
ment technique. (See Appendix.)
O0000002-TSB02

- 106 -
to ceil. Therefore_ ]R losses cannel explain the vaey_ng behavior of
the standard ceils.
With so much evidence against it, iR loss cannot be a real
possibility in explaining tile _esults of this work and of Bloom's (69)
work.
3. Water Absorbtion and eye,voltage Decrease.
A net amount of water is absorbed by the electrolyte during
the "off" cycle; this causes s deorease in the concentration of the
sulfuric acid electzolyte According tc the findings of Kheifets and
I Rivlin (51) and Eflmov and Izgaryshev (23)_ a shift toward a lower H2S04concentration causes an increase _n currenL The amount of this shift
depends on the concentration and the potential. According to the data of
Efimov and Izgaryshev, (see Figure Ii) Bloom's experiments were performed
in a very concentration-sensitlve range. Hence, a small change in
i produce a zelatively large changesulfuric acid concentration could inI
cu_rent (at a given potentlal). However, as pointed out in the arSu-
ment against signiflcaut IR losses, the amount of water absorbed by the
gel electrolyte in five seconds is very small compared to the total
f
_, amount of wate_ in the electrolyte. But, there is one fuLthe_ con-
sideration hele. The absorbed water can be considered to exist only at
the p_otruding electrode surface In th_s case, the amoun_ of water
absorbed must be compared to the total amount of water which exlsts in
the Nernst diffusion layer. If one takes a common value of 0.005 cm as
[_ the t_rLokness of dle dlfiuslon layer and compares the amount of water
absolbed tc the volume o[ the dlffuslon layet_ one hnds that the
change in concentration in th_ dilfusion laye_ is omly 0 13% (_e cal-
culatlons are pLe_(,nted in the Append,x). B_ examining Plgu_e _i, one
O0000002-TSB03

- _O?
can see that this composition change has a sma]l effect on the current.
A further consideration is that water adsorption could not
cause the non-linear section of the Tafel plo_s presented In =his work.
Since the experiments of this woLk were carried out in an essentially
infinite supply of 8°0 M H2S04, water adsorption could have had no<
effect on the experiments. The electrode surface "saw" only 8.0 M H2SO 4
at all times. Hence, it can safely be concluded that water adsorption
is not a viable explanation of experimental results.
4. Adsorption,
The standard cell data of this work bear a definite similarlty
to the data of Efimov and Izgaryshev (see Figure ll). On a current-
voltage plot a Tafel region is followed by a region of steep slope. The
data of Efimov and Izgaryshev exhibit another Tafel region after the
, region of steep slope; however, their anode potentials are considerably
higher in the upper Tafel region than any of the potentials investigated! in this work. Nevertheless, the question a_ises as to whether or not
(the presence of silica gel could act se as to enhance the adsorption
p_oeess. As in previous cases, the discussion continues assuming that
i this is so_ i.e, the standard cell results are due to adsorption
_rf!_ phenomena,
i The first point to b_ addressed is that of the "Jumps" in
current which are observed at higher current densities. One would not
ordinarily expect this type of phenomenon in an adsozptlon process.
_,_ Current-voltage behavior which accompanies ordinary adsorp_lon processes
is smooth. Howevez, the anodic evolution of oxygen has been shown (23)
te possess this erratic behavloz. Efimov and Izgatyshev explained this
in the following way: The species which are abou_ to be adselbed (e.g-
).
O0000002-TSB04

- 108 -
sulfate and persulfate ions) are violently disturbed by Ehe oxygen
bubbles evolved at the surface, Hence, the adsorption of these specied
is somewhat irregular. In support of this interpretation, Eflmov and
Izgrayshev cited the improvement due to stirrlng. They noted a 20-30 mV _
enhancement caused by more continuous adsorption of the sulfate and}
persulfate ions. Hence_ the above explanation of Efimov and lzgaryshev
could account for the unsteady current behavior noted in the experiments
of this work.
The most important question to be asked is whether or not this
proposed adsorption phenomenon can explain the increased current caused
by Bloom's cycling (8). Consider one complete cycle:
a. The cell is in operation. ..
b. The cell is disconnected for approximately five seconds.
c. The cell is then reconnected.
Each of these steps in the cycle is discussed separately below:
a. The cell is in operation: At the anode surface there are
two competing adsorption processes. The first is the
adsorption of 02 and formation of amonolayer of adsorbed
_,_ Oxygen. This process enhances the evolution of oxygen
I_ and increase in The second (proposed)causes an current.
adsorption process is that of sulfate and persulfate ions.
According to the data of Eflmov and Izgaryshev (23), this
decreases the current. The relative rates of adsorption
of oxygen and sulfate and persulfate ions are unknown,
I b. The cell is disconnected: Evolution of oxygen drops rapid-
ly. The species which were adsorbed during cell operation
are subsequently desozbed. The oxygen monolayer desorbs;
&
O0000002-TSB05

I
i
" - I09-
this is deterimenual to _he evolution o[ oxygen, The
sulfate and pezsulfate ions desorb; this enchances the
evolution of oxygen° The relative rates of d_esorption
are unknown,
•3i c, The cell is reeonn=oted. Oxygen evelutlon begins i_araedi-
ately on the anode surface which is present at the end of
the second process. The initial rate of oxygen evolution
depends on the nature of the anod_ surface, If the surface
of the anode is imp_oved over what it was before the cell
was disconnected, the initial current will be correspond-
ingly higher. The converse is also true. Hence, it is
possible to obtain ap. increase in initial current due to
cycling. Obviously, this depends on the relative rates of
_. adsorption and desorption of the various species:
The "nature" of the anode surface can be described by theI'
c
, coverage_ O, of each species_ The greater the coverage by adsorbed 02.i
the larger the current. The greater the cuv_zage by sulfate and per-
sulfate io_s_ the smaller the current A bare Pt site £s better £cz the
_ evolution of 02 than a site with adsorbed sulfate cr persulfate lens.
It is worse than a site wlth an adsorbed 02 molecule.
Bloom further notes an optimum "of_" cycle tlme flan thib
---" i be explained by the above adosozptlon and desorption p_ocessas? This
i question is equivalent to one which asks if the relatlve adsozptlon
W-,_."_:= and desorption rates can be such that tile surface _eaches an optimum
state. The answer is clearly yes Fat example_ suppose that when the
cell is disconnected_ sulfate and pe_sulfate _ons desorb rapidl_ and are
essentially desctbed after flx,e seconds. Any extension at thlw "off"
O0000002-TSB06

- ll0-
time beyond f_ve seconds will be detrimental to tile anode surlace; 02
will be desorbing and bare Pt sites will he formed. This is not a net
benefit to the anode surface. Similarly if the "off" time is less than
five seconds, all the sulfate and persulfate ions will not have desorbed.
Consequently, current will not be as great as it could be, once the cell
is reconnected. Therefore, an optimum "off" time of five seconds may
exist.
One other point to be considered is the difference in cyclic
behavior between electrode materials If adsorption processes exlst_ one
would expect the specific behavior to be dependent on the type of elec-
trode material. Adsorption and desorption rates could exist which fit
the experimental data of both electrode materials which Bloom studied. -_
It has now he_n established that adsorption processes, as
described above, could account for the important results el this work
I and Bloom's work (8). It must furthermore be established that thesej adsorption processes are consistent wlth other less important observa-
tlons.. i
I
The most obvious inconsistency lies in a eomparlson of the
i_ standard cell current-voltage curves of this work and those of Eflmov
and Izgaryshev, The steep slope of their work begins at current densities
of 10 -2 A/cm 2 whereas this occurs at 10-4 A/cm 2 in this work. Since
there was no steep slope in the "free electrolyte" results o_ ghls work,
! one must conclude that the proposed adsorption is due to the presence of
I_ silica. However, silica was o_iginally chosen fo_ the water vapor elec- ,
tLolysls cell because it is extremely inert, in tact, commercial silica,
such as that used in this work, is made by a process using a sulfuric
acid bath. One would not expect the silica gel used in these experiments
O0000002-TSB07

i -II] -
to affect the platinum surface so am to make it sensitive to adsorption.
Strong evidence against the proposition c£ significant adsorp-
tion processes is the remarkable variation which was noticed in the
current-voltage behavlor of different standard cells (see Figure 23),
_i The example given above is that a_ an anode potential of 2.61 V vs NHE_
one standard cell had a current density of 1,3 x 10 -2 A/em 2 and another
standard cell had a current density of 3.6 V 10-3 A/cm 2. This is a
difference of three hundred percentl Even if adsorption processes are
responsible for the standard cell behavior and silica enhances these
adsorption proeesses_ there should not be such a large difference in
behavior from cell to ce.:_, The sili¢a gel used in all experiments was
taken from the same hatch, Since the silica gel itself did not differ ,_
from experiment to experlment, this cannot be responsible for the unusual
differences noted above,
5. Oxygen Covera__e.
Thus far, all of the conventional posslbllitles have been
shown to he inconsistent with experimental results. Hence one must turn
1.
to an "unconventional" explanat!on of the experimental results° YetjJ
•_.(:- it is possible to learn much from the type of arguments presented in the
discussion of the conventional posslbilltles, In partlculaz, the argu-
ments regarding electrode surface coverage a_e attractlveo
A fundamental difference between the standard ceil and the
"free eleetrolye" cell is the presence of a thickj viscous electloiyte
covering the inode, it is pcsslble, =helsfore, that evolved oxygen will
have dlffzeulty In escaping f_om _he electrolyte Io f_n_ it is
possible that an evolved oxygen bubble could [emain on the surface of
the electrode until conditions are su£h that it will escape If bubbles
T
00000002-'1"S808

- ].12-
.............................do remain on the surface, than the area available for electrochemical
reaction is decreased. Consequently, the cell current is less and
current density based on the total cell area is also decreased. In
other words, the explanation being proposed here is this: Because of
the presence of a thick, viscous electrolyts on the surface of the elec-{
trode, evolved oxygen bubbles are trapped on the anode surface. This
decreases the area available for electrolysis. Further implications of
uhis "theory" are explored below.
Consider how the above argument applies to the results of this
, work. First of all, the difference between the "free electrolyte" be-
havior and standard cell behavior is most pronounced at higher currents.
One might expect that, if oxygen is trapped on the surface, the amount
of electrode surface covered by gaseous 02 would increase with increasing
oxygen evolution. This is precisely what is found_ Joe, the higher the
current the more pronounced is the surface coverage effect. Consequently,
the current density characteristics of the standard cell deviate most
from the "free electrolyte" behavio_ at higher currents.
The mast natural question at this point is, "Why doesn't this
deviating behavior show up at even lower current densities?" There are
( two possible answers: I) The rate of oxygen evolution is so small at low
current densities that essentially no measurable surface coverage is
observed_ and 2) the evolved bubbles might be so small that they easily
find a path away from the electrode au_iace.
LThe proposition of bubble entrapment is attractive from the
'_ standpoint of explaining the high degree of current "Jumps" or unsteadi-
ness at high currants. One would expect that if a large bubble breaks
loose from the surface, there would be a small but rapid rise In the
% O0000002-TSB09

- 113-
observed current.
Bloom's results can be treated by almost ideutlcal surface
coverage argume_ts as given for the adsorption processes, The following
situation can easily be hypothesized: The cell is in operation; oxygen
bubbles cover p, Lt of the electrode surface. These bubbles have reached
a steady state where they are Kemoved into the passing ai[ stream at the
same rate they are formed on the surface. The cell is disconnected, No
more bubbles are evolved; however some bubbles still escape f_om the
electrode surface. After five seconds the cell i8 reeonne&ted. Now_
the surface has virtually no bubbles remaining on it. Therefore, there
is an initial current surge utilizing the full electrode surface_
Gradually, the surface reaches a steady state coverage agaln_ and the
cycle is repeated.
The most important assumption in this explanation is that the
_i I bubbles can escape from the surface in a matter of seconds when the cellT
Iis disconnected. It is important to keep in mind that the bubbles must
not necessarily be completely removed from che gel into the passing air
_" stream, The bubbles need onl_ be removed from the el@ctrode surface,L
f This could be a very small distance indeed. All that is required for a
_ current surge is that _he anode surface be in contact with the sulfuric •
acid solution and that there be few or no "baLe spots" on the electrode
_ surface.
"' " Although the nature of oxygen bubble removal is unclear, an
_ analogy to Bloom's fuel cell effect appears attractive, Bloom noticed
" that when he turned his cell off it "acted as a fuel cell, consuming
; hydrogen and oxygen to make water". He noticed the bubble in his
. hydrogen collection bubble meter drop steadily, _heLeby signifying the
• ..... • It i • ,, _ ....... _ ......lllllrl , I Ill _=i • .....
I
O0000002-TSBIO

-]1.4 -
eonstampt_on of hydrogen, llad tllehydrogen not been In a closed system
(i.e. sxmply vented instead of trapped by a soap bubble in the bubble
meter), Bloom would not have seen a prolonged fuel cell effect. The
hydrogen would have escaped into the atmosphere instead of being "sucked
in" by the cell. Nevertheless, this fuel cell effect raises the interest-'_I
ing possibility that any oxygea and hydrogen remaining on the surface of
the electrode will be consumed by the fuel cell effect, In the case
proposed here, oxygen and hydrogen are both trapped by the viscous gal.
This would mean that the phenomenon of bubble entrapment by the gel on
: the electrode surface not only causes lower than expected currents but
i5also causes their rapid removal when the cell is disconnected.
The oxygen bubble can now be seen as having two possible paths
for removal from the electrode surface: i) natuzal density differences,
surface forces, and surface tensions, and 2) the fuel cell effect.
fI Bloom's investigation of cyclic behavior shows that different
" electrode materials exhibit different cyclic characteristics. Although
these findings have already been shown to be suspect (see '_iterature
Search") they are discussed here. In partleular, in the immediate region
I of zero "off" time, the specific power consumption of b_ight platinum
I with decreasing time, the reverse the platimum-increased "off" of
tantulum cell case. At first glanQe, these results appear to contradict
the oxygen entrapment explanation. Platinum-tantulum has a higher
' specific area than b_ight platinum. Consequently the currant density
L_ . should be higher at a given potential and oxygen entrapment should also
be greater. One would therefore expect more of an entrapment effect on
the platinum-tantulum screen than on Lhe bright platinum screen.
Bloom offers an explanation for the phenomena discussed above,
A
O0000002-TSB11

.115 -
This turns out to [a.t very w¢.l.l lnt_ the plctuge of oxygen entrapment
and fuel cell removal of entrapped oxygen, Bloom noticed a d_£ference
in the degree to which the tuci cell reaction was maintained on the
Pt-Ta electrode and on the bright platlnum electrode ]n partiuular he I_
noted that the Pt-Ta electrode used up the hydrogen very quickly and
exhibited s strong fuel cell zeactlan. The bright platinum electrode
did not exhibit as strong a fuel cell react£on as the Pt-Ta electrode,
and_ In faot, was relatively weak. If this is true and the theory of
oxygen entrapment is held, then one would expect that in the neighborhood
of zero "off" time more oxygen would be removed from the surface of the
Pt-Ta electrode and its specific power consumption correspondingly lower
than that of the brlght eleotzode. This is, in facE, what Bloom
observed. It was only in this area, i.e. specific power consumption near
zero "off" tlm% that Bloom noticed a difference between the two electrode
Ii types. Why this different susceptibiligy existed for the fuel cellreaction is still another question. Bloom offezs a possible explanation
I.cf differences in the adsarbed conducting monolayer of oxygen on the two
- types, but conoedes that,"No explanation Is prcsenLly available for the
1
- -_. effect."
I_' The other path of oxygen removal, l:e. out thlough the gel,p_
-- should alsa be cansidered here_ In this case _ha s_tuatlon Is also
complex.
- If oxygen entrapment oecurs_ then it ls important to consider
-_ what factors influence its enhancement and its abatement- Bubble size
is certainly an important consldetatlon, although [t _s not obviou_ if
smallez o_ lazger bubbles are more easily removed. Simlla/ly_ gel thlck-
. heSS and gel _iscosity are very impor'ant The anode _lace and surface
I I I| '- - '
__ . I--/ "] - _1 I i - i '
O0000002-TSB12

[
- ].]6 -
i{_rce_ also may play a ma:lO[ role in controlling cxy_en entrapment Mo_:e-
ove[_ one suzface might g_ve _].se to small bubbles and another [o ].alga
bubbles. The speei£1c pretreatment of a gives e]_ct_od6 mat:e[inJ m,ly also
be a factoc, In other words_ different electrode_ of the same basic
material may exhibit different bubble forming and entzapplng ehazacte_-
istzcs0 All of these factors must be taken into account to be able to
safely predict the behavlor of a given cello Obviously, little is known '
about any of these factors. Therefore, particular xesults such as Bloom_s
work on different electrodes, are extremely difficult to evaluate. For
exa;nple, the bright platinum screen might evolve very small bubbles
which are more easily removed from the electrode surface through the
gel than the bubbles generated by the Pt-Ta electrode° At present_ there
ks no way of determining exactly what occurs at a particular electrode.
Finally, there is the interesting result of this work that
there can be significant differences in the current-voltage relationship
from one standard cell to anothero This can be explained by the fact
that there is no rigoroug_ standard method to spread the gel onto the
electrodes, If the Eel thickness varies from standard cell to standard
I cat1, then the degree of oxygen bubble entrapment will also vary, This
I is what most likely occurs. The gel 18 spread onto the anode with a
_talnless steel spatula. It is pressed through the screen to ensure
total screen coverage_ However_ the gel thickness is not onlform oyez
the screen. Nor is the gel thlekaess the same f com cell _e cell. TheLe
is no way of detezmlning how much the thickness varies_ but it is certain
that there is no specific uniformity. _y_ eutr@pmeat is llkel Z
to vary f[om cell to cell. This is, in fact_ found te he the case, i.e:
£utrent varles significantly from cell to cell at higher voltages,
O0000002-TSB13

- 117-
, Of: a]] the evidence presen[.ed above, very little, i.fany, can
be considered to be po_i_£ve evidenceo All ev.Ldenee has been used to
determine why a partleula_ theory can not prevail, and how one thee[y,
oxygen entrapment, can he shown to account for the accompanying experi-
mental results. However, no evidence has been presented which posit£vely
identifies entrapped oxygen as the "culprit". Instead, arguments have
been presented to show that oxygen entrapment canexplain all.
Three cases of positive evidence are presented below:
i i. The "anode effect'of Eiimov and Izg_ayshev°r
2. Literature mention of oxygen removal to prevent "mass
transfer" effects.
3. Vibration of the standard cell.
The "anode effect" of Efimov and Izgaryshev (8) is not the
same as the oxygen entrapment which is proposed in thls work. It is_
I however, similar in nature. What Efimov and Izgeryshev found was thatat very high voltages (>3.5 V) large oxygen bubbles became paralyz£d on
_"_" the anode surface. The presence of these bubbles caused a sharp decrease
!i in cell_current because available surface area was severely dimlnshed.
_ This is similar to the proposal of this work, namely that entrapped
surface oxygen has a detrimental effect on cell current, Although the
I. cause of paralyzed oxygen on the surface is different in the two cases,
the result is essentially the same_i_. Occaslonally in the literature (e.g, 51) there is a [efe_ence
_ to the experimental technique of passing nit[ogen oyez the anode surface.
Although the reasons given £or use el this technique ale often unclear,
it is usually done to prevent "mass transfer" eiiects, in this ease,
what is probably meant is the Lemoval of oxygen from the eleet['ode sue'face
L
O0000002-TSB14

- i18 -
to ensuFe a continuou_]y "cienr" aut_acc,
Finally, during the experimental work o£ this thesis, the
possibility of oxygen entrapment was realized. Consequently, during
operation at higher currents the cell was banged with the handle of a
screwdriver. The result was a small Jump in the current. This un-
scientific procedure was repeated periodically and it generally produced
t*_r
the same result. The cell unit was assembled very firmly, so that it
was difficult to cause a significant disturbance within the cell itself.
Moreover, the procedure of knocking the cell was limited because this
caused splashing of the sulfuric acid solution in which the total cell
was immersed. This was very hazardous to the operator. Although this
minor experiment is inconclusive, it offers some positive evidence that
oxygen is_ in fact, trapped on the screen. Work is presently in
progress at Battelle Institute_ Ohio, in which the cell is being
vibration-tested. These results could provide further evidence of
oxygen entrapment.J,
Ii
• i
O0000002-TSC01

- i19-
VIIi. CONCLUSIONS AND RECOMMENDATIONS
The exp_rlmental results of uhls work have shown that anode
overvoltage of the electrolysis of water vapor in 8 M H2SO 4 silica gel
eleetrelyte at bright platinum electrodes is electron transfer controlled
thzoughout the expezlmental range of anode poteutlals, The avldence
for this is the agreement between the values of Talel slope s and ex-
change current densities of this work and literature values, Activation
control is also assumed,_to__be the dete_mlning factor at high standard
cell anode potentials_ although the suzface area available for reaction
r
is decreased.
Furthermore, the results of this wozk have been shown to be
compatible with a theory of "oxygen entrapment" at the standard cell
anode. Other possible explanations are discounted for a variety of con-
i tzadictions with experimental results. "O_ygen entzapment" as such, is
the situation whereby ox2_en evolved at the anode surface becomes trappeddue to the presence of a thickj vlsco_S gel eleetroly_e. Such entzapment
i
'-%,
causes a decrease in the available area _e= electrochemical reaction_
Consequentlyj theze is a decrease in 5he effective current density. The
lresults of Bloom's (8) expeziments on cyclic operation of the water yaps[
electrolysis cell ha_e b£en shown to be compatible wlth "oxygen entzapment"
and its removal from the electzode surface when the cell is dleconnected.
The majority of evld6nce for ehe existence of oxygen entrapment
is indirect, Although there is a signlflcant accumulation of indirect
,_- evidence_ it would be beneficial to have an equal arsenal of d_ect
evldence; Uniortunately, little dl_ect_ oz poslt1_e_ e_,idence e_1_ts.
Therefore, It Is recommended here that method_ be devlsed whereby di:-ec£
evldence can 5e obtalned_ This is understandably dli_Icult because v_susl
00000002-T8C02

- i20 -
methods are necessarily excluded due to the nature of the cell. YJbra-
tlon testing, under carefully controlled experimental eonditlons_ could
yield valuable data. Moreover, a fixed method of gel preparation and
application to the anode screen is _ecommended. Finally, quantitative
comparison of results using different gel matrix materials Gould yieldi
valuable information. All of the experiments suggested above deal
with a different aspect of the formation and removal of entrapped oxygen,
a new afea of experimental and analytical investigation which has been
identified by this thesis.
I
i"
O00()O002-TSC03
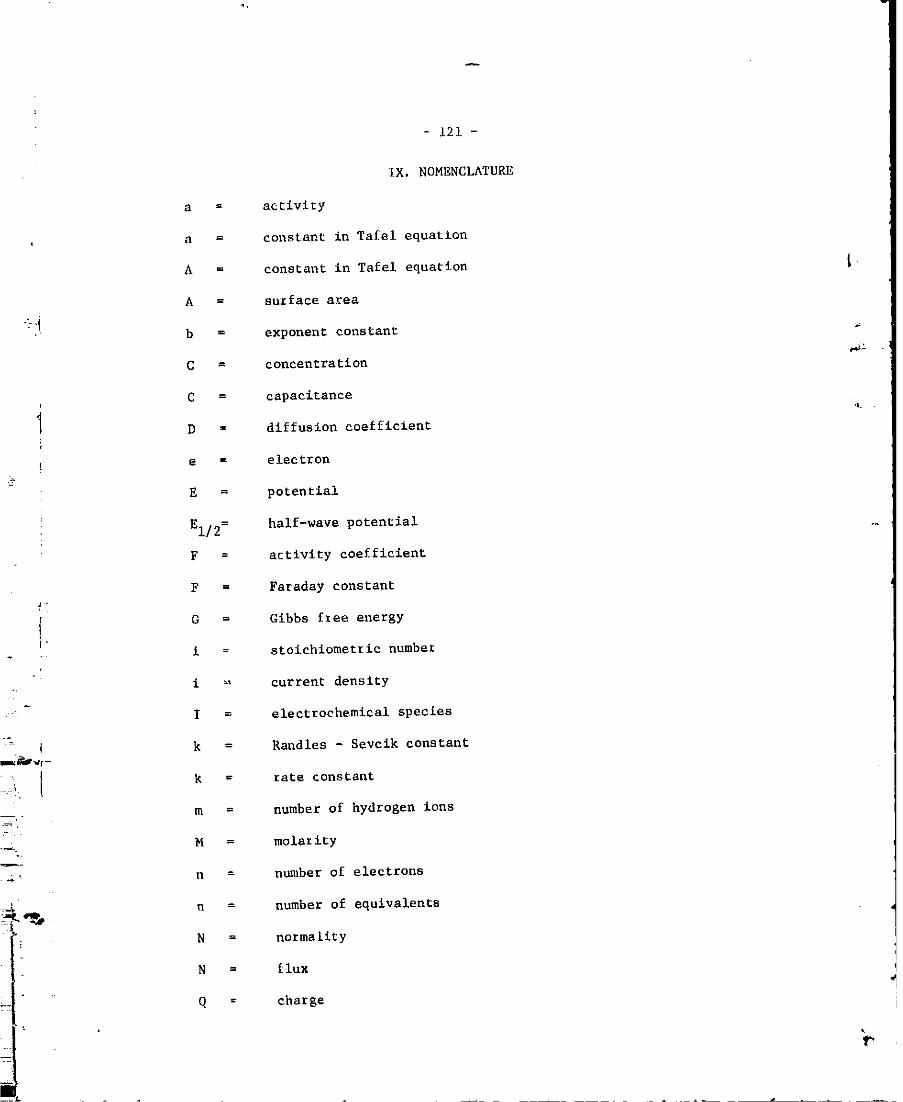
- 121 -
IX. NOMENCLATURE
a activity
a constant in Tafel equation
A constant in Tafel equation _.
A suzface area
"7'ib exponent constant
C = concentration _
C capacitance
D diffusion coefficient
e electron
E = potential
El/2= half-wave potential oo
F activity coefficient
F = Faraday constant
l G = Gibbs f_ee energy
. i stoichiometrlc numbe_
,!• i = current density
_ I = electrochemical species
I k = Randles - Scvclk constant
l k = _ate constant
m = number of hydrogen ions
_. M = molatity
n = number of electrons
n = number of equivalents
_ N = normality
N £1ux
Q charge
00000002-TSC04

- 122 -
r = speed of rotation
R gas law constant
t time _i,
t = transference number
_ T = absolute temperature
V = sweep rate ,_.
x linear dimension
'i z = number of water molecules ' "I
i Subscripts and Supersc,ripts
i_ a = anodic
Ad = adsorption
b = bulk phase
: b backward
I4 c cathodic
d = diffusion
, dl = double layer
f = forward
h = heterogeneous
_-, L limiting
I L-L = liquid-liquid
Ox = oxidized form
p = peak current
Red = reduced form
_h S : standard case
o standard case
k
00000002-TSC05

- 123-
Greek Letters
= transfer coefficient
= diffusion layer
E = electrochemical potential _
e_ = equilibrium potential
= zeta potential
q = overvoltage
@ = Cox/CRe d
= stoiehiometrie coeflicient
p = resistivity
= (Dox/DRed)1/2
,i
/' i
i ¸ .(
, I
i ,
- I."% L
- 00000"00'2-TSC06

- ;[24 -
X. BIBLIOGRAPHY
i. Adams, R. N. El@etrochemlstry at Solid Electrodes, Marcel Dekker,Inc,, New York, 1969.
2. Adams, R. N. Electrochemistry at Solid Electrodes, p. 43 Marcel
Dekker, Inc., New York, 1969, I_
3. Applehy, A. J., J. Electroanal. Chem., 35, 193 (1972).
4. Bain, N. G., Trans. Am. Eleetrochem. Sos., 78, 173 (1940).
5. Beck, T. R. and R. M. Moulton, J. Electroehem. Soe.j i03_ 247 (1956). w
6. Biegler, T., and R. Woods, J. Eleetroanal. Chem., 20, 73 (1969) ....'i
7. Bircumshaw, L. L. and A. C. Riddiford, Quart. Revs. (London) _,157 (1952).
) 8. Bloom, A. M., Center for Air Environment Studies, Pennsylvania State
University, CAES 200-71, NASA Grant NGR-39-O09-123, 1971.
9. BoGkris, J. O'M,, and A. K. M. S. Nuq, Proc. Roy. Soc. (London)
A 237, 277 (1956). "_
i0. Bold, W. and M. W. Breiter, Electrochim. Acta., _, 145 (1961).
¢_ ii. Bowden, F. P.,Proe. Roy. Soc. (London), A125, 446 (1929).
. 12. Briner, E. H, Haefeli, and H. Pillard, Helv. Chim. Asia., 20, 1510(1937).
13. Clifford, J. E., J. A. Gurklis, J._G. Beach, E. S. Kolic, E. W.Winter, A. C. Secrest, J. T. Gates and C. L. Faust, Batelle Memorial
Institute, NASA CR-771, 1967,
i 14. Connorj W. J,, B. M. Greenough, G. M. Cook, Lockhead Missiles and
_' Space Co., NASA Contr,_et NAS-2-2630_ Final Report, 1966.I
L ! 15. Conway, B, E. and E. Gileadi _ Trans. Faraday Sot., 58, 2493 (1962).
160 Conway_ B. E., J. Electroanal. Chem., 8, 486 (1965).
17. Dam_anovie, A., M. A. Genshua, and J. O'M. Bockrls, J. Phys. Chem.,
70, 3761 (1966).
18. deBethune, J, J. and N. A. S. Loud, Standard Aquaeous ElectrodePotentials and Tempezature Coefficients, Clifford A. Hempel, Skokle,
III., 1964.
19. Delahay, Paul, New Instrumental Methods in Eleetrochemlstr>, pp. 48-57, Intersclenee, New York, 1954.
00000002-TSC07

Z
i
!- i_25 -
20. De lahay, Paul, New instrumental Methods in ElecLroehemlstry, pp.17-18, Interscience, New York, 1954.
21. Delahay, Paul, New Instrumental Methods In Electrochemlstry, p_ 69,Intersclence, New York, 1954.
22. Delahay, Paul, New Instrumental Methods in Electrechemim=ry, pp. 133-134, Interseience, New York, 1954.
'_i 23. Eflmov_ E. A. and N_ A. Izgrayshev, Zh. Fiz. Khim., 31, 1141 (1957),
24. Engel, A. J., ASEE - NASA Summer Institute, Final Report, 1967.
25. Feldberg, S. W., C. G. Enke, and C. E. Bricker, J_ Electrochem.,
iiO, 826 (1963).
26. Foerster, F, A., Z. Physlek. Ghemo, 51, 356 (1906).
i 27. Frumkin, A. N,, Electrochim. Aeta., _, 265 (1961).28. Flumkin, A. N., Pzoc, CITCE, _, 396 (1959),
29. Gerovich, M. A., Ro i. Kaganovlch_ V, A. Vergelesov, and L.N. ._
Gorokhog, Dokl. Akad_ Nauk SSSR, ii_44,1049 (1957).
30. Cerlsher, H., Z. Physik Chem: N. F., 26, 223 (1960).
_, 31, Giver, J., Z. Electrochem,, 63, 386 (1959).
i I' 32. Glass_one, S., K. J_ Laidler,and H. Eyring, The Theory of RateProcesses, McGraw - H_ll, New York, 1941.
I 33. G_ube, G , Z, Electroehem., 16, 621 (1910).
34. Haber, F., Z. Anorg. Allgem, Ches_, 51, 356 (1906),
i
_ 35. Hickl_ng, A. and W. H. Wilson, Nature, 164, 673 (1949),
I 36. Hoaz, T. P., Proc, Roy Soc, (London) A142, 628 (1933)_
37. Hoare, James, P., Eleetroehemist_ of Oxygen, Wlley, New York, 1968.
38. Hoare, James, P , Electrochemistry of Oxygen, p 28, Wiley_ New York,1968.
39. Hoare, James, P,, Ele_t_oehemistry of Oxygen, p. 34, Wlley, New York,
[m_ 1968.
40. Hoare, _ames_ P., Electzochemlstry of Oxygen, pp 32-38, Wiley_ NewYo,k, 1968.
41. Hoare, James, P , E%ectroehemlstzy o_ Ox_, p. 84, Wiley, New York,1968.
........... m .....
00000002-TSC08

- 126 -
42. Hoare, James, P., Electrochemistry 0£ 0x_igen, pp. 84-85, Wiley,
New York, 1968.
43. Hoare, James, P., EleetroghemistrM of Oxygen, p. 88, Wiley, New York,1968.
44. Hoare, James, P., Electrochemistry ol oxygen, p. 125, Wiley, NewYork, 1968.
41 45. Hoare, J. P., J. Eleetrochemo Soe., 109, 858 (1962).
46. Hoare, J. P., J. Eleetrochem. Sot., 112, 602 (1965).
47° Hoare, J. P., J. Electrochem. Soe., 11__2,849 (1965).
48. Izgaryshev, N. A. and E. A. Efimov, Zh. Fiz_ Khim., 31, 1141 (1957).i
49. Julian, D. B. and W. R. Ruby, J. Am. Chem. So¢., 72, 4719 (1950).
50. Kaganovieh, R. I., M. A. Gerovich, and E. Kh. Enikeev, Dokl. Akad.
Nauk. SSSR, 108, 107 (1956).
51. Kheifets, V. L. and I. Ya. Rivlin, Zh. Prikl., 28, 1291 (1955). ._
52. Koltoff, I. M. and J. J. Lingane, Polarography, 2nd ed., Interscience,New York - Lon4on, 1952.
53. Krusheheva, E. I. N. A. Shumilova, and M. R. Tarasevieh,
i Elektrokhimiya, l, 730 (1965).I
54. Laitenen, H. A. and C. G. Enke, J. Eleetzochem. Sot., I0___7,773 (1960).
55. Latimer_ W. M., Oxidation Potentials, 2nd ed., Pzentice - Hall,
Englewood Cliffs, New Jersey, 1952.
56. Latimer, W. M., Oxidation Potentials, 2nd ed., p. 39, Pren£iee -
I Hall, Englewood Cliffs, New Jersey, 1952._(_.
I 57. Lederer, E. L., Kollo£d - Z. 44, 108 (1928).i
58. Lee r T. J., J. Am. Chem. See., 74, 5001 (1952). ............
59. Levich, B.j Acta. Physioehem._ U.R_S.S., 17, 257 (1942).
' 60. Levich, B,, Aeta, Physioehem., U.R.S.S., 17, 259 (1942).
61. Levich, B,, J. Phys. Chem. (U.S.S.R.), 2!I_ 689 (].947); 22, 575,"-_ 711, 721 (1948).
62. Lewartowicz, E., J. Eleetroanal. Chem,, _, ii (1963).
63 Lo[enz, R., Z. E].ecktrochem._ 14, 781 (1908).
64. Lorenz, R., and H. Hauser, Z. Anorg, Allgem. Chem., 51, 81 (1906),
00000002-TSC09

- 127 -
65. Lorenz, R. and P, E Spell man, g. _.lekttochem , 15, 293 (1.909).
66, Lorenz, R. and P, E. Spetlnmnp Z. Elekt_ochem,, _, 349 (1909).
67. Nagel, K. and H. Dietz, glecttochim. Acta., _, 141 (1961).
68. Nlcholson, M. M., J. Am. Chem. Soc_, 76, 2539 (1954). _
69. O_d, J. L. and F. C. He, J. Electrochem. See., 118, 46 (1971).
3i70. Parsons, R, and W, H. M. Visschez, J, Electroanal. Chem.,36, 329
(1972).
71. Reddy, A. K. N., M. Genshaw, and J. O'M. Bockris, J_ Electroanal.
Chem., _, 406 (1964)o
72. Roughton, J. E., J. Appl. theme, i ($2), S143 (1951) o
73. Sehuldiner, S., and R. M. Roe, J. Electrochem. Sac., iiO, 332 (1963),i
74. Schuldiner, S., and T. B. Warner, J. Eleetro¢hem. Soe. j i12, 212(1965).
75. Speilman, P. E., Trans. Faraday Sac., _, 88 (1909).
76. Thaeker, R. and J. P. Heave, J. Elsctroanal. Chem., 30, i (1971).
77. Traehtenberg, Isaac, J. Eleetrochem. Sac., _, 376 (1964).
78. Tsukamoto, T., _£ Kambara, and L Tachl, Sbornik Mazlna_od. Polarog.SJezdu Praze, I cong., Pt. I, Prec., pp. 525-541 (1951).
! 79. Vatte_ K. J._ Electrochemical Kinetics, Academic Press, New York,
I 1967.I!
i 80. Vetter, K. I., Electroqhemical Kinetics, p. 232, Academic Press,I New York, 1967.
81. Vetter K. J., Electrochemical Kinetlcs, pp. 283-334, Academic Press,New York, 1967.
: 82 Verier K. J., Electrochemical K_netlcs, p. 25, Academic Press, New
York, 1967.
83. Verier K. J., Electroehemlcal Kinetics, pp 47-52, Academie P_ess,
. New York, 1967_
_ 84. Vetter K. J., Eleetrochemlcal Kinetics, p, 644_ Academic Press, New, York_ 1967.
85, Vetter K. J., Electrochemical Kinetics, pp 22-35, 53-73, AcademicPress, New York_ 1967.
!
86. Watanabe, N., and M.A.V Devanatan, J. Eleettochem. Sac., Iii, 615
._ (1964). _
O0000002-TSCIO

- ].28-
I
.,A
APPENDICES
O0000002-TSC11

;' - ].29-
A. Appendix A - Experimental Data.
The experimental data are presented from whieb Figuros ].8-24
were constructed. The data are presented in tables of anode potential
versus reference_electrode_potential, cell aurzent, and cell current
density. Of course, current density was not a datum which was recorded
during the experiments. However, Figures 18-24 are plots of potential
versus current density, and therefore, current density is also tabulated
to facilitate any checking with the plotted results. All current ,L
densities were obtained by dividing the current by the electrode surface
area, 61,9 cm2, Experimental notes and conditions are presented as they
appeared on the original data sheets. The reference electrode was a
i " mercury-mercurous sulfate sleeve Junction electrode with a potential of
+0.61 V versus the normal hydrogen electrode, +0.0 V.
i
i
00000002-TSC12
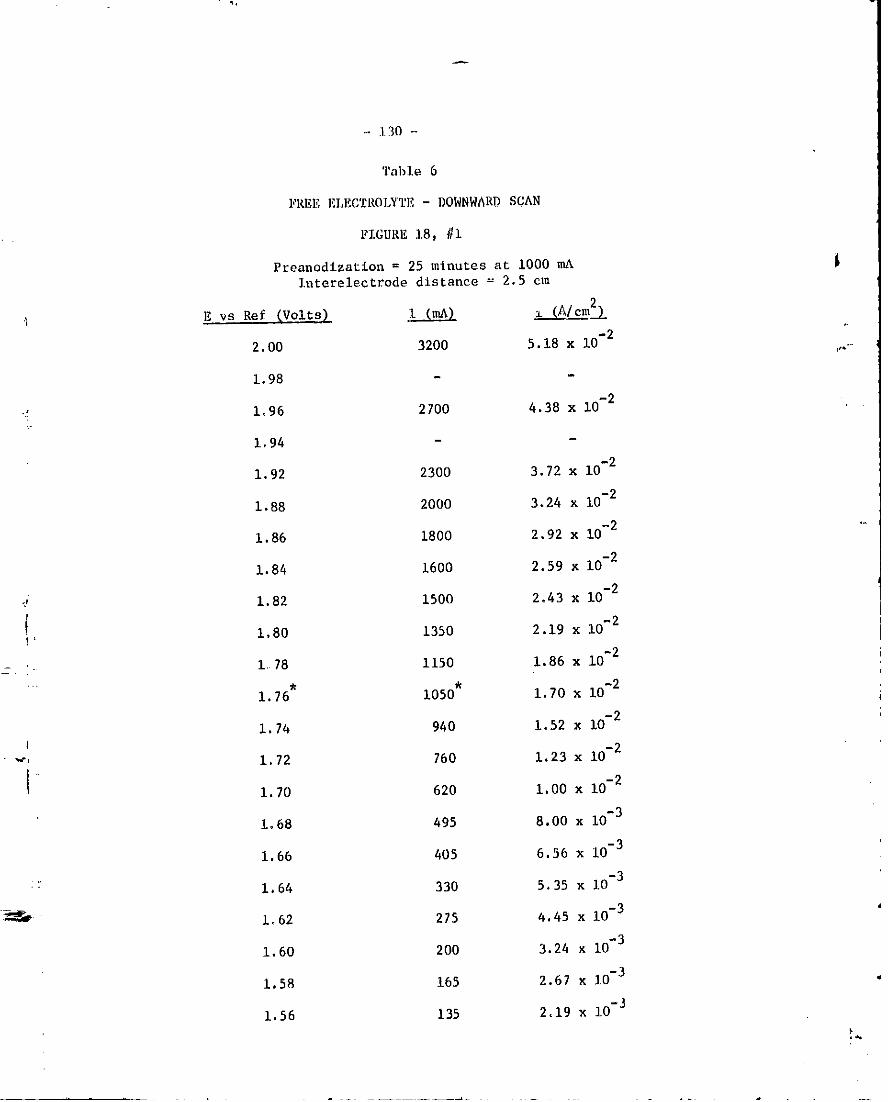
- 13O -
1able 6
I"R}_E/CLgCTROLYTF,_ DOW/_WARD SCAN
FIGUR_ ]8, //1
Preanodization = 25 m_nutes at 1000 mAIntereleetrode distance = 2.5 em
2. O0320O
5.18 x 10⁻²i.98.J
1.962700
4.38 x 10⁻²I.94
1.922300
3.72 X 10-21.88
2000 3.24 x 10⁻²I.86
18002.92 x 10-21.84
16002.59 x 10-2
1.82, 1500
2.43 x 10-21,80
_- 1350 2.19 x 10 -2•. 1. 78
1150 1.86 x 10⁻²i,76*1050"
i,70 x 10-2i,74
"i 940 1.52 x 10⁻²I,72}
7601.23 x 10-21.70
620 1.00 x 10-21,68495
8.00 x 10-31,66: _05
6,56 x 10-31.64
330 5.35 x 10⁻³i.62275
4.45 x 10 -31.60200
3.24 _ 10 -31.58165
2.67 x 10-31.56135
2,19 × i0"J

_q
i
I
- ]31-
Table 6 ((onclnded)
1.54* 105" 1.70 _ tO"31.52
81 1.31 x I0 -3l# i so
56.5 9.15 x 10.41.48
40.0 6,47 x I0-41,46
31.0 5.02 x 10.4
'I 1.4423.5 3.80 x 10⁻⁴
1.42
19.5 3,15 x 10-41.40
14.O 2.27 x i0-4i. 38
12.0 1.94 x 10-41.36
8.40 1.36 x i0"41.34"
6.30* 1.02 x 10-4_" 1.32
4.20 6.80 x i0-5i.30
I 2.90 4.70 x i0"5.L i,28
"!' 1.26 2.30 3.72 x I0"5
1.65 2.67 x 10 -51.24
4/ 1.30 2.11 x i0-5, T 1.22 i.i0 1.78 X 10⁻⁵' i.20
0.81 1.31 X 10.51.18
0.54 8,25 x i0-6i 1.16
0.37 6.0 x 10 -61.14
'_ 1,12 0,285 4.61 x 10⁻⁶
0,19 3.08 x i0"6• *Current Jump noted,
Temp. = 80OF.i
: Air Flow Rate = 24 em3/see.Rel. Hum. = 51_.
,.- 8,1 H H2$O4 solution.

- 132 -
[aisle 7
FREF, ELECtR)LYIE - UPWARI) SCAN
FIG[]RE 19, #2
P_eanodizatlon = 25 minutes at 820 mA
Interelectroee distance = 2.5 cm
: E vs Ref (Volts) I (mA) _ (A/cm21
1.12 i.i0 1.78 x 10⁻⁵
1.14 1 25 2.02 x 10⁻⁵
: . 1.16 1.45 2.35 x 10⁻⁵
1.18 - -
1.20 2.60 4.21 x 10⁻⁵
1.22 - -
1.24 4°80 7.77 x 10⁻⁵ ""
1.26
1.28 9.0 I_45 x 10-4
i. 30 -I
, 1.32 15_0 2.43 x 10⁻⁴
Io34 - -
1.36 30.0 4,86 x 10⁻⁴ !
i
:, 1.38 -mmll-v[
I 1.40 45.0 7,29 x i0-4
1.42 58.0 9,40 x 10⁻⁴
• 1.44 69.0 I,II x 10-3
1,46 91.5 1.47 x 10⁻³
_-_ 1.48 130 2.11 x 10⁻³
1.50 155 2.55 x 10⁻³
1.52
1.54 250 4 04 x 10-3
k_J¢
00000002-TSD01

• - 133-
Table 7 (Couciuded)
E vs Ref (Volts) _
1.56 - -
1.58 330 5.34 x 10⁻³
1.60 - -
1.62 400 6.48 x 10⁻³
i,64 480 7,77 x 10⁻³
I,66 530 8.57 x 10⁻³
"_' 1,68 585 9.46 x 10⁻³
1,70 - -
1.72 690 i,ii x 10-2
1.74 - - ,
I,76 770 1,25 x 10⁻²
1.78
1,80 890 1,44 x 10⁻²
1.82
.., 10-2- _ 1.84 1150 1,86 x
1.86 1400 2,27 x 10⁻²
1.88 - -
1.90 -1.92 1500 2.43 x 10⁻²
1,94
1,96 1700 2,75 x 10⁻²
I,98
" 2,00 1850 2.99 x 10⁻²
Experimental note: At low currents (I-i0 mA) the cur.rent decreased after
a step change in potential.
00000002-TSD02

4,
- 134-
Table 8
DO_,WARD _CAN
FICURE 19, #3
2.O0
1900 3.07 x 10-21.98
i?002.75 x 10 -21.96
i. 941450
2, 34 x 10-2i 92
1, 901250
2.02 x 10-21,88
i.86990
1.60 x 10-21.84
_ 865 1,40 x 10⁻²
1.82 780I' 1,26 x 10-21.80
695 io12 x 10-2: I,78
. 615 9.95 x 10⁻³: i. 76540
8, 75 x 10-3
:j_,,_,j. i. 74 4607.45 x 10-3
-.,. I L 72-: [ 415
6.72 X 10⁻³L • I, 20d
__ I,68 -_ : 310
5,02 x 10⁻³'-_. 1,66
1.64 -22.5
_'_ 1,62 3.64 x 10⁻³
" I.60• 160
2 59 x 10-31.58
.. 130 2,11 X 10⁻³I,56

,i
135-
Table 8 (COncluded)
1,5484.0
i. 52 1.36 x 10-366.5
', 1, 50 1.08 x 10 -3
: 52.5 8,.50 x 10-41,48: 37,5
6.06 x i0"41.46
: " 1.44 -
:_ 1,42 26.0 4.21 x i0-4
1.40
20.5 3.32 x 10-41,3812.3
1.36 2.02 x 10-49.70
1.34 1.57 x 10⁻⁴
7.15 1,16 x 10⁻⁴I.32
5.40 8.75 x 10-51.30
4.10 6.65 x 10⁻⁵"- i.282. 90
4_ 70 x I0":5i.26
I.24
2,00 3.22 x 10.5:_' i,22_- 1.40
1.20 2.27 X 10⁻⁵
!,15 ' 1.86 x i0"5l.IB
- .77 1.25 x I0"5!--" 1.16=
-_ ,60 9,70 x 10⁻⁶-:" I,144.
.4s 7.30 x I0-6_ ," 1,12
;_ Temp.. 80oF. .35 5_67 x i0"6
_ hlr Flew Rate = 24 cm3/See.:_ Re/, Hum. = 50_.
8.1 H H2S04 eolutlon.
_t

- 136 -
Table 9
STANDARD CELL - UPWARD SCAN
FIGURE 20, #I
Preanodiza.tlon = 15 minutes at 800 _AIntereleetrOde distance _ 2.5 cm
i.12
0o330 5.35 x 10-61.14
0.490 7.95 x i0"61o16
0.660 1,08 x 10⁻⁵i 1.18
/ 0. 990 1.61 x 10-51.20
1.45 2.35 x 10-51.22
2.10 3.40 x 10-51.24
2.65 4.29 x 10 -51.26
3.80 6,15 x 10-51.28
4,90 7o93 x i0"5i.30
j 6.50 1.05 x 10-41.32
8,90 1o44 x 10-41.34
12_0 1,94 a 10-4I i_36
W"I 15.0 2.42 x 10⁻⁴i_38 21,5 3,45 x 10⁻⁴I._0
28,5 4 62 _ 10-41.42
" 1,44
47 0 7,60 x 10⁻⁴
1.46
1.48
71.5 1,25 x 10-31.50
93,0 i_51 x 10-31.52
1201,94 x 10-3
1.54
%

- L37-
Table 9 (Coneludefl)
1.56
160 2,59 x 10-31,58
_ 1,60 "no
i.62 3,40 x 10⁻³
i,64265
1,66 4,28 x 10⁻³
, , 1.68_ 330
_ :..... i°70 5,34 X 10⁻³ ,._
1, 72390
i. 74 6,30 x 10 -3
L"
! - i, 76 -"-'-' 450
e 1,78 7,28 x 10⁻³
i.80, 510
t 1.82 8.25 x 10⁻³
1 84
575 9,30 x 10⁻³i,86
1.88655
1,06 x 10-21.90
i,92
690 1,12 X 10⁻²i,94735
1.19 x 10⁻²I,96
L_ 1,98 775 1,25 X 10⁻²
8002,00 1.29 x 10⁻²
Air flow RaLe = 24 cm3/See. 830 1,34 X 10⁻²Temp, = 81¢.F, i
ReJ. Hum, = 5OZ, ,I
Iness".EXpetlmentalNo£e: lnstablllty of Current recorder above 600 _; "Jump- _

- 138 -
Table i0
DOWNWARD SCAN
FIGURE 20, #2
iE vs Ref (Volts) _
2°00 810 1 31 x 10 -2
1.986t
1,9o 725 1,17 x 10⁻²
i.94 - -L .
1,92 640 i_03 x 10-2
1.90
1.88 560 9.06 x 10⁻³
1.86
io84 505 8.18 x 10⁻³
i.82 - -
1.80 430 6.96 x 10⁻³
1.78
-' 1,76 360 5.82 x 10⁻³
1.74
i " 1.72 300 4_86 x lO-3
i " 1.70 - -
1.68 245 3.96 x 10 -3
1.66
1.6/4 190 3.08 x 10 -3
I"_M._- 1.62
1.60 155 2.51 x I0-3
1 58 - -
I 56 115 1,86 x 10⁻³
00000002-TSD07

q,
- 139
Table 10 (Concluded)
1.54
1.52
74 1.20 x 10 -3_,"f 1.50
1o4846
7.45 x 10-41,46
1.44I 27,5
4.45 x 10-41.42
1.40
17.5 2.84 x 10-41.38
1.36
II.5 1.86 x 10 -41.34
1.32
6.30 1.02 x 10⁻⁴
1.30
4.65 7.50 x 10⁻⁵"" 1.28
3.40 5.49 x 10-51.26
; 2.50 4.03 X 10⁻⁵/ 1.24
_-'c" 1.80 2.91 X 10⁻⁵
1.22 -1, 20
1.25 2,02 x 10-51.18
0.775 1.25 x 10 -5_2 1,16
0.60 9.70 X 10-61.14
1--_ _ 0.42 6°80 x 10-6"- i,12
0,33 5.34 _ i0-6 :

- 1./10-
I,_ble 11
STANDARD CELL - DOWNWARDSCAN
I_IGURE22., #3
Preanod1_atlon =. 20 minutes at 700 mAIn_ereleetrode distance = 2,_ cm
2. O0670
1.08 x 10⁻²I,98
615 9,95 x 10-31.96595
9.60 x 10⁻³
i I. 94 5609.05 x 10-3
1,92
530 8,57 x 10-31.90
5008.09 x 10-3
i.88
455 7,35 x 10-31.86
430 6,95 x 10⁻³i.84
4006,47 x 10-3
1o82• 370 5.98 x 10⁻³
1.80
1.78
310 5,01 x 10⁻³I,76
I° 14
. _: 260 4,21 x 10-31.72
I.70210
3,40 x 10-31.68
,._j_ 1.66 1702.75 x 10-3
1.64
I,62130
2,10 x 10-31,60
1.58i00
1.62 x 10⁻³

- /H -
Table 11 (Concluded)
1,5669
1,12 x 10 -31,5456
9,05 X 10⁻⁴': 4• , 1,5246.5
7,51 x 10-41.50
38,56,21 x 10-41o48
27,54,45 x 10-4
1,46 22.53,64 x 10-4
1,4418.I o
i- 2,91 x 10 -41,42
1,4012, 0
1,94 x 10 -4i.38
9,201,49 x 10 -4
; 1,367. 00
1,13 x 10-47 1,34
5,00 8,0% x 10-5• 1.32
4.206,78 x 10-5r
• ,. 1.30
_.' 3_15 5.09 x I-0"5_: _ 1,28
2.353,80x 10-5: ' 1.26IL
_vl 1.90 3.07 X 10⁻⁵:_ I 1.24
_ { 1.22 , 1.45 2.34 X 10-51.20
1,94 _ 10-5" -- 1,200,86
1.39 x 10⁻⁵.... i.180.595
9,61 X 10-61,16
_! 1,14 0.410 6,62 X 10-60,330
5,33 X 10⁻⁶,.... I,120:265
4,28 x 10⁻⁶-- Air Flow Rate = 24 cm3/Sec,: Temp, = 76OF,
_._. Rel, Hum, = 50%
z

742 -
Table /2
STAN1)fiRD CELL - UPI_YARllSCAN
I_'Z{';,URE21, t/4
_.(. 1.12
0.250 6.03 x 10-61.14
0.355 5.74 _ 10-61.16
0.460 7.44 x 10 -61.18
0o720 1.16 x 10-51.20
i=20 1,94 x 10 -51.22
1.60 2.59 x 10-51.24
2.25 3.64 x 10-51.26
2.90 4.69 x 10⁻⁵i.2B
3.95 6.39 x 10-51.30
5.65 9,12 x 10⁻⁵i.32
7o40 1,20 x 10 -4i_34
9_65 1.53 x 10-41,36
11.0i. 78 x 10-4
1.38
14,0 2.26 x 10..41.40
19.0 3.07 x 10 -41,42
26 5 4_12 X 10-41.44
33,05.33 x 10-4
1.46
1°48
Lice'O" 1.50 51.0 _.25 )C 1(] -4
'" 58.0 9.38 _ 10 -41.52
68.0 Ioi0 x 10-3I_54
81_ 01,31 x 10⁻³
1,36120
i,94 x 10-3

- 143
Tab.Ie 12 (Conttnlxad)
1,58
1.60
_..f 170 2.75 x 10-31.62........................1.64
2303.72 x 10-31.66
1.68; 290
4.69 x 10-31,70
• I.72,' 350
5.66 x 10⁻³I.74
1.76415
6.70 x 10-31.78
,_
7.92 x i0-3
1.80490
1.82
In'"
/ ! 555 8.96 x 10 -31,86
/: 1.88 -
"c' 620 l,O0 X 10-2
! l. 90
t -1.92 700 1.13 x i0-2
i.94 735 I.19 10-2
X
1.96
I.98
F_I 770 1.25 x 10⁻²:.: 2.O0
815 1,32 x 10⁻²
L *Gradually decreat_in8 current after Step chanse in POtential,!.
:- Experimental note: No l_mitin8 eu_t+entleached even up to 3 amps.

- 144 -
f
Tnb.l.o 1.3
$TANDAp_QCELL - UPWARDSCAN
F_GURE 22, #5
Prem_odization = 20 mtnutes at 850 mA_nCerelecCrode distance _ 2.5 cm
E vs Re_1.14 L
0,21 3.45 x 10 -6.1.16
.......... 0'30 4.92 x i0 -61.18
0.41 6.72 X i0-61.200.56
1.22 9.20 X 10⁻⁶O.90
1.24 1.48 x 10 _5
1,30 2,13 x 10-51,26
i.70 2.79 x 10⁻⁵¢ 1.28
2.20 3,61 _ 10-51.30
3.30 5.41 x 10.5_.. 1.32
3.90 6.40 x 10.51,34
.5.30 8.70 x 10.51.36l 6.70
1,38 i.i0 x 10.4
8.60 1,41 x 10.41.4012
:'_ 1,42 1.97 X i0-4
13 2.13 x 10.41.44, 16
1.46 2.62 x 10⁻⁴
_ - 1.48 3.44 x 10.4
25.5 4.18 x 10.4 11,50" 30.5
1,52 5,00 x i0-434,5
1,54 5,65 x 10 -4
40 I1.56 6,56 x 10⁻⁴
46 " '_
7.55 :( 10-4 i

- 145
'.L'ablm13 (cOncluded)
1.58
53,5 8.77 x 10⁻⁴i.60
62.59.90 x 10"_4
" 1.62
67 1,08 x 10-31.64
7"/ 1,24 _ 10-31.6687
1.68 1.42 x i0-396
1.55 x 10⁻³I, 70 .... -....125
1,72 2.02 x 10"3130
2.ii X 10-3i. 74140
1.76 2.27 x 10 -3150
1.78 2.43 x 10-3160
2.59 x 10⁻³¹, 80
175 2.83 x 10-31,82
190 3.07 x 10⁻³i_84
' 200 3,23 x 10 -3• 1.86210
3.40 x 10⁻³
i i. 88 2303, 72 X 10-3i. 90
235
1,92 3.80 x 10⁻³
! 240
1.94 3,88 x 10-3250
1.96 4.04 x 10-3265
i.98 4.29 x 10⁻³
L_, 2752.00 4.45 x 10..3
2854.61 x 10-3

- 146 -
Ta _[e 14
STANDARD CELL -, DO_£,_[qAEDSCAN
FIGURE 22, //6
? I 2,00230 +5
- 3.72 x 10.3i. 98
2153.48 x 10-3
1=96205
3.32 x 10⁻³; 1.94
1903.07 x 10-3
i.92
-.. 185 2.99 x 10.31.90
1752.83 x 10-3
1.88165
2,67 x 10"31.B6
1,55 2.51 x 10 .31.84
1452,35 x 10"3
¢ 1.82[ 135
2,19 X 10-31.80" 130
2.11 x 10.3
i,94 x 10.3-.-i-" I.76
ii0I.78 x 10.3
' 1.74" ( i00
B_A_,,,,.:...... 1.62 X 10⁻³: I i. 72
! { . 79 1,28 x 10⁻³:_ i. 70
_l 70 1.13 x i0-3j i,68
l ' = 63 1.02 x i0-3"" i.66-'" 56
9.06 X 10⁻⁴
_" 1,621'64 51 8_25 X I0"4
1. 45 7.28 x 10~41.60
• 40 6,47 x I0"41.58
35 5.66 x i0-41.36
31 5.01 x I0-4

7147-
Table 14 (Conc.l.uded)
1.54
26 4.21 x 10-41,52
_--{ 23 3.72 x 10⁻⁴I.50
19 3.07 x i0"41.4817
2.75 x 10-41,46
'I_ 1.44 14 2.26 x 10⁻⁴........
, 12 i.94 x 10-4" I./42I 8,5
1.38 x 10-41,40
7,15 1.06 x I0-5'. 1.38
5,6 9,06 X 10-51,36
4.25 6.87 x 10⁻⁵i.34
41' 1.32 3.30 5.34 x 10⁻⁵
2.50 4.04 x 10-51.30
2.10 3.40 x 10⁻⁵I.28
. , 1.60 2.59 x 10⁻⁵! 1.26
1.25 2.15 x 10⁻⁵(. 1.24
_'. 0.895 1.45 x 10-51,22
0.610 9.90 x 10⁻⁶
1.200.460 7.45 x 10⁻⁶'" 1.18
I 1.16 0,355 5,75 X 10⁻⁶
0.250 4.04 _ 10-6I,14
_t 0,200 3,23 X 10-61,12
Temp. : 76_F. 0o140 2.26 x 10⁻⁶
] Air FLow Rate -- 2,_cm3/see.Rel, Hum. --50Z.

f- 14_t -
B. _pendi x B - Somp]e Caleula¢ions.
1, IR I_ss.
IR = lip
=! 3.2Ai A =-----'--¢m2 = 5.18 x i0-2 a/cm26,19
._ ( p = 1.91 ohm cm (ref. 72)
1 = 2.5 cm
Ig = (5.18 x 10⁻² A/cm 2) (1.91 ohm em) (2.5 cm)
!. IR = 0<25 voltJ
The IR corrected anode potengial is, thereforel
2.00 V-0.25V = 1.75V vs Ref.
2. Water adsorption - mass balance; verification of
steady state current.
0.33_m I hr 1 moleH20 absorption rate = hr x 3600 see x- 18 gm
i = 5.1 x i0-6 moles O/see.
I = 2.55 X 10⁻⁶ moles 02/see.a
"' _owl
0.92 A = how many moles 02/see?
: I eoul i mole e- mole O_I IA x x _
_N'_,I>v, see 97000 coul 4 m--_ e.A ........
coul 1 mole e- moles 00.92 A 0.92sec x 97000 coul x v----r'--_mo,es2e-
= 2.38 x i0-6 moles 02/see.
: 2.38 x 10⁻⁶ moles 02/see.
100% x -6 = 94%
2,55 x I0 moles 02/see.
J
1
:See Flgure 25,
O0000002-TSE03

- ]49-
0.50
2 gln lt2SO 4 samples
Temperature = 78.8°F.
o,45-- [
':i 0.40 --
• _0.35 -- - .
_0.30
O__4
_0.25 --
m
li °_o.2o -. . o,_
_ SeC •
, 0..15
i• O.iO --
0.05 --
I I I ,_0
35 40 45 50 55 60 ::.-
Average Concentration H2SO _ (wt%)
Figure. 25 WATER ABSORPTION RATE ON H2SO 4 AT DIFFERENT GAS FLOW RATES.
k _ 00000002-TSE04

- 1.50 -
Hence, steady state current has been c_hecked by water
absorption data to within 6%.
3. Volume of water absorbed in 5 seconds.
3 L--_ hr cm_m__
V5sec hr x 3600 sec x g x 5 see.
= 4.1 x 10 -4 cm 3
Volume in cell
Veell = 0.I cm deep x 4 in2 x (2.54 cm/in 2) ;
= 2.58 em3
Relative Volumes
V5 sec 4.1 x 10-4100% x = = 0.00036%
Vcell 2.58 cm
Volume in diffusion layer
2 3
Vd. --0.005 em x 6.19 cm = .31 cmi.
Relative Volumes
, V5 10-4_ 100% x see = 4.1 x cm3 = O.13%
Vd.l. 0.31 cm3
[
f
I
O0000002-TSi=O'
![Annals of Dental Specialty · 2020. 6. 21. · A CT scan showed an enlarged nasopalatine foramen and radiolucent lesion on the midpalatine suture area. [Figure 3] Figure 3: CT scan](https://img.dokumen.tips/doc/110x75/5fbc53f5f4400a2a825dd36f/annals-of-dental-specialty-2020-6-21-a-ct-scan-showed-an-enlarged-nasopalatine.jpg)