Embed Size (px)
Citation preview

S T U D Y G U I D E
The ChicagoGuide toWriting about Numbers
J A N E E . M I L L E R
The University of Chicago PressChicago & London
00-C3314-FM 1/10/05 6:51 AM Page i

Contents
Introduction 1
Chapter 2. Seven Basic Principles
problem set 2suggested course extensions 5solutions 7
Chapter 3. Causality, Statistical Significance, and Substantive Significance
problem set 9suggested course extensions 12solutions 14
Chapter 4. Technical but Important: Five More Basic Principles
problem set 16suggested course extensions 19solutions 21
Chapter 5. Types of Quantitative Comparison
problem set 23suggested course extensions 27solutions 29
Chapter 6. Creating Effective Tables
problem set 31suggested course extensions 34solutions 36
Chapter 7. Creating Effective Charts
problem set 38suggested course extensions 41solutions 43
Chapter 8. Choosing Effective Examples and Analogies
problem set 45suggested course extensions 47solutions 49
Chapter 9. Writing about Distributions and Associations
problem set 50suggested course extensions 52solutions 54
00-C3314-FM 1/10/05 6:51 AM Page ii

Chapter 10. Writing about Data and Methods
problem set 55suggested course extensions 57solutions 59
Chapter 11. Writing Introductions, Results, and Conclusions
problem set 60suggested course extensions 61solutions 63
Chapter 12. Speaking about Numbers
problem set 64suggested course extensions 65solutions 67
00-C3314-FM 1/10/05 6:51 AM Page iii

Introduction
This study guide was designed to provide practice applying the principlesand tools introduced in The Chicago Guide to Writing about Numbers, witha problem set and a series of suggested course extensions for each chapter.
The problem sets reinforce the concepts and skills from each chapter.Some require simple calculations, others involve creating or critiquingtables, charts, or sentences. They can be used as homework assignments fora research methods, statistics, or writing course in which the book is beingused, or by readers working independently. Solutions for the odd-numberedproblems can be downloaded separately.
The suggested course extensions apply the skills and concepts fromWriting about Numbers to the actual writing process. They involve review-ing existing work, applying statistics, writing, and revising—using eitheryour own work in progress or published materials (books, articles, reports, orWeb pages) in your field or that of your intended audience. The “applyingstatistics” questions usually require access to a computerized database thatincludes both continuous and categorical variables (see chapter 4). Many ofthe suggested exercises for writing or revision entail peer-editing and aremost effective if done with one or more other people, whether as part of acourse in which class time is devoted to these exercises, or working with acolleague.
01-C3314-TXT 1/10/05 6:52 AM Page 1

2Seven Basic Principles
PROBLEM SET
1. Use complete sentences to describe the relative sizes of the cities shownin table 2A.
Table 2A. Population of three largest cities worldwide, 1995
City Population (millions)
Sao Paulo 16.5
Mexico City 16.6
Tokyo 27.0
Source: Population Reference Bureau, 1999. “World Popula-
tion: More than Just Numbers”
2. Which of the W’s is missing from each of the following descriptions oftable 2B? Rewrite each sentence to include that information.
Table 2B. Final medal standings of the top four countries,
2002 Olympic winter games
Country Gold Silver Bronze Total
Germany 12 16 7 35
United States 10 13 11 34
Norway 11 7 6 24
Canada 6 3 8 17
a. “Germany did the best at the Olympics, with 35 medals, compared to34 for the United States, 24 for Norway, and 17 for Canada.”
b. “Gold, silver, and bronze medals each accounted for about 1⁄3 of themedal total.”
c. “At the 2002 Winter Olympics, the United States won more medalsthan all other countries, followed by Canada, Germany and Norway.”
3. For each of the following situations, specify whether you would useprose, a table, or a chart.a. Statistics on five types of air pollutants in the 10 largest U.S. cities for
a government report.
2 : CHAPTER TWO : PROBLEM SET
01-C3314-TXT 1/10/05 6:52 AM Page 2

b. Trends in the value of three stock market indices over a one-year pe-riod for a Web page.
c. Notification to other employees in your corporation of a change inshipping fees.
d. Distribution of voter preferences for grade-level composition of a newmiddle school (grades 5–8, grades 6–8, or grades 6–9) for a presen-tation at a local school board meeting.
e. National estimates of the number of uninsured among part-time andfull-time workers for an introductory section of an article analyzingeffects of employment on insurance coverage in New York City.
4. For each of the situations in the previous question, state whether youwould use and define technical terms or avoid jargon.
5. Identify terms that need to be defined or restated for a nontechnical audience.a. “The Williams family’s income of $25,000 falls below 185% of the
Federal Poverty Threshold for a family of four, qualifying them forfood stamps.”
b. “A population that is increasing at 2% per year has a doubling timeof 35 years.”
6. Rewrite the sentences in the previous question for an audience with afifth-grade education. Convey the main point, not the calculation or thejargon.
7. Read the sentences below. What additional information would someoneneed in order to answer the associated question?a. “Brand X costs twice as much as Brand Q. Can I afford Brand X?”b. “My uncle is 6�6� tall? Will he fit in my new car?”c. “New Diet Limelite has 25% fewer calories than Diet Fizzjuice. How
much faster will I lose weight on Diet Limelite?”d. “It has been above 25 degrees every day. We’re really having a warm
month, aren’t we?”
8. Rewrite each of these sentences to specify the direction and magnitudeof the association.a. “In the United States, race is correlated with income.” See table 2C.
Table 2C. Median income by race and Hispanic
origin, United States, 1999
Race/Hispanic origin Median income
White $42,504
Black $27,910
Asian/Pacific Islander $51,205
Hispanic (can be of any race) $30,735
Source: U.S. Bureau of the Census, Statistical
Abstract of the United States, 2001, table 662.
3 : CHAPTER TWO : PROBLEM SET
01-C3314-TXT 1/10/05 6:52 AM Page 3

b. “There is an association between average speed and distance trav-eled.” (Pick two speeds to compare.)
c. Write a hypothesis about the relationship between amount of exer-cise and weight gain.
9. Use the GEE approach to describe the patterns in figure 2A, including anintroductory sentence about the purpose of the chart before summariz-ing the patterns.
4 : CHAPTER TWO : PROBLEM SET
Daily crude oil production, four leading oil producing countries,1990-1999
0.0
1.0
2.0
3.0
4.0
5.0
6.0
7.0
8.0
9.0
10.0
1990 1991 1992 1993 1994 1995 1996 1997 1998 1999
Year
Mill
ions
of
barr
els
Saudi Arabia
Russia
U.S.
Iran
Figure 2A.
01-C3314-TXT 1/10/05 6:52 AM Page 4

2Seven Basic Principles
SUGGESTED COURSE EXTENSIONS
� A. REVIEWING
Find a journal article in your field. Use it to answer the following questions.
1. Is the context (W’s) of the study specified? If not, which W’s are missing?
2. Who is the intended audience for that journal, and what is their ex-pected level of familiarity with the statistical methods in the article?
3. a. Are definitions provided for all technical terms unfamiliar to the audience?
b. Are all acronyms used in the paper spelled out and defined?c. Are methods or concepts named using terms familiar to that audience?
4. List the major tools (text, tables, charts) used to present numbers.a. For one example of each type of tool, identify its intended purpose in
that context (e.g., presenting detailed numeric values; conveying ageneral pattern).
b. Use the criteria in chapter 2 of Writing about Numbers to evaluatewhether it is an appropriate choice for that task.
c. If so, explain why. If not, suggest a more effective tool for that context.
5. Find a numeric fact or comparison in the introduction or conclusion tothe article.a. Is it clear what question those numbers are intended to answer?b. Are the raw data reported in the text, a table, or chart?c. Are the values interpreted in the text?d. Revise the paragraph to address any shortcomings you identified in
parts a through c.
6. Find a description of an association between two variables. Are the direction and magnitude of the association specified? If not, rewrite thedescription.
7. Find a description of a pattern involving more than three values shownin a table or chart. Is the pattern summarized or described piecemeal?Use the GEE approach to revise the description.
5 : CHAPTER TWO : SUGGESTED COURSE EXTENSIONS
01-C3314-TXT 2/23/05 6:52 AM Page 5

� B. WRITING PAPERS
1. Describe a bivariate association among variables in your data, includingthe W’s, units, direction, and magnitude.
2. a. Write an introduction that integrates the concepts and methods usedin your study.
b. Use the criteria in chapter 2 of Writing about Numbers to assess useof jargon.
c. Revise your introduction to fix any problems you identified in part b.
3. Graph the distribution of a continuous variable and describe it using ananalogy.
4. Use the GEE approach to describe a three-way association among vari-ables in your data.
� C. REVISING PAPERS
1. Repeat questions A.1 through A.7 for a paper you have previously written.
2. Have someone who is unfamiliar with your research question peer-editthe answers to question C.1, using the checklist from chapter 2 of Writ-ing about Numbers.
6 : CHAPTER TWO : SUGGESTED COURSE EXTENSIONS
01-C3314-TXT 2/23/05 6:52 AM Page 6

2Seven Basic Principles
SOLUTIONS
1. Use complete sentences to describe the relative sizes of the cities shownin table 2A.“In 1995, the world’s largest city, Tokyo, had a population of 27 millionpeople. With populations of roughly 16.5 million apiece, the next twolargest cities, Mexico City and Sao Paolo, were only about 60% as largeas Tokyo.”
3. For each of the following situations, specify whether you would useprose, a table, or a chart.a. Table to show detailed figures and organize the 50 numbers.b. Multiple line chart to illustrate approximate pattern.c. Prose (memo).d. Pie chart.e. Prose (few sentences).
5. Identify terms that need to be defined or restated for a nontechnical au-dience. Answer shown in bold.a. “The Williams family’s income of $25,000 falls below 185% of the
Federal Poverty Threshold for a family of four, qualifying them forfood stamps.”
b. “A population that is increasing at 2% per year has a doubling timeof 35 years.”
7. Read the sentences below. What additional information would someoneneed to be able to answer the associated question?a. How much does Brand Q (or Brand X) cost? How much money do you
have?b. How big is the door opening to your car? The headroom and legroom?c. How many calories does Diet Fizzjuice (or Diet Limelite) have?d. Where are you located? Is temperature being measured in degrees
Fahrenheit or degrees Celsius?
9. “Figure 2A shows trends in daily crude oil production in the world’s fourleading oil-producing countries during the 1990s. Over the course of thatdecade, Saudi Arabia consistently had the highest crude oil production,followed by Russia, the United States, and Iran. However, downwardtrends in production in the top three oil producing countries, coupledwith steady production in Iran, led to a narrowing of the gap betweenthose countries between 1990 and 1999. In 1990, Saudi Arabia produced30% more oil than the United States and more than three times as much
7 : CHAPTER TWO : SOLUTIONS
01-C3314-TXT 1/10/05 6:52 AM Page 7

as Iran (10 million, 7 million, and 3 million barrels per day, respec-tively). By 1999, Saudi Arabia’s advantage had decreased to 25% morethan the United States or Russia, and about twice as much as Iran.”
8 : CHAPTER TWO : SOLUTIONS
01-C3314-TXT 1/10/05 6:52 AM Page 8

3Causality, Statistical Significance, and
Substantive Significance
PROBLEM SET
1. Evaluate whether each of these statements correctly conveys statisticalsignificance. If not, rewrite the sentence so that the verbal descriptionabout statistical significance matches the numbers; leave the numericvalues unchanged.a. There was a statistically significant increase in average salaries over
the past three years (p � .04).b. The p-value for the t-test for difference in mean ozone levels equals
0.95, so we can be 95% certain that the observed difference is not dueto chance.
c. The difference in voter participation between men and women wasnot statistically significant (p � 0.35).
d. The p-value for the t-test for difference in mean ozone levels equals0.95. This test shows we can be 95% certain that the difference inozone levels can be explained by random chance, hence the differ-ence is statistically significant.
e. The price of gas increased by $0.05 over the past three months, mean-ing that the p-value � 0.05.
f. The p-value comparing trends in gas prices � 0.05, hence the price ofgas increased by $0.05.
g. Voter participation was 20% higher among Democrats than amongRepublicans in the recent local election. Statistical tests show p� .01, so we can be 99% certain that the observed difference is notdue to chance.
h. The average processor speed was slightly higher for Brand A than forBrand B; however p � .09, so the effect was not statistically signi-ficant. If the sample size were increased from 40 to 400, the differencein processor speeds between the two brands would increase, so itmight become statistically significant.
i. The average processor speed was slightly higher for Brand A than forBrand B; however p � .09, so the effect was not statistically signi-ficant. If the sample size were increased from 40 to 400, the standarderror would decrease, so the difference might become statisticallysignificant.
2. For each of the following findings, identify background facts that couldhelp decide whether the effect is big enough to matter. Look up your sug-gested facts for one of the research questions. What do you concludeabout the substantive significance of the finding?a. Jo’s IQ score increased 2 points in one year.
9 : CHAPTER THREE : PROBLEM SET
01-C3314-TXT 2/11/05 12:54 PM Page 9

b. The average response on a political opinion poll for two adjacentcounties differed by 2 points. The question was scaled “agreestrongly,” “agree,” “neither agree nor disagree,” “disagree,” and “dis-agree strongly.”
c. The Dow Jones Industrial Index dropped 2 points since this morning.d. Bed rest is expected to prolong Mrs. Peterson’s pregnancy to 36 weeks
from 34 weeks’ gestation.
3. Discuss whether each of the following research questions involves acausal relationship. If the relationship is causal, describe one or moreplausible mechanisms by which one variable could cause the other. Ifthe relationship is not causal, give alternative explanations or mecha-nisms for the association.a. April showers bring May flowers.b. People with blue eyes are more likely to have blond hair.c. Pollen allergies increase rapidly with longer daylight hours.d. Eating spicy foods is negatively correlated with heartburn.e. Prices and sales volumes are inversely related, so high sales volumes
cause prices to drop.f. Fair-skinned people sunburn faster than do those with dark skin.g. Average reading ability increases dramatically with height between 4�
and 5�.
4. For each of the studies summarized in table 3Aa. explain how would you describe the findings in the results section of
a scientific paper;b. identify the criteria you used to decide how to discuss the findings for
that study.
Table 3A. Hypothetical study results
Topic I: Effect of new Statistical
math curriculum on significance Sample size
test scores* Effect size ( p-value)
Study 1 �1⁄2 point p � .01 1 million
Study 2 �1⁄2 point p � .45 1 million
Study 3 �5 points p � .01 1 million
Study 4 �5 points p � .07 1 hundred
Study 5 �5 points p � .45 1 million
Topic II: Effect of white
hair on mortality**
Study 1 � 5% p � .01 1 million
Study 2 � 5% p � .45 1 million
Study 3 �50% p � .01 1 million
Study 4 �50% p � .07 1 hundred
Study 5 �50% p � .45 1 million
* Effect size for math curriculum studies � scores under new curriculum –
scores under old curriculum.
** Effect size for hair color studies � death rate for white-haired people –
death rate for people with other hair colors.
10 : CHAPTER THREE : PROBLEM SET
01-C3314-TXT 2/11/05 12:54 PM Page 10

5. For each of the topics in table 3A, indicate whether you would recom-mend a policy or intervention based on the results, and explain the logicbehind your decision.
6. For each of the topics in table 3A, write one or two sentences to describethe conclusions of each study to a lay audience.
11 : CHAPTER THREE : PROBLEM SET
01-C3314-TXT 2/11/05 12:54 PM Page 11

3Causality, Statistical Significance, and
Substantive Significance
SUGGESTED COURSE EXTENSIONS
� A. REVIEWING
1. Find an example of a highly correlated association in your statistics textbook.a. Is that association causal? Why or why not?b. List facts or comparisons that could be used to evaluate the substan-
tive meaning of the association.
2. Find an example in your textbook of an association with a low correla-tion or nonstatistically significant association.a. Is that association causal? Why or why not?b. List facts or comparisons that could be used to evaluate whether the
association is substantively meaningful.
3. In a newspaper or magazine, find a scientific or policy problem and so-lution that are currently being touted for implementation.a. Evaluate how the article considers each of the three aspects of “im-
portance.” Does the articlei. specify a cause-and-effect type of relationship?ii. provide a plausible argument for a causal association?iii. discuss bias, confounding, or reverse causation?iv. report results of statistical tests for that association?v. assess whether the expected benefits of the proposed solution are
big enough to outweigh costs or otherwise matter in a larger so-cial context?
b. Given your answers to part a, write a short description of the appro-priateness of the proposed solution.
� B. WRITING AND REVISING
1. Identify an aspect of your main research question that involves the as-sociation between two variables. Is that association causal?a. If so, describe the mechanisms through which the hypothesized
causal variable affects the hypothesized outcome variable.b. If not, explain how those variables could be correlated. Identify pos-
sible bias, confounding factors, or reverse causation.c. Rewrite your research question as a hypothesis, making it clear
whether the association you are studying is expected to be causal.
12 : CHAPTER THREE : SUGGESTED COURSE EXTENSIONS
01-C3314-TXT 1/10/05 6:52 AM Page 12

d. Write a statement for a lay audience, explaining the nature of the as-sociation between the variables.
2. Find a statistically significant association in your analysis.a. Is that association causal? Why or why not?b. What background facts could you find to help assess the substantive
meaning of that association? Look them up and make the assessment.c. Write a description of the substantive importance of the association
for a discussion section of a scientific paper.
3. For one or two key statistical results pertaining to the main researchquestion in your paper, identify ways to quantify the broad social or sci-entific impact of that finding.a. Locate statistics on the prevalence of your issue.b. Find information on the consequences of the issue. E.g., what will it
cost in terms of money, time, and other resources? What are itsbenefits? What does it translate into in terms of reduced side effects,improved skills, or other dimensions suited to your topic?
c. Use the information from parts a and b in conjunction with measuresof effect and association from your analysis to make a compellingcase for or against the importance of the topic.
13 : CHAPTER THREE : SUGGESTED COURSE EXTENSIONS
01-C3314-TXT 1/10/05 6:52 AM Page 13

3Causality, Statistical Significance, and
Substantive Significance
SOLUTIONS
1. Evaluate whether each of these statements correctly conveys statisticalsignificance. If not, rewrite the sentence so that the verbal descriptionmatches the numbers; leave the numeric values unchanged.a. True.b. False. A p-value of 0.95 corresponds to only a 5% probability that the
observed difference is not due to chance (e.g., a 95% probability thatthe observed difference is due to chance.)
c. True.d. True.e. This sentence doesn’t reveal anything about statistical significance of
that change, certainly not the p-value.f. False. Test-statistics and p-values are indicators of statistical signifi-
cance. They do not measure the size of the association, in this case,absolute difference between two values.
g. True.h. False. Sample size does not affect size of a difference, in this case, dif-
ference in average process speed.i. True.
3. Discuss whether each of the following research questions involves acausal relationship.a. Causal (partly). The flowers will bloom in May whether or not it rains
in April, but will bloom more nicely if it rains.b. Non-causal association. In many populations, blue eyes and blond
hair co-occur but neither causes the other.c. Positive correlations between both pollen allergies and daylight with
more flowers blooming causes a spurious association between aller-gies and daylight. In other words, if you could have more daylightwithout more blooming plants, there wouldn’t be an association ofdaylight hours with pollen allergies.
d. Could be causal or reverse causal. For example, people with heart-burn might stop eating spicy foods if they think those foods irritatetheir heartburn.
e. Reverse causal. Low prices probably induced greater sales.f. Causal. Lack of protective pigment in fair-skinned people allows
them to sunburn faster.g. Spurious. Both reading ability and height increase dramatically with
children’s age, which is the real causal factor for both. Comparingkids with the same age but different heights would likely show muchless difference in reading abilities than if age isn’t taken into account.
14 : CHAPTER THREE : SOLUTIONS
01-C3314-TXT 1/10/05 6:52 AM Page 14

5. For both topics in table 3A, the findings of studies 1 and 3 are statisti-cally significant, studies 2 and 5 are not, and study 4 is borderline be-cause the p-value is slightly above 0.05 and the sample size is small.However, the association in topic II is spurious, so substantive and sta-tistical significance are irrelevant. For topic I, where there is a plausiblecausal explanation, only the findings of study 3 are likely to be of sub-stantive interest because the effect size in study 1 is so small.
15 : CHAPTER THREE : SOLUTIONS
01-C3314-TXT 1/10/05 6:52 AM Page 15
4Technical but Important: Five More Basic Principles
PROBLEM SET
1. For each of the following topics, indicate whether the variable or vari-ables used to measure it are continuous or categorical, and single or mul-tiple response.a. Respondent’s current marital status.b. Respondent’s number of siblings.c. Siblings’ heights.d. Current marital status of siblings.e. Temperature at 9 A.M. today.f. The form of today’s precipitation.
2. A new school is being considered in your hometown. Several possiblegrade configurations are being considered (Plan A: grades K–3, 4–5, 6–8, 9–12; Plan B: grades K, 1– 4, 5–7, 8–12). The current configurationis K–5, 6–9, and 10–12. Design a question to collect information fromschool principals on the age distribution of students, making sure thedata collection format provides the detail and flexibility needed to com-pare the different scenarios for the district now and in five years.
3. Your stopwatch is accurate to the nearest tenth of a second. In nine tri-als, the average time for a mouse named Squeeky to solve a maze was10.44444444 seconds. Write a sentence to report that average.
4. In a microbiology lab exercise, the size of viral cells being comparedranged from 0.000000018 meters (m) in diameter for Parovirus to0.000001 m in length for Filoviridae (American Society for Microbiol-ogy, 1999). What scale would you use to report those data in a table? Inthe text?
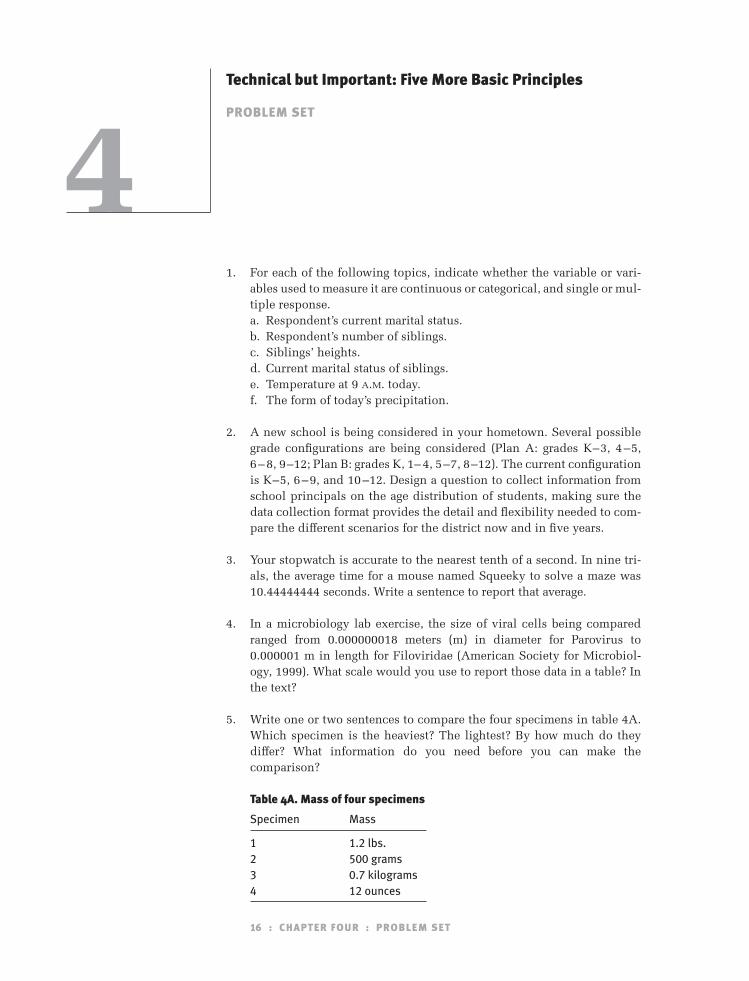
5. Write one or two sentences to compare the four specimens in table 4A.Which specimen is the heaviest? The lightest? By how much do they differ? What information do you need before you can make the comparison?
Table 4A. Mass of four specimens
Specimen Mass
1 1.2 lbs.
2 500 grams
3 0.7 kilograms
4 12 ounces
16 : CHAPTER FOUR : PROBLEM SET
01-C3314-TXT 1/10/05 6:52 AM Page 16

6. For each of the figures 4.3a through 4.3e (Writing about Numbers, 66–68), choosea. a typical value;b. an atypical value;c. a plausible contrast (two values to compare).Explain your choices, with reference to range, central tendency, varia-tion, and skewness.
7. Identify pertinent standards or cutoffs for each of the following questions.a. Does Mr. Jones deserve a speeding ticket?b. Is the new alloy strong enough to be used for the library renovations?c. How tall is five-year-old Susie expected to be next year?d. Can Leah go on the Ferris wheel at the amusement park?e. Is this year’s projected tuition increase at Public U unexpected?f. Should we issue an ozone warning today?
8. Indicate whether each of the following sentences correctly reflects table 4B. If not, rewrite the sentence so that it is correct. Check both cor-rectness and completeness of the data.a. Between 1964 and 1996, there was a steady decline in voter partici-
pation, from 95.8% in 1964 to 63.4% in 1996.b. Voter turnout was better in 1996 (63.4%) than in 1964 (61.9%).c. Almost all registered voters participated in the 1964 United States
presidential election.d. The best year for voter turnout was 1992, with 104,600 people voting.e. Less than half of the voting age population voted in the 1996 presi-
dential election.f. A higher percentage of the voting-age population was registered to
vote in 1996 than in 1964.
Table 4B. Voter turnout, United States presidential elections, 1964
through 1996
Registered Voting Age
Total Vote Voters Vote/RV Pop. (VAP) Vote/VAP
Year (1000s) (RV) (1000) (%) (1000s) (%)
1964 70,645 73,716 95.8 114,090 61.9
1968 73,212 81,658 89.7 120,328 60.8
1972 77,719 97,329 79.9 140,776 55.2
1976 81,556 105,038 77.6 152,309 53.5
1980 86,515 113,044 76.5 164,597 52.6
1984 92,653 124,151 74.6 174,466 53.1
1988 91,595 126,380 72.5 182,778 50.1
1992 104,600 133,821 78.2 189,529 55.2
1996 92,713 146,212 63.4 196,511 47.2
Source: Institute for Democracy and Electoral Assistance 1999.
17 : CHAPTER FOUR : PROBLEM SET
01-C3314-TXT 1/10/05 6:52 AM Page 17
9. A billboard reads: “1 in 250 Americans is HIV positive. 1 in 500 of themknows it.”a. According to the two statements above, what share of Americans are
HIV positive and know it? Does that seem realistic?b. Rewrite the second statement to clarify the intended meaning
i. as a fraction of HIV-positive Americans.ii. as a fraction of all Americans.
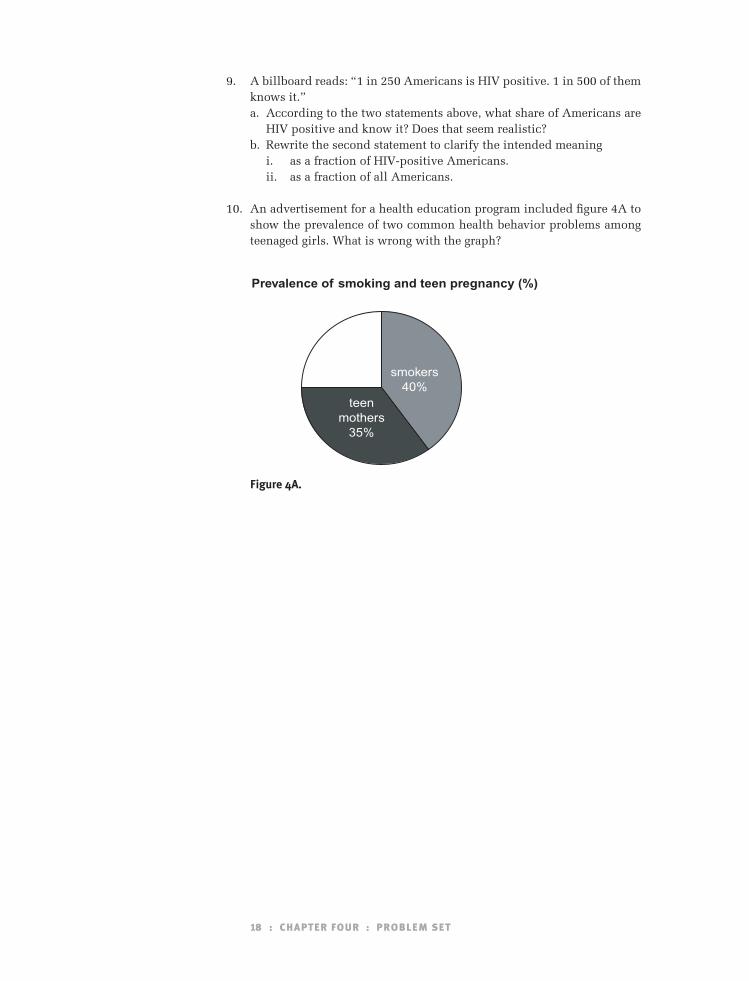
10. An advertisement for a health education program included figure 4A toshow the prevalence of two common health behavior problems amongteenaged girls. What is wrong with the graph?
18 : CHAPTER FOUR : PROBLEM SET
Prevalence of smoking and teen pregnancy (%)
teen mothers
35%
smokers40%
Figure 4A.
01-C3314-TXT 1/10/05 6:52 AM Page 18

4Technical but Important: Five More Basic Principles
SUGGESTED COURSE EXTENSIONS
� A. REVIEWING
1. In a statistics textbook, find a discussion of an association between twoor three variables. For each of those variables, identifya. the type of variable (nominal, ordinal, interval, or ratio);b. whether it is single or multiple response.c. For continuous variables, identify
i. the system of measurement;ii. the unit of analysis;iii. the scale of measurement;iv. the appropriate number of digits and decimal places for report-
ing the mean value in the text and a table.d. For categorical variables, identify the categories for each variable.e. If the items requested in c and d aren’t described in your book, list
plausible versions of that information. For example, if you are study-ing family income in the United States, you would expect the systemof measurement to be United States dollars, the unit of analysis to bethe family, and the scale of measurement to be either dollars or thou-sands of dollars.
2. Read the textbook’s description of the variables you listed in questionA.1. Does it provide the recommended information about the distri-bution of that type of variable? If not, what additional information isneeded?
3. Read the literature in your field to determine whether standard cutoffsor standard patterns are used to assess one of the variables in the asso-ciation you listed in question A.1. Find a reference source that explainsits application and interpretation.
4. Repeat questions A.1–A.3 using variables described in a journal articleor book in your field of study.
� B. APPLYING STATISTICS
1. Repeat question A.1 using variables available in your database.
2. Using the same data,a. calculate the frequency distribution for each variable;
19 : CHAPTER FOUR : SUGGESTED COURSE EXTENSIONS
01-C3314-TXT 1/10/05 6:52 AM Page 19

b. create a simple chart of the distribution;c. select and calculate the appropriate measure of central tendency for
that type of variable;d. Determine whether the measure of central tendency calculated in
part c typifies the overall distribution. Why or why not? If not, whatis a more typical value?
e. For continuous variables, identify the minimum and maximum val-ues and the first and third quartiles of the distribution.
3. For one of the variables in your database, repeat question A.3. Then usethe standard or cutoff to classify or evaluate your data. (e.g., what per-centage of cases fall below the cutoff? Does your distribution follow theexpected pattern for that variable?)
4. Compare the eligibility thresholds for your state’s State Children’sHealth Insurance (S-CHIP) for the most recent year available against theFederal Poverty Thresholds (see Web sites for your state’s S-CHIP pro-gram and the “Poverty” page on the U.S. Census Web site. What is thehighest income that would qualify for free S-CHIP benefits for a familyof one adult and one child? a family of one adult and two children? afamily of two adults and two children?
20 : CHAPTER FOUR : SUGGESTED COURSE EXTENSIONS
01-C3314-TXT 1/10/05 6:52 AM Page 20

4Technical but Important: Five More Basic Principles
SOLUTIONS
1. For each of the following topics, indicate whether the variable or vari-ables used to measure it are continuous or categorical, and single or mul-tiple response.a. Categorical, single-response.b. Continuous, single-response.c. Continuous, multiple-response.d. Categorical, multiple-response.e. Continuous, single-response.f. Categorical, multiple-response.
3. “Squeeky the mouse solved the maze in an average of 10.4 seconds overnine trials.”
5. All measurements must be converted into consistent units (scale andsystem of measurement). I chose to convert all measurements to kilo-grams, using the conversion factor 2.2 pounds/kilogram (see revisedtable 4A). “Of the four specimens compared here, specimen 3 is theheaviest (0.70 kilograms). It is about twice as heavy as the lightest (spec-imen 4, 0.34 kg.). The other two specimens were about 70% as heavy asspecimen 3.”
Table 4A. Mass of four specimens
Weight Weight
Specimen (original units) (kg.)
1 1.2 lbs. 0.54
2 500 grams 0.50
3 0.7 kilograms 0.70
4 12 ounces 0.34
7. Identify pertinent standards or cutoffs and other information needed toanswer each of the following questions.a. Speed limit where he was driving and his actual speed.b. The weight-bearing capacity of the alloy (in weight per unit area) and
the expected weight load (again, in weight per area) in the library.c. Her current height and a growth chart (height for age) for girls.d. Leah’s height and the minimum height requirement for the Ferris
wheel.
21 : CHAPTER FOUR : SOLUTIONS
01-C3314-TXT 1/10/05 6:52 AM Page 21

e. The rate of inflation, current tuition, and rates of tuition increase atPublic U over the past few years.
f. Today’s ozone measurement and the cutoff for an ozone warning.
9. a. Taken together, the two statements imply that 1 in 125,000 Americansare HIV positive and know it, clearly a misstatement of the facts.b. Rewrite the second statement to clarify the intended meaning.
i. “Half of HIV-positive Americans know they are infected.”ii. “1 in 500 Americans is HIV positive and knows it.”
22 : CHAPTER FOUR : SOLUTIONS
01-C3314-TXT 1/10/05 6:52 AM Page 22

5Types of Quantitative Comparisons
PROBLEM SET
1. Identify the type of quantitative comparison used in each of the follow-ing statements:a. “Yesterday, New York City received 5.5 inches of snow.”b. “Ian Thorpe’s margin of victory in the 400-meter freestyle was
0.74 seconds.”c. “A panel of independent tasters preferred new Wheat Whistles 3 to 1
over their regular snack.”d. “The Dow Jones Industrial Average dropped 0.6% since this morn-
ing’s opening.”e. “On sale, the scanner cost $10 less than the suggested list price.”f. “Cornstarch has twice the thickening power of flour; for each tea-
spoon of flour called for in a recipe, substitute one half teaspoon ofcornstarch.”
g. “Median income for the metro region was $31,750.”h. “At 6�3�, Joe is two standard deviations taller than the average adult
man.”i. “Sixty-eight percent of registered voters turned out for the primary
election.”j. “State U was seeded first in the tournament.”
2. In the 2000 presidential election, Al Gore received 50,996,116 voteswhile George W. Bush received 50,456,169 votes.a. Write a sentence to describe the ranks of the two candidates.b. Calculate the absolute difference between the number of votes each
candidate received. What impression does that information aloneconvey?
c. Calculate the percentage difference between the number of votes eachcandidate received. What impression does that information give?
3. Indicate whether each of the following statements is correct. If not,rewrite the second part of the sentence to agree with the first.a. “Brand X lasts longer than Brand T, with an average lifetime 60% as
long as Brand T’s.”b. “Mean attendance at Root4 U increased 25% since last year, from
4,000 to 5,000 fans per game.”c. “The ratio of flour to butter in shortbread is 2:1; it uses twice as much
butter as flour.”d. “At this time of year, reservoirs are usually 90% full. Currently, with
reservoirs at 49% of capacity, water levels are only about 54% of normal.”
23 : CHAPTER FIVE : PROBLEM SET
01-C3314-TXT 1/10/05 6:52 AM Page 23

e. “Nadia’s test score was higher than 68% of students nationwide (Z � 1.0).
f. “A panel of 200 consumers rated ISP A four to one over ISP B. In otherwords, four more panelists preferred Company A as their Internet ser-vice provider.”
g. “Matt is in the 91st percentile for height. He is among the tallest 10%of boys his age.”
h. “Valueland is advertising 15% off everything in the store. That $200camera will cost only $170.”
i. “The value of mutual fund ABCD tripled since last year, going from100 to 33.”
4. In the 1999 Diallo case in New York City, 41 bullets hit the victim. Writedown the criteria that you would intuitively use to interpret that num-ber: against what are you comparing the number of bullets?
5. Each of the following statements correctly describes part of table 5A, buteach description is incomplete. Fill in the missing information.
Table 5A. Median income by race and Hispanic ori-
gin, United States, 1999
Race/Hispanic origin Median income
White $42,504
Black $27,910
Asian/Pacific Islander $51,205
Hispanic (can be of any race) $30,735
Source: U.S. Bureau of the Census, Statistical Ab-
stract of the United States, 2001, table 662.
a. “Asians make about twice as much.”b. “Hispanics earn $2,825 more.”c. “Whites rank second.”d. “The percentage difference for Asians was 20%.”
6. Use table 5B to perform the tasks listed below.
Table 5B. Price per gallon for regular unleaded
gasoline at selected gas stations, June 2000
and June 2001
Gas station June 2000 June 2001
AAA $1.45 $1.71
Bosco $1.37 $1.75
Cargo $1.48 $1.68
Dart $1.30 $1.66
Essow $1.46 $1.74
24 : CHAPTER FIVE : PROBLEM SET
01-C3314-TXT 1/10/05 6:52 AM Page 24

a. Rank the stations from highest to lowest gas price for each of the twodates.
b. Write a description of the distribution of prices in each year. Use ab-solute and relative difference in your description to convey the dif-ferences between the two distributions.
c. Describe how you might use rank in conjunction with absolute or rel-ative difference in deciding where to buy gas.
7. For each of the phrases listed below, identify other phrases on the listthat have the same meaning; write the equivalent dollar value, assumingcomparison against a price of $200; and write the corresponding ratio.For statement a, for example, the equivalent dollar value would be $50and the corresponding ratio would be 0.25.a. “25% of the original price”b. “Costs 25% less than . . . ”c. “Costs 25% more than . . . ”d. “Priced 25% off”e. “125% of the original price”f. “Marked down 75%”g. “75% of the original price”h. “Costs 75% as much as . . . ”
8. The homicide rate in Texas dropped from 16 homicides per 100,000 per-sons in 1990 to 10 per 100,000 in 1995. Calculate and write sentences to describea. the absolute differences between the homicide rates in the two
periods;b. the relative differences between the homicide rates in the two
periods;c. the percentage change between the two periods using
i. the 1990 rate as the denominator;ii. the average of the two rates as the denominator.
9. In table 5C, fill in the z-score for height for each boy in the sample.
Table 5C. Heights of a sample of six-year-
old boys (standard population: mean
� 115.12 cm; SD � 4.78 cm)
Name Height (cm) Z-score
David 117.51
Jamal 113.90
Ryan 124.81
Luis 115.45
JC 112.73
SD � standard deviation
25 : CHAPTER FIVE : PROBLEM SET
01-C3314-TXT 1/10/05 6:52 AM Page 25

a. Describe how Ryan’s, Luis’s and JC’s heights compare to the nationalnorms for boys their age based on their z-scores. (See table 5.3 in Writing about Numbers, 93, for how to avoid using “z-scores” as youwrite).
b. Two boys have heights about equidistant from the mean—one aboveand one below average. Who are they and about how far are theirheights from those of average six-year-old boys? Report the differ-ences in terms of standard deviation units.
c. A new boy, Mike, joins the class. He is one standard deviation tallerthan the average six-year-old boy. How tall is Mike?
10. One thousand people lived in Peopleland in 2000 and the populationwas growing at an annual rate (r) of 2.0% per year.
Table 5D. Population of Peopleland, 2000–2010
Absolute Cumulative Percentage
increase from increase change
Year Population previous year since 2000 since 2000
2000 1,000
2001
2002
2003
2004
2005
2006
2007
2008
2009
2010
a. Use the formula Pt � P0 � ert to fill the population for each year intotable 5D. The year 2000 is year 0, t is the number of years since 2000,r (the annual growth rate, expressed as a proportion) is 0.02 and e isthe base of the natural logarithms (2.718).
b. For each year, calculate the absolute increase in population from thepreceding year. Write a sentence explaining the pattern of absolutepopulation increase across the 10-year period.
c. The cumulative increase is the total number of people added to thepopulation since 2000. How many more people live in Peopleland in2010 than in 2000?
d. Calculate the percentage change relative to 2000 for each year. Writea sentence to describe the percentage change in population between2000 and 2010.
e. What is the ratio of the population size for 2010 compared to 2000?How does that ratio relate to the percentage change over that 10-yearperiod?
f. How do the annual rate of growth and the percentage change between2000 and 2010 relate?
26 : CHAPTER FIVE : PROBLEM SET
01-C3314-TXT 1/10/05 6:52 AM Page 26

5Types of Quantitative Comparison
SUGGESTED COURSE EXTENSIONS
� A. REVIEWING
1. Find a report about recent patterns in mortality, fertility (National Cen-ter for Health Statistics Web site), or unemployment (Bureau of LaborStatistics Web site).a. Identify an example of each of the following: rank, absolute differ-
ence, relative difference, and percentage difference or change.b. For each example, identify the reference value. Does it come from
within their data or some other source (e.g., a historic value or a ref-erence population)?
c. Read the explanation of each of your chosen examples. Is each oneclear? If not, use the criteria outlines in chapter 5 to improve the explanation.
d. Identify at least one instance where a different (or additional) com-parison would be useful. Perform the calculations and describe theresults, not the mathematical steps involved in the comparison.
� B. APPLYING STATISTICS
1. Find a problem from a statistics or research methods textbook that in-volves comparison of two or more numbers.a. Identify a pertinent comparison value.b. Choose two ways to compare the numbers. Explain your choice of
types of quantitative comparisons, with reference to a related re-search question or issue.
c. Calculate the pertinent comparisons.d. Write a paragraph that integrates those types of quantitative
comparisons.e. Use the checklist at the end of chapter 5 in Writing about Numbers
to evaluate completeness and clarity of your writing.
2. Use a spreadsheet to complete the population growth question from thischapter’s problem set.a. Repeat the growth projections using the formula for annual com-
pounding in place of the formula for continuous compounding (see“Annual Rates,” in Writing about Numbers, 96). Which results infaster growth?
b. Repeat the population projection using a negative growth rate (r �
–0.02). How much population is lost over the 10-year period?
27 : CHAPTER FIVE : SUGGESTED COURSE EXTENSIONS
01-C3314-TXT 1/10/05 6:52 AM Page 27

� C. WRITING AND REVISING
1. Identify a quantitative background fact for the introductory section ofyour paper to compare with information for other time periods or cases.a. Select two pertinent types of quantitative comparisons for that fact.
Explain your choice, with reference to the topic of your paper.b. Look up the pertinent comparison data and calculate the compar-
isons.c. Write a paragraph that integrates those types of quantitative compar-
isons.d. Use the checklist at the end of this chapter to evaluate the complete-
ness and clarity of your writing.
2. Repeat question B.1 with data from the results section of your paper.
28 : CHAPTER FIVE : SUGGESTED COURSE EXTENSIONS
01-C3314-TXT 1/10/05 6:52 AM Page 28

5Types of Quantitative Comparison
SOLUTIONS
1. Identify the type of quantitative comparison used in each of the follow-ing statements:a. Value.b. Absolute difference.c. Ratio (relative difference).d. Percentage change.e. Absolute difference.f. Ratio (relative difference).g. Rank (median is the 50th percentile).h. Z-score.i. Value (in this case, the units of measurement are percentage points).j. Rank.
3. Indicate whether each of the following statements is correct. If not,rewrite the second part of the sentence to agree with the first.a. “Brand X lasts longer than Brand T, with an average lifetime 60%
longer than Brand T’s.”b. Correct as written.c. “The ratio of flour to butter in shortbread is 2:1; it uses twice as much
flour as butter.”d. Correct as written.e. “Nadia’s test score was higher than 84% of students nationwide
(Z � 1.0). (Sixty-six percent are within 1 standard deviation of themean [e.g., � 1 standard deviation], but you must also include thosefor when z � – 1.0 to answer this question correctly.)
f. “A panel of 200 consumers rated ISP A four to one over ISP B. In otherwords, four times as many panelists preferred Company A as their Internet service provider.”
g. Correct as written.h. Correct as written.i. “The value of mutual fund ABCD tripled since last year, going from
33 to 100.”
5. Fill in the missing information.a. “Asians make about twice as much as blacks.”b. “Hispanics earn $2,825 more than blacks.”c. “Whites rank second in terms of median income, below only Asians
and Pacific Islanders.”d. “Asians earn 20% more than whites.”
29 : CHAPTER FIVE : SOLUTIONS
01-C3314-TXT 1/10/05 6:52 AM Page 29

7. With a comparison value of $200:The two phrases “25% of the original price” (item a) and “Marked down75%” (f ) have the same meaning. Each of those phrases corresponds toa price of $50, equivalent to a ratio of 0.25 .The phrases “Costs 25% less than . . . ” (item b), “Priced 25% off”(d),”75% of the original price” (g), and “Costs 75% as much as . . . ”(h) are equivalent. They correspond to a price of $150, equivalent to a ra-tio of 0.75.The two phrases “Costs 25% more than . . . ” (item c) and “125% of theoriginal price” (e) have the same meaning. They correspond to a price of$250 and a ratio of 1.25.
9. In table 5C, fill in the z-score for height for each boy in the sample.
Table 5C. Heights of a sample of six-year-
old boys (standard population: mean
� 115.12 cm; SD � 4.78 cm)
Name Height (cm) Z-score
David 117.51 0.50
Jamal 113.90 –0.26
Ryan 124.81 2.03
Luis 115.45 0.07
JC 112.73 –0.50
a. Ryan is approximately two standard deviations above the averageheight for a six-year-old boy, while Luis is just about average and JCis half a standard deviation below average for his age.
b. David and JC are half a standard deviation taller and shorter than theaverage six-year-old boy, respectively.
c. Mike stands 119.90 cm tall.
30 : CHAPTER FIVE : SOLUTIONS
01-C3314-TXT 1/10/05 6:52 AM Page 30

6Creating Effective Tables
PROBLEM SET
1. Write a title for table 6A.
Table 6A.
Year Median age (years)
1960
1970
1980
1990
2000
Source: U.S. Census of Population, various dates.
2. Answer the following questions for tables 6.2 through 6.8 in Writingabout Numbers.a. Who is described by the data?b. To what date or dates do the data pertain?c. Where were the data collected?d. What are the units of measurement? Are they the same for all cells in
the table?e. Where in the table are the units of measurement defined?f. Does the table use footnotes? If so why? If not, are any needed?g. Are panels used within the table? If so, why? If not, would the addi-
tion of panels improve the clarity of the table?
3. Table 6B needs several footnotes to be complete. What informationwould those footnotes provide?
Table 6B. EPA estimates of carbon dioxide concentration and mean annual
global temperature, 1950–2000
CO2 concentration (ppmv) Mean temperature (oF)
1950
1960
1970
1980
1990
2000
31 : CHAPTER SIX : PROBLEM SET
01-C3314-TXT 1/10/05 6:52 AM Page 31

4. What is missing from table 6C?
Table 6C. Math and English test scores by homeroom teacher
Ms. Michaelson 65.7 69.0
Mr. Cifuentes 72.1 70.8
Mr. Williams 70.1 62.1
Ms. Andrews 76.2 78.2
Ms. Smith-Henderson 65.2 72.5
5. Design a table for each of the following topics. Provide complete label-ing and notes, show column spanner and panels if pertinent, and indi-cate what principle(s) you would use to organize items within the rowsand/or columns.a. Average commuting costs per month, by mode of transportation
(bicycle, bus, car, train, walk, other). (One number per type of trans-portation.)
b. Age (years), gender, race, and educational attainment composition ofa study sample.
c. Annual number of people receiving college degrees by gender, from1990 to 2000.
d. Measures of association between height (cm), weight (kg), percentagebody fat, systolic blood pressure (mm Hg), and resting pulse (beatsper minute).
e. Estimates of dates using two different dating techniques for each of 15artifacts taken from archaeological sites in three North African andtwo European countries.
f. Type of contraceptive (condom, diaphragm, implant/injectable, oralcontraceptive (the Pill), surgical sterilization, other, none) by 10-yearage groups of women aged 15 to 44. (Some women use more than onemethod.)
32 : CHAPTER SIX : PROBLEM SET
01-C3314-TXT 1/10/05 6:52 AM Page 32

6. A journal for which you are writing an article allows no more than twotables but your current draft has three. Combine tables 6D and 6E belowinto one table of 18 or fewer rows.
Table 6D. Number of wildfires by month, United States, 1998–2000
Month 1998 1999 2000 30-year averagea
January
February
March
April
May
June
July
August
September
October
November
December
Total
a1970–1999.
Table 6E. Number of acres consumed by wildfire, by month, United States,
1998–2000
Month 1998 1999 2000 30-year averagea
January
February
March
April
May
June
July
August
September
October
November
December
Total
a1970–1999.
33 : CHAPTER SIX : PROBLEM SET
01-C3314-TXT 1/10/05 6:52 AM Page 33

6Creating Effective Tables
SUGGESTED COURSE EXTENSIONS
� A. REVIEWING
1. Find a simple table in a newspaper or magazine article. Evaluatewhether tables in that article can stand alone without the text. Suggestways to improve labeling and layout.
2. In a professional journal in your field, find a table that includes columnspanners or panels.a. Evaluate whether you can interpret all the numbers in the table with-
out reference to the text. Suggest ways to improve labeling and layout.b. Using information in the article, revise the table to correct those
errors.c. Consider whether a different layout would work more effectively.d. Assess whether other tables are needed in the paper. Can two (or
more) tables from the paper be combined into one?e. Take one of the tables in the article and simplify it into one or more
tables for a lay audience.f. Pick a chart from the article. Draw a table to present the same infor-
mation. Show what would go into the rows and columns, whether thetable would have spanners or panels, labels, notes, etc.
� B. APPLYING STATISTICS
1. Create a table to display univariate frequency distributions for severalvariables in your data set.
2. Create a table to show bivariate associations (e.g., correlations, cross-tabulations, or a difference in means) between two or more variables in your data set.
3. Identify a topic for a hypothetical research paper. Make a list of three orfour simple (e.g., no more than three-way relationships) tables that per-tain to your topic. Write individualized titles for each table.
� C. WRITING AND REVISING
1. Evaluate a table you have previously made for your paper, using thechecklist in chapter 6 of Writing about Numbers.
34 : CHAPTER SIX : SUGGESTED COURSE EXTENSIONS
01-C3314-TXT 1/10/05 6:52 AM Page 34

2. Peer-edit another student’s tables after he or she has revised them, againusing the checklist.
3. Read through the results section of your paper and identify topics or sta-tistics for which to create additional tables related to some aspect of yourresearch question. Draft them with pencil and paper including completetitle, labels, and notes.
35 : CHAPTER SIX : SUGGESTED COURSE EXTENSIONS
01-C3314-TXT 1/10/05 6:52 AM Page 35

6Creating Effective Tables
SOLUTIONS
1. Write a title for table 6A: “Median age of the U.S. population, 1960 to 2000.”
3. Provide footnotes to table 6B.Spell out EPA (Environmental Protection Agency).Spell out ppmv (parts per million volume).Cite the data sources.
5. Design a table for each of the following topics.a. Title: “Average monthly commuting costs ($) by mode of transporta-
tion, time, place, population.” Table structure: Mode of transporta-tion in the rows with a column for monthly commuting costs. Itemsin the rows organized in ascending or descending order of cost. Noteciting data source.
b. Title: “Age, gender, race, and educational attainment composition of [fill in who, when, and where for study sample].” Table struc-ture: Demographic variables in the rows, with units specified in rowheader for age, and subgroup relations for the other variables shownwith indented row headings. Columns for number of cases and per-centage of cases. Note citing data source.
c. Title: “Number of people (thousands) receiving college degrees bygender, 1990 to 2000, place.” One row for each year between 1990and 2000 (chronological order), one column for each gender. Note cit-ing data source.
d. Title: “Pearson correlation coefficients between height, weight, per-centage body fat, systolic blood pressure, and resting pulse, [W’s].”Table structure: One row and one column for each variable with labelindicating units, or footnote label for abbreviated units. Correlationsreported in the below-diagonal cells (see Writing about Numbers,table 6.7, p. 116, for an example). Symbols in the table cells to iden-tify p � 0.05, with a note to explain the meaning of the symbol. An-other table note to define unit abbreviations.
e. Title: “Comparison of estimated dates for various artifacts, selectedsites in North Africa and Europe.” Artifacts arranged in the rows, inascending or descending order of estimated date within blocks bygeographic region. Column spanner for each site with a column foreach dating technique below. Footnotes citing data sources, refer-ences about dating methods.
36 : CHAPTER SIX : SOLUTIONS
01-C3314-TXT 1/10/05 6:52 AM Page 36

f. Title: “Percentage of women using specific types of contraceptives, by10-year age groups, [W’s].” Table structure: One row for each contra-ceptive type, in desending order of overall frequency, one column foreach age group. Notes specifying (a) that each woman could use morethan one type; (b) data source.
37 : CHAPTER SIX : SOLUTIONS
01-C3314-TXT 1/10/05 6:52 AM Page 37

7Creating Effective Charts
PROBLEM SET
1. What is missing from the charts in figures 7A and 7B?
38 : CHAPTER SEVEN : PROBLEM SET
Age distribution of the elderly populationUnited States, 2000
52%
35%
13%
Median sales price of new one-family homes,by region, United States, 1980–2000
Northeast Midwest South West
Figure 7A.
Figure 7B.
2. Answer the following questions for figures 7.3, 7.5a, and 7.9 in Writingabout Numbers.a. Who is described by the data?b. To what date or dates do the data pertain?c. Where were the data collected?d. What criteria were used to organize the values of the variables on
chart axes? (Hint: consider type of variable.)e. What are the units of measurement? Are they the same for all num-
bers shown in the chart?f. Are there footnotes to the chart? If so, why? If not, are any needed?
01-C3314-TXT 1/10/05 6:52 AM Page 38

3. For each of the following topics, identify the type of task (e.g., univari-ate distribution, relationship between two variables, or relationshipamong three variables), and types of variables to be presented (e.g., nom-inal, ordinal, interval), then state which type of chart would be most ap-propriate.a. Annual number of people receiving college degrees, by gender, from
1980 to 2000.b. Average commuting costs per month, by mode of transportation
(bicycle, bus, car, train, walk, other). (One number per type of trans-portation.)
c. Current market share for Coca Cola, Pepsi, and other cola brands.d. Distribution of SAT mathematics scores in 2000. (Range � 200 to 800,
in increments of 10.)e. Educational attainment distribution ( � HS, � HS, HS) for native-
born United States residents and for immigrants from other NorthAmerican countries, Africa, Asia, Australia & New Zealand, Europe,and Latin America, 2000.
f. Estimates of dates for each of 15 archeological artifacts, with marginof error for each estimate.
g. Relationship between systolic blood pressure (mm Hg) and percent-age body fat for a sample of 150 elderly people.
h. Type of contraceptive (condom, diaphragm, implant/injectable, oralcontraceptive (the Pill), surgical sterilization, other, none) by 10-yearage groups of women aged 15 to 44 in the United States in 1997.(Some women use more than one method.)
i. Trends in mean annual global temperature (oF ) and carbon dioxide(CO2) concentration (ppmv) from 1950 to 2000.
4. For each of the topics in question 3 that involve an XY-type chart, indi-cate which principle you would use to decide what order to display val-ues on the x-axis; see chapter 6 of Writing about Numbers for a list of or-ganizing principles.
39 : CHAPTER SEVEN : PROBLEM SET
01-C3314-TXT 1/10/05 6:52 AM Page 39

5. Create a stacked bar chart to present the data shown in table 7A, allow-ing bar height to vary, reflecting total number of ozone days. To help youplan your chart, answer the following questions, then draw an approxi-mate stacked bar chart, allowing the level to vary by county.a. Which variable goes on the x-axis, and what principle would you use
to organize its values?b. Which variable goes in the slices (and legend)?c. Which variable goes on the y-axis, and in what units is it measured?
Table 7A. Number of unhealthy ozone days by level of warning for selected
counties in Indiana, 1996–1998
Level of warninga
Unhealthy for
sensitive groups Unhealthy Very unhealthy
Allen 25 0 0
Clark 29 3 1
Elkhart 15 0 0
Floyd 27 6 0
Hamilton 31 3 0
Hancock 28 2 0
Lake 29 2 0
La Porte 26 6 1
Madison 27 3 0
Marion 32 3 0
Porter 25 3 0
Posey 14 1 0
St. Joseph 21 1 0
Vanderburgh 32 2 0
Vigo 25 1 0
Warrick 40 3 0
aUnhealthy for sensitive groups � 0.085–0.104 parts per million (ppm);
Unhealthy � 0.105–0.124 ppm; Very unhealthy � 0.125–0.374 ppm.
Source: American Lung Association.
6. Revise your chart from the previous question to illustrate the relative im-portance (share) of different levels of ozone warning in each county.a. What aspects of each chart remain the same as in the previous ques-
tion? What aspects change?b. What are the advantages and disadvantages of the two versions of the
chart? Be specific for this topic and data.
40 : CHAPTER SEVEN : PROBLEM SET
01-C3314-TXT 1/10/05 6:52 AM Page 40

7Creating Effective Charts
SUGGESTED COURSE EXTENSIONS
� A. REVIEWING
1. Find a pie, simple bar, or line chart in a newspaper or magazine article.Critique it using the criteria in chapter 7 of Writing about Numbers.
2. Use a professional journal in your field to perform the following tasks.a. Find a chart that presents patterns for several different variables. Use
table 7.1 in Writing about Numbers to assess whether that type ofchart is appropriate for the types of variables involved.
b. Evaluate whether you can understand the meaning of the numbers inthe chart based only on the information in the chart. Suggest ways toimprove labeling and layout.
c. Using information in the article, revise the table to correct those errors.
d. Consider whether a different chart format would be more effective.e. Pick a table from the article. Draft a chart to present the same infor-
mation, including complete title, axis labels, legend, and notes.
3. Find data on time trends for two or three subgroups (e.g., trends in un-employment rates for men and for women, or values of two differentstocks over a few weeks). Create a chart to depict those patterns, com-plete with a good title, axis labels, legend, and notes.
� B. APPLYING STATISTICS
1. Using information from a frequency distribution on one of your vari-ables, create a chart. See table 7.1 in Writing about Numbers to decideon the best format of chart for the type of variable.
2. Run a cross-tabulation of two categorical variables in your data set,choosing an outcome that has only two possible values. Create a chart topresent the results.
3. Estimate a difference in means for a continuous variable according tovalues of a categorical predictor. Create a chart to present the results.
4. Identify a topic for a hypothetical research paper. Make a list of three orfour simple (e.g., no more than three-way relationships) charts thatwould pertain to that topic. Write individualized titles for each chart.
41 : CHAPTER SEVEN : SUGGESTED COURSE EXTENSIONS
01-C3314-TXT 1/10/05 6:52 AM Page 41

� C. WRITING AND REVISING
1. Evaluate a chart you have previously made for your paper, using thechecklist for chapter 7 in Writing about Numbers.
2. Peer-edit another student’s charts after he or she has revised them, againusing the checklist.
3. Read through the results section of your paper and identify topics or sta-tistics for which to create additional charts that pertain to your researchquestion. Draft them using pencil and paper including complete title, la-bels, legend, and notes.
4. Identify a table in your paper that would be more effective as a chart.Draft and create that chart including complete title, labels, legend, andnotes.
42 : CHAPTER SEVEN : SUGGESTED COURSE EXTENSIONS
01-C3314-TXT 1/10/05 6:52 AM Page 42

7Creating Effective Charts
SOLUTIONS
1. Figure 7A is missing a legend; 7B is missing axis titles, axis labels, andunits of measurement.
3. For each of the following topics, identify the type of task (e.g., univari-ate distribution, relationship between two variables or relationshipamong three variables), and types of variables to be presented (e.g., nom-inal, ordinal, continuous), then state which type of chart would be mostappropriate.a. Three-way association between one continuous and one nominal pre-
dictor (date and gender, respectively), and a categorical outcome(number of people receiving degrees). Multiple line chart, to showtrends by date on the (x-axis) in the number of people receiving college degrees (on the y-axis), with a separate line for each gender(shown in the legend).
b. Two-way (bivariate) association between transportation mode (nomi-nal) and cost (continuous). Simple bar chart, with one bar for eachtransportation mode and cost on the y-axis.
c. Composition (univariate) of a nominal variable. Pie chart to illus-trate the percentage (or dollar value) of market share for each colaproducer.
d. Distribution (univariate) of many-valued continuous variable. Linechart with SAT scores on x-axis and number or percentage of cases ony-axis.
e. Distribution of one categorical variable (educational attainment)within another categorical variable (continent). Stacked bar chart,with one bar for the U.S. and for each continent of origin and one slicefor each educational attainment level. Each bar totals 100% of thatcontinents’ immigrants (on the y-axis) to illustrate composition whilecontrolling for different numbers of immigrants from each continent.
f. Association between one nominal variable (archeological artifact)and one continuous variable (date). High/low/close chart (“high” and“low” show either standard error or 95% CI) with artifacts on x-axisand date on y-axis. Alternatively, a bar chart with error bars added.
g. Association between two continuous variables. Scatter chart (perhapswith a fitted line), to allow for the possibility of several cases with thesame value (e.g., several people with the same weight but differentblood pressure).
h. Distribution of a nominal variable (contraceptive type) by an intervalvariable (age group). Clustered bar chart with one cluster for eachcontraceptive type and a different bar color for each age group (in the
43 : CHAPTER SEVEN : SOLUTIONS
01-C3314-TXT 1/10/05 6:52 AM Page 43

legend). Y-axis shows % of each age group that uses that method. Astacked bar chart cannot be used because contraceptive types are notmutually exclusive (each woman could use more than one type).
i. Two bivariate associations between pairs of continuous variables:temperature by date and CO2 concentration by date. Line chart withtwo different Y-scales to portray concurrent trends in two continuousvariables, each of which is measured in different units.
5. Stacked bar chart to present the data shown in table 7A. Same title astable 7A.a. Counties arranged on the x-axis in descending order of total number
of unhealthy ozone days.b. A different color slice for each level of ozone warning, identified in
the legend.c. Number of unhealthy ozone days goes on the y-axis.
44 : CHAPTER SEVEN : SOLUTIONS
01-C3314-TXT 1/10/05 6:52 AM Page 44

8Choosing Effective Examples and Analogies
PROBLEM SET
1. For each of the following topics, give an analogy to suit a general audience.a. A 12-inch snowfall.b. Two numbers at opposite ends of a distribution.c. An erratic pattern of change.d. Something moving rapidly.e. A few things.f. Something very heavy.g. Prices that are rising rapidly.h. Something that has been level for a long time and then declines sud-
denly and substantially.i. A repetitive pattern.
2. Repeat the previous question but for a scientific audience in your field.
3. Devise short phrases to convey the concept of small size to the peoplelisted below.a. A cooking aficionadob. A gardening nutc. An artistd. A sports fanatic
4. Each of the following analogies would work better for some audiencesthan others. Name a suitable audience, an unsuitable audience, and animproved analogy for the latter group.a. “The size of a Palm Pilot.”b. “The gasoline shortage of the early 1970s.”
5. For each of the following topics, state whether information from Illinoisin 1990 would be useful as a numeric example. If so, give an example ofa type of contrast in which that information could be used.a. Chicago in 1990.b. Illinois in 2000.c. Illinois schoolchildren in 1990.d. Iowa voters in 2004.
45 : CHAPTER EIGHT : PROBLEM SET
01-C3314-TXT 1/10/05 6:52 AM Page 45

6. Your state is considering three alternative income tax scenarios: a stabletax rate (at 5%), an increase of 0.5 percentage points, and an increase of1.0 percentage points. Your local representative wants to know how eachscenario would affect low-, moderate-, and high-income residents.a. What criteria could you use to define “low,” “moderate,” and “high”
income?b. What kinds of numeric contrasts would you use to compare the dif-
ferent scenarios?c. Create a table to present those effects to the government budget
agency.d. Create a chart to illustrate the effects to citizens of the state.
7. State whether a $1.00 increase would be a useful contrast for each of thefollowing topics. If not, suggest a more reasonable increment. Assumethat all examples are for the year 2000 in the United States.a. Weekly allowance for an eight-year-old childb. Weekly wages for a supermarket checkout clerkc. Hourly wages for a supermarket checkout clerkd. Sales tax on a package of cigarettese. Sales tax on a new SUV
46 : CHAPTER EIGHT : PROBLEM SET
01-C3314-TXT 1/10/05 6:52 AM Page 46

8Choosing Effective Examples and Analogies
SUGGESTED COURSE EXTENSIONS
� A. REVIEWING
1. Find a one-to-three-page article in the popular press or a journal or bookin your field.a. Circle all analogies or metaphors used to illustrate quantitative pat-
terns or relationships.i. Does the author explicitly or implicitly convey the purpose in
each example, or is it left unclear?ii. Is it easy to understand the analogy and the pattern or relation-
ship it is intended to illustrate?b. Are there other places in the article where an analogy or metaphor
would be helpful? Identify the purpose of the analogy or metaphor foreach such situation.
c. Choose two analogies that are unclear or where you have suggestedadding an analogy or metaphor, and revise them using the principlesin chapter 8.
d. Identify the intended audience for the article. Choose a different au-dience (e.g., more quantitatively sophisticated; younger) and rewriteone analogy to suit them.
2. In an article in the popular press or a journal or book in your field, circleall numeric examples where a single number is reported (e.g., not a com-parison of two or more numbers). For each indicate whether the authorconveys the purpose of the example (e.g., whether it is a typical or un-usual value).
3. In the same article, circle all numeric contrasts.a. Indicate whether in each instance the author provides enough infor-
mation for you to assess whether it is a realistic difference or changefor the research question.
b. Evaluate whether different or additional size contrasts would be use-ful for the intended audience, consideringi. plausibility;ii. real-world application;iii. measurement issues.
c. Identify an audience that would be interested in different applica-tions than the audience for whom the article is currently written. De-scribe how you would select numeric contrasts to meet their interests.
47 : CHAPTER EIGHT : SUGGESTED COURSE EXTENSIONS
01-C3314-TXT 1/10/05 6:52 AM Page 47
� B. APPLYING STATISTICS
1. Choose an audience to whom you want to explain results of a statisticalanalysis.a. Devise an analogy to describe one of the main numeric patterns or re-
lationships in your results using the principles described in chapter8 of Writing about Numbers.
b. Select numeric contrasts within your data using the principles inchapter 8.
c. Review the literature in your field to determine whether standards orcutoffs are commonly used. If so, calculate and describe a contrast be-tween your data and that standard.
� C. WRITING AND REVISING
1. Critique your paper using the guidelines in questions A.1 through A.3and B.1.
48 : CHAPTER EIGHT : SUGGESTED COURSE EXTENSIONS
01-C3314-TXT 1/10/05 6:52 AM Page 48

8Choosing Effective Examples and Analogies
SOLUTIONS
1. For each of the following topics, give an analogy to suit a general audience.a. “Knee deep.”b. “Polar opposites.”c. “All over the map.”d. “Faster than a speeding bullet.”e. “A handful.”f. “As heavy as an elephant.”g. “Going through the roof.”h. “Like it fell off a cliff.”i. “Like a broken record.”
3. Analogies for small size.a. Pea-sizedb. Like a grain of sand or a seedc. Like a speck of paintd. Like a drop of water in an Olympic-sized swimming pool
5. Use of information from Illinois in 1990.a. Comparison of the state and its largest city in the same year.b. Analysis of trends over time in the entire state.c. Comparison of one age group to the total population.d. A poor choice, as too many dimensions differ (time, place, and age).
7. Using a $1.00 increase as a contrast.a. Reasonable.b. Too small. Look at $50 difference.c. Reasonable.d. Okay or possibly too large. Also consider smaller contrasts.e. Way too small. Look at difference of several hundred dollars.
49 : CHAPTER EIGHT : SOLUTIONS
01-C3314-TXT 1/10/05 6:52 AM Page 49

9Writing about Distributions and Associations
PROBLEM SET
1. Write descriptions of the age, gender, and racial distributions shown intable 6.3 (Writing about Numbers, 113).
2. Write a description of the race/household type patterns in table 6.1(Writing about Numbers, 105), using the GEE approach. Hint: to com-pare across racial/ethnic groups, report percentage distribution ofhousehold type within each race. Why are percentages preferred tocounts in this case?
3. Write a description of the age pattern of mortality shown in figure 7.15b(Writing about Numbers, 159). Use descriptive phrases to convey theshape of the pattern, then document with appropriate numeric evidence.Incorporate selected quantitative comparisons to illustrate size of differ-ences in the chart.
4. What kind of test would you perform to assess the statistical significanceof differences in household type by race? (Do not perform the calcula-tion, just name the statistic.)
50 : CHAPTER NINE : PROBLEM SET
01-C3314-TXT 1/10/05 6:52 AM Page 50

5. Refer to figure 9A.
51 : CHAPTER NINE : PROBLEM SET
0
20
40
60
80
100
120
0 5 10 15 20 25 30
Adult obesity rate (%), 2002
% in
crea
se in
obe
sity
rat
e
Adult obesity rate (%) versus percentage change in obesity rate,United States, 1992–2002, by state
Figure 9A.
a. What types of variables are shown?b. What kind of chart is used to portray the association? Explain why
this is an appropriate choice.c. Write a description of the pattern in figure 9A, reporting the level and
range of each of the two variables and portraying the shape and extentof association between them.
d. What statistic would you use to measure the extent of association be-tween those variables?
6. In figure A.2 (Writing about Numbers, 275), the pattern of emergencyroom use varies by race and family income. What is such a pattern calledin statistical terms? In “GEE” lingo? Write paragraphs to describe thatpattern toa. a group of first-year high school students;b. a group of graduating statistics majors.
01-C3314-TXT 1/10/05 6:52 AM Page 51

9Writing about Distributions and Associations
SUGGESTED COURSE EXTENSIONS
� A. REVIEWING
1. In a journal article, find a description of univariate distributions for eachof the following types of variables. Critique it, using the criteria de-scribed in chapter 9 of Writing about Numbers.a. A nominal variableb. An ordinal variablec. An interval or ratio variable with many possible values
2. Refer to each of the descriptions in question A.1.a. Identify the criteria the author is using to choose which value to high-
light. Does that value match the research question and introductorymaterial in the article?
b. If all values are described with equal emphasis, assess whether oneor more values should be featured and why.
3. Find examples of each of the following types of bivariate associations.Critique them, using the principles in chapter 9.a. A bivariate association between two categorical variablesb. An association between a categorical and a continuous variablec. Bivariate correlations among a series of continuous variables
4. In a textbook or a journal article, find a description of a table or chartportraying time trends for two or more subgroups or outcomes (e.g., val-ues of several different stocks over a few weeks, or trends in unemploy-ment rates for two or more states or regions).a. Critique the description.b. Rewrite it using the “generalization, example, exceptions” (GEE)
approach.
� B. APPLYING STATISTICS
1. Repeat questions A.1 and A.2 using frequency distributions on one nominal, one ordinal, and one interval or ratio variable from your owndata set.
2. Repeat question A.3 based on bivariate associations among variables inyour data set.
52 : CHAPTER NINE : SUGGESTED COURSE EXTENSIONS
01-C3314-TXT 1/10/05 6:52 AM Page 52

3. Repeat question A.4 based on a three-way association among variablesin your data set.
� C. WRITING
1. In your textbook or a journal article, find a table or chart showing the dis-tribution of each of the following types of variables. Write a brief de-scription of each distribution, emphasizing the modal value. Summa-rize, then report key indicators of central tendency.a. A nominal variableb. An ordinal variablec. An interval or ratio variable with many possible values
2. Rewrite each of the descriptions in question A.1 to highlight a value ofinterest other than the mean or mode, such as a minority group, unusualvalue, or most recent value.
3. In a textbook or a journal article, find tables or charts depicting the fol-lowing types of associations. Write a brief description of each type ofpattern, using the principles in chapter 9 of Writing about Numbers.a. Two categorical variablesb. An association between a categorical predictor and a continuous out-
come variablec. Bivariate correlations among a series of continuous variables
4. In a textbook or a journal article, find a table or chart portraying timetrends in two or more related concepts (e.g., values of several differentstocks over a few weeks, or trends in unemployment rates for two ormore states or regions). Describe the pattern, using the GEE approach.
5. In a textbook or a journal article, find a chart depicting a three-way as-sociation such as a clustered bar chart or simple bar chart with two ormore panels. Describe the pattern, using the GEE approach.
� D. REVISING
1. Critique and rewrite your descriptions of univariate statistics (distribu-tions, central tendency), using the principles in chapter 9 of Writingabout Numbers.
2. Critique and rewrite your descriptions of bivariate associations statistics(cross-tabulations, differences in means, correlations) using the prin-ciples in chapter 9.
3. Critique and rewrite your descriptions of three-way associations usingthe principles in chapter 9.
4. Peer-edit the original and revised versions of these descriptions.
53 : CHAPTER NINE : SUGGESTED COURSE EXTENSIONS
01-C3314-TXT 1/10/05 6:52 AM Page 53

9Writing about Distributions and Associations
SOLUTIONS
1. “Table 6.3 shows the demographic composition of the study sample. Justover half of the 2,058 respondents were female (51.4%). Persons aged 40 to 64 years were the largest single age group in the sample (41.4%),just edging out persons aged 18–39 (37.8%). Elderly persons (aged 65and older) made up about one-fifth of the sample.
The most common racial/ethnic group was non-Hispanic whites,with 21⁄2 times as many respondents as the second largest racial/ethnicgroup, non-Hispanic blacks (55.6% and 22.1%, respectively). Hispanicscomprised the third-largest group (15.9%), followed by Asians (4.2%)and persons of other racial/ethnic origin (2.2%).”
3. “In 1996, age-specific death rates in the United States traced the famil-iar J-shape, with a substantial decline between infancy and early child-hood, slowly increasing rates until middle age, and then an acceleratingincrease into old age. The lowest death rate was observed among chil-dren aged 5–9 years (19.4 deaths per 100,000 persons)—a 50-fold de-crease from the death rate among infants (755 per 100,000). From age 50onward, the death rate increased about 50% for each successive 5-yearage group. Approximately one out of every six persons aged 85 or olderdied in 1996—the highest death rate of any age group.”
5. Referring to figure 9A.a. Both the percentage of adults who are obese in 2002 and the percent-
age change in obesity rates between 1992 and 2002 are continuousvariables. Percentage obese is a ratio variable; percentage change is aninterval variable (no absolute zero point).
b. A scatter chart is used in this case because many X values have morethan one Y value. Also, using a scatter chart conveys the almost com-plete lack of an association between obesity rate and percentagechange in obesity rate.
c. “In 2002, at least 17%, and as many as 28% of adults in each of the50 United States were obese. Obesity rates increased by 40% to 114%between 1992 and 2002. Somewhat surprisingly, there was virtuallyno correlation between the obesity rate in 2002 and the percent-age change in obesity over the preceding decade. Large percentageschanges were observed across the full range from low- to high-obesity-rate states.”
d. The Pearson correlation is the usual measure of association betweentwo continuous variables.
54 : CHAPTER NINE : SOLUTIONS
01-C3314-TXT 1/10/05 6:52 AM Page 54

10Writing about Data and Methods
PROBLEM SET
1. For each of the following scenarios, list what information you would re-port in a data section for a scientific paper. Hint: what additional infor-mation would you want to know?a. A three-year study of a six-month drug rehabilitation program that re-
cruited 200 subjects to examine cure and relapse rates.b. A study of calcium intake among 50 pregnant women, based on their
recall over a two-week period.
2. Dr. Dollar is conducting a study of poverty patterns in the United Statesbased on annual income data from the 2000 census. She defines a cate-gorical measure of income group comparing family income (calculatedfrom income of individual family members, alimony, and four types ofsocial benefits) against the federal poverty thresholds. Classifications aredefined in terms of multiples of the threshold: � .50, .50–.99, 1.00–1.84, 1.85–2.99, and 3.00 or greater. (Search for “poverty” on the U.S.Census Web page (www.census.gov) for more detail.) State how youwould describe the poverty measure ina. a one-page summary of the study for a local newspaper;b. documentation of a new data set that has collected data on each of the
income components as part of a written questionnaire;c. a journal article on poverty patterns, written for people who are
familiar with poverty thresholds.
3. Making use of newly available data from a three-year panel study of asample of 10,000 people drawn from the 2000 census, Dr. Dollar de-scribes movement in and out of poverty and duration of poverty (inmonths) over the study period. Poverty was defined as family income be-low the threshold ( � 1.0). Data were collected annually, with retro-spective recall of income in each of the previous 12 months. What in-formation would you want to add to item 2.c to describe these data forthis research question?
4. A researcher in a meteorology lab accidentally erased a file containinginformation from two years’ worth of climatic data. Embarrassed, hewent ahead and analyzed data for the other 28 years in the study. Whatassumptions did he implicitly make about the missing data?
55 : CHAPTER TEN : PROBLEM SET
01-C3314-TXT 1/10/05 6:52 AM Page 55

5. For each of the following data, methods and objectives, write a short dis-cussion of strengths and limitations for the concluding section of a gen-eral interest newspaper article.a. Study: twenty subjects were interviewed at the Snooty Golf Club at
noon on a Friday in early April regarding their preferred color and fitof jeans. Objective: a marketing study by the Gap.
b. Study: two classes of second graders in the same school were given a math test in September. One class was then taught with a new math curriculum, the other with the standard curriculum. Theclasses were tested again in June. Objective: an evaluation of the new math curriculum.
c. Study: data on hair color and age were collected for everyone aged25–85 in a city of 200,000 people. Deaths over a two-year period wereascertained from death certificates. Two models were estimated: onewith hair color as the predictor and mortality as the outcome; the sec-ond with age as another predictor. Objective: understand the poten-tial benefit of hair dye in improving survival.
6. Revise the material in box 10.2 for a general interest newspaper article.Consider detail, vocabulary, and citation style.
56 : CHAPTER TEN : PROBLEM SET
01-C3314-TXT 1/10/05 6:52 AM Page 56

10Writing about Data and Methods
SUGGESTED COURSE EXTENSIONS
� A. REVIEWING
1. In a one- or two-page article in the health or science section of a news-paper or magazine, mark the information on data and methods.a. Critique the presentation of that information, using the guidelines for
content of data and methods for general interest articles for a lay au-dience in chapter 10 of Writing about Numbers.
b. Assess whether additional information would be helpful for peopleseeking information to compare with data from another study.
c. Evaluate the discussion of how the data and methods affect interpre-tation of the findings.
2. Find a short article in a journal from your field, and mark the informa-tion on data and methods.a. Critique the presentation of that information, using the checklist in
chapter 10 and the guidelines for content of data and methods for sci-entific articles.
b. List additional information needed by researchers seeking to repli-cate the data collection.
c. List additional information needed by researchers seeking to repli-cate the statistical analysis.
d. Assess how well the article discusses how the data and methods af-fect interpretation of the findings.
e. Indicate whether the authors suggest directions for future research.f. Pick one aspect of data and methods in the discussion and rewrite it
to improve the presentation.
3. Go to a data Web site such as the U.S. Census Bureau, National Centerfor Health Statistics, or the Bureau of Labor Statistics and identify atopic of interest involving two or three variables. Evaluate the Web sitein terms of how easy it is to find information abouta. the type of study design (e.g., cross-sectional sample survey, retro-
spective, prospective);b. the data sources (e.g., vital registration forms, questionnaires, admin-
istrative records).c. the wording of questions used to collect the variables of interest
to you;d. the units or coding of those variables;e. sampling weights, if applicable.
57 : CHAPTER TEN : SUGGESTED COURSE EXTENSIONS
01-C3314-TXT 1/10/05 6:52 AM Page 57

� B. WRITING
1. Outline the data section for your analysis for a scientific paper, using thechecklist in chapter 10 of Writing about Numbers.
2. Write a one-paragraph description of the data and methods for the sameanalysis for a lay audience.
3. Write a discussion of the strengths and limitations of your data andmethods for a scientific audience.
4. Exchange your answers to questions B.1 through B.3 with someonestudying a different topic or data. Peer-edit each other’s work.
� C. REVISING
1. Critique your data and methods section, using the criteria in chapter 10for a scientific paper.a. Identify elements you have omitted.b. Track down that information in data documentation or other publica-
tions on the same data.c. Rewrite your data and methods to incorporate that information.
2. Identify strengths or limitations of the pertaining data or methods thatneed additional discussion. Revise the discussion to correct those weak-nesses, writing for a scientific audience.
3. Rewrite the corrected discussion section for a lay audience.
4. Exchange your answers to questions C.1 through C.3 with someonestudying a different topic or data. Peer-edit each other’s work, compar-ing the initial drafts with the revisions.
58 : CHAPTER TEN : SUGGESTED COURSE EXTENSIONS
01-C3314-TXT 1/10/05 6:52 AM Page 58

10Writing about Data and Methods
SOLUTIONS
1. List what information you would report in a data section for a scientificpaper.a. When, where, who (demographic characteristics) was studied? How
were they recruited? What was the baseline response rate among recruits? What percentage of the initial sample was lost-to-follow up and how? How did the sample compare demographically to allclients at that rehab center? How were “cure” and “relapse” definedand measured? By whom were these assessments made?
b. Again, the Ws. How were they recruited, what was the response rate,and how did the sample compare to all pregnant women? Were theyasked specifically about calcium intake or to list foods? Open- orclosed-ended questions about food?
3. Loss-to-follow-up, how income data were collected (total or by compo-nents; in what ranges? continuous or categorical?)
5. Write a short discussion of strengths and limitations for the concludingsection of a general interest newspaper article.a. “The findings from this study are probably of little use for the average
Gap store. Because the data were collected during the school year ona weekday at an exclusive golf club, the opinions represent princi-pally those of relatively affluent, nonworking adults—a fairly smallshare of the Gap market. Future studies should sample younger per-sons of both genders from a range of income and employment groups,as well as students—the groups that comprise the more usual targetaudience.”
b. “Strengths of this study include its longitudinal nature, with testingboth before and after adoption of the new curriculum in schools witheach type of curriculum. However, it isn’t clear whether random assignment was used to decide which schools followed which cur-riculum, or whether school districts made their own choices of cur-riculum. In addition, possible differences in socioeconomic, demo-graphic, and educational characteristics that might explain observeddifferences across schools or changes across time were not included.”
c. “This study demonstrates that the association between hair color andmortality is spurious, being completely explained by their mutual as-sociation with age. Strengths of the study include the large samplesize and the wide range of ages and hair colors represented, allowingtheir association to be observed.” (See chapter 3 for an explanation ofthis topic.)
59 : CHAPTER TEN : SOLUTIONS
01-C3314-TXT 1/10/05 6:52 AM Page 59

11Writing Introductions, Results, and Conclusions
PROBLEM SET
1. Write a results section for a scientific paper about federal outlays, de-scribing the recent distribution across major categories of outlays (figure7.2b in Writing about Numbers, 133) and how the level and distributionhave changed since 1950 (figure 7.7, ibid., 141). Organize the topics intoparagraphs with good introductory sentences, then describe the patternsand cite evidence from the charts.
2. Write an introductory paragraph for a general interest article abouttrends and differences in federal outlays in the United States. List thekinds of background information you would incorporate, and suggestuseful types of quantitative comparisons to highlight why the topic is in-teresting or important.
3. Write a results section for a scientific paper about AIDS knowledge bylanguage group (table 6.2 in Writing about Numbers, 110). Summarizegeneral patterns for differences across language groups and acrossknowledge topic areas, and report results of statistical significance tests.
4. Write a concluding section for a scientific paper about AIDS knowledgeby language groups to follow your results section from the precedingquestion. List the types of background information you would use toshow how findings of the study might be applied to health educationprograms in the United States
60 : CHAPTER ELEVEN : PROBLEM SET
01-C3314-TXT 1/10/05 6:52 AM Page 60

11Writing Introductions, Results, and Conclusions
SUGGESTED COURSE EXTENSIONS
� A. REVIEWING
1. Find a newspaper or magazine article that summarizes findings of aquantitative study. Critique it, using the principles in chapter 11 of Writ-ing about Numbers.a. Is there a clear introduction of the broad issues or questions to be in-
vestigated?b. Do topic sentences introduce the purpose of each table, chart, or
quantitative comparison?
2. Find a journal article about a quantitative study in your field. Critique it,using the principles in chapter 11 to check for the following.a. Clear introduction of the broad issues or questions to be investigatedb. Review of the previous literature to identify theories and existing
evidencec. Topic sentences that introduce the purpose of each table, chart, or
quantitative comparisond. Descriptions of direction, magnitude, and statistical significance of
associationse. Good explanations of how specific numeric findings address the
questions under studyf. A discussion and conclusions section that summarizes numeric find-
ings and relates them back to the research question and to previousstudies
g. Consideration of causality and substantive significance of findings inthe conclusions
� B. WRITING
1. Write an introductory section for your paper following the guidelines inchapter 11.
2. Write the results section of your paper.a. Organize the quantitative analysis into manageable chunks, each pre-
sented in a separate table or chart.b. Use paragraphs and subheadings within the results section to organ-
ize written descriptions of each table or chart.c. Write topic sentences that introduce the purpose of each table, chart,
or quantitative comparison.
61 : CHAPTER ELEVEN : SUGGESTED COURSE EXTENSIONS
01-C3314-TXT 1/10/05 6:52 AM Page 61

d. Include generalizations about direction, magnitude, and statisticalsignificance where relevant.
e. Write transition sentences to orient readers about how the differ-ent tables or charts relate to one another and to the overall researchquestion.
3. Write the discussion and conclusions section of your paper, includinga. summaries of major numeric findings rather than repetition of de-
tailed numbers from the results;b. discussion of causality, statistical significance, and substantive signi-
ficance of findings;c. explanation of how those findings relate to initial hypotheses and to
findings of other studies.
4. Write a two- or three-page general interest article on the same topic, fol-lowing the guidelines in chapter 11.
� C. REVISING
1. Critique the introductory section of your paper, using the principles inchapter 11. Rewrite it to incorporate the changes you have identified.
2. Evaluate the results section of your paper using the criteria listed underquestion B.2. Rewrite the results section to incorporate the changes youhave identified.
3. Critique the discussion and conclusions section of your paper using thecriteria listed under question B.3. Rewrite it to incorporate the changesyou have identified.
4. Exchange initial and revised drafts of the introductory, results and dis-cussion sections with someone writing about a different topic or data.Peer-edit the work.
62 : CHAPTER ELEVEN : SUGGESTED COURSE EXTENSIONS
01-C3314-TXT 1/10/05 6:52 AM Page 62
11Writing Introductions, Results, and Conclusions
SOLUTIONS
1. “In 2000 in the United States, human resources comprised by far thelargest single category of federal outlays (61% of the $1.8 trillion spentthat year; figure 7.2b). The second largest category—national defense—accounted for only about one quarter as much of all outlays (16% of thetotal). Net interest, physical resources, and other functions togetheramounted for the remaining 23%.
“The relative shares of those functions changed substantially over thesecond half of the twentieth century (figure 7.7b). As recently as 1970,national defense was the modal category, comprising more than half ofall federal outlays in 1960, and edging out human resources in 1970(42% and 39%). Since that time, human resources have dominated, ac-counting for 53%, 49%, and 62% of all federal outlays in 1980, 1990,and2000, respectively. Over the same period, the concurrent shares of out-lays going to national defense were 23%, 24%, and 16%.”
3. “Generally, respondents were more likely to understand the ways AIDScan be transmitted than ways AIDS cannot be transmitted (table 6.2). Onaverage, English speakers answered 91.7% of the “likely” transmissionquestion correctly, compared to an average of 59.8% of “unlikely” ques-tions correct. Similar patterns were observed among Spanish speakers.
“Although all language groups scored high on the question abouttransmission via sexual intercourse, for the other three likely trans-mission modes, incorrect answers were more common among Spanishspeakers, especially those who answered the questionnaire in Spanish.For example, only two-thirds of that group knew that the AIDS virus isvery likely to be spread via shared IV drug needles, compared to 92% ofEnglish speakers and 91% of Spanish respondents who completed thequestionnaire in English.
“Responses to questions about transmission via casual contact weremore troubling (bottom panel of table 6.2), with fewer than two-thirds ofrespondents knowing the correct answers to those questions. Most strik-ing was the widespread misconception about transmission from a med-ical provider: only one-third knew that such spread is unlikely. Differ-ences across language groups were sizeable and statistically significantfor all but the medical provider question.”
63 : CHAPTER ELEVEN : SOLUTIONS
01-C3314-TXT 1/10/05 6:52 AM Page 63

12Speaking about Numbers
PROBLEM SET
1. Adapt the material in text box 11.1 (Writing about Numbers, 224) intoslides for a 10-minute presentation. Include a good title for each slideand incorporate the information about which principles are used.
2. Write the speaker’s notes to accompany the slides you created for theprevious question.
3. Create one or more slides to present the following material to a scientificaudience. “The Center for Epidemiological Studies-Depression Scale(CES-D) is a 20-item scale for epidemiological research that was devel-oped by the National Institute of Mental Health. Respondents are askedto choose from four possible responses in a Likert format, where ‘0’ is‘rarely or none of the time (less than one day per week),’ and ‘3’ is ‘almostor all of the time (five to seven days per week).’ The theoretical range isfrom 0 to 60, with higher scores reflecting greater levels of depressivesymptoms. The CES-D has four separate factors: depressive affect, so-matic symptoms, positive affect, and interpersonal relations. The CES-Dhas very good internal consistency with alphas of 0.85 for the generalpopulation and 0.90 for a psychiatric population (Radloff 1977).”
4. Write the speaker’s notes to accompany the slides you created for theprevious question.
5. Write “Vanna White” notes to introduce the tables or charts listed below.a. Table 6.1 (“Households by type, race, and Hispanic origin,” Writing
about Numbers, 105)b. Figure 7.2b (“Federal outlays by function, 2000,” ibid., 133)c. Figure 7.5a (“Relative odds of emergency room visits for asthma, by
race and income,” ibid., 138)d. Figure 7.15b (“Death rates by age, United States, 1996,” ibid., 159)
6. Adapt the following tables into simpler tables or charts for use on slidesfor a speech. Aim for one concept or series of closely related conceptsper chart.a. Table 6.1 (“Households by type, race, and Hispanic origin,” Writing
about Numbers, 105)b. Table 6.8 (“Drug use by arrestees in selected major United States
cities by type of drug and sex, 1999,” ibid., 118)
64 : CHAPTER TWELVE : PROBLEM SET
01-C3314-TXT 1/10/05 6:52 AM Page 64

12Speaking about Numbers
SUGGESTED COURSE EXTENSIONS
� A. WRITING
1. Create slides and speaker’s notes for a 20-minute presentation of an aca-demic paper. Include slides for each major section of the paper, includ-ing introduction, literature review, data and methods, results (severalcharts or tables), and conclusions.
2. Adapt charts or tables from your paper to be used on the slides. Writespeaker’s notes with “Vanna White” directions for where to point whenintroducing each table or chart.
3. Peer-edit the written drafts of slides and notes, using the checklist fromchapter 12.
4. Rehearse the talk out loud, checking timing and clarity.
5. Make revisions to slides and speaker’s notes based on what you learnedin your rehearsal.
6. Repeat A.1 through A.5 for a five-minute oral presentation on an ex-ample from your textbook or a journal article.
� B. REVISING
1. Critique slides you have previously created for a 15–20 minute speechto a scientific audience, using the criteria in chapter 12 of Writing aboutNumbers.
2. Critique the speaker’s notes for the same speech.
3. Pick one large table from the results section of your paper. Revise it intoseveral simpler table slides or chart slides.
4. Revise the slides and notes for the same audience.
5. Write “Vanna White” notes to introduce and explain one table and onechart from your revised presentation.
65 : CHAPTER TWELVE : SUGGESTED COURSE EXTENSIONS
01-C3314-TXT 1/10/05 6:52 AM Page 65

6. Exchange your revised work from questions C.3 through C.5 with some-one working on a different topic and data. Peer-edit each other’s work.
7. Revise the slides to create a 10-minute presentation for a lay audience.
66 : CHAPTER TWELVE : SUGGESTED COURSE EXTENSIONS
01-C3314-TXT 1/10/05 6:52 AM Page 66

12Speaking about Numbers
SOLUTIONS
1. Slides for material in box 11.1.
67 : CHAPTER TWELVE : SOLUTIONS
•
Annotated example of good writing
• Article from front section of New York Times—“First Tower to Fall Was Hit at Higher Speed,
Study Finds”E. Lipton and J. Glanz (2/23/02)
Tailoring to the audience and objectives—An educated lay audience—Two-page article
•
Figure 12A.
01-C3314-TXT 1/10/05 6:52 AM Page 67

68 : CHAPTER TWELVE : SOLUTIONS
Energy and impact of planes
“The energy of motion carried by any object, called the kinetic energy, varies as the square of its velocity, so even modest differences in speed can translate into large variations in what the building had to absorb.”— Basic principle: Define concepts using simple wording.
“That means that while the United jet was traveling only about a quarter faster than the American jet, it would have released about 50 percent more energyon impact.”—Tool: Relative difference and % difference calculations
•
•
Figure 12C.
Airplane speed
• “The FBI said the government’s analysis put the speeds at 586 m.p.h for the United flight and
494 m.p.h. for the American one.”Basic principle: Report numbers.
“In both cases, the planes were flying much faster than they should have been at that altitude;the aviation agency’s limit below 10,000 feet is 287 m.p.h.”—Basic principle: Compare against a standard to help
interpret number.
—
•
Figure 12B.
01-C3314-TXT 1/10/05 6:52 AM Page 68

69 : CHAPTER TWELVE : SOLUTIONS
How did speeds compare to design limits?
• Uses a bar chart to illustrate speed of planes relative to important benchmarks.—Basic principle: Choose the
right tools.
• Describe patterns in chart by pointing out that planes’ speeds exceeded design limits.—Basic principle: Compare
against meaningful cutoffs.
Impact speed of 9/11 flights* and comparison speeds
530414
287.5
586494
0100200300400500600700
Boeingdesign
cruise speedat 35,000 ft.
Boeingdesign
speed limitat 1,500 ft.
F.A.A.speed limit<10,000 ft.
UnitedAirlines 175
AmericanAirlines 11
Just how much energy is that?
• “Even at a speed of only about 500 m.p.h., a partly loaded Boeing 767 weighing 132 tons would have created about three billion joules of energy at impact, the equivalent of three-quartersof a ton of T.N.T.”—Basic principle: Interpret numbers and relate them to
familiar quantities.
Figure 12D.
Figure 12E.
01-C3314-TXT 1/10/05 6:52 AM Page 69

70 : CHAPTER TWELVE : SOLUTIONS
Why do design limits matter?
• “Such speeds threatened the structural integrity of the planes even before they struck the buildings, because the lower the plane goes,the thicker the air becomes, so the slower the plane must travel to avoid excessive stress.”— Basic principle: Explain complex concepts in
simple terms.• In this case, explain principles of physics.
Authors’ use of tools and principles
• Explained complex ideas without (much) jargon. — Energy on impact— Effect of altitude on stress
• Compared against— Useful benchmarks
• FAA speed limit• Design speed limit
—Familiar examples• TNT
• Used appropriate tools.— Chart to show relative
speed—Prose
• Reports a few numbers.• Explains patterns.• Defines terms.
—Types of quantitative comparisons• Absolute difference• Relative difference• Percentage difference
Figure 12F.
Figure 12G.
01-C3314-TXT 1/10/05 6:52 AM Page 70
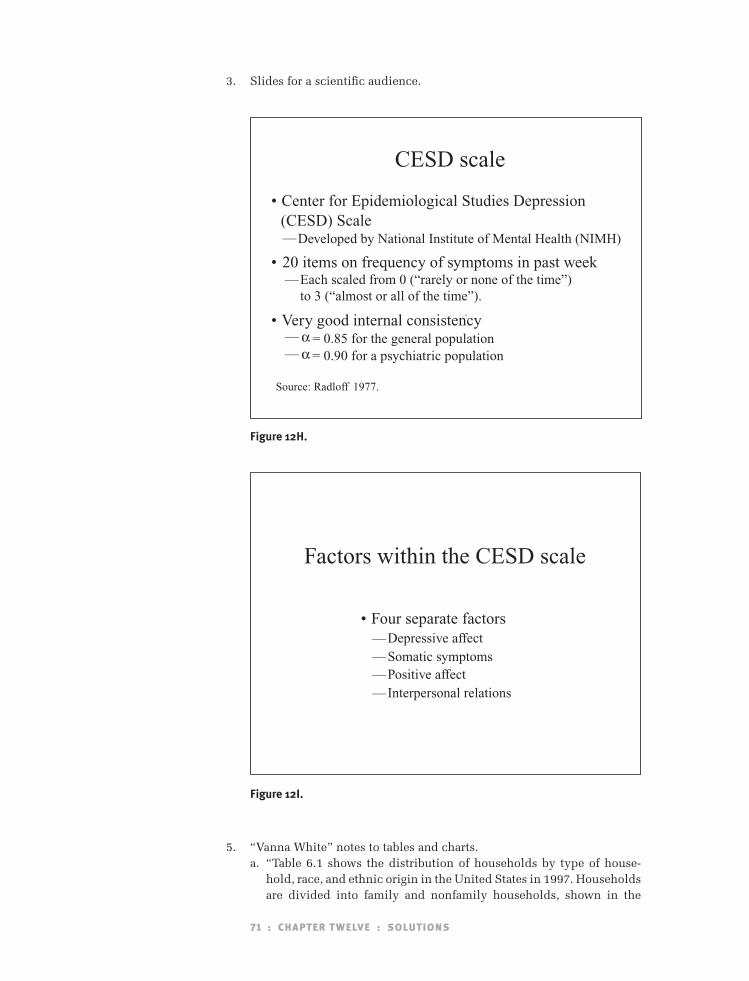
5. “Vanna White” notes to tables and charts.a. “Table 6.1 shows the distribution of households by type of house-
hold, race, and ethnic origin in the United States in 1997. Householdsare divided into family and nonfamily households, shown in the
71 : CHAPTER TWELVE : SOLUTIONS
Factors within the CESD scale
• Four separate factors —Depressive affect—Somatic symptoms—Positive affect— Interpersonal relations
Figure 12I.
CESD scale
• Center for Epidemiological Studies Depression (CESD) Scale —Developed by National Institute of Mental Health (NIMH)
• 20 items on frequency of symptoms in past week—Each scaled from 0 (“rarely or none of the time”)
to 3 (“almost or all of the time”).
• Very good internal consistency— = 0.85 for the general population— = 0.90 for a psychiatric population
.
Source: Radloff 1977.
Figure 12H.
3. Slides for a scientific audience.
01-C3314-TXT 1/10/05 6:52 AM Page 71

middle and right-hand sections of the table. The racial distribution ofall households is in the leftmost column of numbers. All numbers arereported in units of thousands, meaning that there are 102 millionhouseholds when all races and household types are combined. Dis-tributions of household types are also broken out separately by raceand Hispanic origin—shown in the rows.” [Then point out the modalhousehold type and how it compares to other household types of in-terest, overall, and by race.]
b. “The distribution of federal outlays by major function in the UnitedStates in 2000 is shown in figure 7.2b.” [Define the slices and pointout their respective colors in the pie or legend as you describe the rel-ative shares of the outlay categories, as in the answer to question 1,chapter 11.]
c. “Figure 7.5a shows how the relative chances of emergency room useamong asthmatic children varied by family income and race in theUnited States in 1991. Income groups (poor, near poor, and non-poor)are arranged from left to right along the horizontal axis [wave alongthe axis]. There is a different color bar for each racial group—blackfor black children and gray for non-black children [point at legend orone cluster of bars]. The heights of the bars show the relative chancesof emergency room use for asthma, compared to non-poor, non-blackchildren (the reference category) [point at pertinent bar].” [Then de-scribe the patterns by race and by income as in appendix A.]
d. “The age pattern of death rates in the United States in 1996 is shownin figure 7.15b. Age is grouped into five-year age categories across thex-axis. Death rates are shown on a logarithmic scale on the y-axis,measured in number of deaths per 100,000 persons in the pertinentage group. The logarithmic scale is used to allow a wide range ofdeath rates to be shown on a single graph without obscuring differ-ences at the low end of the range. [For a lay audience, add] Thatmeans that the distance between successive marks on the y-axis cor-responds to a 10-fold increase in death rates. For example, death ratesincrease by nearly a multiple of 10 between the age groups 20–24 and50–59 (from 101.3 deaths per 100,000 persons to 851.3 per 100,000).Death rates increase by another factor of 10 between the age groups50–59 and 80–84 years.” [Then go on to describe the J-shaped pat-tern, as in the answer to question 3 from chapter 9.]
72 : CHAPTER TWELVE : SOLUTIONS
01-C3314-TXT 1/10/05 6:52 AM Page 72