Embed Size (px)
Citation preview

1
Shrink: Paper Efficiency ProjectPEP Talk
Paper v Digital
Mandy Haggith - [email protected] Sturges - [email protected] Walsh - [email protected]
shrinkpaper.org

2
European Environmental Paper Network

3
Common Vision
The Environmental Paper Networks in Europe and North America (> 100 NGOs) have a shared Vision for Transforming the Pulp and Paper
Industry
• Reduce consumption• Reduce reliance on virgin forest fibre• Ensure social responsibility• Source fibre responsibly• Ensure clean production

4
We want to protect this…

5
from becoming this…
6
…and minimise this.

7
Main impacts of paper-making
Climate Change
Forest Destruction
Energy Use
Waste
Water Use
Pollution
Plantations
Illegal Logging
Human Rights Abuses

8
The shrink project 2 (2012-13)
60 UK organisations being assessed and urged to take action on paper efficiency, 10 each of
• Supermarkets• Catalogue retailers• Financial firms• Utilities (gas, phone etc)• Governmental bodies• Universities
The scorecard will be published in July 2013
New website, more paper saving case studies
Motivational seminars and PEP talks:
• Packaging (5 June)• Paper Vapour (climate change), 9 July, London

9
Paper v digital – some starting points
Global annual sector CO2e emissions (from Climate for Ideas):
• paper - 2500 MTonnes (8% of global emissions) • IT - 860MTonnes (2.7% of global emissions)
The Climate Group estimates digital applications could replace up to 25% of paper consumption.
That could produce really substantial carbon emission reductions.

10
Paper v Digital – some questions
Do we compare global impacts of the paper and IT industries, or marginal impacts, product by product?
Do we compare impacts of use, or include impacts of manufacture and disposal as well (full life cycle assessment?)
What is included in the life cycle assessment of products? Carbon footprint only? Or all environmental and social impacts?
Is enough known about the impacts of new technologies (e.g. rare metals and handling of e-waste)?
How to handle threshold effects? (e.g. the claim that <5000 pages, paper is better, > 5000 pages, digital is better)
How to handle multi-functionality of electronic tools?

11
Understanding the footprint of digital content – experiences from the UK magazine sectorMichael Sturges, Innventia Edge
11

12
PPAs carbon journey
2001 – Balanced Reading – mass balance of the UK magazine publishing supply chain (Phase 0)
2008 – Magazine sector carbon footprint (Phase 1)
2009 – Magazine Carbon calculator (Phase 2)
2011 – Updating the carbon calculator data (Phase 3)
2012-13 – Moving the calculator online, extending the scope, reporting to government (Phase 4)
2012-13 – Carbon footprint of digital media (Phase 5)
2013 – Embedding carbon footprinting in the industry and reporting to government (Phase 6)
12

13
Potential sources of GHG from digital publishing
13
Content generation
Content conversion
Content storage
Content distribution
Use
Supp
ly c
hain
sta
geAc
tiviti
es g
ivin
g ris
e to
GH
G e
mis
sion
s
This is the activity necessary to generate the intellectual content to be included in the publication. Some of this will have parallels with traditional magazine publishing content generation (journalist travel, photo-shoots, article writing, editing, etc). However, publishing to new channels may require additional content generation activities, such as video production, blogging, tweeting, etc.
This is the process of converting the content into the appropriate electronic formats, such as an App. This will be desk-based activity. The main sources of GHG emissions from this stage of the supply chain are likely to be:• Emissions arising
from the electricity consumed to power computers, etc
• Emissions arising from the production and subsequent waste management of computing hardware
Data storage may be in-house or outsourced. The main sources of GHG emissions from this stage of the supply chain are likely to be:• Emissions arising
from the electricity consumed to power servers, etc
• Emissions arising from the power used in air conditioning/cooling server rooms
• Emissions arising from the production and subsequent waste management of data centre hardware
Depending on the format and end-user, content may be distributed by the Internet or by a wireless network. The main sources of GHG emissions from this stage of the supply chain are likely to be:• Emissions arising
from the electricity consumed to power the networks, etc
• Emissions arising from the production and subsequent waste management of network infrastructure and hardware
This is the process of accessing and reading the content. The main sources of GHG emissions from this stage of the supply chain are likely to be:• Emissions arising
from the production and subsequent waste management of the reading device
• Emissions arising from the electricity consumed to power the reading device (and any peripheral devices)
• Emissions associated with any printing made by the reader
Source: Innventia Edge 2011

14
What did we learn from the existing research and our own case studies?
Some words of caution:
There are few studies and only one of these evaluates the carbon footprint of these technologies from the perspective of a magazine publisher
Data and assumptions in different studies are often contradictory or lack transparency
Boundaries and methodologies are highly influential
Some studies lack rigour but achieve influence
The displacement relationship between e-publishing and traditional publishing is unclear
There is only limited data on the carbon impact of reading devices
14
15
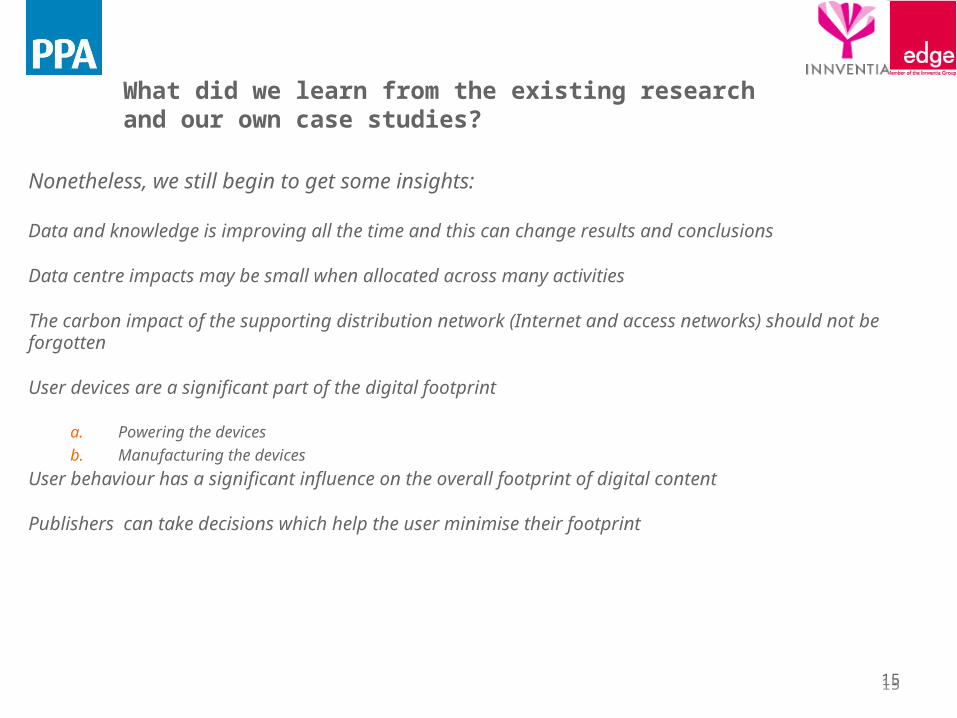
What did we learn from the existing research and our own case studies?
Nonetheless, we still begin to get some insights:
Data and knowledge is improving all the time and this can change results and conclusions
Data centre impacts may be small when allocated across many activities
The carbon impact of the supporting distribution network (Internet and access networks) should not be forgotten
User devices are a significant part of the digital footprint
a. Powering the devicesb. Manufacturing the devices
User behaviour has a significant influence on the overall footprint of digital content
Publishers can take decisions which help the user minimise their footprint
15

16
Crude estimate of the footprint for alternative channels for delivering content
16Source: Innventia Edge 2011

Paper and DigitalWhat do we know?Meredith WalshPenguin Group UKMay 2013

18
Why did Penguin want to calculate their CO2 footprint?
• Penguin publish trade mono and colour books• We manage the impact on biodiversity and landrights
via certification and other tools • We want to manage carbon impacts• We need knowledge to do this• Goal is to know paper and digital product footprints• We will make both products and want to manage the
impacts of both• There is also the increasing possibility of legislation
that will require us to know the carbon footprint of our supply chain

19
Bookcarbon.com
• Through the UK Publishers Association a group of UK publishers created Bookcarbon.com
• Invenntia built this tool• It calculates
– Monoprint carbon footprints– Titles printed in the UK– Cradle to Grave

20
Paper and Digital Comparison
• Manufacturing and creation footprint
• Manufacturing and creation PLUS Apples estimate of the CO2 produced over the life of an iPad
• http://images.apple.com/euro/environment/reports/docs/iPad_Retina_PER_oct2012.pdf
• http://www.ethicalconsumer.org/ethicalreports/buyingbookswithoutamazon/environment.aspx
21
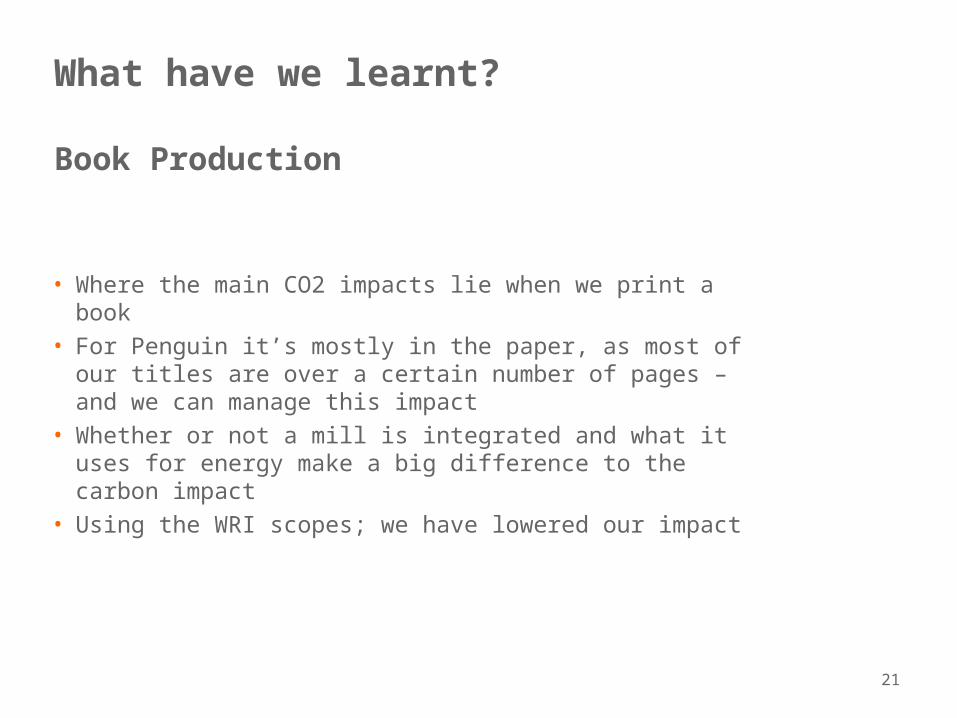
What have we learnt?
Book Production
• Where the main CO2 impacts lie when we print a book
• For Penguin it’s mostly in the paper, as most of our titles are over a certain number of pages – and we can manage this impact
• Whether or not a mill is integrated and what it uses for energy make a big difference to the carbon impact
• Using the WRI scopes; we have lowered our impact

22
What would we like to know more about?
Digital supply chain and product use• More knowledge would provide more insights with
which to manage our impacts• Questions we’d like to answer
– How do customers use devices? How long do they read for, do they read to finish an article or do they have a screen tolerance time?
– What kind of product is used on what devices?– Can products be designed to be low storage and low use?– What methodology should be used for comparing single
function devices or products to multifunction devices?– What are the other environmental impacts of the digital
supply chain, particularly for the extraction of minerals? Mineral extraction as a driver of deforestation?
– As products change how should our communication with customers change?

23

24
What have we learnt?
Digital production
• We can measure the CO2 generation of content creation for a digital product
• There is limited publicly available data on the CO2 footprint of reading devices, but what there is we can use to begin the paper and digital comparison
• Using the WRI scopes; moving to digital products lowers our carbon and forest impacts
• We see that there are additional impacts across the full length of the digital supply chain
• We can engage our customers and offer advice on end of life for both paper and digital– Opportunities to recycle books and devices– Repairing devices– Reusing books

Thank you

26
Thanks for listening and for caring about your impact on the environment!
More information on paper versus digital here:http://shrinkpaper.org/toolkit/paper-versus-digital/
The environmental paper calculator is here: http://c.environmentalpaper.org/home
We’re happy to answer any questions you may have.