Embed Size (px)
Citation preview

Stress-strain curve of paper revisited Svetlana Borodulina, Artem Kulachenko, Sylvain Galland, and Mikael Nygårds
KEYWORDS: Network simulation, Mechanical properties,
Fibers, Bonds, Paper properties, Damage
SUMMARY: We have investigated a relation between
micromechanical processes and the stress-strain curve of a
dry fiber network during tensile loading. By using a detailed
particle-level simulation tool we investigate, among other
things, the impact of “non-traditional” bonding parameters,
such as compliance of bonding regions, work of separation
and the actual number of effective bonds. This is probably
the first three-dimensional model which is capable of
simulating the fracture process of paper accounting for
nonlinearities at the fiber level and bond failures.
The failure behavior of the network considered in the study
could be changed significantly by relatively small changes in
bond strength, as compared to the scatter in bonding data
found in the literature. We have identified that compliance of
the bonding regions has a significant impact on network
strength. By comparing networks with weak and strong
bonds, we concluded that large local strains are the
precursors of bond failures and not the other way around.
ADDRESS OF THE AUTHORS: Svetlana Borodulina ([email protected]), Artem Kulachenko ([email protected]),
Mikael Nygårds ([email protected]): KTH, BiMaC
Innovation, Department of Solid Mechanics, SE-100 44,
Stockholm, Sweden. Sylvain Galland ([email protected]):
KTH, Wallenberg Wood Science Center, SE-100 44
Stockholm, Sweden.
Corresponding author: Svetlana Borodulina
The mechanism behind the hardening behavior in the
in-plane stress-strain curve of paper has been a matter of
discussion during the 60s and 70
s last century. The theme for
discussion was “fibers versus bonds”. As never-dried fibers
with a low micro-fibril angle show very little or no
hardening behavior until failure during tensile testing, it was
speculated that debonding and consequent fiber-fiber
friction is controlling the behavior of paper in the plastic
regime.
Seth and Page 1983 presented the experimental study
showing that bonding parameters such as measured relative
bonded area and bonding strength affect the paper strength
but do not influence the appearance of the stress-strain curve
at a given density. At the same time, the non-linearity of the
curves was tracked to the non-linear response of the fibers,
which is amplified during papermaking by drying and
mechanical treatments. This means that the measured
response of the fibers to tensile loading prior to papermaking
differs from that exhibited once the fibers are in the paper.
Other experimental results support the argument of
insignificant influence of bond failures on the shape of the
stress-strain curve. For example, using acoustic emission,
Gradin et al. 2008 recorded rather limited number of
acoustic events during the hardening path of the stress-strain
curve, which suggests that only few bonds fail completely
before rupture.
Although the presented evidence clearly establishes that
the shape of the stress-strain curve and bond failure are
unrelated, the limited impact of bonds is counterintuitive.
Reducing the number of bonds obviously increases stress
variation inside the network. This means that fibers reach
yield stress at lower network stress level. At the same time,
the non-linear behavior of the fiber is explained by the
deformation of its non-crystalline parts. Yet, the paper made
of nanofibrilated cellulose with crystallinity up to 70-80%
show similar hardening behavior, which in that case was
attributed to frictional sliding of fibers (Henriksson et al.
2008). Since the effect of the bonds is invisible in the
stress-strain curve, it is still unknown what the processes are,
which precede the final rupture and control the strength. As
so much effort is being invested in improving the bond
strength to increase the strength of paper, it is vital to
understand how the bonds contribute to it.
Several attempts have been made to reproduce paper
fracture numerically. Heyden (2000) modeled the tensile
behavior of paper with elastic fibers. The fracture was
captured by a series of linear computations in which the
force was incrementally increased and the failed bonds were
eliminated at each subsequent step. This modeling technique
could not account for inelastic deformation of fibers since
the deformation history was not accounted for.
Räisänen et al. 1996 showed with two-dimensional fiber
network simulations without bond failures that the
non-linear features of the stress-strain curve of individual
fibers were reflected in the response of the network.
Niskanen 1999 modeled two-dimensional sparse networks
with elastic fibers introducing fiber and bond failures.
Through comparison between energies released through
fiber and bond breakage, they showed a specific relation
between the number of failed bonds and failed fibers.
Moreover, Hägglund and Isaksson 2008 used a
two-dimensional isotropic fiber network to model the
fracture process in paper by accounting solely for
fiber-to-fiber bond failure. They observed that the network
stiffness reduction was proportional to the number of
collapsed bonds prior to peak load. They were able to
capture the softening behavior through the bond failure
mechanism.
The objective of this study was to describe a stress-strain
curve of the network of fibers and parameters that dominate
its shape as well as development of failure. By using detailed
particle level simulation tools we investigated, among other
things, the impact of “non-traditional” bonding parameters,
such as compliance of bonding regions, work of separation
and the actual number of effective bonds.
PAPER PHYSICS
318 Nordic Pulp and Paper Research Journal Vol 27 no.2/2012

Material and Methods Network modeling
In our model, we considered a three-dimensional network of
fibers. The network was created with the help of a deposition
technique described elsewhere (Kulachenko and Uesaka
2010). Each fiber is represented as a series of Timoshenko
quadratic beam elements with a tubular cross-section. The
beam element has three translational and three rotational
degrees of freedom at each node.
The following parameters can be varied during
construction of the network: fiber length, width, wall
thickness, curl, basic weight and other material properties of
fibers. All the listed parameters can vary according to a
specified distribution law.
We accounted for large deflections, rotations and strains.
A 4 x 4 mm2 snippet of a typical fiber network is shown in
Fig 1.
Fiber-to-fiber bonds were modeled by a point-wise contact
with friction (Zavarise and Wriggers 2000).
Fiber bonds can break and separate during loading. This
requires a specific description. A relation between force and
displacement of an individual bond is schematically
demonstrated in Fig 2.
There are three principal characteristics of the curve above:
stiffness, strength and work of separation (dark area below
the descending part of the curve). We captured this behavior
with a bilinear cohesive zone model, Fig 3, where Fbs is the
bond strength expressed through force, Kc is the contact
stiffness which describes the compliance of the bonding
regions, df is the fracture distance, and ds is the separation
distance.
A mixed I + II debonding mode was assumed, in which the
bond separation depends on both normal and tangential
contact forces. A power law energy criterion was used to
define the completion of debonding,
n t
cn ct
1E E
E E+ =
(1)
where En and Et are the computed normal and tangent
fracture energies respectively. The inputs for the model are
the maximum traction in both directions, and the critical
energy release rates Ecn and Ect. When a bond fails, the
contact between corresponding fibers is described with a
frictional contact. This is probably the first three-
dimensional model which is capable of simulating the
fracture process of paper accounting for nonlinearities at the
fiber level and bond failures.
Material characterization
Nonlinear stress-strain behavior of a single fiber was
described by bilinear isotropic hardening plasticity, Fig 4.
Selecting reasonable values for the fiber material properties
was a difficult task. Most of the experiments reported in the
literature were performed on the untreated fibers with
relatively low micro-fibril angles. These fibers behave
almost elastically before failure. It was shown that fibers
dried under compressive strains or having a high fibril
Fig 1. A typical simulated fiber network, 4 mm x 4 mm with 27 g/m2, where MD is machine direction, CD – cross-machine and ZD – thickness directions (ZD coming out of the network plane).
Fig 2. Schematic diagram of a force-displacement curve measured during fiber joint testing in either normal or tangent direction. Joint strength is the maximum point of the curve, joint stiffness is the tangent of the linear region of the curve and work of separation is the area below the curve from the point of maximum load to the separation distance.
Fig 3. Bilinear cohesive zone model used for modeling of contact debonding.
PAPER PHYSICS
Nordic Pulp and Paper Research Journal Vol 27 no.2/2012 319

Fig 4. Bilinear isotropic hardening plasticity fiber material model, where σy is yield stress, E is Young’s modulus and Etan is tangent modulus. For numerical values see Table 1.
angles exhibit stronger nonlinear behavior with a distinct
hardening region (Page and El-Hosseiny 1983; Groom et al.
2002). In this respect, drying inside the sheet affects the
fibril angles, reduces the elastic modulus of the fiber and
promotes distinct non-linear hardening response through
introducing compressive strains. Fig 5 shows the material
data found in the literature on a fiber dried under
compressive restraint (Seth and Page 1983) and an untreated
fiber (Groom et al. 2002).
These two measurements exemplify probably the upper
and lower bounds for the fiber behavior inside the network.
For our numerical experiments, we assigned the following
average fiber properties, Table 1, which were measured for
the pulp used in the experimental sheets preparation;
described in the next section. The fiber width and length
were varied according to a Gaussian distribution with cut-off
values of 6 μm in fiber width and 100 μm in fiber length.
Fiber bonding properties are widely available in the
literature (Lindström 2005). However, it is often left
unspecified whether normal or shear strength is measured
since a clear distinction is difficult to make in the
experimental analysis. There are at least eight experimental
methods including in-plane, shear, peel or z-directional
loading modes for determination of fiber-fiber bond
strengths, which are often reported in stress units
(Retulainen 1993). There has been a debate about the
relative bonded area, as it is involved in calculations. Based
on the previously published results of measured bond
strengths, Joshi 2007 and Batchelor 2010 stated that most of
the reported shear bond strengths are far too low compared
to reality. However, since we specify the bonding strength in
force units, we stay unaffected by the uncertainty related to
the relative bonded area.
For the reference case, we selected the data for
summerwood fibers (Aulin et al. 2010; Niskanen 1998)
summarized in Table 2.
The friction coefficient which acted between the fibers
after debonding was assumed to be 0.5.
Fig 5. Stress-strain curve for a latewood fiber, adopted from Groom et al. 2002 and for holocellulose summerwood fiber, adopted from Seth and Page 1983.
Table 1: Fibers properties used during network construction.
Fiber length mean±std [mm]
Fiber width mean±std [μm]
Young’s modulus [GPa]
Tangent modulus [GPa]
Yield stress [MPa]
3.20±1.38 32.45±2.45 20 10 100
Table 2 Parameters used for the control case in simulation: separation distance (SD), bond strength (BS), contact stiffness (CS).
Norm BS [mN]
Tang BS [mN]
Norm SD [μm]
Tang SD [μm]
Norm CS [GPa]
Tang CS [GPa]
25.5 4.2 0.73 0.60 40 8
Experimental setup
The purpose of the experimental setup was to get a
qualitative comparison between the numerical network
model and the physical fiber network. With the help of a
sharp die, we extracted and tested small rectangular pieces
from isotropic handsheets made of unbleached softwood
sulfate pulp with removed fines. Fines were removed by a
screening technique. Fiber length analysis was performed
prior to fractionation. The measured fiber length distribution
followed a bimodal Gaussian mixture distribution.
Analyzing the mode which corresponds to longer fiber
fraction retained after screening gave the mean fiber length
of 3.2 mm with standard deviation of 1.38 mm. This fiber
length data was used during numerical network generation.
Laboratory handsheets of the specified pulp were prepared
according to ISO 5269/2 using Rapid Köthen sheet former
equipment in a climate-controlled room. Sheets were dried
under restraints at 93°C in the dryer for 15 minutes. After
preparation, the handsheets were conditioned at 50% RH
and 23 °C until testing.
Tensile tests were performed on a INSTRON® 5944 system
PAPER PHYSICS
320 Nordic Pulp and Paper Research Journal Vol 27 no.2/2012

equipped with a 50 N load cell at 1 mm/min loading rate and
at a standard climate 50% RH and 23 °C. We checked for the
presence of jaw slip by looking for the traces of zigzagging
behavior in the force measurements and concluded that the
jaw slip did not take place during testing. Digital speckle photography was performed with the
deformation measurement system Vic 2D (LIMESS®).
Results and Discussion Size effects in the physical fiber networks
The size and the basis weight of the simulated specimen are
critical for collecting meaningful results and being able to
compute the network on the available computing resources.
With the fiber properties described earlier, we are currently
able to compute the strength of dry three-dimensional
networks with a number of fibers equivalent to 10x4 mm2
samples with a basis weight up to 30 g/m2. The main
limitation arises from the necessity to have a fine mesh along
the fibers to achieve convergence with respect to mesh
density.
In order to assess the implication of computational
limitations on the planned analyses, we investigated how the
size of the specimen influences the average values of
network stiffness and strength on a limited set of networks.
We do not draw any conclusions from the experimental data
alone.
Fig 6-Fig 8 show the stress-strain curves recorded in
tensile tests experimentally. Tensile force was applied in the
length (longest) direction of paper sample in Fig 9. Fig 6
shows that 4x4 mm2 networks have somewhat lower elastic
modulus than 10x4 mm2 networks, presumably because the
sample cutting procedure reducing the average length of the
fibers and the effect of boundary conditions. Shorter network
had a long softening region which can be explained by the
fact that few long fibers can extend from one constrained end
of the network to another and being stretched even after
losing all the contacts.
At the same time, increasing the width from the chosen
reference level of 10x4 mm2 to 10x10 mm
2 did not affect the
stiffness but increased the strength and strain to failure, Fig
7.
Finally, increasing the basis weight did not change the
tensile stiffness index and tensile index significantly, but
increased the strain to failure, Fig 8.
From these experiments, we can that the size of 10x4 mm2,
27 g/m2 is sufficiently large and thick in the view of
representing elastic properties and the overall shape of the
stress-strain curve.
Evolution of damage. Experiments.
A stress-strain curve provide limited information even for
alitative comparison with simulation. In order to extract
more data, we observed the evolution of the strain field in the
physical specimen with the help of the digital speckle
photography. There was no need to apply a speckle pattern
onto the network as the fibers themselves created a sufficient
Fig 6. Experimental results from the tensile test. Effect of increased sample length for laboratory handsheets (27 g/m2).
Fig 7. Experimental results from the tensile test. Effect of increase in sample width for laboratory handsheets (27 g/m2).
Fig 8. Experimental results from the tensile test. Effect of increased grammage for 10x4 mm2 laboratory handsheets (27 g/m2).
PAPER PHYSICS
Nordic Pulp and Paper Research Journal Vol 27 no.2/2012 321

a)
b) Fig 9. Tensile test on 10 x 4 mm2 samples, cut from laboratory handsheets (27 g/m2). (a) Initial state prior to loading and loading direction. (b) Post-failure localization.
Fig 10. Stress-strain curve from the tensile test on 10 x 4 mm2, 27 g/m2 sample. The points a to e correspond to instances of strain field measurement (Fig 11a to Fig 11e).
contrast pattern for analyses. Fig 9 shows the initial state of
the physical network and the post-failure damage
localization, which was on a millimeter length-scale. In all
the observed samples, damage localization occurred at an
angle to the direction of loading typical for semi-ductile
behavior with shear-band formation. Since dry paper usually
fails more abruptly, it also suggests that the handsheets did
not have a sufficient level of interfiber bonding due to
relatively low pressure applied during sheet making.
Fig 9b shows the localization path at the network
separation point. The localization path is not clearly visible
before that moment. At the separation point, the measured
force is already zero and there are some considerable
out-of-plane deformations.
By analyzing Fig 10 and Fig 11, we can conclude that
nucleation of damages, manifested through increased local
strain on the millimeter scale, which develops already during
the hardening region. In this particular sample, there are two
“competing” localization regions of which only one will be
preferred for the final rupture already along the softening
part of the curve.
a)
b)
c)
d)
e) Fig 11. Digital speckle photography results. Development of fracture during tensile test on 10 x 4 mm2, 27 g/m2 sample. The color bar indicates local in-plane strains in tension direction with range from 0 to 2%.
Evolution of damage. Simulations.
We used the acquired fiber length distribution data to create
an isotropic fiber network numerically. Table 1 and Table 2
summarize the fiber and bonding data used in the reference
(control) numerical experiment. During fiber deposition, we
assumed the maximum level of conformability, which gave
us an average number of contacts per fiber of 156. This
number corresponds to a distance between the bonds of
21 µm, which is comparable to the average diameter of
PAPER PHYSICS
322 Nordic Pulp and Paper Research Journal Vol 27 no.2/2012

Fig 12. Comparison of the experimental and simulated results from the tensile test on 10 x 4 mm2, 27 g/m2 sample.
fibers and agrees with the prediction by Alava and Niskanen
2006. Fibers not connected to the network were removed
during computations.
We performed numerical simulations until the stress-strain
curves showed the persistent signs of softening. Capturing
the entire softening part of the curve would require a fine
time-step and consume a significant amount of computation
time without providing much additional information.
Fig 12 shows the comparison of the computed stress-strain
curve with the experimental ones. Although the initial part of
the curve was captured, the strength and the hardening
regions were not. The fact that the strength was considerably
overestimated can be attributed to an overestimated number
of contacts or other contact parameters. We have
investigated these factors on the very same network and
mesh in order to exclude the influence of the variations due
to disordered network structure.
Effect of the bond strength
We considered four cases: (a) bond failure with the reference
bond strength “Control”; (b) with the reference bond
strength divided by 3 “Weak”; (c) with the reference bond
strength multiplied by a factor of 5/3 “Strong”, as defined in
Table 3; (d) no bond failure “No debonding”. The
separations distance was 15% longer than the fracture
distance in all the cases.
Fig 13 shows the stress-strain curves for different bond
strengths. The appearance of the curves is similar to the
results of Seth and Page 1983, who varied the bonding
strength by addition of bonding agents – the networks show
identical response until the point close to failure. The higher
the bond strength is, the longer the curve follows the case
Table 3 Different bond strengths used in parametric study.
Bond strength (BS) Normal BS [mN]
Tangent BS [mN]
Strong 42.5 7 Control 25.5 4.2
Weak 8.5 1.4
Fig 13. Stress-strain curves for different bond strengths from the simulated tensile test on 10 x 4 mm2, 27 g/m2 network.
with no bond failure. Remarkably, a factor of 3 in bond
strength, which is lower than the variation found in the
literature (partially with data reported in stress units),
changed the strength of the network dramatically with a
given bond compliance and relation between fracture and
separation distances.
The intensity of damage can be related to the number of
broken bonds. Using acoustic emission, Gradin et al. 2008
showed that during the elastic deformation of paper only a
very limited number of acoustic events was registered. It
remained unclear, however, whether all the fiber bond
breakage could be detected with the utilized equipment,
since some of the broken bonds could not emit sufficient
amount of energy at failure to be registered. For example,
similar acoustic emission testing applied to cellulose
nanopaper by Henriksson et al. 2008 showed only very few
events registered until the rupture.
By observing the number of bonds failed in the network,
Fig 14, we can conclude that the growth rate in the number
of contacts follows an exponential law. At the same time,
relatively few bonds, namely, 3% of the total number, failed
completely in the network with strong bonds before the
catastrophic failure. Although more contacts failed in the
network with weaker bonds, the total number of them stayed
below 5%. By observing the difference between the number
of fractured and fully separated bonds at a given substep, Fig
14, we can conclude that there is no observable delay
between the damage and complete separation of the bonds
(dashed and solid lines almost coincide).
Let us now examine the processes on the network level
which preceded the failure and compare to what was
measured in the experiments. We looked first how the failed
bonds were distributed in the network. Fig 15a shows initial
contact positions in the network while Fig 15b and Fig 15c
show the fractured bonds at the time of onset of softening.
The color scale indicates the state of damage where 0
corresponds to undamaged state and 1 to separated state
according to Fig 3. Only the bonds having some degree of
PAPER PHYSICS
Nordic Pulp and Paper Research Journal Vol 27 no.2/2012 323
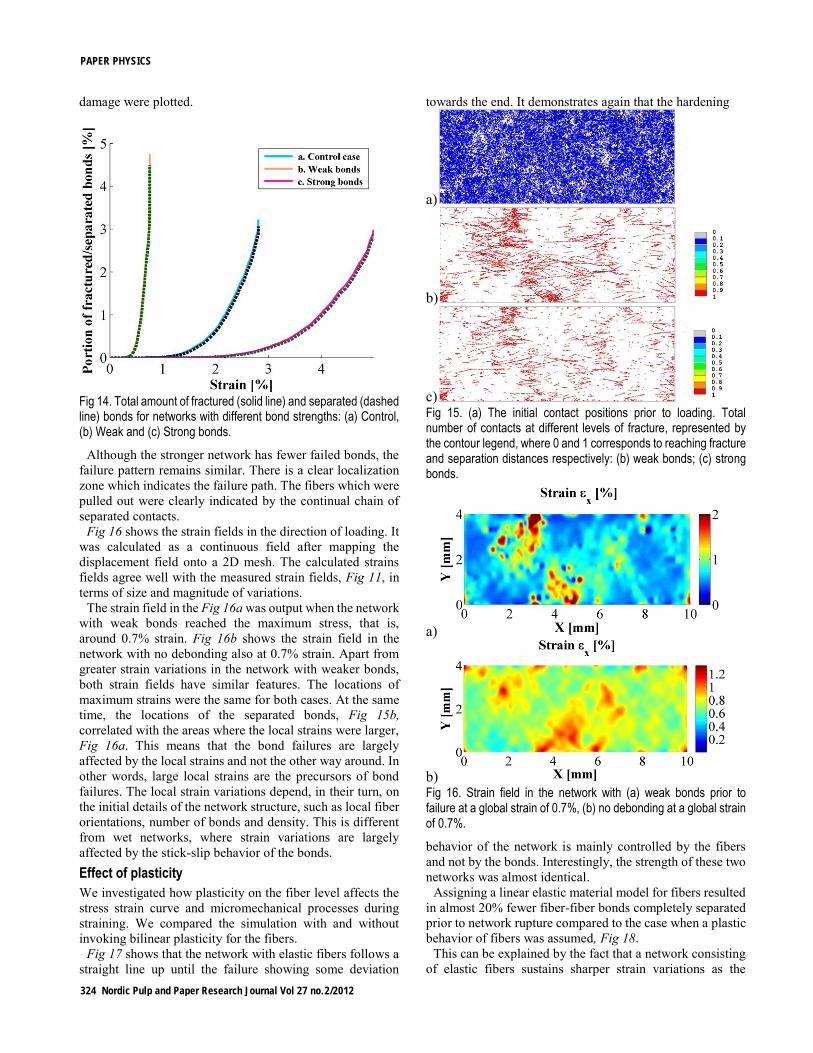
damage were plotted.
Fig 14. Total amount of fractured (solid line) and separated (dashed line) bonds for networks with different bond strengths: (a) Control, (b) Weak and (c) Strong bonds.
Although the stronger network has fewer failed bonds, the
failure pattern remains similar. There is a clear localization
zone which indicates the failure path. The fibers which were
pulled out were clearly indicated by the continual chain of
separated contacts.
Fig 16 shows the strain fields in the direction of loading. It
was calculated as a continuous field after mapping the
displacement field onto a 2D mesh. The calculated strains
fields agree well with the measured strain fields, Fig 11, in
terms of size and magnitude of variations.
The strain field in the Fig 16a was output when the network
with weak bonds reached the maximum stress, that is,
around 0.7% strain. Fig 16b shows the strain field in the
network with no debonding also at 0.7% strain. Apart from
greater strain variations in the network with weaker bonds,
both strain fields have similar features. The locations of
maximum strains were the same for both cases. At the same
time, the locations of the separated bonds, Fig 15b,
correlated with the areas where the local strains were larger,
Fig 16a. This means that the bond failures are largely
affected by the local strains and not the other way around. In
other words, large local strains are the precursors of bond
failures. The local strain variations depend, in their turn, on
the initial details of the network structure, such as local fiber
orientations, number of bonds and density. This is different
from wet networks, where strain variations are largely
affected by the stick-slip behavior of the bonds.
Effect of plasticity
We investigated how plasticity on the fiber level affects the
stress strain curve and micromechanical processes during
straining. We compared the simulation with and without
invoking bilinear plasticity for the fibers.
Fig 17 shows that the network with elastic fibers follows a
straight line up until the failure showing some deviation
towards the end. It demonstrates again that the hardening
a)
b)
c) Fig 15. (a) The initial contact positions prior to loading. Total number of contacts at different levels of fracture, represented by the contour legend, where 0 and 1 corresponds to reaching fracture and separation distances respectively: (b) weak bonds; (c) strong bonds.
a)
b) Fig 16. Strain field in the network with (a) weak bonds prior to failure at a global strain of 0.7%, (b) no debonding at a global strain of 0.7%.
behavior of the network is mainly controlled by the fibers
and not by the bonds. Interestingly, the strength of these two
networks was almost identical. Assigning a linear elastic material model for fibers resulted
in almost 20% fewer fiber-fiber bonds completely separated
prior to network rupture compared to the case when a plastic
behavior of fibers was assumed, Fig 18.
This can be explained by the fact that a network consisting
of elastic fibers sustains sharper strain variations as the
PAPER PHYSICS
324 Nordic Pulp and Paper Research Journal Vol 27 no.2/2012

energy cannot dissipate in highly strained areas by other
Fig 17. Stress-strain curves for different fiber material models utilized on fiber level in 10 x 4 mm2, 27 g/m2 network: (a) bilinear isotropic hardening plasticity; (b) linear elastic fiber material model.
Fig 18. Total amount of fractured (solid line) and separated (dashed line) bonds for networks with different fiber material models: (a) bilinear isotropic hardening plasticity; (b) linear elastic fiber material model.
means than bond failure. The strain variations can be
observed in Fig 19a, in which we plot the strain fields at the
moment of failure normalized with the global strain to
failure recorded at this point.
It is also reflected in the map of the failed bonds, Fig 20,
which shows more clustered concentrations of bond failures
in the elastic fiber networks.
Note on the effect of friction
Numerical experiments showed that friction coefficient
varied in a reasonable range had virtually no effect on either
stress-strain curve or strength. The observed frictional forces
were two orders of magnitude lower than the forces
developed in the bonds and thus could not significantly
contribute to the response of a dry network.
a)
b) Fig 19.Normalized strain in the network with: (a) linear elastic; (b) bilinear isotropic hardening plasticity fiber material model at network fracture.
a)
b) Fig 20. Total number of contacts at different levels of fracture, represented by the contour legend, where 0 and 1 corresponds to reaching fracture and separation distances respectively: (a) linear elastic; (b) bilinear isotropic hardening plasticity fiber material model.
The role of unconventional contact parameters
As mentioned earlier, the bond strength is one of three
parameters characterizing a bond failure under the adopted
bilinear cohesive zone model. Measuring the two remaining
properties, namely, the compliance of bond regions and the
work of separation have not been possible with reported
techniques. During experiments, the fiber-fiber bonds were
not isolated, and the measured force encompassed the
response from both the bonds and from global deformation
of the fibers.
We look at the effect of the bond compliance and the work
of separation on the stress-strain curve with the help of
modeling on a single realization of the network.
PAPER PHYSICS
Nordic Pulp and Paper Research Journal Vol 27 no.2/2012 325

Effect of compliance of contact regions
Beam elements that we use to represent the fibers have no
through-thickness normal strains, which makes their
cross-section rigid against the load in the normal direction.
In reality, the fibers deform locally due to reciprocal forces
in the bond regions. We express the compliance of the bond
regions through the contact stiffness, which is usually a
numerical parameter in a penalty-based contact algorithm. In
our case, when the cross-sections of the fibers are rigid
against point-wise loads, the contact stiffness alone is
appropriate enough to represent the compliance of the
bonding regions. Considering its influence in the frames of
the cohesive zone model, it is nothing but the slope of the
elastic region in Fig 3. Consequently, with a given bond
strength, the bond with a lower stiffness can accumulate
greater critical fracture energy (the area under the curve up
to the fracture distance).
We varied the contact stiffness in the normal and tangent
directions according to Table 4.
Stress-strain curves plotted for these cases (Fig 21) show
that the bond compliance has a very limited effect on the
elastic part of the curve. Decreasing the bond stiffness in
both directions by a factor of two did not change the initial
slope of the curve simply because the amount of elastic
energy stored in the bonds is relatively small. Having softer
bond regions delays, however, the point of failure. On the
contrary, the stiffer the bond regions the lower the strength,
which together with the results on the impact of bond
strength means that the critical fraction energy accounting
for both the strength and compliance is a better measure for
relating the bonds and network strength properties.
Effect of work of separation
The work of separation is the amount of energy needed to
separate completely the bond from the point of fracture. In
practice this means creating a delay between failure and full
separation in a displacement-controlled test of individual
bonds. We varied the separation distance, Fig 22, according
to Table 5 leaving bond strength and contact stiffness intact.
The work of separation was set to be 15 percent of the
fracture energy in the reference and was changed to 5 and 25
percents in two selected cases.
Fig 22 shows that the work of separation varied in a
reasonable range has an expected but rather limited effect on
the strength of the fiber network. Increasing the work of
separation from 5 to 25 percents of the critical fracture
energy increased the strength by about 12 percent.
Effect of the number of bonds
The number of bonds in the network can be related to a
commonly used term “the level of interfiber bonding”. The
latter is usually changed by wet pressing or beating. In
numerical simulations, we reduced the number of bonds by
randomly removing contacts all over the network.
Along with the stress-strain curves, we computed the
efficiency factors introduced by Seth and Page 1983. The
efficiency factor Ф is the ratio of the initial Young’s
modulus (for all bonds) to the current Young’s modulus for
Fig 21. Stress-strain curves for different bonding compliance in 10 x 4 mm2, 27 g/m2 network: (a) control compliance; (b) softer bond regions; (c) stiffer bond regions.
Fig 22. Stress-strain curves for different separation distance the simulated tensile test on 10 x 4 mm2, 27 g/m2 network at normal 25.5 mN and tangent 4.2 mN bond strength kept constant: (a) reference case; (b) minimized; (c) maximized separation distance (see Table 5).
Table 4. Varying contact stiffness (CS) in the numerical tests.
Contact stiffness (CS)
Normal CS [GPa]
Tangent CS [GPa]
Soft bonds 20 4
Control 40 8
Stiff bonds 80 16
Table 5 Effect of varying separation distances (SD) keeping bond strength constant (25.5 mN in the normal and 4.2 mN in the tangent directions).
Separation distance (SD) Normal SD
[μm] Tangent SD
[μm]
a (reference) 0.73 0.60
b 0.67 0.55
c 0.80 0.66
PAPER PHYSICS
326 Nordic Pulp and Paper Research Journal Vol 27 no.2/2012

a)
b) Fig 23. (a) Stress-strain curves for different number of fiber-fiber bonds in the simulated tensile test on 10 x 4 mm2, 27 g/m2 network: (A) control network, 100% bonds; (B) 25% of removed bonds; (C) 50% of removed bonds. (b) Transposed curves.
a respective curve. Stress-strain curves are transposed by
diving them by the efficiency factor Ф, which has a
maximum value of 1.0 for a network with all bonds. The
results of reducing the number of bonds by 25 and 50 percent
are presented in Fig 23a and the transposed curves in Fig
23b.
The curves coincide in the linear region and up to 1.4%
strain. Seth and Page 1983 reported corresponding
experimental findings by modifying the number of bonds by
wet-pressing and beating. Since the wet-pressing affects the
thickness and we removed the bonds at given thickness, we
referred to the experiment with beating for comparison. The
results agree rather well for the range of efficiency factors
considered in the study. It should be noted, however, that
even with 50% removed bonds we could not reach as low
values of the efficiency factor as reported by Seth
(Ф=0.686). Even with 50% bonds removed, the efficiency
factor dropped to 0.9 only. This can indicate that fiber
properties were modified by beating in the physical
experiments but remained unchanged in our numerical
simulations.
Decreasing the number of bonds by 50% resulted in nearly
Fig 24. Fiber axial stress distribution for different number of contacts at specific stress level of 13 kN·m/kg: (a) control network, 100% bonds; (b) 75% of bonds; (c) 50% of bonds.
30% lower strength. The stiffness of the network was not
significantly affected.
The reduction in strength can be explained by a simple fact
that a lower number of contacts would have a higher average
stress at a given global strain level, since the elastic stiffness
of the network was not affected, and the global stress at a
given strain level is the same. Lower number of contacts also
imposes a greater stress variation as well as higher mean
stress along the fibers. Fig 24 shows that distribution of axial
stress in the beam element expressed through probability
density function. This data was collected along the linear
slope of the curve at a specific stress of 13 kN·m/kg. It
shows that the distribution is bimodal. The left mode
represents unstressed fiber segments and the right mode
corresponds to the fiber segments bearing the load. With
50% removed bonds, the average stress in the right-side
mode is greater. It explains the fact the network with fewer
bonds deviates from the straight line sooner.
Conclusions We used a three-dimensional fiber network model that
encompasses fiber nonlinearities and bond failures to
examine the phenomena, which take place in a network of
fibers along the stress-strain curve. The main outcome is that
the original strain inhomogeneities due to the structure are
transferred to the local bond failure dynamics.
The results show that failed bonds are located in the places
with high local strain. By comparing networks with weak
and unbreakable bonds, we concluded that strain
concentrations are the precursors of bond failures and not the
other way around. The width of strain concentrations regions
have a size on a millimeter scale and obviously depend on
the initial details of the network structure, such as local fiber
orientations and bond density.
The network with elastic fibers showed no sign of
softening up to the point close to failure. It confirmed again
that non-linear response of the network has its origin in the
PAPER PHYSICS
Nordic Pulp and Paper Research Journal Vol 27 no.2/2012 327

fibers. Plasticity on the fiber level reduced the strain
variations since the energy dissipated through plastic
deformations in the areas of high strain.
The influence of the bond strength was significant. A factor
of 2-3 in bond strength, which is relatively low in the view of
the scatter encountered throughout the literature, changed
the strength of the network dramatically. At the same time, a
"non-traditional" bonding parameter, namely, the
compliance of the bond regions showed a comparably strong
effect on the strength as the bond strength. More compliant
bond regions increase the strength by accumulating more
energy prior to failure. This suggests that the critical fracture
energy, which account for both the strength and compliance
of the bonds, is a better measure for relating bond and
network strength. The work of separation (another
unconventional bonding property) showed a relatively small
impact on the stress-strain curve and can be discarded in
practical applications.
Decreasing the number of bonds in the network by 50%,
did not change the elastic stiffness significantly but
decreased the strength. It also increased stress variation
inside the network as well as the mean axial stress in the
load-bearing fiber segments.
Acknowledgement
The authors appreciate WoodWisdom-NET and BiMaC Innovation together with their industrial partners for the financial support.
Literature
Alava, M. and Niskanen, K. (2006): The physics of paper, Reports on Progress in Physics 69(3), 669-723.
Aulin, C., Gällstedt, M. and Lindström, T. (2010): Oxygen and oil barrier properties of microfibrillated cellulose films and coatings, Cellulose 17(3), 559-574.
Batchelor, W. (2010): Application of an analitical method to calculate the load distribution along a fibre in a loaded fibre network, Appita Journal 63(4), 287-293.
Gradin, P., Graham, D., Nygård, P. and Vallen, H. (2008): The Use of Acoustic Emission Monitoring to Rank Paper Materials with Respect to Their Fracture Toughness, Experimental Mechanics 48(1), 133-137.
Groom, L., Mott, L. and Shaler, S. (2002): Mechanical properties of individual southern pine fibres. Part I. Determination and variability of stress-strain curves with respect to tree height and juvenility, Wood and Fibre Science 34(1), 14-27.
Henriksson, M., Berglund, L. A., Isaksson, P., Lindström, T. and Nishino, T. (2008): Cellulose Nanopaper Structures of High Toughness, Biomacromolecules 9(6), 1579-1585.
Heyden, S. (2000): Network Modelling for the Evaluation of Mechanical Properties of Cellulose Fluff, Lund University, Lund.
Hägglund, R. and Isaksson, P. (2008): On the coupling between macroscopic material degradation and interfiber bond fracture in an idealized fiber network, International journal of solids and structures 45, 868-878.
Joshi, K., Batchelor, W., Parker, I., Nguyen, L. (2007): A new method for shear bond strength measurement, International Paper Physics conference, Queensland, Australia, pp. 7-13.
Kulachenko, A. and Uesaka, T. (2010): Simulation of Wet Fiber Network Deformation, Progress in Paper Physics, Montreal, Canada.
Lindström, T., Wågberg, L., Larsson, T. (2005): On the nature Advances in Paper Science and Technology, Cambridge, The Pulp and Paper Fundamental Research Society, pp. 457-562.
Niskanen, K. (1998): Paper Physics, Fapet Oy.
Niskanen, K. J., Alava, M.J., Seppäla, E.T., Åström, J. (1999): Fracture Energy in Fibre and Bond Failure, Journal of Pulp and Paper Scince 25(5), 167-169.
Page, D. H. and El-Hosseiny, F. (1983): The mechanical properties of single wood pulp fibers. Part IV. Fibril angle and the shape of the stress-strain curve, Journal of Pulp and Paper 9(4), 99-100.
Retulainen, E., Ebeling, K. (1993): Fibre-fibre bonding and ways of characterizing bond strength, Appita Journal 46(4), 282-288.
Räisänen, V. I., Alava, M. J., Nieminen, R. M. and Niskanen, K. J. (1996): Elastic-plastic behaviour in fibre networks, Nordic Pulp and Paper Research Journal 11(4), 243-248.
Seth, R. S. and Page, D. H. (1983): The Stress Strain Curve of Paper, The Role of Fundamental Research in Paper Making, Mechanical Engineering Publication, London, pp. 421-452.
Zavarise, G. and Wriggers, P. (2000): Contact with friction between beams in 3-D space, International Journal for Numerical Methods in Engineering 49, 977-1006.
PAPER PHYSICS
328 Nordic Pulp and Paper Research Journal Vol 27 no.2/2012