Embed Size (px)
Citation preview

Effect of enhanced biochar on green house gas emission and paddy rice yield from loamy sand soil after first year trial in Thai Nguyen, Viet Nam
Lan Anh Mai Thi1, Stephen Joseph2,3; Lukas Van Zwieten2; Kien Hoang Trung1;
Genxing Pan3, L Li3; Trinh Mai Van4
(Corresponding authors: Lan Anh Mai Thi, [email protected])
Abstract: Rice fields are considered as important sources of CH4 and N2O emissions. Organic
matters and water regimes are the determining factors for CH4 and N2O emissions from rice fields. Rice on the upland areas of Vietnam is mostly planted on the soils which are acidic and have low organic matter. Biochar could increase the pH and the organic carbon content of the soil as well as increasing yields if combined either with compost or with chemical fertilizer. This study investigates the effect of biochar as well as biochar-composting on the green house gas emission and rice yield on paddy fields that have a sandy clay loam, in suburb of Thai Nguyen City, Vietnam (21o34’275’’ North, 105o46’ East). This paper reports on the results of the first year of a three year field trial. Experimental treatments include: T1: no amendment (control); T2: application of inorganic fertilizer (NPK); T3: NPK+ 1.5 tonnes biochar; T4: NPK+ 10 tonnes of composted buffalo manure without biochar; T5: NPK+ 10 tonnes of composted of buffalo manure/5% biochar mixture. A composite high nutrient biochar was produced by blending buffalo dung, Hybrid Acacia wood, bamboo, rice husk, rice straw. All feed stocks were coated with a mixture of 5% of buffalo dung, 2% of lime; 10% clay; 5% of rice straw ash to increase the mineral content on the biochar’s surface. The mixture of minerals and biomass (rice straw and timber wood) were dried and then pyrolysis in TLUD - drum oven at 400-500oC to produce the biochar. After year trial of experiment, the utilization of organic amendments increased the amount of SOC compared with the control soil. The highest soil carbon content and nitrogen content was observed in treatment of compost mixed with 5% biochar. The highest yield increase was from treatment NPK+ 1.5 tonnes biochar.
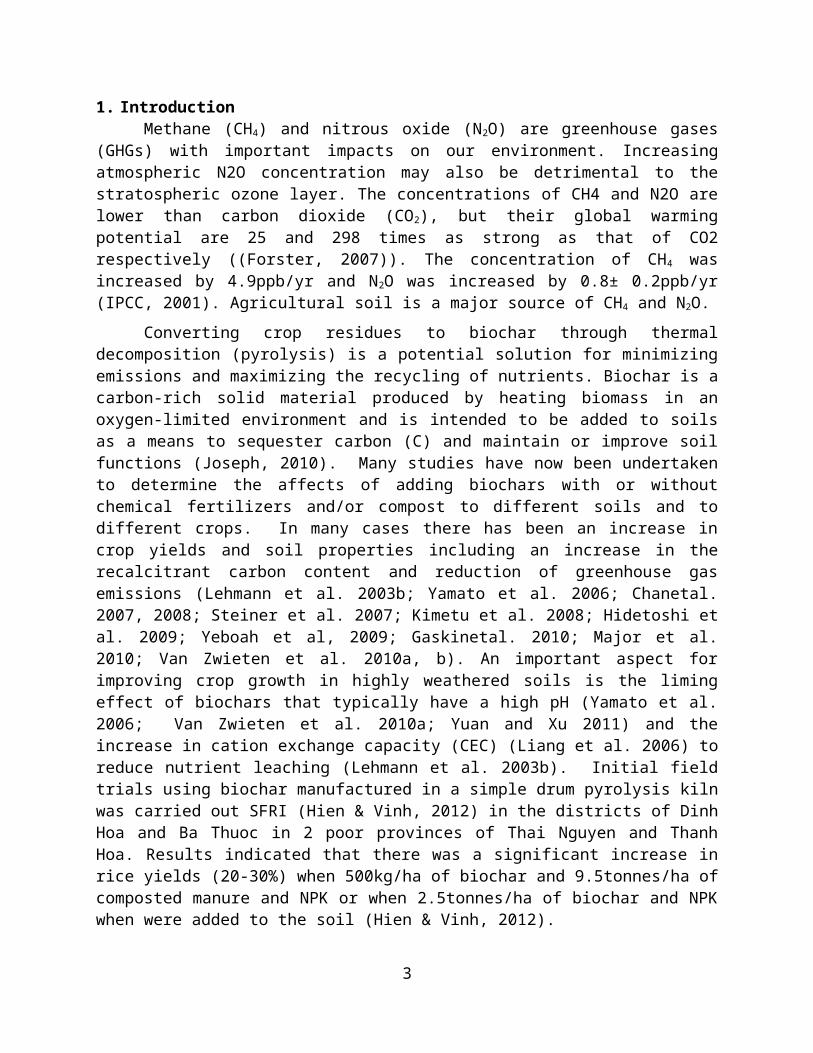
There was significant differences in methane emission flux (p<0.05) between plots which was added 10 tonnes of compost with 5% biochar plus NPK and 3 other treatments. There is no difference in CH4-C flux in treatment T2 (NPK) and T3 (NPK+1.5t/ha biochar) and T4 (10 tonne compost without biochar plus NPK). There was not significant difference (p> 0.05) between the CO2e GWP (changed from 134.4-175.6g/h/WRGS) and no significant difference in N2O -N (changed from 916.5 - 1115.4 µg/h/WRGS between 4 treatments.
Key words: Soil organic carbon, rice, biochar, compost,
1 Thai Nguyen College of Sciences, Thai Nguyen, Vietnam2 School of Materials Science and Engineering, University of New South Wales, SYDNEY, NSW2052 Australia3 Institute of Resources, Ecosystem and Environment of Agriculture, Nanjing Agricultural University, Nanjing, 210095, P.R.C.4 Institute for Agricultural Environment (IAE), Ha Noi, Viet Nam
1
1. IntroductionMethane (CH4) and nitrous oxide (N2O) are greenhouse gases (GHGs) with important
impacts on our environment. Increasing atmospheric N2O concentration may also be detrimental to the stratospheric ozone layer. The concentrations of CH4 and N2O are lower than carbon dioxide (CO2), but their global warming potential are 25 and 298 times as strong as that of CO2 respectively ((Forster, 2007)). The concentration of CH4 was increased by 4.9ppb/yr and N2O was increased by 0.8± 0.2ppb/yr (IPCC, 2001). Agricultural soil is a major source of CH4 and N2O.
Converting crop residues to biochar through thermal decomposition (pyrolysis) is a potential solution for minimizing emissions and maximizing the recycling of nutrients. Biochar is a carbon-rich solid material produced by heating biomass in an oxygen-limited environment and is intended to be added to soils as a means to sequester carbon (C) and maintain or improve soil functions (Joseph, 2010). Many studies have now been undertaken to determine the affects of adding biochars with or without chemical fertilizers and/or compost to different soils and to different crops. In many cases there has been an increase in crop yields and soil properties including an increase in the recalcitrant carbon content and reduction of greenhouse gas emissions (Lehmann et al. 2003b; Yamato et al. 2006; Chanetal. 2007, 2008; Steiner et al. 2007; Kimetu et al. 2008; Hidetoshi et al. 2009; Yeboah et al, 2009; Gaskinetal. 2010; Major et al. 2010; Van Zwieten et al. 2010a, b). An important aspect for improving crop growth in highly weathered soils is the liming effect of biochars that typically have a high pH (Yamato et al. 2006; Van Zwieten et al. 2010a; Yuan and Xu 2011) and the increase in cation exchange capacity (CEC) (Liang et al. 2006) to reduce nutrient leaching (Lehmann et al. 2003b). Initial field trials using biochar manufactured in a simple drum pyrolysis kiln was carried out SFRI (Hien & Vinh, 2012) in the districts of Dinh Hoa and Ba Thuoc in 2 poor provinces of Thai Nguyen and Thanh Hoa. Results indicated that there was a significant increase in rice yields (20-30%) when 500kg/ha of biochar and 9.5tonnes/ha of composted manure and NPK or when 2.5tonnes/ha of biochar and NPK when were added to the soil (Hien & Vinh, 2012).
The recent trials were undertaken to determine if similar yield increases could be achieved in a different pedogenic climate around the city of Thai Nguyen. The specific objectives of the trials were to
(1) Quantify the effects of charcoal, organic, and inorganic fertilization on soil fertility and crop production; and
(2) Evaluate the sustainability of charcoal additions in terms of maintaining high-SOM contents and nutrient availability in loamy sand.
(3) Methane and nitrogen oxide emission monitoring from the field under paddy rice soil condition.
The hypothesis that was to be tested is “charcoal additions improve nutrient availability and reduce GHG emission; that crop productivity is maintained on a higher level than without charcoal addition”.
2. Materials and methods2.1. Materials: Pretreated feedstock and production of biochar
Bamboo and wood (which was soaked in pond for a year) were dried and added in equal
2
proportions to dry rice husk and rice straw. To increase available nutrients and the CEC of the biochar a slurry consisting of 2% lime, 10% clay and 5% of buffalo manure and 5% rice straw ash was added to these feedstocks. The mineral coated biomass was dried and then pyrolysed in a drum oven (Care International in Viet Nam, 2012) at 450-600oC over a period of 1.5-2 hours.
2.2. Making compost with biochar and without biochar for experiments
The composting method used was developed by SFRI and consisted of adding by weight 5% biochar 1% compost enhancing plant (Eupatorium odoratum L.), 0.5kg of microorganism package per 1 tone of manure. The procedure was as follows:
1. A layer of 10-15 cm of buffalo was placed on the ground approximately 2m in diameter. 2. Approximately 100g of the micro-organisms was added to buffalo dung. 3. Approximately 25% of the biochar was sprinkled over the dung4. Green leaf was then added on top of the biochar in thin layer, to cover all manure.5. A further 3 Layers of dung/biochar and green leaves were added.6. Then cover compost pile with nylon that has approximately 30 small holes (10 mm in
diameter) for water vapor to escape.
Manure, green plant and microorganism are added for composting without biochar using the same procedure as above. Composting is complete after 45 days in spring season. 2.3. Method2.3.1. Soil and Field trials
Characterization of soil at study site
This study was implemented in Thai Nguyen city, Thai Nguyen province, Viet Nam. Longitude is 21o34 275’ North; 105o46 796’ East. Rice has been cultivated in this field for at least 20 years. Soil samples were taken at the depth of 0-20cm. The soil was loamy sand with a particle size distribution of 79.8%, 11.3%, and 8.9% respectively of sand, silt, and clay. Bulk density is 1.34g/cm3. The properties of the soil are given in table 1. The pHKCl (1:5) is acidic at 4.43. Cation Exchange Capacity (CEC) in research areas is 12.3cmol/kg, soil organic carbon (SOC) 0.96%, total nitrogen (0.11%), total phosphate (P) is 0.017% and total potassium (K) is 0.03%. CEC, P and N are typical of soils in this area but OC and K are low. Burning of the rice straw causes volatilization of its K content and this in part could result in a low K in the soil after experiment.
Table 1. Soil properties in experiment
pH (1:5) CEC(cmol/kg)
OC N P K Fe Available P
Exchange K
H2O KCl Total content (%) (ppm)
6.27 4.43 12.3 0.96 0.11 0.02 0.03 0.22 22.2 22.2
Field trial: Field trial was set up as random complete block design (5m x 6m) with 5 treatments with
3 replicates as below: T1: Control with no amendment; T2: NPK; T3: NPK + 1.5 tonne biochar; T4: NPK+ 10t/ha compost buffalo manure without biochar (CP); T5: NPK + 10 tonne/ha of
3
compost with 5% of biochar (CPBC). Chemical fertilizer was applied at 100kg N, 90kg P2O5, 60 kg K2O per ha. The amount of NPK was the same in all treatment, except Control where no ammendent or fertilizer was added.
2.3.2. Sample analysisBiochar analysis
Biochar pH values were obtained in duplicate using a ratio of 1.0 g of biochar in 20 mL deionized water with the modification that the time on the shaker was increased to 1.5 h to ensure sufficient equilibration between solution and biochar surfaces (Rajkovich et al., 2011). Potential CEC was determined by saturating 1.0 g of the biochar with 40 mL of CH 3COONH4
1N at pH 7 and placing on a table shaker overnight. The shaking ensured sufficient wetting of the biochar surfaces. After shaking, the initial 40 mL of 1N ammonium acetate was extracted by vacuum with an automatic extractor, and a second addition of 40 mL ammonium acetate was added. The samples were then washed with ethanol three times with a total volume of 60 mL and then received 40 mL of 2N KCl. This initial 40mL addition of 2 N KCl was allowed to stand 16h to ensure adequate time for replacement of the absorbed NH4
+ cations. The initial 40 mL was extracted and then immediately followed by a second addition of 40 mL of 2N KCl and subsequent extraction. The 10 ml extracted NH4 solution was quantified by Kjeldahl method (Rajkovich et al., 2011).
Total C and N were measured by Dumas combustion using an Elementar vario MAX CN analyzer with combustion chamber set at 900°C and oxygen flow rate of 125 mL min−1 (Zwieten, Kimber, & Morris, 2010). Total P, Ca, Mg, and K was analyzed using the following method. The biochar samples were combusted at the temperature of 500°C over 2h and then the oven was maintained at 500°C for 8h. 5.0 mL concentrate HNO3 was added to each sample and digested at 120°C until all liquid was evaporated. Secondly, tubes were removed and allowed to cool before adding 1.0 mL HNO3 and 4.0 mL H2O2. Then, the samples were placed back into a preheated block and cooked at 120°C to dryness. The dry sample was dissolved with 1.43 mL HNO3, made up with 18.57 mL demonized water to get the 5% acid concentration, sonicated for 10 min, and filtered. Taking green house gas sample
Closed chamber technique was used to collect the gas samples (Pathak et al., 2001; Zhang et al., 2010). There were two parts of the chamber. One part was the base chamber fixed permanently in the soil throughout the rice growing season, and second part was top replaceable chamber Fig. 5b. The base chamber was made up of stainless steel with 40 cm length, 36 cm width and 35 cm height. Before transplanting, the base chamber was fixed in the middle of each plot by inserting 10 cm of its base into the soil. The base chamber contained grove on the top edge so as to fix top chamber during gas sampling. Furthermore, the base chamber was provided with two holes on the opposite sides near the level of the soil so as to allow the flow of water in and out of the base chamber. The holes were sealed with rubber cork during gas sampling to avoid the air leakage. Four hills of the rice plants were maintained within the base chamber. In addition, wooden boardwalk was provided to reach each base chamber to avoid the soil disturbance during sampling. The top chamber was 2 types. The small chamber was used for sample taking at 35 DAT and 50 DAT. The small one made up of Plexiglas with aluminum frame with 36 cm width, 40 cm length and 37.5 cm height. The big was used for 3 times latter.
4
The big one made up of Plexiglas with aluminum frame with 36 cm width, 40 cm length and 95 cm height. Two opposite sides of the top chamber were transparent and the other two sides were non-transparent. The non-transparent sides of the chamber were faced towards the sun during gas sampling to avoid direct sunlight into the chamber. The reason behind this was to reduce the temperature fluctuation inside the chamber during its deployment. A thermometer to measure temperature and two small electric fans to homogenize air during gas sampling were fixed inside the top chamber. Four fans were connected with disposable batteries placed on the top of the chamber to supply power. The top chamber also contained a 3 mm hole on the top. A open ended plastic tube with 5 mm diameter and 50 m length was inserted into the chamber through the hole with one end hanging 10 cm inside and the other end protruding 40 cm outside the top chamber. The hole was sealed from the periphery after the tube insertion so as to prevent air leakage. A check valve was provided on the protruding part of the tube to control the gas flow during gas sampling.
To determine seasonal emissions of CH4 and N2O, gases samples were collected 5 times on 35 DAT (maximum tiller); 50 DAT (Booting); 63 DTA (Flowering); 80 DAT (Milky Ripen) and 90 DAT (Total ripen). Gas sampling was started from the first replicate of each treatment at 9.00 h followed by second replicate at 9.45 h, and third replicate at 10.30 h in a row during each sampling day. Sampling time was decided based on the procedure recommended by various previous studies (Buendia et al., 1997; Zou et al., 2005). While sifting from one replicate to another 15 minutes time difference was maintained so as to let the air inside the top chamber to normalize.
During gas sampling the top chamber was placed on the grove of the base chamber and water was poured into the grove so as to avoid ga leakage. The whole assemble was made an airtight chamber during gas sampling. Four fans inside the chamber were operated immediately after placing the top chamber on the base chamber. In total, the top chamber was deployed on the base chamber for 30 minute during each gas sampling. Gas samples; t0, t1, t2 and t3 were collected at 0 minute, 10 minutes, 20 minutes and 30 minutes after the deployment, respectively. A 60 ml syringe provided with a needle was used to pull the gas samples from the chamber. The needle with the syringe was inserted into the tube, the check valve was opened and the tube was flushed with the air inside the chamber for five times before pulling out the gas samples so as to take representative samples. Exactly 50 ml gas was pulled into the syringe and the check valve was closed before the syringe was pulled out from the tube. The pulled gas was immediately inserted into the pre-evacuated 12 ml vials. The vials were analysis in the Lab of Center of Biochar & Green Agriculture, Institute of Resource Ecosystem & Environmental of Agriculture, Nanjing Agricultural University.
Green house gas analysis:The concentration of CO2, CH4 and N2O in a gas sample was simultaneously analyzed
with a gas chromatograph (Agilent 7890A) equipped with a flame ionization detector (FID) and an electron capture detector (ECD). N2 was used as the carrier gases and an Ar–CH4 gas mixture as the make-up gas for ECD analysis of CO 2, CH4 and N2O. N2O was separated by two stainless steel columns (column 1 with 1 m length and 2.2 mm in diameter, column 2 with 3 m length and 2.2 mm in diameter) that were packed with 80–100 mesh Porapack Q. N2O was detected by ECD, while CO2 and CH4 was detected by FID. The oven temperature was controlled at 55 ◦C, and the temperatures of the ECD and FID were set at 330◦C and 200◦C, respectively.
5
Calculation of amount of flux was based on the change in gas concentrations within the enclosed headspace with increase in time from 0 min to 30 minute during each sampling. Data points were excluded unless the change in concentration of gas from t0 – t30 yielded linear regression value, i.e. r2 greater than 0.80 with increase in time from 0 min to 30 minutes. Following equation (Pihlatie et al., 2013) was used to calculate the hourly flux (F= mg m -2 h-1) of CH4 and N2O:
F=S M
Vmx V
Ax 273.16(T +273.16)
x3600
1000
Where, • F is the final flux value of gas of interest at the time of chamber closure and is expressed as mg m-2 h-1, • S is the slope or time derivative of the linear fit at chamber closure and is expressed as ppm s-1 • M is molecular mass of the particular gas, which is 16.042 g mol-1 and 44.0128 g mol-1 for CH4 and N2O, respectively • Vm is ideal gas mole volume, which is 0.0224 m3mol-1 • V is the volume of chamber above water/soil level and is expressed as m3, • A is the surface area of soil covered by the base chamber and is expressed as m2, • T is the temperature reading in the thermometer, which was installed inside the chamber and is expressed as 0C.
The CO2 equivalent (CO2-e) global warming potential (GWP) over 100 years time horizon for each of the treatment over the WRGS were calculated using the IPCC GWP factors for CH4 and N2O. The IPCC GWP factors on mass basis for CH4 and N2O is 25 and 298 times CO2 over 100-years time horizon, respectively (Forster et al., 2007). The CO2 emissions from the rice field under any of the treatments were not included during the calculation of total CO2-e GWP. The CO2-e GWP ton-1 of rice production from each of the treatment was also calculated on the basis of total CO2-e GWP.
Following equations were used to calculate the total CO2-e GWP kg ha-1 and CO2-e GWP per unit of rice grain yield for each of the treatment:
Total CO2e GWP (CH4+N2O) = 25 x total cumulate CH4+298 x total cumulate N2O
CO2e GWP tonne-1 of rice grain produced = TotalCO2eGWP
Rice grain yield∈tonne
Soil analysis:
Soil pHKCl was extracted by KCl 1N (1/5 w/v) and the pH measurement taken. Soil organic carbon (OC) is analyzed using the Walkley and Black method (Walkley & Black., 1934). The soil organic matter is oxidised by dichromate (Cr2O7
2-) and concentrated sulphuric acid. Unreduced dichromate is titrated with ferrous ammonium sulphate using diphenylamine as a redox indicator. Total N was digested by concentrated H2SO4 and then determined by Kjeldahl method. Total P was extracted by mixed concentrated H2SO4 and HNO3, measured on color specphotometer at = 882 nm. Total K was digested by concentrated HNO3 acid and measured on flame photometer (BWB XP). To measure available P– Bray 2, available K, exchangeable
6

Ca2+, Mg2+ and CEC extraction was carried out using ammonium acetate solution (1M, pH7). Ca2+ and Mg2+ concentration was measured on AAS. CEC was measured by steam ammonium distillation with semi- micro Kjendahl, then titration, (TCVN Manual, 2010).
3. Results and discussion
3.1. Some characterizations of biochar
The properties of the biochar used in the trials are provided in table 1. Enhanced biochar made from mixed biomass have high nutrient content of total carbon (54%); nitrogen (0.82%) as well as Calcium, Magnesium, potassium, phosphorus. Mixture with rich of mineral and clay could help t improved CEC of biochar (13.6 cmol/kg)
Table 2. Biochar properties for field trial in experiment spring 2013
pH H2O CEC C N C/N P K Ca Mg(1:4) cmol/
kg% g/kg
9.78 13.6 54 0.82
65.9 5.12 25.87 13.8 3.9
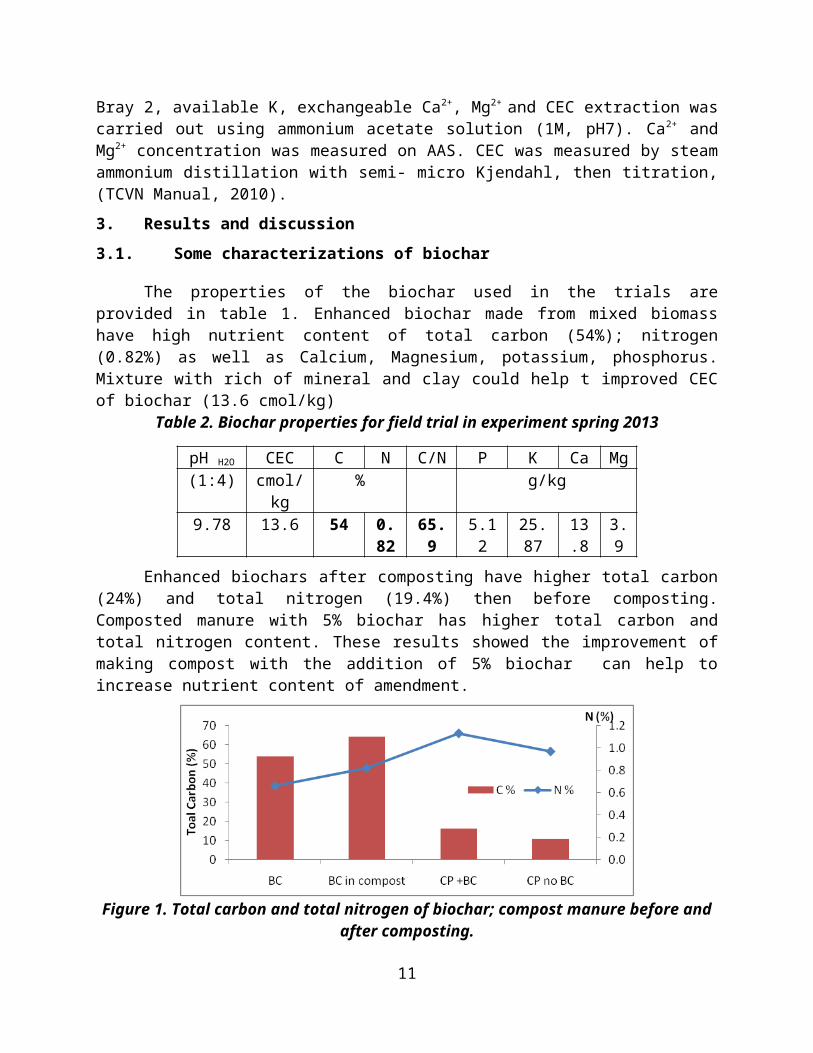
Enhanced biochars after composting have higher total carbon (24%) and total nitrogen (19.4%) then before composting. Composted manure with 5% biochar has higher total carbon and total nitrogen content. These results showed the improvement of making compost with the addition of 5% biochar can help to increase nutrient content of amendment.
Figure 1. Total carbon and total nitrogen of biochar; compost manure before and after composting.
Analyses of enhanced biochars made in TLUD have shown that the clay, lime and some of the nutrients from the manure resides in the macrospores of the biochar. It is probably that these nutrients are plant available. Figure 1 is a piece of biochar that has been mounted in resin and polished. Analysis of the light colored mineral phases by energy dispersive x-ray spectroscopy (EDS) shows that these mineral phases are high in K, Ca, Si and Al. The K and Si probably originate in part from the added rice straw ash and the Ca from the lime (figure 2).
3.2. The effect of organic matter amendment on rice yield
7
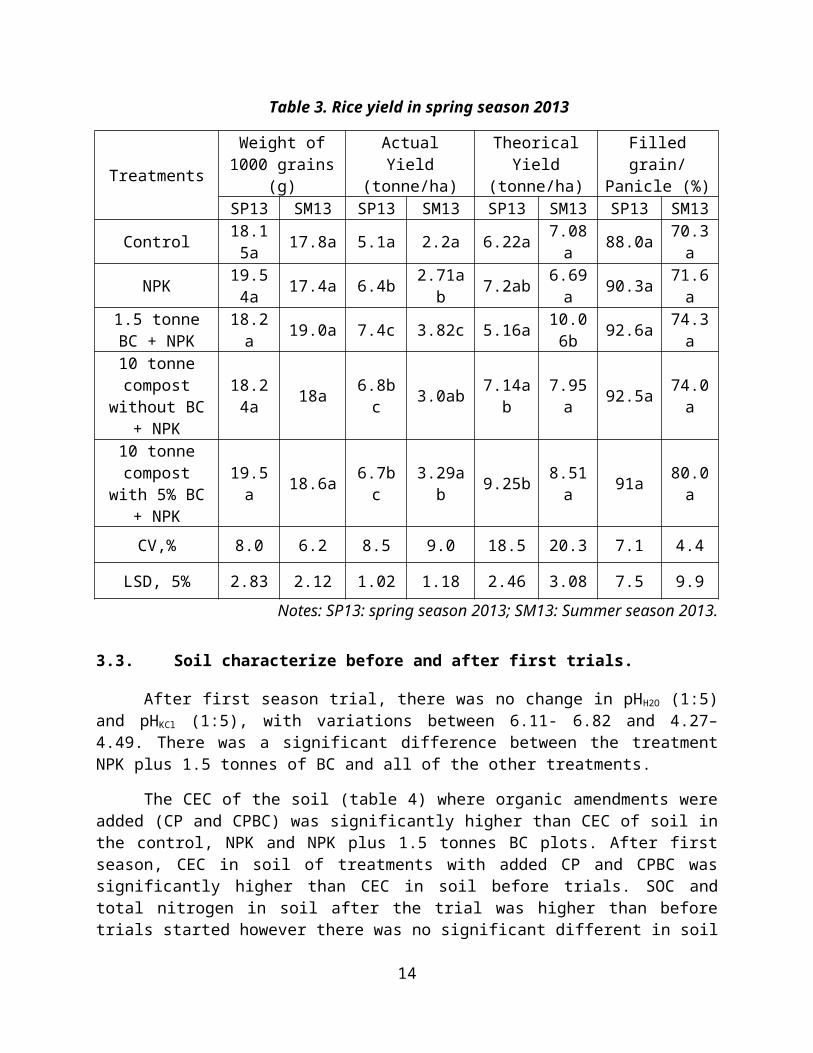
Results of these first year trials show that there is a significant increase in yield of 45% in spring season and 74% in summer season when 1.5tonnes/ha of biochar was added to the NPK fertilizer compare to the addition of only NPK (table 3). Although, in flowering stage of whole rice growth season (WRGS), rice was affected by a big storm; the summer rice yield was lower than spring season, plots of 1.5 tonnes/ha of biochar plus NPK till got highest yield.There was a small increase in yield when CP and CPBC compared with the addition of straight NPK but this was significantly smaller than the addition of biochar plus NPK. All treatments resulted in significantly greater yields than the treatment that had no fertilizer and/or amendment. There was no significant difference between CP and CPBC.
There was not significant difference between the number of filled grains per panicle (changed from 117.2 – 130.4 filled grains/panicle), weigh of 1000 filled grains (range between 18.15 – 19.54 gram in spring season; 17.4-19.0 gram in summer season), rate of filled grain per all grain in the panicle (90.3– 92.9% in spring season and from 70.3-80.03% in summer season) for all of the treatments.
Figure 2. Examination of the biochar using SEM with EDS detector
However, there was significant difference in number of panicles per hill between NPK plus 10 tonnes of CP (5.2 panicle per hill) and 10 tons of CPBC with NPK (7.5 panicle per hill). There were not significant differences between the numbers of panicles/hill for the other treatments. There was a significant difference in the average height of rice plants between the CPBC and the other amendments (Table 3).
8
Table 3. Rice yield in spring season 2013
TreatmentsWeight of 1000
grains (g)Actual Yield
(tonne/ha)Theorical Yield
(tonne/ha)Filled grain/Panicle (%)
SP13 SM13 SP13 SM13 SP13 SM13 SP13 SM13Control 18.15a 17.8a 5.1a 2.2a 6.22a 7.08a 88.0a 70.3a
NPK 19.54a 17.4a 6.4b 2.71ab 7.2ab 6.69a 90.3a 71.6a1.5 tonne BC +
NPK 18.2a 19.0a 7.4c 3.82c 5.16a 10.06b 92.6a 74.3a
10 tonne compost without
BC + NPK18.24a 18a 6.8bc 3.0ab 7.14ab 7.95a 92.5a 74.0a
10 tonne compost with
5% BC + NPK19.5a 18.6a 6.7bc 3.29ab 9.25b 8.51a 91a 80.0a
CV,% 8.0 6.2 8.5 9.0 18.5 20.3 7.1 4.4
LSD, 5% 2.83 2.12 1.02 1.18 2.46 3.08 7.5 9.9
Notes: SP13: spring season 2013; SM13: Summer season 2013.
3.3. Soil characterize before and after first trials.
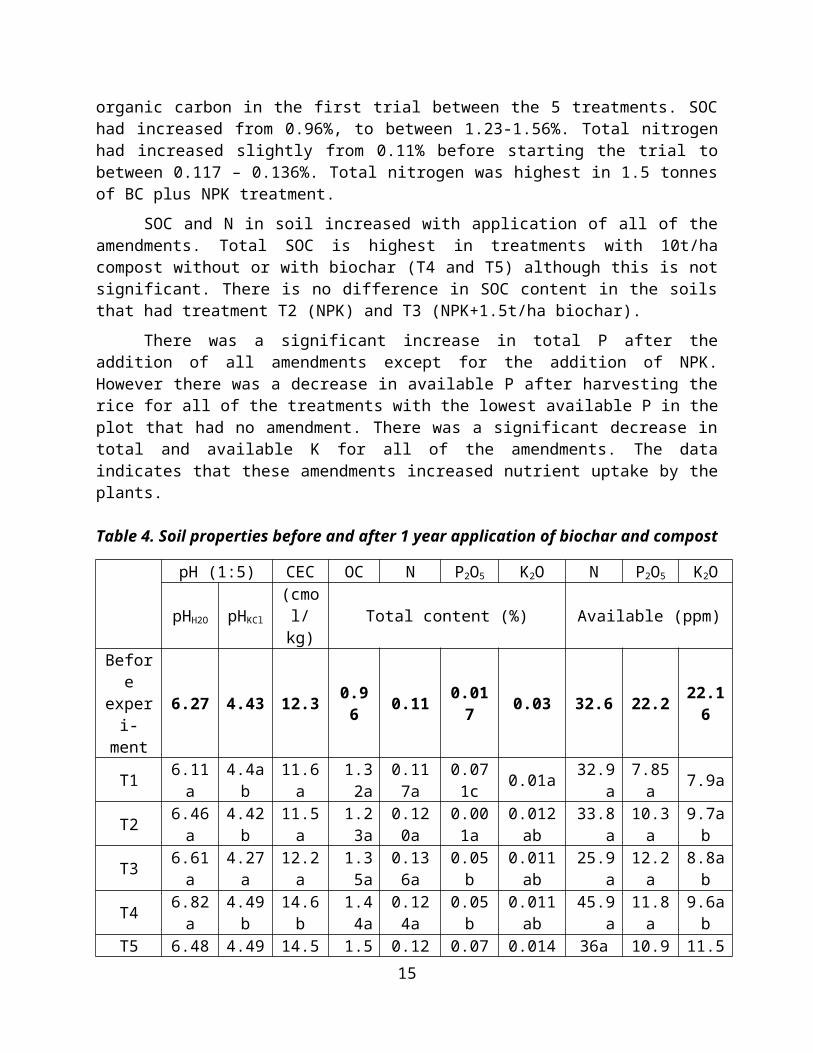
After first season trial, there was no change in pHH2O (1:5) and pHKCl (1:5), with variations between 6.11- 6.82 and 4.27– 4.49. There was a significant difference between the treatment NPK plus 1.5 tonnes of BC and all of the other treatments.
The CEC of the soil (table 4) where organic amendments were added (CP and CPBC) was significantly higher than CEC of soil in the control, NPK and NPK plus 1.5 tonnes BC plots. After first season, CEC in soil of treatments with added CP and CPBC was significantly higher than CEC in soil before trials. SOC and total nitrogen in soil after the trial was higher than before trials started however there was no significant different in soil organic carbon in the first trial between the 5 treatments. SOC had increased from 0.96%, to between 1.23-1.56%. Total nitrogen had increased slightly from 0.11% before starting the trial to between 0.117 – 0.136%. Total nitrogen was highest in 1.5 tonnes of BC plus NPK treatment.
SOC and N in soil increased with application of all of the amendments. Total SOC is highest in treatments with 10t/ha compost without or with biochar (T4 and T5) although this is not significant. There is no difference in SOC content in the soils that had treatment T2 (NPK) and T3 (NPK+1.5t/ha biochar).
There was a significant increase in total P after the addition of all amendments except for the addition of NPK. However there was a decrease in available P after harvesting the rice for all of the treatments with the lowest available P in the plot that had no amendment. There was a significant decrease in total and available K for all of the amendments. The data indicates that these amendments increased nutrient uptake by the plants.
Table 4. Soil properties before and after 1 year application of biochar and compost
9
pH (1:5) CEC OC N P2O5 K2O N P2O5 K2O
pHH2O pHKCl(cmol/kg) Total content (%) Available (ppm)
Before experi-ment
6.27 4.43 12.3 0.96 0.11 0.017 0.03 32.6 22.2 22.16
T1 6.11a 4.4ab 11.6a 1.32a 0.117a 0.071c 0.01a 32.9a 7.85a 7.9aT2 6.46a 4.42b 11.5a 1.23a 0.120a 0.001a 0.012ab 33.8a 10.3a 9.7abT3 6.61a 4.27a 12.2a 1.35a 0.136a 0.05b 0.011ab 25.9a 12.2a 8.8abT4 6.82a 4.49b 14.6b 1.44a 0.124a 0.05b 0.011ab 45.9a 11.8a 9.6abT5 6.48a 4.49b 14.5b 1.56a 0.122a 0.072c 0.014b 36a 10.9a 11.5b
CV,% 6.7 1.6 5.6 11.8 12.9 19.7 17.5 55.7 43.2 16.2LSD 5% 0.8 0.13 1.38 0.30 0.03 0.02 0.004 35.7 0.4 1.15
Notes: T1: no amendment (control); T2: application of inorganic fertilizer (NPK); T3: NPK+ 1.5 tonnes biochar; T4: NPK+ 10 tonnes of composted buffalo manure without biochar; T5: NPK+ 10 tonnes of composted of buffalo manure/5% biochar mixture.
3.4. Changes in SOC in the top soils Changes in SOC from the beginning of the experiment to harvesting of the rice in the first
spring season 2013 are presented in figure 3.
Figure 3. Changes in SOC during the trials
There was a very large increase in SOC for all of the treatments 36 days after their incorporation in the soil. The largest increase was measured in the plots where NPK and compost with biochar were added. SOC in the control and NPK plots increased due to the
10
incorporation of crop residues from the previous season and from irrigation water that had a high organic matter. After 36 days SOC was highest in T5 plots and then reduce slowly across rice growing period.
After day 36, there was no significant difference (p>0.05) in the changes in SOC for treatment T1-T4 plots (1.3– 1.6%) between the 4 growth stages before harvesting. For NPK plus 1.5 tonne/ha of biochar and 10 tonnes/ha of compost without biochar, SOC was highest at Panicle stage (45 days after transplanting the rice seedlings). Treatment with NPK+10 tonnes compost mixed with 5% biochar gave the greatest increase of SOC. After first season, SOC was increased by 62.5% with organic amendments but there was a decrease with the application of NPK although this was not significant. 3.5. Green house gases by adding organic matter in four treatments.3.5.1. Green house gases emission form paddy rice
The green house gases emission from loamy sand soil in paddy rice cultivation is provided in figure 4.
Figure 4. Green house gases emission form paddy rice in spring season 2013
There was significant differences in methane emission flux (p<0.05) between plots which was added 10 tonnes of compost with 5% biochar plus NPK and 3 other treatments (NPK; 1.5 tonne biochar + NPK and 10 tonne of compost without biochar + NPK). CH4 flux was lowest in treatments with 10t/ha compost with biochar (T5), 5.36 CH4-C g/m2/WRGS. There is no difference in CH4-C flux in treatment T2 (NPK) and T3 (NPK+1.5t/ha biochar) and T4 (10 tonne compost without biochar plus NPK).
There was not significant difference (p> 0.05) between the CO2e GWP (changed from 134.4-175.6g/h/WRGS) and no significant difference in N2O -N (changed from 916.5 - 1115.4 µg/h/WRGS between 4 treatments.
11
Figure 5. Green house gases emission form paddy rice in spring season 2013
3.5.2. Correlation of soil organic carbon (%) and methane emissionMethane emission in WRGS was showed in figure 6. CH4 flux was highest in max tiller
stage (4.04-4.57 mg/h/m2). At that time, the soil was kept flooded all time to provide enough water for tiller. CH4 flux was lowest in total ripen stage (0.05-0.22 mg/h/m2) because there was no water in the field, thus resulting in an increase in Eh with sufficient O2 to oxidize the methane. Main GHG fluxes at that time were CO2 and N2O.
Figure 6. Methane emission form paddy rice in WRGS in spring season 2013.
Figure 7 - 10 shows the correlation of soil organic carbon in soil and methane emission after the first experiment. There is no significant correlation between OC and methane emissions.
12
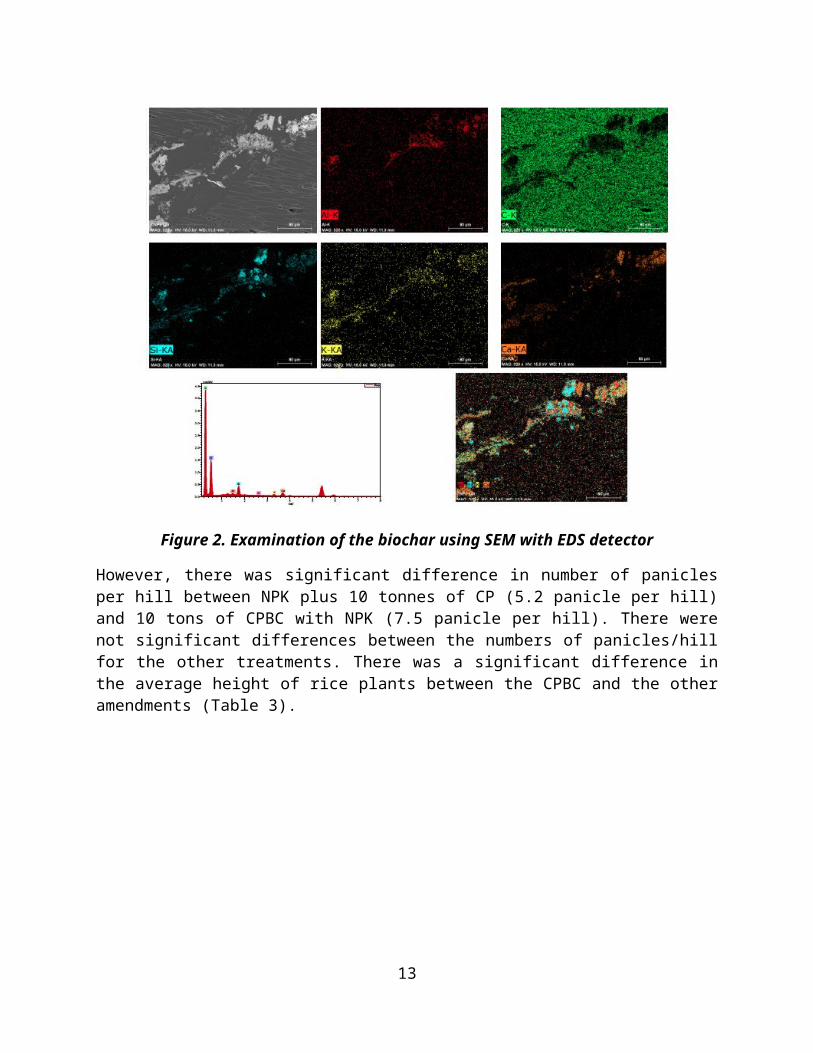
Figure 7. Correlation of OC (%) and Methane emission in plot T2 (NPK application only)
Figure 8. Correlation of OC (%) and Methane emission in plot T3 (1.5 tonne of biochar + NPK)
Figure 9. Correlation of OC (%) and methane emission in plot T4 (10 tonnes compost without
biochar + NPK)
Figure 10. Correlation of OC (%) and methane emission in plot T5 (10 tonne compost with 5% of
biochar + NPK)3.5.3. Estimation of CO2 equivalent global warming potential for each of the treatment
Table 5 showed the CO2 equivalent global warming potential for each of the treatment. The first experiment indicated that no significant different in total CO2e GWP and CO2e GWP per tonne of rice grain in each treatments. There are necessary to have more research and monitoring on CO2e potential in future.
Table 5. CO2 equivalent global warming potential for each of the treatment
CO2e (g/ha/Season)
Yield (tonnes/ha)
CO2e GWP(g/tonnes rice grain)
NPK 1633.8a 6.4a 221.54aBC+NPK 1755.9a 7.4b 256.19aCP 1659.9a 6.8ab 260.64aCP+BC 1344a 6.7ab 202.04aCV,% 28.2 7.5 31LSD, 5% 899.5 1.02 146.2
4. Conclusion and recommendation
13
4.1. Conclusion
After the first trial in spring season, application of all of the treatments increased rice yield over the control (26% - 45%). The greatest increase in yield was the application of 1.5tonnes/ha with NPK fertilizer (45% compared with the control). There was no significant difference (p> 0.05) in yield between the other treatments.
The application of organic amendments increased the amount of SOC compared with the control soil. The highest soil carbon content and nitrogen content was observed in treatment of 10 t/ha compost mixed with 5% biochar.
There was significant differences in methane emission flux (p<0.05) between plots which was added 10 tonnes of compost with 5% biochar plus NPK and 3 other treatments. There is no difference in CH4-C flux in treatment T2 (NPK) and T3 (NPK+1.5t/ha biochar) and T4 (10 tonne compost without biochar plus NPK). There was not significant difference (p> 0.05) between the CO2e GWP (changed from 134.4-175.6g/h/WRGS) and no significant difference in N2O -N (changed from 916.5 - 1115.4 µg/h/WRGS between 4 treatments.
4.2. Recommendation
Biochar in conjunction with either NPK or compost and NPK could increase crop yields and soil quality in the North of Vietnam. Biochar in compost could help reduce GHGs flux from loamy sandy soil in paddy rice condition. Long term trials need to be undertaken in a range of ecosystems to determine the benefits of this new technology.
5. References
Care International in Viet Nam. (2012). Piloting Pyrolitic Cookstoves and Sustainable Biochar Soil Enrichment in the Northern Vietnam Uplands Stove-Biochar Project (pp. 1–23).
Forster, P., V. Ramaswamy, P. Artaxo, T. Berntsen, R. Betts, D.W. Fahey, J. Haywood, J. Lean, D.C. Lowe, G. Myhre, J. Nganga, R. Prinn, G. Raga, M. S. and R. V. D. (2007). Changes in Atmospheric Constituents and in Radiative Forcing, In: Climate Change 2007: The Physical Science Basis. Contribution of Working Group I to the Fourth Assessment Report of the Intergovernmental Panel on Climate Change, (Cambridge University Press, Cambridge, United Kingdom and New York, NY, USA.).
Hien, N. Van, & Vinh, N. C. (2012). Component: “Application of biochar for sustainable soil enrichment in the Northern Vietnam uplands”. Component: “ Application of biochar for sustainable soil enrichment in the Northern Vietnam uplands”.
Joseph, S. D. (2010). An investigation into the reactions of biochar in soil. Australian Journal of Soil Research, 39(7), 3990. doi:10.1071/SR10009
Rajkovich, S., Enders, A., Hanley, K., Hyland, C., Zimmerman, A. R., & Lehmann, J. (2011). Corn growth and nitrogen nutrition after additions of biochars with varying properties to a temperate soil. Biology and Fertility of Soils, 48(3), 271–284. doi:10.1007/s00374-011-0624-7
14
Walkley, A., & Black., I. A. (1934). A Examination of a Rapid Methord for determination of organic carbon in sois-effect of variation in Digestion conditions and Inorganic soil constituents. Soil Science, 63, 251–257.
Zwieten, L. Van, Kimber, S., & Morris, S. (2010). Effects of biochar from slow pyrolysis of papermill waste on agronomic performance and soil fertility, 327, 235–246. doi:10.1007/s11104-009-0050-x.
15