Embed Size (px)
Citation preview

A Picture of ACT’s Children and Young People
Health, wellbeing, learning and development outcomes for children and young people living in the Australian Capital Territory
Acknowledgment of CountryThe ACT Government acknowledges the traditional custodians of the ACT, the Ngunnawal people. The ACT Government acknowledges and respects their continuing culture and the contribution they make to the life of this city and this region.
Acknowledgments The framework contained within A Picture of ACT’s Children and Young People utilises a number of outcomes and indicators focused on children and young people’s health, wellbeing, learning and development. It acknowledges the contribution of the Council of Australian Governments, Australian Institute of Health and Welfare, and the Victorian Government in their work in identifying outcomes and reporting on evidence based indicators, which have been used as the basis of this framework.
Images used in this report are taken from ‘Right Here Right Now’ a project of the ACT Children & Young People Commissioner. In April 2015 a large-scale art installation was created in the Fitters’ Workshop using self portraits created by 11,500 students from 50 ACT schools, with their messages about why it is important for adults to listen to children and young people. The double helix design represents the unique contribution made by each child and young person to our ACT community. For further information see www.actkids.act.gov.au
AccessibilityThe ACT Government is committed to making its information, services, events and venues accessible to as many people as possible.
If you have difficulty reading a standard printed document and would like to receive this publication in an alternative format — such as large print or audio — please telephone (02) 6205 0619.
If English is not your first language and you require translating and interpreting services — please telephone 131 450.
If you are deaf or hearing impaired and require the TTY typewriter service — please telephone (02) 6205 0888.
1

DisclaimerEach reader waives and releases the territory, to the full extent permitted by law, from any and all claims relating to the usage of material or information documented in the report. Subject to any terms implied by law which cannot be excluded, in no event shall the territory be liable for any losses or damages, including incidental or consequential damages, resulting from use of the material or reliance on the information.
While care has been taken to ensure that information contained in the territory’s publications is true and correct at the time of publication, changes in circumstances after the time of publication may impact on the accuracy of this information. The territory gives no warranty or assurance, and makes no representation as to the accuracy or reliability of any information or advice contained in the report, or that it is suitable for your intended use.
The report contains reference to external documents and internet sites. The external websites are outside the territory’s control. It is the responsibility of internet users to make their own decisions about the accuracy, currency, reliability, and correctness of information found. While care is taken to provide links to suitable material, the nature of the internet prevents the territory from guaranteeing the suitability, completeness or accuracy of any material that this report may be linked to.
ISSN 2202-5065 (Print)
ISSN 2202-5073 (Online)
October 2015. © ACT Government
Enquiries about this publication should be directed to:
Community Services DirectorateGPO Box 158, Canberra ACT 2601
t 133 427 e [email protected]
www.communityservices.act.gov.au
2

From the Minister for Children and Young People
Optimising the heath, wellbeing, learning and development of children and young people is a key priority in the ACT, and across Australia.
A Picture of ACT’s Children and Young People 2015 is the fifth annual report which provides an overview of how children, young people, families and communities in the ACT are faring against key national headline indicators in relation to health, wellbeing, learning and development outcomes. This publication is highly regarded and provides important information about children, young people, families and the ACT community in one easily accessible place.
It is evident from the data presented in A Picture of ACT’s Children and Young People 2015 that most children and young people are faring well in the ACT. For example, the proportion of fully immunised children aged 60–63 months in the ACT has increased over time with 85 per cent of children fully immunised in 2009 to 93 per cent in 2014; the percentage of ACT women smoking during pregnancy has decreased significantly between 2002 and 2012 and is significantly lower than the national rate; and the rate of young people under supervision, in detention or who have offended continues to decrease.
The publication importantly highlights areas where improvements can be made and identifies opportunities for health and wellbeing gains to guide government and community action to address these issues. Reducing the proportion of Aboriginal and Torres Strait Islander women who smoke during pregnancy and reducing the over-representation of Aboriginal and Torres Strait Islander young people in the youth justice system are key areas for action.
A strategic priority of the ACT Government is Enhancing Livability and Social Inclusion and this publication reflects this priority and demonstrates a whole of government commitment to monitor the indicators that impact on children and young people’s health and wellbeing. It provides accessible, easy to read and comprehensive data trends to inform planning, policy, programs and services that supports the continuation of building Canberra as a wonderful place to live for all of our citizens. I encourage anyone whose work is related to children, young people and families to read A Picture of ACT’s Children and Young People 2015.
Mick Gentleman MLAMinister for Children and Young PeopleOctober 2015
3

Table of contents
Introduction 6
Background to the ACT Children and Young People Outcomes Framework 8
About this report 10
An overview of ACT’s children and young people11
Where were parents of ACT’s children and young people born? 12
Where do ACT’s children and young people live? 12
What are the changes to where children and young people live? 13
Part one: Children and young people 15
Outcome 1: Optimal physical health and wellbeing
Smoking during pregnancy 16
Low birthweight in newborns 18
Infant mortality 20
Breastfeeding 21
Fruit and vegetable consumption 24
Participation in physical activity 27
Children fully immunised 29
Leading causes of hospitalisations 32
Psychiatric hospitalisation 34
Dental health 35
Outcome 2: Optimal development in the early years
Children entering school with the basic skills for life and learning 36
Children enrolled in preschool 43
Outcome 3: Educational engagement and success
ACT public primary and high school attendance 44
Students achieving at or above the national minimum standard in literacy and numeracy 45
Year 10–12 apparent retention 50
Transition from school to further education or work 52
Outcome 4: Children and young people adopt healthy and pro-social lifestyles
Children and young people who are overweight and obese 54
Young people who use drugs 55
Young people who have offended 59
Young people under youth justice supervision 60
Young people under community-based supervision 62
Young people in youth justice facilities 64
4
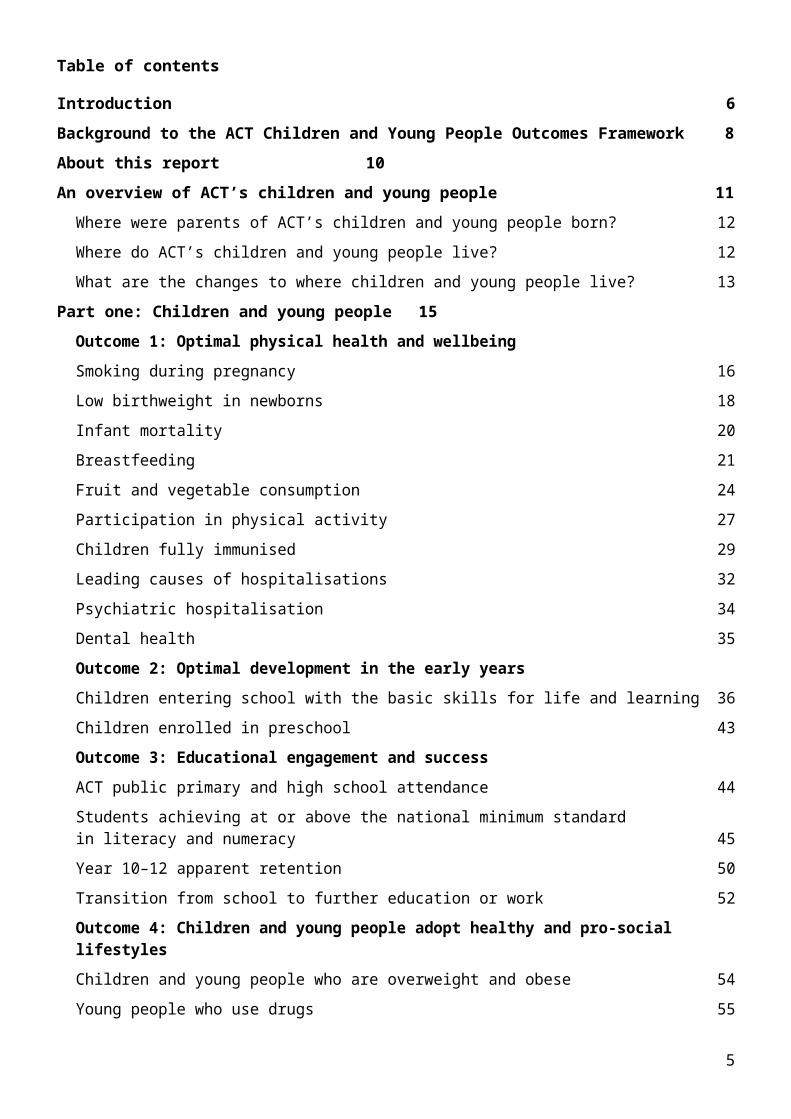
Table of contents
Part two: Families 66
Outcome 1: Families have access to sufficient material wellbeing
Parental employment status 67
Disposable household income 68
Family income spent on housing 69
Outcome 2: Families are free from abuse and neglect
Substantiated child abuse 70
Children and young people on care and protection orders 72
Children and young people in out of home care 74
Outcome 3: The individual needs of families are recognised and supported
Teenage fertility 77
ACT children’s level of reading, writing and numeracy by parental education 78
Part three: Community, environments and services 81
Outcome 1: Accessible local recreation spaces, activities and community facilities
Children and young people living in neighbourhoods with good parks, playground and play spaces 82
Children registered as library users 83
Outcome 2: Adequate family support services to meet the needs of parents
Families and Caregivers receiving support through services provided to children and young people with a developmental delay or disability from Therapy ACT 85
Families accessing coordinated locally-based services through the Child and Family Centres 88
Outcome 3: Supportive and connected communities
Children’s participation rate at cultural activities, venues or events 90
Families attending at least one cultural venue or event in the preceding year 92
Young people who volunteer 93
Territory and national policies and frameworks influencing children and young people 94
Looking for more data? 98
References 100
Figures 102
Tables 104
5

Introduction
Introduction
A Picture of ACT’s Children and Young People complements the work being undertaken nationally and within jurisdictions across Australia to measure outcomes for children and young people.
This report incorporates nationally recognised indicators of children and young people’s health, wellbeing, learning and development together with ACT specific indicators. Maximising the use of data to evaluate progress and to identify changing trends is a vital component in building a child and youth friendly city. Investment in the collection and analysis of data is assisting with the development of responsive policy, programs and services within the ACT.
This is the fifth year the ACT Government has compiled key data on the health, wellbeing, learning and development of ACT’s children and young people in one report. There are 37 indicators reported in the 2015 publication where eight of which have no new data for the 2014 reporting period. The inaugural report, released in 2011, highlighted that most children and young people in the ACT were faring well. This trend has continued in the 2012, 2013, 2014 and 2015 releases of A Picture of ACT’s Children and Young People.
Highlights
The 2015 report highlights many positive outcomes for ACT children, young people, their families and communities including:
visits to neighbourhood parks increased from 75 per cent to 85 per cent during the year, which indicates an increase in park usage
the year 10–12 apparent retention rate for all ACT students increased between 2008 and 2014, and is higher than national results
the proportion of fully immunised children aged 60–63 months in the ACT has increased over time with 85 per cent of children fully immunised in 2009 increasing to 93 per cent in 2014
the number of families accessing services from the Child and Family Centres has increased in the most recent reporting period from 1,830 (in 2012–13) to 1,863 (in 2013–14)
the proportion of ACT women smoking during pregnancy has decreased significantly between 2002 and 2012, and is significantly lower than the national rate
the proportion of children enrolled in a preschool program in the ACT increased for the 2014 reporting period
the rate of young people who have offended continues to decrease, and is at its lowest rate over the preceding five-year period
the rate of young people under supervision has declined and is at its lowest rate since 2008–09
the number of young people in detention has continued to decrease over the last three years.
The report continues to highlight that improvements could be made in the following areas:
the trend in children being overweight or obese has remained relatively constant in Australia but in the ACT there has been an increase in the percentage of children who are overweight from 2007–08 to 2011–12
reducing the vulnerability of ACT children on the Physical health and wellbeing domain as measured 6

Introduction
by the AEDI in 2012 where the ACT was higher than the national average
reducing the rate of Aboriginal and Torres Strait Islander children identified as developmentally vulnerable on one or more domain/s as measured by the AEDI in 2012 where the ACT was higher than the national average
reducing the proportion of Aboriginal and Torres Strait Islander women who smoke during pregnancy
reducing the proportion of teenage women who smoke during pregnancy
reducing the over-representation of Aboriginal and Torres Strait Islander young people in the youth justice system.
A Picture of ACT’s Children and Young People is a key initiative supporting Canberra as a child and youth friendly city. The ACT Children’s Plan 2010–2014 and ACT Young People’s Plan 2009–2014 were the key policy documents instrumental in providing the strategic direction in achieving this goal.
7
Introduction
Background to the ACT Children and Young People Outcomes Framework
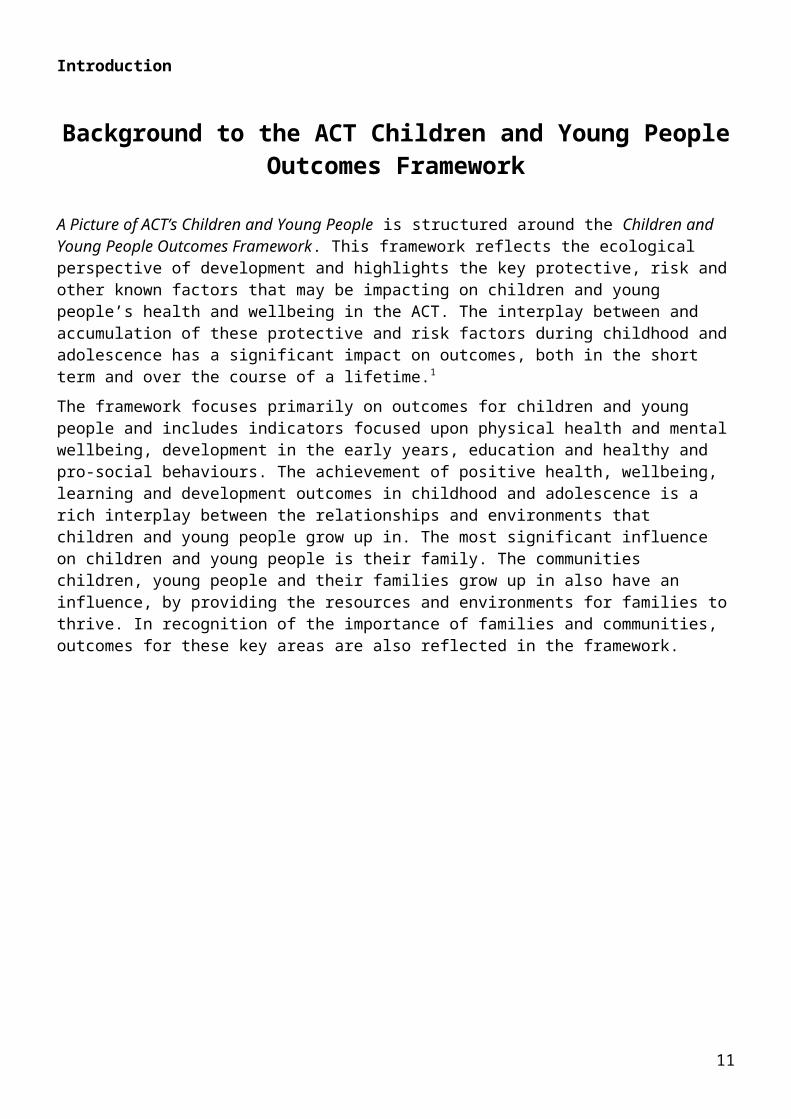
A Picture of ACT’s Children and Young People is structured around the Children and Young People Outcomes Framework. This framework reflects the ecological perspective of development and highlights the key protective, risk and other known factors that may be impacting on children and young people’s health and wellbeing in the ACT. The interplay between and accumulation of these protective and risk factors during childhood and adolescence has a significant impact on outcomes, both in the short term and over the course of a lifetime.1
The framework focuses primarily on outcomes for children and young people and includes indicators focused upon physical health and mental wellbeing, development in the early years, education and healthy and pro-social behaviours. The achievement of positive health, wellbeing, learning and development outcomes in childhood and adolescence is a rich interplay between the relationships and environments that children and young people grow up in. The most significant influence on children and young people is their family. The communities children, young people and their families grow up in also have an influence, by providing the resources and environments for families to thrive. In recognition of the importance of families and communities, outcomes for these key areas are also reflected in the framework.
8

Figure 1 The ACT Children and Young People Outcomes Framework
Influences over the development of children and young people — families, community and environment — adapted from the Centre for Community and Child Health, and Telethon Institute for Child Health Research.
9
Introduction
About this report
Key to symbols used in this report
Performance improving
Performance worsening
Performance maintaining
No new data available
The ACT Children and Young People Outcomes Framework provides a conceptual map of outcomes and indicators relating to the health, wellbeing, learning and development of children and young people.
A Picture of ACT’s Children and Young People 2015 has three parts. Part one reports on indicators relating to children and young people, part two reports on indicators related to families, and part three reports on indicators relating to communities, environments and services.
Most of the indicators contained in the report outline how the ACT is progressing over time. Included for each indicator is a description, rationale for the indicator’s inclusion and an evaluation of how the ACT is faring. The symbols shown have been used to represent how the ACT is performing over time.
Data in this report has been sourced from a variety of ACT Government and national datasets. While many of the indicators have new data from 2015, some of the indicators present the same data from previous years as the data is collected periodically rather than annually. For these indicators, new data will be presented when available.
Data has also been disaggregated (where possible) by age (or age cohort), gender, disability status, Aboriginal and Torres Strait Islander background and ACT region to provide a more detailed picture of children and young people.
The selection of data on how Aboriginal and Torres Strait Islander children are faring in this report has been prioritised by the targets set in the Closing the Gap reform.2 As the ACT is a small jurisdiction, data cannot be reported for some of the indicators due to the small numbers which could lead to identification.
10
Introduction
An overview of ACT’s children and young people
How many children and young people live in the ACT?
As of September 2014 there were an estimated 385,489 people living in the ACT and 127,215 of these people were children and young people aged 0 to 24 years. Children and young people aged between 0 to 24 years of age comprised 33.2 per cent of the total population in the ACT.3 In the ACT 2.8 per cent of children and young people identified as Aboriginal and Torres Strait Islander.4
Figure 2 The proportion of ACT residents in each age group, 2014
Data source: ABS 31010DO002_201409 Australian Demographic Statistics, Sep 2014
The ACT reported the third highest proportion of total residents aged 0–24 years nationally.
Figure 3 The proportion of the total population who are aged 0–24 years in each Australian state and territory, 2014
Data source: ABS 31010DO002_201409 Australian Demographic Statistics, Sep 2014.
11

Introduction
Where were parents of ACT’s children and young people born?
In the ACT, 61 per cent (65,697) of children and young people aged 0–24 years were identified as having both parents born in Australia. Whereas 16 per cent (17,126) of children and young people indicated that both parents were born overseas and 23 per cent (24,094) indicated that one parent was born overseas.
Figure 4 Ancestry of dependent children aged 0–24 years, ACT 2011
Data source: ABS, Census, 2011.
Where do ACT’s children and young people live?
The districts with the highest total number of children and young people aged 0–24 years in 2012 were Belconnen (31,841) and Tuggeranong (31,268). The districts with the highest proportion of residents aged 0–24 years are Cotter-Namadgi (38.1 per cent), Gungahlin (37.5 per cent) followed by Tuggeranong (35.5 per cent) and Belconnen (34.0 per cent).
Table 1 Total number and proportion of district population, by age group in the ACT, 2012
District
Age group Proportion of residents
aged 0–240–4 5–9 10–14 15–19 20–24
Belconnen 6,940 5,749 4,970 5,943 9,239 34.0%
Cotter-Namadgi 37 36 52 40 73 38.1%
Fyshwick-Pialligo-Hume 49 21 77 83 154 25.1%
Gungahlin 5,039 4,209 3,629 3,155 4,006 37.5%
North Canberra 2,314 2,054 1,822 3,208 7,978 33.8%
South Canberra 1,150 1,306 1,332 1,436 1,712 27.0%
Tuggeranong 5,927 5,627 5,916 6,934 6,864 35.5%
12

Introduction
District
Age group Proportion of residents
aged 0–240–4 5–9 10–14 15–19 20–24
Weston Creek 1,659 1,499 1,334 1,264 1,214 29.9%
Woden 1,889 1,942 1,972 2,061 2,281 29.7%
Data source: ABS, Population by Age and Sex, Regions of Australia, 2012, cat. no. 3235.0.
What are the changes to where children and young people live?
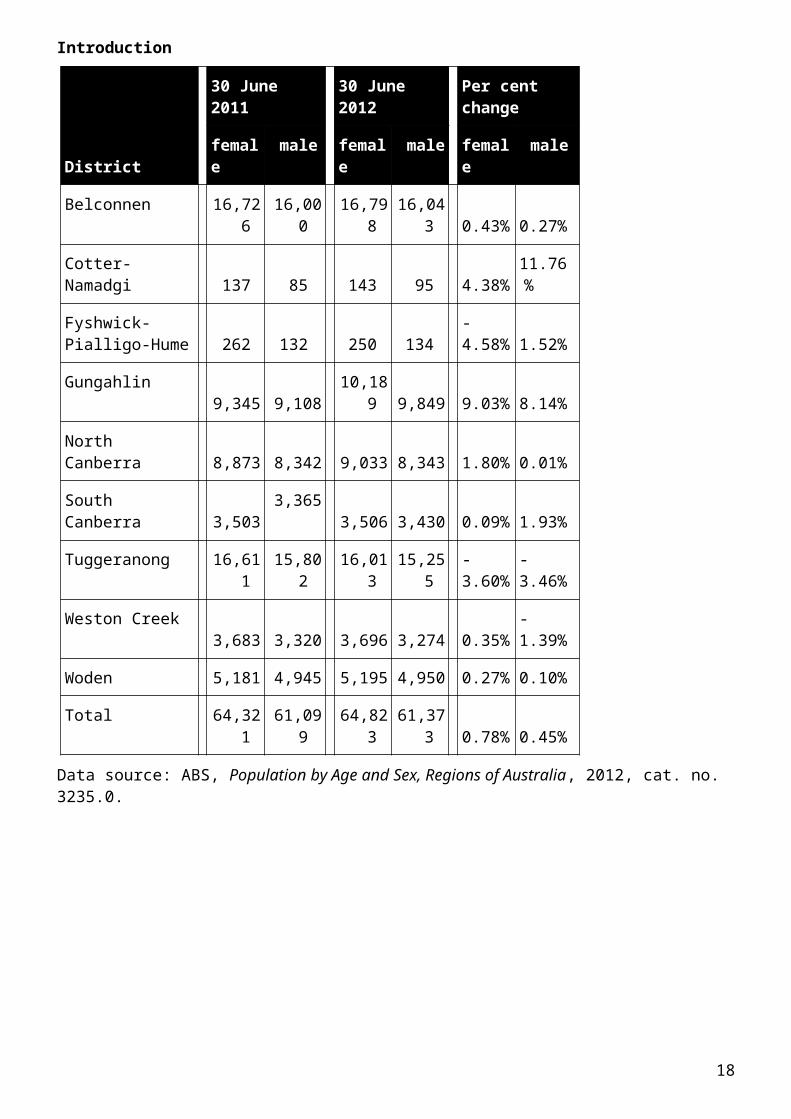
The districts with the largest percentage change in the number of 0–24 year olds between 2011 and 2012 were Gungahlin (8.59 per cent) and Cotter-Namadgi (7.21 per cent) with the largest decline in Tuggeranong (-3.46 per cent). The growth in the number of males was stronger in Cotter-Namadgi compared to females (11.76 per cent and 3.38 per cent respectively) while the largest increase in the number of females was in Gungahlin (9.03 per cent).
Table 2 Estimated resident population, ACT, by age and sex, 0–24 years for 2011 and 2012
District
30 June 2011 30 June 2012 Per cent change
female male female male female male
Belconnen 16,726 16,000 16,798 16,043 0.43% 0.27%
Cotter-Namadgi 137 85 143 95 4.38% 11.76%
Fyshwick-Pialligo-Hume 262 132 250 134 -4.58% 1.52%
Gungahlin 9,345 9,108 10,189 9,849 9.03% 8.14%
North Canberra 8,873 8,342 9,033 8,343 1.80% 0.01%
South Canberra 3,503 3,365 3,506 3,430 0.09% 1.93%
Tuggeranong 16,611 15,802 16,013 15,255 -3.60% -3.46%
Weston Creek 3,683 3,320 3,696 3,274 0.35% -1.39%
Woden 5,181 4,945 5,195 4,950 0.27% 0.10%
Total 64,321 61,099 64,823 61,373 0.78% 0.45%
Data source: ABS, Population by Age and Sex, Regions of Australia, 2012, cat. no. 3235.0.
13

Introduction
Figure 5 Percentage change of 0–24 year olds in each ACT district, 2011–12
Data source: ABS, Population by Age and Sex, Regions of Australia, 2012, cat. no. 3235.0.
14

Part 1: Children and young people
Children and young people
Outcomes Indicators
Optimal physical health and mental wellbeing
Smoking during pregnancy
Low birthweight in newborns
Infant mortality
Breastfeeding
Fruit and vegetable consumption
Participation in physical activity
Children fully immunised
Leading causes of hospitalisation
Psychiatric hospitalisation
Dental health
Optimal development in the early years
Children entering school with basic skills for life and learning
Children enrolled in preschool
Educational engagement and success
ACT public primary school and high school attendance
Students achieving at or above the national minimum standard in literacy and numeracy
Year 10–12 apparent retention
Transition from school to further education or work
Children and young people adopt healthy and pro-social lifestyles
Children and young people who are overweight and obese
Young people who use drugs
Young people who have offended
Young people under youth justice supervision
Young people under community-based supervision
Young people in youth justice facilities
Performance improving
Performance
worsening
Performance
maintaining
No new data
available
15

Children & young people — Outcome 1: Optimal physical health & mental wellbeing
Smoking during pregnancy
Indicator description The proportion of women who smoked tobacco during pregnancy for ACT resident women.
What do we measure? The number of women who report smoking tobacco during pregnancy.
Why is this important? Smoking during pregnancy is the most common preventable risk factor for pregnancy complications, and is associated with poorer perinatal outcomes such as low birthweight, preterm birth, small for gestational age babies and perinatal death. 5
How is the ACT progressing?
The proportion of women who smoked during pregnancy has decreased significantly from 12.0 per cent in 2003 to 7.1 per cent in 2012 (Figure 6). The proportion of ACT women who smoke during pregnancy is consistently significantly lower than the national rate. Nationally, 12.5 per cent of women smoked during pregnancy in 2012.
Teenage women were significantly more likely to smoke during pregnancy. In 2012, 36.5 per cent of women aged less than 20 years at the birth of their baby smoked during pregnancy compared with 6.5 per cent of women aged 20 years and over.
Figure 6 Proportion of women who smoked during pregnancy, ACT residents, 2003–12
Data source: ACT Health, Epidemiology Section. Maternal and Perinatal Data Collection, unpublished data.
16

Children & young people — Outcome 1: Optimal physical health & mental wellbeing
Smoking during pregnancy for Aboriginal and Torres Strait Islander women
How is the ACT progressing?
Note: The data for this section has been grouped into three-year periods due to the small number of Aboriginal and Torres Strait Islander women who reside in the ACT and give birth each year.
Over the period 2010–12, 50 per cent of Aboriginal and Torres Strait Islander women in the ACT reported smoking during pregnancy compared with 8.3 per cent of non-Aboriginal and Torres Strait Islander women.
The proportion of Aboriginal and Torres Strait Islander women who reported smoking during pregnancy over the period 2004–06 to 2010–12 has fluctuated, while the rate for non-Aboriginal and Torres Strait Islander women has decreased (Figure 7).
Nationally, 48.1 per cent of Aboriginal and Torres Strait Islander women reported smoking during pregnancy in 2012 compared with 10.7 per cent of non-Aboriginal and Torres Strait Islander women.6
The average birthweight for babies born to Aboriginal and Torres Strait Islander women who smoked during pregnancy was significantly lower than the average birthweight of babies born to Aboriginal and Torres Strait Islander women who did not smoke during pregnancy in 2010–12 (2,988 grams compared with 3,408 grams).
Figure 7 Proportion of women who smoked during pregnancy by Aboriginal and Torres Strait Islander status, ACT residents, 2004–06 to 2010–12
Data source: ACT Health, Epidemiology Section. Maternal and Perinatal Data Collection, unpublished data.
17
Children & young people — Outcome 1: Optimal physical health & mental wellbeing
Low birthweight in newborns
Indicator description The proportion of live born babies with a birthweight less than 2,500 grams born to ACT resident women.
What do we measure? The birthweight of all babies born in the ACT.
Why is this important? A baby’s birthweight is a key indicator of health status.7 Low birthweight babies have a greater risk of poor health and dying during the first year of life, require a longer period of hospitalisation after birth and are more likely to develop significant disabilities.8
How is the ACT progressing?
The proportion of low birthweight babies born to ACT residents in the ACT in 2012 was 5.9 per cent, slightly lower than the national rate of 6.2 per cent.
The proportion of live born ACT babies with a low birthweight has fluctuated over the period 2003–12 (Figure 8). Annual fluctuations in the proportion of low birthweight babies occur due to the small number of births in the ACT each year.
Figure 8 Proportion of low birthweight babies, ACT residents, 2003–12
Data source: Epidemiology Branch, ACT Health. Maternal and Perinatal Data Collection, unpublished data. Maternal and Perinatal Health Series.
Note: Includes live born babies born in the ACT to ACT resident women.
18

Children & young people — Outcome 1: Optimal physical health & mental wellbeing
Low birthweight babies born to Aboriginal and Torres Strait Islander women
How is the ACT progressing?
The proportion of low birthweight babies born to Aboriginal and Torres Strait Islander women was higher than the proportion of low birthweight babies born to non-Aboriginal and Torres Strait Islander women (Figure 9). The proportion of low birthweight babies born to Aboriginal and Torres Strait Islander women has decreased over the period 2004–06 to 2010–12, while the proportion of low birthweight babies born to non-Aboriginal and Torres Strait Islander women has fluctuated over this period.
Figure 9 Proportion of low birthweight babies by maternal Aboriginal and Torres Strait Islander status, live births, ACT residents, 2003–06 to 2010–12
Data source: Epidemiology Branch, ACT Health. Maternal and Perinatal Data Collection, unpublished data. Maternal and Perinatal Health Series.
NOTES: Includes live born babies born in the ACT to ACT resident women. The data for this section has been grouped into three-year periods due to the small number of Aboriginal and Torres Strait Islander women who reside in the ACT and give birth each year.
19

Children & young people — Outcome 1: Optimal physical health & mental wellbeing
Infant mortality
Indicator description The number of infant deaths (at less than 1 year of age) per 1,000 live births in the ACT.
What do we measure? The number of infant deaths and the number of live births in the ACT.
Why is this important? Infant mortality (i.e. deaths under 1 year of age) is an important indicator of the general health and wellbeing of a population and has a large influence on life expectancy at birth. A high infant mortality rate lowers life expectancy, while a low infant mortality rate contributes to increased life expectancy.9
How is the ACT progressing?
The infant mortality rate for ACT babies fluctuated over the period 2004–13 at between 2.9 and 6.9 per 1,000 live births (Figure 10). Fluctuations in the infant mortality rate occur due to the very small number of infant deaths in the ACT each year, however there was an overall decrease in the rate of infant deaths (Figure 10).
Figure 10 Infant mortality rate, ACT and Australia, 2004–13
Data source: ABS 2014. Deaths, Australia 2013. cat. no. 3302.0. Canberra: ABS
20

Children & young people — Outcome 1: Optimal physical health & mental wellbeing
Breastfeeding
Indicator description The proportion of infants being breastfed in the ACT who attend Maternal and Child Health (MACH) clinics for their immunisations.
What do we measure?
Note: The data for this indicator is obtained only from clients who attend MACH clinics for their immunisations. This does not include clients who visit their GP or other health service for immunisations and therefore is only representative of a proportion of ACT infants.
In 2009, ACT Health implemented a simple data collection for babies presenting for immunisation at Child Health Immunisation Clinics at 2, 4, 6 and 12 months of age. During the immunisation encounter, the carers were asked to indicate whether the infant was still breastfeeding through a simple ‘yes’ or ‘no’ response. The purpose of this collection was to create a picture of the proportion of infants being breastfed in the ACT and to identify opportunities to improve the breastfeeding rate amongst women and infants in the ACT.
Due to the success of this trial, in 2011 the data collection was refined and carers were asked at the Child Health Immunisation Clinics about exclusive breastfeeding*, if the infant was receiving any breast milk and introduction of solids to their infant’s diet. These questions are in line with nationally agreed indicators to allow better interpretation on how the ACT is tracking.
* Exclusive breastfeeding definition: Infants receive only breast milk, including expressed breast milk and, where required, medicines, but no infant formula or non-human milk10.
Why is this important? The National Health and Medical Research Council (NHMRC) recommend ‘that infants be exclusively breastfed until around 6 months of age when solid foods are introduced. It is further recommended that breastfeeding be continued until 12 months of age and beyond, for as long as the mother and child desire.’ 11
It is well established that breastfeeding provides significant public health benefits. It provides benefits to infants including reduced risk of infection, asthma and atopic disease and sudden infant death syndrome. Breastfeeding also contributes to infants’ improved cognitive development and protects against obesity, high blood pressure and some chronic diseases in later life.12
How is the ACT progressing?
Figure 11 data shows the proportion of infants accessing ACT Child Health Immunisation Clinics who were being exclusively breastfed during the period of 1 July 2013 to 30 June 2014 in comparison to the 2012–13 period. Approximately 65 per cent of infants were exclusively breastfed to three months of age after which rates of exclusively breastfed infants begin to decline. The drop in exclusive breastfeeding rates at around 5 months of age coincides with the NHMRC recommended time for the introduction of solids.
Exclusive breastfeeding rates have remained relatively stable since the collection of the 2012–13 data.
21

Children & young people — Outcome 1: Optimal physical health & mental wellbeing
Figure 11 Exclusive breastfeeding, infants presenting at ACT Child Health Immunisation Clinics, by age (completed calendar months), 2011–12, 2012–13 and 2013–14
Data source: ACT Health, Maternal and Child Health Program, 2012–13, 2013–14 unpublished data.
NOTE: The age group of infants is based upon completed calendar months only — any days over the calendar month are rounded down to the nearest completed month (e.g. 2 months and 20+ days is rounded to 2 months).
22

Children & young people — Outcome 1: Optimal physical health & mental wellbeing
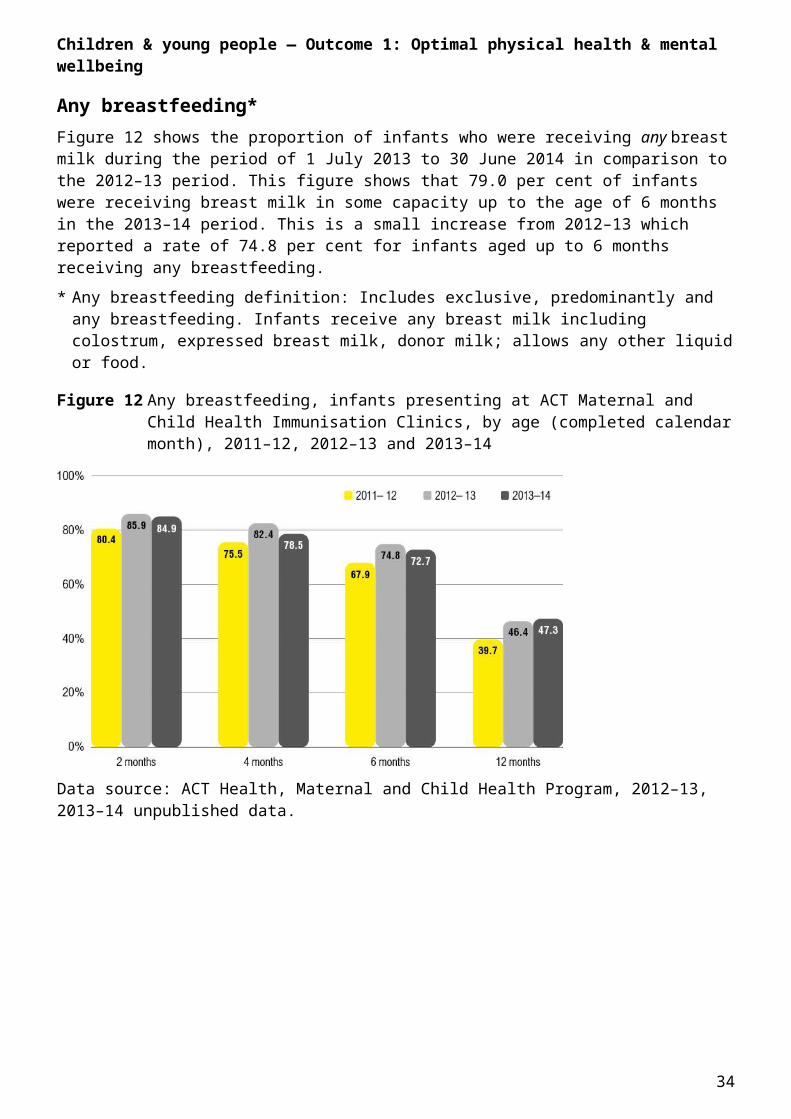
Any breastfeeding*Figure 12 shows the proportion of infants who were receiving any breast milk during the period of 1 July 2013 to 30 June 2014 in comparison to the 2012–13 period. This figure shows that 79.0 per cent of infants were receiving breast milk in some capacity up to the age of 6 months in the 2013–14 period. This is a small increase from 2012–13 which reported a rate of 74.8 per cent for infants aged up to 6 months receiving any breastfeeding.
* Any breastfeeding definition: Includes exclusive, predominantly and any breastfeeding. Infants receive any breast milk including colostrum, expressed breast milk, donor milk; allows any other liquid or food.
Figure 12 Any breastfeeding, infants presenting at ACT Maternal and Child Health Immunisation Clinics, by age (completed calendar month), 2011–12, 2012–13 and 2013–14
Data source: ACT Health, Maternal and Child Health Program, 2012–13, 2013–14 unpublished data.
23

Children & young people — Outcome 1: Optimal physical health & mental wellbeing
Fruit and vegetable consumption
Indicator description The proportion of ACT children and young people reported as meeting the NHMRC’s Dietary Guidelines for fruit and vegetable consumption for children and adolescents in Australia.
What do we measure? Parent-reported fruit and vegetable consumption for children and young people in the ACT aged 2–15 years.
Why is this important? Eating fruit and vegetables is essential for a healthy diet. A diet high in these foods provides protection against a range of chronic diseases including cardiovascular disease, cancer, stroke, cataracts and Type 2 diabetes.
The minimum recommended daily fruit intake according to the NHMRC Dietary guidelines for children and adolescents in Australia is one serve for children aged 4–11 years and three serves for children aged 12–18, depending on their overall diet. The guide does not provide recommendations for children aged 2–3 years, so the recommendations for 4–7 year old children have been applied.13
The minimum recommended daily vegetable intake according to the NHMRC is defined as two serves a day for children aged 4–7 years; three serves a day for children aged 8–11 years and four serves for 12–18 year olds depending on their overall diet. The guide does not provide recommendations for children aged 2–3 years so the recommendations for 4–7 years have been applied for this age group.14
How is the ACT progressing?
There has been a slight, though not significant increase in the proportion of children aged 2–15 years meeting the minimum dietary requirements for fruit consumption. ACT General Health Survey results indicate that in 2011–13, 71.7 per cent were meeting the minimum dietary requirements compared with 69.7 per cent in 2007–10.15
In 2011–13, younger children were significantly more likely (p<0.05) to be meeting the minimum requirements than older children with 95.7 per cent of younger children (2–11 years) eating one or more serves a day (97.3 per cent of males and 94.0 per cent of females) and only 21.2 per cent of 12–15 year olds eating three or more serves a day (25.7 per cent of males and 16.6 per cent of females).
24

Children & young people — Outcome 1: Optimal physical health & mental wellbeing
Table 3 Fruit consumption, serves per day, percentage of children 2–15 years, ACT, 2007–13
2–11 years 12–15 years
Serves 2007–10 2011–13 2007–10 2011–13
Less than 1 serve 3.5 4.3 15.3 8.5
1–2 serves 65.6 66.4 64.7 70.3
3 or more serves 30.9 29.3 20.0 21.2
Total meeting requirements 96.5 95.7 20.0 21.2
Data source: ACTGHS data collection 2007–13.
Notes: Percentages may not add to 100 per cent due to rounding. One serve of fruit is calculated as a medium piece or two small pieces of fruit.
25

Children & young people — Outcome 1: Optimal physical health & mental wellbeing
There has been a slight, though not significant, decrease in the proportion of children aged 2–15 years meeting the minimum recommended dietary guidelines for vegetable consumption. ACT General Health Survey results indicate that in 2011–13, 37.5 per cent of ACT children aged 2–15 years were meeting the minimum recommended dietary guidelines for vegetable consumption compared with 39.7 per cent in 2007–10.
Younger children were significantly more likely (p<0.05) to meet the daily requirements than older children, with 55.5 per cent of 2–7 year olds consuming two or more serves of vegetables (52.1 per cent of males and 58.9 per cent of females); 33.3 per cent of 8–11 year olds (33.3 per cent male and 33.3 per cent female) were eating three or more serves, and 15.8 per cent of 12–15 year olds eating four or more serves (15.1 per cent males and 16.5 per cent of females) (Table 4).
Table 4 Vegetable consumption, serves per day, percentage of children 2–15 years, ACT, 2007–13
2–7 years 8–11 years 12–15 years
Serves 2007–10 2011–13 2007–10 2011–13 2007–10 2011–13
Less than 1 serve 8.4 6.5 7.2 5.0 5.9 4.8
1 serve 30.7 38.0 23.9 25.3 25.8 28.0
2 serves 35.0 31.1 31.2 36.4 32.1 27.9
3 serves 18.2 12.5 22.4 20.5 18.9 23.6
4 or more serves 7.7 11.9 15.4 12.8 17.4 15.8
Total meeting requirements 60.9 55.5 37.8 33.3 17.4 15.8
Data source: ACTGHS data collection 2007–13.
Notes: Percentages may not add to 100 per cent due to rounding. One serve of vegetables is calculated as half a cup of cooked vegetables or one cup of salad vegetables.
26

Children & young people — Outcome 1: Optimal physical health & mental wellbeing
Participation in physical activity
Indicator description The proportion of ACT children and young people who are reported as participating in physical activity outside of school hours.
What do we measure?Parent-reported physical activity participation rates of children and young people in the ACT aged 5–15 years outside of school hours.
Why is this important?The National Physical Activity Guidelines recommend that children and adolescents need at least 60 minutes of moderate (e.g. bike riding, skateboarding, quick walking) to vigorous (e.g. running, ball games) physical activity every day for healthy growth and wellbeing. Children who are sedentary can become overweight or obese and this can affect their health in later life.16
How is the ACT progressing?
Results from the 2011–13 ACT General Health Survey (ACTGHS) show that 21.9 per cent of ACT children (24.3 per cent of males and 19.4 per cent of females) were meeting the National Physical Activity Guidelines by doing more than 60 minutes of physical activity a day. This proportion has not changed significantly since 2007–10 when 22.8 per cent were meeting the guidelines (24.4 per cent of males and 20.9 per cent of females).
The 2011–13 ACTGHS results indicate that less than half (44.7 per cent) of ACT parents could accurately respond when asked how many minutes of physical activity it is recommended children do each day. This is a significant increase from 2007–10, where 29.1 per cent responded correctly. More than one-third (37 per cent) of parents believed the recommended amount of physical activity for children was less than 60 minutes a day, while 18.3 per cent did not know what the recommendations were.
The 2011–13 ACTGHS results indicate that 18.3 per cent of ACT children usually walked to school each day, a slight but not significant decrease from 19.3 per cent in 2007–10. A further 8.9 per cent of ACT children walked part of the way to school in 2011–13.
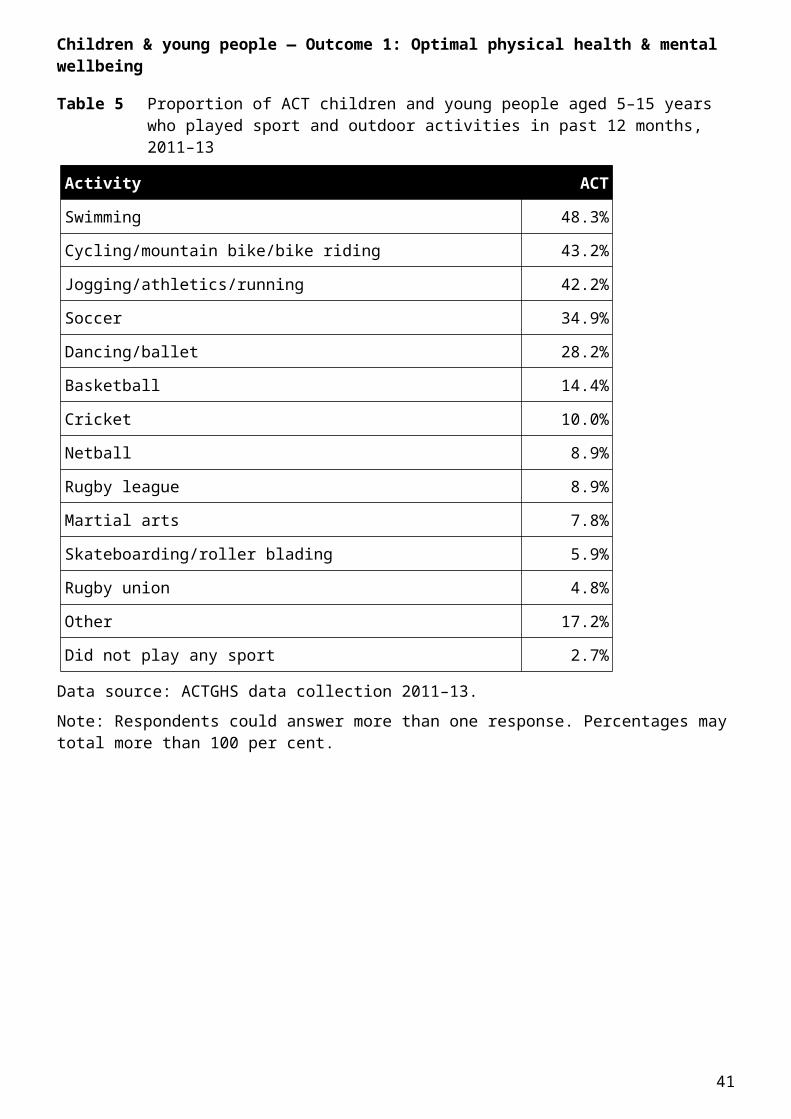
Almost all (97.3 per cent) ACT children participated in a sport and/or outdoor activity over the past 12 months in 2011–13. These are presented in Table 5.
27

Children & young people — Outcome 1: Optimal physical health & mental wellbeing
Table 5 Proportion of ACT children and young people aged 5–15 years who played sport and outdoor activities in past 12 months, 2011–13
Activity ACT
Swimming 48.3%
Cycling/mountain bike/bike riding 43.2%
Jogging/athletics/running 42.2%
Soccer 34.9%
Dancing/ballet 28.2%
Basketball 14.4%
Cricket 10.0%
Netball 8.9%
Rugby league 8.9%
Martial arts 7.8%
Skateboarding/roller blading 5.9%
Rugby union 4.8%
Other 17.2%
Did not play any sport 2.7%
Data source: ACTGHS data collection 2011–13.
Note: Respondents could answer more than one response. Percentages may total more than 100 per cent.
28

Children & young people — Outcome 1: Optimal physical health & mental wellbeing
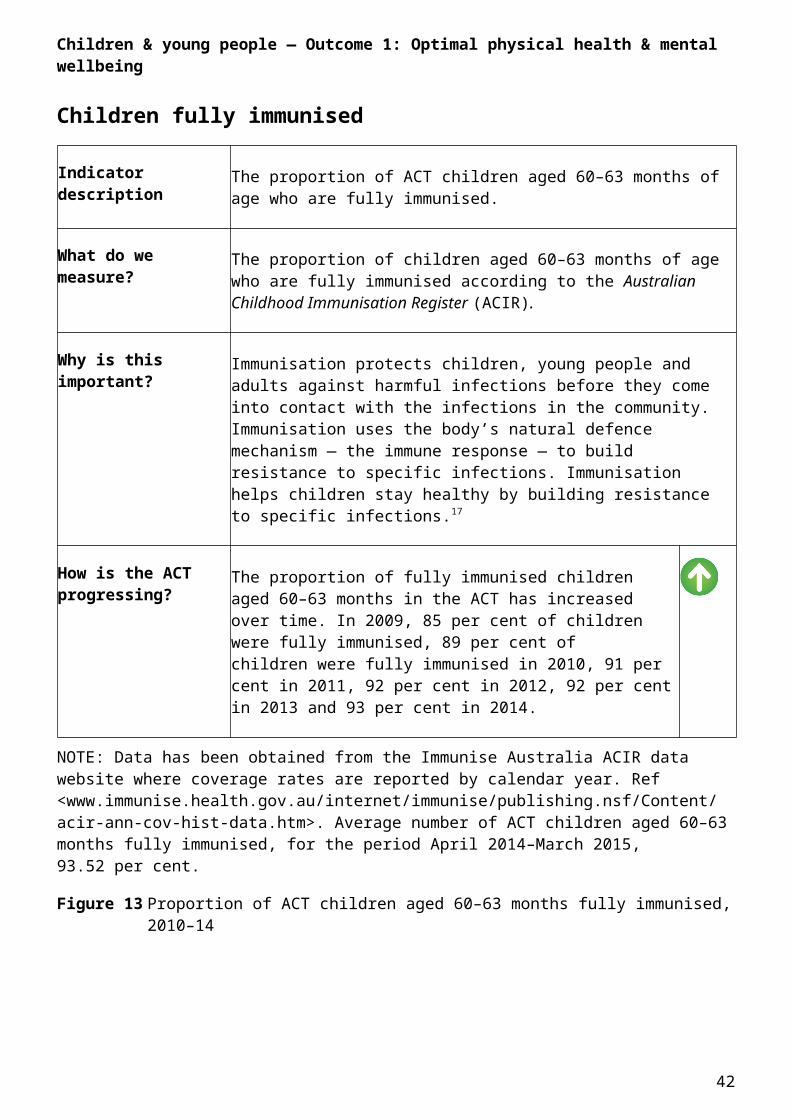
Children fully immunised
Indicator description The proportion of ACT children aged 60–63 months of age who are fully immunised.
What do we measure? The proportion of children aged 60–63 months of age who are fully immunised according to the Australian Childhood Immunisation Register (ACIR).
Why is this important? Immunisation protects children, young people and adults against harmful infections before they come into contact with the infections in the community. Immunisation uses the body’s natural defence mechanism — the immune response — to build resistance to specific infections. Immunisation helps children stay healthy by building resistance to specific infections.17
How is the ACT progressing?
The proportion of fully immunised children aged 60–63 months in the ACT has increased over time. In 2009, 85 per cent of children were fully immunised, 89 per cent of children were fully immunised in 2010, 91 per cent in 2011, 92 per cent in 2012, 92 per cent in 2013 and 93 per cent in 2014.
NOTE: Data has been obtained from the Immunise Australia ACIR data website where coverage rates are reported by calendar year. Ref <www.immunise.health.gov.au/internet/immunise/publishing.nsf/Content/acir-ann-cov-hist-data.htm>. Average number of ACT children aged 60–63 months fully immunised, for the period April 2014–March 2015, 93.52 per cent.
Figure 13 Proportion of ACT children aged 60–63 months fully immunised, 2010–14
29

Children & young people — Outcome 1: Optimal physical health & mental wellbeing
Figure 14 Proportion of children aged 60–63 months assessed as fully immunised by state or territory. The information below is from one quarterly report (date of processing 31 March 2015)
Figure 15 Proportion of ACT Aboriginal and Torres Strait Islander children aged 60–63 months fully immunised, 2010–14
The very low numbers of Aboriginal and Torres Strait Islander children in the ACT means that ACT Aboriginal and Torres Strait Islander coverage data should be read with caution, as the immunisation coverage rates can fluctuate greatly. Coverage rates can vary dramatically between cohorts and between reporting periods.
Figure 16 Proportion of Aboriginal and Torres Strait Islander children aged 60–63 months assessed as fully immunised by state or territory. The information below is from one quarterly report (date of processing 31 March 2015)
30
Children & young people — Outcome 1: Optimal physical health & mental wellbeing
Table 6 The National Immunisation Program (NIP) — current schedule
Birth Hepatitis B (hepB) 1
2 months Hepatitis B, diphtheria, tetanus, acellular pertussis (whooping cough), Haemophilus influenzae type b, inactivated poliomyelitis (polio) (hepB-DTPa-Hib-IPV)
Pneumococcal conjugate (13vPCV) Rotavirus
4 months Hepatitis B, diphtheria, tetanus, acellular pertussis (whooping cough), Haemophilus influenzae type b, inactivated poliomyelitis (polio) (hepB-DTPa-Hib-IPV)
Pneumococcal conjugate (13vPCV) Rotavirus
6 months Hepatitis B, diphtheria, tetanus, acellular pertussis (whooping cough), Haemophilus influenzae type b, inactivated poliomyelitis (polio) (hepB-DTPa-Hib-IPV)
Pneumococcal conjugate (13vPCV) Rotavirus 2
12 months Haemophilus influenzae type b and meningococcal C (Hib-MenC) Measles, mumps and rubella (MMR)
18 months Measles, mumps, rubella and varicella (chickenpox) (MMRV)
4 years Diphtheria, tetanus, acellular pertussis (whooping cough) and inactivated poliomyelitis (polio) (DTPa-IPV)
Measles, mumps and rubella (MMR) (to be given only if MMRV vaccine was not given at 18 months)
School program
10–15 years Varicella (chickenpox) 3
Human papillomavirus (HPV) 4
Diphtheria, tetanus and acellular pertussis (whooping cough) (dTpa)
Notes:
1 Hepatitis B: vaccine should be given to all infants as soon as practicable after birth. The greatest benefit is if given within 24 hours, and must be given within 7 days.
2 Rotavirus vaccine: third dose of vaccine is dependent on vaccine brand used. Contact your state or territory health department for details.
3 Varicella vaccine: contact your state or territory health department for details on the school grade eligible for vaccination.
4 HPV vaccine: is for all adolescents aged between 12 and 13 years. Contact your state or territory health department for details on the school grade eligible for vaccination.
31

Children & young people — Outcome 1: Optimal physical health & mental wellbeing
Leading causes of hospitalisations
Indicator description The leading causes of hospitalisation for ACT children.
What do we measure? The top 25 causes of hospitalisation for Canberra residents aged 14 or under at ACT public hospitals (excluding episodes related to births).
Why is this important? This indicator provides an indication of the leading causes of hospitalisation and enables health planners to ensure that health promotion, early intervention and our public hospital services are able to respond effectively to major changes in the demand for hospital services for children.
How is the ACT progressing?
The main causes of hospitalisation for children are injury and infectious diseases.
The top 25 diagnoses for the hospitalisation of children, account for more than half of all hospital episodes for people aged 14 years or younger at ACT public hospitals.
In 2013–14, there were 4,024 inpatient hospital episodes recorded at ACT public hospitals for Canberra residents aged 14 years or younger. This is consistent with the number of inpatient episodes recorded in previous years, with 4,143 in 2012–13, 4,167 in 2011–12, and 4,024 in 2010–11.
The major causes of hospitalisation for children in 2013–14 were other factors influencing health status generally relating to social reasons (316 episodes), followed by bronchitis and asthma (241 episodes) and injury to the forearm, wrist, hand or foot (206 episodes). The top three major causes of hospitalisation for ACT children have remained consistent over the past two years.
32

Children & young people — Outcome 1: Optimal physical health & mental wellbeing
Table 7 ACT Public Hospitals, top 25 diagnoses for hospital admission by volume, persons aged 14 years or under, 2013–14
Diagnosis Separations
Other factors influencing health status 316
Bronchitis and asthma 241
Injuries to forearm, wrist, hand or foot 241
Otitis media and Upper Respiratory Infection 138
Abdominal pain or mesenteric adenitis 134
Respiratory infection or inflammation 123
Reticuloendothelial and immunity disorders without complications or malignancy 123
Chemotherapy 106
Tonsillectomy or adenoidectomy 99
Viral illness 97
Seizure 93
Other digestive system diagnoses, without complications 88
Oesophagus or gastro related diagnoses 84
Dental extractions and restorations 79
Whooping cough and acute bronchitis 74
Respiratory signs and symptoms 66
Miscellaneous metabolic disorders 63
Red blood cell disorders 63
Cellulitis 60
Testes procedures 59
Myringotomy and tube insertion 56
Procedures on the humerous, tibia, fibula or ankle, without complications 56
Kidney and urinary tract infections, without complications 54
Injuries 53
Other digestive system diagnoses 51
Data source: ACT Health, Admitted patient care dataset, hospital separations for persons aged 14 years or younger 2013–14 (excludes admissions for births, ACT residents only).
33
Children & young people — Outcome 1: Optimal physical health & mental wellbeing
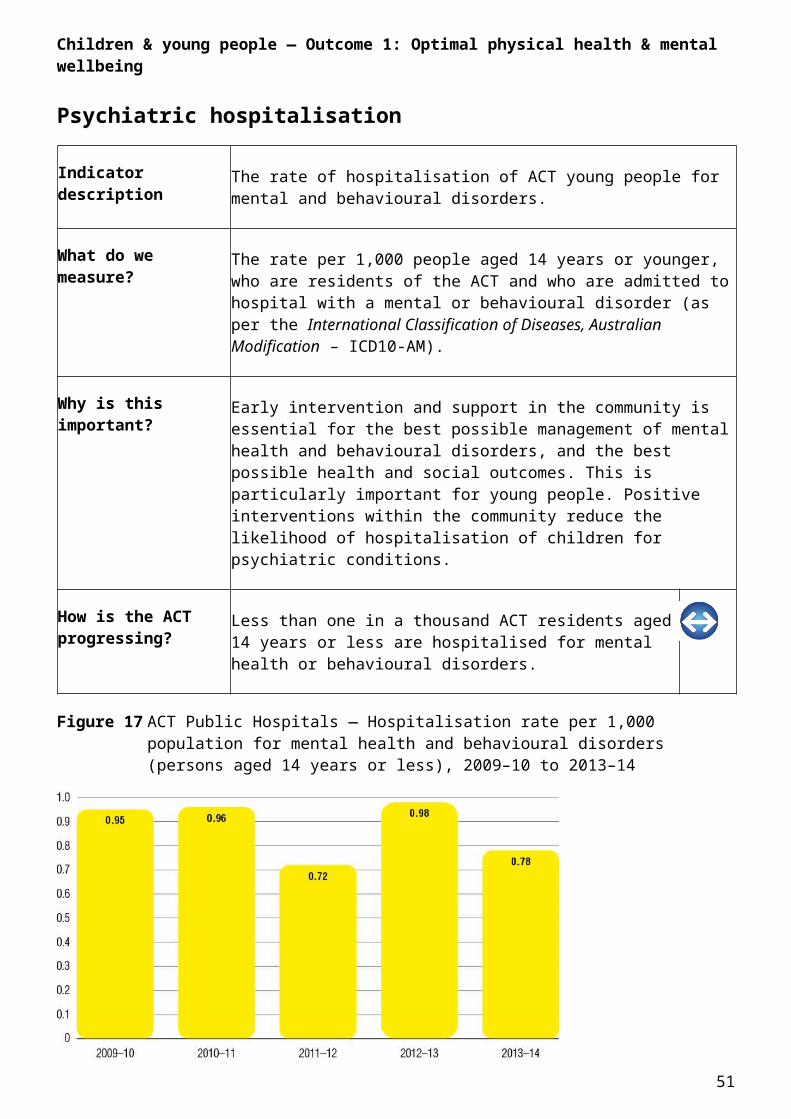
Psychiatric hospitalisation
Indicator description The rate of hospitalisation of ACT young people for mental and behavioural disorders.
What do we measure? The rate per 1,000 people aged 14 years or younger, who are residents of the ACT and who are admitted to hospital with a mental or behavioural disorder (as per the International Classification of Diseases, Australian Modification – ICD10-AM).
Why is this important? Early intervention and support in the community is essential for the best possible management of mental health and behavioural disorders, and the best possible health and social outcomes. This is particularly important for young people. Positive interventions within the community reduce the likelihood of hospitalisation of children for psychiatric conditions.
How is the ACT progressing?
Less than one in a thousand ACT residents aged 14 years or less are hospitalised for mental health or behavioural disorders.
Figure 17 ACT Public Hospitals — Hospitalisation rate per 1,000 population for mental health and behavioural disorders (persons aged 14 years or less), 2009–10 to 2013–14
Note: The small number of people aged 14 years or younger hospitalised for mental health or behavioural disorders can result in fluctuations between years.
Data source: ABS for Resident ACT population for people aged 14 years and younger by year and the ACT Health Admitted Patient Care dataset.
34

Children & young people — Outcome 1: Optimal physical health & mental wellbeing
Dental health
Indicator description The mean number of decayed, missing or filled teeth (DMFT) among primary school children aged 12 years.
What do we measure? The number of teeth decayed, missing or extracted of children aged 12 years visiting ACT Health public dental services. The number of decayed, missing or filled teeth is expressed as the DMFT (for permanent teeth).
Why is this important? This indicator provides an indication of the effectiveness of dental prevention, early intervention and treatment services.
How is the ACT progressing?
The ACT Health mean DMFT figure for 2014 is 0.59 at 12 years. This represents an increase of 0.02 when compared to 2013.
This figure is representative of ACT Health clients only.
The mean DMFT is lower, when compared to the figures available from the most recent Child Dental Health Survey (2007). This survey indicated that the mean DMFT for ACT children aged 12 was 0.80. The mean DMFT for children aged 12 years nationally was 0.95.
Data source: ACT Health Dental Program client database Titanium and the Australian Institute of Health and Welfare, Dental Health of Australia’s teenagers and pre-teen children: the Child Dental Health Survey, Australia 2007.
35

Children & young people — Outcome 2: Optimal development in the early years
Children entering school with the basic skills for life and learning
Indicator description The proportion of ACT children who are developmentally vulnerable as shown by the Australian Early Development Census (AEDC).
What do we measure? The proportion of kindergarten children who are developmentally on track, developmentally at risk and developmentally vulnerable across five domains of early childhood development: Physical health and wellbeing; Social competence; Emotional maturity; Language and cognitive skills; and Communication skills and general knowledge. The AEDC was formerly known as the Australian Early Development Index (AEDI). The AEDC is conducted every three years. The 2015 census is the third collection as data was collected in 2009 and 2012. The 2015 AEDC results are expected by mid-2016.
Why is this important? Successful transition to school is greatly shaped by children’s attainment of the basic skills for life and learning in the early years18. Children’s development in the years before school has an impact on both their ability to be ready to learn at school entry and their social and economic outcomes over the course of their lifetime. The quality of the relationships, environments and experiences in the early stages of development are crucial in shaping children’s health, wellbeing and development outcomes.
The AEDC plays a vital role in strengthening our early childhood evidence base. Results from the AEDC help communities, governments and policy-makers pinpoint the types of services, resources and supports that young children and their families need to ensure children have the best possible start in life.
How is the ACT progressing?
The 2012 results indicated that overall the majority of children in the ACT are developmentally ‘on track’ and doing well.
The proportion of male children (28.1 per cent) in the ACT who are developmentally vulnerable on one or more domain/s was higher than that of females (15.5 per cent). The proportion of ACT children with a language background other than English that are developmentally vulnerable on one or more domain/s (28.3 per cent) was higher than children with an English speaking background (20.5 per cent).
36

Children & young people — Outcome 2: Optimal development in the early years
Table 8 Characteristics of the children surveyed both in the ACT and Australia, 2012
Selected characteristic ACT Australia
Children surveyed living in the ACT 5,106 289,973
Average age of children 5 years 8 months 5 years 7 months
Teachers involved in completing the checklist 284 16,425
Schools where checklists were completed 106 7,417
Children who are Aboriginal and Torres Strait Islander 117 (2.4%) 15,490 (5.3%)
Children with a language background other than English 962 (19.6%) 55,489 (19.1%)
Children born outside Australia 502 21,698
Children reported as having special needs 238 14,173
Children identified by teachers as requiring further assessment 394 29,628
Data source: 2012 Australian Early Development Index Results for the ACT, ACT Government, Canberra.
Note: Children with special needs are those who have chronic medical, physical or intellectual disabilities that require special assistance. Information about children with special needs is not included in the census results because of the already identified substantial developmental needs of this group.
37

Children & young people — Outcome 2: Optimal development in the early years
National and regional comparisons of developmental vulnerability
How is the ACT progressing?
The proportion of ACT children developmentally vulnerable on one or more domain/s was the same as their Australian peers (22.0 per cent), and 9.8 per cent of children were developmentally vulnerable on two or more domains, compared to 10.8 per cent nationally. The proportion of developmental vulnerability in the ACT has slightly decreased between 2009 and 2012.
Figure 18 Developmental vulnerability: National and regional comparisons, AEDI, 2009 and 2012
Data source for Figures 18–19: 2012 Australian Early Development Index Results for the ACT, ACT Government, Canberra.
The proportion of children developmentally vulnerable varied across the ACT communities. Localities with the highest proportions of children developmentally vulnerable on one or more domain/s were Tuggeranong (24.6 per cent), Gungahlin (22.3 per cent) and Weston Creek (22.0 per cent). Communities with the lowest proportion of children developmentally vulnerable on one or more domain/s were North Canberra (17.7 per cent) and South Canberra (19.5 per cent).
38

Children & young people — Outcome 2: Optimal development in the early years
Figure 19 The proportion of children developmentally vulnerable on one or more domain/s of the AEDI in each region within the ACT, 2012
39

Children & young people — Outcome 2: Optimal development in the early years
Developmental vulnerability by domain
How is the ACT progressing?
Between 2009 and 2012, the ACT experienced an improvement in four out of the five developmental domains: Social competence; Emotional maturity; Language and cognitive skills; and Communication skills and general knowledge. On each of these four domains, the ACT compared favourably to the rest of Australia. In particular, children in the ACT were least likely to be developmentally vulnerable on the Language and cognitive skills domain (3.9 per cent).
However, on the Physical health and wellbeing domain, 10.6 per cent of children in the ACT were developmentally vulnerable — a slight increase from 2009 (9.4 per cent). The 2012 ACT results were also slightly higher than the national result (9.3 per cent).
Table 9 The proportion of Australian and ACT children developmentally on track, at risk and vulnerable on each domain of the AEDI, 2012
Domain Developmentally on track (%)
Developmentally at risk (%)
Developmentally vulnerable (%)
Australia ACT Australia ACT Australia ACT
Physical health and wellbeing 77.3 72.5 13.4 16.9 9.3 10.6
Social competence 76.5 75.5 14.3 15.9 9.3 8.6
Emotional maturity 78.1 79.0 14.2 13.8 7.6 7.2
Language and cognitive skills 82.6 86.5 10.6 9.5 6.8 3.9
Communication skills and general knowledge
74.7 73.5 16.3 18.5 9.0 8.1
Data source for Tables 9–10: 2012 Australian Early Development Index Results for the ACT, ACT Government, Canberra.
40
Children & young people — Outcome 2: Optimal development in the early years
Developmental vulnerability for Aboriginal and Torres Strait Islander children
How is the ACT progressing?
Aboriginal and Torres Strait Islander children in the ACT experienced an increase in developmental vulnerability between 2009 and 2012, from 37.0 per cent in 2009 to 45.4 per cent in 2012. Over this same time, there was a national decrease in the proportion of Aboriginal and Torres Strait Islander children developmentally vulnerable in Australia from 47.4 per cent to 43.2 per cent.
Table 10 Comparison of Aboriginal and Torres Strait Islander children developmentally vulnerable on one or more domain/s, 2009–12
2009 2012
ACT Australia ACT Australia
Aboriginal and Torres Strait Islander 37.0% 47.4% 45.4% 43.2%
Non-Aboriginal and Torres Strait Islander 21.8% 22.4% 21.5% 20.9%
Developmental vulnerability for children with a language background other than English
How is the ACT progressing?
Children with a language background other than English displayed a decrease in developmental vulnerability on one or more domain/s between 2009 (32 per cent) and 2012 (28.3 per cent). Over this same period there was a national decrease in the proportion of children with a language background other than English developmentally vulnerable in Australia from 32.2 per cent in 2009 to 29.5 per cent in 2012.
Table 11 Comparison of children with a language background other than English developmentally vulnerable on one or more domain/s, ACT and Australia, 2009–12
2009 2012
ACT Australia ACT Australia
Children with a language background other than English
32.0% 32.2% 28.3% 29.5%
Children with an English speaking background 20.2% 21.7% 20.5% 20.2%
Data source for Tables 11–12: 2012 Australian Early Development Index Results for the ACT, ACT Government, Canberra.
41
Children & young people — Outcome 2: Optimal development in the early years
Developmental vulnerability for female and male children
How is the ACT progressing?
The proportion of male children both in the ACT and nationally who are developmentally vulnerable on one or more domain/s is higher than their female counterparts. There was a slight decrease in the percentage of ACT males developmentally vulnerable on one or more domain/s between 2009 (29 per cent) and 2012 (28.1 per cent). A decrease was also seen nationally for males in the same period (30.2 per cent in 2009 and 28.2 per cent in 2012).
Over this period there was a decrease in the percentage of females developmentally vulnerable on one or more domain/s at the national level from 16.8 per cent in 2009 to 15.7 per cent in 2012. A slight increase in the percentage of ACT females developmentally vulnerable on one or more domain/s was seen for this period (15 per cent in 2009 and 15.5 per cent in 2012).
Table 12 Children developmentally vulnerable, by sex, on one or more domain/s, ACT and Australia, 2009–12
2009 2012
ACT Australia ACT Australia
Female 15.0% 16.8% 15.5% 15.7%
Male 29.0% 30.2% 28.1% 28.2%
42

Children & young people — Outcome 2: Optimal development in the early years
Children enrolled in preschool
Indicator description The proportion of children enrolled in a preschool program in the ACT.
What do we measure? The proportion of children, as a percentage of the estimated resident population, enrolled in an early childhood education program in the year before full-time schooling. Also presented is the proportion of Aboriginal and Torres Strait Islander children in the ACT who were enrolled in an early childhood education program in the year before full-time schooling.
Why is this important? Early childhood education is one of the important learning experiences for children. It provides a rich environment to facilitate the development of children’s language, social, emotional, motor, cognitive and independence skills. It also assists with children’s school readiness and transition to full-time schooling. Early school experiences can have a lasting impact on a person’s attitude to education and training and confidence in their learning abilities.
How is the ACT progressing?
In August 2014, a total of 6,287 children aged 4 or 5 years were enrolled in the year before full-time schooling in at least one quality early childhood education program provided through public schools, Catholic schools, independent schools and long day care centres (LDC), representing 120.6 per cent of the estimated preschool age population.
There were 106.9 per cent of Aboriginal and Torres Strait Islander children enrolled in an early childhood education program in public schools, Catholic schools and independent schools including LDCs as at August 2014.
These proportions are greater than 100 per cent due to the population of children being an estimate, and also due to enrolments of children living in New South Wales.
Data sources: ABS, Preschool Education, Australia, 2014, cat. no. 4240.0
Australian Demographic Statistics Table 58. Estimated resident population by single year of age, Australian Capital Territory (cat. no. 3101.0) ABS email dated 3 March 2015
Estimates and Projections, Aboriginal and Torres Strait Islander Australians, 2001-2026, cat. no. 3238.0.
43

Children & young people — Outcome 3: Educational engagement & success
ACT public primary and high school attendance
Indicator description Student attendance rate is the number of actual full-time equivalent student days attended by full-time students as a percentage of the total number of possible student days attended in the first semester of the school year.
What do we measure? Attendance is analysed for the first semester of the school year.
Attendance data are collected through the electronic management system at the school. For primary schools, teachers record student attendance in the morning and afternoon. Absence data are aggregated at the end of each term and entered in the school management system. Terms 1 and 2 data are analysed at the end of the first semester for national and local reporting purposes.
Why is this important? Attendance at school is essential for learning and for enabling students to benefit from the full range of educational programs offered at school. Attendance is an accepted indicator of student engagement.
How is the ACT progressing?
Attendance rates of years 1 to 10 students have been maintained over the period 2009–14. In 2014, attendance for ACT public school students in years 1 to 10 was 91.5 per cent, compared with 92.1 per cent recorded in 2013. Aboriginal and Torres Strait Islander student school attendance in the ACT was 83.6 per cent in 2014, compared with 85.1 per cent in 2013.
In 2014, the attendance rate of male students in the ACT was 91.6 per cent, while the figure for female students was 91.3 per cent. The development and implementation of national standards for student attendance data reporting will enable consistent and comparable reporting of attendance rates for students in years 1 to 10 across jurisdictions and sectors.
Table 13 Attendance rate (%) at ACT public primary and high schools, by grade year, 2009–14
Year 1 Year 2
Year 3
Year 4
Year 5
Year 6
Year 7
Year 8
Year 9
Year 10
2014 93 93 94 93 93 93 91 89 87 86
2013 93 94 94 94 94 93 92 90 88 88
2012 93 93 93 93 93 93 92 89 88 87
2011 93 93 94 93 93 93 91 89 87 86
2010 94 94 94 94 94 93 92 89 87 87
2009 94 94 94 94 93 93 91 88 87 87
44
Children & young people — Outcome 3: Educational engagement & success
Data source: ACT Education and Training Directorate 2014.
Students achieving at or above the national minimum standard in literacy and numeracy
Indicator description The proportion of ACT students in years 3, 5, 7 and 9 achieving at or above the national minimum standard in literacy (reading and writing) and numeracy.
What do we measure? The results are based on the number of students at each year level who participated in the National Assessment Program: Literacy and Numeracy (NAPLAN) testing each year. The proportion is calculated as the percentage of total participants who achieved at or above the national minimum standard. Also included is the proportion of Aboriginal and Torres Strait Islander students in the ACT achieving at or above the national minimum standard in literacy and numeracy.
Why is this important? Literacy and numeracy skills acquired in the schooling years are the building blocks for further education, social development and employment. The ability to read, write and perform mathematics is essential in day-to-day life and for educational opportunities and employment prospects.
How is the ACT progressing?
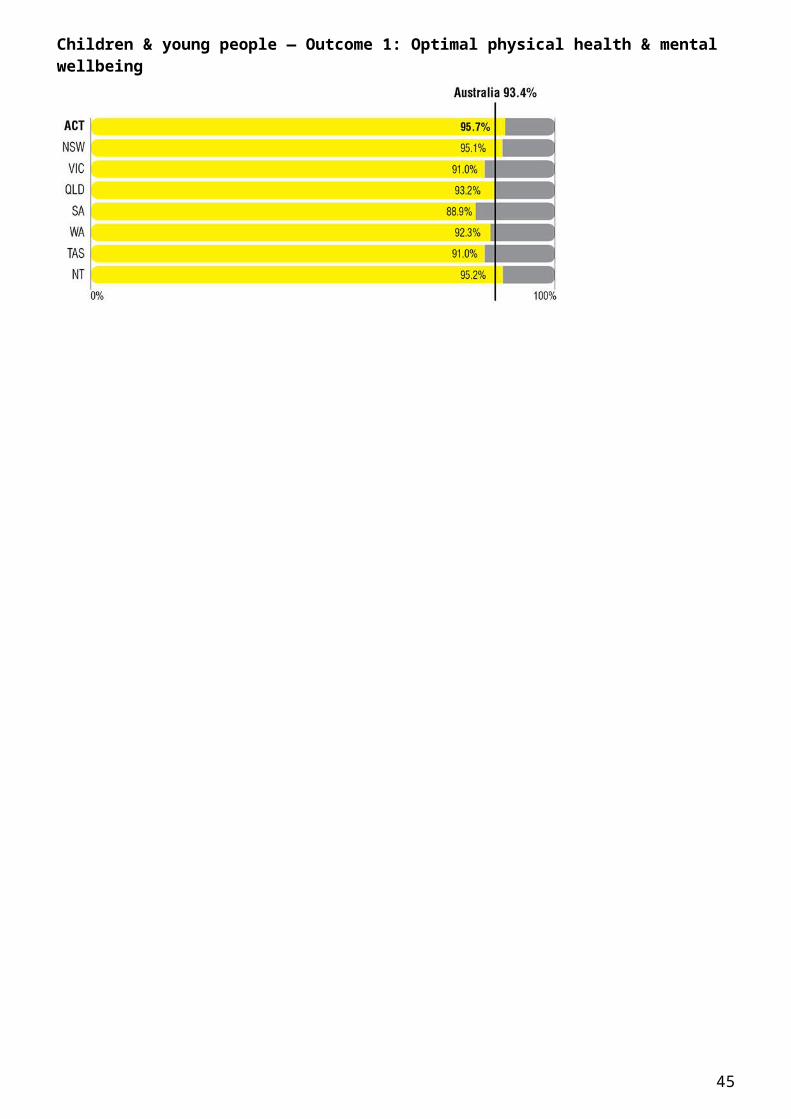
The ACT has consistently performed better than the national average in all subjects across all school years. ACT mean scores for reading and numeracy were highest or equal highest in the country. Higher percentages of ACT students achieved at or above the national minimum standard for numeracy than most other jurisdictions.
45

Children & young people — Outcome 3: Educational engagement & success
Table 14 The proportion of year 3, 5, 7 and 9 students at or above the national minimum standard in reading, writing and numeracy in the ACT and Australia, NAPLAN testing, 2008–14
ACT Australia
2008 2009 2010 2011 2012 2013 2014 2008 2009 2010 2011 2012 2013 2014
Year 3 Reading 94.4 94.7 95.7 95.6 96.0 96.1 95.4 92.1 93.7 93.9 93.8 93.6 95.3 93.5
Writing* 96.3 95.9 96.6 96.2 96.4 95.5 94.9 95.4 95.7 95.5 95.3 95.3 95.0 93.8
Numeracy 96.4 94.8 96.6 96.5 96.5 96.6 96.5 95.0 94.0 94.3 95.6 93.9 95.7 94.6
Year 5 Reading 94.8 94.0 94.2 94.5 94.9 97.0 95.6 91.0 91.7 91.3 91.5 91.6 96.1 92.9
Writing* 94.9 93.9 94.8 93.7 93.6 94.1 92.8 92.6 93.0 93.1 92.5 92.1 91.7 90.2
Numeracy 94.9 95.5 95.3 95.4 95.8 95.0 95.9 92.7 94.2 93.7 94.4 93.3 93.4 93.5
Year 7 Reading 96.3 95.5 96.9 96.8 95.7 95.9 96.5 94.2 94.0 94.9 94.7 94.1 94.2 94.9
Writing* 93.4 93.2 94.6 91.8 89.8 90.7 90.7 91.8 92.5 92.6 91.1 89.9 89.3 88.5
Numeracy 97.1 95.7 96.8 95.7 95.0 95.8 96.3 95.4 94.8 95.1 94.5 93.8 95.0 95.1
Year 9 Reading 96.6 94.1 93.7 94.4 94.7 96.0 93.9 92.9 92.2 90.8 92.4 91.4 93.4 92.1
Writing* 88.9 89.4 89.0 85.5 83.4 86.5 83.8 87.2 87.8 87.2 84.8 81.7 82.6 81.8
Numeracy 96.6 95.4 94.7 94.6 95.5 92.9 94.9 93.6 95.0 93.1 93.0 93.7 90.6 94.1
*A new persuasive writing style was introduced in 2011. The writing results for 2011, 2012 and 2013 and 2014 should not be directly compared to earlier years. ACT females had a higher proportion than males at or above national minimum standards in reading, writing and numeracy in 2014 in all four year levels which reflects the national performance for males and females.
46

Children & young people — Outcome 3: Educational engagement & success
Table 15 Proportion of students at or above national minimum standard (%) by sex in the ACT and Australia, NAPLAN testing, 2014
Year 3 Year 5 Year 7 Year 9
ACT Australia ACT Australia ACT Australia ACT Australia
Reading Male 94.4 92.0 94.8 91.2 95.4 93.5 92.0 90.1
Female 96.5 95.1 96.6 94.7 97.6 96.3 95.9 94.2
Writing Male 93.3 91.6 90.1 86.6 87.0 84.0 77.2 75.3
Female 96.5 96.1 95.7 94.1 94.4 93.2 90.6 88.6
Numeracy Male 96.3 94.2 95.6 93.1 95.8 94.8 94.6 94.0
Female 96.6 95.1 96.1 93.8 96.7 95.5 95.2 94.3
Data source for Tables 14–15: National Assessment Program, Literacy and Numeracy, Achievement in Reading, Writing, Language Conventions and Numeracy, National Report 2014.
47

Children & young people — Outcome 3: Educational engagement & success
Literacy and numeracy for Aboriginal and Torres Strait Islander students
How is the ACT progressing?
In 2014, as in previous years, the proportion of Aboriginal and Torres Strait Islander students in the ACT who were achieving at or above the national minimum standard was below the proportion for non-Aboriginal and Torres Strait Islander students in the ACT. This was the case across all jurisdictions.
When considering only Aboriginal and Torres Strait Islander students, the proportion of students in the ACT achieving at or above the national minimum standard in reading, writing and numeracy continued to be higher than students nationally across years 3, 5, 7 and 9.
Table 16 The proportion of Aboriginal and Torres Strait Islander year 3, 5, 7 and 9 students at or above the national minimum standard in reading, writing and numeracy in the ACT and Australia, 2011–14
ACT Australia
2011 2012 2013 2014 2011 2012 2013 2014
Year 3 Reading 86.8 85.7 87.6 83.4 76.3 74.2 81.5 74.7
Writing 90.5 88.4 90.2 86.7 79.9 78.3 78.9 75.8
Numeracy 88.9 84.0 91.4 88.1 83.6 72.7 81.6 78.2
Year 5 Reading 86.0 80.4 93.7 83.1 66.4 64.7 83.3 70.3
Writing 87.0 74.3 83.6 73.5 68.9 66.3 65.8 63.3
Numeracy 86.0 81.5 87.1 84.4 75.2 69.2 73.0 71.1
Year 7 Reading 86.1 84.1 90.9 83.1 77.1 75.4 73.2 77.1
Writing 69.3 71.9 78.3 66.9 66.9 63.7 61.4 59.3
Numeracy 79.6 81.9 90.0 85.1 76.5 74.4 78.1 79.5
Year 9 Reading 89.0 82.4 81.0 79.4 71.9 67.2 73.9 71.2
Writing 62.7 63.9 59.8 57.5 55.0 48.8 51.2 49.4
Numeracy 83.0 86.8 70.9 82.8 72.0 74.2 65.7 76.2
48

Children & young people — Outcome 3: Educational engagement & success
Table 17 The proportion of non-Aboriginal and Torres Strait Islander year 3, 5, 7 and 9 students at or above the national minimum standard in reading, writing and numeracy in the ACT and Australia, 2011–14
ACT Australia
2011 2012 2013 2014 2011 2012 2013 2014
Year 3 Reading 95.8 96.3 96.4 95.8 94.9 94.7 96.2 94.7
Writing 96.3 96.6 95.6 95.1 96.2 96.4 96.0 94.9
Numeracy 96.6 96.8 96.7 96.7 96.4 95.1 96.6 95.7
Year 5 Reading 94.7 95.3 97.1 96.1 92.9 93.1 96.9 94.2
Writing 93.9 94.1 94.4 93.5 93.9 93.6 93.3 91.9
Numeracy 95.6 96.2 95.2 96.3 95.5 94.6 94.6 94.8
Year 7 Reading 97.1 96.0 96.0 96.8 95.7 95.1 95.4 95.9
Writing 92.4 90.2 91.1 91.4 92.6 91.4 90.9 90.2
Numeracy 96.1 95.4 96.0 96.6 95.5 94.9 96.0 96.1
Year 9 Reading 94.6 94.9 96.4 94.3 93.5 92.7 94.5 93.3
Writing 86.1 83.8 87.3 84.7 86.4 83.4 84.4 83.6
Numeracy 94.9 95.7 93.6 95.3 94.1 94.7 92.0 95.2
Data source for Tables 16–17: National Assessment Program, Literacy and Numeracy, Achievement in Reading, Writing, Language Conventions and Numeracy, National Report for 2011, 2012, 2013 and 2014.
49

Children & young people — Outcome 3: Educational engagement & success
Year 10–12 apparent retention
Indicator description The proportion of ACT year 10 students continuing to year 12.
What do we measure? The number of full-time equivalent year 12 students enrolled in a given year as a proportion of students enrolled in year 10 two years earlier. Also measured is the year 10–12 apparent retention rate of full-time Aboriginal and Torres Strait Islander students.
Why is this important? Higher education levels are associated with increased opportunities for employment, improving future income, increased standards of living and access to health care. Completing school provides many opportunities to improve both economic and social wellbeing. As the number of low-skilled jobs in the employment market decreases, the importance of educational qualifications increases.
Other factors being constant, a higher or increasing apparent retention rate suggests that a large number of students are continuing to participate in school education which is likely to result in improved educational and employment outcomes.
How is the ACT progressing?
The year 10–12 apparent retention rate for all ACT students increased between 2008 and 2014, and is higher than national results.
From 2008 to 2014, the ACT year 10–12 apparent retention rate continued to be at least 10 percentage points higher than the Australian year 10–12 apparent retention rate.
The ACT year 10–12 apparent retention rate of full-time Aboriginal and Torres Strait Islander students increased from 59.7 per cent in 2008 to 79.6 per cent in 2014. This increase is consistent with the national result where the year 10–12 apparent retention rate of full-time Aboriginal and Torres Strait Islander students was 51.7 per cent in 2008, increasing to 60.4 per cent in 2014.
Calculating the retention rate is inherently difficult, as it does not take into account students who repeat, move interstate, and transfer between schools or school sectors, and students who have left school previously but return to continue their school education.
50
Children & young people — Outcome 3: Educational engagement & success
Figure 20 Apparent retention rates year 10 to year 12, ACT and Australia, 2008–14
Data source: ABS 4221.0 Schools, Australia 2014, Table 64a — Apparent Retention Rates (ARR) 1999–2014.
51

Children & young people — Outcome 3: Educational engagement & success
Transition from school to further education or work
Indicator description Proportion of ACT year 12 graduates employed or studying six months after completing an ACT Year 12 Certificate.
What do we measure? The data for this indicator is obtained from the annual survey of students who completed an ACT Year 12 Certificate in the reference year. The survey excludes full fee paying international students but includes students who were awarded a Year 12 Certificate from the Canberra Institute of Technology.The indicator is calculated by dividing the estimated number of graduates who were employed or studying six months after graduation by the total number of graduates in the target population responding in the survey.Studying includes graduates who were actively undertaking some study in the year following graduation, including those attending university, technical and further education (TAFE), undertaking an apprenticeship or repeating year 12.Employed includes graduates who are participating in any type of work including full-time, casual, temporary or part-time work, if it was for one hour or more over a two-week period.
Why is this important? The ACT Education and Training Directorate is committed to providing learning pathways for students which result in an educated and skilled workforce that meets the present and future needs of the ACT and region.The destination of students after leaving school remains an important piece of information contributing to the ongoing development and provision of appropriate education and training options into the future.
How is the ACT progressing?
Of those students who completed year 12 in the ACT in 2013, 91.9 per cent reported that they were employed or studying in 2014. Although slightly lower, this was not significantly different from the 93.4 per cent reported for the 2012 graduates. Data relating to Aboriginal and Torres Strait Islander students is not available for this indicator due to the small number of Aboriginal and Torres Strait Islander students in the survey.The percentage of ACT year 12 graduates employed or studying six months after completing an ACT Year 12 Certificate is provided for the last five years in Table 18. For 2013 year 12 graduates, the ACT results for this indicator were similar to the results for other states and territories published in the Report on Government Services 2015.
52

Children & young people — Outcome 3: Educational engagement & success
Table 18 Percentage of ACT year 12 graduates employed or studying six months after completing an ACT Year 12 Certificate, 2009–13
Year of graduation
2009 2010 2011 2012 2013
Percentage employed or studying 90.1 93.9 94.3 93.4 91.9
Female 89.7 94.3 95.5 94.7 93.7
Male 90.5 93.4 93.0 92.1 90.1
Data source: The Education and Training Directorate publication, 2013 ACT year 12 graduates and school leavers: Where were they in 2014? available at www.det.act.gov.au
53

Children & young people — Outcome 4: Children & young people adopt healthy & pro-social lifestyles
Children and young people who are overweight and obese
Indicator description The proportion of ACT children and young people who are overweight or obese.
What do we measure? Measured (not self-reported) height and weight of children and young people in the ACT aged 5–17 years.
Why is this important? Children who are not sufficiently physically active and who do not have a balanced, well-proportioned diet are at risk of becoming overweight and obese. Increases in childhood overweight and obesity are now emerging as a serious global public health issue with the World Health Organization (WHO) describing this increase as an epidemic in some countries.19 In Australia, the NHMRC estimates that between 20 per cent and 25 per cent of Australian children are now overweight or obese, an increase from 1985, where 10 per cent to 12 per cent were estimated as overweight or obese.20, 21
How is the ACT progressing?
Measured data from the 2007–08 National Health Survey and the 2011–12 Australian Health Survey show that the proportion of children who are overweight and obese has remained fairly constant for Australia as a whole; while for the ACT the proportion of overweight and obese children has increased. More than one-quarter (25.5 per cent) of ACT children aged 5–17 years were overweight or obese in 2011–12 compared with 21.0 per cent in 2007–08. The proportion of children who were overweight increased from 15.8 per cent in 2007–08 to 19.8 per cent in 2011–12, while the proportion of children who were obese increased from 5.2 per cent to 5.7 per cent over this period.
Figure 21 The percentage of ACT and Australian children aged 5–17 years who were overweight or obese, 2007–08 and 2011–12
Data sources: ABS, National Health Survey 2007–08: Summary of results, ACT, 2007–08 cat. no. 4362.0; and Summary of results, 2007–08 cat. no. 4364.0
Australian Health Survey: First results, 2011–12 —ACT, cat. no. 4364.0; and First results, 2011–12 — Australia, cat. no. 4364.0.
54

Children & young people — Outcome 4: Children & young people adopt healthy & pro-social lifestyles
Young people who use drugs
Indicator description The proportion of young people who use alcohol, tobacco or illicit drugs.
What do we measure? The proportion of secondary students aged 12–17 years who report current use of alcohol, tobacco and illicit drugs. The ACT Secondary Students’ Alcohol and Drug Survey is conducted on a three-yearly basis with the most recently available survey data being for 2011 where 1,546 students attending government, Catholic and independent secondary schools in the ACT were surveyed.
Why is this important? The harms to individuals, families, communities and Australian society as a whole from alcohol, tobacco and other drugs are well known. Adolescence is a critical age for monitoring the initiation of illicit drug use.Drinking alcohol in adolescence can be harmful to young people’s physical and psychosocial development. Alcohol-related damage to the brain can be responsible for memory problems, inability to learn, problems with verbal skills, alcohol dependence and depression.22
Young people are more at risk of motor vehicle accidents, injuries, accidental death and suicide whilst under the influence of alcohol and drugs. They are also highly susceptible to being victims of crime.23
Tobacco use
How is the ACT progressing?
Tobacco smoking is one of the top risk factors for chronic disease including many types of cancer, respiratory disease and heart disease.24 The prevalence of tobacco use in secondary students in the ACT has decreased steadily over time.25
In 2011, 19.1 per cent of all students surveyed reported having smoked at least once in their lifetime (a statistically significant decrease from 26.4 per cent in 2008), 5.8 per cent of students reported smoking cigarettes on at least one day in the seven days before the survey (current smokers), and 1.4 per cent reported smoking cigarettes every day in the last seven days (daily smokers). Although there have been continual decreases in current and daily smoking since 1996, the changes from 2008 to 2011 were not statistically significant.
55

Children & young people — Outcome 4: Children & young people adopt healthy & pro-social lifestyles
Aboriginal and Torres Strait Islander students
Students who were of Aboriginal and Torres Strait Islander descent were more likely to have ever smoked or to be current smokers than non-Aboriginal and Torres Strait Islander students (28.8 per cent compared with 18.8 per cent).
Figure 22 Tobacco use, ACT secondary students (%), 1996–2011
Data source for Figures 22–23: ACT Health 2013, Substance use and other health-related behaviours among ACT secondary students: results from the 2011 ACT Secondary Students’ Alcohol and Drug Survey, ACT Government, Canberra. Note: Estimates for rates of daily smoking have changed slightly from previous reports due to coding changes.
56

Children & young people — Outcome 4: Children & young people adopt healthy & pro-social lifestyles
Alcohol use
How is the ACT progressing?
Since 1999 there has been a steady decline in reported alcohol consumption amongst secondary students.26 In 2011, 73.2 per cent of students surveyed reported that they had consumed at least a few sips of alcohol in their lifetime. This was a statistically significant reduction from 85.9 per cent in 2008.
There was a statistically significant decrease in the number of students consuming alcohol in the last seven days (current drinkers) from 24.2 per cent in 2008 to 14.0 per cent in 2011. There was a statistically significant decrease in the number of students reporting single-occasion risky drinking (consuming more than four drinks on any one occasion) in the week preceding the survey from 8.1 per cent in 2008 to 4.3 per cent in 2011.
Aboriginal and Torres Strait Islander students
Although there were some differences in alcohol use between students who were Aboriginal and Torres Strait Islander and those who were not, most of these differences were not statistically significant, or the estimates had wide relative standard errors due to small numbers.
Figure 23 Alcohol consumption, ACT secondary students (%), 1996–2011
57

Children & young people — Outcome 4: Children & young people adopt healthy & pro-social lifestyles
Illicit substance use
How is the ACT progressing?
There has been a steady and statistically significant decline in students reporting having used at least one illicit substance in their lifetime since 1996.27
In 2011, 12.7 per cent of students reported using an illicit drug at least once in their lifetime (a statistically significant decrease from 14.8 per cent in 2008).
There has been a consistent and statistically significant decrease in the lifetime use of cannabis since 1996. In 2011, 11.0 per cent of students reported that they had ever used cannabis (not a statistically significant change from 13.2 per cent in 2008). There were statistically significant decreases in the lifetime use of ecstasy (3.8 per cent in 2008 to 1.9 per cent in 2011) and heroin or other opiates (1.8 per cent in 2008 to 0.9 per cent* in 2011). There were not significant changes in students’ lifetime use of hallucinogens, amphetamines or cocaine (2.0 per cent, 2.5 per cent and 1.6 per cent respectively in 2011).
* Estimate has a relative standard error between 25% and 50% and should be interpreted with caution.
58

Children & young people — Outcome 4: Children & young people adopt healthy & pro-social lifestyles
Young people who have offended
Indicator description Young people who have been charged with a criminal offence.
What do we measure? The number of young people aged between 10 and 19 years, against whom a charge that must be answered in court has been laid by the police, during the reference period, per 100,000 of the population. A young person will only be counted once.
Why is this important? The proportion of young people in the population that may have committed offences may infer trends in offending by young people, by analysing rates over time.During adolescence young people face new challenges, learn new skills and lead more independent lives. Risk taking behaviour can be part of this development. While many young people exhibit some risk taking behaviour, only a minority will come into contact with the criminal justice system.28
Young people’s offending can be a concern to their families, schools and the wider community. Research indicates that young people who come into contact with the criminal justice system are more likely to go on to become adult offenders. The impacts to their lives through disruption to education, relationships with family and friends, employment and the stigmatisation from involvement in the criminal justice system, can lead to a range of poor outcomes. Young people are also more likely to be victims of crime, which can also lead to involvement in offending. The ACT Government emphasises diversion of young people away from the criminal justice system through the Blueprint for Youth Justice in the ACT 2012–22.Information from this indicator can inform government policies and services about initiatives that are effective in minimising young people’s contact with the criminal justice system and reduce reoffending.
How is the ACT progressing?
The data for 2013–14 (Table 19) shows the rate of young people offending has continued to decline and is at its lowest over the preceding five-year period
Table 19 Young people offending in the ACT (rate per 100,000 of population), 2008–14
2008–09 2009–10 2010–11 2011–12 2012–13 2013–14
Rate of young people offending 2,950.8 2,571.0 2,738.1 2,523.1 1,913.4 1,755.4
Data source: ABS 2015, Recorded Crime—Offenders, 2013–14, ‘Table 12. Youth Offenders, Principal offence by states and territories–2008–09 to 2013–14’, time series spreadsheet, cat. no. 4519.0, viewed 7 May 2015, <http://abs.gov.au/AUSSTATS/[email protected]/DetailsPage/4519.02013-14?OpenDocument>.
Note: Data for the 2008–09, 2009–10, 2010–11, 2011–12 and 2012–13 reference years have been revised since the previous issue of this publication. Readers are advised against making comparisons between data in this issue and in previous issues of the publication, as data may not be directly comparable.
59

Children & young people — Outcome 4: Children & young people adopt healthy & pro-social lifestyles
Young people under youth justice supervision
Indicator description Young people for whom the police or ACT courts have made a decision for a period of supervision.
What do we measure? The number of young people aged 10–17 years per 10,000 of the population under youth justice supervision, both in the community or in detention. A young person will only be counted once.
Why is this important? The proportion of young people in the population that are placed by the ACT courts under supervision (both before and after sentencing for an offence) may infer trends in offending by young people, by analysing rates over time. The ACT Government emphases diversion of young people away from the criminal justice system through the Blueprint for Youth Justice in the ACT 2012–22.This information can inform government policies and services about initiatives that are effective in minimising young people’s contact with the criminal justice system and reduce reoffending.
How is the ACT progressing?
The data for 2013–14 (Figure 24) shows the rate of young people under supervision has declined and is at its lowest rate since 2008–09.The rate of Aboriginal and Torres Strait Islander young people in detention in the ACT has been declining over the preceding four-year period to 352.60 young people per 10,000 of the population in 2013–14. However, when compared to the rate of non-Aboriginal and Torres Strait Islander young people in detention, the decline of Aboriginal and Torres Strait Islander young people is much slower and the over-representation of Aboriginal and Torres Strait Islander young people continues to be a challenge for the ACT and nationally.
Figure 24 Young people aged 10–17 years in the ACT under supervision by Aboriginal and Torres Strait Islander status, 2008–09 to 2013–14 (rate per 10,000 of population)
Data source for Figures 24–26: Australian Institute of Health and Welfare Youth Justice in Australia 2013–14.
60

Children & young people — Outcome 4: Children & young people adopt healthy & pro-social lifestyles
Traditionally there were fewer young women under youth justice supervision than young men. This is consistent nationally and in the ACT there was a small downward trend in the number of young women under youth justice supervision.
There were more young men (130) than young women (44) experiencing youth justice supervision in the ACT and there is a higher proportion of Aboriginal and Torres Strait Islander young women (30 per cent) than young men (23 per cent) (Figure 25).
Figure 25 Young people under supervision in the ACT, by sex and Aboriginal and Torres Strait Islander status, 2013–14
In the ACT most young people who were under supervision in 2013–14, were supervised for the first time between 14 and 17 years of age29 and the largest group of young people under supervision in 2013–14 were also those between the ages of 14 to 17 years.
In the ACT the average age of first supervision is around 12 years of age, with the majority of young people supervised between 15 and 17 years of age.
Figure 26 Young people under supervision in the ACT by age, 2013–14
61
Children & young people — Outcome 4: Children & young people adopt healthy & pro-social lifestyles
Young people under community-based supervision
Indicator description Young people for whom the ACT courts have made a decision for a period of supervision, which is to be served in the community.
What do we measure? The number of young people under community-based supervision.
Why is this important? Young people who have been charged or convicted of a criminal offence may be ordered by the court to be supervised in the community. These young people are provided support and supervision with the aim of addressing their risks of reoffending.
The ACT Government provides a range of programs to support and divert young people who are on supervised community-based orders. These programs target young people with drug and alcohol issues, disconnection from education and training, mental health issues and a need for accommodation, family connection and cultural support.
Information from this indicator can inform government policies and services about initiatives that are effective in minimising young people’s contact with the criminal justice system and reduce reoffending.
How is the ACT progressing?
The number of young people aged 10–17 years under community-based supervision in the ACT has decreased to 132 young people in 2013–14 from 166 in 2012–13. In 2011–12 the number was 183.
Note: The figures provided may change from previous years due to the youth justice national minimum dataset allowing for changes to orders or any data quality improvements.
Figure 27 Young people aged 10–17 years under community-based supervision in the ACT by Aboriginal and Torres Strait Islander status, 2008–09 to 2013–14
Data source for Figures 27–29: Australian Institute of Health and Welfare Youth Justice in Australia 2013–14.
62
Children & young people — Outcome 4: Children & young people adopt healthy & pro-social lifestyles
There were more young men (112) than young women (41) experiencing community-based supervision in the ACT and there was a higher proportion of Aboriginal and Torres Strait Islander young women (32 per cent) than young men (23 per cent).
Figure 28 Young people under community-based supervision in the ACT by sex and Aboriginal and Torres Strait Islander status, 2013–14
In the ACT most young people who were under community-based supervision in 2013–14 were supervised for the first time between 14 and 17 years of age30 and the largest group of young people under supervision in 2013–14 were those between the ages of 14 to 17 years.
Figure 29 Young people under community-based supervision in the ACT by age, 2013–14
Assault was the most common offence for young people under supervised community-based orders during 2013–14 and 2014–15 (up to March 2015).
Figure 30 Five most common offences for community-based supervision by young people under supervision, July 2013 to March 2015
Data source: Justice and Community Safety Directorate Criminal Justice Statistical Profile, March 2015.
63

Children & young people — Outcome 4: Children & young people adopt healthy & pro-social lifestyles
Young people in youth justice facilities
Indicator description Young people for whom the police or ACT courts have made a decision for a period of supervision, which is to be served in detention.
What do we measure? The number of young people aged 10–17 years detained at Bimberi Youth Justice Centre.
Why is this important? Young people who have been charged or convicted of a criminal offence may be ordered by the court (or police) to be detained, which provides safe and secure accommodation, facilitates rehabilitation and promotes the reintegration of young people into the community through a range of programs and services.
Research shows that any period of detention at a justice facility can have negative implications for the life of a young person in areas such as education, employment and personal relationships.31 More significantly, a period of detention may draw the young person further into the justice system and develop negative peer relationships and attitudes towards themselves and the community.
This information can inform government policies and services about initiatives that are effective in minimising young people’s contact with the criminal justice system and reduce reoffending.
How is the ACT progressing?
The number of young people aged 10–17 years detained in Bimberi in the ACT has decreased to 75 young people in 2013–14—around half the number in 2010–11.
Figure 31 Young people aged 10–17 years in detention in the ACT by Aboriginal and Torres Strait Islander status, 2008–09 to 2013–14
Data source for Figures 31–33: Australian Institute of Health and Welfare Youth Justice in Australia 2013–14.
There were more young men (66) than young women (22) experiencing detention in the ACT and there was a higher proportion of Aboriginal and Torres Strait Islander young men (29 per cent) than young women (23 per cent).
64

Children & young people — Outcome 4: Children & young people adopt healthy & pro-social lifestyles
Figure 32 Young people in detention in the ACT by sex and Aboriginal and Torres Strait Islander status, 2013–14
In the ACT most young people who were supervised in detention in 2013–14 were supervised for the first time between 14 and 17 years of age32 and the largest group of young people in detention in 2013–14 were those between the ages of 15 to 17 years.
Figure 33 Young people in detention in the ACT by age, 2013–14
The majority of young people admitted to Bimberi were being held on breaches of an order (justice procedure offences).
Figure 34 Most common offences for admissions of young people to detention, July 2013 to March 2015
Data source: Justice and Community Safety Directorate Criminal Justice Statistical Profile, March 2015.
65

Part 2: Families
Families
Outcomes Indicators
Families have access to sufficient material wellbeing
Parental employment status
Disposable household income
Family income spent on housing
Families are free from abuse and neglect
Substantiated child abuse
Children and young people on care and protection orders
Children and young people in out of home care
The individual needs of families are recognised and supported
Teenage fertility
ACT children’s level of reading, writing and numeracy by parental education
Performance improving
Performance
worsening
Performance
maintaining
No new data
available
66

Families — Outcome 1: Families have access to sufficient material wellbeing
Parental employment status
Indicator description An indicator of the employment status of parents in the ACT, whether they are sole or dual income families.
What do we measure? Family composition and labour force status of parents/partners, one parent, or a couple with children.
Why is this important? Parental employment status is an important indicator to assess the usage of child care, time spent and connection with children and the overall wellbeing of children and parents. It is important for government to know for planning and informational purposes.
How is the ACT progressing?
2011 Census data shows that since 2001, the number of one-parent families, couple families with no children and couple families with children who are employed has increased.
From 2006 to 2011, the proportion of one-parent families employed full-time increased by 11 per cent; however, the proportion of one-parent families employed part-time decreased by 0.5 per cent. The proportion of couples with children who worked full-time increased 12 per cent and increased by 13 per cent for those who worked part-time. Couples with children with one partner working full-time/part-time also increased (9 per cent increase). The number of one-parent families stating they were unemployed reduced by 10 per cent. Couples with children stating they both were not working also reduced by 4 per cent.
Data source: ABS, Census of Population and Housing: Time Series Profile, 2011, cat. no. 2003.0.
67

Families — Outcome 1: Families have access to sufficient material wellbeing
Disposable household income
Indicator description The median equivalised disposable household income per week of all households in the ACT. This is an indicator of the economic resources available to each member of a household when surveyed.
What do we measure? Household income consists of all current receipts, whether monetary or in kind, that are received by the household or by individual members of the household, and which are available for, or intended to support current consumption. Equivalised disposable household income scales calculate the relative wellbeing of households of different size and composition, and can be used to compare the situation of individuals as well as households.
Why is this important? Regular disposable household income is a major determinant of economic wellbeing for most people. Low family disposable income can negatively impact access to appropriate housing, sufficient nutrition and medical care and impact a child’s health, education and self-esteem.
How is the ACT progressing?
As at 2013–14, the median equivalised disposable household income per week was recorded as $1,114 in the ACT, in comparison to $883 as a nationwide average of capital city states and territories. The median equivalised disposable household income per week in the ACT has increased by 82 per cent since 2002–03.
Capital city state and territory comparisons show that the ACT recorded the highest median equivalised household disposable income and is 26 per cent higher than the national average. The rising equivalised household disposable income could be linked to the high level of education in the ACT, and the high proportion of professional employment relative to other Australian capital city states and territories.
Figure 35 Median equivalised disposable household income in the ACT and Australia
Data source: ABS, Household Income and Wealth, Australia, 2013–14, cat. no. 6523.0 collected from the Survey of Income and Housing.
68
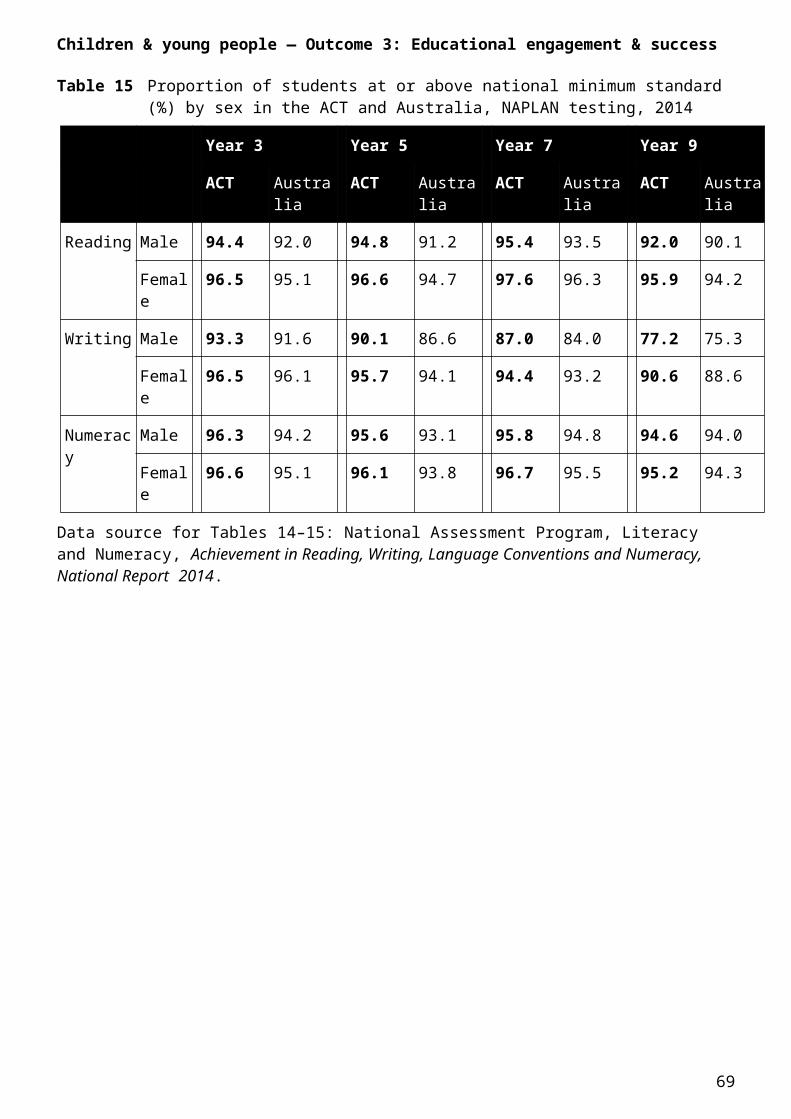
Families — Outcome 1: Families have access to sufficient material wellbeing
Family income spent on housing
Indicator description The proportion of the total gross household income in the ACT that is spent on housing-related costs.
What do we measure? Housing costs reported in Housing Occupancy and Costs (ABS cat no. 4130.0) covers housing-related mortgage payments, rates payments (general and water) and rent payments. The gross household income is then used to derive what proportion of family income is spent on housing costs. The data presented are compiled from the Survey of Income and Housing (SIH).
Why is this important? For most families, whether owning or renting, the cost of housing involves a substantial expenditure throughout their lives. As each household goes through its life-cycle different housing and housing costs are experienced. The proportion of gross income spent on housing is an important indicator of wellbeing, as the income left can be used for other essential items such as food, health services, education and transport costs.
How is the ACT progressing?
The total gross mean household income spent on housing costs in 2011–12 in the ACT was 14 per cent which is the same as the national figure. This was a 1 per cent increase in the ACT since 2009–10. National figures remained the same.
In 2009–10, 13 per cent of gross household income was spent on housing in the ACT compared to 14 per cent nationally.
In 2011–12, home owners with a mortgage spent 16 per cent of their gross income on housing costs in the ACT and 18 per cent nationally, which is the same as the 2009–10 percentages.
Home owners without a mortgage spent the lowest proportion of their gross income on housing costs, 2 per cent in the ACT and 3 per cent nationally. The same percentages were reported in 2009–10.
Renters in the ACT spent 19 per cent of their gross income on housing costs, compared with 19 per cent nationally. This is a 1 per cent increase in the ACT and a 1 per cent decrease in the national figures from the 2009–10 reporting period.
ACT public housing tenants reported in 2011–12, that 19 per cent of their income was spent on housing costs, an increase of 1 per cent from 2009–10. In 2007–08 this percentage was 22 per cent. Nationally public housing tenants reported 19 per cent of their income was spent on housing costs.
69

Families — Outcome 2: Families are free from abuse & neglect
Substantiated child abuse
Indicator description The number of child protection reports received during the year that were subsequently appraised and substantiated within the ACT.
What do we measure? Under section 360 of the Children and Young People Act 2008 Care and Protection Services will investigate a child protection report. An appraised report is substantiated when the matter reported meets the criteria as set out in sections 342 and 343 of the Children and Young People Act 2008.
Why is this important? Children are more likely to have enhanced health and wellbeing outcomes when they grow up in nurturing and supportive home environments. Children have a right to live in an abuse free environment. The immediate and later outcomes for children who have experienced abuse, or neglect are often poor, compared to those of children raised in supportive and secure environments.33
In the ACT, Care and Protection Services have a crucial role in ensuring children grow up in nurturing and supportive home environments. Care and Protection Services will investigate a child protection report, and on the basis of evidence and professional judgment, establish if a child or young person has been, is being, or is likely to be abused, neglected or otherwise harmed. To ensure the ongoing safety of children and young people, it is crucial that the appraisal process involves working with families to resolve protective concerns for all children. This measure can assist in improving community and Care and Protection Services response to increased child protection reporting rates.
How is the ACT progressing?
During 2013–14 there were 449 child protection reports that were subsequently substantiated. Previous substantiation numbers of child protection reports are: 2012–13 (720), 2011–12 (861), 2010–11 (636), 2009–10 (741), and 2008–09 (896).
Figure 36 Investigated and substantiated cases of child abuse, 2008–09 to 2013–14
Data source for Figures 36–37: Australian Institute of Health and Welfare 2015 Child Protection Australia: 2013–14 Child Welfare series no. 61 cat. no. CWS 52 Canberra: AIHW and previous publications.
70

Families — Outcome 2: Families are free from abuse & neglect
Figure 37 Child protection notification, investigations and substantiations, 2004–05 to 2013–14
Table 20 Children and young people subject of substantiated reports by age group, 2012–14
Years of age
<1 1–4 5–9 10–14 15–17 Total
2013–14 56 94 94 73 21 341
2012–13 71 120 141 119 42 494
The <1 category excludes unborn children (3). These children are included in the total.
These children were unborn at time of report, but born by commencement of the investigation.
Data source for Tables 20–22: Australian Institute of Health and Welfare 2015 Child Protection Australia: 2013–14 Child Welfare series no. 61 cat. no. CWS 52 Canberra: AIHW and previous publications.
Note: Disaggregates available are for the number of children subject to substantiations in the period rather than the number of substantiations made as measured on previous pages.
Table 21 Children and young people subject of substantiated reports by sex, 2012–14
Male Female Total
2013–14 179 162 341
2012–13 234 260 494
Table 22 Children and young people subject of substantiated reports by Aboriginal and Torres Strait Islander status, 2012–14
Aboriginal and Torres Strait Islander
Non-Aboriginal and Torres Strait Islander
Unknown Total*
2013–14 66 275 – 341
2012–13 84 309 101 494
71

Families — Outcome 2: Families are free from abuse & neglect
Children and young people on care and protection orders
Indicator description A measure of ACT children and young people aged 0–17 years who are on a Children’s Court order which allocates parental responsibility to the Director-General or a third party other than parents, and/or has a provision requiring supervision by the Director-General, Community Services Directorate as well as children on a Voluntary Care Agreement which shares parental authority between the Director-General and the parent(s).
What do we measure? The number of children on a care and protection order as at 30 June. This measure does not include children on a Children’s Court order with Youth Justice provisions only or whose care and protection order was made interstate and received support in the ACT.
Why is this important? It is recognised that children’s bests interests are served by being in the care of their parents/ family, if their developmental, emotional and safety needs are being met. However, this may not be the case for some children and it may be deemed necessary for them to enter into the care of the Director-General, Community Services Directorate to ensure their safety and wellbeing. This is only considered after other less intrusive measures have been attempted to support the child and family.This measure provides an indication as to how many children and young people have been placed in the care, or supervision of the Director-General, Community Services Directorate.
How is the ACT progressing?
As of 30 June 2014, 705 children and young people were on a care and protection order. This is a 4.6 per cent increase from June 2013, where 674 children and young people were on a care and protection order. Increasing numbers of children on care and protection orders continues as a national trend, due to the cumulative effect of children entering the care and protection system at a young age and remaining on long-term orders.
Figure 38 Total number of children and young people on care and protection orders, June 2009, June 2010, June 2011, June 2012, June 2013 and June 2014
Data source for Figure 38 and Tables 23–25: Australian Institute of Health and Welfare 2015 Child Protection Australia: 2013–14 Child Welfare series no. 61 cat. no. CWS 52 Canberra: AIHW and previous publications.
72
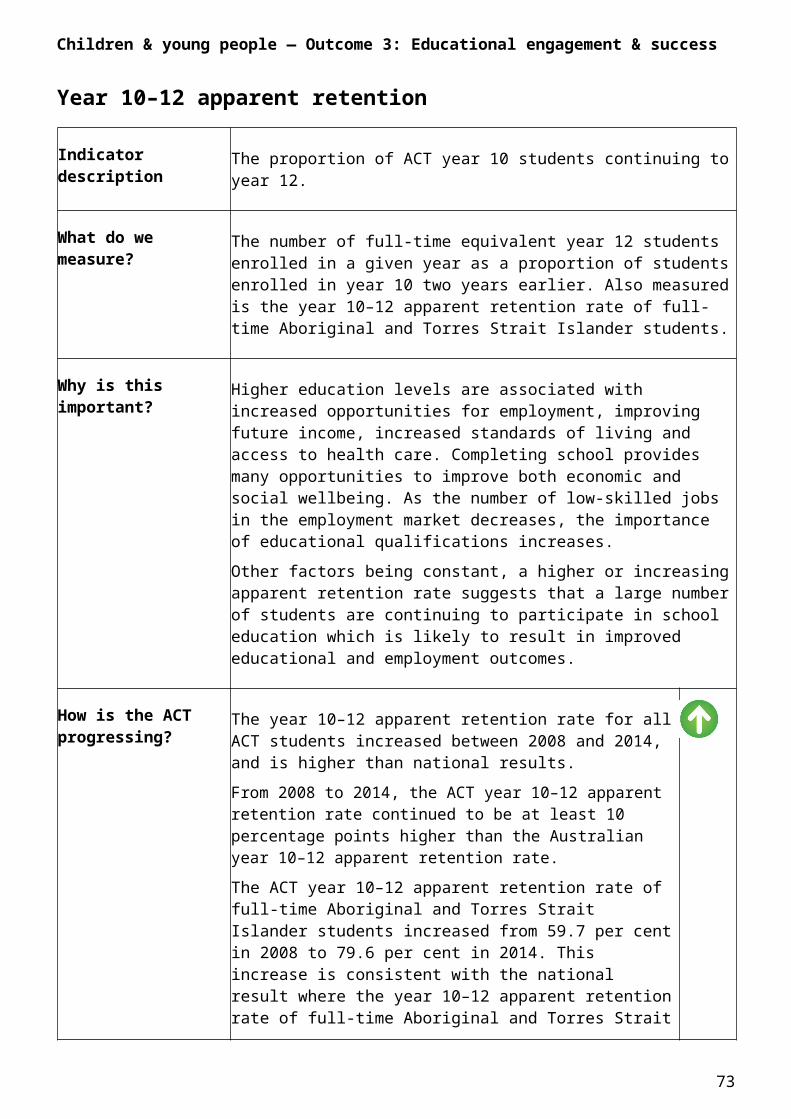
Families — Outcome 2: Families are free from abuse & neglect
Table 23 Children and young people on care and protection orders by age group, 2012–14
Years of age
<1 1–4 5–9 10–14 15–17 Total
2013–14 35 155 208 205 102 705
2012–13 18 141 220 184 111 674
Table 24 Children and young people on care and protection orders by sex at 30 June 2014
Male Female Total
2013–14 375 330 705
2012–13 354 320 674
Table 25 Children and young people on care and protection orders by Aboriginal and Torres Strait Islander status at 30 June 2014
Aboriginal and Torres Strait Islander
Non-Aboriginal and Torres Strait Islander
Total*
2013–14 182 523 705
2012–13 169 481 674
73

Families — Outcome 2: Families are free from abuse & neglect
Children and young people in out of home care
Indicator description A measure of ACT children and young people aged 0–17 years who have been placed in an out of home care placement by Care and Protection Services. Out of home care includes foster care, kinship care and residential/refuge placements.
What do we measure? The number of children residing in an out of home care placement at 30 June 2014. This includes children on care and protection orders and those not on care and protection orders where the Community Services Directorate makes a payment for their overnight care.
This measure does not include children case managed by Care and Protection Services where a care and protection order has been issued to another state or territory. Data on young people who reside independently is also not included.
Why is this important? If a child or young person is placed in the care of the Director-General, Community Services Directorate, all reasonable attempts will be made to support the child being in the care of their extended family. This is important to maintain the child’s sense of identity and family connectedness. However it may not always be possible, or appropriate, for a child to be placed in kinship care.
Having assumed parental responsibility, the Director-General needs to ensure that all children and young people are placed in suitable accommodation for their age and circumstances. This may range from foster care to supported independent living. This measure is important in showing the demand for different types of out of home care and is relevant to assist agency planning for resource allocation.
How is the ACT progressing?
As of 30 June 2014, there were 606 children placed in out of home care. This is a 9 per cent increase on the number of children in out of home care at the same time last year (558) and a return to the upward trend seen both nationally and in the ACT in recent years.
Of the 606 children and young people in out of home care, 318 were in kinship care (52.5 per cent); 213 were in foster care (35.1 per cent), 36 children (5.9 per cent) were in other home-based care (originally foster carers who were then given full parental responsibility), 38 were in residential care (6.3 per cent) and one in other arrangements.
74

Families — Outcome 2: Families are free from abuse & neglect
Table 26 Proportion of children residing in out of home care placements by type as at June 2010, June 2011, June 2012, June 2013 and June 2014
Type of out of home care placement
Kinship care Foster care Residential care Other home-based care
TotalYear No. % No. % No. % No. %
2014 318 52.5 213 35.1 38 6.3 36 5.9 606
2013 291 52.1 209 38.5 38 6.8 20 3.6 558
2012 292 51.6 218 38.5 33 5.8 22 3.8 566
2011 280 51.9 214 39.6 45 8.3 1 0.2 540
2010 266 50.0 219 41.2 47 8.8 n/a n/a 532
Nationally the rate of Aboriginal and Torres Strait Islander children in out of home care placements was nine times the rate for non-Aboriginal and Torres Strait Islander children. In the ACT the rate of Aboriginal and Torres Strait Islander children in out of home care was 11 times the rate than for non-Aboriginal and Torres Strait Islander children. Of all Aboriginal and Torres Strait Islander children in out of home care in the ACT, 53.3 per cent lived with relatives or kin, and a further 2 per cent lived in another Aboriginal and Torres Strait Islander care arrangement.
Table 27 Children and young people in out of home care by age group at 30 June 2013 and 30 June 2014
Years of age
<1 1–4 5–9 10–14 15–17* Total
2014 30 124 188 181 83 606
2013 15 118 184 155 86 558
* The age category 15–17 includes six young people aged 18 years.
Data source for Tables 26–29: Australian Institute of Health and Welfare 2015 Child Protection Australia: 2013–14 Child Welfare series no. 61 cat. no. CWS 52 Canberra: AIHW.
75

Families — Outcome 2: Families are free from abuse & neglect
Table 28 Children and young people in out of home care by sex at 30 June 2013 and 30 June 2014
Male Female Total
2014 330 276 606
2013 301 257 558
Table 29 Children and young people in out of home care by Aboriginal and Torres Strait Islander status at 30 June 2013 and 30 June 2014
Aboriginal and Torres Strait Islander
Non-Aboriginal and Torres Strait Islander
Total*
2014 152 454 606
2013 140 399 558
76
Families — Outcome 3: The individual needs of families are recognised & supported
Teenage fertility
Indicator description The annual number of live births to women aged 15–19 years old per 1,000 females in that age group.
What do we measure? The number of live births by age of mother (15–19) and the ACT resident female population of that age.
Why is this important? Teenage pregnancy is recognised both in Australia and internationally as an important risk factor for both obstetric and perinatal outcomes and also poor social outcomes for both mother and child.
How is the ACT progressing?
The ACT has one of the lowest teenage fertility rates in Australia.34
The fertility rate for teenage women has been consistently lower in the ACT than nationally. Between 2004 and 2013, the ACT teenage fertility rate remained significantly lower than the national rate.
Figure 39 Teenage fertility rate, 2004–13
Data source: ABS 2014. Births, Australia, 2013. cat. no. 3301.0.
Note: Fertility rate refers to the age specific fertility rate for 15–19 year old females.
77
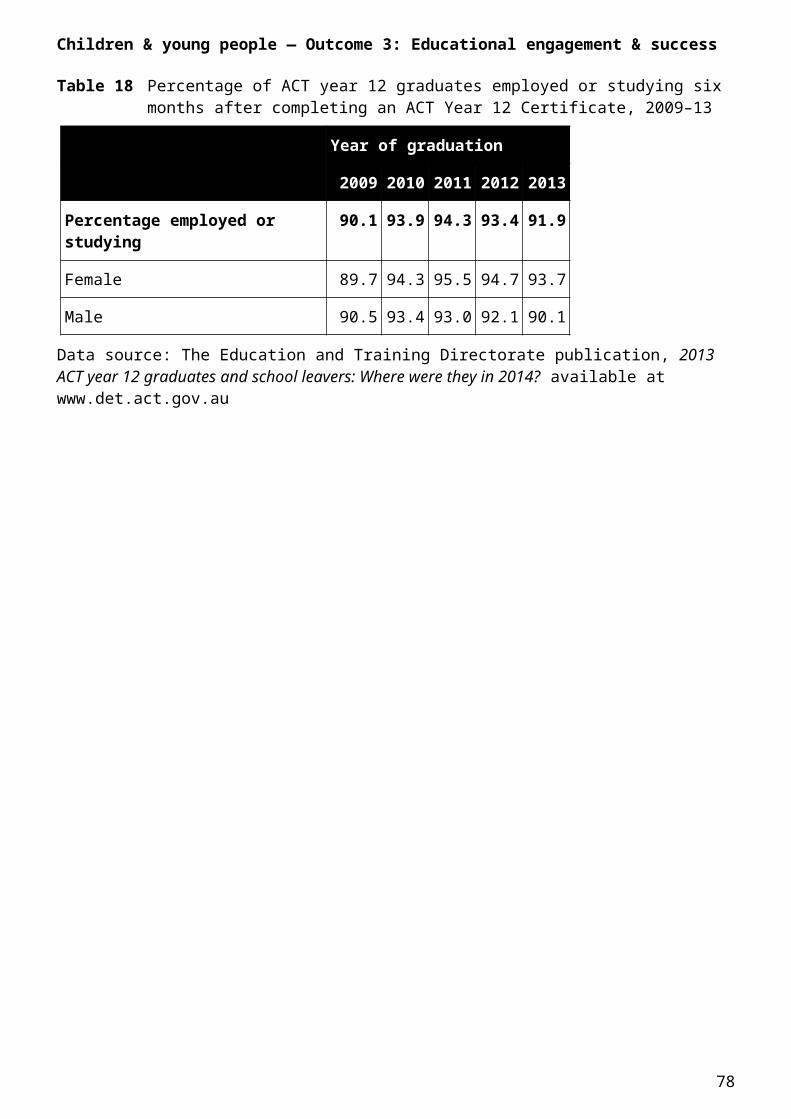
Families — Outcome 3: The individual needs of families are recognised & supported
ACT children’s level of reading, writing and numeracy by parental education
Indicator description The proportion of ACT children at or above the national minimum standards in reading, writing and numeracy, by parental education level.
What do we measure? The proportion of ACT children in year 3 achieving at or above the national minimum standards in reading, writing and numeracy by parental education levels. This information is based on the National Assessment Program Literacy and Numeracy, National Reports for 2010, 2011, 2012, 2013 and 2014. The highest level of education that either parent has completed is the level of education that is reported.
Why is this important? Research has indicated that parental education levels, among other factors including the amount of time parents spend discussing books with their child and the presence of study aids, is an important influence over a child’s attainment of literacy and numeracy.35
Research has indicated that children whose mothers did not complete secondary school, for example, are at substantially greater risk of having low literacy scores.36
How is the ACT progressing?
Results within the ACT indicate that a higher proportion of students in year 3 whose parents have a bachelor degree or diploma are at or above the national minimum standard when compared with the proportion of students whose parents have a year 11 equivalent. This reflects the wider trends within Australia.
It is important to note that these results are indicative only since parental education data was not available for 15 per cent of ACT year 3 students and 11 per cent of year 3 students nationally in 2011, 11 per cent of ACT year 3 students and 9 per cent of year 3 students nationally in 2012, 8 per cent of ACT year 3 students and 8 per cent of year 3 students nationally in 2013 and 6 per cent of ACT year 3 students and 7 per cent of year 3 students nationally in 2014.
78

Families — Outcome 3: The individual needs of families are recognised & supported
Key
Bachelor Bachelor degree or above
Diploma Advanced diploma/diploma
Certificate Certificate I to IV
Year 12 Year 12 or equivalent
Year 11 Year 11 or equivalent or below
Not stated no data was provided for parental education at the time of enrolment.
Table 30 Proportion (%) of students in year 3 achieving at or above national minimum standards in reading by parental education within the ACT and Australia, 2010–14
2010 2011 2012 2013 2014
Parental education ACT Aust. ACT Aust. ACT Aust. ACT Aust. ACT Aust.
Bachelor 97.7 97.8 97.3 97.8 97.7 97.8 97.4 98.3 96.9 97.6
Diploma 96.3 96.1 95.5 96.1 94.1 95.9 96.3 96.8 95.6 95.6
Certificate 93.9 94.1 93.0 93.7 94.4 93.5 94.7 95.3 93.0 93.2
Year 12 95.2 93.7 95.4 93.2 94.5 92.8 94.6 94.7 93.3 92.1
Year 11 90.5 86.9 87.0 86.1 87.4 84.9 90.9 88.6 89.1 83.2
Not stated 95.1 89.4 95.6 88.5 96.6 87.7 94.4 89.8 95.4 86.1
Table 31 Proportion (%) of students in year 3 achieving at or above national minimum standards in writing* by parental education within the ACT and Australia, 2010–14
2010 2011 2012 2013 2014
Parental education ACT Aust. ACT Aust. ACT Aust. ACT Aust. ACT Aust.
Bachelor 97.7 98.0 97.3 98.0 97.8 98.1 96.7 97.8 96.1 97.3
Diploma 97.0 97.2 95.3 97.2 94.8 97.1 95.9 96.6 96.4 95.8
Certificate 95.7 96.4 94.7 95.6 95.5 95.7 93.8 95.1 93.6 93.7
Year 12 97.0 95.8 96.0 95.3 95.5 95.1 95.9 94.6 92.0 92.7
Year 11 91.2 90.8 91.3 90.0 90.5 89.3 87.4 88.5 86.8 85.1
Not stated 96.2 91.5 96.8 90.6 95.8 89.7 93.5 88.0 94.0 86.0
* A new persuasive writing style was introduced in 2011. The writing results for 2011, 2012, 2013 and 2014 should not be directly compared to the NAPLAN assessment results of earlier years.
79

Families — Outcome 3: The individual needs of families are recognised & supported
Table 32 Proportion (%) of students in year 3 achieving at or above national minimum standards in numeracy by parental education within the ACT and Australia, 2010–14
2010 2011 2012 2013 2014
Parental education ACT Aust. ACT Aust. ACT Aust. ACT Aust. ACT Aust.
Bachelor 98.1 97.9 97.7 98.3 98.1 98.0 97.7 98.5 97.5 98.1
Diploma 96.9 96.3 96.5 97.2 94.4 96.2 97.0 97.2 97.2 96.5
Certificate 95.4 94.6 93.9 95.8 94.9 93.8 94.8 95.8 95.2 94.6
Year 12 96.1 94.1 96.1 95.2 95.3 93.0 95.2 95.2 94.0 93.4
Year 11 91.1 87.8 91.9 90.1 88.9 85.1 91.9 89.2 90.5 85.7
Not stated 96.5 90.1 96.9 92.0 96.7 87.7 95.5 90.2 96.9 88.1
Data source for Tables 30–32: Australian Curriculum, Assessment and Reporting Authority, NAPLAN Achievement in Reading, Writing, Language Conventions and Numeracy: National Report for 2010, 2011, 2012, 2013 and 2014.
80

Part 3: Community, environments & services
Community, environments and services
Outcomes Indicators
Accessible local recreation spaces, activities and community facilities
Children and young people living in neighbourhoods with good parks, playgrounds and play spaces
Children registered as library users
Adequate family support services to meet the needs of parents
Families and Caregivers receiving support through services provided to children and young people with a developmental delay or disability from Therapy ACT
Families accessing coordinated locally-based services through the Child and Family Centres
Supportive and connected communities
Children’s participation at cultural activities, events or venues
Families attending at least one cultural venue or event in the preceding year
Young people who volunteer
Performance improving
Performance
worsening
Performance
maintaining
No new data
available
81

Community, environments & services — Outcome 1: Accessible local recreation spaces, activities & community facilities
Children and young people living in neighbourhoods with good parks, playground and play spaces
Indicator description Measure of the levels of usage of neighbourhood parks and play spaces across the ACT.
What do we measure? The percentage of urban residents and visitors who used neighbourhood parks or play spaces in the preceding year.
Why is this important? Children need access to a variety of quality public play spaces that encourage exploration of the self and the environment. Through creative, physical, social and cognitive play children begin to understand their world and develop skills necessary for adulthood. Through exploration of their environments children learn about themselves and the complex world in which they live.
How is the ACT progressing?
These local neighbourhood play spaces provide for a range of users, with the target age group being 0–9 years with a guardian accompanying. Central neighbourhood play spaces cater for a range of users, with the target age group being 10–14 years, sometimes accompanied by a guardian.
The 2013–14 Market Attitude Research Services Survey found that approximately 75 per cent of ACT residents regularly visited neighbourhood parks, which is an increase when compared with 2012–13 (64 per cent) and 2011–12 (67 per cent).
The findings of the 2014–15 survey indicated that visits to neighbourhood parks increased from 75 per cent to 85 per cent during the year, which indicates a strong increase in park usage.
Data source: 2014–15 Market Attitude Research Services Summary Report, Parks and Territory Services, TAMS.
82

Community, environments & services — Outcome 1: Accessible local recreation spaces, activities & community facilities
Children registered as library users
Indicator description A measure of the number of children and young people living in the ACT who are registered library users.
What do we measure? The number of children and young people aged 0–24 years who are registered members of an ACT Public Library managed by Libraries ACT. Also measured is the number of children and young people who participated in programs run or organised by Libraries ACT.
Why is this important? A child’s access to a range of learning opportunities, including language and literacy activities, is integral to their early development. Activities such as shared reading, exposure to print and language activities and games are influential in a child’s early literacy development.37 As children grow, reading remains a crucial factor in their success in education and life.
Public libraries play an important role in the development of early literacy skills through shared book reading and exposing children to various forms of print, encouraging all members of the family to read and exposing children and families to songs and rhymes. They also provide an avenue to access a vast array of books and other resources that encourage a lifelong engagement with reading.
Monitoring the number of children and young people who are registered members of an ACT public library is important information for Libraries ACT in planning programs and services as well as profiling collections aimed at children.
How is the ACT progressing?
As of May 2015, there were 63,607 children and young people aged 0–24 years who were registered library members of Libraries ACT. This represents 26.9 per cent of the total number of library members.
Table 33 Number of registered Libraries ACT members by age, 2014 and 2015 (as on 11 May 2015)
Age range
0–4 5–9 10–14 15–19 20–24 Total
2014 2,657 8,909 12,159 17,545 21,060 62,330
2015 2,252 8,642 12,559 18,251 21,903 63,607
Note: This is the fourth year Libraries ACT has reported on this indicator but it is important to note that the age range reported in the figure above has been extended to 0–24 years in 2014 where previously it was 0–15 years. This change means that comparisons between 2013 and subsequent years cannot be made.
83
Community, environments & services — Outcome 1: Accessible local recreation spaces, activities & community facilities
In addition to library membership, Libraries ACT run a range of successful early childhood programs to promote early literacy. As of June 2015, more than 62,396 children and carers participated in early childhood literacy programs Giggle and Wiggle and Story Time. Giggle & Wiggle is for children aged from birth to 2 years and Story Time is for children aged 3 to 5 years.
Table 34 Participant numbers for Giggle and Wiggle and Story Time, 2012–13 to 2014–15
2012–13 2013–14 2014–15
Giggle and Wiggle 29,464 38,960 38,238
Story Time 28,043 25,362 24,158
Data source for Tables 33–34: Libraries ACT Database, May 2015.
Children and young people also engaged in a number of other programs organised by Libraries ACT that promote literacy and reading including school holiday programs, author visits and other programs. As of June 2015, 3,346 children and young people participated in these programs.
84
Community, environments & services — Outcome 2: Adequate family support services to meet the needs of parents
Families and Caregivers receiving support through services provided to children and young people with a developmental delay or disability from Therapy ACT
Indicator description The number of ACT families with a child or young person with a developmental delay or disability who received support from Therapy ACT in a 12-month period.
What do we measure? The number of Therapy ACT clients aged 0–25 years who had an open case in a 12-month period.
Why is this important? Families with a child with a developmental delay or diagnosed disability are under significant stress. Support from therapists can assist children and young people to function more independently and assist families with additional strategies and referrals to best support their child.
How is the ACT progressing?
In 2013–14, 3,060 children or young people with a disability or significant developmental delay received support from allied health professional staff. The number of children or young people receiving support is similar to 2012–13 where 3,062 families received support. There is no national comparative data as the service structures and models vary in each jurisdiction.
The National Disability Insurance Scheme (NDIS) commenced in the ACT in July 2014. NDIS funding will enable reasonable and necessary supports to be purchased by people who are ACT residents and meet the participant eligibility guidelines for early intervention or disability. ACT residents eligible for the NDIS will continue to phase into the scheme until June 2016 as per the NDIS Phasing Timetable. Therapy ACT will continue to provide intervention services until December 2016 to clients who continue to choose Therapy ACT as a NDIS provider.
From January 2016, assessment and referral services will be available through a new Child Development Service. The Child Development Service will consider the physical and emotional development of children and support for their families. The service will have a focus on early identification, screening and assessment of children 0–6 years, children 7–8 years with complex needs who have not had a previous diagnosis, and autism assessment to age 12 years. Some initial intervention will be available for children not eligible for the NDIS.
85
Community, environments & services — Outcome 2: Adequate family support services to meet the needs of parents
Figure 40 The number of children, young people or adults with a disability or significant developmental delay accessing services from Therapy ACT 2009–10 to 2014–15
Figure 41 The number of children, young people or adults with a disability or significant developmental delay accessing Therapy ACT services by age range, 2014–15
Data source for Figures 40–41: National Disability Agreement (NDA) National Minimum Dataset 2013–14 (NMDS).
86

Community, environments & services — Outcome 2: Adequate family support services to meet the needs of parents
Figure 42 The number of families with a child or young person with a disability or significant developmental delay accessing Therapy ACT services by age range, 2014–15
Data source for Figures 42–43: National Disability Agreement (NDA) National Minimum Dataset 2013–14 (NMDS).
Figure 43 The number of families with a child or young person with a disability or significant developmental delay accessing Therapy ACT services by disability status, 2014–15
87

Community, environments & services — Outcome 2: Adequate family support services to meet the needs of parents
Families accessing coordinated locally-based services through the Child and Family Centres
Indicator description The number of ACT families accessing coordinated locally based services through the Child and Family Centres.
What do we measure? The number of families accessing a range of early intervention and prevention services offered by the Community Services Directorate’s Early Intervention and Prevention Services branch through the Child and Family Centres either at a centre located in Gungahlin, Tuggeranong and West Belconnen or via outreach in homes, schools and the community. This measure includes families accessing community development activities as well as individual case management.
This measure does not include all families accessing the Parents as Teachers programs and does not include data on the total number of families who access services at the centres that are offered by other areas of the Community Services Directorate, ACT Health or community organisations.
Why is this important? All families, during the early years of their child’s development, require access to a range of services to meet their child’s health, wellbeing, learning and development needs. Early intervention and prevention services are provided to ensure that all families are supported to assist their child reach their full potential.
The Child and Family Centres provide integrated service delivery, with child and family support services provided alongside other services including ACT Health’s Maternal and Child Health services, midwifery services, nutrition services, Therapy ACT, Housing ACT and Relationships Australia. Together, the services provide support and advice on child health, development and parenting issues, immunisations, growth and care of babies, speech and physiotherapy drop-in services, supportive counselling and case coordination for vulnerable families.
How is the ACT progressing?
The number of families accessing coordinated, locally-based services by a Child and Family Centre increased slightly in the most recent reporting period, from 1,830 (in 2012–13) to 1,863 (in 2013–14).
The number of families accessing services from the Child and Family Centres (provided by the staff of the Child and Family Centres) increased rapidly from 2006–07 to 2008–09. The number of families accessing services remained relatively stable for the periods 2008–09 and 2009–10 with an increase observed over the 2010–11 period, with the opening of a new centre in West Belconnen.
88

Community, environments & services — Outcome 2: Adequate family support services to meet the needs of parents
Figure 44 Number of families accessing services from the Child and Family Centres (services provided by staff of Child and Family Centre), 2006–07 to 2013–14
Data source: CSD Annual Report 2013–14; Volume Two, F Strategic Objectives and Indicators, Strategic Indicator 3 and previous publications.
89
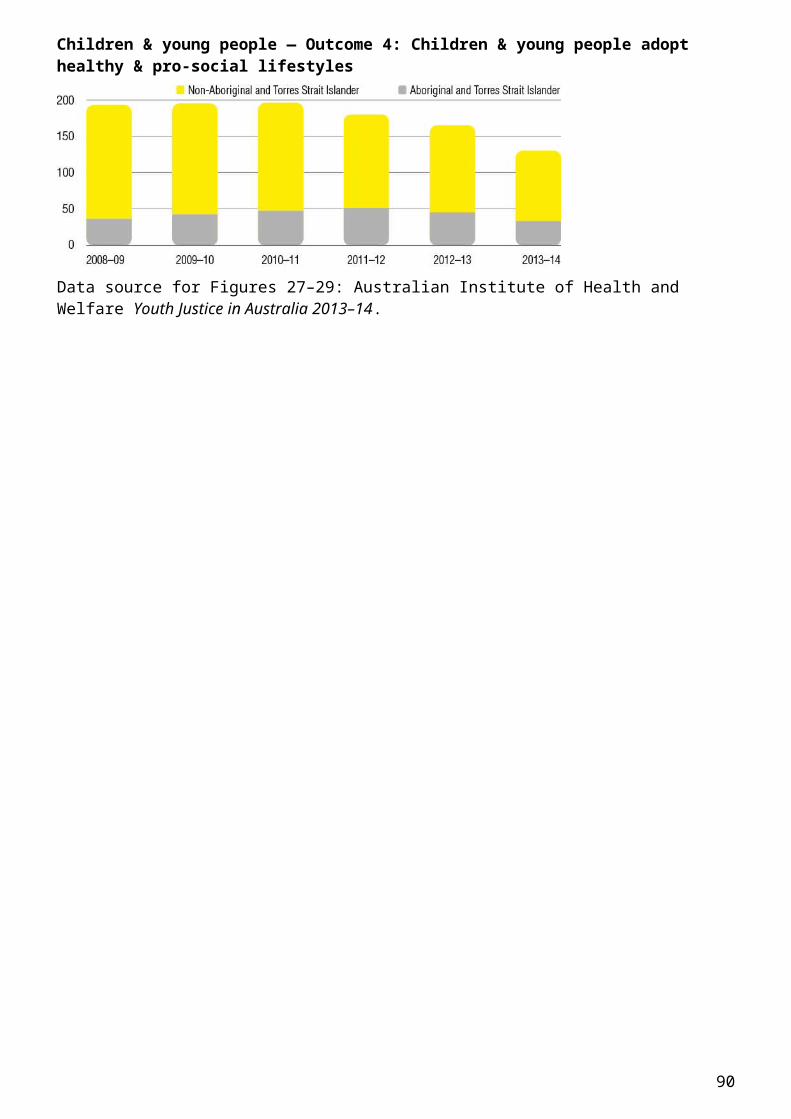
Community, environments & services — Outcome 3: Supportive & connected communities
Children’s participation rate at cultural activities, venues or events
Indicator description The proportion of children who attended a selected cultural activity, venue or event.
What do we measure? The proportion of ACT’s children aged 5–15 years who attended a cultural activity, venue or event in the preceding year.
Why is this important? The arts make a strong contribution to community strength and identity and are recognised for facilitating communication across social, economic, cultural and ethnic groups. Cultural events provide an outlet that increases our wellbeing, education and respect.
How is the ACT progressing?
In the ACT, a higher percentage of 5–14 year olds attended a selected, organised cultural activity and selected venue or event, compared to national percentages.In the ACT, the activity that attracted the highest percentage of males was playing a musical instrument, and for females it was dance. Attendance at a museum or art gallery recorded the highest percentage for both males and females in the ACT.The national data also shows the same trend of a higher percentage of males who play a musical instrument and females who participate in dance; however attendance at a public library, rather than a museum or art gallery recorded the highest percentage of males and females.
Figure 45 The proportion of children and young people aged 0–14 years in ACT and Australia, who attended at least one selected cultural activity and cultural venue or event, 2012
Data source for Figure 45 and Tables 35–36: ABS, Children’s Participation in Cultural and Leisure Events, cat. no. 4901.0
90

Community, environments & services — Outcome 3: Supportive & connected communities
Table 35 Children’s participation rate (%) in selected organised cultural activities, selected characteristics, 2012
Playing a musical Instrument Singing Dancing Drama
Organised art and craft
Sex Males 17.2 3.9 5.7 2.8 5.5
Females 25.6 15.6 27.9 5.1 13.8
Age in years
5–8 13.8 7.9 13.9 3.1 8.0
9–11 21.2 11.8 18.4 3.8 9.5
12–14 32.1 10.1 18.7 5.1 11.9
Table 36 Children’s participation rate (%) attendance at selected cultural venues and events, selected characteristics, 2012
Visited public library Visted museum or art gallery
Attended performing arts events
Sex Males 54.4 64.4 36.8
Females 65.0 66.4 55.8
Age in years
5–8 63.3 65.4 44.7
9–11 55.2 73.4 47.4
12–14 58.6 57.6 46.9
91

Community, environments & services — Outcome 3: Supportive & connected communities
Families attending at least one cultural venue or event in the preceding year
Indicator description Proportion of ACT families who attended at least one cultural venue or event in the preceding year.
What do we measure? The proportion of ACT families who attended a cultural venue or event by household composition (couple with no children, couples with dependent children and single parents with dependent children).
Why is this important? The arts make a strong contribution to community strength and identity and are recognised for facilitating communication across social, economic, cultural and ethnic groups. Cultural events provide an outlet that increases our wellbeing, education and respect.
This indicator measures the accessibility of cultural events in our community and the level of interest in experiencing the benefits in attending these events.
How is the ACT progressing?
Couples with at least one dependent child had the highest attendance rate within the ACT, with 95.0 per cent attending at least one cultural venue or event over 2009–10. This was followed by couples with no children (94.0 per cent attending at least one cultural venue or event) and single parents with at least one dependent child (92.6 per cent attending at least one cultural venue or event). The ACT’s attendance rate was higher than the average Australian attendance for all family groups.
Figure 46 Proportion of ACT and Australian families attending at least one cultural event or venue over 2009–10
Data source: ABS, Attendance at Selected Cultural Venues and Events, Australia, 2009–10, cat. no. 4114.0
92

Community, environments & services — Outcome 3: Supportive & connected communities
Young people who volunteer
Indicator description The proportion of young people who have undertaken voluntary
What do we measure? The proportion of young people aged 18–24 years in the ACT who have undertaken voluntary work in the last 12 months. The Australian Bureau of Statistics defines a volunteer as someone who willingly provides unpaid help, in the form of time, service or skills, through an organisation or group. People completing unpaid work under some form of compulsion because of employment (for example, work for the dole) or as part of study commitments are excluded from this measure.
Why is this important? Participation in voluntary work provides important outcomes for both individuals and the broader community. Volunteer work provides young people with many key skills supporting their transition to adulthood and in becoming active citizens38. Research indicates that volunteering enhances social cohesion, strengthens communities and provides benefits to the volunteer themselves. Volunteering can increase social inclusion, physical and psychological wellbeing and career opportunities.
How is the ACT progressing?
In 2006, the volunteer rate of young people aged 18–24 years in the ACT was 28.9 per cent. In 2010, this rate had increased to 35.2 per cent, and was one of the highest volunteer rates nationally.
Figure 47 Proportion of young people aged 18–24 who have undertaken voluntary work in the last 12 months within the ACT and Australia, 2006 and 2010
Data source: ABS, Voluntary Work, Australia, cat. no. 4441.0
93

References and further information
Territory and national policies and frameworks influencing children and young people
When reviewing individual, family and community outcomes, it is important to acknowledge the broader policy and social influences. There are several Australian Government and Australian Capital Territory policies that influence child health, wellbeing, learning and development within the ACT.
ACT policies and frameworks
The Human Services Blueprint The Blueprint was released in 2014 and provides a framework for the delivery of better and sustainable outcomes for our children and young people by ensuring improved access and service integration for human service users.
www.communityservices.act.gov.au/home/current_news/human-services-blueprint
A Step Up for Our Kids—One Step Can Make a Lifetime of Difference (Out of Home Care Strategy 2015–2020)
A Step Up for Our Kids was released in January 2015. The strategy is a cornerstone initiative of the ACT Government’s Better Services suite from the Human Services Blueprint. The strategy will strengthen existing child protection and out of home care services through the introduction of new services and reforms, ensuring children and young people who need protection and care receive the right service, at the right time for the right duration.
http://www.communityservices.act.gov.au/ocyfs/out-of-home-care-strategy-2015-2020/out-of-home-care-strategy-2015-2020
Community Services Directorate Strategic Plan 2012–2015Implementing the CSD Strategic plan is presented in the 2014–15 Business Plan which outlines six key change initiatives.
http://incommunityservices/Strategic%20Plan%20Documents/CSD%20Business%20Plan%202014-15%20-%20FINAL.pdf
Every Chance to Learn Curriculum Framework for ACT Schools: Preschool to Year 10The Framework lays the foundation for high-curriculum standards in all ACT schools by outlining essential teaching content and learning expectations for the children and young people of Canberra.
http://activated.act.edu.au/ectl/resources/ECTL_Framework.pdf
The ACT Youth Commitment The Commitment requires all service agencies working with young people to the age of 17 years, commit to ensuring that no young person is lost from education, training or employment.
www.det.act.gov.au/actyc
Education Capital: Leading the Nation—Education and Training Directorate Strategic Plan 2014–17www.det.act.gov.au/publications_and_policies/publications_a-z
94

References and further information
Skilled Workforce for the ACT: ACT Skills and Training Policy Directions Paper.Reforms are underway to ensure a strong ACT training sector provides quality opportunities for people to access flexible training to enhance their career prospects. In a time of limited resources, it is also important for the ACT to continue to find efficiencies in how training can best be supported to ensure its ongoing sustainability.
www.det.act.gov.au/__data/assets/pdf_file/0005/677165/ACTSkillsAndTrainingPolicyDirectionsPaper_v1.0.pdf
ACT Aboriginal and Torres Strait Islander Agreement 2015–2018This Agreement sets out the commitment of the ACT Government, our service partners, the Aboriginal and Torres Strait Islander Elected Body, and most importantly the community, to work together to recognise and respond to the needs of Aboriginal and Torres Strait Islander people living in the ACT and surrounding region. Together we can bridge the gap and ensure all Canberrans receive the opportunities to achieve equitable outcomes in all aspects of their life.
www.communityservices.act.gov.au/atsia/agreement-2015-18
Aboriginal and Torres Strait Islander Justice Agreement 2014–2017The Agreement provides a mutual commitment to addressing the needs of Aboriginal and Torres Strait Islander people in the justice system, including addressing over-representation in the youth justice system.
The Blueprint for Youth Justice in the ACT 2012–22 The Youth Justice Blueprint is a ten-year strategy of reform that focuses on early intervention, prevention and diversion of young people from the youth justice system.
www.dhcs.act.gov.au/__data/assets/pdf_file/0009/337590/Blueprint_for_Youth_Justice_in_the_ACT_2012-22.pdf
ACT Prevention of Violence Against Women Strategy 2011–17The Strategy targets violence against women and children by promoting holistic and flexible service provision, an anti-violence culture, and accountable perpetrators who are supported to change their behaviour.
www.communityservices.act.gov.au/__data/assets/pdf_file/0014/231341/ACT_Prevention_of_Violence_Against_Women_and_Children_Strategy_2011.pdf
ACT Women’s Plan 2010–2015The plan provides a strategic framework to assist in improving the quality of life for all women and girls in the ACT, particularly isolated or marginalised women and girls.
www.communityservices.act.gov.au/__data/assets/pdf_file/0016/122506/ACT_Womens_Plan_2010_-15.pdf
Future Directions: Towards Challenge 2014 (Future Directions)Future Directions drives ACT Government, community and business direction towards improving outcomes, opportunities and community inclusiveness for all people with disability, including our children, young people, their families and carers.
www.communityservices.act.gov.au/__data/assets/pdf_file/0006/79872/final_policy_framework_PUBLISHED.pdf
95
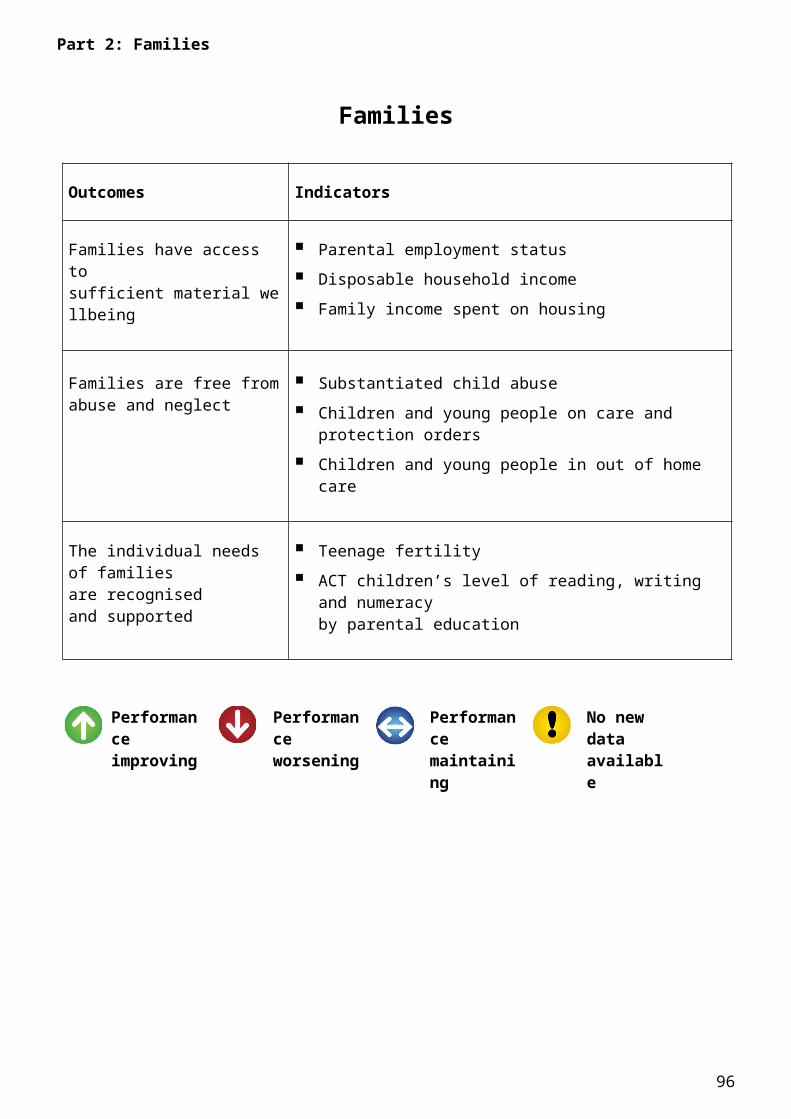
References and further information
Involve Canberra Disability Commitment Involve Canberra Disability Commitment is a movement of people with and without disability, community organisations, industry and government acting together to achieve change that empowers people with disability. We will achieve change though community designed social campaigns that focus on practical action in each priority area.
www.involvecbr.com.au/
Renewing Libraries: Libraries, Literacy and Learning Strategy 2015–2019The strategic plan aims to deliver and support literacy programs, help create lifelong learners, facilitate information-sharing with the community, and provide access to technology, the internet and inclusive spaces. It also invests in the vision of Canberra as a digital city—digitally literate, connected and engaged.
http://www.library.act.gov.au/__data/assets/pdf_file/0009/728280/1500147-Libraries-Strategy_FA_web-FINAL.pdf
Building A Strong Foundation: A Framework For Promoting Mental Health And Wellbeing In The ACT 2009–2014The framework guides investment in the development and implementation of activities to promote mental health and wellbeing in the ACT.
http://health.act.gov.au/c/health?a=dlpubpoldoc&document=1861
Active2020: A strategic plan for sport and active recreation in the ACT and Region 2011–2020Active2020 promotes ACT Government and industry partnerships dedicated to encouraging long term investment and planning by sport and recreation associations in the ACT. It aims to improve the health, wellbeing and connectedness of community members, including children and young people.
http://active2020.com.au/
The Canberra Plan: Towards our second centuryThe Plan shapes the ACT Government’s vision for the growth and development of Canberra into the future and aims to make Canberra a great place to live for children, young people and other members of the community.
www.cmd.act.gov.au/__data/assets/pdf_file/0013/120217/canberra_plan_text_V5.pdf
Building our Community: The Canberra Social Plan 2004–2014The Social Plan outlines the ACT Government’s vision for a community where all people reach their potential and contribute and share in the benefits of inclusiveness.
www.cmd.act.gov.au/__data/assets/pdf_file/0010/216559/2011CanberraSocialPlan_Print_Version.pdf
The Social Compact 2012The Compact highlights the relationship between the government and community sector and the vital role played by the community sector in contributing to quality community life.
www.cmd.act.gov.au/__data/assets/pdf_file/0008/521486/The-Social-Compact_web-version2.pdf
96

References and further information
National policies and frameworks
The current initiatives within the ACT fit within a broader national policy context focused on monitoring and promoting positive outcomes for children and young people. Current initiatives influencing the development of children and young people nationwide include:
Investing in the Early Years — A National Early Childhood Development Strategy 2009 and the National Early Childhood Strategic Plan 2014–2017 aim to build an effective early childhood development system in Australia that will contribute to the nation’s human capital and productivity.
National Quality Framework for Early Childhood Education and Care 2012 recognises the importance of quality early childhood education and care and aims to implement national quality standards to ensure consistent and high-quality practices.
Protecting Children is Everyone’s Business: National Framework for Protecting Australia’s Children 2009–2020 aims to build parenting and community capacity to care for children and reduce child abuse and neglect over time.
Closing the Gap 2009 is a national integrated strategy to improve the lives of Aboriginal and Torres Strait Islander Australians, and in particular provide a better future for Aboriginal and Torres Strait Islander children.
Australian National Breastfeeding Strategy 2010–2015 aims to contribute to improving the health, nutrition and wellbeing of infants and young children, and the health and wellbeing of mothers, by protecting, promoting, supporting and monitoring breastfeeding.
National Strategy for Young Australians 2010 describes what it’s like to be young in Australia today and highlights eight priority areas for government action now and into the future.
National Disability Strategy 2010–2020 provides a unified, national approach to improving the lives of people with disability, their families and carers.
Australian Curriculum
The Australian Curriculum sets consistent national standards to improve learning outcomes for all young Australians. It sets out, through content descriptions and achievement standards, what students should be taught and achieve, as they progress through school. It is the base for future learning, growth and active participation in the Australian community. ACARA develops the Australian Curriculum through rigorous, consultative national processes.
97

References and further information
Looking for more data?
ACT Health Epidemiology Branch
ACT Health Epidemiology Branch provides a range of reports on the health of the ACT population, to assist with the development and evaluation of policies and interventions to improve health. Reports outlining the health status of children and young people in the ACT include: the biennial Chief Health Officer’s Report, the Health Status of Young People in the ACT 2012 report, and maternal and perinatal health publications.
health.act.gov.au/health-services/population-health/health-improvement/epidemiology-branch/
Australian Bureau of Statistics (ABS) Children and Youth theme page
This theme page provides a guide to both ABS and non-ABS data, identifying the wide range of information available on children and youth.
www.abs.gov.au
Australian Early Development Census (AEDC)
The AEDC is a national population measure of children’s development at school entry in five domains of physical health and wellbeing; emotional maturity; social competence; language and cognitive skills; and communication and general knowledge. The AEDC website also provides contextual community data from the Australian Census (2006 and 2011) relevant to the development of children.
www.aedc.gov.au/
Australian Institute for Health and Welfare (AIHW)
The AIHW is a major national agency which provides reliable, regular and relevant information and statistics on Australia’s health and welfare. National headline indicators for children’s health, development and wellbeing, includes a set of 19 children’s headline indicators designed to focus policy attention on priorities for children’s health, development and wellbeing. The Young Australians: their health and wellbeing series of reports provides the latest available information on how Australia’s 12–24 year olds are faring according to a set of national indicators of health and wellbeing.
www.aihw.gov.au
Australian Research Alliance for Children and Youth (ARACY)
The ARACY is a national non-profit organisation working to improve the wellbeing of children and young people, by advancing collaboration and evidence-based action.
www.aracy.org.au/
98

References and further information
Longitudinal Study of Australian Children (LSAC)
LSAC investigates the health, education, child and family functioning, child care and socio-demographics of Australian children. Data collection began in 2004 on two cohorts of children, infants and 4–5 year olds. The study will continue to follow these two cohorts of children to the ages of 14–15 years and 18–19 years.
www.aifs.gov.au/
Longitudinal Surveys of Australian Youth (LSAY)
LSAY is a research program that tracks young people as they move from school to post-school destinations, such as further study, work and other destinations, and explores social outcomes, such as wellbeing. Information collected as part of LSAY covers a wide range of school and post-school topics, including: student achievement, student aspirations, school retention, social background, attitudes to school, work experiences and what students are doing when they leave school. This includes vocational and higher education, employment, job seeking activity, and satisfaction with various aspects of their lives.
www.lsay.edu.au/
Report on Government Services
Every year, the Australian Government’s Productivity Commission releases the (ROGS) to provide information on the effectiveness and efficiency of government services across Australia. Chapters relating to children and young people are included in Part B (early childhood, education and training) and Part F (community services).
www.pc.gov.au/gsp/rogs
99

References and further information
References
Council of Australian Governments 2009, Investing the Early Years — A National Early Childhood Development Strategy, Canberra.
National Integrated Strategy for Closing the Gap in Indigenous Disadvantage (the Strategy), COAG, July 2009 <https://www.coag.gov.au/node/65>.
Australian Bureau of Statistics (ABS) 2014, 31010DO002_201409 Australian Demographic Statistics, Sep 2014.
ABS 2014, 3238.0 Estimates and Projections, Aboriginal and Torres Strait Islander Australians: Series B, table 8, Canberra.
Hilder L, Zhichao Z, Parker M, Jahan S, Chambers GM 2014. Australia’s mothers and babies 2012. Perinatal statistics series no. 30. cat. no. PER 69. Canberra.
Hilder L, Zhichao Z, Parker M, Jahan S, Chambers GM 2014. Australia’s mothers and babies 2012. Perinatal statistics series no. 30. cat. no. PER 69. Canberra.
Hilder L, Zhichao Z, Parker M, Jahan S, Chambers GM 2014. Australia’s mothers and babies 2012. Perinatal statistics series no. 30. cat. no. PER 69. Canberra.
Goldenberg RL & Culhane JF (2007). Low birth weight in the United States. American Journal of Clinical Nutrition 85: 584S–90S.
ABS 2010, Measure of Australia’s Progress, 2010, cat. no. 1370.0, Canberra.
Australian Institute of Health and Welfare (AIHW) 2011, National breastfeeding indicators: workshop report cat. no. PHE 146. Canberra.
National Health and Medical Research Council (NHMRC) 2012, Infant Feeding Guidelines Canberra: National Health and Medical Research Council, <www.eatforhealth.gov.au/sites/default/files/files/the_guidelines/n56_infant_feeding_guidelines.pdf>.
NHMRC 2012, Infant Feeding Guidelines Canberra: National Health and Medical Research Council, <www.eatforhealth.gov.au/sites/default/files/files/the_guidelines/n56_infant_feeding_guidelines.pdf>.
NHMRC 2003, Dietary Guidelines for Children and Adolescents in Australia: Incorporating the Infant Feeding Guidelines for Health Workers. Commonwealth of Australia.
NHMRC 2003, Dietary Guidelines for Children and Adolescents in Australia: Incorporating the Infant Feeding Guidelines for Health Workers. Commonwealth of Australia.
ACT Health 2014, Health Status of Children in the ACT, ACT Government, Canberra.
Australian Government Department of Health and Ageing, Australia’s physical activity recommendations for 5–12 year olds and Australia’s physical activity recommendations for 12–18 year olds, <www.healthyactive.gov.au>.
Commonwealth of Australia 2013, Understanding childhood immunisations, <www.immunise.health.gov.au/internet/immunise/publishing.nsf/Content/A12E183FB21B71F1CA2575BD001C80F0/$File/UCI-booklet-2013.pdf>.
AIHW 2012, A Picture of Australia’s Children 2012, cat. no. PHE 167, Canberra.
World Health Organization 2005, Global Strategy on Diet, Physical Activity and Health, <www.who.int/dietphysicalactivity/strategy/eb11344/strategy_english_web.pdf>.
100

References and further information
NHMRC 2003, Clinical Practice Guidelines for the Management of Overweight and Obesity in Children and Adolescents, Commonwealth of Australia.
AM Magarey, LA Daniels & TJC Boulton 2001, ‘Prevalence of overweight and obesity in Australian children and adolescents: reassessment of 1985 and 1995 data against new standard international definitions’, Medical Journal of Australia, vol. 194: pp. 561–64.
Ministerial Council on Drug Strategy 2011, National Drug Strategy 2010–2015: A framework for action on alcohol, tobacco and other drugs, pub. no. D0224, <www.nationaldrugstrategy.gov.au/internet/drugstrategy/publishing.nsf/Content/DB4076D49F13309FCA257854007BAF30/$File/nds2015.pdf>.
Ministerial Council on Drug Strategy 2011, National Drug Strategy 2010–2015: A framework for action on alcohol, tobacco and other drugs, pub. no. D0224, <www.nationaldrugstrategy.gov.au/internet/drugstrategy/publishing.nsf/Content/DB4076D49F13309FCA257854007BAF30/$File/nds2015.pdf>.
Ministerial Council on Drug Strategy 2011, National Drug Strategy 2010–2015: A framework for action on alcohol, tobacco and other drugs, pub. no. D0224, <www.nationaldrugstrategy.gov.au/internet/drugstrategy/publishing.nsf/Content/DB4076D49F13309FCA257854007BAF30/$File/nds2015.pdf>.
ACT Health 2013, Substance use and other health-related behaviours among ACT secondary students: results from the 2011 ACT Secondary Students’ Alcohol and Drug Survey, ACT Government, Canberra, <www.health.act.gov.au/health-services/population-health/health-improvement/epidemiology-branch/epidemiology-publications-health-series/substance-use-and-other-health-related-behaviours-among-act-secondary-students>.
ACT Health 2013, Substance use and other health-related behaviours among ACT secondary students: results from the 2011 ACT Secondary Students’ Alcohol and Drug Survey, ACT Government, Canberra, <www.health.act.gov.au/health-services/population-health/health-improvement/epidemiology-branch/epidemiology-publications-health-series/substance-use-and-other-health-related-behaviours-among-act-secondary-students>.
ACT Health 2013, Substance use and other health-related behaviours among ACT secondary students: results from the 2011 ACT Secondary Students’ Alcohol and Drug Survey, ACT Government, Canberra, <www.health.act.gov.au/health-services/population-health/health-improvement/epidemiology-branch/epidemiology-publications-health-series/substance-use-and-other-health-related-behaviours-among-act-secondary-students>.
Richards, K 2011, ‘What makes juvenile offenders different from adult offenders?’, Trends and issues in crime and criminal justice vol. no. 409, Australian Institute of Criminology, Canberra.
AIHW 2015, Youth justice in Australia 2013–14. AIHW bulletin no. 127. cat. no. AUS 188. Canberra.
AIHW 2015, Youth justice in Australia 2013–14. AIHW bulletin no. 127. cat. no. AUS 188. Canberra.
Department of Disability, Housing and Community Services 2011, Discussion paper—towards a diversionary framework for the ACT, ACT Government, Canberra.
AIHW 2015, Youth justice in Australia 2013–14. AIHW bulletin no. 127. cat. no. AUS 188. Canberra.
AIHW 2009, A picture of Australia’s children 2009, cat. no. PHE 112, Canberra.
ABS 2014. Births, Australia, 2013. Cat. no. 3301.0. Canberra.
AIHW 2009, A picture of Australia’s children 2009, cat. no. PHE 112, Canberra.
AIHW 2009, A picture of Australia’s children 2009, Cat. no. PHE 112, Canberra.
Centre for Community Child Health 2011, Policy Brief No. 13 2008: Literacy in Early Childhood, The Royal Children’s Hospital, Melbourne, <www.rch.org.au/ccch/policybriefs.cfm>.
101

References and further information
Moffit, L & Volunteering Tasmania 2011, Engaging Young people in Volunteering: What works in Tasmania?, Volunteering Tasmania.
Figures
Figure 1 The ACT Children and Young People Outcomes Framework 9
Figure 2 The proportion of ACT residents in each age group, 2014 11
Figure 3 The proportion of the total population who are aged 0–24 years in each Australian state and territory, 2014 11
Figure 4 Ancestry of dependent children aged 0–24 years, ACT 2011 12
Figure 5 Percentage change of 0–24 year olds in each ACT district, 2011–12 14
Figure 6 Proportion of women who smoked during pregnancy, ACT residents, 2003–12 16
Figure 7 Proportion of women who smoked during pregnancy by Aboriginal and Torres Strait Islander status, ACT residents, 2004–06 to 2010–12 17
Figure 8 Proportion of low birthweight babies, ACT residents, 2003–12 18
Figure 9 Proportion of low birthweight babies by maternal Aboriginal and Torres Strait Islander status, live births, ACT residents, 2003–06 to 2010–12 19
Figure 10 Infant mortality rate, ACT and Australia, 2004–13 20
Figure 11 Exclusive breastfeeding, infants presenting at ACT Child Health Immunisation Clinics, by age (completed calendar months), 2011–12, 2012–13 and 2013–14 22
Figure 12 Any breastfeeding, infants presenting at ACT Maternal and Child Health Immunisation Clinics, by age (completed calendar month), 2011–12, 2012–13 and 2013–14 23
Figure 13 Proportion of ACT children aged 60–63 months fully immunised, 2010–14 29
Figure 14 Proportion of children aged 60–63 months assessed as fully immunised by state or territory. The information below is from one quarterly report (date of processing 31 March 2015) 30
Figure 15 Proportion of ACT Aboriginal and Torres Strait Islander children aged 60–63 months fully immunised, 2010–14 30
Figure 16 Proportion of Aboriginal and Torres Strait Islander children aged 60–63 months assessed as fully immunised by state or territory. The information below is from one quarterly report (date of processing 31 March 2015) 30
Figure 17 ACT Public Hospitals — Hospitalisation rate per 1,000 population for mental health and behavioural disorders (persons aged 14 years or less), 2009–10 to 2013–14 34
Figure 18 Developmental vulnerability: National and regional comparisons, AEDI, 2009 and 2012 38
Figure 19 The proportion of children developmentally vulnerable on one or more domain/s of the AEDI in each region within the ACT, 2012 39
Figure 20 Apparent retention rates year 10 to year 12, ACT and Australia, 2008–14 51
Figure 21 The percentage of ACT and Australian children aged 5–17 years who were overweight or obese, 2007–08 and 2011–12 54
Figure 22 Tobacco use, ACT secondary students (%), 1996–2011 56
Figure 23 Alcohol consumption, ACT secondary students (%), 1996–2011 57
102

References and further information
Figure 24 Young people aged 10–17 years in the ACT under supervision by Aboriginal and Torres Strait Islander status, 2008–09 to 2013–14 (rate per 10,000 of population) 60
Figure 25 Young people under supervision in the ACT, by sex and Aboriginal and Torres Strait Islander status, 2013–14 61
Figure 26 Young people under supervision in the ACT by age, 2013–14 61
Figure 27 Young people aged 10–17 years under community-based supervision in the ACT by Aboriginal and Torres Strait Islander status, 2008–09 to 2013–14 62
Figure 28 Young people under community-based supervision in the ACT by sex and Aboriginal and Torres Strait Islander status, 2013–14 63
Figure 29 Young people under community-based supervision in the ACT by age, 2013–14 63
Figure 30 Five most common offences for community-based supervision by young people under supervision, July 2013 to March 2015 63
Figure 31 Young people aged 10–17 years in detention in the ACT by Aboriginal and Torres Strait Islander status, 2008–09 to 2013–14 64
Figure 32 Young people in detention in the ACT by sex and Aboriginal and Torres Strait Islander status, 2013–14 65
Figure 33 Young people in detention in the ACT by age, 2013–14 65
Figure 34 Most common offences for admissions of young people to detention, July 2013 to March 2015 65
Figure 35 Median equivalised disposable household income in the ACT and Australia 68
Figure 36 Investigated and substantiated cases of child abuse, 2008–09 to 2013–14 70
Figure 37 Child protection notification, investigations and substantiations, 2004–05 to 2013–14 71
Figure 38 Total number of children and young people on care and protection orders, June 2009, June 2010, June 2011, June 2012, June 2013 and June 2014 72
Figure 39 Teenage fertility rate, 2004–13 77
Figure 40 The number of children, young people or adults with a disability or significant developmental delay accessing services from Therapy ACT 2009–10 to 2014–15 86
Figure 41 The number of children, young people or adults with a disability or significant developmental delay accessing Therapy ACT services by age range, 2014–15 86
Figure 42 The number of families with a child or young person with a disability or significant developmental delay accessing Therapy ACT services by age range, 2014–15 87
Figure 43 The number of families with a child or young person with a disability or significant developmental delay accessing Therapy ACT services by disability status, 2014–15 87
Figure 44 Number of families accessing services from the Child and Family Centres (services provided by staff of Child and Family Centre), 2006–07 to 2013–14 89
Figure 45 The proportion of children and young people aged 0–14 years in ACT and Australia, who attended at least one selected cultural activity and cultural venue or event, 2012 90
Figure 46 Proportion of ACT and Australian families attending at least one cultural event or venue over 2009–10 92
Figure 47 Proportion of young people aged 18–24 who have undertaken voluntary work in the last 12 months within the ACT and Australia, 2006 and 2010 93
103

References and further information
104

References and further information
Tables
Table 1 Total number and proportion of district population, by age group in the ACT, 2012 12
Table 2 Estimated resident population, ACT, by age and sex, 0–24 years for 2011 and 2012 13
Table 3 Fruit consumption, serves per day, percentage of children 2–15 years, ACT, 2007–13 25
Table 4 Vegetable consumption, serves per day, percentage of children 2–15 years, ACT, 2007–13 26
Table 5 Proportion of ACT children and young people aged 5–15 years who played sport and outdoor activities in past 12 months, 2011–13 28
Table 6 The National Immunisation Program (NIP) — current schedule 31
Table 7 ACT Public Hospitals, top 25 diagnoses for hospital admission by volume, persons aged 14 years or under, 2013–14 33
Table 8 Characteristics of the children surveyed both in the ACT and Australia, 2012 37
Table 9 The proportion of Australian and ACT children developmentally on track, at risk and vulnerable on each domain of the AEDI, 2012 40
Table 10 Comparison of Aboriginal and Torres Strait Islander children developmentally vulnerable on one or more domain/s, 2009–12 41
Table 11 Comparison of children with a language background other than English developmentally vulnerable on one or more domain/s, ACT and Australia, 2009–12 41
Table 12 Children developmentally vulnerable, by sex, on one or more domain/s, ACT and Australia, 2009–12 42
Table 13 Attendance rate (%) at ACT public primary and high schools, by grade year, 2009–14 44
Table 14 The proportion of year 3, 5, 7 and 9 students at or above the national minimum standard in reading, writing and numeracy in the ACT and Australia, NAPLAN testing, 2008–14 46
Table 15 Proportion of students at or above national minimum standard (%) by sex in the ACT and Australia, NAPLAN testing, 2014 47
Table 16 The proportion of Aboriginal and Torres Strait Islander year 3, 5, 7 and 9 students at or above the national minimum standard in reading, writing and numeracy in the ACT and Australia, 2011–14 48
Table 17 The proportion of non-Aboriginal and Torres Strait Islander year 3, 5, 7 and 9 students at or above the national minimum standard in reading, writing and numeracy in the ACT and Australia, 2011–14 49
Table 18 Percentage of ACT year 12 graduates employed or studying six months after completing an ACT Year 12 Certificate, 2009–13 53
Table 19 Young people offending in the ACT (rate per 100,000 of population), 2008–14 59
Table 20 Children and young people subject of substantiated reports by age group, 2012–14 71
Table 21 Children and young people subject of substantiated reports by sex, 2012–14 71
Table 22 Children and young people subject of substantiated reports by Aboriginal and Torres Strait Islander status, 2012–14 71
Table 23 Children and young people on care and protection orders by age group, 2012–14 73
105

References and further information
Table 24 Children and young people on care and protection orders by sex at 30 June 2014 73
Table 25 Children and young people on care and protection orders by Aboriginal and Torres Strait Islander status at 30 June 2014 73
Table 26 Proportion of children residing in out of home care placements by type as at June 2010, June 2011, June 2012, June 2013 and June 2014 75
Table 27 Children and young people in out of home care by age group at 30 June 2013 and 30 June 2014 75
Table 28 Children and young people in out of home care by sex at 30 June 2013 and 30 June 2014 76
Table 29 Children and young people in out of home care by Aboriginal and Torres Strait Islander status at 30 June 2013 and 30 June 2014 76
Table 30 Proportion (%) of students in year 3 achieving at or above national minimum standards in reading by parental education within the ACT and Australia, 2010–14 79
Table 31 Proportion (%) of students in year 3 achieving at or above national minimum standards in writing* by parental education within the ACT and Australia, 2010–14 79
Table 32 Proportion (%) of students in year 3 achieving at or above national minimum standards in numeracy by parental education within the ACT and Australia, 2010–14 80
Table 33 Number of registered Libraries ACT members by age, 2014 and 2015 (as on 11 May 2015) 83
Table 34 Participant numbers for Giggle and Wiggle and Story Time, 2012–13 to 2014–15 84
Table 35 Children’s participation rate (%) in selected organised cultural activities, selected characteristics, 2012 91
Table 36 Children’s participation rate (%) attendance at selected cultural venues and events, selected characteristics, 2012 91
106