Embed Size (px)
Citation preview
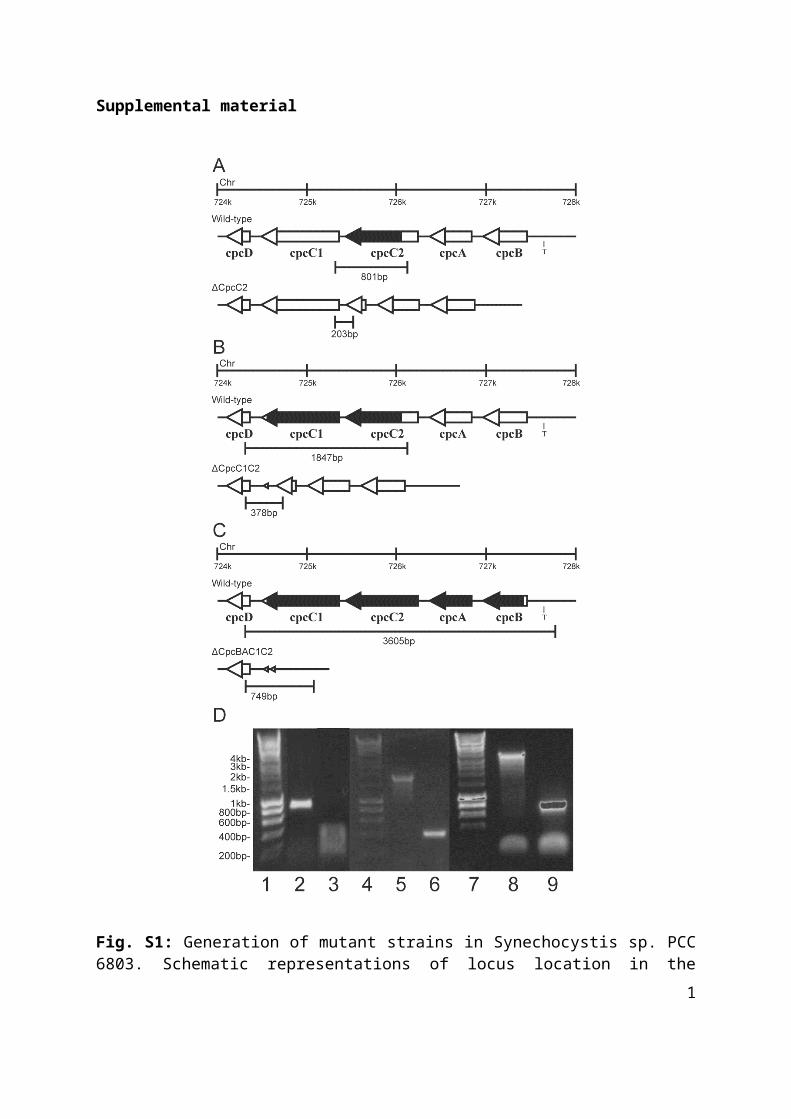
Supplemental material
Fig. S1: Generation of mutant strains in Synechocystis sp. PCC 6803. Schematic representations of locus location in the Synechocystis genome (top), and the wild-type (middle) and unmarked knockout strain (bottom) profiles expected in (a) ∆CpcC2, (b)
1

∆CpcC1C2 and (c) ∆CpcBAC1C2 (Olive) strains following amplification with primers flanking the deleted sequence. Regions deleted in the mutant strains are shaded in black. Location of the T→C or T→G substitution is indicated. (d) Amplification of genomic DNA in WT (Lane 2) and ∆cpcC2 (Lane 3) using CpcC2for/CpcC2rev primers; in WT (Lane 5) and ∆cpcC1C2 (Lane 6) using CpcC1for/CpcC2rev primers; in WT (Lane 8) and ∆cpcABC1C2 (Lane 9) using CpcC1for/CpcBrev primers. Markers are in lane 1, 4, 7.
Fig. S2: Spectrum showing the absorbance of the (a) wild-type, ∆CpcC2 and ∆CpcC1C2 and (b) pcpcT→C and ∆CpcC2:pcpcT→C strains. Values are the average from four biological replicates and are standardized to 750 nm.
2

Synechocystis sp. PCC 6714 AGCATTGTATAAAGTTAACTGTGGSynechocystis sp. PCC 6803 ACCGTTGTATAAAGTTAACTGTGGSynechococcus sp. PCC 7942 ATCGTTGTATAAGAATGCAGGCAASynechococcus sp. PCC 7002 GACGTTGTATAACATTTACCTAAG
Fig S3: Conservation in various cyanobacteria of the upstream region near the altered T→C substitution. Underlined is the transcriptional start site as confirmed in Synechocystis sp. PCC 6714 1. The T nucleotide which was altered to C in the Synechocystis sp. PCC 6714 mutant and to C or G in this study is indicated in red.
3

4

Fig S4: Light penetration of wild-type (●), pcpcT→C (■), ∆CpcC1C2:pcpcT→C (▲) and olive (▼) strains. OD (750 nm) 0.1, 0.5, 1.0, 2.5 and 5.0 cultures were exposed to either 500, 1000 or 2000 µmol photons m-2 s-1 and light levels measured at 11 mm intervals up to 110 mm. OD (750 nm) 1.0 cultures were exposed to 1000 µmol photons m-2 s-1 of (P) red, (Q) blue and (R) green light and light levels measured at 11 mm intervals up to 99 mm.
Fig. S5: Growth of wild-type (●), pcpcT→C (■), ∆CpcC1C2:pcpcT→C (▲) and olive (▼) at (a) 40 and (b) 150 µmol photons m-2 s-1 in conical flasks with air bubbling. Results are from three biological replicates. The errors bars indicate standard deviation. Asterisks indicate a significant difference between samples (p<0.05).
5
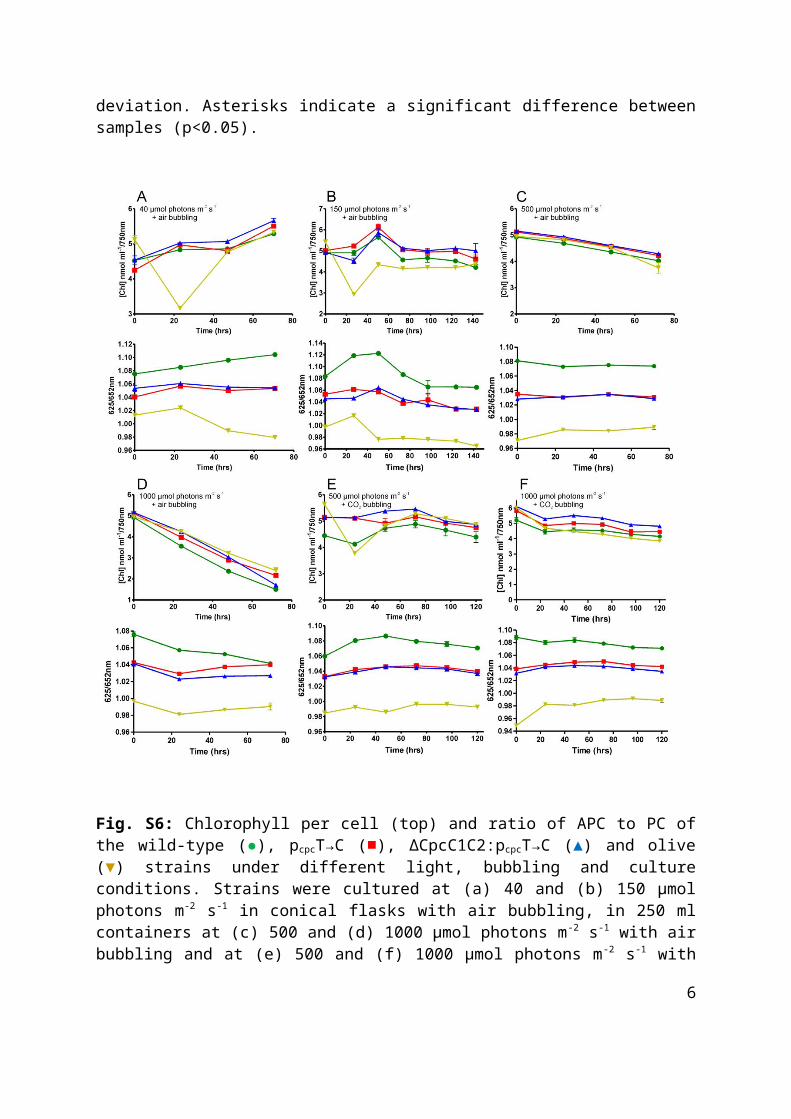
Fig. S6: Chlorophyll per cell (top) and ratio of APC to PC of the wild-type (●), pcpcT→C (■), ∆CpcC1C2:pcpcT→C (▲) and olive (▼) strains under different light, bubbling and culture conditions. Strains were cultured at (a) 40 and (b) 150 µmol photons m-2 s-1 in conical flasks with air bubbling, in 250 ml containers at (c) 500 and (d) 1000 µmol photons m-2 s-1 with air bubbling and at (e) 500 and (f) 1000 µmol photons m-2 s-1 with 5% CO2 bubbling. Results are from three to six biological replicates. The errors bars indicate standard deviation. Asterisks indicate a significant difference between samples (p<0.05).
6

400 450 500 550 600 650 700 750
25
50
75
100
Wavelength (nm)
Rel
ativ
e po
wer
Fig. S7: Relative spectra of white LED lights (black line) and blue, green and red LED lights used in the light penetration experiments. Light spectra were measured using an Ocean Optics Spectrometer USB2000+UV-VIS detector.
7

Fig. S8: Custom made apparatus used for measuring light penetration. It consists of (a) 10 plate-units made by high-density fibreboard - HDF (11mm h x 80 mm w x 80 mm L). Each unit has a central circular cavity (Ø 56mm) for holding the cell suspension and four lateral holes (Ø 10mm) for housing the screws. The internal surface of the central cavity is covered by a layer of aluminium foil for reflecting the light. The units can be piled up to form a (c) chamber with a variable height (from 11 to 110 mm). The bottom of the pile is sealed by a (b) solid place of transparent Perspex® (10mm h x 80 mm w x 80 mm L). The complete unit is shown in (d).
8
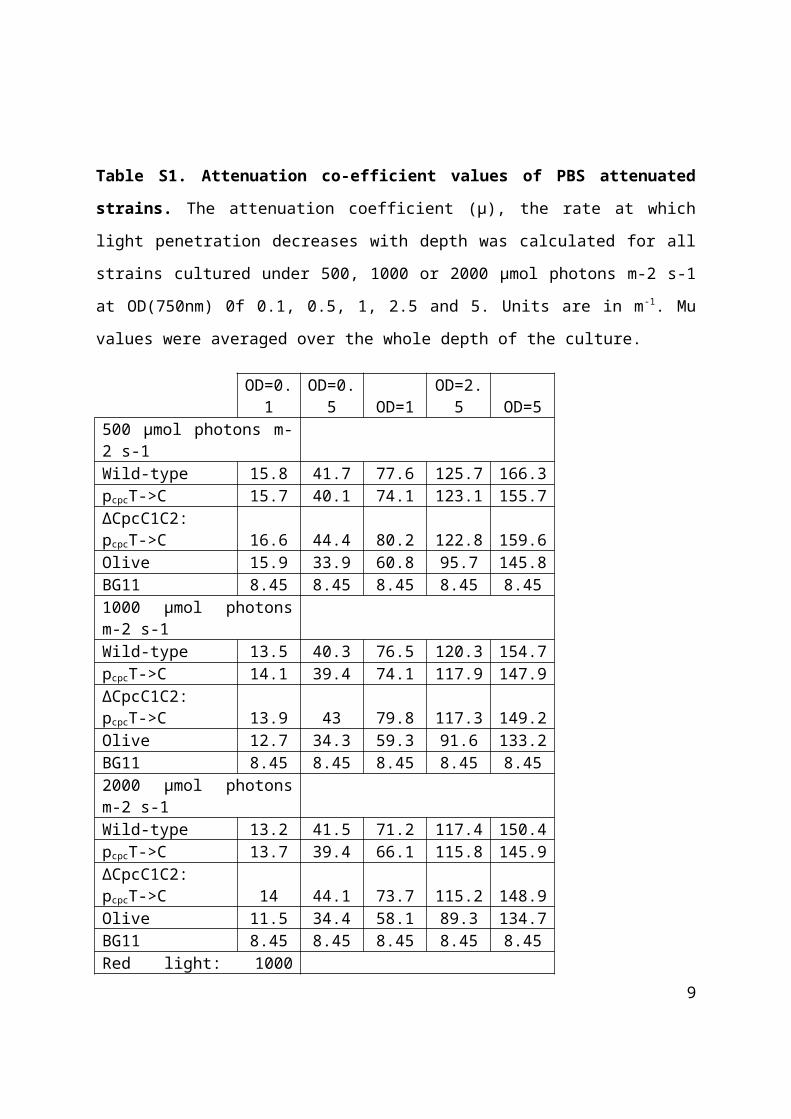
Table S1. Attenuation co-efficient values of PBS attenuated strains. The attenuation
coefficient (µ), the rate at which light penetration decreases with depth was calculated for all
strains cultured under 500, 1000 or 2000 µmol photons m-2 s-1 at OD(750nm) 0f 0.1, 0.5, 1,
2.5 and 5. Units are in m-1. Mu values were averaged over the whole depth of the culture.
OD=0.1 OD=0.5 OD=1 OD=2.5 OD=5500 µmol photons m-2 s-1 Wild-type 15.8 41.7 77.6 125.7 166.3pcpcT->C 15.7 40.1 74.1 123.1 155.7ΔCpcC1C2: pcpcT->C 16.6 44.4 80.2 122.8 159.6Olive 15.9 33.9 60.8 95.7 145.8BG11 8.45 8.45 8.45 8.45 8.451000 µmol photons m-2 s-1 Wild-type 13.5 40.3 76.5 120.3 154.7pcpcT->C 14.1 39.4 74.1 117.9 147.9ΔCpcC1C2: pcpcT->C 13.9 43 79.8 117.3 149.2Olive 12.7 34.3 59.3 91.6 133.2BG11 8.45 8.45 8.45 8.45 8.452000 µmol photons m-2 s-1 Wild-type 13.2 41.5 71.2 117.4 150.4pcpcT->C 13.7 39.4 66.1 115.8 145.9ΔCpcC1C2: pcpcT->C 14 44.1 73.7 115.2 148.9Olive 11.5 34.4 58.1 89.3 134.7BG11 8.45 8.45 8.45 8.45 8.45Red light: 1000 µmol photons m-2 s-1 Wild-type 135.3pcpcT->C 105.2ΔCpcC1C2: pcpcT->C 95.3Olive 80.4Blue light: 1000 µmol photons m-2 s-1 Wild-type 162.8pcpcT->C 153.3ΔCpcC1C2: pcpcT->C 158.8Olive 170.7Green light: 1000 µmol photons m-2 s-1 Wild-type 88.7pcpcT->C 87.1ΔCpcC1C2: pcpcT->C 82.3Olive 80.7
9

Table S2. Conservation of PBS subunits in cyanobacteria. The Synechocystis apcE,
cpcG1, cpcC1, and cpcC2 sequences were used to identify homologues, as indicated by the
positive amino acid similarity, in cyanobacteria. Percent identity is high between the cpcC1,
and cpcC2 sequences; therefore the locus number of the best match is shown to indicate that
these are different genes. Other significant matches to the cpcC2 sequence are shown under
the gene with the highest percent identity.
Strain ApcE CpcG1 CpcC1 CpcC1 locus CpcC2 CpcC2 locusAcaryochloris marina MBIC11017 79/133(59%) 138/176(78%) 226/290(77%) YP_001521651 Anabaena cylindrica PCC 7122 769/900(85%) 141/191(73%) 226/286(79%) YP_007156296 171/278(61%) YP_007156421
Anabaebna sp. 90 764/900(84%) 157/256(61%) 228/286(79%) YP_006995666 Anabaena variabilis ATCC 29413 765/902(84%) 159/256(62%) 229/289(79%) YP_323438 174/283(61%) YP_323433
Arthrospira maxima CS-328 96/123(78%) 187/251(74%) 224/290(77%) EDZ96894 212/274(77%) EDZ96895Arthrospira platensis NIES-39 740/912(81%) 187/251(74%) 227/290(78%) YP_005068161 210/274(76%) YP_005068162
Calothrix sp. PCC 6303 764/906(84%) 207/249(83%) 223/288(77%) YP_007139968 191/253(75%) YP_007139969
170/280(60%) YP_007136555
Calothrix sp. PCC 7507 764/903(84%) 160/256(62%) 228/289(78%) YP_007066926 170/274(62%) YP_007066921 Chamaesiphon minutus PCC 6605 745/906(82%) 196/249(78%) 231/289(79%) YP_007098559 197/273(72%) YP_007098558
157/257(61%) YP_007098548Chroococcidiopsis thermalis PCC 7203 770/902(85%) 156/256(60%) 211/288(73%) YP_007092736 169/284(59%) YP_007092731 Coleofasciculus chthonoplastes PCC 7420 82/136(60%) 213/249(85%) 212/289(73%) EDX73562 208/270(77%) EDX73526 Crinalium epipsammum PCC 9333 764/907(84%) 156/256(60%) 214/284(75%) YP_007142207 Crocosphaera watsonii WH 8501 807/901(89%) 213/249(85%) 178/288(61%) ZP_00514728 165/273(60%) ZP_00518419
156/252(61%) ZP_00514727 Cyanobacterium aponinum PCC 10605 779/911(85%) 212/249(85%) 234/289(80%) YP_007162250 Cyanobacterium stanieri PCC 7202 779/907(85%) 212/249(85%) 174/287(60%) YP_007165176
Cyanobium sp. PCC 7001 459/680(67%) 169/249(67%) 174/290(60%) EDY38806 148/284(52%) EDY37897
Cyanothece sp. ATCC 51142 810/901(89%) 215/250(86%) 247/294(84%) YP_001804068 217/273(79%) YP_001804067
Cyanothece sp. CCY0110 812/901(90%) 180/209(86%) 78/127(61%) ZP_01728351
Cyanothece sp. PCC 7424 811/902(89%) 216/250(86%) 251/291(86%) YP_002375496 221/270(81%) YP_002375497
Cyanothece sp. PCC 7425 754/914(82%) 202/249(81%) 221/289(76%) YP_002482424 201/272(73%) YP_002482425
Cyanothece sp. PCC 7822 809/903(89%) 217/249(87%) 252/291(86%) YP_003886914 221/270(81%) YP_003886915
Cyanothece sp. PCC 8801 817/907(90%) 219/250(87%) 258/292(88%) YP_002373214 227/273(83%) YP_002373213 Cylindrospermopsis raciborskii CS-505 764/897(85%) 139/191(72%) 230/287(80%) EFA69353 Cylindrospermum stagnale PCC 7417 770/901(85%) 160/256(62%) 219/286(76%) YP_007145760 184/281(65%) YP_007145755Dactylococcopsis salina PCC 8305 757/898(84%) 186/252(73%) 188/284(66%) YP_007170674
Geitlerinema sp. PCC 7407 773/902(85%) 154/256(60%) 213/283(75%) YP_007111028 Gloeobacter violaceus PCC 629/938(67%) 69/125(55%) 166/271(61%) NP_924211 164/275(59%) NP_924210
10

7421
Gloeocapsa sp. PCC 7428 764/901(84%) 142/244(58%) 211/284(74%) YP_007130201
Halothece sp. PCC 7418 759/901(84%) 193/252(76%) 188/284(66%) YP_007169542
Leptolyngbya sp. PCC 7376 745/900(82%) 197/252(78%) 176/293(60%) YP_007069747
Lyngbya sp. PCC 8106 745/916(81%) 194/251(77%) 189/283(66%) ZP_01619120
Microcoleus sp. PCC 7113 776/903(85%) 212/249(85%) 230/288(79%) YP_007121790 205/273(75%) YP_007121789
Microcoleus vaginatus FGP-2 747/926(80%) 195/251(77%) 231/288(80%) EGK90278 217/273(79%) EGK90279
162/255(63%) YP_007123833Microcystis aeruginosa NIES-843 798/905(88%) 215/250(86%) 246/291(84%) YP_001657462 214/273(78%) YP_001657461
Moorea producens 3L 740/898(82%) 204/249(81%) 186/286(65%) EGJ32923 167/257(64%) EGJ32920
168/271(61%) EGJ32921 Nodularia spumigena CCY9414 768/903(85%) 161/256(62%) 235/289(81%) EAW42632
Nostoc azollae' 0708 762/900(84%) 159/256(62%) 223/286(77%) YP_003722227 173/280(61%) YP_003720003 Nostoc punctiforme PCC 73102 773/908(85%) 206/249(82%) 228/288(79%) YP_001868556 202/271(74%) YP_001868555
169/262(64%) YP_001864431
Nostoc sp. PCC 7107 774/905(85%) 161/256(62%) 237/289(82%) YP_007050883 174/280(62%) YP_007050889
Nostoc sp. PCC 7120 766/902(84%) 158/256(61%) 229/289(79%) NP_484574 173/281(61%) NP_484569
Nostoc sp. PCC 7524 774/906(85%) 161/256(62%) 227/289(78%) YP_007077538 168/275(61%) YP_007077533 Oscillatoria acuminata PCC 6304 738/905(81%) 194/252(76%) 224/290(77%) YP_007084872 Oscillatoria nigro-viridis PCC 7112 746/933(79%) 197/251(78%) 230/288(79%) YP_007114896 213/276(77%) YP_007114897
158/252(62%) YP_007114000
Oscillatoria sp. PCC 6506 746/912(81%) 187/251(74%) 237/287(82%) ZP_07110955
Pleurocapsa sp. PCC 7327 807/894(90%) 216/250(86%) 240/296(81%) YP_007081101 213/273(78%) YP_007081100
196/274(71%) YP_007081099 Prochlorococcus marinus str. AS9601 Prochlorococcus marinus str. MIT 9202 Prochlorococcus marinus str. MIT 9211 Prochlorococcus marinus str. MIT 9215 Prochlorococcus marinus str. MIT 9301 Prochlorococcus marinus str. MIT 9303 Prochlorococcus marinus str. MIT 9312 Prochlorococcus marinus str. MIT 9313 Prochlorococcus marinus str. MIT 9515 Prochlorococcus marinus str. NATL1A Prochlorococcus marinus str. NATL2A Prochlorococcus marinus str. CCMP1375 Prochlorococcus marinus str. CCMP1986
Pseudanabaena sp. PCC 7367 705/902(78%) 184/251(73%) 171/286(59%) YP_007083591 159/253(62%) YP_007083552
11

Raphidiopsis brookii D9 766/897(85%) 148/252(58%) 230/287(80%) EFA73718
Rivularia sp. PCC 7116 750/906(82%) 158/256(61%) 223/289(77%) YP_007056562 178/283(62%) YP_007056566 Stanieria cyanosphaera PCC 7437 786/895(87%) 215/249(86%) 249/296(84%) YP_007130836 192/274(70%) YP_007130835
195/273(71%) YP_007133444
198/287(68%) YP_007133445
Synechococcus elongatus 440/680(65%) 189/250(75%) 225/292(77%) YP_171208 214/274(78%) YP_171209
Synechococcus sp. BL107 462/706(65%) 173/253(68%) 172/291(59%) EAU70285 145/246(58%) EAU70284
Synechococcus sp. CB0101 357/712(50%) 154/228(67%) 170/284(59%) ZP_07974574
Synechococcus sp. CB0205 350/693(51%) 146/211(69%) 175/293(59%) ZP_07970122
Synechococcus sp. CC9311 484/760(63%) 175/251(69%) 174/291(59%) YP_729740 148/246(60%) YP_729739
Synechococcus sp. CC9605 459/695(66%) 170/253(67%) 168/291(57%) YP_380775 149/246(60%) YP_380774
Synechococcus sp. CC9902 462/706(65%) 172/253(67%) 173/293(59%) YP_377884 146/246(59%) YP_377885 Synechococcus sp. JA-2-3B'a(2-13) 703/906(77%) 142/244(58%) 186/298(62%) YP_478925
Synechococcus sp. JA-3-3Ab 703/907(77%) 142/244(58%) 184/298(61%) YP_475444
Synechococcus sp. PCC 6312 750/908(82%) 148/244(60%) 222/289(76%) YP_007062150
Synechococcus sp. PCC 7002 758/898(84%) 200/250(80%) 229/289(79%) YP_001735447
Synechococcus sp. PCC 7335 729/904(80%) 195/249(78%) 212/291(72%) EDX86812 205/273(75%) EDX86330
158/258(61%) EDX84538
161/282(57%) EDX84390
Synechococcus sp. PCC 7502 710/903(78%) 154/255(60%) 223/287(77%) YP_007107298 201/281(71%) YP_007107297
Synechococcus sp. RCC307 470/716(65%) 172/239(71%) 177/291(60%) YP_001228294
Synechococcus sp. RS9916 515/872(59%) 173/253(68%) 170/291(58%) EAU72911 145/244(59%) EAU72910
Synechococcus sp. RS9917 352/697(51%) 168/249(67%) 174/288(60%) EAQ68494 149/283(52%) EAQ68490
Synechococcus sp. WH 5701 376/729(52%) 167/250(66%) 172/284(60%) EAQ76783 155/284(54%) EAQ76787
Synechococcus sp. WH 7803 458/698(65%) 174/249(69%) 178/292(60%) YP_001224226 143/246(58%) YP_001224225
Synechococcus sp. WH 7805 458/696(65%) 174/249(69%) 175/293(59%) EAR19013 150/245(61%) EAR19015
Synechococcus sp. WH 8102 459/695(66%) 173/250(69%) 176/293(60%) NP_898090 145/249(58%) NP_898091
Synechococcus sp. WH 8109 457/695(65%) 170/253(67%) 168/291(57%) EEX07449 147/244(60%) EEX07824 Thermosynechococcus elongatus BP-1 748/907(82%) 148/250(59%) 223/289(77%) NP_682749 Trichodesmium erythraeum IMS101 738/909(81%) 188/254(74%) 189/288(65%) YP_723585 176/271(64%) YP_720838
166/271(61%) YP_720850
163/257(63%) YP_723586
cyanobacterium UCYN-A
Table S3. Strains used in this study.
Strain Genotype Reference
WT Synechocystis sp. PCC 6803 Wild-type Williams et al, 1988
∆CpcC2 ∆ CpcC2 This study12

∆CpcC1C2 ∆ CpcC1C2 This studyOlive ∆ CpcBAC1C2 This studypcpcT->C Wild-type/T→C 258 upstream of cpcB start codon This studypcpcT->G Wild-type/T→G 258 upstream of cpcB start codon This study∆CpcC2: pcpcT->C ∆ CpcC2/T→C 258 upstream of cpcB start codon This study∆CpcC2: pcpcT->G ∆ CpcC2/T→G 258 upstream of cpcB start codon This study∆CpcC1C2:pcpcT->C ∆ CpcC1C2/T→C 258 upstream of cpcB start codon This study∆CpcC1C2:pcpcT->G ∆ CpcC1C2/T→G 258 upstream of cpcB start codon This study
Table S4. Sequence of primers used in this study. Restriction endonuclease sites
introduced into the primer are underlined.
Primer name Sequence (5’ to 3’)cpcC2leftfor GTACTCTAGAAAGAGAAGCGACCCCAAGTcpcC2leftrev GATCGGATCCACAAATCAATCGCCAAGGAGcpcC2rightfor GATCGAGCTCTGCACTGGTCAGTCGTTCcpcC2rightrev GACTGAATTCATCGTTGCTTGAACGGTCTCcpcC1leftfor GTACTCTAGAGCGGCTAAATGCTACGACcpcC1leftrev GATCGGATCCGCGGTAATTGTTCCCTTTGAcpcBrightfor GATCGAGCTCCGAGTGAATACGTCGAACAcpcBrightrev GACTGAATTCATCGATAGGCGACGGACATAcpcproleftfor GTACGAATTCATTCGGTGCTGCTCAGAAAGcpcproleftrev GTACGGATCCTGCAAAAGCATTCAAGCCTAcpcprorightfor GTACGGATCCTCCCTGTGGTTTGTCTGTGAcpcprorightrev GATCAAGCTTACCGTTTGAAAACCGACAAGcpcprointfor GTCACCCGGGGATTTATGAGAGATcpcprointtrev GATCAAGCTTCTTTGCCATGGCCAGTCTTcpcprointforT-C GACTTTATACAACGGTGATGGGACTcpcprointforT-G CACTTTATACAACGGTGATGGGACTcpcC2for AAAGTCAGGGCGTAACTCCAcpcC2rev ATGTCCCAGGAACGACTGACcpcC1for GTTTTCATTGGCATCGGTCTcpcBrev GGTTGTCTTCCCTTCCCAAT
13

14


![arXiv:1902.02860v1 [cs.LG] 7 Feb 2019 · location), and yield difference of 148,452 samples for different hybrids planted in different years and locations. Yield difference is the](https://img.dokumen.tips/doc/110x75/5f8a3088f2c8c7460968f4cb/arxiv190202860v1-cslg-7-feb-2019-location-and-yield-difference-of-148452.jpg)


![1 Difference equations - MIT OpenCourseWare...1 Difference equations. 5. The samples grow quickly. Their growth is too rapid to fbe logarithmic, unless f[n] is an unusual function](https://img.dokumen.tips/doc/110x75/5e9dc0fbf1ffa0604b146bfe/1-difference-equations-mit-opencourseware-1-difference-equations-5-the-samples.jpg)


