Embed Size (px)
Citation preview

# segments
()
# objects # segments/object
() ()
diamond center(1) # directions(4) # segments/
vertices (4) direction(2)

Exercise: The Earth’s Circumference
Estimate the circumference of the earth. Break down this problem in such a way as to
take advantage of the following facts:
1. The distance between New York and San Francisco is about 3,000 miles.
2. There are 24 time zones.
3. New York and San Francisco are 3 time zones apart.
Estimate the number of piano tuners in Chicago, assuming:
1. Chicago has a population of about 3 million people.
2. A family contains four members on the average.
3. One in five families owns a piano.
4. A piano tuner takes a two-week vacation during the year.
5. A piano tuner services four pianos every day of the work week on the average.
6. All pianos are tuned once a year on the average.


Functional Decomposition: An Approach to Solving Complex Problems
1. Break down the complex problem into simpler problems.
2. Solve each simpler problem. *
3. Put the solutions back together to arrive at the solution to the original problem. * If the simpler problems are still too complex, continue the break down process.
How to read:
Doing A involves doing A1, A2, and A3, but not necessarily every time, or in that order
The Flow of Control
1 12
2 3 10 11
4 5 6 7 8 9
A
A2 A1 A3
A22 A23 A21
A
A2 A1 A3
A22 A23 A21

Part
Whole
Part
Whole Part
Whole
Part
Whole
Part
Whole Part
Whole
Whole
Part Part Part

Legend:
Department
System


From Analysis to Design
X Y
The Centerpiece of Systems Analysis: Data Flow Diagram
X Y
X
The Centerpiece of Systems Design: Structure Chart
A
B
C D
A B C D

The Hidden Logic of Execution
The logic in a module =
The manner/sequence in which it executes its subordinate
modules. It does not address the module’s peers or superiors.
The above structure chart may be executed in any of the following ways,
depending on the logic hidden in module A.
Scenario 1
Scenario 2
Scenario 3
Scenario 4
A1
A2
A3
A3
A2
A1
A1
IF … THEN
A2
ELSE
A3
ENDIF
A1
IF … THEN
A2
ENDIF
A3
A
A2 A1 A3

The data flow diagram (DFD), reflecting user requirements.

The Process of Building A Structure Chart
The Starting Point
The Purchasing Fulfillment System works as follows. First supplier-related data are obtained. This
involves getting quotes from suppliers and getting supplier material evaluations from engineering.
Then material-related data are obtained. This involves getting the production capacities from
production schedulers and based on those calculating material forecasts, getting material specs from
engineering, and getting the production schedule from production schedulers. Next, purchase
agreements are planned and purchased good specs are developed. Finally, material orders are
produced, which involves producing bill of material, selecting preferred supplier, generating the
order, and sending the order to the supplier.
The Transformation The Purchasing Fulfillment System [works as follows.]
[First] supplier-related data are obtained Get supplier data
[This involves]
getting quotes [from suppliers] Get supplier quotes
[and]
getting supplier material evaluations [from engineering] Get supplier material evaluations
[Then] material-related data are obtained Get material data
[This involves]
getting the production capacities from [production schedulers] Get production capacities
[and based on those] calculating material forecasts Calculate material forecasts
getting material specs [from engineering] Get material specs
[and] getting the production schedule [from production schedulers] Get production schedule
[Next,] purchase agreements are planned Plan purchase agreements
and purchased good specs are developed Develop purchased goods specs
[Finally,] material orders are produced Put material orders
[which involves]
producing bill of material Produce bill of materials
selecting preferred supplier Select preferred supplier
generating the order Generate order
[and] sending the order [to the supplier.] Put order

The Action Diagram
0. The Purchasing Fulfillment System
1. Get supplier data
1.1. Get supplier quotes
1.2. Get supplier material evaluations
2. Get material data
2.1. Get material forecasts (note: this is a new boss added)
2.1.1. Get production capacities
2.1.2. Calculate material forecasts
2.2. Get material specs
2.3. Get production schedule
3. Plan purchase agreements
4. Develop purchased goods specs
5. Put material orders
5.1. Produce bill of materials
5.2. Select preferred supplier
5.3. Generate order
5.4. Put order
Children Indent
Siblings Align

The Structure Chart

The (“diamond”)

From the standpoint of user interface, = Menu
MS-Word
File … …
Print … …
Select
Range Select
Number of
Copies
Select
Printer
Selected
Range
Specified
Pages
Current
Page
Print All
Pages
“And”
“Or”

The (“hat”)
=
Read Payroll
File
Guests
Perform
Calculations
Paycheck
Produce
Paycheck
poiuytrewq……………
qwertyuiop……………
………………………...
lkjhgfdsa……………..
asdfghjkl……………..
………………………
zxcvbnm……………..
mnbvcxz……………..
……………………….
Read Payroll
File
Perform
Calculations
Paycheck
“The listed children are chunks of code within the
parent module, rather than physically independent
modules”

Structure Chart: Benefits
Communicates effectively
Diagrams reduce the intimidation index of users
Helps organize work
Provides a basis for division of labor among programmers
Fosters reusability
Utility modules are reusable (write/test once, use many times)
Reduces program errors
Design: Top-down
Construction/Testing: Bottom up
Action Diagrams
Action Diagram = Functional Decomposition + Structured English
How many months would it take to build a 30-story
hotel?
Modern Incarnation:
Service-Oriented Architecture

Structure Chart: Design Criteria
Concept
Definition
Analogy
Design
Approach
Coupling
Dependence among
modules; the need
to share data
Two neighboring
towns depending
on each other for
services
Heavy traffic
Minimize
Cohesion
Wholeness of each
module; the needed
data are self-
contained
Each town having
all the services it
needs
Light traffic
Maximize
Span of Control
Number of
subordinates of a
module
Number of
employees under a
supervisor
Optimize Relative to height
Height
Number of levels in
the hierarchy
Number of
management levels
Optimize Relative to span of
control

Structure Chart: Design Criteria
Examples of poorly-designed and well-designed structure charts
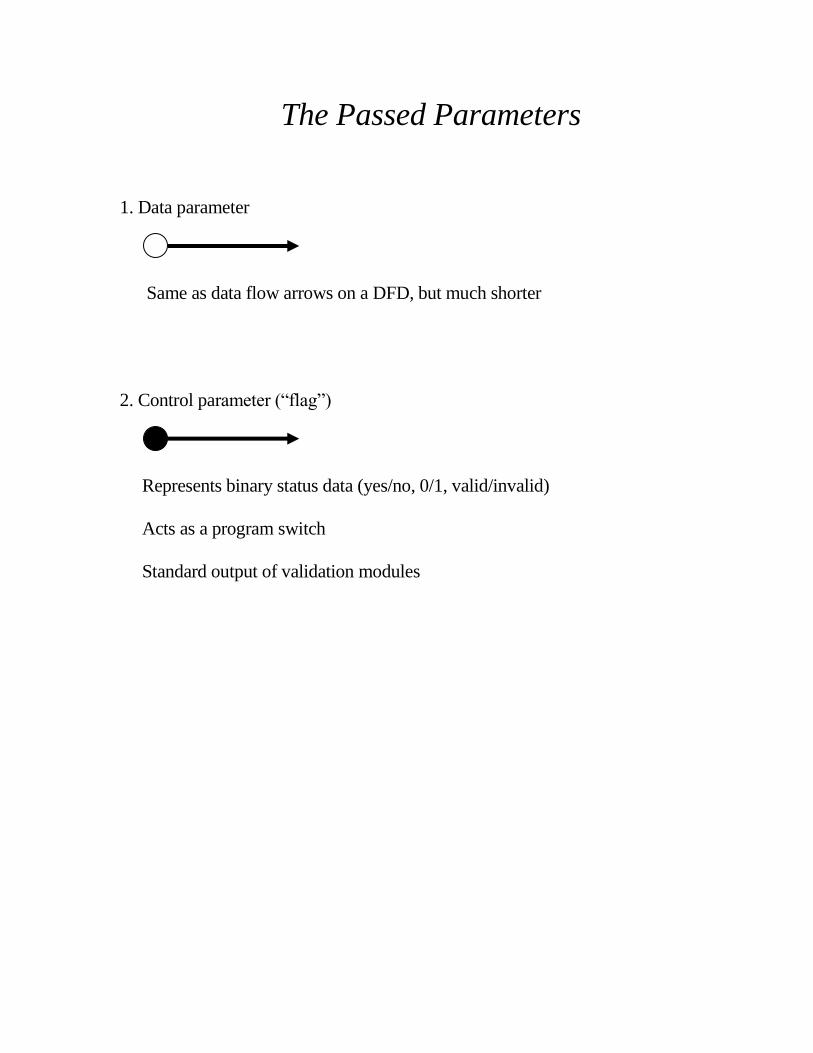
The Passed Parameters
1. Data parameter
Same as data flow arrows on a DFD, but much shorter
2. Control parameter (“flag”)
Represents binary status data (yes/no, 0/1, valid/invalid)
Acts as a program switch
Standard output of validation modules
Structure Charts: Quality Control Checklist
Name each module starting with a verb, as if ordering someone to do it. This someone may later
turn out to be the computer.
Correct : Calculate Balance
Incorrect : Balance Calculation, Calculates Balance, Calculating Balance, Balance
The only exception is the name of the module on the highest level. Since it is the name of the
entire system, it may start with a noun.
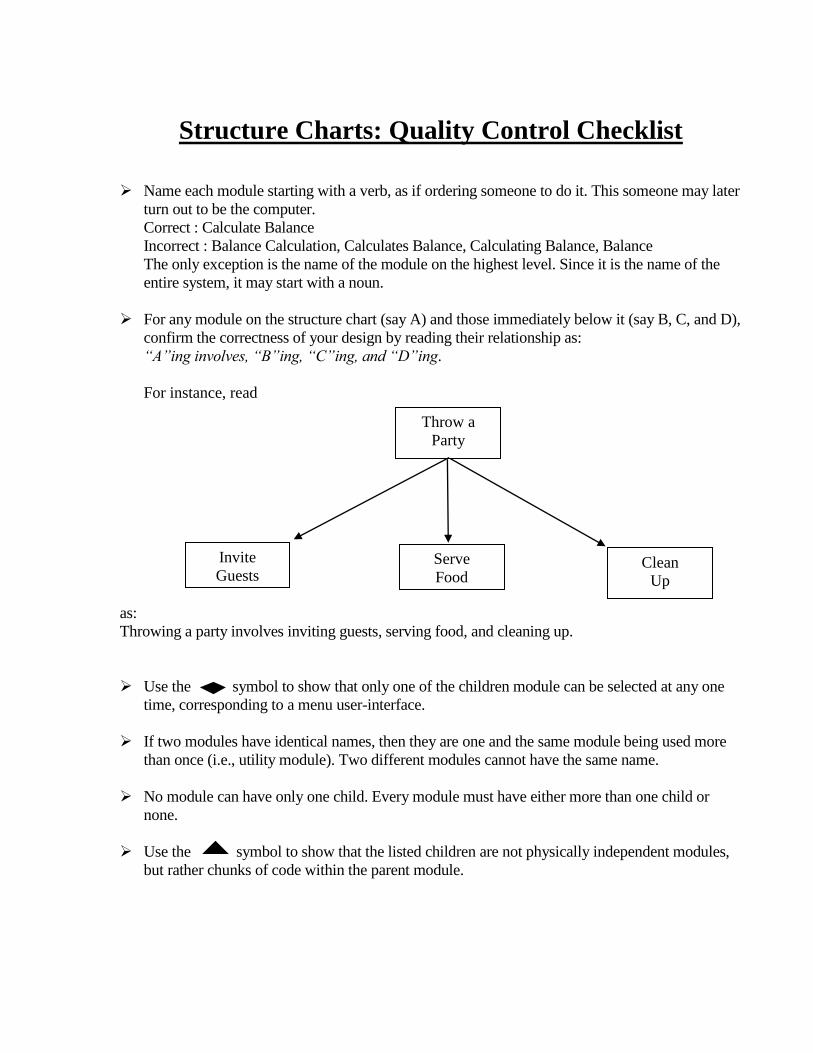
For any module on the structure chart (say A) and those immediately below it (say B, C, and D),
confirm the correctness of your design by reading their relationship as:
“A”ing involves, “B”ing, “C”ing, and “D”ing.
For instance, read
as:
Throwing a party involves inviting guests, serving food, and cleaning up.
Use the symbol to show that only one of the children module can be selected at any one
time, corresponding to a menu user-interface.
If two modules have identical names, then they are one and the same module being used more
than once (i.e., utility module). Two different modules cannot have the same name.
No module can have only one child. Every module must have either more than one child or
none.
Use the symbol to show that the listed children are not physically independent modules,
but rather chunks of code within the parent module.
Throw a
Party
Invite
Guests
Guests
Serve
Food
Clean
Up
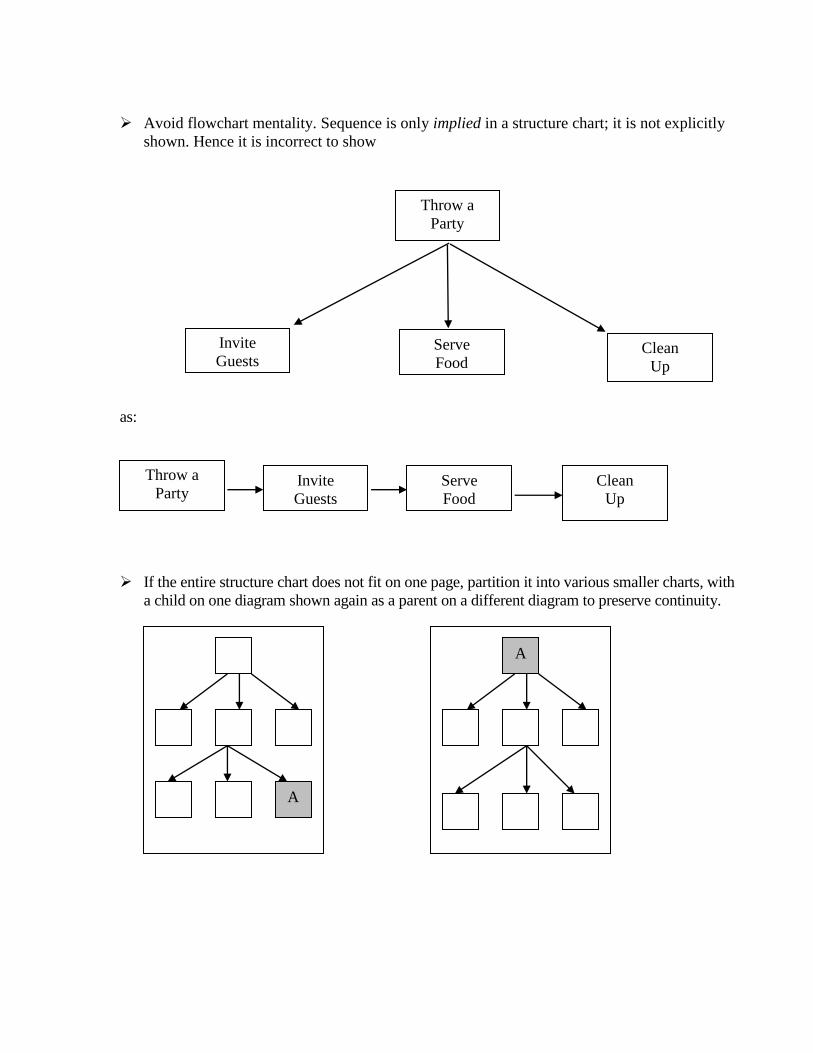
Avoid flowchart mentality. Sequence is only implied in a structure chart; it is not explicitly
shown. Hence it is incorrect to show
as:
If the entire structure chart does not fit on one page, partition it into various smaller charts, with
a child on one diagram shown again as a parent on a different diagram to preserve continuity.
Invite
Guests
Guests
Serve
Food
Clean
Up
Throw a
Party
Throw a
Party
Invite
Guests
Guests
Serve
Food
Clean
Up
A
A
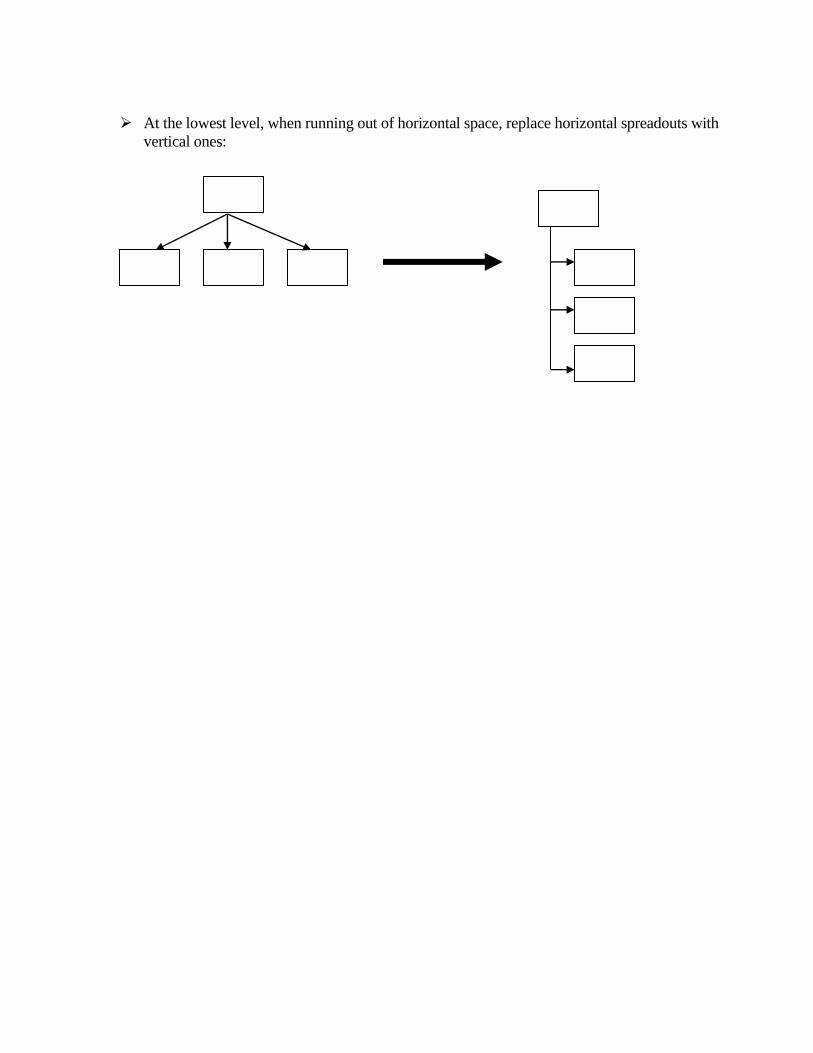
At the lowest level, when running out of horizontal space, replace horizontal spreadouts with
vertical ones:

In-Class Assignment: Action Diagram
Create an action diagram for the following application. Number each level.
The payroll program is run either to conduct transactions or to produce
management reports. It conducts transactions by getting time card data, performing
the necessary calculations, and producing the required output. Getting time card
data involves getting employee time card, validating it, and reading employee
record. Performing calculations comprises getting employee pay rates and
calculating pay amounts. The latter is done by calculating base amount, overtime
amount, taxes, and other deductions. Producing the output consists of updating
employee record, writing payroll transactions, and updating general ledger.
card-number valid-
status
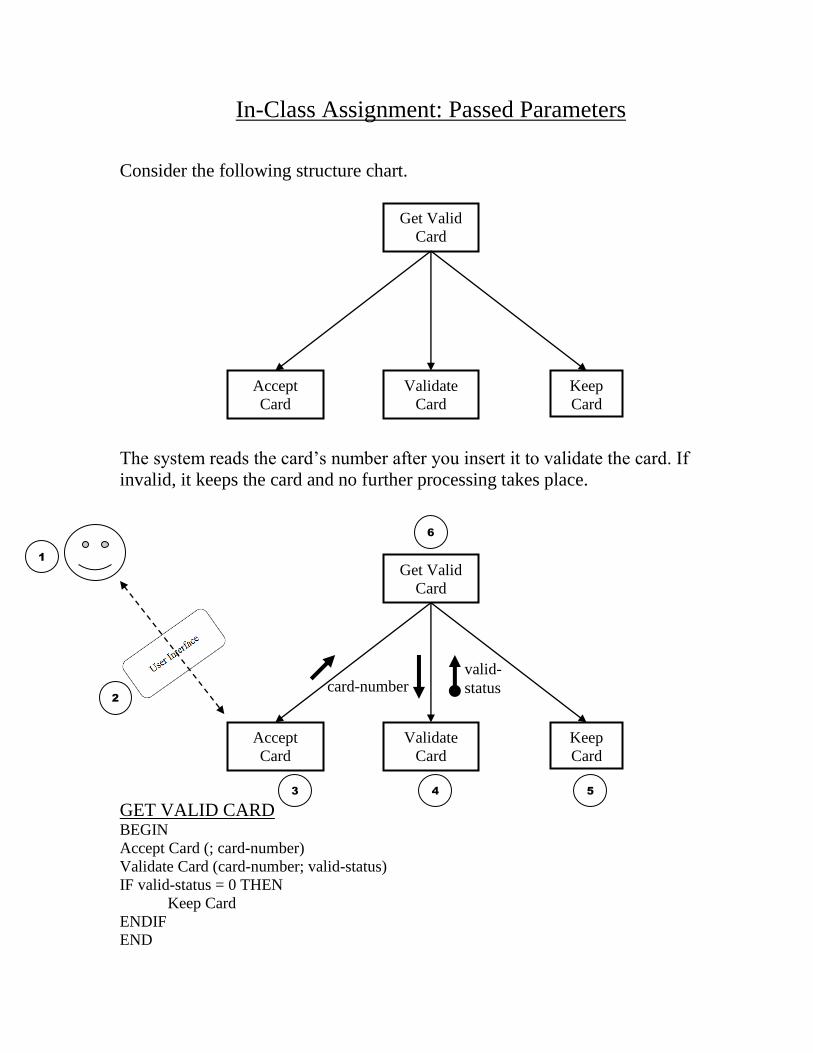
In-Class Assignment: Passed Parameters
Consider the following structure chart.
The system reads the card’s number after you insert it to validate the card. If
invalid, it keeps the card and no further processing takes place.
GET VALID CARD BEGIN
Accept Card (; card-number)
Validate Card (card-number; valid-status)
IF valid-status = 0 THEN
Keep Card
ENDIF
END
Get Valid
Card
System
Accept
Card
System
Validate
Card
Keep
Card
Get Valid
Card
System
Accept
Card
System
Validate
Card
Keep
Card
1
2
3 4 5
6

Card-
Number
Valid-
Status
456CBA 1
789XYZ 0
123XYZ 1
456ABC 1
123ABC 0
789ABC 1
Card
Number: 123ABC

card-number valid-
status
Important Note
A always goes UP.
It never goes DOWN!
WHY?!
A is only a messenger carrying a 0/1 value to the boss module. The boss
looks at its value, and based on whether it is a 0 or a 1, makes a decision one way
or another.
GET VALID CARD BEGIN
Accept Card (; card-number)
Validate Card (card-number; valid-status)
IF valid-status = 0 THEN
Keep Card
ENDIF END
There is no point in sending the to the Keep Card module.
The Keep Card module is only a servant. It does not need to know whether
carries a 0 or a 1.
Get Valid
Card
System
Accept
Card
System
Validate
Card
Keep
Card
Incorrect!

ATM Structure Chart