Embed Size (px)
Citation preview

© Robert Magee, Kellogg School of Management 2008
Understanding and UsingFinancial Statements
Mini-MBA
Robert P. Magee
8 September 2008

© Robert Magee, Kellogg School of Management 2008
Agenda
• Review of financial statement relationships
– “Plumbing”
– Reporting conventions
– Producing reports
• Financial analysis
– Ratios
– Reverse engineering

© Robert Magee, Kellogg School of Management 2008
The Balance Sheet
• “Snapshot” at a point in time• Levels of Assets
– Resources listed by type
• Levels of Liabilities and Shareholders Equity– Claims on resources
– Fixed claims (liabilities)
– Flexible claims (shareholders equity)

© Robert Magee, Kellogg School of Management 2008
The Income Statement
• Flows of resources (net assets)– Over a period of time
– Resulting from operations
• Revenues reflect inflows of resources• Expenses reflect outflows of resources• Try to separate ongoing amounts from infrequent
amounts

© Robert Magee, Kellogg School of Management 2008
The Statement of Cash Flows
• Flows of Cash– Over a period of time
– Three classifications• Operations
• Investing
• Financing
• Two methods of presentation for Operations– Direct – easy to understand
– Indirect – what everyone reports!

© Robert Magee, Kellogg School of Management 2008
The Accounting Model (BS)
ASSETS = LIAB'S + SHAREHOLDERS EQUITYContr'd Ret'd
Cash A/R Inv PPE,net = A/P Capital Earnings
0 0 0 0 0 0 0

© Robert Magee, Kellogg School of Management 2008
The Accounting Model (BS+IS)
ASSETS = LIAB'S + SHAREHOLDERS' EQUITYContr'd Ret'd
Cash A/R Inv PPE,net = A/P Capital Earnings Revenue Expense
0 0 0 0 0 0 0

© Robert Magee, Kellogg School of Management 2008
The Accounting Model (BS+IS+SCF)
ASSETS = LIAB'S + SHAREHOLDERS' EQUITYContr'd Ret'd
Opns Invstg Fincg Cash A/R Inv PPE,net = A/P Capital Earnings Revenue Expense
0 0 0 0 0 0 0

© Robert Magee, Kellogg School of Management 2008
Accounting Measurement Principles
• Timing of revenue recognition– Revenue must have been “earned”
– Amount to be received can be estimated with reasonable certainty
• Timing of expense recognition
– Match expenses with the revenues they produce
– Occasional conflict with accounting’s “conservatism” in the recognition of assets and liabilities

© Robert Magee, Kellogg School of Management 2008
The Sage Company: Start
ASSETS = LIABILITIES + SHAREHOLDERS' EQUITY
Ppd Acm Con'd Ret'd
Opns Invstg Fincg Cash A/R Inv Rent PPE Dep = A/P W/P STDt Tx/P LTDt Cap Earn Rev Exp
600 6500 2400 1900 -800 = 3000 100 1600 4600 1300

© Robert Magee, Kellogg School of Management 2008
The Sage Company: 1-6
ASSETS = LIABILITIES + SHAREHOLDERS' EQUITY
Ppd Acm Con'd Ret'd
Opns Invstg Fincg Cash A/R Inv Rent PPE Dep = A/P W/P STDt Tx/P LTDt Cap Earn Rev Exp
600 6500 2400 1900 -800 = 3000 100 1600 4600 1300
1200 (1) 1200
3800 (2) 3800
-1800 -1800
3500 -3500 (3)
-1100 (4) -1100
-730 (5) -30 -700
-600 400 (6) -200

© Robert Magee, Kellogg School of Management 2008
The Sage Company: 7-12
ASSETS = LIABILITIES + SHAREHOLDERS' EQUITY
Ppd Acm Con'd Ret'd
Opns Invstg Fincg Cash A/R Inv Rent PPE Dep = A/P W/P STDt Tx/P LTDt Cap Earn Rev Exp
600 6500 2400 1900 -800 = 3000 100 1600 4600 1300
1200 (1) 1200
3800 (2) 3800
-1800 -1800
3500 -3500 (3)
-1100 (4) -1100
-730 (5) -30 -700
-600 400 (6) -200
-800 800 (7)
10 -80 70 (8)
-150 (9) -150
2000 (10) 2000
-16 -1600 -1600 -16
(11) 374 -374
-80 (12) -80

© Robert Magee, Kellogg School of Management 2008
The Sage Company
ASSETS = LIABILITIES + SHAREHOLDERS' EQUITY
Ppd Acm Con'd Ret'd
Opns Invstg Fincg Cash A/R Inv Rent PPE Dep = A/P W/P STDt Tx/P LTDt Cap Earn Rev Exp
600 6500 2400 1900 -800 = 3000 100 1600 4600 1300
1200 (1) 1200
3800 (2) 3800
-1800 -1800
3500 -3500 (3)
-1100 (4) -1100
-730 (5) -30 -700
-600 400 (6) -200
-800 800 (7)
10 -80 70 (8)
-150 (9) -150
2000 (10) 2000
-16 -1600 -1600 -16
(11) 374 -374
-80 (12) -80
SCF I/S

© Robert Magee, Kellogg School of Management 2008
Financial Statements (flows)Statement of Cash FlowsOperations:
Cash receipts from customers $ 3,500Less:Payments to suppliers 1,100Payments to employees 730Payments for rent 600Payments for interest 16Cash from operations $ 1,054
Investing:Proceeds from disposals $10New fixtures and equipment (800)Cash from investing ($ 790)
Financing:Loan repayment (1,600)Proceeds from new loan 2,000Shareholder dividends (80)Cash from financing $ 320
Net change in cash $ 584Beginning cash balance 600Ending cash balance $ 1,184
Income StatementRevenue $ 3,800
Expenses:Cost of goods sold 1,800Salaries and wages 700Rent 200Depreciation 150 2,850
Operating income $ 950Interest expense 16
Income before taxes $ 934Tax expense 374
Net income $ 560

© Robert Magee, Kellogg School of Management 2008
The Sage Company: Close ASSETS = LIABILITIES + SHAREHOLDERS' EQUITY
Ppd Acm Con'd Ret'd
Opns Invstg Fincg Cash A/R Inv Rent PPE Dep = A/P W/P STDt Tx/P LTDt Cap Earn Rev Exp
600 6500 2400 1900 -800 = 3000 100 1600 4600 1300
1200 (1) 1200
3800 (2) 3800
-1800 -1800
3500 -3500 (3)
-1100 (4) -1100
-730 (5) -30 -700
-600 400 (6) -200
-800 800 (7)
10 -80 70 (8)
-150 (9) -150
2000 (10) 2000
-16 -1600 -1600 -16
(11) 374 -374
-80 (12) -80
CL
1184 6800 1800 400 2620 -880 = 3100 70 0 374 2000 4600 1780

© Robert Magee, Kellogg School of Management 2008
Balance Sheet (levels)
Assets Liabilities and shareholders equity
Cash $ 1,184 Accounts payable $ 3,100Accounts receivable 6,800 Salaries and wages payable 70Inventory 1,800 Tax payable 374Prepaid rent 400 Current Liabilities $ 3,544
Current Assets $ 10,184 Long-term loan 2,000Fixtures and equipment at cost 2,620 Common Stock, $1 par 300
Accumulated depreciation (880) Additional paid-in-capital 4,300Plant and equipment, net 1,740 Retained earnings 1,780
Total Assets $ 11,924 Total liabilities and shareholders equity $ 11,924
Balance Sheet July 31, 2000

© Robert Magee, Kellogg School of Management 2008
Reconcile Cash Flow and Income
Statement of Cash Flows-IndirectOperations:
Net income $ 560Adjustments:
Depreciation addback 150Less:
A/R increase (300)Prepaid rent increase (400)Wages Payable decrease (30)
Plus:Inventory decrease 600A/P increase 100Tax payable increase 374
Cash from operations $ 1,054
Statement of Cash FlowsOperations:
Cash receipts from customers $ 3,500Less:Payments to suppliers 1,100Payments to employees 730Payments for rent 600Payments for interest 16Cash from operations $ 1,054
Investing:Proceeds from disposals $10New fixtures and equipment (800)Cash from investing ($ 790)
Financing:Loan repayment (1,600)Proceeds from new loan 2,000Shareholder dividends (80)Cash from financing $ 320
Net change in cash $ 584Beginning cash balance 600Ending cash balance $ 1,184
© Robert Magee, Kellogg School of Management 2008
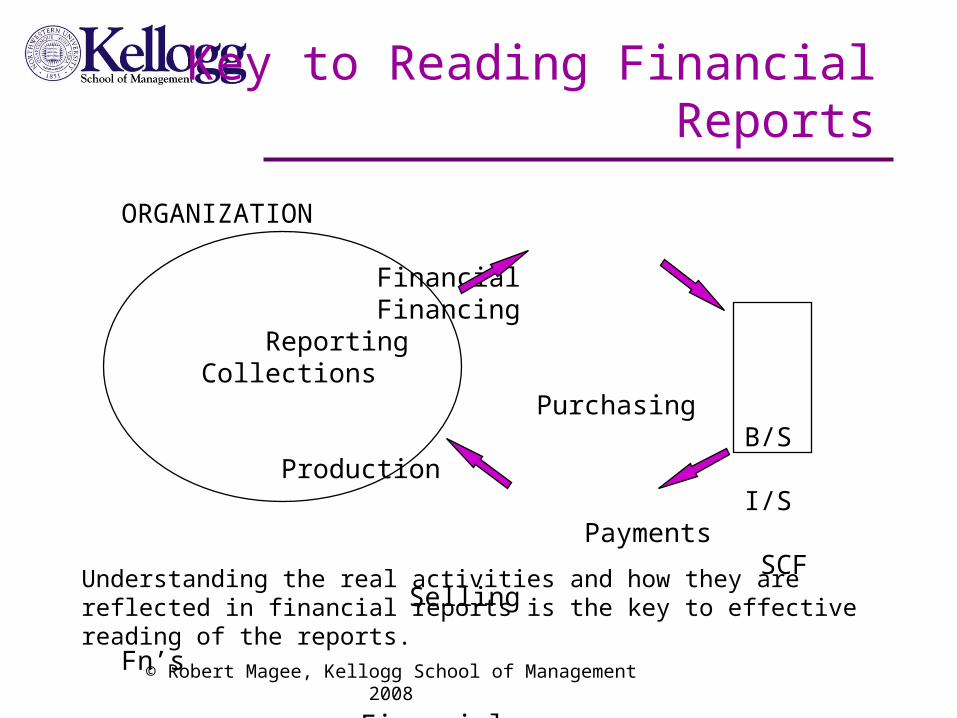
Key to Reading Financial Reports
Understanding the real activities and how they are reflected in financial reports is the key to effective reading of the reports.
ORGANIZATION Financial Financing Reporting Collections Purchasing B/S Production I/S Payments SCF Selling Fn’s Financial Statement Analysis
© Robert Magee, Kellogg School of Management 2008
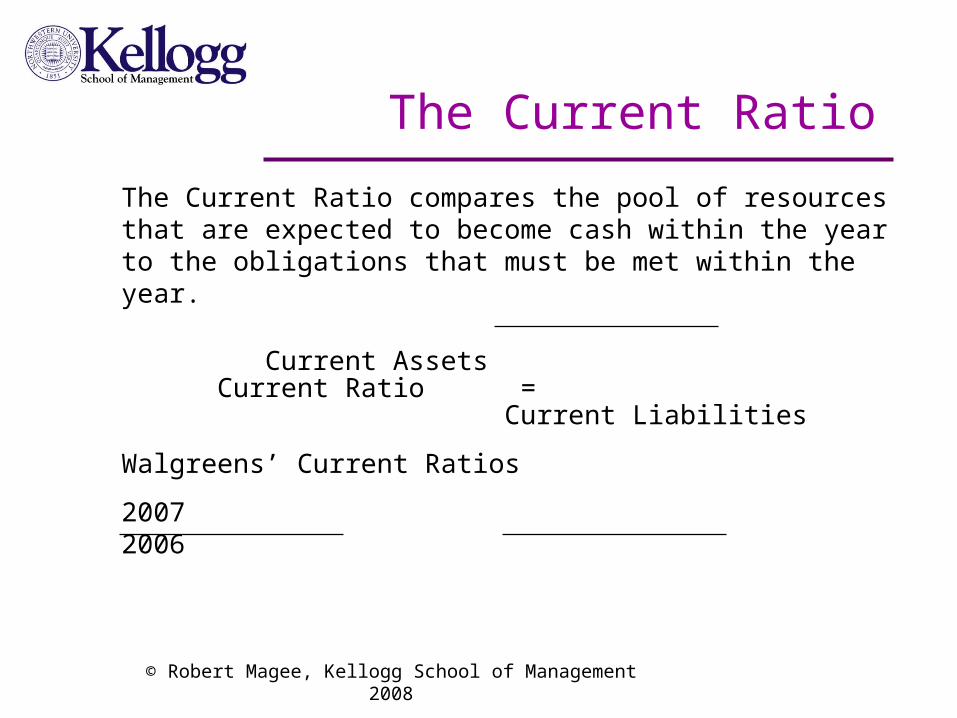
The Current Ratio
The Current Ratio compares the pool of resources that are expected to become cash within the year to the obligations that must be met within the year.
Current AssetsCurrent Ratio =
Current Liabilities
Walgreens’ Current Ratios
2007 2006

© Robert Magee, Kellogg School of Management 2008
Other Liquidity Ratios
Quick ratio = (Current assets – inventory) ÷ Current liabilities
A/R turnover = Sales revenue ÷ Average A/R
Days receivables = Average A/R ÷ (Sales revenue ÷ 365)
Inventory turnover = Cost of goods sold ÷ Average inventory
Days inventory = Average inventory ÷ (Cost of goods sold ÷ 365)
A/P turnover = Cost of goods sold ÷ Average A/P
Days payables = Average A/P ÷ (Cost of goods sold ÷ 365)
Cash operating cycle = Days receivables + Days inventory – Days payables
Days to flame-out = (Cash + Marketable securities) ÷ (-Free cash flow ÷ 365)

© Robert Magee, Kellogg School of Management 2008
The Total Debt to Total Equity Ratio
One measure of the firm’s ability to meet its long-term fixed commitments relates the size of the fixed obligations (liabilities) to the size of the shareholders’ residual claim.
Total LiabilitiesDebt to Equity Ratio =
Shareholders’ Equity
Walgreens’ D/E Ratios
2007 2006

© Robert Magee, Kellogg School of Management 2008
Return on Common Shareholders’ EquityProfitability measures often use a “return on investment” notion so that the accomplishments (profits) are related to the resources provided (investment).
Net Profit to Common1
Return on Shareholders’ Equity = Average Common Shareholders’
Equity
Walgreens’ ROE
2007
1 Net profit to common equals net income minus any dividends to outstanding preferred stock.

© Robert Magee, Kellogg School of Management 2008
Other Profitability Ratios
Earnings per share
= Net profit to common ÷ Average common shares outstanding
Gross margin = Gross profit ÷ Sales revenue
Return on sales (Profit margin) = Net income ÷ Sales revenue
Total asset turnover = Sales revenue ÷ Average total assets
Return on assets (pre-tax) = EBIT1 ÷ Average total assets
Return on assets
= {Net income + (1-tax rate)*Interest expense} ÷ Average assets
1 EBIT is defined as earnings before interest and tax expense.
Ratios Tell A Story: 2005
• Airline company
• Automobile manufacturer
• Pharmaceutical company
• Commercial bank
• Computer and office equipment manufacturer
• Discount general-merchandise store chain
• Electric utility
• Fast-food chain
• Wholesale food distributor
• Supermarket chain
• Internet retailer
• Specialized staffing services company
• Software development company
© Robert Magee, Kellogg School of Management 2008

1 2 3 4 5 6 7 8 9 10 11 12 13
Year-end Dec Jun Dec Dec Dec Jan Dec Oct Dec Feb Dec Jan Dec
Cash 2.4 69.7 14.2 34.7 3.8 4.6 54.1 18.2 35.9 7.4 25.6 11.4 0.3
Receivables 2.2 7.1 4.5 34.2 3.8 1.4 7.4 15.6 6.7 7.5 65.7 4.4 5.2
Inventory 17.6 -- 2.0 -- 9.5 24.5 15.3 9.1 3.6 16.4 0.0 1.8 1.5
Other current assets 1.3 5.5 2.1 8.2 20.1 1.5 2.4 13.0 2.2 2.6 0.5 4.4 4.2
Total current assets 23.5 82.3 22.9 77.1 37.2 32.0 79.2 55.8 48.0 33.9 91.9 22.0 11.2
Net plant and equip 57.7 4.3 63.0 8.4 35.2 57.0 9.4 9.1 4.0 35.1 1.8 67.6 72.2
Goodwill 15.2 4.9 -- 12.6 0.9 9.0 4.3 20.8 31.4 25.9 2.1 3.8 --
Other 3.5 8.6 14.1 1.9 26.7 2.0 7.0 14.3 4.5 5.1 4.3 6.7 16.6
Total assets 100.0 100.0 100.0 100.0 100.0 100.0 100.0 100.0 15.7 100.0 100.0 100.0 100.0
Accts payable 13.7 1.7 2.6 6.7 7.2 18.0 37.0 13.0 2.2 17.7 64.1 5.5 4.8
Short-term debt 4.5 -- 0.6 0.1 18.1 6.5 0.1 2.6 6.7 1.6 4.0 0.3 2.5
Other 8.9 18.0 18.1 18.7 17.5 11.2 15.2 24.7 20.0 6.7 7.1 11.2 5.1
Total current liabilities 27.1 19.7 21.3 25.5 42.8 35.7 52.2 40.3 28.9 26.0 75.2 16.9 12.4
Long-term debt 35.6 -- 64.9 0.2 22.0 19.7 41.2 3.9 11.1 25.2 14.5 17.9 28.8
Other 6.1 3.9 54.6 0.6 17.0 3.6 -- 6.5 20.0 8.9 1.3 5.3 27.4
Total liabilities 68.8 23.6 140.9 26.4 81.9 58.9 93.3 50.6 60.0 60.0 91.0 40.2 68.6
Preferred stock -- -- 2.1 -- -- -- -- -- -- -- -- -- 1.0
Common Stock 22.0 55.3 11.4 66.4 5.4 2.4 61.4 28.6 15.8 4.2 3.0 12.2 11.0
Treasury stock -24.7 -95.2 -7.7 -- -- -- -- -- -60.2 -4.9 -1.2 -8.7 -4.5
Retained earnings 33.9 116.3 -46.7 7.2 12.7 38.7 -54.7 20.8 84.4 40.7 7.2 56.3 23.9
Total owners' equity 31.2 76.4 -40.9 73.6 18.1 41.1 6.7 49.4 40.0 40.0 9.0 59.8 31.4
Total liab. and equity 100.0 100.0 100.0 100.0 100.0 100.0 100.0 100.0 100.0 100.0 100.0 100.0 100.0
Return on sales 1.5% 30.7% -20.8% 7.1% 1.9% 3.6% 4.2% 2.3% 22.7% 2.0% 31.0% 5.9% 7.5%
Asset turnover 2.44 0.81 0.94 2.53 0.74 2.40 2.30 1.13 0.49 3.11 0.05 1.10 0.44
Return on assets 3.6% 24.7% -19.5% 18.0% 1.4% 8.5% 9.7% 2.6% 11.2% 6.1% 1.5% 6.5% 3.3%
Financial leverage 3.20 1.31 NA 1.36 5.53 2.43 15.02 2.03 2.48 2.50 11.14 1.67 3.18
Return on equity 11.4% 32.3% NA 24.5% 7.8% 20.8% 145.9% 5.3% 27.8% 15.4% 16.4% 1.1% 10.4%
Current ratio 0.87 0.04 1.07 0.03 0.87 0.90 1.52 1.39 1.66 1.30 1.22 1.30 0.91
Receivable collection 3 32 18 49 19 2 12 50 50 9 5055 14 44
Inventory turnover 9.9 NA NA NA 6.4 7.5 11.4 7.6 3.1 16.2 NA 31.8 15.4
Gross margin 28.9% 95.3% NA 41.1% 17.9% 22.9% 24.0% 23.2% 77.3% 14.6% NA 33.9% 47.6%
Dividend payout 8.0% 0.5% NA 20.2% 55.3% 21.6% 0.0% 50.0% 60.0% 20.7% 51.3% 29.5% 54.8%
Revenue growth 7.2% 17.9% 8.9% 24.7% 5.4% 11.3% 22.7% 8.8% -4.3% -3.3% 21.4% 4.1% 15.8%
R&D ratio NA 18.6% NA NA 3.8% NA NA 4.0% 17.5% NA NA NA NA

© Robert Magee, Kellogg School of Management 2008
Ratios Tell A Story - Two Lessons
• Ratios are only meaningful when compared to an appropriate benchmark. Comparing ratios of firms from the same industry, with similar strategies, is useful. A firm can provide its own comparison using prior periods if there have been no significant changes in its operations or policies.
• What we have done is to picture how a particular type of company (e.g., a grocery chain or an electric utility) would be reflected in its financial statements. The next step is to picture how a well-run company would be reflected in its financial statements, relative to a poorly-run company.

© Robert Magee, Kellogg School of Management 2008
What Happens When “Hide” Trouble?
• Standard “Red Flags”1
– Net income much higher than operating cash flow– Big differences between tax income and book income– Unsustainable sales– “Reserves”– Asset overstatements (a.k.a. Deferred expenses)– Purchased profits– Growing inventory and/or receivables– Write-offs– Cutbacks in “soft” investments
1 G. Morgensen. “When a Rosy Picture Should Raise a Red Flag” New York Times July 18, 1999.

Reverse Engineering Exercise
© Robert Magee, Kellogg School of Management 2008

Financial Reporting Issues
• Revenue recognition timing – product characteristics
• Accounts receivable valuation – use of estimates
• Inventory – margin and operating analysis
• Noncurrent operating assets – intellectual property
• Financial assets – multiple methods
• Liabilities
• Leases – off-balance-sheet financing
• Shareholders equity – options
• Regulatory changes – movement to IFRS
© Robert Magee, Kellogg School of Management 2008


![005014907 00253 - National Archives of Ireland · Patrick Joseph, Effects £1,092 18B. 9d. [55) MAGEE Robert. £322 188. 9d, Samuel, [68] Effects £72 IOS. MAGEE Samuel. 11771 Effects](https://img.dokumen.tips/doc/110x75/604edf654bcf1d30e60c0c8c/005014907-00253-national-archives-of-patrick-joseph-effects-1092-18b-9d.jpg)