Embed Size (px)
Citation preview

UK NEAFO Work Package 1: Natural capital asset check – Annex 4: Case studies
Contents 1. ASSET CHECK CASE STUDIES ..................................................................................................................................................... 3
1.1. POLLINATORS ASSET CHECK ....................................................................................................................................................... 4 1.1.1. Natural capital asset ................................................................................................................................................. 4 1.1.2. Integrity of natural capital asset .................................................................................................................................. 7 1.1.3. Performance of natural capital asset ........................................................................................................................... 16 1.1.4. Natural capital asset criticalities ................................................................................................................................ 21 1.1.5. Natural capital asset check ........................................................................................................................................ 25 1.1.6. Conclusions ........................................................................................................................................................... 28 1.1.7. Appendix .............................................................................................................................................................. 29 1.1.8. References ............................................................................................................................................................ 32
1.2. ARABLE SOILS ASSET CHECK .................................................................................................................................................... 38 1.2.1. Natural capital asset ............................................................................................................................................... 38 1.2.2. Integrity of natural capital asset ................................................................................................................................ 40 1.2.3. Performance of natural capital asset ........................................................................................................................... 47 1.2.4. Natural capital asset criticalities ................................................................................................................................ 54 1.2.5. Natural capital asset check ........................................................................................................................................ 58 1.2.6. Conclusions ........................................................................................................................................................... 59 1.2.7. References ............................................................................................................................................................ 60 1.2.8. Appendix .............................................................................................................................................................. 62
1.3. BLUE CARBON ASSET CHECK .................................................................................................................................................... 84 1.3.1. Natural capital asset ............................................................................................................................................... 84 1.3.2. Integrity of natural capital asset ................................................................................................................................ 86 1.3.3. Performance of natural capital asset ........................................................................................................................... 95 1.3.4. Natural capital asset criticalities ................................................................................................................................ 98 1.3.5. Natural capital asset check ....................................................................................................................................... 101 1.3.6. Conclusions .......................................................................................................................................................... 103 1.3.7. References ........................................................................................................................................................... 105 1.3.8. Annex ................................................................................................................................................................. 109
1.4. SALTMARSH-FISHERIES ASSET CHECK ........................................................................................................................................... 111 1.4.1. Natural capital asset .............................................................................................................................................. 111 1.4.2. Integrity of natural capital asset ............................................................................................................................... 114 1.4.3. Performance of natural capital asset .......................................................................................................................... 121 1.4.4. Natural capital asset criticalities ............................................................................................................................... 126 1.4.5. Natural capital asset check ....................................................................................................................................... 130

2
1.4.6. Conclusions .......................................................................................................................................................... 132 1.4.7. References ........................................................................................................................................................... 134
1.5. URBAN GREEN SPACE ASSET CHECK ............................................................................................................................................ 136 1.5.1. Natural capital asset .............................................................................................................................................. 136 1.5.2. Integrity of natural capital asset ............................................................................................................................... 139 1.5.3. Performance of natural capital asset .......................................................................................................................... 143 1.5.4. Natural capital asset criticalities ............................................................................................................................... 147 1.5.5. Natural capital asset check ....................................................................................................................................... 149 1.5.6. Conclusions .......................................................................................................................................................... 151 1.5.7. References ........................................................................................................................................................... 152 1.5.8. Appendix ............................................................................................................................................................. 153
1.6. TEES ESTUARY ASSET CHECK ................................................................................................................................................... 166 1.6.1. Natural capital asset .............................................................................................................................................. 166 1.6.2. Integrity of natural capital asset ............................................................................................................................... 168 1.6.3. Performance of natural capital asset .......................................................................................................................... 174 1.6.4. Natural capital asset criticalities ............................................................................................................................... 179 1.6.5. Natural capital asset check ....................................................................................................................................... 184 1.6.6. Conclusions .......................................................................................................................................................... 187 1.6.7. Appendix ............................................................................................................................................................. 188
2. LAKES AND RESERVOIRS ASSET CHECK .................................................................................................................................... 207
2.1.1. Natural capital asset .............................................................................................................................................. 208 2.1.2. Integrity of natural capital asset ............................................................................................................................... 209 2.1.3. Performance of natural capital asset .......................................................................................................................... 213 2.1.4. Natural capital asset criticalities ............................................................................................................................... 215 2.1.5. Natural capital asset check ....................................................................................................................................... 216 2.1.6. Conclusions .......................................................................................................................................................... 217 2.1.7. Appendix ............................................................................................................................................................. 218 2.1.8. Lakes – current condition (WFD Status) ........................................................................................................................ 218 2.1.9. Lakes – trends in water quality .................................................................................................................................. 219 2.1.10. Water supply ........................................................................................................................................................ 220 2.1.11. Hydropower ......................................................................................................................................................... 221 2.1.12. Recreation & Tourism ............................................................................................................................................. 222 2.1.13. References to Lakes and Reservoirs Case Study .............................................................................................................. 224 2.1.14. Appendix 4: List of References .................................................................................................................................. 225

UK NEAFO Work Package 1: Natural capital asset check – Annex 4: Case studies
1. Asset check case studies The working definition of a ‘natural capital asset check’ is:
An assessment of the current and future performance of natural capital assets, with performance measured in terms of their ability to support human well-being.
Thus, the purpose of a natural capital asset check is to assess how changes in a natural capital asset affect human wellbeing. It incorporates concepts of integrity, performance, red flags and sustainability. It is organised in the following main steps:
1. The asset.
2. Integrity of the asset.
3. Performance of the asset.
4. Asset criticalities.
5. Asset check.
6. Conclusions Notes on the Tables: The questions in the tables are in coloured boxes . The tables also include guidance on answering the questions in italics that can be overwritten as the proposed approach is completed. Uncertainty can be described using the following scale, adopted from the UKNEA:
Well established: high agreement based on significant evidence Established but incomplete evidence: high agreement based on limited evidence Competing explanations: low agreement, albeit with significant evidence Speculative: low agreement based on limited evidence

4
1.1. Pollinators asset check
1.1.1. Natural capital asset
Question Guidance on Answer
A. Define Natural Capital asset being checked
Configuration of living and/or non-living processes and functions over space and time, which produce through their existence and/or some combination of their functions, a positive economic or social capital.
The natural capital in question is the natural capital that makes up the pollination service provided by insects to crop plants across the UK. The natural capital asset is made up of both managed pollinators (honeybees) and wild pollinators (mainly bumblebees, solitary bees and hoverflies) and the habitat, ecological processes and human capital that support them. The best indication of the functioning of the natural capital asset is likely to be the insect populations themselves; however the ability of these populations to provide ecosystem services going forward will also depend on the extent and condition of supportive habitat both on farms and in the wider countryside. Habitat areas should provide both nesting sites and foraging resources for wild pollinators and should be linked to maintain healthy pollinator networks. Honeybees are managed within nests but still require that forage plants are available in the surrounding area. Other factors exert negative pressure on wild pollinator populations by increasing mortality or reducing reproductive rates and thus lowering the population size. Such negative factors include pesticides, which can cause acute mortality if incorrectly applied, and may reduce foraging and reproductive success in populations of bees near to farms. Pesticide use may affect populations at a local level, but widespread pesticide use over a large area and over a long period of time could have a cumulative impact. Populations of wild pollinators and honeybees are also subject to biotic threats such as diseases, predators and parasites. Otherwise healthy populations should be able to withstand acute threats of this kind, but there is evidence that negative factors can act in combination with a greater impact; for example pesticide exposure can exacerbate the effect of some diseases (Alaux, Burnet et al. 2010). A diverse assemblage of wild pollinators supported by a network of habitats along with a stable honeybee supply may be the best defence against the impacts of these multiple threats. As well as honeybees, farmers will use other commercial pollinators the most common of which are commercial bumblebees, which are factory reared. For the purpose of the asset check, honeybees are considered as natural capital while commercial bumblebees are not. Honeybees are managed in hives which can persist continuously for years, and are therefore affected by some of the same pressures as wild pollinators, including changes in climate, pesticide use and the threats of pests and diseases. Commercial bumblebees on the other hand, are bred in laboratories and are supplied in boxes which are disposed of at the end of the year; therefore
UK NEAFO Work Package 1: Natural capital asset check – Annex 4: Case studies
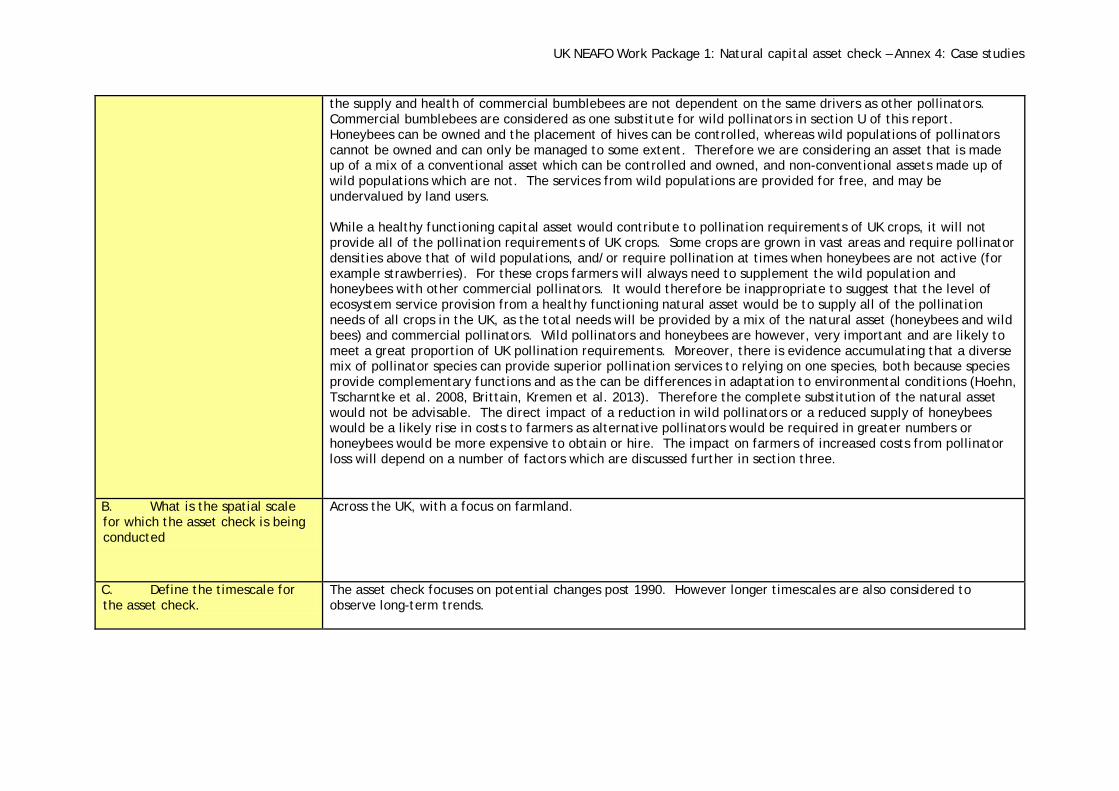
the supply and health of commercial bumblebees are not dependent on the same drivers as other pollinators. Commercial bumblebees are considered as one substitute for wild pollinators in section U of this report. Honeybees can be owned and the placement of hives can be controlled, whereas wild populations of pollinators cannot be owned and can only be managed to some extent. Therefore we are considering an asset that is made up of a mix of a conventional asset which can be controlled and owned, and non-conventional assets made up of wild populations which are not. The services from wild populations are provided for free, and may be undervalued by land users. While a healthy functioning capital asset would contribute to pollination requirements of UK crops, it will not provide all of the pollination requirements of UK crops. Some crops are grown in vast areas and require pollinator densities above that of wild populations, and/or require pollination at times when honeybees are not active (for example strawberries). For these crops farmers will always need to supplement the wild population and honeybees with other commercial pollinators. It would therefore be inappropriate to suggest that the level of ecosystem service provision from a healthy functioning natural asset would be to supply all of the pollination needs of all crops in the UK, as the total needs will be provided by a mix of the natural asset (honeybees and wild bees) and commercial pollinators. Wild pollinators and honeybees are however, very important and are likely to meet a great proportion of UK pollination requirements. Moreover, there is evidence accumulating that a diverse mix of pollinator species can provide superior pollination services to relying on one species, both because species provide complementary functions and as the can be differences in adaptation to environmental conditions (Hoehn, Tscharntke et al. 2008, Brittain, Kremen et al. 2013). Therefore the complete substitution of the natural asset would not be advisable. The direct impact of a reduction in wild pollinators or a reduced supply of honeybees would be a likely rise in costs to farmers as alternative pollinators would be required in greater numbers or honeybees would be more expensive to obtain or hire. The impact on farmers of increased costs from pollinator loss will depend on a number of factors which are discussed further in section three.
B. What is the spatial scale for which the asset check is being conducted
Across the UK, with a focus on farmland.
C. Define the timescale for the asset check.
The asset check focuses on potential changes post 1990. However longer timescales are also considered to observe long-term trends.

6
D. What are the main ecosystem services the asset provides?
Hoverflies, wild bees and honeybees provide pollination services to the UK. Pollination was categorised as a regulating service in the 2010 National Ecosystem Assessment which valued the services from pollination of crops at £430m per year (Smith, Ashmore et al. 2011). Pollinators also provide pollination services to wild plants, maintaining floral diversity, and contributing towards other ecosystem services such as providing seed and berries for bird populations (Jacobs, Clark et al. 2009) and supporting natural vegetation for recreational use. Pollinators also have existence values outside of their use values so people may be willing to pay to conserve bees and other pollinators even if pollination services do not directly benefit them. Honeybees also provide both recreational value and provisioning services through honey production.
Notes: It is useful to define these parameters for the analysis clearly at the outset. If a subset of a natural asset is being checked (e.g. peat bogs in Scotland are a subset of all peat bogs in the UK), then this can affect availability of data and interpretation of results. Our approach in the scoping study for Defra assumes that an asset needs to have some physical measurement, and defines natural capital assets as:
…stock that can be managed or protected in order to have a positive economic or social value. However, in further work looking at the definition of natural capital we have defined it as:
the configuration of living and/or non-living processes and functions over time and space, that produce through their existence and/or some combination of their functions, a positive economic or social value.

UK NEAFO Work Package 1: Natural capital asset check – Annex 4: Case studies
1.1.2. Integrity of natural capital asset Question Guidance on Answer Trends
Past trend Current trend Future Trend Summary of Trends (see key*)
E. What is the extent of the natural capital asset?
Wild bees, including bumblebees and solitary bees, and hoverflies are found throughout the UK. The populations of pollinating species fluctuate from year to year and are not monitored systematically making evaluations of number or density of wild pollinators difficult. There is a particular challenge to monitoring mobile organisms as activity patterns will depend on weather and surrounding resources as well as the underlying extent of the population. Monitoring social species such as bumblebees is made more difficult as many individual workers observed foraging are collectively representative of only one reproductive unit, or nest. One way of dealing with this issue is estimate nest density, rather than abundance of individuals. Using data collected by volunteers for the National Bumblebee Survey 2004, Osborne and colleagues found that nests of bumblebees where at higher densities in gardens and around countryside linear features such as hedgerows and edges of woodland (Osborne, Martin et al. 2008). Other studies have used molecular methods to calculate nest numbers by analysing sibling relationships between bees caught across areas of land. In one such study which compared nest densities of common
In an analysis of 10 x10 km grid squares from the BWARs dataset, bee and hoverfly species numbers where compared from observations before and after 1980; bee diversity was found to be reduced in the majority of grid squares (Biesmeijer, Roberts et al. 2006). The largest declines were in species with narrow habitat requirements. There were no directional changes in hoverfly diversity over the same time period. Bee pollinated plant diversity also declined between datasets, whereas the diversity of other plants did not. Carvell and colleagues also found a decline in “bee-friendly” plants between pre-1980 and post 1980 (Carvell, Roy et al. 2006). They found
Carvalheiro and colleagues have used data at different scales from 10 km upwards to detect changes post 1990 (Carvalheiro, Kunin et al. 2013). Although bumblebee species richness has continued to decline in Great Britain between the 1970 to 1989 dataset and the 1990 onwards data, the species richness decline has been less dramatic that that observed between 1950-1969 and 1970-1989. Solitary bee species appear to have recovered somewhat, species richness increases were detectable in recent years. Rates of wild flower species decline have also slowed. Despite the general downwards trend observable before 1993 it is likely that honey bee
The slowing of the rate of species richness decline in bumblebees and flowering plants, and the apparent recovery of solitary bees detected by Carvalheiro et al is encouraging. However this slowing may be due to the fact the most vulnerable species have already been lost. Social bees are more susceptible to habitat losses and pesticides than solitary bees (Williams, Osborne 2009) which may explain the recovery in solitary bees relative to bumblebees. The current public interest in bees will continue to pull
Insert symbol
Solitary bees
↔
Bumblebees
↓
Hoverflies
↔
Honeybees
↑

8
bumblebee species, it was found that nest densities per ha fell between 0.26 and 1.17 depending on the species (Knight, Martin et al. 2005), summing to 2.4 nests per ha over the 6 most common species. Similarly Darvill et al (Darvill, Knight et al. 2004) found nest densities of 0.13 and 1.93 nests per ha for two species of bumblebee. These estimates were lower than the estimate from the volunteer collected data, which estimated bumblebee nest densities at around 7 per ha for the same study area as Knight et al, 2005 (Osborne et al, 2008). There have been no similar studies on solitary bee or hoverfly population density at a landscape scale. The Bee, Wasps and Ants Recording Society (BWARS) holds observation records for bees and hoverflies dating back to the 1800s. While these data are not standardised in a way that would allow abundance data to be elucidated they do give an indication of species range across the UK, and relative species richness. Relative species richness increases towards the South and West of the Country. The relationship between species richness and abundance is unlikely to be linear as the increased species richness in the South and West of the UK is likely to be made up of rare species which may contribute little to pollination on farmlands. The BWARs dataset can, however, be used to monitor species losses over time. Honeybees The number of honeybees colonies in the UK
declines in ranges as measured by changes in occupancy of 10 km grid squares (from New Atlas of British and Irish Flora),and changes in frequency in randomised fixed 1km plots from Countryside Survey datasets from 1979 and 1998. Post 1980 changes in nectar plant diversity were detected in the Countryside Survey Integrated Assessment in 2007 (Smart et al, 2010). In this case changes where categorised by land use, and were significant (and negative) between 1990 and 2007 in small habitat parcels within arable and horticultural area, improved and neutral grassland, broadleaved and mixed woodland. Numbers of beehives and beekeepers declined between 1983 and 1993, and are lower currently than levels in the 1950’s. In 2001 figures from a government commissioned survey estimated colony
colonies numbers are now increasing. This is due to the increased public interest in bees and beekeeping. There is a general perception that bee starter colonies are hard to come by (Peterson, Gray et al. 2012, Peterson, Gray et al. 2012) and new beekeeper courses have been over-subscribed. BBKA has seen rises in membership in recent years providing positive indications of the increase in honeybee colonies overall.
people towards beekeeping. However many new beekeepers may only stay with the activity for a few years, making little impact on pollination services going forward. Disease risks and increased monitoring are likely to increase costs for commercial beekeepers. Unless pollination and honey prices can cover these costs, commercial beekeepers may leave the market.

UK NEAFO Work Package 1: Natural capital asset check – Annex 4: Case studies
has been estimated at 274,000 (European Commission 2010) Commission Regulation (EU) No 726/2010. While there has been a downward trend detectable in the number of hives based on data up to 1992 (Potts, Roberts et al. 2010) there has also been a surge in amateur interest in beekeeping in recent years which has boosted the number of hives. Most amateur beekeepers keep only one hive, whereas commercial bee farmers keep around 400 each. Commercial bee farmers consequently own around 40% of the hives, despite being far fewer in number (around 300 as opposed to 33,000 amateur beekeepers). The majority of amateur beekeepers do not move their hives to take advantage of different flowering seasons and so only contribute to pollination services in the area around where the hive is kept. The hives owned by bee-farmers are therefore likely to contribute disproportionately to pollination services to crops.
numbers at 230,000, and beekeeper numbers at 33,000. This represented a substantial increase from the last official figure of 130,000 in 1993. Most recent official figures put the total colony number at 274,000 in 2010. (European Commission, 2010) Commission Regulation (EU) No 726/2010
F. What is the condition of the natural capital asset?
Honeybee overwintering rates in the USA have caused concern, particularly due to the sudden disappearance of honeybees from a colony, or Colony Collapse Disorder. Honeybee overwintering rates have been recorded for the COLOSS network in Scotland and England and Wales. Overwintering losses have been around 20% in Scotland since 2007, and peaked in 2010 at 27% (Peterson, Gray 2010, Peterson, Gray et al. 2012). In England and Wales the colony losses where highest in 2008 at 30% but have been lower since and were 14% in 2011 (BBKA 2012). Although variable
Describe/ quantify trend
Colony Collapse Disorder or the sudden disappearance of colonies has been cited as a cause for overwintering losses in the UK (Peterson et al, 2012). Varroa mites and starvation are other common causes of overwintering losses. Beekeepers are vigilant
Describe/ quantify trend
The rise in new beekeepers will increase the extent of the natural asset, however new beekeepers suffer higher overwintering losses suggesting that husbandry practices require attention (Vanderzee et al, 2011). That being said, there is an
Describe expected future trend
There are emerging threats to both honeybees and wild pollinators through alien pests such as the small hive beetle which feeds on young bee larvae and is endemic to the USA. While this pest cannot be eradicated, good
Insert symbol
Wild bees and
hoverflies
O

10
between location and years, there is no evidence for an upward trend in overwintering losses in the UK in recent years (see Appendix table 1). While the cases of colony collapse disorder are likely to be multi-faceted, a combination of Varroa mites, pesticides and viruses (particularly Deformed Wing Virus) have been implicated (Cox-Foster, Conlan et al. 2007). The vast majority of beekeepers in the UK treat and inspect their hives for Varroa and other pests. While pesticides have been long known to adversely affect bees and other pollinating insects, particular attention is now paid to neonicotinoids, which are systemic pesticides usually applied to the seed coat and then move up through all parts of the plant, including pollen and nectar. Pesticide incidence monitoring in England showed a peak in pesticide incidents in 2009 and 2010 (defined as significant mortality caused by one pesticide use event) (Alix, Adam et al. 2013), but the numbers are still relatively low. This acute statistic however, will not detect the effects of chronic exposure to neonicotinoids which is more difficult to monitor. While the disease status of honeybees is well documented, the disease status of wild pollinators is not. Bumblebee colonies also have variable survival rates which are not well studied making it is difficult to predict populations from year to year.
to such losses, and can to some extent mitigate them by propagating new colonies. Overwintering losses reached 30% in England in 2008, but are currently lower. Neonicotinoid pesticides are thought to have an effect on both wild pollinators and managed bees and have increased in use over the past 9 years. While much neonicotinoid use is on crops which are not pollinated by bees, the neonicotinoids clothianidin, imidiacloprid and thiamethoxam are used on oil seed-rape as well as thiacloprid (which is used a foliar spray). While imidiacloprid use on oil seed rape has reduced over recent years, the use of thiamethoxam has increased dramatically. Thiacloprid is used on soft-fruit and orchard fruit. Acetamiprid is used at a low level on orchard fruit.
increased awareness of disease and the sharing of best husbandry practice should allow new beekeepers to manage hives in a healthy way. There is no indication that the peak of overwintering losses in 2008 in England is part of an increasing trend. The policy concerning pesticides is evolving at the current time with a two year moratorium on neonicotinoid pesticide use across the EU coming into place in December 2013 for the three neonicotinoids which are most widely used in the UK (clothianidin, imidiacloprid and thiamethoxam).
monitoring and husbandry can prevent catastrophic effects and minimise spread. Other emerging diseases include Nosema ceranae, originally from Asia but now widespread in both managed honeybees and wild bumblebees. The future condition of wild pollinators and honeybees will depend to an extent on land use and pesticide policies adopted.
Honeybees
↔

UK NEAFO Work Package 1: Natural capital asset check – Annex 4: Case studies
Together, extent and condition reflect the integrity of the stock of natural capital, which produces flows of ecosystem services. Use of historical data must be relevant to the environmental and/or ecosystem services changes from the natural capital asset.
Uncertainties
There is evidence both from bee numbers and the plants that support them that wild bee diversity is decreasing. Well established. Although some sources state that honeybee numbers are declining, no evidence of this was found; sources imply that numbers are increasing
(though most new beekeepers are amateurs rather than professional). Established but incomplete evidence. No evidence was found of increased overwintering rates in the time span for which data is available (since 2006). Well established.
Give level of uncertainty in analysis* for D, E and F, and reasons for this.
* Use Uncertainty scale described in introduction.
Key for trends
↑ increasing ↓ decreasing
↔ evidence shows no trend O no evidence
↑↓ both increasing and decreasing (this could reflect ambiguous evidence and/or spatially differing trends)
G. Drivers of changes in Extent and Condition
List policy drivers Policy drivers
Wild pollinators around farmland are supported under agricultural stewardship schemes in England and Wales. The Entry Level Stewardship scheme encourages the creation, restoration and maintenance of low input permanent grassland and hedgerow management, both of these will be of benefit to pollinator populations (Natural England 2013a). There are drivers to reduce the “hungry gap” so that pollinators are supported throughout the year rather than only during the time of mass flowering. To achieve this swards of native flowering plants including clovers, hogweed and cow parsley are encouraged. The Higher Level Stewardship scheme builds from this providing further support for maintenance of species rich grasslands and pollen and nectar mixes (Natural England 2013b). However, uptake of these schemes in HLS is low. Many of the habitats covered by the UK Biodiversity Action Plan are beneficial to pollinators: improvements to field margins and boundaries and linear features in agricultural landscapes will be of benefit to pollinators around farmland, while improvements in lowland meadows, calcareous grasslands and heathlands will benefit the wider wild pollinator networks. Current agri-environment schemes in England, Wales and Scotland will end in 2013. This will coincide with a review of the European Union Common Agricultural Policy (CAP). Current proposals suggest that an increase in support of agri-environment schemes is likely with new payments for the support of Ecological Focus Areas and permanent grassland. Ecological Focus Areas are areas of in-field and field-side features such as fallow, buffer strips and beetle banks which will make up 5-10% of farmed area. Such a move would likely be

12
positive for pollinators; it would serve to link up populations across landscapes, provide habitat and alternative forage for pollinators and bring pollinators closer to the crop. Nine species of solitary bee and seven bumblebee species were treated as priority species under UK Biodiversity Action Plans and have therefore been incorporated into NERC S41 and equivalent legislation in Scotland and Wales. These species are regarded as conservation priorities but are not individually supported to same level as they were under UKBAPs. This represents a move towards a more holistic approach to conservation, based on ecosystem integrity rather than individual species. While rare pollinators may currently provide little in the way of pollination services to crop lands, their maintenance is important for the conservation of diverse wild flower species. Policies to improve the health of honeybees are evident in all regions of the UK (DEFRA, 2009; Scottish Government, 2010; DARDNI, 2011) with the purpose of “achieving a sustainable and healthy population of honeybees for pollination and honey production”. These strategies all emphasize improved communication between stakeholders, surveillance and monitoring of pests and disease, competency development, and improving the evidence base. In England and Wales, a prevalence reporting network has been developed (BeeBase) to encourage vigilance against diseases and pests, and monitor spread. The Balai direction (92/65/EEC) names American foulbrood, Small Hive Beetle and Tropilaelaps mites as notifiable across the EU. While the honeybee health plans make brief mention of habitat and foraging plant requirements with respect to honeybee needs, the nutritional needs of wild pollinators are not addressed. The Welsh Government has an “Action Plan for Pollinators” currently under consultation, recognising the contribution of wild pollinators and their expected requirements (Welsh Government 2013). The action plan currently states the intention to provide linked, conducive habitats on a local and landscape scale, supporting native flora in protected areas, and encouraging pollinator friendly gardening and land use in urban areas. Plans for monitoring of populations, effects of pesticides and diseases and stakeholder engagement are also included. There is a UK national action plan on the sustainable use of pesticides (DEFRA 2012). The EU has imposed a two-year moratorium on neonicotinoid use based on evidence from both honeybees and wild bees. Most pesticide policy particularly refers to the effect of pesticides on honeybees despite the significant impact that commonly used pollinators can have on solitary bees (Gradish, Scott-Dupree et al. 2012) and bumblebees (Scott-Dupree, Conroy et al. 2009). Neonicotinoid pesticides have been used on oilseed rape seeds and are known to have long half-lives in soil so may continue to affect populations despite the moratorium (half-lives reviewed in Goulson 2013). The area of oil seed rape has increased in the UK over the last 10 years (DEFRA 2012) and prices have risen in the same period reflecting the demand for biodiesel across the EU (Department of Transport 2012). While mass-flowering crops provide a food source and can increase the growth of bumblebee colonies (Westphal,

UK NEAFO Work Package 1: Natural capital asset check – Annex 4: Case studies
Steffan-Dewenter et al. 2009), they can also act as a sink pulling pollinators from native plants (Blitzer, Dormann et al. 2012) and disrupt community composition by favouring short-tongued bumblebees (Diekoetter, Kadoya et al. 2010).
List biophysical drivers
Biophysical Drivers Neonicotinoid pesticides are known to cause a reduction in reproduction of bumblebee nests (Whitehorn, O'Connor et al. 2012) and to impair navigation behaviour in honeybees (Henry, Beguin et al. 2012) and pollen collection in bumblebees (Gill, Ramos-Rodriguez et al. 2012). The effect of exposure to neonicotinoids can act in synergy with the effect of other pesticides and fungicides leading to higher than expected levels of toxicity (Iwasa, Motoyama et al. 2004) and diseases such as Nosema (Alaux, Burnet et al. 2010) therefore any on-going effects of neonicotinoids may make disease management more difficult, potentially leading to increasing overwintering losses in honeybees and reduced population sizes in wild pollinators. Healthy pollinator populations require adequate habitat including foraging resources and nesting sites. Pollinators are sensitive to habitat loss (Winfree, Aguilar et al. 2009), and tend to decrease in abundance further from areas of semi-natural habitat (Ricketts, Regetz et al. 2008). Though this trend was not observed in areas of heterogeneous farmland with fine scale floral resources (Winfree, Williams et al. 2008) suggesting that both areas of habitat and diffuse habitat within agricultural lands can support pollinators. Declines in pollinator diversity are thought to be due in part to post war losses of unimproved grasslands and decline in hedgerows (Goulson, Lye et al. 2008). Areas of important habitat for wild bees in the UK have been stable or increasing in recent years, though in some cases condition of these habitats is poor (Breeze, Roberts et al. 2012). Pollinators are supported within conservation areas: Natura network grasslands and calcareous grasslands have high pollinator species richness, while bumblebees are in high abundance in dry heath (Murray, Fitzpatrick et al. 2012). Within farmlands agri-environment schemes, including unmowed field margins and sown flower strips can boost bee diversity and abundance around farms (Pywell, Warman et al. 2006, Westrich et al. 2006, Pywell, Carvell et al. 2007) and “green veins” such as hedgerows and verges can also boost pollinator populations (Schweiger, Maelfait et al. 2005). Increases in urban areas are unlikely to be a problem for generalist species, as gardens provide rich foraging areas and support dense populations of some wild bee species (Goulson, Lepais et al. 2010), but may reduce specialist species which rely on wild flowers. Nest sites availability can also limit bumblebees and solitary bees. Bumblebees nest in grassy tussocks or underground cavities whereas solitary bees and hoverflies use a variety of substrates including bare soil and tree stumps. There is evidence from Scotland that agri-environment prescriptions such as field margins can promote nesting and foraging at the same time in bumblebees (Lye, Park et al. 2009). Few management prescriptions target increasing nesting sites in other pollinator groups. Climate change will affect the pollinator network. Any directional change in temperature will cause bees to shift their ranges northwards, possibly decoupling local food webs (Memmott, Craze et al. 2007). Climate change can also cause phonological shifts causing some species to emerge earlier, or to have multiple
14
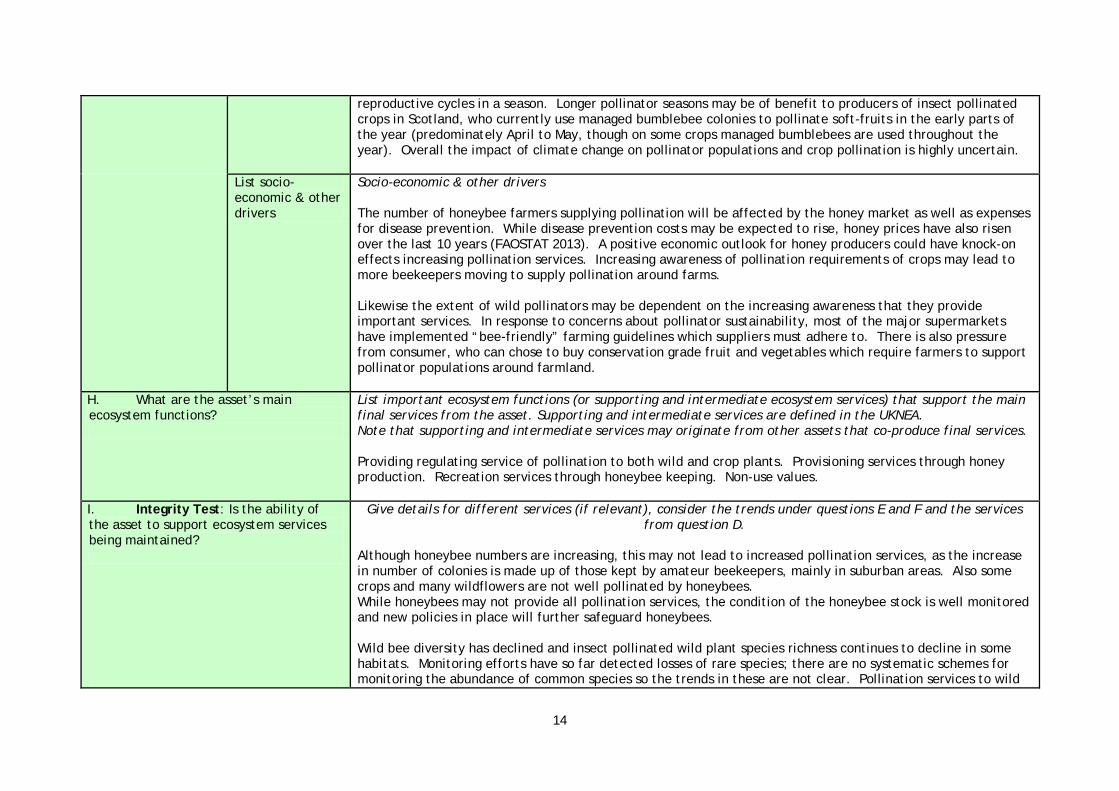
reproductive cycles in a season. Longer pollinator seasons may be of benefit to producers of insect pollinated crops in Scotland, who currently use managed bumblebee colonies to pollinate soft-fruits in the early parts of the year (predominately April to May, though on some crops managed bumblebees are used throughout the year). Overall the impact of climate change on pollinator populations and crop pollination is highly uncertain.
List socio-economic & other drivers
Socio-economic & other drivers The number of honeybee farmers supplying pollination will be affected by the honey market as well as expenses for disease prevention. While disease prevention costs may be expected to rise, honey prices have also risen over the last 10 years (FAOSTAT 2013). A positive economic outlook for honey producers could have knock-on effects increasing pollination services. Increasing awareness of pollination requirements of crops may lead to more beekeepers moving to supply pollination around farms. Likewise the extent of wild pollinators may be dependent on the increasing awareness that they provide important services. In response to concerns about pollinator sustainability, most of the major supermarkets have implemented “bee-friendly” farming guidelines which suppliers must adhere to. There is also pressure from consumer, who can chose to buy conservation grade fruit and vegetables which require farmers to support pollinator populations around farmland.
H. What are the asset’s main ecosystem functions?
List important ecosystem functions (or supporting and intermediate ecosystem services) that support the main final services from the asset. Supporting and intermediate services are defined in the UKNEA. Note that supporting and intermediate services may originate from other assets that co-produce final services. Providing regulating service of pollination to both wild and crop plants. Provisioning services through honey production. Recreation services through honeybee keeping. Non-use values.
I. Integrity Test: Is the ability of the asset to support ecosystem services being maintained?
Give details for different services (if relevant), consider the trends under questions E and F and the services from question D.
Although honeybee numbers are increasing, this may not lead to increased pollination services, as the increase in number of colonies is made up of those kept by amateur beekeepers, mainly in suburban areas. Also some crops and many wildflowers are not well pollinated by honeybees. While honeybees may not provide all pollination services, the condition of the honeybee stock is well monitored and new policies in place will further safeguard honeybees. Wild bee diversity has declined and insect pollinated wild plant species richness continues to decline in some habitats. Monitoring efforts have so far detected losses of rare species; there are no systematic schemes for monitoring the abundance of common species so the trends in these are not clear. Pollination services to wild

UK NEAFO Work Package 1: Natural capital asset check – Annex 4: Case studies
plants are at risk, particularly for specialised plant species, as the diversity of these have declined in parallel with pollinators with narrower niche breadth. Whether the asset as a whole is able to support crop pollination depends on the specific requirements of crops which are discussed in the next section.
Notes: Non-essential supporting information that can be useful for decision-makers includes:
- are the ecosystem services provided by the asset rival or non-rival goods?
- are the ecosystem services provided by the asset market or non-market goods?
- Some main final services may rely on supporting and intermediate services from natural capital assets not considered in the asset check. Links to the status of these other assets may be an important factor for the asset check. It may be possible to consider their status/trend/management within the asset check, but where the links become complex, such analysis may not be feasible. However, these interdependencies should be noted; furthermore the natural capital underpinning the final services in question may justify a separate asset check.

16
1.1.3. Performance of natural capital asset In this context ‘performance’ is fitness to carry out the role which is required of a capital asset. This is regarded as useful because defining the target performance of natural capital assets captures both the current and future quantity and quality of an asset. Human ‘requirements’ include basic human needs, but also reflect infinite wants, so the definition of performance is usually subjective.
Question Guidance on Answer
J. Is there a measure of the current output of services from the asset?
Either a direct measure of levels of services (see question D), or an indication of this based on the amount of the asset (stock) and its ability to provide the service (condition) (see question I) The output of the services from the asset is the yield increase in insect-pollinated agricultural commodities which can be attributed to pollinators. Given the variability in agricultural yields due to inputs other than pollinators, it is not feasible to use yield data to monitor the performance of the asset. Breeze et al (2011) took the approach that the required stocking density of honeybee hives on pollinator dependent crops could be used as a proxy. By assessing the number of hives demanded by the area of insect dependent commodities in production, we can get an idea of the number of honeybee hives which would be needed to maximise production. Assuming that all hives in the UK are moved three times per year, Breeze et al then used the number of honeybee hives to calculate the capacity of the current level of hives to meet this demand. They found that the capacity of honeybees to fulfil pollination requirements has declined in the UK, mainly due to the increase in the areas of oil-seed rape and field beans, which require insect pollination. The capacity of honeybees to meet demand for pollination services fell to 30% in 2007, down from 71% in 1984. These figures are likely to over-estimate the ability of UK honeybees to meet demand for pollinators; the calculations assume that all honeybee hives are moved multiple times per year, given that most hobby beekeepers (who look after 60% of the colonies) do not move their hives it is unlikely that the current stock could meet as much as 30% of crop production needs. Wild pollinators are important for the supply of pollination services. Wild pollinators can also pollinate a wider range of crops than honeybees. Honeybees are short-tongued and so (along with short-tongued bumblebees) tend to nectar rob from flowers with long corollas by biting holes at the base of the flower (Free 1962, Free 1968). Common long-tongued bumblebee species Bombus pascuorum and Bombus hortorum are more suitable pollinators of field/broad beans for this reason. Apples and other orchard fruit trees flower earlier than most honeybees are active, and so are usually pollinated by solitary bees, whose emergence patterns are a better match. Bumblebees are the main pollinators of soft-fruit, as not only are they tolerant to indoor or semi-indoor fruit production characteristic of soft-fruit growing, but they can transfer more pollen and visit more flowers per unit of time than honeybees (Willmer, Bataw et al. 1994). Oil seed rape can be pollinated by honeybees or wild pollinators, including hoverflies. Hoverflies are likely be able to pollinate similar crops to honeybees and solitary bees, although higher densities are required to reach the same level of pollination as they tend to move less between flowers and also carry less pollen (Jauker, Bondarenko et al. 2012). The stocking densities of honeybees required for adequate pollination has been estimated for crops, the most important of

UK NEAFO Work Package 1: Natural capital asset check – Annex 4: Case studies
which in the UK are summarised in table 2, and the middle of the stocking density range given in Breeze et al is noted. As mentioned above, honeybees may not be the sole or main provider of services to these crops, some crops can be pollinated by both honeybees and wild pollinators, and others can only be pollinated by a particular subset of wild pollinators; such special requirements are also noted in the table. The density requirement of bumblebees, solitary bees or hoverflies required is less frequently evaluated. There are recommended densities of bumblebee colonies from the providers of commercially reared colonies, usually around 6 to 9 colonies per ha for soft-fruit. However higher densities are likely to be required on some fruits than others due to differing attractiveness to bumblebees, and different dependency on pollination. Drummond (Drummond 2012) provides a direct comparison of stocking density requirements of honeybees and bumblebees for highbush blueberries, and find that 10 bumblebee colonies per ha provided the same pollination as 7.5 to 10 honeybee hives. Using the ratio implies that 1.33 bumblebee nests per ha would be required for each honeybee hive. Bumblebees are known to be better pollinators of blueberries than honeybees, so this ratio may be low for crops that are well pollinated by both types of bee. Table 2 shows the required bumblebee nest density using this ratio. It should also be noted that bumblebee nests vary greatly in size through the season, being very small in spring. Orchard crops flower early in the season, and at this time bumblebee nests will be small and adequate pollination by bumblebees is less unlikely. Table 2 provides a qualitative assessment of how vulnerable various crops are to pollinator shortages, given the timing of flowering and the requirements for specific pollinators.
K. What goods and benefits do these services support?
Wild and managed pollinators support the production of insect dependent crops in the UK. Globally, 35% of food crops are at least partly dependent on insect pollination, as are some energy crops such as oil-seed rape. Insect pollinated crops have higher value added than non-pollinated crops, therefore representing a high proportion of goods by market value. Insect pollinated crops also contain higher vitamin and micronutrient concentrations per kg than non-insect (mainly wind) pollinated crops (Eilers, Kremen et al. 2011). The ability of UK-produced volumes of goods to meet home demand ranges from 5% for broad beans and 70% for strawberries and raspberries (See table 3). The loss of insect pollination would cause imports of insect mediated crops to rise, weakening UK food security. The wider pollinator network also supports flowering plant reproduction. It has been estimated that the proportion of wild plant species in temperate regions requiring insect pollination at 78% (Ollerton, Winfree et al. 2011). The insect pollinated plants provide other ecosystem services including forage for birds and animals, and recreational value to humans. There are also non-use values associated with wild flowers and particularly rare flowers such as orchids which are protected. Amateur beekeepers often do so while making a loss, suggesting that bees also provide recreational value. Other pollinating insects also have non-use or existence values as signified in the high sign up to societies such as the Bumblebee Conservation Trust and Buglife.

18
L. What is the target performance from the asset?
Insect pollination boosts the yield of crops, increasing the market value and allowing farmers to stay in production. The target performance varies from crop to crop (see table 2), as different crops require different stocking densities so that pollination does not limit production. In addition to the performance in relation to the producers, the pollinator assets should also sustain wild flower and plant pollination.
Uncertainties
Give level of uncertainty* in answer to L and reasons for this. * Use Uncertainty scale described in introduction.
Established but incomplete evidence. Stocking densities for honeybees are taken from the scientific literature but these are not collected by standardised means and are not always from studies in the UK or other temperate regions. Numbers of wild bumblebees required are based on an assumption that the equivalency of honeybees and wild bumblebees that exists for blueberries can be extended to other crops. Data on density of solitary bees and hoverflies across the UK is not known. The spatial distribution of honeybee hives is not known, it may be that many honeybee hives are located in cities and are not moved to provide crop pollination. The performance measures provided are therefore qualitative in nature and give an indication of how well the needs of different crops are met by the available natural pollinator assets.
Defining performance: Answering these questions can help define performance, but not all questions can be answered for all assets
What policy targets are there for the asset?
(e.g. maximum sustainable yield for fish stocks, global concentrations of GHG)
The UK government has a target to manage honeybees for sustainable pollination services. Such a target has been referred to in honeybee policy, rather than policy concerning the total pollinator asset.
What is the trend in the main services the asset provides?
See question d for services, and UKNEA synthesis report Figure 5 for trends.
Although honeybee numbers are increasing, the location of hives is based on the owner rather than the pollination needs of the country and so many are in urban areas which already support a high proportion of wild pollinators. Most crop plants require pollination by short-tongued generalists, including 4 of the 6 common species of bumblebee, honeybee and solitary bee species. While there are multiple species to provide these services, crops differ in the level of vulnerability to pollinator decline based on the possibilities for substitution given the phenology of flowering and pollinator preference. With increasing area requirements for insect pollinated crops, the maintenance of pollination services into the future is uncertain.
What types of goods are supported by the asset?
(e.g. food, drinking water, pollution control) See UKNEA synthesis report Figure 10 for terminology

UK NEAFO Work Package 1: Natural capital asset check – Annex 4: Case studies
Provisioning goods, recreation, regulating services.
Who benefits from the goods?
Identify the number and location of beneficiaries Consumers of insect-pollinated food benefit both in the UK and abroad. Farmers of such goods benefit from lower costs of pollination services, if needs are met by wild bees, and from the choice of whether or not to farm insect-pollinated food or not. The UK is also an exporter of oil seed rape; pollinators increase the yield of oil seed rape to the benefit of producers and consumers.
What wellbeing results from the goods?
UK consumers benefit from a greater supply of insect-pollinated food. There is not only an economic benefit but also a non-tangible benefit that some derive from eating local food. Insect-pollinated crops contain more vitamins and so society benefits as a whole if more consumers can access these goods cheaply (Eilers, Kremen et al. 2011). Wild flowers add to recreational and aesthetic value of the UK countryside, and insect pollinated wild plants such as brambles and hedgerows provide food for animals and birds, thus increasing the biodiversity value further.
M. Are any future changes in target performance expected?
How is target performance expected to change? Consider exogenous factors like those associated with the drivers under question F, and the asset’s role in climate change adaptation.
The target performance is expected to increase if area of oil-seed rape continues to increase.
N. Can future target performance be defined?
What is the target level of future performance of the asset? What are the drivers of this (see question G).
Future target performance could be defined if areas of expected insect pollinated crops in the future are known.

20
Notes: Non-essential supporting information that can be useful for decision-makers includes:
- Has target performance changed over time? If so how?
- Distributional issues: what is the distribution of the beneficiaries of the goods supported by the ecosystem services from the asset?
- Do the goods provided by the ecosystem services from the asset have use and/or non-use values?

UK NEAFO Work Package 1: Natural capital asset check – Annex 4: Case studies
1.1.4. Natural capital asset criticalities Note that these answers may be very different for different spatial scales, so Question B gives important context, and appropriate scale of analysis may need to be reconsidered.
Question Guidance on Answer
O. What is the trajectory of change for the asset?
Specify if any linear or non-linear changes are known or anticipated (see trends from questions E and F) The loss of specialised pollinators since post-war agricultural intensification may not be surprising given changing land use. However floral diversity has also declined since 1990 in small habitat patches within larger areas (Smart et al, 2007). It is possible that continued declines in wild flower diversity affect pollinator diversity further or vice-versa. The positive feedback between these two declining assets is cause for concern. Generalist pollinators have not shown declines to the same extent and are relatively adaptable to modified landscapes. Hoverflies also have not suffered to the same extent. Honeybee numbers have declined but seem now to be increasing in the UK. Whether this trend will be reflected in greater pollination services depends on whether the new beekeepers are placing their hives in agricultural areas, or whether the increase is more due to the growth in beekeeping in urban areas. If the increase is evenly distributed then we could expect an increase in services provided by honeybees. Emerging diseases and pests threaten both wild pollinators and honeybees. The relative importance previously placed on honeybees could leave the asset potentially vulnerable if honeybees do suffer from problems such as CCD in the future. Overwintering rates in honeybees are already variable, and liable to cause supply problems if caused by a disease or weather event which affects many beekeepers at once. It is prudent therefore that while honeybee husbandry and disease surveillance is treated with high priority, equivalent efforts are also made to boost the diverse assemblage of wild pollinators which may be more resilient to such changes.
P. Are there any standards or agreed limits of change to the asset?
Specify if there are any relevant standards or limits for the condition of the asset (e.g. adult spawning stock biomass for fish) or the services from it (e.g. fish landing quota). There are no agreed limits of change to the honeybee asset, although honeybee plans are now in place for “sustainable” pollination suggesting that resilience of the honeybee stock is a priority. There are no agreed limits of change to wild pollinators.

22
Q. Are there likely to be any threshold effects?
State knowledge of any thresholds – thresholds can include where the integrity of an asset declines in a non-linear way, where the influence of feedbacks on an asset change, or where the ability of an asset to recover declines. A diverse mix of wild pollinators and honeybees will reduce the probability of collapse of pollinator services. That being said, a poorly managed epidemic affecting either honeybees or Bombus spp would be likely to cause significant reductions in services available that year. Honeybees are the most vulnerable to such a shock as diseases can spread quickly between colonies. Crops which depend on long-tongued species of bumblebees are also somewhat vulnerable, as there are fewer species to replace this service if lost. There is some evidence that mass-flowering crops support short-tongued species at the expense of long-tongued bumblebees (Diekotter, 2010). The integrity of the asset could decline in a non-linear way if there is a positive feedback between wild flower diversity loss and pollinator diversity.
R. What is the reversibility of changes to the asset?
Can changes to the asset be reversed? (e.g. can the asset, and its functions, be restored or recreated?) Most pollinator species in the UK complete one or more generations per year, and can be expected to undergo stochastic fluctuations due to weather or other perturbations. Many “bad” years in succession or a chronic threat to bees will ultimately have an impact on populations which will not be avoided until the threat is removed. Should such a threat cause a population to go locally extinct, the area is likely to be recolonised once the environment is conducive again. However if the threat is widespread then local recolonisation may not be an option. It is extremely difficult, though not impossible to reintroduce lost pollinator species. Attempts are being made to reintroduce Bombus subterraneous to the UK with limited success so far. Even after a successful reintroduction it would take years for an introduced species to spread to the extent required to make a difference to pollination services, during which time any wild plants dependent on that pollinator may have already been lost. Changes in honeybees are also difficult to reverse, as once a disease or pest becomes endemic, the high density of hives allows easy spread. Prevention and early detection of such problems can mitigate against this.
S. What is the cumulative effect of impacts on the asset?
What patterns of impacts result from past, current and future trends and drivers (see questions D, E and F)? The increasing proportion of oil seed rape could further exacerbate the trend towards generalist, short tongued pollinators at the expense of specialists and short-tongued species. AES schemes in England to fill the “hungry gap” and to increase areas of grassland will to some extent mitigate the losses by encouraging a diversity of wild flowers but it is unknown whether the areas over which these schemes will be implemented will be sufficient to offset any loss. Neonicotinoid use and increasing amateur beekeeper number may act in synergy to increasing overwintering losses

UK NEAFO Work Package 1: Natural capital asset check – Annex 4: Case studies
in honeybees and increase the vulnerability to disease. Without intervention to support disease treatment and surveillance, costs may rise causing professional beekeepers to leave the industry.
T. What risks are associated with current trends in the asset integrity?
Identify risks of significant detrimental impacts: see answers to questions N, and relate this to answers to questions P – S. Most industries will currently rely on a mix of wild pollinators and honeybees or other substitutes, but any loss in wild pollinators would increase the cost of pollination (as more honeybees or substitutes are required), as would threats to honeybees such as a disease or pest outbreak. If the costs of providing pollination services are low compared to the gross value of production, farmers are likely to be able to accept this cost increase. If costs are high compared to the gross value of production, then farmers will either pass on the costs to consumers, or leave the market. Table 3 compares the price of pollination by honeybees, with the Gross Value of Production (GVP). For most crops the cost of pollination relative to GVP is quite low (less than 4%), though for businesses operating on the margin any increases in costs will be significant. Firms will only be able to pass price rises onto consumers if imports for the crop are not easily available. The current “self-sufficiency” of the crop has been calculated as the UK consumption of these crops, over the UK production. Consumers of crops such as strawberries, with a relatively high cost of pollination to GVP ratio, and a high self-sufficiency, are more likely to be affected by rises in the cost of pollination.
U. What substitutes exist for the main ecosystem services from the asset?
For the services identified in G, are substitutes available? If so what supplies are available or potentially available? Substitutes for crop pollination There are substitutes available for crop pollination; there is a large industry for commercial bumblebees, which were developed for use in greenhouses but can be used in polythene tunnels and in open fields. There are increased efforts to domesticate solitary bees such as Osmia rufa in man-made nests which can be placed throughout orchards and fields. Honeybees themselves, are a substitute for wild pollinators, but have been treated as natural capital in this evaluation for the reasons outline in section A. Further research and development may increase the availability of non-bee pollinators such as hoverflies. The difficulty with substituting wild pollinators entirely is that such substitutions are costly, and substitution may not be perfect; one commercial species is unlikely to provide the breadth of functional provided by a natural community (Hoehn, Tscharntke et al. 2008). Commercial solutions also tend to focus on single-species (for example Bombus terrestris is the main commercialised pollinator used in Europe), this can increase the vulnerability of the system to disease threats and environmental changes, as such threats will no longer be buffered by a diverse range of species. Substitutes are however, useful for increasing the abundance of pollinators in a location at a particular time.

24
Substitutes for wild plant pollination While honeybees do spillover and pollinate wild flowers (Tuell, Fiedler et al. 2008), and bee farmers focused on honey production will move nests to utilise wild flower resources (i.e. heather), honeybees are not able to pollinate all wild flowers both due to morphological and phonological limitations. Even if they were able to pollinate all wild plants which require insect pollination, it would require a redistribution of the honeybee stock to woodland, grassland and riparian habitats, and away from urban areas, which would be infeasible from a cost and management perspective. Wild plant pollination is therefore much more difficult to substitute and therefore more vulnerable to loss of pollinators than crop pollination.
Uncertainties
Give level of uncertainty* in analysis and reasons for this. Established but incomplete evidence. Though there will be thresholds below which wild pollinator populations will be threatened, the lack of systematic abundance monitoring makes it very difficult to tell where these thresholds are. Current monitoring networks can detect changes in species richness over time, but only detect species losses after they have occurred. The economic risks of pollinator decline depend not only on the extent of wild pollinators but on the price and availability of substitutes. Assessments of vulnerability of consumers to such changes can only be made crudely.
Non-essential supporting information that can be useful for decision-makers includes:
- What is the level of investment needed in the natural capital to maintain it above the limits/thresholds identified above?
- What are the distributional (social group/intergenerational) implications of the criticality identified?
- For question T, define on what basis the substitute(s) are identified (e.g. which ecosystem services the substitute provides).

UK NEAFO Work Package 1: Natural capital asset check – Annex 4: Case studies
1.1.5. Natural capital asset check
Question Guidance on Answer
V. Tradeoffs?
If one or more of the asset’s key ecosystem services (see question D) are increased, does this lead to reductions in other services?
The pollination of mass flowering crops such as oil seed rape has the potential to distort the wild pollinator population by increasing the number of short-tongued bumblebees relative to long-tongued bees (Diekoetter, Kadoya et al. 2010). These short-tongued bees can then spillover to wild flowers and may nectar rob from flowers with long corollas, reducing the food sources available for long-tongued species. Pollination services to crops and to wild plants could trade-off against each other unless efforts are made to provide forage for both short and long tongued species post flowering. During flowering there may also be a trade-off between wild flower pollination and crop pollination as pollinators are drawn away from wild flowers and so flowers with concurrent pollination needs may suffer from pollinator dilution (Holzschuh, Dormann et al. 2011). Similarly, increasing in honeybees could lead to competition with native pollinators for foraging resources driving down wild pollinator populations (Goulson, Sparrow 2009), the overall impact of such competition will depend on the number and placement of honeybees but may be more likely to occur after the target crop has stopped flowering, during the “hungry gap”. Given the importance of both honeybees and wild pollinators, it would be unwise to support honeybees at the expense of wild pollinators, and vice versa.
W. Synergies?
If one or more of the asset’s key ecosystem services (see question D) are increased, does this lead to increases in other services?
The key ecosystem services from the pollinator asset are crop pollination and wild flower pollination. As outlined above there is evidence that wild flower pollination could suffer as a result of increasing pollination to mass flowering crops. However mass flowering crops will also provide a food source to pollinators, increasing colony success if the resource is properly managed. The difference between mass-flowering crops aiding populations and degrading populations will depend on the balance between increased nutrition and post-flowering disadvantages such as increased competition and increased parasite density. The balance between these factors was studied in Osmia rufa by Jauker and colleagues (Jauker, Peter et al. 2012), who found that the positive effects outweigh the negative post-flowering effects. This is likely due to reasonable synchrony between oil seed rape flowering and Osmia rufa lifecycles. Increasing the Osmia rufa population should increase the potential for wild plants as well as mass flowering plants to be pollinated in the following year. Mass-flowering crops increase the growth of bumblebee colonies early in the season, but this does not translate in increased reproduction (Westphal, Steffan-Dewenter et al. 2009), the timings of oilseed rape flowering are therefore not beneficial to bumblebee reproduction despite increasing early colony growth.

26
Honeybees do spillover and pollinate wild flowers surrounding arable landscapes (Tuell, Fiedler et al. 2008), however wild bees, although at a similar abundance to honeybees, visited all 43 wild flower species in the area, whereas honeybees were only seen to visit 24 out of 43. Honeybees cannot be relied upon to pollinate all wild flower species. This is unsurprising, as the wild pollinator assemblage is made up of many species with different floral preferences and phenology as opposed to the honeybee population which is composed of only one species. Increasing honeybee numbers will therefore, benefit some wild plant species, but only in areas within flight distance of hives, and only some species. Increasing wild pollinator numbers will be of benefit to wild flower populations if functional diversity of species is preserved.
Uncertainties
Give level of uncertainty* in analysis and reasons for this. * Use Uncertainty scale described in introduction.
Competing explanations. There are potential trade-offs between wild plant pollination and crop pollination, however there are also potential synergies. Whether the outcome is positive or negative will depend on the balance of these. There are some management interventions (such as growing plants which will flower just after mass flowering crops) which will assist in creating a positive outcome, but uncertainty around the eventual outcome.
X. Sustainability test: is the asset currently able to give the target performance?
Compare integrity in question I and performance in question L.
The asset of honeybees is not currently able to pollinate all crops in the UK. There is a trend towards increased honeybee numbers but this will not lead to increased pollination services unless the colonies can be moved around the UK to meet pollination needs. This is unlikely given the amateur nature of new beekeepers, who may not keep with the activity in the long term. Wild pollinators do a large proportion of crop pollination across the UK, but may not be sufficiently abundant to meet increased pollinator needs, particular across large fields associated with increased oil seed rape production.
If yes - will this performance be sustained into the future?
Relate changes from question O and criticalities from P and Q to future changes identified in questions M and N. Give timescale – from question C.
If no – state why?
Is this because target performance is unrealistic, or because integrity of asset is compromised, or both?
The pollinator assets of the UK are not being managed with pollination in mind. Honeybees are for the most part, used for recreation and small scale honey production. The large scale bee-farmers do not have sufficient capacity to meet the UK’s pollination requirements. The population sizes of common wild pollinators are not

UK NEAFO Work Package 1: Natural capital asset check – Annex 4: Case studies
known.
Y. Red flags? This is a warning if future target performance is at risk, for example because:
- the asset is underperforming (see question X) and continuing to decline (see Question O), or - there is prospect of collapse (a limit or threshold – see questions P and Q) which could be irrecoverable (i.e.
being irreversible, see question R, and with no substitute, see question U)
Overwintering rates are a suitable indicator of honeybee stress and should continue to be monitored. Wild pollinator populations would benefit from systematic monitoring allowing populations to be tracked over time. The current monitoring system is better at detecting local population loss, but does not detect declines in populations which could alert land managers to conservation priorities. Incidents of large scale pesticide poisonings have not increased in the UK but any increase in oil seed rape production area will increase the exposure of bees to neonicotinoids. Populations should be monitored for neonicotinoid residues and any impacts of these. Hoverflies are not efficient pollinators but appear resistant to land use changes which affect bees, they may therefore be vital to conserving pollination services into the future and should be monitored for population stress. Overwintering rates in honeybees are not currently a cause for concern. The continued loss of wild flower diversity and pollinator diversity however, should be seen as a red flag. The latest data showing a slowing of the decline in wild flower species richness is a positive sign.
Uncertainties
Give level of uncertainty* in analysis and reasons for this. Use Uncertainty scale described in introduction.
There is a possibility that declines in specialised and small bodied species are a relic of post-war agricultural intensification and do not represent a current downward trend. However if there is any positive feedback between wildflower loss and pollinator loss then the trend would be expected to continue, particular as nectar producing plants have also been lost to succession in the last 20 years, which will further stress wild pollinator populations. Established but incomplete evidence.

28
1.1.6. Conclusions Summary of Pollinators natural capital asset check
Asset Trends in natural asset integrity Target performance
Criticalities Sustainability of performance
Red Flags
The pollination
service provided by
insects to crop plants across the UK. The main insect pollinators,
bees (including
bumblebees, honeybees and solitary bees) and
hoverflies are considered.
These pollinators are
part of the wider network of pollinators across the UK,
which also supports the
sexual reproduction
of wild plants.
Although honeybee numbers are increasing, the increase in number
of colonies is made up of those kept by amateur beekeepers,
mainly in suburban areas. Some crops and many wildflowers are
not well pollinated by honeybees. However the condition of
honeybees is well monitored and new policies in place will further safeguard honeybees. Wild bee diversity has declined and insect
pollinated wild plant species richness continues to decline in
some habitats. Monitoring efforts have so far detected losses of rare species, there are no systematic
schemes for monitoring the abundance of common species so
the trends are not clear. Pollination services to wild plants
are at risk, particularly for specialised plant species, as the
diversity of these have declined in parallel with pollinators with
narrower niche breadth. Whether the asset as a whole is able to
support crop pollination depends on the specific requirements of
crops.
Insect pollination boosts the yield
of crops, increasing the
market value and allowing farmers
to stay in production. The
target performance
varies from crop to crop (see table 2), as different crops require
different stocking densities so that pollination does
not limit production. In addition to the performance in relation to the producers, the
pollinator assets should also sustain wild
flower and plant pollination.
There are no agreed limits of change to the
honeybee asset, although honeybee
plans are now in place for “sustainable”
pollination suggesting that resilience of the honeybee stock is a
priority. There are no agreed limits of change
to wild pollinators. A diverse mix of wild
pollinators and honeybees will reduce
the probability of collapse of pollinator services. Honeybees
are vulnerable to acute shock such as diseases
as pathogens can spread quickly between
colonies. The integrity of the
asset could decline in a non-linear way if there is a positive feedback between wild flower
diversity loss and pollinator diversity.
The asset of honeybees is not currently able to
pollinate all crops in the UK. There is a
trend towards increased honeybee numbers but this will not lead to increased pollination services unless the colonies
can be moved around the UK to meet
pollination needs. This is unlikely given
the amateur nature of new beekeepers, who may not keep with the
activity in the long term. Wild pollinators do a large proportion
of crop pollination across the UK, but
may not be sufficiently abundant
to meet increased pollinator needs,
particular across large fields associated with
oil seed rape production.
Overwintering rates are a suitable indicator of honeybee stress and should continue to be monitored. Overwintering rates in honeybees
are not currently a cause for concern.
Wild pollinator populations would benefit from systematic monitoring allowing populations to be tracked over time. Incidents of large scale
pesticide poisonings have not increased in the UK. Hoverflies are not efficient pollinators but appear
resist to land use changes which affect bees, they may therefore be
vital to conserving pollination services into the future and should be monitored for population stress.
The continued loss of wild flower diversity and pollinator diversity however, should be seen as a red
flag. While short-tongued bumblebees and generalist
populations do not seem in peril, those with a narrower habitat niche are in decline. New data showing
decreasing rate of decline of flowering plant richness is
encouraging and should continue to be monitored.
Level of Certainty
Established Established but incomplete evidence
Competing Explanations Established but incomplete evidence
Established but incomplete evidence

UK NEAFO Work Package 1: Natural capital asset check – Annex 4: Case studies
1.1.7. Appendix
Overwinter Losses Year
2006-2007
2007-2008
2008-2009
2009-2010
2010-2011
2011-2012
Scotland1 17.5% 21.4% nd 27.3% 21.8% nd
England2 nd 30.5% 18.7% 17.7% 13.6% 16.2%
USA3 31.8% 35.8% 28.6% 34.4% 29.9% nd
Europe (average)4 nd nd 12.3% 16.9% nd nd nd = no data 1. Peterson et al (2012a, 2012b, 2010), Gray et al (2007). 2. BBKA (2012) 3. VanEngelsdorf et al (2012, 2011, 2010, 2009, 2008, 2007) 4. Vanderzee et al 2012 Table 1: Table comparing overwintering losses for honeybees in Scotland and England with the USA and European average as comparators.

30
Crop Honeybee Stocking
density Bumblebee
density Flowering
time Pollinators Vulnerability Oilseed rape 5 7 Mid All Mid Strawberries 10 13 All year All High
Dessert apples 7 9 Early Solitary bees
preferred High
Culinary apples 7 9 Early Solitary bees
preferred High
Raspberries 1.5 2 Mid Bumblebees
preferred Low
Blackcurrants 6 8 Mid Bumblebees
preferred High
Runner beans 1.5 2 Mid Long-tongued Bumblebees Mid
Cherries 3 4 Early Solitary bees
preferred Mid
Broad bean 4 5 Mid Long-tongued Bumblebees High
Plums 4 5 Early Solitary bees
preferred Mid
Pears 3 4 Early Solitary bees
preferred Mid Table 2: Table to assess the vulnerability of 11 UK grown crops to wild pollinator loss. Equivalent bumblebee stocking densities are calculated using the conversion factor in Drummond & Stubbs (2001) and honeybee stocking densities from Breeze et al, 2011. Vulnerability was assessed from 1 to 5, with 5 being very vulnerable, score increased with importance of wild bee pollinators, and with high pollinator density requirement with low location wild bee factor.
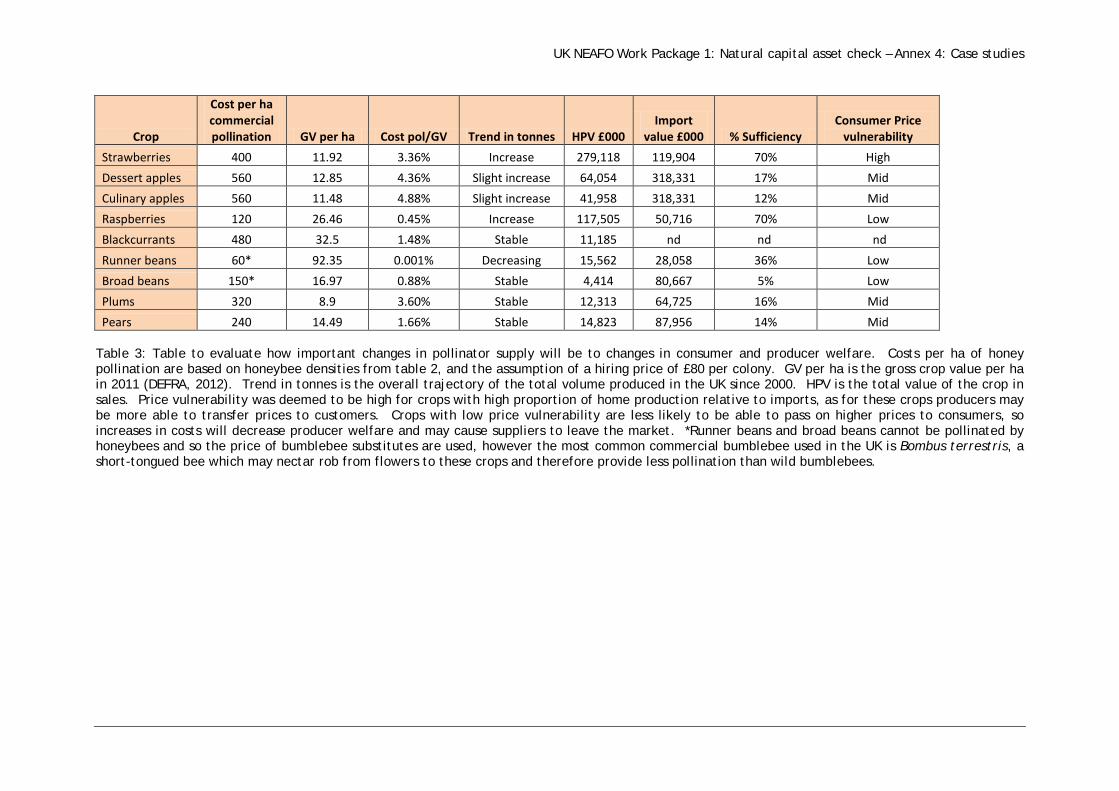
UK NEAFO Work Package 1: Natural capital asset check – Annex 4: Case studies
Crop
Cost per ha commercial pollination GV per ha Cost pol/GV Trend in tonnes HPV £000
Import value £000 % Sufficiency
Consumer Price vulnerability
Strawberries 400 11.92 3.36% Increase 279,118 119,904 70% High Dessert apples 560 12.85 4.36% Slight increase 64,054 318,331 17% Mid Culinary apples 560 11.48 4.88% Slight increase 41,958 318,331 12% Mid Raspberries 120 26.46 0.45% Increase 117,505 50,716 70% Low Blackcurrants 480 32.5 1.48% Stable 11,185 nd nd nd Runner beans 60* 92.35 0.001% Decreasing 15,562 28,058 36% Low Broad beans 150* 16.97 0.88% Stable 4,414 80,667 5% Low Plums 320 8.9 3.60% Stable 12,313 64,725 16% Mid Pears 240 14.49 1.66% Stable 14,823 87,956 14% Mid
Table 3: Table to evaluate how important changes in pollinator supply will be to changes in consumer and producer welfare. Costs per ha of honey pollination are based on honeybee densities from table 2, and the assumption of a hiring price of £80 per colony. GV per ha is the gross crop value per ha in 2011 (DEFRA, 2012). Trend in tonnes is the overall trajectory of the total volume produced in the UK since 2000. HPV is the total value of the crop in sales. Price vulnerability was deemed to be high for crops with high proportion of home production relative to imports, as for these crops producers may be more able to transfer prices to customers. Crops with low price vulnerability are less likely to be able to pass on higher prices to consumers, so increases in costs will decrease producer welfare and may cause suppliers to leave the market. *Runner beans and broad beans cannot be pollinated by honeybees and so the price of bumblebee substitutes are used, however the most common commercial bumblebee used in the UK is Bombus terrestris, a short-tongued bee which may nectar rob from flowers to these crops and therefore provide less pollination than wild bumblebees.

32
1.1.8. References ALAUX, C., BRUNET, J., DUSSAUBAT, C., MONDET, F., TCHAMITCHAN, S., COUSIN, M., BRILLARD, J., BALDY, A., BELZUNCES, L.P. and LE CONTE, Y., 2010. Interactions between Nosema microspores and a neonicotinoid weaken honeybees (Apis mellifera). Environmental microbiology, 12(3), pp. 774-782. ALIX, A., ADAM, L., BROWN, M., CAMPBELL, P., CAPRI, E., KAFKA, A., KASIOTIS, K., MACHERA, K., MAUS, C., MILES, M., MORARU, P., NAVARRO, L., PISTORIUS, J., THOMPSON, H. and MARCHIS, A., 2013. Bee Health in Europe Facts and Figures. Opera Research. BBKA, 2012. BBKA Winter Survival Survey. Final 14 June 1339663845. BIESMEIJER, J.C., ROBERTS, S.P.M., REEMER, M., OHLEMUELLER, R., EDWARDS, M., PEETERS, T., SCHAFFERS, A.P., POTTS, S.G., KLEUKERS, R., THOMAS, C.D., SETTELE, J. and KUNIN, W.E., 2006. Parallel declines in pollinators and insect-pollinated plants in Britain and the Netherlands. Science, 313(5785),. BLITZER, E.J., DORMANN, C.F., HOLZSCHUH, A., KLEIN, A., RAND, T.A. and TSCHARNTKE, T., 2012. Spillover of functionally important organisms between managed and natural habitats. Agriculture Ecosystems & Environment, 146(1), pp. 34-43. BREEZE, T., ROBERTS, S. and POTTS, S., 2012. The Decline of England's Bees. Policy Review and Recommendations. University of Reading/Friends of the Earth. BREEZE, T.D., BAILEY, A.P., BALCOMBE, K.G. and POTTS, S.G., 2011. Pollination services in the UK: How important are honeybees? Agriculture Ecosystems & Environment, 142(3-4),. BRITTAIN, C., KREMEN, C. and KLEIN, A., 2013. Biodiversity buffers pollination from changes in environmental conditions. Global Change Biology, 19(2), pp. 540-547. CARVALHEIRO, L.G., KUNIN, W.E., KEIL, P., AGUIRRE-GUTIERREZ, J., ELLIS, W.N., FOX, R. and GROOM, Q., 2013. Species richness declines and biotic homogenization have slowed down for NW-European pollinators and plants. Ecology Letters, In press. CARVELL, C., ROY, D.B., SMART, S.M., PYWELL, R.F., PRESTON, C.D. and GOULSON, D., 2006. Declines in forage availability for bumblebees at a national scale. Biological Conservation, 132(4),. CARVELL, C., WESTRICH, P., MEEK, W.R., PYWELL, R.F. and NOWAKOWSKI, M., 2006. Assessing the value of annual and perennial forage mixtures for bumblebees by direct observation and pollen analysis. Apidologie, 37(3), pp. 326-340. COX-FOSTER, D.L., CONLAN, S., HOLMES, E.C., PALACIOS, G., EVANS, J.D., MORAN, N.A., QUAN, P., BRIESE, T., HORNIG, M., GEISER, D.M., MARTINSON, V., VANENGELSDORP, D., KALKSTEIN, A.L., DRYSDALE, A., HUI, J., ZHAI, J., CUI, L., HUTCHISON, S.K., SIMONS, J.F., EGHOLM, M., PETTIS, J.S. and LIPKIN, W.I., 2007. A metagenomic survey of microbes in honey bee colony collapse disorder. Science, 318(5848),. DARDNI, 2011. Strategy for the sustainabilitiy of the honeybee. Belfast: .

UK NEAFO Work Package 1: Natural capital asset check – Annex 4: Case studies
eftec 33 November 2012
DARVILL, B., KNIGHT, M.E. and GOULSON, D., 2004. Use of genetic markers to quantify bumblebee foraging range and nest density. Oikos, 107(3), pp. 471-478. DEFRA, 2013. Total income from farming in the UK. Aggregate Agricultural Accounts. DEFRA, 2012. Land use and livestock June UK series 121220. Food and farming statistics, . DEFRA, 2012. UK National Action Plan for the Sustainable Use of Pesticides (plant protection products). DEFRA, 2009. Healthy bees: Protecting and improving the health of honeybees in England and Wales. DEPARTMENT OF TRANSPORT, 2012. Renewable Transport Fuels Obligation. DIEKOETTER, T., KADOYA, T., PETER, F., WOLTERS, V. and JAUKER, F., 2010. Oilseed rape crops distort plant-pollinator interactions. Journal of Applied Ecology, 47(1), pp. 209-214. DRUMMOND, F., 2012. Commercial Bumble Bee Pollination of Lowbush Blueberry. International Journal of Fruit Science, 12(1-3), pp. 54. EILERS, E.J., KREMEN, C., GREENLEAF, S.S., GARBER, A.K. and KLEIN, A., 2011. Contribution of Pollinator-Mediated Crops to Nutrients in the Human Food Supply. Plos One, 6(6), pp. e21363. FAOSTAT, 2013. Honey producer prices 2000 to 2010, United Kingdom. FREE, J.B., 1968. Behaviour of Bees Visiting Runner Beans (Phaseolus Multiflorus). Journal of Applied Ecology, 5(3), pp. 631-&. FREE, J.B., 1962. The Behavior of Honeybees Visiting Field Beans (Vicia-Faba). Journal of Animal Ecology, 31(3), pp. 497-502. GILL, R.J., RAMOS-RODRIGUEZ, O. and RAINE, N.E., 2012. Combined pesticide exposure severely affects individual- and colony-level traits in bees. Nature, 491(7422), pp. 105-U119. GOULSON, D., HUGHES, W., DERWENT, L. and STOUT, J., 2002. Colony growth of the bumblebee, Bombus terrestris, in improved and conventional agricultural and suburban habitats. Oecologia, 130(2), pp. 267-273. GOULSON, D., LYE, G.C. and DARVILL, B., 2008. Decline and conservation of bumble bees. Annual Review of Entomology, 53. GOULSON, D., LEPAIS, O., O'CONNOR, S., OSBORNE, J.L., SANDERSON, R.A., CUSSANS, J., GOFFE, L. and DARVILL, B., 2010. Effects of land use at a landscape scale on bumblebee nest density and survival. Journal of Applied Ecology, 47(6), pp. 1207-1215. GRADISH, A.E., SCOTT-DUPREE, C.D. and CUTLER, G.C., 2012. Susceptibility of Megachile rotundata to insecticides used in wild blueberry production in Atlantic Canada. Journal of Pest Science, 85(1), pp. 133-140.

34
GRAY, A., MASON, K., PETERSON, M. and TEALE, A., 2007. Scottish Beekeepers' Association Survey of Members 2006. Report on the Survey. . HEARD, M.S., CARVELL, C., CARRECK, N.L., ROTHERY, P., OSBORNE, J.L. and BOURKE, A.F.G., 2007. Landscape context not patch size determines bumble-bee density on flower mixtures sown for agri-environment schemes. Biology Letters, 3(6), pp. 638-641. HENRY, M., BEGUIN, M., REQUIER, F., ROLLIN, O., ODOUX, J., AUPINEL, P., APTEL, J., TCHAMITCHIAN, S. and DECOURTYE, A., 2012. A Common Pesticide Decreases Foraging Success and Survival in Honey Bees. Science, 336(6079),. HOEHN, P., TSCHARNTKE, T., TYLIANAKIS, J.M. and STEFFAN-DEWENTER, I., 2008. Functional group diversity of bee pollinators increases crop yield. Proceedings of the Royal Society B-Biological Sciences, 275(1648),. HOLZSCHUH, A., DORMANN, C.F., TSCHARNTKE, T. and STEFFAN-DEWENTER, I., 2011. Expansion of mass-flowering crops leads to transient pollinator dilution and reduced wild plant pollination. Proceedings of the Royal Society B-Biological Sciences, 278(1723),. JACOBS, J.H., CLARK, S.J., DENHOLM, I., GOULSON, D., STOATE, C. and OSBORNE, J.L., 2009. Pollination biology of fruit-bearing hedgerow plants and the role of flower-visiting insects in fruit-set. Annals of Botany, 104(7),. JAUKER, F., BONDARENKO, B., BECKER, H.C. and STEFFAN-DEWENTER, I., 2012. Pollination efficiency of wild bees and hoverflies provided to oilseed rape. Agricultural and Forest Entomology, 14(1), pp. 81-87. JAUKER, F., DIEKOETTER, T., SCHWARZBACH, F. and WOLTERS, V., 2009. Pollinator dispersal in an agricultural matrix: opposing responses of wild bees and hoverflies to landscape structure and distance from main habitat. Landscape Ecology, 24(4), pp. 547-555. JAUKER, F., PETER, F., WOLTERS, V. and DIEKOETTER, T., 2012. Early reproductive benefits of mass-flowering crops to the solitary bee Osmia rufa outbalance post-flowering disadvantages. Basic and Applied Ecology, 13(3), pp. 268-276. KNIGHT, M.E., MARTIN, A.P., BISHOP, S., OSBORNE, J.L., HALE, R.J., SANDERSON, A. and GOULSON, D., 2005. An interspecific comparison of foraging range and nest density of four bumblebee (Bombus) species. Molecular ecology, 14(6), pp. 1811-1820. KNIGHT, M.E., OSBORNE, J.L., SANDERSON, R.A., HALE, R.J., MARTIN, A.P. and GOULSON, D., 2009. Bumblebee nest density and the scale of available forage in arable landscapes. Insect Conservation and Diversity, 2(2), pp. 116-124. LYE, G.C., PARK, K., OSBORNE, J., HOLLAND, J. and GOULSON, D., 2009. Assessing the value of Rural Stewardship schemes for providing foraging resources and nesting habitat for bumblebee queens (Hymenoptera: Apidae). Biological Conservation, 142(10), pp. 2023-2032. MEMMOTT, J., CRAZE, P.G., WASER, N.M. and PRICE, M.V., 2007. Global warming and the disruption of plant-pollinator interactions. Ecology Letters, 10(8), pp. 710-717.

UK NEAFO Work Package 1: Natural capital asset check – Annex 4: Case studies
eftec 35 November 2012
MURRAY, T.E., FITZPATRICK, U., BYRNE, A., FEALY, R., BROWN, M.J.F. and PAXTON, R.J., 2012. Local-scale factors structure wild bee communities in protected areas. Journal of Applied Ecology, 49(5), pp. 998-1008. NATURAL ENGLAND, 2013. Entry Level Stewardship: Environmental Stewardship Handbook. Fourth Edition edn. NATURAL ENGLAND, 2013. Higher Level Stewardship: Environmental Stewardship Handbook. Fourth Edition edn. OLLERTON, J., WINFREE, R. and TARRANT, S., 2011. How many flowering plants are pollinated by animals? Oikos, 120(3), pp. 321-326. OSBORNE, J.L., MARTIN, A.P., SHORTALL, C.R., TODD, A.D., GOULSON, D., KNIGHT, M.E., HALE, R.J. and SANDERSON, R.A., 2008. Quantifying and comparing bumblebee nest densities in gardens and countryside habitats. Journal of Applied Ecology, 45(3), pp. 784-792. OTTERSTATTER, M.C. and THOMSON, J.D., 2008. Does Pathogen Spillover from Commercially Reared Bumble Bees Threaten Wild Pollinators? Plos One, 3(7), pp. e2771. PETERSON, M. and GRAY, A., 2010. Scottish Beekeepers' Association Survey of Members 2008. Report on the survey results. . PETERSON, M., GRAY, A., RUDDOCK, C. and KERR, G., 2012. Scottish Beekeepers' Association Survey 2010 Report. . PETERSON, M., GRAY, A. and WANG, W., 2012. Scottish Beekeepers' Association Survey 2011 Report. . POTTS, S.G., ROBERTS, S.P.M., DEAN, R., MARRIS, G., BROWN, M.A., JONES, R., NEUMANN, P. and SETTELE, J., 2010. Declines of managed honey bees and beekeepers in Europe. Journal of Apicultural Research, 49(1),. PYWELL, R.F., WARMAN, E.A., HULMES, L., HULMES, S., NUTTALL, P., SPARKS, T.H., CRITCHLEY, C.N.R. and SHERWOOD, A., 2006. Effectiveness of new agri-environment schemes in providing foraging resources for bumblebees in intensively farmed landscapes. Biological Conservation, 129(2), pp. 192-206. RICKETTS, T.H., REGETZ, J., STEFFAN-DEWENTER, I., CUNNINGHAM, S.A., KREMEN, C., BOGDANSKI, A., GEMMILL-HERREN, B., GREENLEAF, S.S., KLEIN, A.M., MAYFIELD, M.M., MORANDIN, L.A., OCHIENG, A. and VIANA, B.F., 2008. Landscape effects on crop pollination services: are there general patterns? Ecology Letters, 11(5),. SCHWEIGER, O., MAELFAIT, J.P., VAN WINGERDEN, W., HENDRICKX, F., BILLETER, R., SPEELMANS, M., AUGENSTEIN, I., AUKEMA, B., AVIRON, S., BAILEY, D., BUKACEK, R., BUREL, F., DIEKOTTER, T., DIRKSEN, J., FRENZEL, M., HERZOG, F., LIIRA, J., ROUBALOVA, M. and BUGTER, R., 2005. Quantifying the impact of environmental factors on arthropod communities in agricultural landscapes across organizational levels and spatial scales. Journal of Applied Ecology, 42(6), pp. 1129-1139. SCOTT-DUPREE, C.D., CONROY, L. and HARRIS, C.R., 2009. Impact of Currently Used or Potentially Useful Insecticides for Canola Agroecosystems on Bombus impatiens (Hymenoptera: Apidae), Megachile rotundata (Hymentoptera: Megachilidae), and Osmia lignaria (Hymenoptera: Megachilidae). Journal of economic entomology, 102(1), pp. 177-182.

36
SCOTTISH GOVERNMENT, 2010. The honey bee health strategy. Edinburgh: Scottish Government. SMART, S., DUNBAR, M., EMMETT, B., MARKS, S., MASKELL, L., NORTON, L., ROSE, P. and SIMPSON, I., 2010. Integrated Assessment of Countryside Survey data to Investigate Ecosystem Services in Great Britain. Technical Report No, 10/07. NERC/Centre for Ecology and Hydrology. SMITH, P., ASHMORE, M., BLACK, H., BURGESS, P., EVANS, C., HAILS, R., POTTS, S., QUINE, T., THOMSON, A., BIESMEIJER, K., BREEZE, T., BROADMEADOW, M., FERRIER, R., FREER, J., HANSOM, J., HAYGARTH, P., HESKETH, H., HICKS, K., JOHNSON, A., KAY, D., KUNIN, W., LILLY, A., MAY, L., MEMMOTT, J., ORR, H., PICKUP, R., PURSE, B. and SQUIRE, G., 2011. Chapter 14: Regulating Services. UK National Ecosystem Assessment, Technical Report. TUELL, J.K., FIEDLER, A.K., LANDIS, D. and ISAACS, R., 2008. Visitation by wild and managed bees (Hymenoptera : Apoidea) to eastern US native plants for use in conservation programs. Environmental Entomology, 37(3), pp. 707-718. VAN DER ZEE, R., PISA, L., ANDONOV, S., BRODSCHNEIDER, R., CHARRIERE, J., CHLEBO, R., COFFEY, M.F., CRAILSHEIM, K., DAHLE, B., GAJDA, A., GRAY, A., DRAZIC, M.M., HIGES, M., KAUKO, L., KENCE, A., KENCE, M., KEZIC, N., KIPRIJANOVSKA, H., KRALJ, J., KRISTIANSEN, P., MARTIN HERNANDEZ, R., MUTINELLI, F., BACH KIM NGUYEN, OTTEN, C., OZKIRIM, A., PERNAL, S.F., PETERSON, M., RAMSAY, G., SANTRAC, V., SOROKER, V., TOPOLSKA, G., UZUNOV, A., VEJSNAES, F., WEI, S. and WILKINS, S., 2012. Managed honey bee colony losses in Canada, China, Europe, Israel and Turkey, for the winters of 2008-9 and 2009-10. Journal of Apicultural Research, 51(1), pp. 91-114. VANENGELSDORP, D., CARON, D., HAYES, J., UNDERWOOD, R., HENSON, M., RENNICH, K., SPLEEN, A., ANDREE, M., SNYDER, R., LEE, K., ROCCASECCA, K., WILSON, M., WILKES, J., LENGERICH, E., PETTIS, J. and BEE INFORMED PARTNERSHIP, 2012. A national survey of managed honey bee 2010-11 winter colony losses in the USA: results from the Bee Informed Partnership. Journal of Apicultural Research, 51(1), pp. 115-124. VANENGELSDORP, D., HAYES, J.,JR., UNDERWOOD, R.M., CARON, D. and PETTIS, J., 2011. A survey of managed honey bee colony losses in the USA, fall 2009 to winter 2010. Journal of Apicultural Research, 50(1), pp. 1-10. VANENGELSDORP, D., HAYES, J.,JR., UNDERWOOD, R.M. and PETTIS, J., 2008. A Survey of Honey Bee Colony Losses in the US, Fall 2007 to Spring 2008. Plos One, 3(12), pp. e4071. VANENGELSDORP, D., UNDERWOOD, R., CARON, D. and HAYES, J.,JR., 2007. An estimate of managed colony losses in the winter of 2006-2007: A report commissioned by the apiary inspectors of America. American Bee Journal, 147(7), pp. 599-603. VIDAU, C., DIOGON, M., AUFAUVRE, J., FONTBONNE, R., VIGUES, B., BRUNET, J., TEXIER, C., BIRON, D.G., BLOT, N., EL ALAOUI, H., BELZUNCES, L.P. and DELBAC, F., 2011. Exposure to Sublethal Doses of Fipronil and Thiacloprid Highly Increases Mortality of Honeybees Previously Infected by Nosema ceranae. Plos One, 6(6), pp. e21550. WELSH GOVERNMENT, 2013. Consultation on the Draft Action Plan for Pollinators for Wales. Aberystwyth: . WESTPHAL, C., STEFFAN-DEWENTER, I. and TSCHARNTKE, T., 2009. Mass flowering oilseed rape improves early colony growth but not sexual reproduction of bumblebees. Journal of Applied Ecology, 46(1), pp. 187-193.

UK NEAFO Work Package 1: Natural capital asset check – Annex 4: Case studies
eftec 37 November 2012
WESTPHAL, C., STEFFAN-DEWENTER, I. and TSCHARNTKE, T., 2006. Bumblebees experience landscapes at different spatial scales: possible implications for coexistence. Oecologia, 149(2), pp. 289-300. WHITEHORN, P.R., O'CONNOR, S., WACKERS, F.L. and GOULSON, D., 2012. Neonicotinoid Pesticide Reduces Bumble Bee Colony Growth and Queen Production. Science, 336(6079),. WILLIAMS, P.H. and OSBORNE, J.L., 2009. Bumblebee vulnerability and conservation world-wide. Apidologie, 40(3),. WILLIAMS, P., COLLA, S. and XIE, Z., 2009. Bumblebee Vulnerability: Common Correlates of Winners and Losers across Three Continents. Conservation Biology, 23(4), pp. 931-940. WILLMER, P.G., BATAW, A.A.M. and HUGHES, J.P., 1994. The Superiority of Bumblebee to Honeybees as Pollinators - Insect Visits to Raspberry Flowers. Ecological Entomology, 19(3),. WINFREE, R., AGUILAR, R., VAZQUEZ, D.P., LEBUHN, G. and AIZEN, M.A., 2009. A meta-analysis of bees' responses to anthropogenic disturbance. Ecology, 90(8),. WINFREE, R., WILLIAMS, N.M., GAINES, H., ASCHER, J.S. and KREMEN, C., 2008. Wild bee pollinators provide the majority of crop visitation across land-use gradients in New Jersey and Pennsylvania, USA. Journal of Applied Ecology, 45(3),.

38
1.2. Arable soils asset check
1.2.1. Natural capital asset
Question Guidance on Answer
A. Define Natural Capital asset being checked
This case study focuses on agricultural soil quality, specifically in relation to arable land use. Agricultural soils underpin a wide range of ecosystem services, in particular provisioning of food and the cultural services related to agricultural activity. However, too narrow a focus on specific services may not lead to the most appropriate management for other services and may also compromise the ability of the asset to perform its primary role. In 2011 the total croppable area in the UK (arable, horticulture, uncultivated and temporary grassland) was 6.11 million hectares; this is a decline of 12.7% from 6.99m ha in 1984. The area of arable crops in the UK fell from 4.95m ha to 4.50m ha (9.1%) between 1984 and 20111. This reflects a general trend of land moving out of agricultural production but is most pronounced for croppable land (12.7% decline versus 2.6% for total agricultural area). These higher declines for croppable and arable areas may reflect the greater suitability of that land for alternative uses such as development. The Countryside Survey 2007 also noted small net flows from arable land to grassland between 1998 and 2007 (Carey et al, 2008, chapter 3). It is not clear whether this trend has continued since 2007. Within the area of arable crops there have been shifts in production, for example the area of cereals has declined by 23.8%, whilst oilseeds have increased by 175.8% (cereals still dominate the area planted: 68.4% of the total in 2011). This decline in area for cereals has been offset by an increase in yield (5 year average wheat yields from 2008 to 2012 were 19.6% higher than 5 year average yields up to 1984), although yields appear to have plateaued in recent years.
B. What is the spatial scale for which the asset check is being conducted
The main arable areas in the UK are found in England (3.89m ha) and Scotland (0.55m ha) and constitute 98.6% of the UK arable area. These will be the focus of the asset check. Within these countries the most important arable areas are found in eastern areas, however the data used for the asset check is drawn from the Countryside Survey and location of sampling points is reliant on the sampling strategy used for that study. Within the area of arable land there is considerable variation in conditions due to factors such as soil type, slope, climate, management etc. These will all influence the ecosystem services supported by the asset and the relative impact of different soil properties and indicators. This study is a national overview which does not consider this heterogeneity.
1 The 1984 to 2011 timescale reflects data published in Agriculture in the United Kingdom (Defra, various years)

UK NEAFO Work Package 1: Natural capital asset check – Annex 4: Case studies
eftec 39 November 2012
C. Define the timescale for the asset check.
The asset check considers only the timescale of the data available for soil quality indicators. These are collected by the Countryside Survey and extend as far back as 1978 with the most recent data being collected in 2007 (Emmett et al, 2010). The time frame between successive Countryside Surveys (soils properties are reported for 1978, 1998 and 2007) is sufficient to determine whether significant changes are occurring. Arable farming is a highly modified land use and has been so for many decades or centuries. For example, available data suggests that significant increases in yields of wheat occurred particularly after 1948; average yields between 1885 and 1948 were 2.4 tonnes/ha compared to 7.7 tonnes/ha between 1995 and 2012. However, more recently there has been concern about a yield plateau for some crops (Knight et al, 2012). Over the period of the Countryside Survey soil quality indicators (1978 to 2007) 5-year average wheat yields have increased from 4.7 to 7.8 tonnes/ha.
D. What are the main ecosystem services the asset provides?
The main ecosystem services provided by, or contributed to by, the asset are identified in the Enclosed Farmland chapter of the UK NEA (Firbank et al, 2011):
• Crops • Climate regulation • Water quantity • Hazard regulation • Waste breakdown and detoxification • Wild species diversity • Purification • Environmental settings: landscapes
Appendix 1 presents a summary table also indicating which of the soil quality indicators collected by the Countryside Survey are relevant to each ecosystem service. This indicator set could be extended utilising other datasets such as the National Soils Inventory (England and Wales) held by Cranfield University and the National Soils Inventory of Scotland held by the James Hutton Institute.
Notes: It is useful to define these parameters for the analysis clearly at the outset. If a subset of a natural asset is being checked (e.g. peat bogs in Scotland are a subset of all peat bogs in the UK), then this can affect availability of data and interpretation of results. Our approach in the scoping study for Defra assumes that an asset needs to have some physical measurement, and defines natural capital assets as:
…stock that can be managed or protected in order to have a positive economic or social value. However, in further work looking at the definition of natural capital we have defined it as:
…the configuration of living and/or non-living processes and functions over time and space, that produce through their existence and/or some combination of their functions, a positive economic or social value.

40
1.2.2. Integrity of natural capital asset
Question Guidance on Answer Trends
Past trend Current trend Future Trend Summary of Trends (see key*)
E. What is the extent of the natural capital asset?
As defined by the area of land under arable production or defined as croppable the extent of arable soils in the UK in 2011 was 4.5m ha (arable) or 6.1m ha (croppable). Most of the difference between these figures is due to 1.3m ha of land classed as temporary grassland (i.e. < 5 years old); the rest is defined as either horticultural crops (0.18m ha) or uncropped (0.16m ha, i.e. set aside or fallow). Source: Agriculture in the United Kingdom (Defra, various years) In England there is approximately 14,000ha of arable and horticultural habitat designated as SSSI of which 13,800ha is considered to be in favourable condition (Natural England, 2013a).
As noted above, since 1984 there has been a 9.1% decline in arable land (12.7% decline in croppable area).
The rate in reduction of UK croppable area has remained fairly consistent over the time period of available data. There have been considerable changes within this land use which will affect the status of the asset and the associated ecosystem services. Specifically, there have been large changes in set-aside of fallow with large increases in the 1980s and 1990s followed by large reductions in the 2000s. An opposite trend has been observed for temporary grassland, i.e. periods of increases in set aside see
Future trends for this asset are likely to be driven in the short term by CAP reform and development pressure. Given recent high prices for arable commodities, CAP reform is unlikely to provide incentives for reduced production. Localised pressure for use of land for development is likely to persist. In the medium term, climate change is likely to have a growing influence on the asset. This will include more immediate increases in unpredictable weather and future shifts in average temperatures and precipitation. In
↓

UK NEAFO Work Package 1: Natural capital asset check – Annex 4: Case studies
eftec 41 November 2012
decreases in temporary grassland and vice versa.
turn these will affect the ecosystem service provision and demand from the asset.
F. What is the condition of the natural capital asset?
The soil properties indicators collected by the Countryside Survey provide information on a range of ecosystem services (see Appendix 2 for the rationale for each indicator). Bulk density: In 2007 for Great Britain soil bulk density in arable and horticulture habitats was 1.23g/cm3; this compares to 0.97g/cm3 for improved grassland indicating relatively poorer soil structure, porosity, carbon content and biodiversity. Soil C: Soil carbon concentration in arable and habitats in 2007 was 30.7g/kg in GB (30g/kg in England and 32.3g/kg in Scotland) this compares to 56.9g/kg for improved grassland in Great Britain. Mean soil C density in 2007 was 47.3t/ha in GB for arable and horticultural habitats. The values for England and Scotland were 46.9t/ha and 52.3t/ha. Soil C density is a possible measure of soil C stock for C sequestration actions.
Bulk density: Only measured in 2007 so no trend available. Soil C conc.: No significant change between 1978 and 1998. Soil C density: No significant change between 1978 and 1998
Bulk density: only measured in 2007 so no trend available. But modelled link to soil C concentration suggests bulk density has increased between 1998 and 2007. Soil C conc.: Significant declines between 1998 and 2007 in GB, England and Scotland. Soil C density: Significant declines between 1998 and 2007 in GB and England. No
Bulk density: the wet year in 2012 has highlighted the risk of soil compaction and the need for soil management action. Soil C conc.: Results suggest that soil C concentration has not reached a new equilibrium level. Recent land use changes indicate reduction on set-aside and increased cropping suggesting soil C decline could continue. Soil C density: Likely to follow similar trends to soil C concentration.
Bulk density: O (may follow soil C conc. trend)
Soil C conc.: ↓
Soil C density: ↓

42
Soil pH: In 2007 soil pH in arable and horticultural habitats was measured at 7.2, 7.43 and 6.28 in GB, England and Scotland respectively. pH levels above 7.5 are a potential limiting factor on plant growth as levels between 6.0 and 7.5 are required for soluble phosphorus. Total N: in 2007 total N levels for arable and horticulture habitats were 2.5% (dry weight of soil) for GB and England and 2.6% in Scotland. Total N is a basic measure of soil fertility. Total N density for 2007 was 4.3 t/ha for GB, 4.4 England and 4.1 Scotland. C:N ratio: In 2007 for GB the C:N ratio was 11.3 for arable and horticulture habitats. Lower C:N values indicate loss of soil C and increased mineralisation of N. Mineralisable N: in 2007 levels of Mineralisable N were 8.3mgN/kg dry soil in England and 10.8mgN/kg in Scotland for the arable and horticulture habitat.
Soil pH: Reduced acidification has result in increases in soil pH, these were significant in GB and England between 1978 and 1998. Total N: Data only collected since 1998 C:N ratio: Data only collected since 1998 Mineralisable N: Only measured in 2007 so no trend available.
significant change in Scotland. Soil pH: Significant increases in soil pH have continued between 1998 and 2007 in GB, England and Scotland. Total N: Significant reductions in were observed between 1998 and 2007 in GB and England. There was no change in Scotland. C:N ratio: Significant reduction in C:N ratio for GB between 1998 and 2007 Mineralisable N: Only measured in 2007 so no trend available.
Soil pH: If pH levels in England continue to increase towards a critical level than actions to acidify soils might be expected, e.g. the area over which sulphur dressing has been applied in England has increased since 1999. This has implications for future liming requirements to keep to optimal crop growth conditions. Total N: Likely that farmers or advisers would monitor N levels and take or recommend action if required. C:N ratio: reduction expected to continue with decline in C concentration. Mineralisable N: Uncertainty in how trends will develop but likely to follow
Soil pH: ↑
Total N: ↓
C:N ratio: ↓ Mineralisable N: O

UK NEAFO Work Package 1: Natural capital asset check – Annex 4: Case studies
eftec 43 November 2012
These compare to values of 10.1mgN/kg for improved grassland in both countries. This is a measure of plant nutrient availability. Olsen P: This is a measure of fertility of agricultural soils and potentially interactions with other ecosystems (e.g. freshwater). In 2007 for arable and horticulture habitats Olsen P was 44.2mg/kg, 41.8mg/kg, 51.6mg/kg for GB, England and Scotland respectively. Soil metals: The Countryside Survey measures concentrations of a number of metals at GB level, for arable and horticulture habitats these are: Cadmium (Cd), 0.35 mg/kg; Chromium (Cr), 25.4 mg/kg; Copper (Cu), 20.7 mg/kg; Nickel (Ni), 20.1 mg/kg; Lead (Pb), 41.9 mg/kg; Zinc (Zn), 84.4 mg/kg. Inputs of metals to soils arise from atmospheric deposition, animal manures and sewage sludge application. High metal concentrations can influence abundance and diversity of key soil taxa leading to breakdown of soil functions. Soil invertebrates: The Countryside
Olsen P: Data only collected since 1998 Soil metals: Data only collected since 1998 Soil invertebrates:
Olsen P: There have been significant declines in GB, England and Scotland between 1998 and 2007. This has coincided with a 37% decrease in phosphate fertiliser application to tillage crops across GB (BSFP, 2008). Soil metals: 1998 to 2007, no significant change: Cd, Cu, Pb; significant decrease: Cr, Ni, Zn Soil invertebrates:
N inputs (quantities and timings) in arable systems. On-going farm monitoring is likely to recommend action if required. Olsen P: Likely that farmers or advisers would monitor P levels and take or recommend action if required. However the NEA Supporting Services chapter (Bardgett et al, 2011) notes a need for greater understanding of the P cycle across UK habitats. Soil metals: Cu and Cd concentrations are expected to be maintained or rise in areas where animal manures and sewage sludge are applied. For Cr, Ni and Zn outputs are likely to exceed inputs where cropping occurs. Soil invertebrates:
Olsen P: ↓
Soil metals: ↓ Soil invertebrates:

44
Survey publishes data on 5 measure of soil invertebrates at GB level, for arable and horticulture habitats these are: Total invertebrate catch, 31.6; Number of broad taxa, 3.4; Combined catch of mites and springtails, 28.1; Mites to springtail ratio, 5.31; Shannon diversity, 0.85.
Data only collected since 1998
1998 to 2007, no significant change in total catch. Significant decreases in number of broad taxa and Shannon diversity. Significant increases in combined catch of mites and springtails and mites to springtail ratio.
The Countryside Survey was unable to determine whether the observed trends are ongoing due to changes in soil chemistry, land management, climate change or due to short term weather patterns
↓
Overall condition The combination of indicators and trends above suggest that arable soil quality is declining in terms of structure, carbon concentration, nutrient status, pH and biodiversity.
Uncertainties
Established but incomplete evidence: The asset provides a range of ecosystem services and its condition is described using a range of indicators. These indicators have differing influences across the ecosystem services, for example reduced Olsen P and total N are potentially beneficial for water quality but may have negative impact on crop production (recent wheat yields have been static). In general the indicators are not moving in desirable directions. For other indicators, the relationship may only be indirect; for example impacts on landscape where soil quality provides the underpinning for the land uses that contribute to landscape character.
Key for trends
↑ increasing ↓ Decreasing
↔ evidence shows no trend O no evidence
↑↓ both increasing and decreasing (this could reflect ambiguous evidence and/or spatially differing trends)

UK NEAFO Work Package 1: Natural capital asset check – Annex 4: Case studies
eftec 45 November 2012
G. Drivers of changes in Extent and Condition
List policy drivers Note there may be different drivers of
changes in stock and condition
The main policy driver affecting this asset is the CAP which sets incentive structures for both crop production and environmental management of arable land. The structure of these incentives has shifted with past reform of the CAP to decouple payments from production and to emphasise environmental management through both cross-compliance requirements (linked to single payment) and stewardship payments2. Other relevant policy drivers include the Nitrates Directive which influences timing and rates of N application and the Water Framework Directives which licences water abstraction and encourages mitigation of diffuse pollutants.
List biophysical drivers The asset is subject to fluctuations in weather patterns which interact with management practices. For example water logged soils are at greater risk of compaction; extreme rain increases risk of soil erosion; damper soils are related to changes in invertebrate communities (i.e. mite:springtail ratio). Historic reductions in sulphur deposition are resulting in increasing soil pH leading to potential future nutrient (P) availability problems. Longer term climate change may shift soil properties to a new equilibrium.
List socio-economic & other drivers The decoupling of CAP payments from production was intended to make production more responsive to markets. However, price spikes as seen recently may incentivise short term gain over sustainable management. High quality arable soils often coincide with areas of development pressure resulting in risk of small scale and localised, but permanent, loss of the asset.
H. What are the asset’s main ecosystem functions?
The main ecosystem functions performed by the asset include (as identified by Bennett et al, 2010): • Soil structure maintenance • Organic matter cycling • Nutrient cycling • Ion retention and exchange • Water cycling • Gas cycling • Soil biological life cycles
The links to the final services in arable soils have been identified by Bennett et al (2010) Glenk et al (2012) and are illustrated in Appendix 1. The figure shows a stylised representation of the links between ecosystem
2 Cross-compliance includes Statutory Management Requirements (SMRs) and the need to keep land in Good Agricultural and Environmental Condition (GAEC). SMR3 relates to application of sewage sludge, whilst there are GEACs relating to soil management including in England the requirement to complete a Soil Protection Review.

46
processes, final ecosystem services and benefits, illustrating the complexity of these linkages. Full understanding of the interactions between functions in providing final services is likely to require additional research.
I. Integrity Test: Is the ability of the asset to support ecosystem services being maintained?
The ability of arable soils to produce crops has relied on the use of additional inputs (specifically fertilisers, but also crop protection products) to increase yield substantially from historic levels. At the same time this intensive, input based, management has compromised the range of non-production (or non-market) ecosystem services. Recent trends in crop yields and input use are static (or declining for P and K), suggesting that productivity is being maintained. At the same time indicators for other linked ecosystem services have been improving, notably percentage of river length classified in good condition and agricultural emissions of GHGs emissions (N2O) and also ammonia. Recent trends suggest that the main provisioning function of the asset is being maintained whilst other linked ecosystem services are being improved with the exception of carbon storage/sequestration and wild species conservation.
Notes: Non-essential supporting information that can be useful for decision-makers includes:
- are the ecosystem services provided by the asset rival or non-rival goods?
- are the ecosystem services provided by the asset market or non-market goods?
- Some main final services may rely on supporting and intermediate services from natural capital assets not considered in the asset check. Links to the status of these other assets may be an important factor for the asset check. It may be possible to consider their status/trend/management within the asset check, but where the links become complex, such analysis may not be feasible. However, these interdependencies should be noted; furthermore the natural capital underpinning the final services in question may justify a separate asset check.

UK NEAFO Work Package 1: Natural capital asset check – Annex 4: Case studies
eftec 47 November 2012
1.2.3. Performance of natural capital asset In this context ‘performance’ is fitness to carry out the role which is required of a capital asset. This is regarded as useful because defining the target performance of natural capital assets captures both the current and future quantity and quality of an asset. Human ‘requirements’ include basic human needs, but also reflect infinite wants, so the definition of performance is usually subjective.
Question Guidance on Answer
J. Is there a measures of the current output of services from the asset?
The measures and sources of ES output data are summarised below:
Key soil ES Measure Source
Crops • Productivity/yield for key crops (t/ha) • Agriculture in the United Kingdom
Climate regulation
• Total GHG emissions from soils (t/ha) • Per ha GHG emissions from soils based
on N inputs and emissions factors (t/ha)
• Topsoil soil carbon density (t/ha)
• UK GHG Inventory • British Survey of Fertiliser Practice • Countryside Survey
Water quantity • Agricultural water abstraction impact on water availability (million m3) • ENV15 - Water abstraction tables
Hazard regulation • Erosion rates (t/ha) • Estimates from literature Waste breakdown and detoxification
• Disposal of sewage sludge to farmland (tonnes)
• WR_0922 Sewage sludge arisings and management (data to 2005 only)
Wild species diversity • Soil invertebrate counts (indicator of
wider biodiversity, e.g. as food source for birds)
• Countryside Survey
Purification
• Nitrate levels in rivers by land use type (mg/l)
• Orthophosphate levels in rivers by land use type (mg/l)
• ENV-16 Harmonised Monitoring Scheme datasets
Environmental settings: Landscapes • Annual trips to arable areas • Natural England Monitor of Engagement with
the Natural Environment
K. What goods and benefits do these services support?
The following table outline the main goods and benefits that arise from the asset including linked ecosystems. Goods/benefit categories adapted from UK NEA Good/benefit
Food / Fibre Income from production and sale of crop yield (or biomass for materials and fuel production)

48
Equable climate Reduced or delayed damage related to climate change Flood control Reduced damage due to flooding Drought regulation Reduced pressure on water resources Drinking water High quality drinking water from groundwater sources Drinking water High quality drinking water from surface water sources Pollution control Buffering and waste assimilation by soils Recreation/Tourism Pleasure and fulfilment derived from terrestrial recreational activities Recreation/Tourism Pleasure and fulfilment derived from freshwater recreational activities
Aesthetic/Inspiration Landscape benefits (different paths: soil as visual component; soil as platform for landscapes)
Non-use value (existence and bequest) for agricultural ecosystems
Knowing that agricultural landscapes provide habitat also for future generations (or others living at present)
Non-use value (existence and bequest) associated with aquatic ecosystems
Knowing that rivers and lakes are and will be in good condition for future generations (or others living at present)
L. What is the target performance from the asset?
There is no specific target performance for the asset, instead there are linked targets for key ES which are underpinned by the performance of soil functions: Ecosystem service Target Relevant soil function/property Crops Maintain overall levels of production Soil fertility, structure, moisture Climate regulation Reduce agricultural GHG emissions and maintain
Increase stocks of soil carbon Soil fertility, soil organic matter concentration (with related influence on structure, moisture, nutrients etc), soil nutrient levels (allowing N use efficiency) and nitrification
Water quantity Contribution to flood management (run-off) Good Ecological Status (abstraction and impoundment)
Soil structure allowing infiltration, slowing surface flow, maintaining soil moisture
Hazard regulation Contribute to natural flood management Soil structure allowing infiltration and slowing surface flow
Waste breakdown and detoxification
Disposal of sewage sludge Heavy metal concentrations (critical values)
Wild species diversity Halt loss of biodiversity by 2020, aim to have 95% of SSSIs in favourable or recovering condition by 2020
Soil invertebrates
Purification Ensure all water bodies reach Good Ecological Status Soil structure reducing erosion and allowing infiltration, slowing surface flow
Environmental settings: Landscapes
Landscape conservation objectives Arises from maintaining other ES

UK NEAFO Work Package 1: Natural capital asset check – Annex 4: Case studies
eftec 49 November 2012
Uncertainties
Established but incomplete evidence: Although there is well established evidence for the status of most of the ecosystem services listed in L, with the exception of natural flood management, the precise functional relationship between soil quality as the asset and these services is less certain. The interaction between functions to provide multiple ecosystem services is not well understood.
Defining performance: Answering these questions can help define performance, but not all questions can be answered for all assets
What policy targets are there for the asset?
There are a number of policy targets relating to linked ecosystems to which soil quality contributes. The importance of soil quality in underpinning sustainable food production is recognised in the Green Food Project’s Conclusions (Defra, 2012). Maintaining or increasing the stock of carbon held in agricultural soils is an important element of UK Climate Change mitigation policy. This is combined with more efficient use of nutrients (to reduce N2O emissions) and emphasises the role of soil organic matter in soil fertility. Nutrient use also impacts on water quality and the targets for Good Ecological Status (Water Framework Directive), nitrate and phosphate levels. Although these policy targets are not directly related to soil quality, their delivery is reliant on good soil management.
What is the trend in the main services the asset provides?
The trend in soil quality within the enclosed farmland broad habitat was assessed as of being of high importance with some deterioration. Our consideration of soil as the asset also means that soil quality is supporting function or service underlying the broader range of service provided by enclosed farmland.
Key soil ES UK NEA assessment (since 1990 for enclosed farmland)
Crops Climate regulation ↑↓ Water quantity Hazard regulation Waste breakdown and detoxification ↑↓ Wild species diversity Purification ↑↓ Environmental settings: Landscapes ↔
Key to trends: ↑ increasing some increase ↑↓ both increasing and decreasing ↓ Decreasing some decrease ↔ evidence shows no trend O no evidence
What types of goods are supported by the asset?
The following table links the key ecosystem services underpinned by soil quality with the goods categories. It indicates that some goods are dependent on multiple ecosystem service categories (or sub-categories).

50
Key soil ES Goods/benefit categories adapted from UK NEA Crops Food / Fibre Climate regulation Equable climate Water quantity Hazard regulation
Flood control
Purification Drinking water Waste breakdown and detoxification Pollution control
Wild species diversity Environmental settings: Landscapes
Recreation/Tourism Aesthetic/Inspiration Non-use value (existence and bequest) for agricultural ecosystems
Wild species diversity Water quantity Purification
Non-use value (existence and bequest) associated with aquatic ecosystems
Who benefits from the goods?
The table below outlines the nature and location of the beneficiaries for each of goods/benefits categories.
Goods/benefit categories adapted from UK NEA
Beneficiaries Private /public
Location (Local, Catchment,
Landscape, National, Global)
Food / Fibre Farmers, consumers Private Lo, N Equable climate Future population Public G Flood control Residents and businesses Private C, La Drinking water Consumers Private C, La, N
Pollution control General population Land managers
Public Private
Lo, C, La, N
Recreation/Tourism General population, local business
Public Private
Lo, N
Aesthetic/Inspiration General population Public N Non-use value (existence and bequest) for agricultural ecosystems General population Public N
Non-use value (existence and bequest) associated with aquatic ecosystems General population Public N
What wellbeing results from the goods?
The role of soil quality in providing a range of goods and services is recognised and values for those benefits can be estimated. Apportioning those values to specific underpinning factors such

UK NEAFO Work Package 1: Natural capital asset check – Annex 4: Case studies
eftec 51 November 2012
as soil quality is problematic. The following values are therefore only indicative of the value of final goods or benefits towards which soil quality contributes; further it is not possible to definitively apportion values for arable farming. Some of these values are also presented as costs due to negative impacts of agricultural land management; they do not reflect the value of marginal changes in soil quality on ecosystem service provision. As indicated in the table above linking final ES with goods and benefits there is considerable scope for double counting of values due to overlapping categorisations and difficulty in separating motivations for values. Food / Fibre: The value of production of arable and horticultural crops in the UK in 2010 was £6.6bn although full production functions would be required for the contribution of soil quality to be assessed. Equable climate: Changes in soil C stocks and reductions in N2O emissions through increased soil fertility (with potential reductions in N applications) can be valued using appropriate carbon prices. Flood control: The Environmental Accounts for Agriculture (eftec/IEEP, 2004 and Jacobs/SAC, 2008) both estimate annual flood damage costs due to agriculture; these were £164m in 2007. However, this value is highly uncertain as it does not link soil quality and land use to flood events and actual flood damage costs. Drinking water: The Environmental Accounts for Agriculture estimated that the removal of contaminants (nitrates, pesticides and sediments) apportioned to agriculture cost the water industry in England and Wales £106m in 2007. This value is also highly uncertain and cannot be attributed to specific sub-sectors within agriculture. The value also does not consider the relative effects of soil quality on run-off rates and quality. Pollution control: There are no direct estimates of the pollution control benefits arising from the waste breakdown and purification services of soil. The Environmental Accounts for Agriculture estimated the benefits of disposal of sewage sludge to land (avoided incineration costs) as £35m per annum in 2007 for England, Wales and Scotland. Recreation/Tourism: Natural England’s Monitor of Engagement with the Natural Environment (MENE) surveys between 2009 and 2012 (Natural England, 2013) found that 3% of day visits were to ‘farmland’ in regions where arable farming predominates (East of England, East Midlands and South East) and these were associated with mean expenditure of £1.37 per visit (visits to ‘farmland’ accounted for 8% of visits across all regions). In Scotland visits to ‘farmland: fields with

52
crops’ accounted for 2% of day visits in 2011 (TNS Research International, 2012), however the available data do not allow an estimate of per trip expenditure to be made for visit location types. Aesthetic/Inspiration: These values could be attributed to landscape, however there is a general gap in the valuation literature with respect to arable landscapes. The reasons for this are the concentration of previous valuation efforts on specific landscape features (e.g. hedgerows) or landscapes of higher nature values (e.g. agri-environment designation where arable areas are not represented). It is also likely that recreation/tourism values will include elements of aesthetic/inspiration values potentially resulting in double counting of benefits. Non-use value (existence and bequest) for agricultural ecosystems: The Environmental Accounts for Agriculture used the value of farmland birds as a proxy for all agricultural biodiversity benefits; these were estimated at £307m for the UK in 2007. It is reasonable to assume that a significant proportion of this value has non-use motives (as well as recreation/tourism and aesthetic/inspiration); however the values cannot be readily apportioned to soil quality. Non-use value (existence and bequest) associated with aquatic ecosystems: The Environmental Accounts for Agriculture estimated that the costs of freshwaters being in less than ‘good’ condition in 2007 was £88m per annum; further, the costs due to agricultural abstraction was estimated at £62m due to summer low flows. As with terrestrial non-use values there is also likely to be elements of recreation/tourism and aesthetic/inspiration values within these estimates. Again, apportioning value to soil quality is difficult.
M. Are any future changes in target performance expected?
Section G outlines the main drivers of performance of the asset. As noted previous concentration on provision of a limited range of ecosystem services (crop production) conflicted with other linked services (notably GHG emissions, water quality and water quantity). Recent changes in these drivers such as CAP reform have changed management incentives by decoupling farm payments from production and introducing cross-compliance. Environmental targets on water, waste, flooding and climate change are likely to continue the focus on a broader range of target performance. Soil quality and management will be a key element in delivering future performance. Negotiations are also continuing on a proposed EU Soils Framework Directive as the primary delivery mechanism for the EU Soils Thematic Strategy, however progress has stalled and EU level soils policy is likely to continue to be delivered through other means such as CAP regulations.
N. Can future target
The table below outlines the broad performance targets for the ecosystem services provided by the asset together with the

UK NEAFO Work Package 1: Natural capital asset check – Annex 4: Case studies
eftec 53 November 2012
performance be defined?
potential future performance and key drivers. Ecosystem service Target Future
performance Drivers
Crops Maintain overall levels of production
↑↓ CAP reform, market signals -
Climate regulation Reduce agricultural GHG emissions and maintain Increase stocks of soil carbon
Climate Change Acts, Treaty Obligations
Water quantity Contribution to flood management (run-off) Good Ecological Status (abstraction and impoundment)
Flood and Water Management Act Flood Risk Management (Scotland) Act Water Framework Directive
Hazard regulation Contribute to natural flood management
Flood and Water Management Act Flood Risk Management (Scotland) Act
Waste breakdown and detoxification
Disposal of sewage sludge ↔ Urban Waste Water Treatment Directive Nitrates Directive
Wild species diversity
Halt loss of biodiversity by 2020, aim to have 95% of SSSIs in favourable or recovering condition by 2020
Biodiversity Strategy for 2020
Purification Ensure all water bodies reach Good Ecological Status
Water Framework Directive Nitrates Directive
Environmental settings: Landscapes
No specific targets – arises from maintaining other ES
↔
Key to trends: ↑ increasing some increase ↑↓ both increasing and decreasing ↓ Decreasing some decrease ↔ evidence shows no trend O no evidence
Notes: Non-essential supporting information that can be useful for decision-makers includes:
- Has target performance changed over time? If so how?
- Distributional issues: what is the distribution of the beneficiaries of the goods supported by the ecosystem services from the asset?
- Do the goods provided by the ecosystem services from the asset have use and/or non-use values?

54
1.2.4. Natural capital asset criticalities Note that these answers may be very different for different spatial scales, so Question B gives important context, and appropriate scale of analysis may need to be reconsidered.
Question Guidance on Answer
O. What is the trajectory of change for the asset?
The following table outlines trajectories for extent and each of the soil indicators. Indicator Trend Trajectory Extent
↓ Arable land has declined in extent by 9.1% since 1984 (12.7% decline in total croppable area) and there is an issue that losses are proportionally greater from prime agricultural land. Reduction in quality of remaining stock is also of concern
Bulk density ↓
Potential decline (linked to soil C) and also due to compaction. Linked to localised and time dependent loss or degradation of key ecosystem services (e.g. yield, water management). Can be managed through cultivation practices
Soil C conc. ↓ Soil C concentration threshold of 2% is widely used but empirically unproven. GB levels have declined from 3.5% to 3.1% between 1978 and 2008 suggesting threshold and potential non-linear effects of loss of soil structure are not imminent Soil C density ↓
Soil pH ↑ Soil pH reaching critical level for arable crops in some locations, can be addressed through application of ammonium sulphate / lime.
Total N
↓ N application rates have declined in recent years and this has coincided with a ‘yield plateau’ for crops such as wheat and oilseed rape. Knight et al. (2012) found that a variety of reasons could be responsible for the ‘yield plateau’ but note that N use efficiency could be improved rather than increase N application (given environmental constraints).
C:N ratio ↓ Related to trajectories of C and N.
Mineralisable N ↓ Linked to N trajectory; decline in mineralisable N suggests lower nutrient availability for crops but reduced eutrophication in broader ecosystems.
Olsen P ↓
P application rates to tillage crops have fallen dramatically in recent years (45% between 1998 and 2012; BSFP, 2013). Phosphate status and availability might be further reduced by deep ploughing (dilution by subsoil) and rising pH (decreased solubility).
Soil metal ↓
Cu and Cd levels expected to be maintained or rise due to ongoing application of animal manures and sewage sludge. Cr, Ni and Zn are likely to decline as outputs exceed inputs in arable soils.
Soil invertebrates ↓ Soil biodiversity has been declining on measures of total catch, number of taxa and Shannon diversity, although it is unclear whether observed trends are responding to
UK NEAFO Work Package 1: Natural capital asset check – Annex 4: Case studies
eftec 55 November 2012
weather, climate, land management or soil chemistry (e.g. pH). Soil biota performs key ecosystem functions and decreasing diversity may indicate reduced resilience to future changes in drivers.
P. Are there any standards or agreed limits of change to the asset?
There are no broadly agreed standards for soil quality, although limits can be applied to individual indicators: • Critical upper limits exist for soil metal concentrations relating to sewage sludge applications and contaminated land
regulations.
Q. Are there likely to be any threshold effects?
Thresholds strictly refer to the intrinsic properties of the asset. However, due to lack of knowledge and natural variation either within the asset (e.g. soil type, structure, depth) or its context (e.g. slope, climate) there is no broadly agreed threshold for soil quality; thresholds can be applied to individual indicators:
• There is an informal threshold for soil C concentration of 2% but there is little scientific evidence for this threshold (Loveland and Webb, 2003). An alternative uses median statistics for arable soil.
• pH values above 7.5 are a potential limiting factor for plant growth.
R. What is the reversibility of changes to the asset?
Given the heavily managed nature of the asset it is likely that changes in some indicators can be reversed where these are due to management (either alone or in combination with other factors). Given the complexity of the asset it is unlikely that changes can be reversed in a way that achieves any given previous state. Where there is uncertainty as to cause of observed trends (e.g. soil biota) and/or where drivers cannot be fully mitigated (e.g. climate change) then changes may not be reversible. With respect to some indicators such as nutrient status reversing observed trends might not be desirable for all ecosystem services.
S. What is the cumulative effect of impacts on the asset?
The asset has been subject to ongoing intensive management which has reduced carbon content, with negative impacts on soil structure; it has in the past been associated with excessive nutrient inputs which have since been reduced. Reduced sulphur deposition (itself in response to acidification concerns in other ecosystems) has resulted in increasing pH and consequent impacts on nutrient availability, yields and soil biota. The cumulative effect of these impacts is likely to be a reduced resilience to acute short-term or chronic long-term changes.
T. What risks are associated with current trends in the asset integrity?
Widespread risk are likely to be low due to potential for management action, however localised and/or short-term risks to integrity may be high (e.g. due to adverse weather conditions) which will affect the ability of the asset to provide key ecosystem services.
U. What substitutes exist for the main ecosystem services from the asset?
The table below summarises the potential impacts on key ecosystem services that might trigger the need to seek substitutes. Issues with the use of these substitutes are also outlined.

56
Key soil ES Potential impact Potential substitutes Issues
Crops • Reduced yields/output • More variable inter-annual
yields/output
• Imported commodities and products
• Conversion of marginal lands to arable
• Greater intensification (higher inputs)
• Loss of ‘food security’ • Greater environmental
impacts/loss of ecosystem services elsewhere
Climate regulation • Increased GHG emissions • Loss of soil C stock
• Displacement of mitigation activities to other sectors to meet targets
• Loss of cost-effective mitigation measures and policy flexibility
Water quantity • Increased seasonal low-flows due to abstraction
• Reduced abstraction in other sectors
• May be no local substitutes
Hazard regulation • Increased run-off and erosion
• Engineered flood defences • Dredging of sediments
• Cost
Waste breakdown and detoxification
• Loss of suitable land for sewage sludge disposal
• Incineration of sewage sludge • Cost and public opposition
Wild species diversity • Loss of soil biota and linked farmland species
• Targeting of other ecosystems • Reduced overall resilience
Purification • Increased nutrient inputs • Water treatment • Cost Environmental settings: Landscapes
• Changing land use patterns • Development
• More distant alternative landscapes
• Loss of local amenity and cultural heritage
Uncertainties
Well established: the available substitutes are proven and have or are being used to some extent.
Non-essential supporting information that can be useful for decision-makers includes:
- What is the level of investment needed in the natural capital to maintain it above the limits/thresholds identified above?
- What are the distributional (social group/intergenerational) implications of the criticality identified?

UK NEAFO Work Package 1: Natural capital asset check – Annex 4: Case studies
eftec 57 November 2012
- For question T, define on what basis the substitute(s) are identified (e.g. which ecosystem services the substitute provides).

58
1.2.5. Natural capital asset check
Question Guidance on Answer
V. Tradeoffs?
The key trade-offs are between crop production and the other ecosystem services. Specifically, maximising production through intensive cultivation is likely to increase overall GHG emissions though fertiliser use and loss of soil carbon (emission per tonne of output may decline though). Increased inputs may lead to greater nutrient leaching with impacts on water quality. More intensive cultivation may also increase surface flow, run-off and soil erosion, with possible flooding impacts and further exacerbation of water quality issues. Higher use of inputs and tillage may also have negative impacts of soil biodiversity.
W. Synergies?
Action to increase provision of services such as GHG emissions or water quality and quantity are likely to have synergistic impacts across all services with the exception of crop production (which may remain stable rather than decrease). The primary mechanisms of such action are likely to be reduced nutrient inputs, increased use of cover crops and reduced tillage.
Uncertainties
Established but incomplete evidence: awareness of the trade-offs in particular has been a recent driver of policy. Implementing policy to optimise the synergies has been less evident although is subject to research and policy interest (e.g. integrated catchment management, Ecosystems Approach).
X. Sustainability test: is the asset currently able to give the target performance?
Yes: in the short term the asset should be able to respond to management in order to maintain or improve performance across the range of target ecosystem services.
If yes - will this performance be sustained into the future?
Yes: but there is potential for reduced resilience which might increase vulnerability to future change in climate and extreme events, with consequent reduction in ecosystem service provision or flexibility of use (i.e. farm management options might become constrained)
If no – state why?
Y. Red flags? Widespread failure to meet target performance is unlikely due to available management options; however, if soil C levels continue to decline following observed trends then a large proportion of arable soils would technically be failing GEAC cross-compliance requirements to maintain soil organic matter. Localised failures may occur, e.g. through excessive loss of soil carbon or increased pH.
Uncertainties
Established but incomplete evidence: the asset check has been based on a national scale sampling of indicators. Risks of thresholds/criticalities at smaller scales should be considered for a more targeted assessment.

UK NEAFO Work Package 1: Natural capital asset check – Annex 4: Case studies
eftec 59 November 2012
1.2.6. Conclusions
Summary of Arable Soils natural capital asset check
Asset Trends in natural asset integrity
Target performance Criticalities Sustainability of performance
Red Flags
The asset is agricultural soils associated with arable crop production. The scale of the asset is approximately 4.4m ha of land in arable production in England and Scotland (98.6% of UK cropped area). This differs from the total UK croppable area including temporary grassland and uncultivated land which is up to 6.1m ha.
The ability of arable soils to produce crops has relied on the use of additional inputs to increase yield from historic levels. This intensive management has compromised the range of non-production ecosystem services. Recent trends in crop yields and input use are static (or declining for P and K), suggesting that productivity is being maintained. Indicators for other linked ecosystem services have been improving, notably percentage of river length classified in good condition and agricultural emissions of GHGs emissions (N2O) and also ammonia. Recent trends suggest that the main provisioning function of the asset is being maintained whilst other linked ecosystem services are being improved.
• Maintain overall levels of crop production
• Reduce agricultural GHG emissions
• Maintain or increase stocks of soil carbon
• Contribution to flood management (run-off)
• Good Ecological Status of water bodies (abstraction and impoundment)
• Disposal of sewage sludge
• Halt loss of biodiversity by 2020
There are no broadly agreed standards or criticalities for soil quality, although limits can be applied to individual indicators:
• Informal threshold for soil C concentration of 2%.
• pH values above 7.5 are a potential limiting factor for plant growth.
• Upper limits exist for soil metal concentrations
In the short term the asset should be able to respond to management in order to maintain or improve performance across the range of target ecosystem services.
Widespread failure to meet target performance is unlikely due to available management options; however, if soil C levels continue to decline following observed trends then a large proportion of arable soils would technically be failing GEAC cross-compliance requirements to maintain soil organic matter. Localised failures may occur, e.g. through excessive loss of soil carbon or increased pH.

60
1.2.7. References Bardgett RD, Campbell CD, Emmett BA, Jenkins A and Whitmore AP (2011) Supporting Services In: The UK National Ecosystem Assessment Technical Report. UK National Ecosystem Assessment, UNEP-WCMC, Cambridge. Bennett LT, Mele PM, Annett S, Kasel S (2010) Examining links between soil management, soil health, and public benefits in agricultural landscapes: An Australian perspective. Agriculture, Ecosystems and Environment 139: 1-12. BSFP (2008) The British Survey of Fertiliser Practice: Fertiliser Use of Farm Crops for Crop Year 2007, Defra. BSFP (2013) The British Survey of Fertiliser Practice: Fertiliser Use of Farm Crops for Crop Year 2012, Defra. Carey PD, Wallis S, Chamberlain PM, Cooper A, Emmett BA, Maskell LC, McCann T, Murphy J, Norton LR, Reynolds B, Scott WA, Simpson IC, Smart SM, and Ullyett JM (2008) Countryside Survey: UK Results from 2007, NERC/Centre for Ecology & Hydrology, 105pp. (CEH Project Number: C03259). Defra (various years) Agriculture in the United Kingdom, Defra, Department of Agriculture and Rural Development (Northern Ireland), Welsh Assembly Government (The Department for Rural Affairs and Heritage), The Scottish Government (Rural and Environment Research and Analysis Directorate) https://www.gov.uk/government/statistical-data-sets/agriculture-in-the-united-kingdom (accessed 11/06/13) Defra (2012) Green Food Project Conclusions, Report for Defra July 2012, https://www.gov.uk/government/uploads/system/uploads/attachment_data/file/69575/pb13794-greenfoodproject-report.pdf (accessed 30/04/13) Eftec and IEEP (2004) Framework for Environmental Accounts for Agriculture, Final Report to Defra, Department of Agriculture and Rural Development (Northern Ireland), Scottish Executive and Welsh Assembly Government. Emmett BA, Reynolds B, Chamberlain PM, Rowe E, Spurgeon D, Brittain SA, Frogbrook Z, Hughes S, Lawlor AJ, Poskitt J, Potter E, Robinson DA, Scott A, Wood C and Woods C (2010) Countryside Survey: Soils Report from 2007, CS Technical Report No 9/07, Centre for Ecology and Hydrology Firbank L, Bradbury R, McCracken D, Stoate C, Goulding K, Harmer R, Hess T, Jenkins A, Pilgrim E, Potts S, Smith P, Ragab R, Storkey J and Williams P (2011) Enclosed Farmland, In: The UK National Ecosystem Assessment Technical Report. UK National Ecosystem Assessment, UNEP-WCMC, Cambridge. Glenk K, McVittie A, Moran D, Smith P, Yeluripati J, Ghaley B and Porter J (2012) Soil and Soil Organic Carbon within an Ecosystem Service Approach Linking Biophysical and Economic Data, SmartSOIL Deliverable D3.1 Jacobs and SAC (2008) Environmental Accounts for Agriculture, Final Report to Defra, Welsh Assembly Government, Scottish Government and Department of Agriculture and Rural Development (Northern Ireland) Knight S, Kightley S, Bingham I, Hoad S, Lang B, Philpott H, Stobart R, Thomas J, Barnes A and Ball B (2012) Desk study to evaluate contributory causes of the current ‘yield plateau’ in wheat and oilseed rape, Project Report No. 502 for HGCA and Defra prepared by NIAB, SRUC and Cambridge University Loveland P and Webb J (2003) Is there a critical level of organic matter in the agricultural soils of temperate regions: a review, Soil and Tillage Research, 70: 1–18.

UK NEAFO Work Package 1: Natural capital asset check – Annex 4: Case studies
eftec 61 November 2012
Natural England (2013a) Sites of Special Scientific Interest: Report and statistics http://www.sssi.naturalengland.org.uk/Special/sssi/reportIndex.cfm (accessed 12/06/13) Natural England (2013b) Monitor of Engagement with the Natural Environment (MENE), online resources http://www.naturalengland.org.uk/ourwork/research/mene.aspx (accessed 30/04/13) TNS Research International (2012) Scottish Recreation Survey: Annual summary report 2011, Scottish Natural Heritage Commissioned Report No. 535.

62
1.2.8. Appendix Appendix 1 Supplementary information and tables Section D Soil Ecosystem Services and assessment of indicators
Key soil ES
Impo
rtan
ce o
f ass
et
Impa
ct o
f soi
l on
ES
Dire
ct/i
ndire
ct
Comments Indicators
Bulk
den
sity
Soil
C
Soil
pH
Tota
l N
C:N
ratio
Min
eral
isab
le N
Ols
en P
Soil
Met
al
Soil
Inve
rteb
rate
s
Crops High ++ D Primary purpose of land use
Climate regulation High -- D Major source of GHG emissions and store of soil carbon
Water quantity High +/- D Important for regulating surface and groundwater flows for flood risk management.
Hazard regulation High -- D Impacts due to sediment loss, downstream flood risk Waste breakdown and detoxification High --/+ D Diffuse pollution (soil management), positive for
composting green waste and sewage sludge disposal
Wild species diversity High -- D Soil microbes
Purification Low -- D Negative impact on water quality due to diffuse pollution Environmental settings: Landscapes High ++ I Farming management is largely responsible for cherished
landscapes

UK NEAFO Work Package 1: Natural capital asset check – Annex 4: Case studies
eftec 63 November 2012
Section H Links between soil ecosystem processes (intermediate services) and final ecosystem services Source: Glenk et al (2012), adapted from Bennett et al (2010)

64
Appendix 2 Soil Indicators Comments uses of soil indicators (source: Emmett et al, 2010) Bulk density • Soil physical structure
• Soil compaction (or loosening) • Soil porosity (available pore space) • Soil biodiversity (macropore volume) • Estimation of soil carbon density
Soil C • Fundamental to soil functioning • Primary energy source in soil • Maintains soil structural condition • Resilience and water retention
Soil pH • Indicator of soil acidity and recovery from acidification • Predicts mobility and bioavailability of metals (essential plant micronutrients) • Response of plant species to changes in atmospheric N and acid deposition • Potential limiting factor on arable crops (pH 6.0 to 7.5 needed for soluble P)
Total N • Total soil N concentration and stock are basic measures of soil fertility • Long term trend measure of nutrient status
C:N ratio • Influences the rate of decomposition of organic matter and the degree of release (mineralisation) or immobilisation of nitrogen (C > N immobilisation; C < N release)
• Increased C:N ratio might indicate greater N removal of vegetation or greater inputs and storage of C
• Declining C:N ratio indicates loss of soil C Mineralisable N • Index of plant-available N
• Indicator of eutrophication of the countryside as evidenced by plant species composition
• Will be used to improve models of nutrient (C and N) cycling Olsen P • Assessment of fertility of agricultural soils
• Recommended as an indicator for interactions between soil and linked ecosystems (e.g. freshwaters)
Soil Metal • High metal concentrations can influence abundance and diversity of keystone soil taxa (e.g. earthworms, springtails, nitrifying bacteria), potentially resulting in breakdown of soil functions (e.g. decomposition, nutrient turnover and regulation of hydrological flows)
• Metals can only be removed by long term leaching and cropping • Cu and Cd sources include animal manures, sewage sludge and atmospheric
deposition. Cr, Ni and Zn are reducing due to cropping. Soil Invertebrates
• Soil biota are important for biomass production; storing, filtering and transforming nutrients, contaminants and water; acting as a biodiversity pool
• Mite : springtail ratio varies in proportion to rainfall

UK NEAFO Work Package 1: Natural capital asset check – Annex 4: Case studies
eftec 65 November 2012
Appendix 3 Aims of Countryside Survey soil sampling The following description of the Countryside Survey soil sampling exercise is taken from http://www.countrysidesurvey.org.uk/science-and-research/work-packages/soils The main objectives were to:
• Assess the status of key soil properties* and any changes that have occurred. • Identify linkages between soil properties. • Attribute changes in soils to a range of different drivers (or pressures), such as
management, vegetation change, climate and air pollution. • Interpret possible effects of change on soil function. • Help identify linkages between soils, vegetation and water. *soil properties to be analysed are pH; soil organic matter (SOM); soil organic carbon (SOC); bulk density; hand texture; total-N; soil C:N (by calculation); Olsen-P; potential mineralisable N; invertebrate diversity by main taxa; metals.
Details:
Soils have been part of Countryside Survey since its inception in 1978. The rationale for their inclusion was originally to provide many of the explanatory variables that contribute to the understanding of vegetation distribution and change. More recently soils have been recognised as a valuable resource in their own right, due to their importance for delivering a range of soil functions – such as the breakdown and recycling of plant and animal remains; plant nutrition (including food crops); degradation of pollutants, etc.
Fieldwork is based on the collection of four soil cores from each of the Survey’s 629 (1km) squares. Cores are taken from plots adjacent to past sample locations in 1978 and 1998, to ensure compatibility with previous results. Following return to the laboratory, cores are either prepared for immediate analysis or frozen for archiving.
Questions addressed by the 2007 Survey include:
• Is there robust evidence of a decline in soil biodiversity as stated by the European Union? • Has recovery from acidification continued? • Can we confirm loss of soil carbon (as reported by Bellamy et al. 2005)? • Can the trend of increasing phosphorous levels in intensive grasslands be confirmed and is it
matched in other habitats? • Can the trend of eutrophication of the countryside be detected in the soil as well as the
vegetation?

66
Is the decline in atmospheric deposition reported by the Metal Deposition Network reflected in soil metal concentrations? The outputs include:
• Maps and summary statistics of the status of soil properties, identifying where change is occurring.
• Interpretation of trends and changes in relation to a range of different drivers. • Comparison of findings with outputs from other major soil monitoring schemes.
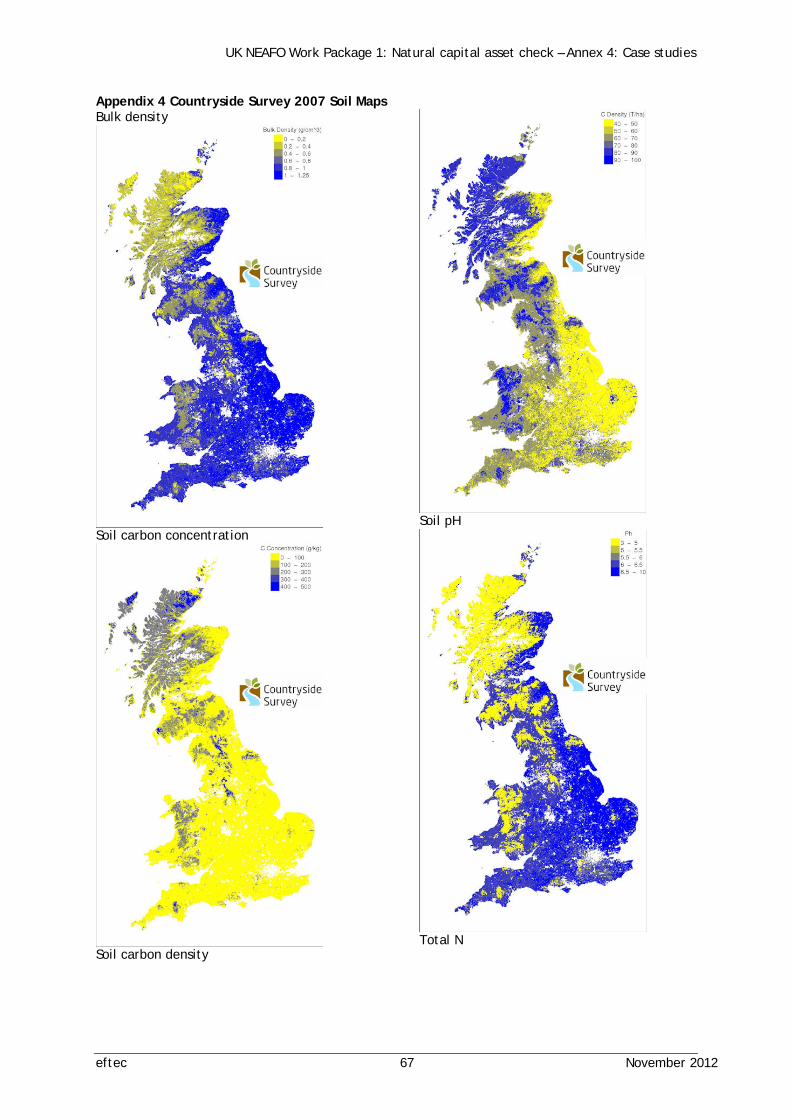
UK NEAFO Work Package 1: Natural capital asset check – Annex 4: Case studies
eftec 67 November 2012
Appendix 4 Countryside Survey 2007 Soil Maps Bulk density
Soil carbon concentration
Soil carbon density
Soil pH
Total N

68
C:N ratio
Mineralisable N
Olsen P
Total invertebrates
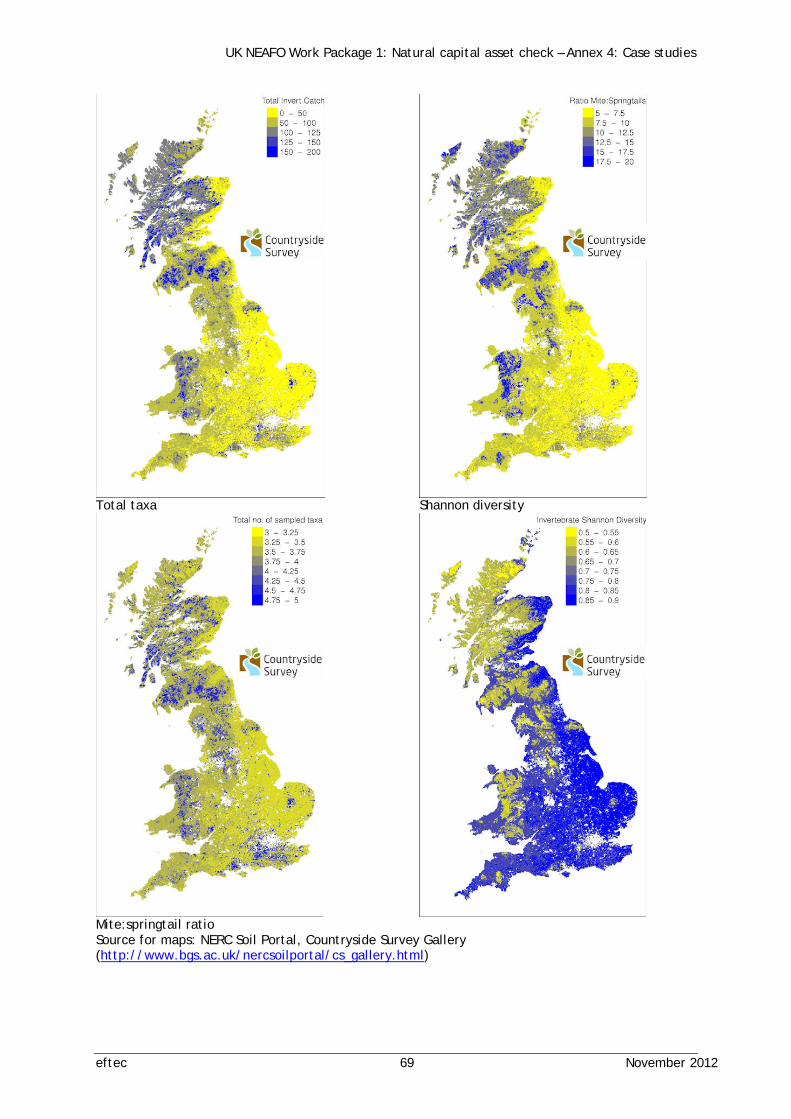
UK NEAFO Work Package 1: Natural capital asset check – Annex 4: Case studies
eftec 69 November 2012
Total taxa
Mite:springtail ratio
Shannon diversity
Source for maps: NERC Soil Portal, Countryside Survey Gallery (http://www.bgs.ac.uk/nercsoilportal/cs_gallery.html)

70
Appendix 5 Charts of Countryside Survey Soil Indicator Measures The following charts illustrate the values and trends for soil indicators reported by Emmett et al (2010) showing values for the ‘Arable and Horticulture’ broad habitat and the ‘Crops and Weeds’ aggregate vegetation class.

UK NEAFO Work Package 1: Natural capital asset check – Annex 4: Case studies
eftec 71 November 2012
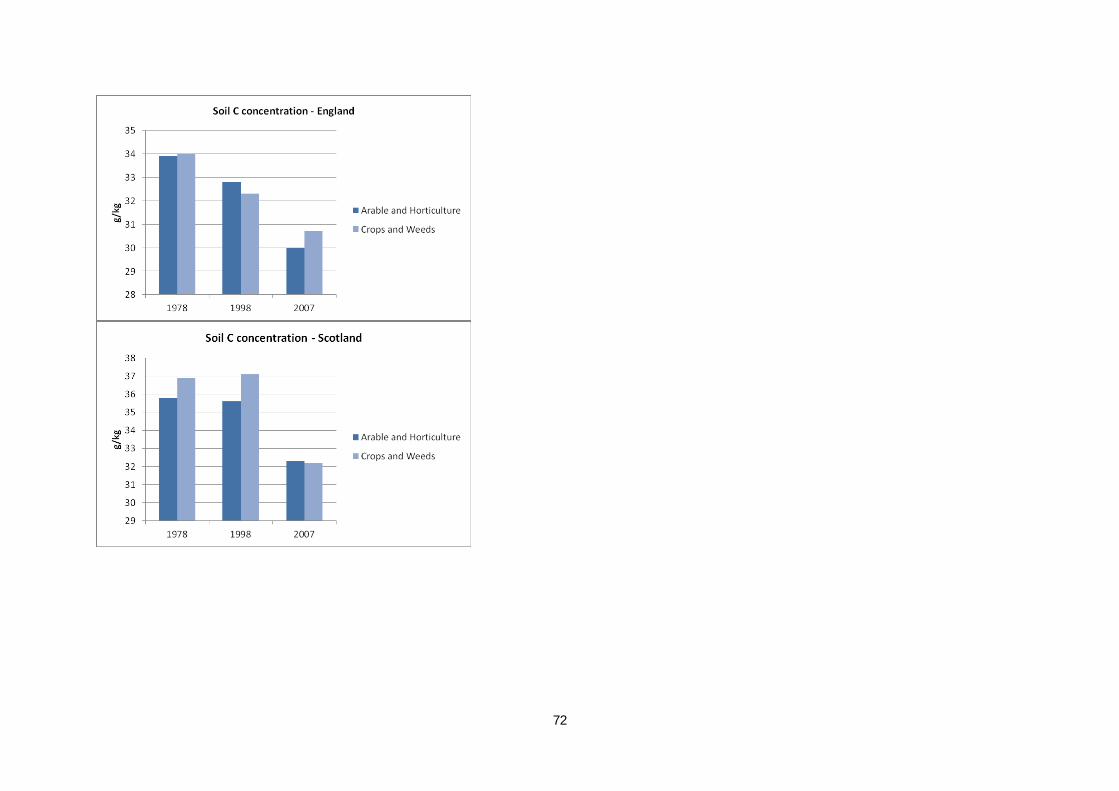
72

UK NEAFO Work Package 1: Natural capital asset check – Annex 4: Case studies
eftec 73 November 2012

74

UK NEAFO Work Package 1: Natural capital asset check – Annex 4: Case studies
eftec 75 November 2012

76
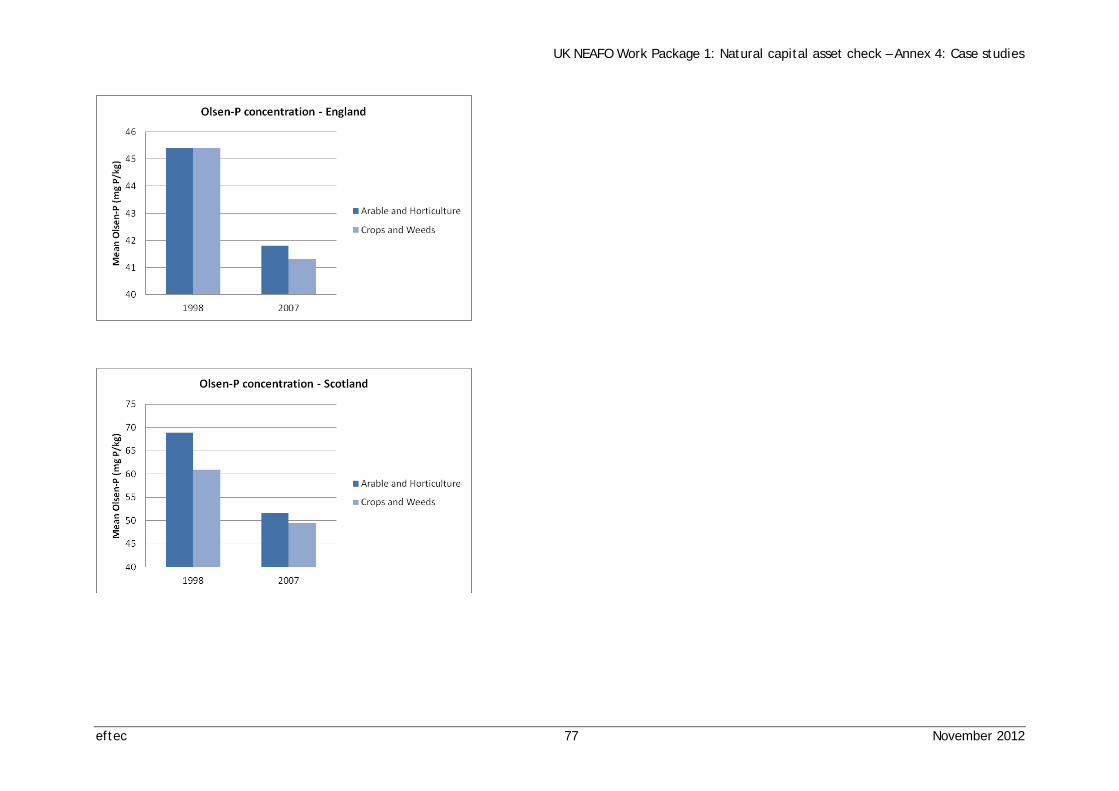
UK NEAFO Work Package 1: Natural capital asset check – Annex 4: Case studies
eftec 77 November 2012

78
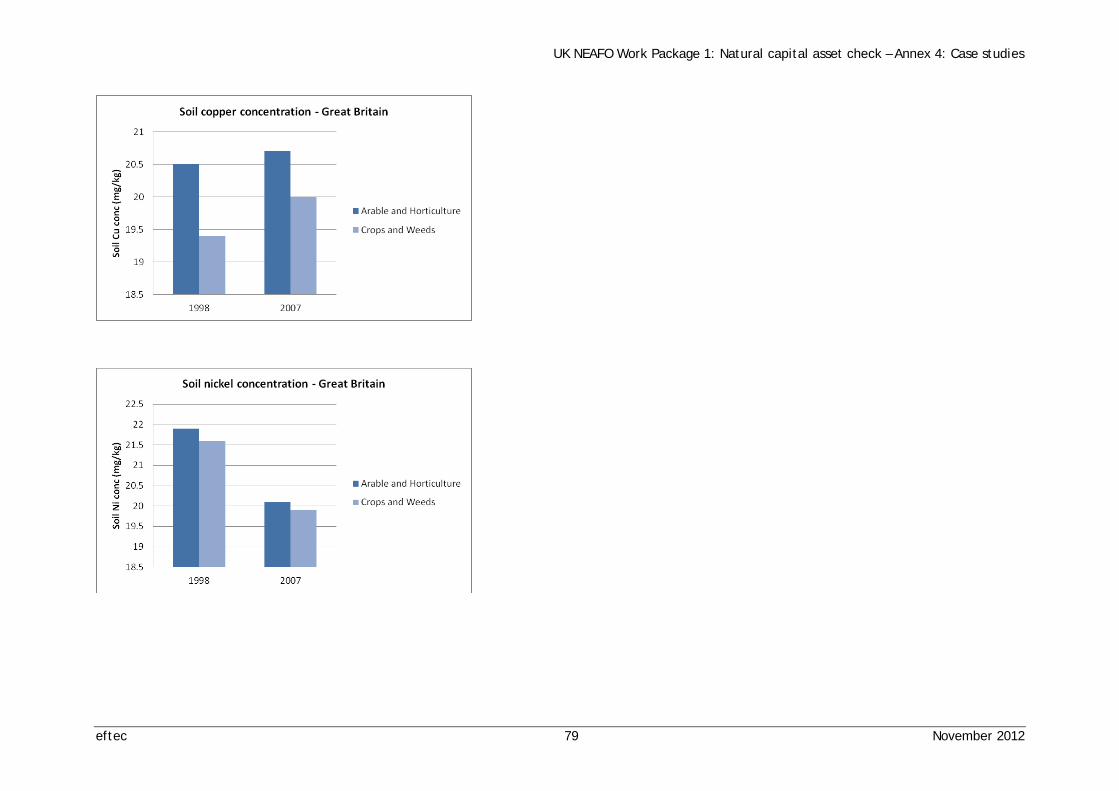
UK NEAFO Work Package 1: Natural capital asset check – Annex 4: Case studies
eftec 79 November 2012

80

UK NEAFO Work Package 1: Natural capital asset check – Annex 4: Case studies
eftec 81 November 2012

82
Chart data from Emmett et al (2010).
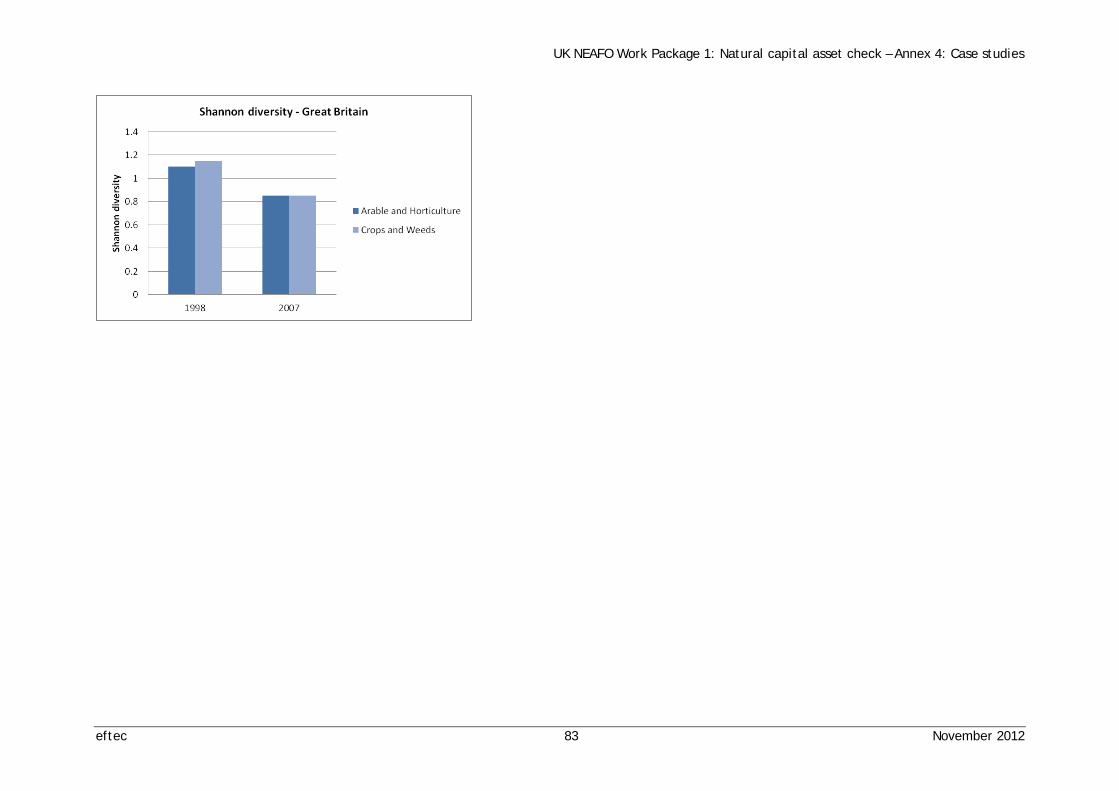
UK NEAFO Work Package 1: Natural capital asset check – Annex 4: Case studies
eftec 83 November 2012

84
1.3. Blue carbon asset check
1.3.1. Natural capital asset
Question Guidance on Answer
A. Define Natural Capital asset being checked
In this case study, we focus on the flow of the regulating ecosystem service (ES) of carbon sequestration and storage supported by functions within seagrass meadows (the natural capital asset). In the UK there are two species of seagrass, intertidal Zostera noltii and the subtidal Zostera marina. Both species can form extensive meadows. Seagrass beds, while occupying less than 1% of the area of the world’s oceans, are hotspots for organic carbon burial in the ocean: an estimated 27.4 TgC y-1 is buried in seagrass beds, which is roughly 10% of the yearly estimated organic C burial in the oceans(Duarte et al., 2005).
UK seagrasses provide also other ES such as, erosion protection, biodiversity, and other benefits such as food (e.g. fish production) and recreation.
Since as stated in section F there is limited data on the condition of seagrass habitats, the definition of ‘natural capital asset’ being checked here (the continued capacity of seagrasses to support the flow of C sequestration) includes all of the ecological components within seagrass that together contribute to the sequestration, burial and storage of carbon. In this respect, the natural capital is related to the total primary production occurring within a meadow, the amount of organic carbon captured by the seagrass from external sources (e.g. plankton or terrestrial), the rate of carbon burial and the potential for long term storage. Spatial and temporal variability in sequestration capacity may be linked to changes in the physical environment and vegetative traits of the seagrass. The mobilization of organic C stored in seagrass beds due to loss of seagrass has the potential to result in CO2 emissions, in much the same way that deforestation and land-use change contribute to anthropogenic greenhouse gas emissions. The focus of this tool is to check the condition of the natural capital asset (i.e. the carbon storage services and other ES provided by the UK seagrasses). The justification for choosing the carbon sequestration service here is that compared to the complexities in delivery of some of the other services, this service was relatively simple to analyse in such a short time available to do a NCAC. There are issues in using just one service to represent the condition of seagrasses and of the other ecosystem services they provide, and their processes and functions. Significant interactions and trade-offs exist between the delivery of different ecosystem services particularly in respect to their role in carbon sequestration and their importance in transferring primary production to consumers, which varies significantly with environmental conditions(Cebrián et al., 1997). However, despite these issues the use of the flow of the service of carbon sequestration for this assessment still helps to provide an indication of the status of the seagrasses and how this may influence ecosystem service delivery, but it should be

UK NEAFO Work Package 1: Natural capital asset check – Annex 4: Case studies
eftec 85 November 2012
noted that any economic valuation would be a significant underestimate of the total economic value of these habitats.
B. What is the spatial scale for which the asset check is being conducted
The extent is the UK; however data on seagrass has patchy coverage both at the national and at the global level.
C. Define the timescale for the asset check.
Historical and current measures of seagrass health and extent, and future projections based on long term trends.
D. What are the main ecosystem services the asset provides?
Seagrass beds are stated as providing flows of a number of ecosystem services from provisioning, regulating and cultural categories(Barbiet et al., 2011). They function as important nursery and foraging habitat for fish, shellfish (Jackson et al. 2001; Warren et al., 2010; de la Torre-Castro et al. 2009) and wildfowl(Ganter, 2000). They are also thought to oxygenate and stabilise sediments, providing shoreline stabilisation and protection from erosion(Koch et al., 2009), and are natural hotspots for carbon sequestration and nutrient cycling(Kennedy et al., 2010). Seagrasses are considered a foundation species, that is a species that provides habitat and enhances ecosystem biodiversity and is home to culturally valuable species such as the seahorse(Garrick-Maidment et al., 2010; Curtis and Vincent, 2005). Ecosystem biodiversity is fundamental in the provision of cultural services. Seagrasses are also an important sentinel of system health, due to their sensitivity to both water quality and physical disturbances, and were developed as an indicator for the Water Framework Directive(Foden and Brazier, 2007; Ward, 1987). Depending on the context, benefits/goods provided by these services can be valued with different methods.
Notes: It is useful to define these parameters for the analysis clearly at the outset. If a subset of a natural asset is being checked (e.g. peat bogs in Scotland are a subset of all peat bogs in the UK), then this can affect availability of data and interpretation of results. Our approach in the scoping study for Defra assumes that an asset needs to have some physical measurement, and defines natural capital assets as:
…stock that can be managed or protected in order to have a positive economic or social value. However, in further work looking at the definition of natural capital we have defined it as:
…the configuration of living and/or non-living processes and functions over time and space, that produce through their existence and/or some combination of their functions, a positive economic or social value.

86
1.3.2. Integrity of natural capital asset
Question Guidance on Answer Trends
Past trend Current trend Future Trend Summary of Trends (see key*)
E. What is the extent of the natural capital asset?
In a review of seagrass global state change Waycott et al. (2009) found that seagrasses have been disappearing worldwide at a rate of 110 km2 yr-1 since 1980 and the rate of loss is increasing(Waycott et al., 2009). Seagrass beds are in decline in OSPAR Region II (Greater North Sea - The North-East Atlantic) and are under threat in all areas where they occur(Tullrot, 2009). In the UK, Zostera is considered nationally scarce (JNCC, 1998). Mapped Z. marina beds total 4,887 ha (Rhodes et al., 2006; Jackson, 2003; Jackson et al. 2011; Jackson et al. 2012; Chesworth et al., 2008; Black and Kochanowska, 2004; Burton et al., 2010; Egerton, 2011; Irving et al., 2007). There are 1804 records of Z. noltii across the UK and 3699 records of Z. marina (NBN Gateway), but not all these records represent a meadow. See Annex 2 for a map of Z. marina and Z. noltii points. It is worth nothing that at present an official source of mapped seagrasses for the UK is missing. Given the limited time available for the NCAC, this map results incomplete, especially for the Z. noltii.
The size of the stock impacts its ability to sequester carbon and therefore is
According to historical reports seagrass beds were once very common along Europe’s shorelines, but have since declined due to the impact of a wasting disease (Labyrinthula spp.) which resulted in black lesions on the leaf blades which potentially lead to loss of productivity, degradation of shoots and roots, and in extreme cases loss of large areas of seagrass(Den Hartog, 1987). Two distinct periods of the disease in Europe have been identified, the first immediately after World War 1, and the second between 1931 and 1932. By 1933 the beds had
Although turbidity and nutrient loading have been the primary cause of seagrass decline globally (Waycott et al., 2009), improvements in water quality through better sewerage treatment and national regulations resulting from the Urban Waste Water Treatment Directive and Water Framework Directive are starting to negate these pressures. Even so continued direct physical pressures on seagrass beds are increasingly resulting in fragmentation and even losses of many beds (Rhodes et al., 2006; Goumenaki,
There is likely to be a decrease in the direct physical removal of seagrasses located within a marine protected area (MPA) such as a European Marine Site or, in future, a Marine Conservation Zone (MCZ) in England, or equivalent national marine protected area (Scotland, Wales) or areas protected under local byelaws (e.g. fisheries bylaws which prevent the use of mobile gears). However those beds outside such protection will likely continue to fragment. Also, water quality may continue to cause losses in areas beyond WFD
↑↓
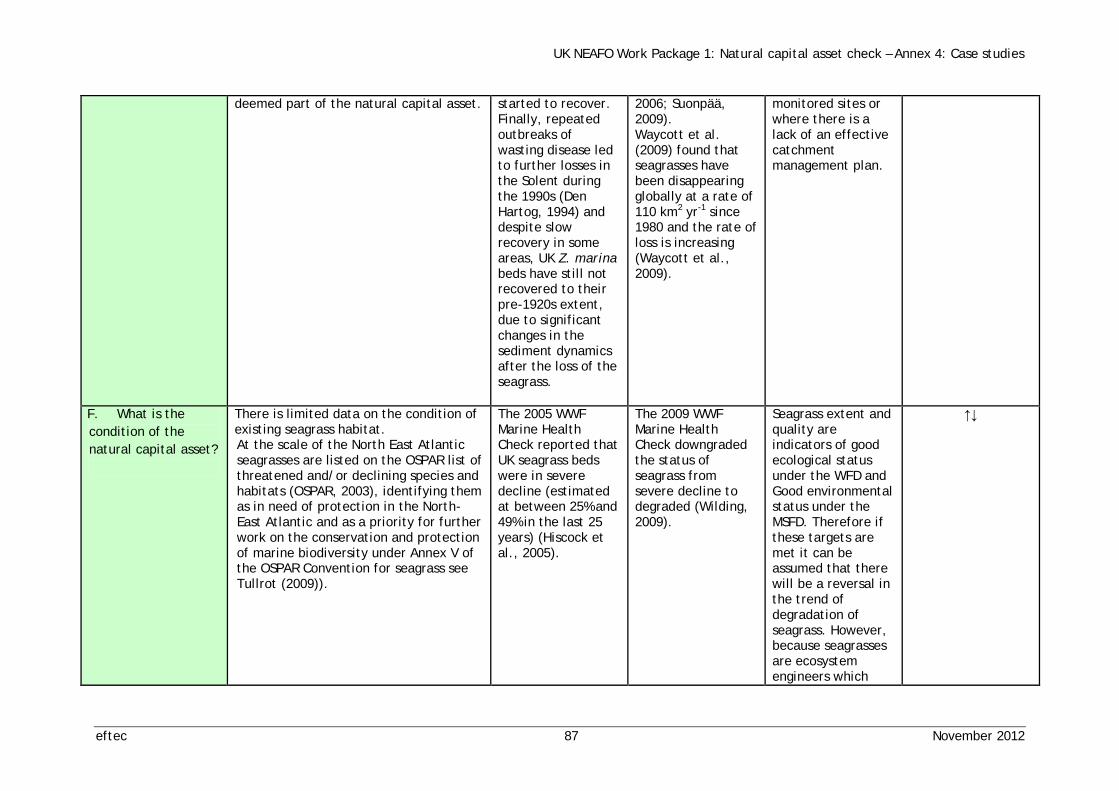
UK NEAFO Work Package 1: Natural capital asset check – Annex 4: Case studies
eftec 87 November 2012
deemed part of the natural capital asset. started to recover. Finally, repeated outbreaks of wasting disease led to further losses in the Solent during the 1990s (Den Hartog, 1994) and despite slow recovery in some areas, UK Z. marina beds have still not recovered to their pre-1920s extent, due to significant changes in the sediment dynamics after the loss of the seagrass.
2006; Suonpää, 2009). Waycott et al. (2009) found that seagrasses have been disappearing globally at a rate of 110 km2 yr-1 since 1980 and the rate of loss is increasing (Waycott et al., 2009).
monitored sites or where there is a lack of an effective catchment management plan.
F. What is the condition of the natural capital asset?
There is limited data on the condition of existing seagrass habitat. At the scale of the North East Atlantic seagrasses are listed on the OSPAR list of threatened and/or declining species and habitats (OSPAR, 2003), identifying them as in need of protection in the North-East Atlantic and as a priority for further work on the conservation and protection of marine biodiversity under Annex V of the OSPAR Convention for seagrass see Tullrot (2009)).
The 2005 WWF Marine Health Check reported that UK seagrass beds were in severe decline (estimated at between 25% and 49% in the last 25 years) (Hiscock et al., 2005).
The 2009 WWF Marine Health Check downgraded the status of seagrass from severe decline to degraded (Wilding, 2009).
Seagrass extent and quality are indicators of good ecological status under the WFD and Good environmental status under the MSFD. Therefore if these targets are met it can be assumed that there will be a reversal in the trend of degradation of seagrass. However, because seagrasses are ecosystem engineers which
↑↓
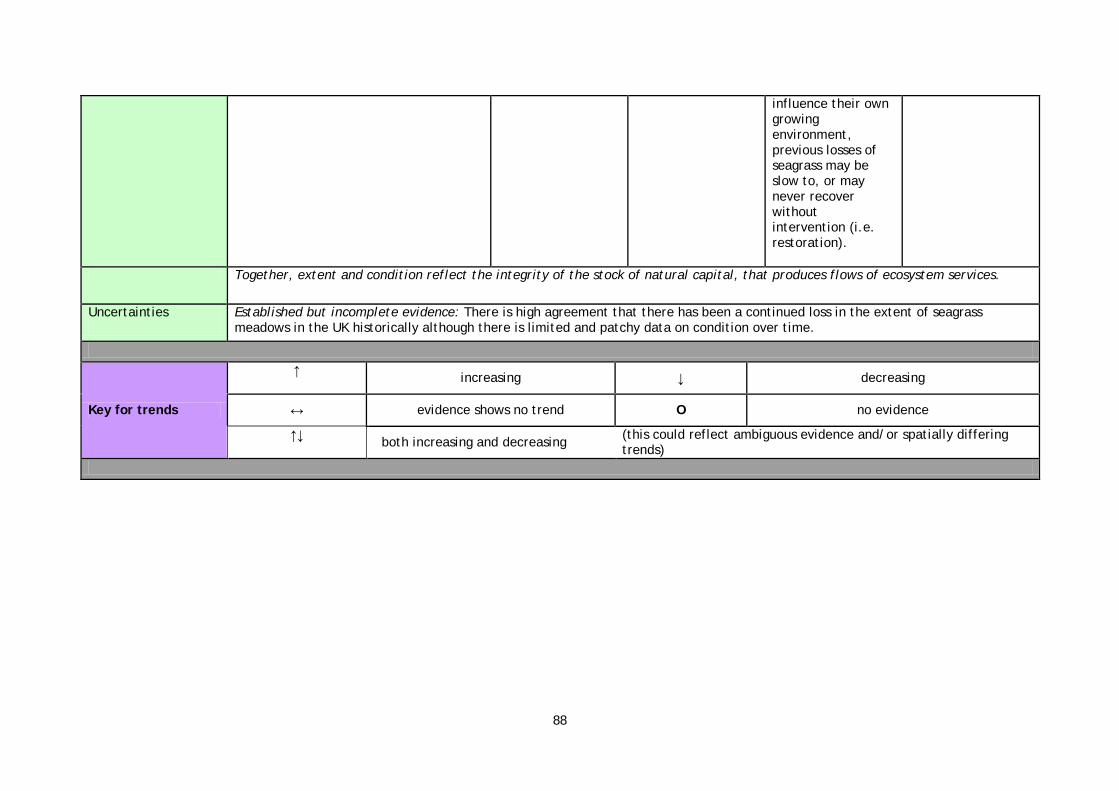
88
influence their own growing environment, previous losses of seagrass may be slow to, or may never recover without intervention (i.e. restoration).
Together, extent and condition reflect the integrity of the stock of natural capital, that produces flows of ecosystem services.
Uncertainties
Established but incomplete evidence: There is high agreement that there has been a continued loss in the extent of seagrass meadows in the UK historically although there is limited and patchy data on condition over time.
Key for trends
↑ increasing ↓ decreasing
↔ evidence shows no trend O no evidence
↑↓ both increasing and decreasing (this could reflect ambiguous evidence and/or spatially differing trends)
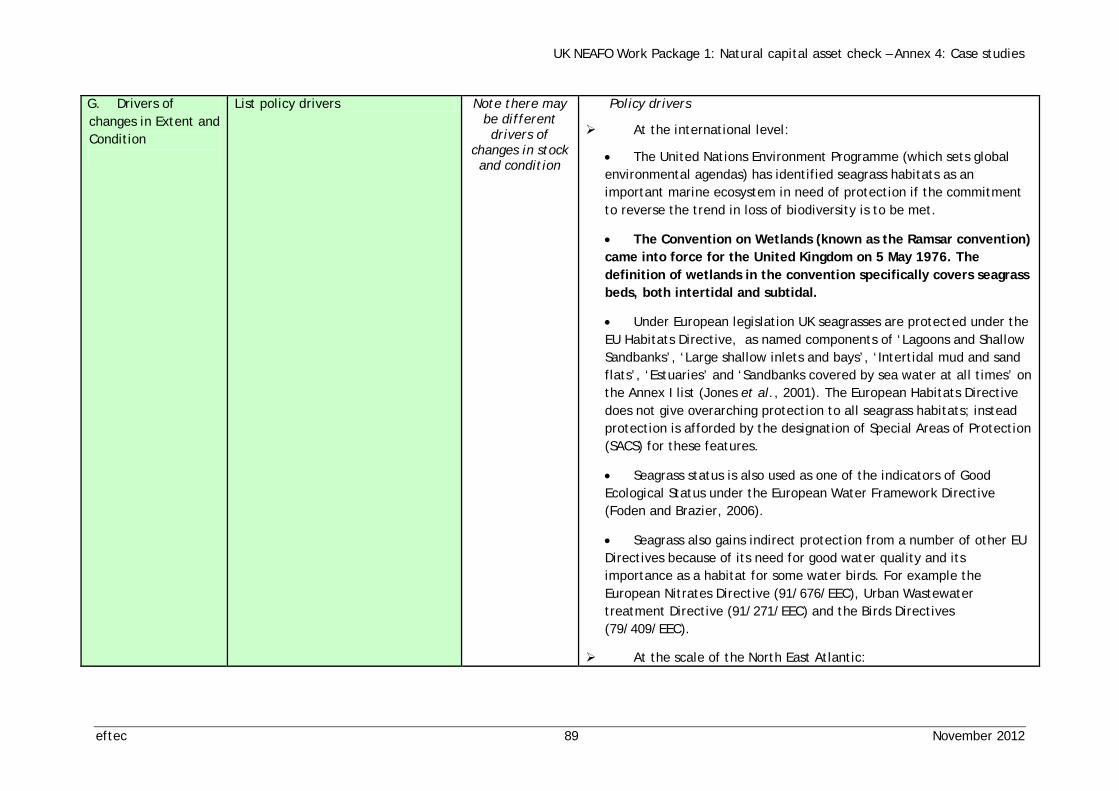
UK NEAFO Work Package 1: Natural capital asset check – Annex 4: Case studies
eftec 89 November 2012
G. Drivers of changes in Extent and Condition
List policy drivers Note there may be different drivers of
changes in stock and condition
Policy drivers
At the international level:
• The United Nations Environment Programme (which sets global environmental agendas) has identified seagrass habitats as an important marine ecosystem in need of protection if the commitment to reverse the trend in loss of biodiversity is to be met.
• The Convention on Wetlands (known as the Ramsar convention) came into force for the United Kingdom on 5 May 1976. The definition of wetlands in the convention specifically covers seagrass beds, both intertidal and subtidal.
• Under European legislation UK seagrasses are protected under the EU Habitats Directive, as named components of ‘Lagoons and Shallow Sandbanks’, ‘Large shallow inlets and bays’, ‘Intertidal mud and sand flats’, ‘Estuaries’ and ‘Sandbanks covered by sea water at all times’ on the Annex I list (Jones et al., 2001). The European Habitats Directive does not give overarching protection to all seagrass habitats; instead protection is afforded by the designation of Special Areas of Protection (SACS) for these features.
• Seagrass status is also used as one of the indicators of Good Ecological Status under the European Water Framework Directive (Foden and Brazier, 2006).
• Seagrass also gains indirect protection from a number of other EU Directives because of its need for good water quality and its importance as a habitat for some water birds. For example the European Nitrates Directive (91/676/EEC), Urban Wastewater treatment Directive (91/271/EEC) and the Birds Directives (79/409/EEC).
At the scale of the North East Atlantic:
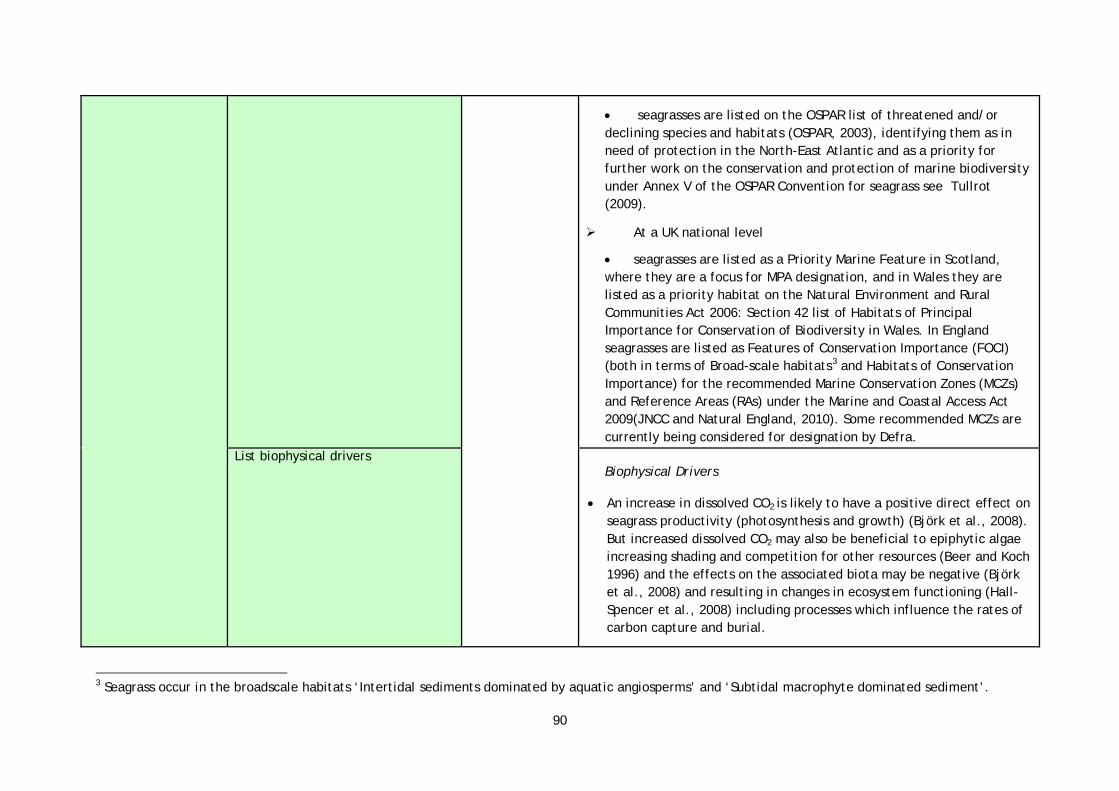
90
• seagrasses are listed on the OSPAR list of threatened and/or declining species and habitats (OSPAR, 2003), identifying them as in need of protection in the North-East Atlantic and as a priority for further work on the conservation and protection of marine biodiversity under Annex V of the OSPAR Convention for seagrass see Tullrot (2009).
At a UK national level
• seagrasses are listed as a Priority Marine Feature in Scotland, where they are a focus for MPA designation, and in Wales they are listed as a priority habitat on the Natural Environment and Rural Communities Act 2006: Section 42 list of Habitats of Principal Importance for Conservation of Biodiversity in Wales. In England seagrasses are listed as Features of Conservation Importance (FOCI) (both in terms of Broad-scale habitats3 and Habitats of Conservation Importance) for the recommended Marine Conservation Zones (MCZs) and Reference Areas (RAs) under the Marine and Coastal Access Act 2009(JNCC and Natural England, 2010). Some recommended MCZs are currently being considered for designation by Defra.
List biophysical drivers Biophysical Drivers
• An increase in dissolved CO2 is likely to have a positive direct effect on seagrass productivity (photosynthesis and growth) (Björk et al., 2008). But increased dissolved CO2 may also be beneficial to epiphytic algae increasing shading and competition for other resources (Beer and Koch 1996) and the effects on the associated biota may be negative (Björk et al., 2008) and resulting in changes in ecosystem functioning (Hall-Spencer et al., 2008) including processes which influence the rates of carbon capture and burial.
3 Seagrass occur in the broadscale habitats ‘Intertidal sediments dominated by aquatic angiosperms’ and ‘Subtidal macrophyte dominated sediment’.

UK NEAFO Work Package 1: Natural capital asset check – Annex 4: Case studies
eftec 91 November 2012
• A rise in sea level (when the landward extension of the seabed is limited by human constructions such as seawalls), changing tidal regimes, damage from UV radiation, sediment hypoxia and anoxia, increases in sea temperatures and increased storm and flooding events. All of these may influence primary productivity and therefore carbon burial.
• Temperature stress on seagrasses will result in distribution shifts, changes in patterns of sexual reproduction, altered seagrass growth rates, metabolism, and changes in their carbon balance (Short et al. 2001, Short and Neckles 1999). Z. marina has an upper temperature tolerance of 38ºC, and Zostera noltii has a tolerance of up to 25ºC. Zostera noltii is at the limit of its distribution in the UK.
• For subtidal Z. marina, experiments showed that a 5°C increase in the normal seawater temperature caused a significant loss in shoot density; however, it seemed that the genetic diversity of this species provides it with the possibility to recover from such extreme temperatures (Reusch et al. 2005, Ehlers et al. 2008). Elevated temperatures may also increase the growth of competitive algae and epiphytes, which can overgrow seagrasses and reduce the available sunlight they need to survive (Peirano et al. 2005). Similarly temperature increases will increase metabolism of microbes including the slime mold protist Labyrinthula spp. which causes the wasting disease in Zostera.
• The slime mold protist Labyrinthula which causes the wasting disease is often present on the leaves of Zostera however under certain climatic conditions the disease can, and has, caused large scale destruction of seagrass meadows in the North Atlantic (Bull et al., 2011; Nienhuis, 1994).
• An increase in storm activity (Trenberth 2005) may affect seagrass by reducing the available light to the seagrass causing a depth squeeze and therefore a loss of area (Bourcier 1989) and more turbulent

92
conditions may destabilise sediments and uproot the plants (Short et al. 2006). Whilst seasonal senescence and winter storms often result in large amounts of seagrass foliage being removed, some leaves and most of the root rhizome mats (in the case of Z. marina) usually remain intact and promote recovery. However increased frequency of storms may reduce the potential of seagrasses to recover.
• Changes in prevailing wind direction would drive major shifts in the distribution of seagrasses.
List socio-economic & other drivers Socio-economic & other drivers
• Coastal development including the development of built capital, for example demand for new ports driven by increased levels of international trade and tourism.
• Dredging to support increased shipping causes direct physical removal and increased turbidity.
• Nutrient enrichment due to sewage, agricultural runoff and more localised inputs (for example from boating and aquaculture) have all been correlated with increased growth of epiphytic algae (in particular filamentous), drift algae and phytoplankton.
• Fishing intensity increasing: more inshore trawling and dredging in areas of seagrass due to escalating fuel costs and displacement from closed fishing areas. Mobile benthic fishing gears causes direct physical damage to seagrasses.
• Anchor and mooring damage from recreational boating causing localised damage and fragmentation.
H. What are the asset’s main ecosystem functions?
The following ecosystem functions of seagrasses support the ecosystem service of carbon sequestration:
• Primary Production: The ecology of primary production in a seagrass meadow is complex, involving six different plant groups, the seagrass itself, microepiphytic algae, macroepiphytic algae, benthic microalgae, benthic macroalgae and phytoplankton (Moncreiff et al., 1992).

UK NEAFO Work Package 1: Natural capital asset check – Annex 4: Case studies
eftec 93 November 2012
• Bioaccumulation: Seagrass sediments are largely anaerobic, consequently seagrass-derived organic matter can be preserved for long-time periods (Mateo et al., 1997; Orem et al., 1999), but this storage can be difficult to quantify, especially where bioturbating benthic infauna may transport oxygen into the sediments and redistribute nutrients, or where erosion events remove the seagrass and sediments.
• Niche/habitat construction: the complex structure and numerous microhabitats created by seagrass meadows support species which facilitate carbon sequestration and burial, for example leaves provide substrate for epiphytic flora which contribute to primary production.
• Sediment depositions: Seagrasses ability to attenuate water currents and stabilise sediments results in organic matter and nutrients become stored within the accreting sediments, sequestering C, N and P, while the remaining organic material is recycled or exported (Kennedy and Björk, 2009; Nellemann et al., 2009). Although not highlighted in the literature, due to a lack of seagrass C sequestration studies which are carried out over long time scales, some may argue that sediment trapping and C sequestration can only occur to a limited state and that will reach equilibrium at some point in time. However, most of the studies published in the literature identify that unlike terrestrial soils the sediments of healthy seagrass meadows do not become saturated with C because the sediments accrete vertically, but evidence for this is limited in the UK (Mcleod et al., 2011). As pointed out elsewhere in this NCAC, this accretion may be temporarily reversed due to erosion rates, but usually only temporarily.
See also section D for other ecosystem functions and services provided by seagrasses.
I. Integrity Test: Is the ability of the asset to support ecosystem services being maintained?
Continued loss of seagrass removes its ability to sequester carbon and the long term storage of carbon is compromised. Removal of seagrass can result in the release of previously stored carbon into the water column. Drivers of seagrass degradation which either reduce productivity (e.g. those affecting water quality and clarity) or increase erosion and sediment mobility within the seagrass will negatively influence the maintenance of carbon sequestration. Currently the ability of the asset to support this ecosystem service is being compromised by direct physical disturbance and decreases in water clarity and quality.
Notes: Non-essential supporting information that can be useful for decision-makers includes:
- are the ecosystem services provided by the asset rival or non-rival goods?
- are the ecosystem services provided by the asset market or non-market goods?

94
- Some main final services may rely on supporting and intermediate services from natural capital assets not considered in the asset check. Links to the status of these other assets may be an important factor for the asset check. It may be possible to consider their status/trend/management within the asset check, but where the links become complex, such analysis may not be feasible. However, these interdependencies should be noted; furthermore the natural capital underpinning the final services in question may justify a separate asset check.

UK NEAFO Work Package 1: Natural capital asset check – Annex 4: Case studies
eftec 95 November 2012
1.3.3. Performance of natural capital asset In this context ‘performance’ is fitness to carry out the role which is required of a capital asset. This is regarded as useful because defining the target performance of natural capital assets captures both the current and future quantity and quality of an asset. Human ‘requirements’ include basic human needs, but also reflect infinite wants, so the definition of performance is usually subjective.
Question Guidance on Answer
J. Is there a measure of the current output of services from the asset?
There are current estimates of carbon burial: Z. marina 0.52 tC ha-1 yr-1 and Z. noltii 0.029 tC ha-1 y-1( Cebrián et al., 1997) . These are averages from a fairly dynamic landscape and for that reason they may be an underestimate for those meadows found in sheltered regions. Changes in C sequestration flow provision can be valued using the damage cost avoided method, or the marginal abatement cost (clean-up cost) method. The former is also known as the social cost of carbon (SCC) and has been adopted in several economic studies (Pearce, 2003; Tol, 2005; Stern, 2007). An example of the second method are the prices for non-traded carbon dioxide elaborated by the British Department of Energy and Climate Change (DECC)(DECC, 2009). Market prices may be used to assess the value of commercial fish species, and willingness to pay values for recreation in UK diving areas.
K. What goods and benefits do these services support?
Healthy climate (carbon sequestration and storage); food (fisheries production); recreation (e.g. diving)
L. What is the target performance from the asset?
Seagrass is a priority habitat under UK and EU conservation objectives. In European Marine Sites (EU Habitats and Birds Directives) where seagrass is listed in the conservation objectives the aim is to maintain or restore the seagrass. Seagrass status is also used as one of the indicators of Good Ecological Status under the European Water Framework Directive (Foden and Brazier, 2006), where GES is measured against the species richness and extent. However, these targets are in regard to area extent and quality objectives which do not directly relate to prioritising seagrass protection in terms of carbon sequestration. The UK BAP lists seagrass as a priority habitat occurring in two broad habitat types depending upon the species present. These are littoral sediment, for seagrass beds of Z. noltii, and inshore subtidal sediment, for seagrass beds of Z. marina. Under the UK HAP for seagrass there are aims to assess the feasibility of restoration of damaged or degraded seagrass beds, however plans have been slow to be implemented due to limited information on baselines for identifying targets of areas to be restored Anon (1995).
Uncertainties
Well established: The link between seagrass habitat and carbon sequestration is well established globally. However, spatial and temporal variability in sequestration capacity (linked to changes in the physical environment and vegetative traits of the seagrass) are somewhat established but incomplete. Also, the possibility exists, as with any biological habitat which sequesters carbon, that seagrasses may act as carbon sources following loss and degradation.
Defining performance: What policy targets are there for See section L

96
Answering these questions can help define performance, but not all questions can be answered for all assets
the asset?
What is the trend in the main services the asset provides?
The data does not exist to be able to assess the trend in relation to the provision of carbon sequestration by seagrasses. In these cases scenario analysis could be a very helpful tool to explore possible trends.
What types of goods are supported by the asset?
Use values: Healthy Climate (non-rival); Food (e.g. Fish and Shellfish - rival); Recreation tourism (non-rival); Aesthetic/inspiration (non-rival). Clean, clear water (non-rival); Non-use values: Coastal erosion prevention (non-rival); Wild species diversity (non-rival).
Who benefits from the goods?
Consumers benefit from increased standard of living through greater supply of a variety of goods (fish). Economic benefits are secured throughout the commercial fishing supply chain and may include fishers, ports, local restaurants etc. Society benefits more widely through a healthier population (water quality, healthy climate) thereby reducing healthcare spending and from use and non-use values associated with cultural services (non-use value in terms of supporting culturally valued species such as seahorses, diving, bird watching – important in the diet of some wading birds, e.g. the Brent goose(Ganter, 2000)).
What wellbeing results from the goods?
See above
M. Are any future changes in target performance expected?
In 2012 the new UK post-2012 Biodiversity Framework was published4 which replaces the previous UK level Biodiversity Action Plans. This framework is the UK’s response to the 2010 Convention on Biological Diversity (Nagoya, Japan), when contracting parties renewed their commitment to take action to halt global declines of biodiversity. Increasing interest in the potential for blue carbon farming/management may result in increased economic incentives for seagrass restoration. More recently projects have started to investigate the possibilities of setting up carbon off-setting schemes using seagrass beds, although currently the variability in carbon fluxes of many seagrass beds is limiting progress (Blue Ventures, 2012; Fourqueen et al. 2012)
N. Can future target performance be defined?
The ‘performance’ of the natural capital asset can be defined by its production of the ‘flow’ of ES which in this case is the ability of a seagrass meadow to sequester, bury and store carbon. It is also intended to maintain and restore the extent and condition of seagrass for other ES such as fisheries production, erosion control as well as cultural services (habitat for seahorses). Since the condition and extent of seagrass are not the only factors impacting sequestration of carbon, therefore measures of ocean acidification or percentage of carbon dioxide in the atmosphere are not a good proxy for seagrass condition. However, burial rates of carbon in seagrasses under different conditions (environmental and seagrass structure) and monitoring of the temporal stability of carbon storage, could be used in conjunction with extent of seagrass to assess the natural capital asset. Given that protection for seagrasses and targets in terms of WFD etc. have focused on extent of
4 JNCC and Defra (on behalf of the Four Countries’ Biodiversity Group). 2012. UK Post-2010 Biodiversity Framework. July 2012. Available from: http://jncc.defra.gov.uk/page-6189.

UK NEAFO Work Package 1: Natural capital asset check – Annex 4: Case studies
eftec 97 November 2012
seagrass rather than condition, there is no target for the ‘performance’ of seagrass in the UK in terms of the extent or quality of the habitat that is required to maintain current/or recover to former ability to sequester carbon. However, the national BAP targets specify target performance as being no further net loss and restoration to former extent. Conservation objectives within European Marine Sites (SAC and SPAs) and MCZs are to restore/recover seagrass to its former extent. A challenging control is the one of the wasting disease. Resilience to disease requires removal of manageable pressures on the seagrass and the preservation of phenotypic / genetic diversity; conservation management measures currently in place do not adequately address the latter yet.
Notes:
Non-essential supporting information that can be useful for decision-makers includes:
- Has target performance changed over time? If so how?
- Distributional issues: what is the distribution of the beneficiaries of the goods supported by the ecosystem services from the asset?
- Do the goods provided by the ecosystem services from the asset have use and/or non-use values?
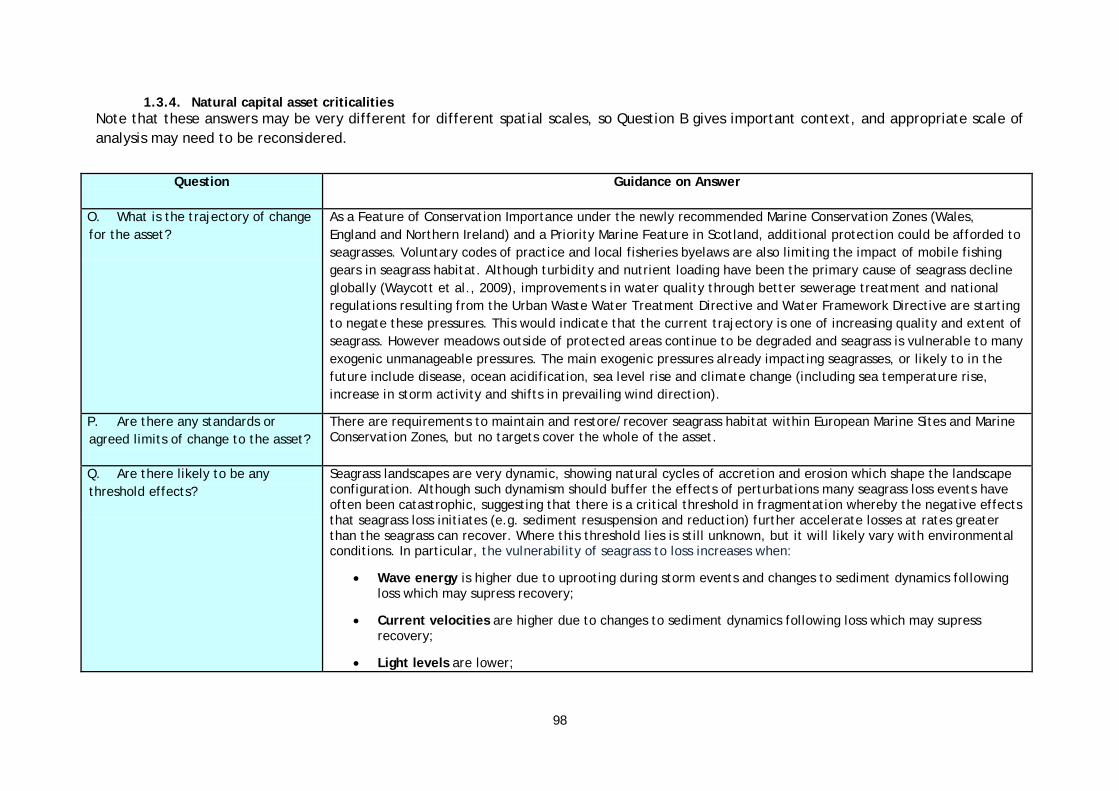
98
1.3.4. Natural capital asset criticalities Note that these answers may be very different for different spatial scales, so Question B gives important context, and appropriate scale of analysis may need to be reconsidered.
Question Guidance on Answer
O. What is the trajectory of change for the asset?
As a Feature of Conservation Importance under the newly recommended Marine Conservation Zones (Wales, England and Northern Ireland) and a Priority Marine Feature in Scotland, additional protection could be afforded to seagrasses. Voluntary codes of practice and local fisheries byelaws are also limiting the impact of mobile fishing gears in seagrass habitat. Although turbidity and nutrient loading have been the primary cause of seagrass decline globally (Waycott et al., 2009), improvements in water quality through better sewerage treatment and national regulations resulting from the Urban Waste Water Treatment Directive and Water Framework Directive are starting to negate these pressures. This would indicate that the current trajectory is one of increasing quality and extent of seagrass. However meadows outside of protected areas continue to be degraded and seagrass is vulnerable to many exogenic unmanageable pressures. The main exogenic pressures already impacting seagrasses, or likely to in the future include disease, ocean acidification, sea level rise and climate change (including sea temperature rise, increase in storm activity and shifts in prevailing wind direction).
P. Are there any standards or agreed limits of change to the asset?
There are requirements to maintain and restore/recover seagrass habitat within European Marine Sites and Marine Conservation Zones, but no targets cover the whole of the asset.
Q. Are there likely to be any threshold effects?
Seagrass landscapes are very dynamic, showing natural cycles of accretion and erosion which shape the landscape configuration. Although such dynamism should buffer the effects of perturbations many seagrass loss events have often been catastrophic, suggesting that there is a critical threshold in fragmentation whereby the negative effects that seagrass loss initiates (e.g. sediment resuspension and reduction) further accelerate losses at rates greater than the seagrass can recover. Where this threshold lies is still unknown, but it will likely vary with environmental conditions. In particular, the vulnerability of seagrass to loss increases when:
• Wave energy is higher due to uprooting during storm events and changes to sediment dynamics following loss which may supress recovery;
• Current velocities are higher due to changes to sediment dynamics following loss which may supress recovery;
• Light levels are lower;

UK NEAFO Work Package 1: Natural capital asset check – Annex 4: Case studies
eftec 99 November 2012
• Seagrass density is lower as sparse seagrass is more sensitive to disturbance than dense seagrass, because the root rhizome mat is less developed in the former and the potential for re-colonisation lower due less plants;
• Patch size is smaller because of more edge effects (i.e. erosion), and
• Age is younger (due to improved anchoring capability and physical integration between shoots as the seagrasses age)
Overall, deep and shallow edges of a larger seagrass are more vulnerable than mid-range at an individual site. And, patchy seagrass and new seagrass beds are more vulnerable to loss.
R. What is the reversibility of changes to the asset?
Depending on the environmental conditions, even when a disturbance is removed from a seagrass bed, natural recovery may not occur, and restoration is becoming an increasingly popular management option. Various methods for restoring seagrass exist from transplanting plugs and turf to seeding areassee (Calumpong and Fonseca, 2001). In October 2010 the first European Seagrass Restoration Workshop was held. Outputs of the workshop included decision trees, guidelines, and restoration models to aid seagrass restoration management, but the results of the workshop also identified a shift in priority to promoting natural restoration over using restoration as compensation for natural habitat loss during economic development (Cunha et al., 2012). If the appropriate methodologies are used for the specific site, recovery of seagrass extent could be at similar rates to the actual growth rates(Fonseca et al., 2000), however recovery of biological function is likely to be considerably slower(Smith et al., 1989).
S. What is the cumulative effect of impacts on the asset?
The repercussions of the various pressures discussed above and combinations thereof are very much dependent on the vulnerability and resilience of the seagrass to the various perturbations, and their recovery potential. Therefore many pressures have cumulative effects, specifically where one or more impact component results in a reduction in density or increased fragmentation. Seagrass patch edgewhere the seagrass is patchy within a matrix of sand are more vulnerable to further disturbance and natural erosion than seagrass edges along patches of sand which may form in a matrix of seagrass (due to channeling of currents and greater perimeter to area ratios in the former less connected configuration). In terms of density, sparse seagrass is more sensitive to disturbance than dense seagrass, since the root rhizome mat will be less developed in sparse seagrass and the potential for re-colonisation is lower due to the lower numbers of plants. The age of the meadow (directly related to past disturbance and recovery events) has also been shown to be inversely related to mortality(Olesen and Sand-Jensen, 1989).
T. What risks are associated with current trends in the asset integrity?
A focus on protecting only seagrass beds in marine protected areas will reduce the overall asset in terms of carbon sequestration. Also losses of seagrass meadows outside of marine protected areas, may dilute its distribution (reducing connectivity and phenotypic diversity) and undermine resilience in the entire system, in particular reducing the ability of the species to adapt to unmanageable pressures such as those related to climate change.
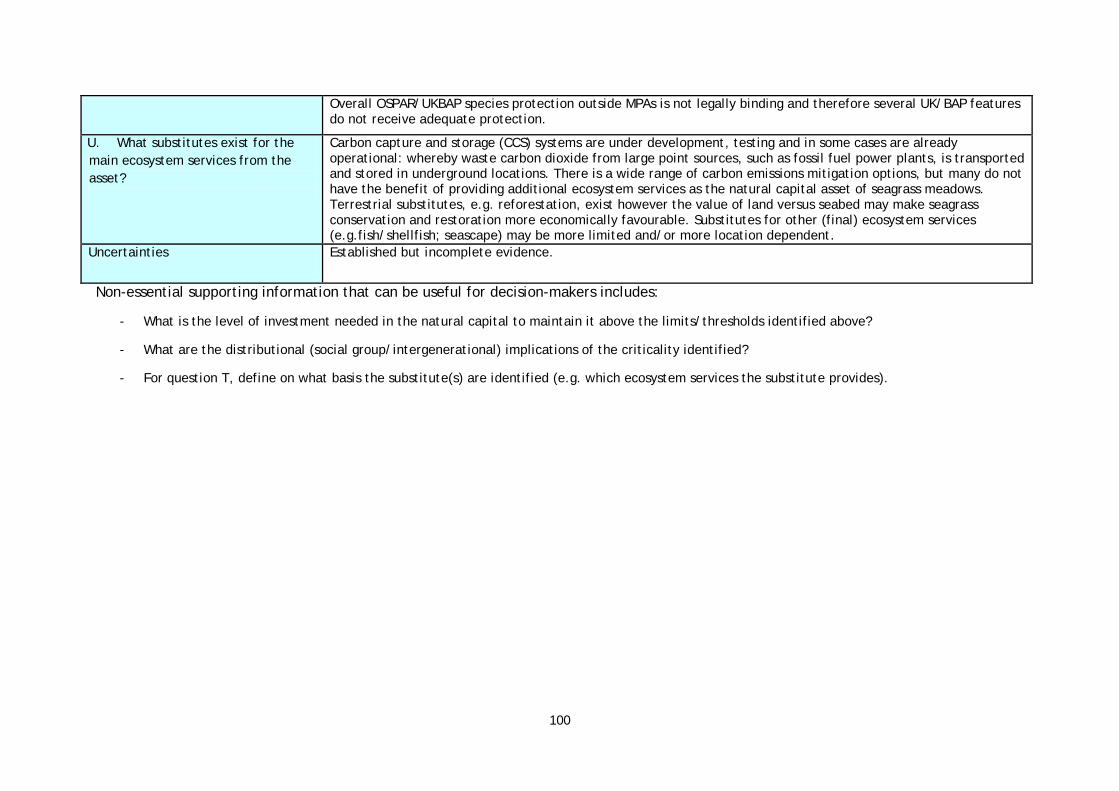
100
Overall OSPAR/UKBAP species protection outside MPAs is not legally binding and therefore several UK/BAP features do not receive adequate protection.
U. What substitutes exist for the main ecosystem services from the asset?
Carbon capture and storage (CCS) systems are under development, testing and in some cases are already operational: whereby waste carbon dioxide from large point sources, such as fossil fuel power plants, is transported and stored in underground locations. There is a wide range of carbon emissions mitigation options, but many do not have the benefit of providing additional ecosystem services as the natural capital asset of seagrass meadows. Terrestrial substitutes, e.g. reforestation, exist however the value of land versus seabed may make seagrass conservation and restoration more economically favourable. Substitutes for other (final) ecosystem services (e.g.fish/shellfish; seascape) may be more limited and/or more location dependent.
Uncertainties
Established but incomplete evidence.
Non-essential supporting information that can be useful for decision-makers includes:
- What is the level of investment needed in the natural capital to maintain it above the limits/thresholds identified above?
- What are the distributional (social group/intergenerational) implications of the criticality identified?
- For question T, define on what basis the substitute(s) are identified (e.g. which ecosystem services the substitute provides).

UK NEAFO Work Package 1: Natural capital asset check – Annex 4: Case studies
eftec 101 November 2012
1.3.5. Natural capital asset check
Question Guidance on Answer
V. Tradeoffs?
In most cases managing seagrasses to increase carbon sequestration potential would enhance the delivery of other services (see section W.). The main tradeoff is that Carbon sequestration would likely be less where export of organic material was high (for example in high current environments where seagrasses may play an important role in sediment stabilisation and coastal protection) and where secondary production was high (related to fisheries production). Protection of seagrass from physical disturbance could result in the loss of access to an area for recreational boat owners for mooring (unless management solutions such as eco-friendly moorings, are investigated), with a minimal reduction in the recreational value of the meadows.
W. Synergies?
An increase in seagrass meadows for carbon sequestration is likely to increase available coastal nursery grounds for spawning commercial fish, have beneficial impacts for ecological food webs, improve local sediment stability and increase the biodiversity of an area, with subsequent beneficial impacts on wider ecological processes and functions.
Uncertainties
Speculative: the extent to which trade-offs and synergies exist between the condition of seagrass meadows, the ES it provides and other ES is unclear.
X. Sustainability test: is the asset currently able to give the target performance?
As the extent and health of seagrass declines in the UK, its ability to sequester carbon is not only declining, but carbon will be being released to the system. Although the trend is slowing it is likely to continue until a point where all seagrass outside of protected areas is compromised (assuming that the seagrass within MPAs is maintained or even recovered within the site). The implementation of the Habitats Directive and UK BAP targets through restoration has yet to be acted upon in the UK. Therefore we can conclude that seagrass is currently unable to give the target performance.
If yes - will this performance be sustained into the future?
n/a
If no – state why?
The implementation of the Habitats Directive, UK BAP and English MCZ (under the Marine and Coastal Access Act) targets are intended to restore seagrass habitat to former extent and condition. Even with these policies declines in seagrass habitat outside of MPAs continue, suggesting that more needs to be done to sustain the extent and condition of all seagrass.
Y. Red flags? As reported in section Q, there is a critical threshold in fragmentation whereby the negative effects that seagrass loss initiates (e.g. sediment resuspension and reduction) further accelerate losses at rates greater than

102
the seagrass can recover. In the 1930s the entire North Atlantic populations of Zostera marina were decimated by an epidemic of a wasting disease(Den Hartog, 1987). Since Zostera beds have not regained their former distribution, restoration may be required. However, there is the view that, although the 1930s wasting disease wiped out most of the seagrass and it never recovered, those surviving today are much more resilient to the disease, although this is difficult to prove.
As ecosystem engineers that influence their own growing environment, loss of seagrasses can lead to a significant shift in environmental conditions (water currents, sediment composition) which may inhibit restoration. Therefore, as a precautionary approach protection surpasses the “cure”.
Finally, as with any biogenic habitat those seagrass meadows growing at the upper or lower limits of its distributional range or environmental tolerances are more likely to be vulnerable to anthropogenic disturbance and less able to recover.
Uncertainties
Speculative: There is insufficient evidence on where the threshold actually is in terms of the amount of fragmentation a seagrass meadow can recover from (at the scale of meadow and in terms of the distribution of seagrasses).

UK NEAFO Work Package 1: Natural capital asset check – Annex 4: Case studies
eftec 103 November 2012
1.3.6. Conclusions A summary of the asset check should reflect the uncertainties in the evidence available, conclusions on integrity and sustainability of the natural capital asset, and future sustainability of the asset is assessed in terms of whether it is expected to deliver the target performance, and the presence of red flags. Where these issues are quantified relevant data should be included.

104
Summary of Blue Carbon natural capital asset check
Asset Trends in natural asset integrity
Target performance Criticalities Sustainability of performance
Red Flags
Seagrasses and the climate regulation
service provided via
carbon sequestration and storage
Globally seagrasses have been disappearing at a rate of 110 km2 yr-1 since 1980 and the rate
of loss is increasing (Waycott et al., 2009). UK Seagrasses may have never fully recovered
from a wasting disease in the 1930s (Short et
al., 1987). Although the 2009 WWF Marine
Health Check downgraded the status of seagrass from severe
decline to degraded (Wilding et al., 2009)
continued direct physical pressures on seagrass beds (outside
of MPAs) are increasingly resulting in fragmentation and even
losses of many beds (Rhodes et al., 2006;
Goumenaki, 2006; Suonpää, 2009).
Seagrass beds are a priority habitat
under UK (UK BAP) and a sub-feature under EU (Habitats
Directive) conservation
objectives. These objectives require
the maintenance or restoration of seagrass to a favourable
conservation status. Given current
evidence is that seagrass has not yet
recovered to its former extent
following disease and continues to
decline, there is a need to restore at certain locations.
Seagrass extent is an indicator for GES
under the WFD and GEnS under the
MSFD.
MPAs, voluntary codes of practice and local fisheries
byelaws protect against physical disturbance.
Improvements in catchment management
and sewage treatment are improving water clarity and nutrient loading to
above critical thresholds for the seagrass. Meadows outside of protected areas
and or catchment management plans
continue to be degraded and seagrass is vulnerable
to many exogenic unmanageable pressures.
(e.g. through ocean acidification, sea level rise
and climate change). Restoration of seagrasses is
possible but loss of seagrass may change the local environment making
it unsuitable for restoration. Restoring seagrass to levels of
functional equivalency in terms of ES may take many decades if possible at all.
Although evidence on the extent and health of
seagrass is mixed and there is not a consolidated effort to monitor seagrass extent in the UK. A 2009 review
(Wilding et al., 2009) suggested that in general
they are declining in the UK, but whilst highly likely there is insufficient evidence to be certain of this. Furthermore,
as the extent of seagrass declines, its ability to
sequester carbon is not only declining, but carbon will be
being released to the system. Although the trend
is slowing it is likely to continue until a point where
all seagrass outside of protected areas is
compromised. The implementation of the Habitats Directive and UK
BAP targets through restoration has yet to be
acted upon in the UK. Therefore we can conclude that seagrass is currently unable to give the target
performance.
It is probable that there is a critical threshold in fragmentation
of seagrasses whereby the negative effects that seagrass loss initiates further accelerate losses at rates greater than the seagrass can recover. Current monitoring methods and timings may not be
sensitive to these critical thresholds. In the 1930s the entire
North Atlantic populations of Zostera marina were decimated by
an epidemic of a wasting disease(Den Hartog, 1987). As of yet Zostera beds have not since
regained their former distribution, so restoration is needed.
As ecosystem engineers that influence their own growing
environment, loss of seagrasses can lead to a significant shift in environmental conditions (water currents, sediment composition) which may inhibit restoration.
Seagrass meadows growing at the upper or lower limits of its
distributional range or environmental tolerances are more
likely to be vulnerable to anthropogenic disturbance and less
able to recover.

UK NEAFO Work Package 1: Natural capital asset check – Annex 4: Case studies
eftec 105 November 2012
1.3.7. References
Anon. Biodiversity: The UK Steering Group Report - Volume II: Action Plans. . Report No. (December 1995, Tranche 1, Vol 2, p262) http://www.ukbap.org.uk/UKPlans.aspx?ID=35, (1995).
Barbier, E. B. et al. The value of estuarine and coastal ecosystem services. Ecological Monographs 81, 169-193 (2011).
Björk, M., Short, F., Mcleod, E. & Beer, S. Managing seagrasses for resilience to climate change. (Iucn, 2008).
Black, G. & Kochanowska, D. Inventory of Eelgrass beds in Devon and Dorset 2004. 61 (English Nature, Environment Agency, Devon Biodiversity Records Centre and Dorset Environmental Records Centre, Exeter, 2004).
Blue Ventures. Blue Carbon, <http://blueventures.org/conservation/blue-carbon.html> (2012).
Bull, J. C., Kenyon, E. J. & Cook, K. J. Wasting disease regulates long-term population dynamics in a threatened seagrass. Oecologia, 1-8 (2011).
Burton, M., Lock, K. & Newman, P. Skomer Marine Nature Reserve. Distribution and Abundance of Zostera marina in North Haven 2010. Report No. CCW Regional Report CCW/WW/10/10, 33 (2010).
Calumpong, H. & Fonseca, M. in Global seagrass research methods Vol. 33 (ed R.G. Coles) Ch. 22, 425-445 (Elsevier Science, 2001).
Cebrián, J., Duarte, C. M., Marba, N. & Enriquez, S. Magnitude and fate of the production of four co-occurring western Mediterranean seagrass species. Marine Ecology-Progress Series 155, 29-44, doi:10.3354/meps155029 (1997).
Cebrián, J., Duarte, C., Marbà, N. & Enríquez, S. Magnitude and fate of the production of four co-occurring Western Mediterranean seagrass species. Marine Ecology Progress Series 155, 29-44, doi:10.3354/meps155029 (1997).
Chesworth, J. C., Gall, A. & King, D. G. Yarmouth Seagrass (Zostera spp.) Survey., 21 (Hampshire and Isle of Wight Wildlife Trust and Yarmouth Harbour Commission, Yarmouth, 2008).
Cleator, B. The status of the genus Zostera in Scottish coastal waters. Report No. 22, (Scottish Natural Heritage, Edinburgh, 1993).
Cook, K. J. Isles of Scilly Zostera marina monitoring 2001: expedition report. (Natural England, Truro, 2002).
Cunha, A. H. et al. Changing Paradigms in Seagrass Restoration. Restoration Ecology (2012).
Curtis, J. M. R. & Vincent, A. C. J. Distribution of sympatric seahorse species along a gradient of habitat complexity in a seagrass-dominated community. Mar. Ecol.-Prog. Ser. 291, 81-91, doi:10.3354/meps291081 (2005).
Davison, D. M. The genus Zostera in the UK: A literature review identifying key conservation, management and monitoring requirements. (Environment, Heritage Service, Department of the Environment (northern Ireland), Belfast, 1997).
de la Torre-Castro, M., Björk, M., Eklöf, J. & Rönnbäck, P. Seagrass Importance in Food Provisioning Services: Fish Stomach Content as a Link between Seagrass Meadows and Local Fisheries. Western Indian Ocean Journal of Marine Science 7 (2009).

106
Den Hartog, C. "Wasting disease" and other dynamic phenomena in Zostera beds. Aquat. Bot. 27, 3-14 (1987).
Den Hartog, C. Suffocation of a littoral Zostera bed by Enteromorpha radiata. Aquatic Botany 47, 21-28 (1994).
Department of Energy and Climate Change. Carbon Valuation in UK Policy Appraisal: A Revised Approach. 128 (2009).
Duarte, C. M., Middelburg, J. J. & Caraco, N. Major role of marine vegetation on the oceanic carbon cycle. Biogeosciences 2, 1-8 (2005).
Egerton, J. Management of the seagrass bed at Porth Dinllaen. Initial investigation into the use of alternative mooring systems. Report to Gwynedd Council. 34 (Marine Ecological Solutions, 2011).
Foden, J. & Brazier, D. P. Angiosperms (seagrass) within the EU water framework directive: A UK perspective. Mar. Pollut. Bull. 55, 181-195 (2007).
Foden, J. & Brazier, D. P. Angiosperms (seagrass) within the EU water framework directive: A UK perspective. Mar Pollut Bull (2006).
Fonseca, M. S., Julius, B. E. & Kenworthy, W. J. Integrating biology and economics in seagrass restoration: How much is enough and why? Ecol. Eng. 15, 227-237, doi:http://dx.doi.org/10.1016/S0925-8574(00)00078-1 (2000).
Fourqurean, J. W. et al. Seagrass ecosystems as a globally significant carbon stock. Nature GeoScience 5, 505-509 (2012).
Ganter, B. Seagrass (Zostera spp.) as food for brent geese ( Branta bernicla): an overview. Helgoland Marine Research 54, 63-70 (2000).
Ganter, B. Seagrass (Zostera spp.) as food for brent geese (Branta bernicla): an overview. Helgol. Mar. Res. 54, 63-70 (2000).
Garrick-Maidment, N., Trewhella, S., Hatcher, J., Collins, K. & Mallinson, J. Seahorse tagging project, Studland Bay, Dorset, UK. Marine Biodiversity Records 3 (2010).
Goumenaki, P. Contributing to the management of a seagrass habitat by determining its natural or anthropogenic structuring (Salcombe estuary, SW England) MSc Coastal and Ocean Policy thesis, University of Plymouth, (2006).
Hall-Spencer, J. M. et al. Volcanic carbon dioxide vents show ecosystem effects of ocean acidification. Nature 454, 96-99 (2008).
Hiscock, K., Sewell, J. & Oakley, J. The Marine Health Check 2005: A report to gauge the health of teh UK's sea life. 79 (WWF-UK, Godalming, 2005).
Irving, R. A., Jackson, E. L. & Cole, H. Mapping eelgrass Zostera marina beds within Plymouth Sound and Estuaries SAC. . (Report to Natural England by Sea-Scope, Marine Environmental Consultants, Devon, 2007).
Jackson, E. L. et al. Isles of Scilly Seagrass Mapping. Natural England Commissioned Reports Number 087 (2011).
Jackson, E. L. The importance of seagrass habitats for fishery species in Jersey, English Channel, University of Plymouth, (2003).
Jackson, E. L., Griffiths, C. A., Collins, K. & Durkin, O. An assessment of anthropogenic impact on marine angiosperm habitat. (Natural England and Marine Management Organisation, Peterborough, UK., 2012).

UK NEAFO Work Package 1: Natural capital asset check – Annex 4: Case studies
eftec 107 November 2012
Jackson, E. L., Rowden, A. A., Attrill, M. J., Bossey, S. J. & Jones, M. B. The importance of seagrass beds as a habitat for fishery species. Oceanography and Marine Biology an Annual Review 39, 269-304 (2001).
Jackson, E., Griffiths, C. A., Collins, K. & Durkin, O. A guide to assessing and managing anthropogenic impact on marine angiosperm habitat: Part 2: Studland Bay vulnerability assessment. Report No. Natural England Commissioned Reports, Number 111, 148 pp. (Natural England, Peterborough, 2013).
James, B. North-west Scotland subtidal seagrass bed survey 2004. Scottish Natural Heritage Commissioned Report No. 076 (ROAME No. F04LB05). (2004).
JNCC & Natural England. Ecological Network Guidance. 124 (2010).
JNCC. Guidelines for the selection of biological SSSI’s Part 2: Detailed guidelines for habitats and species groups. Chapter 11 VASCULAR PLANTS (FLOWERING PLANTS, FERNS AND THEIR ALLIES). 17 (Joint Nature Conservation Committee, Peterborough, 1998).
Kennedy, H. & Björk, M. in The management of natural coastal carbon sinks (eds D. Laffoley & G. Grimsditch) (IUCN, Gland, p 23-29, 2009).
Kennedy, H. et al. Seagrass sediments as a global carbon sink: Isotopic constraints. Global Biogeochem. Cyc. 24, 1-8 (2010).
Koch, E. W. Beyond light: Physical, geological and geochemical parameters as possible submersed aquatic vegetation habitat requirements. Estuaries 24, 1-17 (2001).
Koch, E. W. et al. Non-linearity in ecosystem services: temporal and spatial variability in coastal protection. Front. Ecol. Environ. 7, 29-37, doi:10.1890/080126 (2009).
Luisetti, T., Jackson, E. L. & Turner, R. K. Valuing the European ‘coastal blue carbon’ storage benefit. Mar. Pollut. Bull., doi:http://dx.doi.org/10.1016/j.marpolbul.2013.03.029 (2013).
Mateo, M. A., Romero, J., Pérez, M., Littler, M. M. & Littler, D. S. Dynamics of millenary organic deposits resulting from the growth of the Mediterranean seagrass Posidonia oceanica. Estuar. Coast. Shelf Sci. 44 (1997).
Mcleod, E. et al. A blueprint for blue carbon: toward an improved understanding of the role of vegetated coastal habitats in sequestering CO2. Front. Ecol. Environ. 9, 552-560 (2011).
Moncreiff, C. A., Sullivan, M. J. & Daehnick, A. E. Primary production dynamics in seagrass beds of Mississippi Sound: the contributions of seagrass, epiphytic algae, sand microflora, and phytoplankton. Marine Ecology Progress Series 87, 161-161 (1992).
Nellemann, C. et al. Blue Carbon. A Rapid Response Assessment. 80 (United Nations Environment Programme, GRID-Arendal, 2009).
Nienhuis, P. H. Causes of the eelgrass wasting disease: Van der Werff's changing theories. Aquatic Ecology 28, 55-61 (1994).
Olesen, B. & Sand-Jensen, K. Patch dynamics of eelgrass Zostera marina. Marine Ecology Progress Series 106, 147-147 (1994).
Orem, W. H. et al. Geochemistry of Florida Bay sediments: nutrient history at five sites in eastern and central Florida Bay. Journal of Coastal Research 15, 1055-1071 (1999).

108
Pearce, D. The social cost of carbon and its policy implications. Oxford Review of Economic Policy 19, 362 (2003).
Reid, N., Stone, R. E., Coyle, A., Grimes, G. & Montgomery, W. I. Intertidal seagrass survey of Strangford, Carlingford and Killough, Northern Ireland 2012. Report prepared by the Natural Heritage Research Partnership (NHRP) between Quercus, Queen’s UniversityBelfast and the Northern Ireland Environment Agency (NIEA) for the Research and Development Series No. 13/04. (2012).
Rhodes, B., Jackson, E. L., Moore, R., Foggo, A. & Frost, M. The impact of swinging boat moorings on Zostera marina beds and associated infaunal macroinvertebrate communities in Salcombe, Devon, UK. 58 (Report to Natural England by the University of Plymouth Marine Biology and Ecology Research Centre, 2006).
Rhodes, B., Jackson, E. L., Moore, R., Foggo, A. & Frost, M. The impact of swinging boat moorings on Zostera marina beds and associated infaunal macroinvertebrate communities in Salcombe, Devon, UK. 57 (University of Plymouth report to Natural England, Peterborough, 2006).
Short, F. T., Muehlstein, L. K. & Porter, D. Eelgrass Wasting Disease: Cause and Recurrence of a Marine Epidemic. The Biological Bulletin 173, 557 (1987).
Smith, I., Fonseca, M. S., Rivera, J. A. & Rittmaster, K. Habitat value of natural versus recently transplanted eelgrass, Zostera marina, for the bay scallop, Argopecten irradians. Fishery Bulletin 87, 189-196 (1989).
Stern, N. H. The economics of climate change: the Stern review. (Cambridge University Press, 2007).
Suonpää, A. M. The impacts of anchor scarring on the eelgrass (Zostera marina) - experimental study and an assessment of its growth potential in Studland Bay, UK Masters of Science thesis, University of Southampton, (2009).
Tol, R. S. J. The marginal damage costs of carbon dioxide emissions: an assessment of the uncertainties. Energy policy 33, 2064-2074 (2005).
Tullrot, A. Background Document for Zostera beds, Seagrass beds. 39 (OSPAR, 2009).
Ward, T. J. Temporal variation of metals in the seagrass Posidonia australis and its potential as a sentinel accumulator near a lead smelter. Marine Biology 95, 315-321 (1987).
Warren, M. A., Gregory, R. S., Laurel, B. J. & Snelgrove, P. V. R. Increasing density of juvenile Atlantic (Gadus morhua) and Greenland cod (G. ogac) in association with spatial expansion and recovery of eelgrass (Zostera marina) in a coastal nursery habitat. J. Exp. Mar. Biol. Ecol. 394, 154-160, doi:10.1016/j.jembe.2010.08.011 (2010).
Waycott, M. et al. Accelerating loss of seagrasses across the globe threatens coastal ecosystems. PNAS 106, 12377–12381 (2009).
Wilding, C. et al. Marine Health Check - update 2009. (World Wildlife Fund, 2009).

UK NEAFO Work Package 1: Natural capital asset check – Annex 4: Case studies
eftec 109 November 2012
1.3.8. Annex Annex 1 Data sources There is no one stop shop for data showing changes in the area or quality of all UK seagrass habitats. The following data sources represent the most comprehensive data sets:
• Defra MB0102 contract data-layers5
• Database of OSPAR Habitats in the North-East Atlantic Ocean (data accessible through MESH6)
• NBN Gateway – provides point data and metadata of surveys showing the distribution of seagrasses in the UK
• Davison DM (1997) The genus Zostera in the UK: A literature review identifying key conservation, management and monitoring requirements. Environment, Heritage Service, Department of the Environment (northern Ireland), Belfast
• The EA will also hold data on seagrass quality and distribution but only for those sites monitored under the Water Framework Directive, the data is not accessible online.
However, mostly seagrass mapping and condition data is available from disparate written reports. The statutory conservation agencies (Natural England, Countryside Council for Wales, Scottish Natural Heritage and the Northern Ireland Environment Agency have all funded various reports to monitor change in seagrass area at specific sites as well as inventories of seagrass in specific regions (examples include 17,19,21,22,24,25,58-63 Rhodes et al., 2006; Jackson et al. 2011; Chesworth et al., 2008; Black and Kochanowska, 2004; Egerton, 2011; Irving et al., 2007; Reid et al., 2012; Jackson et al., 2013; Cook, 2002; James, 2004; Cleator, 1993; Davison, 1997). The IUCN world atlas of seagrass provides distribution data for the two UK species of Zostera and a global context for these important UK habitats.
5http://randd.defra.gov.uk/Default.aspx?Menu=Menu&Module=More&Location=None&Completed=0&ProjectID=16368 6http://www.searchmesh.net/default.aspx?page=1974&&mapInstance=MESHAtlanticMap_&Layers=OSPARhabPoints

110
Annex 2 Distribution map of Zostera noltii and Zostera marina in the UK

UK NEAFO Work Package 1: Natural capital asset check – Annex 4: Case studies
eftec 111 November 2012
1.4. Saltmarsh-fisheries asset check
1.4.1. Natural capital asset
Question Guidance on Answer
A. Define Natural Capital asset being checked
Specify natural capital asset, e.g. habitat type and/or ecosystem services (e.g. peat bogs, carbon sequestration in woodland, all carbon sequestration in habitats)
Natural capital assets can be defined as: ‘the configuration of living and/or non-living processes and functions over time and space, which produce through their existence and/or some combination of their functions, a positive economic or social value.’
In this case study, we focus on the provisioning ecosystem service (ES) of landings of commercial fish species (e.g. sea bass, Dicentrarchus labrax L.) supported by functions within inter-tidal saltmarsh habitats. UK saltmarsh also produces other ES such as flood and pollution protection, biodiversity and recreational (especially recreational angling) values (see Section D). Although there are issues in using just one service to represent saltmarshes and all the other ecosystem services they provide, and their processes and functions, the use of fisheries production still helps to provide an indication of the status of the UK saltmarshes and how this may influence ecosystem service delivery.
Since as stated in Section F there is no data on the condition of existing coastal saltmarsh habitat, the definition of ‘natural capital asset’ used here includes all of the ecological elements that together contribute to the production of commercial fish stocks and other ES of concern. Therefore, the natural capital is defined through the functional and spatial configuration of ecological processes that support the flow of fish landings, including the Spawning Stock Biomass (SSB) that produces juvenile fish and the area of saltmarsh feeding and refuge habitat that allows them to mature. The quality and extent of this natural capital asset will determine the quality and extent of ecosystem service ‘flows’ that are produced. Coastal saltmarshes are highly important for the juvenile stages of commercial fishes (Colclough et al., 2010). The saltmarsh vegetation and shallow creeks provide small fish with refuge from predation by larger fish and birds. The vegetation and muddy creeks provide habitats for phytoplanktonic and invertebrate prey which are indirectly and directly consumed by the juvenile fish. In this way, the saltmarshes contribute to the growth of the juveniles and increase their likelihood of survival, improving recruitment. This improvement to recruitment then contributes to the spawning stock biomass and subsequently,

112
potential fish yields.
Information on the extent and condition of coastal saltmarsh habitat is used in this asset check. The condition of fish stocks also provides information on the existing population of reproductively active fish that provide the juvenile fish entering the coastal saltmarsh to feed, as well as providing direct value to society as food.
Although many fish species inhabit saltmarshes, not all of these are dependent on saltmarshes for their survival. Elliott and Hemmingway (2002) define a fish nursery as a concentration of juvenile stages which are growing and feeding. Juveniles of many commercially valuable species concentrate within UK saltmarshes to feed and grow, including gilthead bream (Sparus aurata L.), sand smelt (Atherina presbyter L.), flounder (Platichthys flesus L.), grey mullet (Liza ramada L., Chelon labrosus Risso., and Liza aurata L.), herring (Clupea harengus L.) and sprat (Sprattus sprattus L.) (Fonseca, 2009). Beck et al., (2001) define a nursery habitat as an area which contributes more per unit area on average to the production of individuals that recruit to the adult population, than the production from other habitats in which juveniles exist. This second definition is stricter because it requires knowledge of, and comparison between, a range of potential juvenile fish habitats, plus evidence that the juveniles in these habitats are more likely to survive to make a significant contribution to the adult population. According to the second definition, the only species for which there is currently clear evidence to demonstrate that UK saltmarshes are key fish nursery habitats, is sea bass. For this reason, sea bass was chosen as the case study species. However it is important to note that the complex ecological interdependencies and the relationship between coastal saltmarsh condition and sea bass productivity, is not yet fully understood.
The focus of this tool is to check the condition of the natural capital asset (i.e. the productivity of fish and other ES from the coastal saltmarsh).
B. What is the spatial scale for which the asset check is being conducted
UK, England/ Scotland/ Wales, Regional, County, Local? This case study compares saltmarsh contributions to inshore commercial sea bass fisheries in England and Wales. Scottish saltmarshes do not currently support concentrations of juvenile sea bass that can survive to make a significant contribution to the adult stock, and there is a lack of available Irish saltmarsh area data that is comparable to that available from the Environment Agency (2011) for England and Wales. The study only considers inshore fisheries, because of complex patterns in both the stock biology e.g. migration patterns and sea bass exploitation which occurs both inshore and offshore; as described in Fonseca (2009).

UK NEAFO Work Package 1: Natural capital asset check – Annex 4: Case studies
eftec 113 November 2012
C. Define the timescale for the asset check.
Take into account rate of change in asset, decision-making timescales, and timescales over which services from the asset can change. Past timescales should avoid reference to historical periods (>50 years) unless they are relevant to decision-making. Different timescales may be appropriate for different services from a natural
capital asset.
Historical and current measures of coastal saltmarsh extent, and future projections based on long term trends. In terms of sea bass stock dynamics, historical (last 4 decades) and current (last 5 years) trends are considered.
D. What are the main ecosystem services the asset provides?
List main ecosystem services the asset provides (or contributes to providing) Coastal saltmarshes not only provide provisioning services as nursery grounds for commercial fish species, but also regulating services through flood hazard protection, and absorption of micro-pollutants (Watts, 2012), sequestration of carbon, and cultural services through supporting biodiversity, and hence recreational values such as recreational angling, and landscape values (UKNEA, 2011). These services are valued in different ways, within markets through the sale of commercial fish landings, and outside the market system (e.g. through the non-use value attributed to biodiversity).
Notes: It is useful to define these parameters for the analysis clearly at the outset. If a subset of a natural asset is being checked (e.g. peat bogs in Scotland are a subset of all peat bogs in the UK), then this can affect availability of data and interpretation of results. Our approach in the scoping study for Defra assumes that an asset needs to have some physical measurement, and defines natural capital assets as:
…stock that can be managed or protected in order to have a positive economic or social value. However, in further work looking at the definition of natural capital we have defined it as:
…the configuration of living and/or non-living processes and functions over time and space, that produce through their existence and/or some combination of their functions, a positive economic or social value.

114
1.4.2. Integrity of natural capital asset
Question Guidance on Answer Trends
Past trend Current trend Future Trend Summary of Trends
(see key*)
E. What is the extent of the natural capital asset?
Can be area, volume, number The total extent of coastal saltmarsh in England and Wales is approximately 40,000 ha (Environment Agency, 2011).
Quantify trend In the UK and across Western Europe 80% of coastal saltmarsh has been lost (Attrill et al., 1999). Citations in Colclough et al (2005) describe the historic losses of intertidal habitats in the UK and impacts on fish production (e.g. McLusky, Bryant & Elliott, 1992 and Elliott & Taylor, 1989). For example, historic losses in the Forth estuary over the past 200 years are estimated to have reduced fish
Quantify trend Coastal saltmarsh losses continue in the UK, estimated at around 100 ha/yr (Biodiversity Action Reporting System, 2008).
Describe expected future trend Predictions for salt marsh loss because of sea level rise in the UK: wetland habitat losses have been relatively small to date (i.e. 4.5% for salt marshes over the last twenty years), although losses are projected to reach 8% by 2060 (Jones et al., 2011) Recently, the rate of loss of coastal saltmarsh in the UK has been slowed by managed realignment schemes. The Online Managed Realignment Guide (OMRG, www.abpmer.net/omreg/) reports the cumulative habitat area created to date in the UK through 51 managed realignment projects (about 600ha of saltmarsh and 400ha of
Insert symbol
↓

UK NEAFO Work Package 1: Natural capital asset check – Annex 4: Case studies
eftec 115 November 2012
production by 40% (similar figures have been developed in the US). Across the UK, such losses would cumulatively mean a massive impact on overall fish production.7
mudflat) since 1991 (Esteves, 2013).
F. What is the condition of the natural capital asset?
Can be measured through different ecological data, e.g. conservation
status, age structure, or proxies such as ecosystem processes
Coastal saltmarshes across the UK and around UK seas have declined significantly over the past century, although there are uncertainties surrounding the rate of decline in recent data (Phelan et al., 2009). Loss of coastal saltmarshes continues in the UK due to rises in sea level causing coastal squeeze (Luisetti et al., 2011) and development of built capital, for example demand for new ports driven by increased levels of international trade. However, more detailed data of current monitoring on the condition of existing coastal saltmarsh habitats are
Describe/ quantify trend
In UK waters, the stocks of the majority of commercial fish species have declined.
With increasingly restrictive quota controls under the CFP, fishermen turned to non-quota species such as sea bass (Pickett and Pawson, 1994).
Describe/ quantify trend
In UK waters, a significant number of fish stocks are still in a poor and declining state (Defra, 2012). Overall, the large majority of scientifically assessed stocks continue to be fished at rates well above the levels expected to provide the highest long-term yield (UKMASS, 2010).
Describe expected future trend
If no further Government action is taken, the status of bass stocks are likely to decline further.
Insert symbol
↓
7 Paragraph based on inputs form Steve Colclough, pers comm, July 2012.

116
not easily available. However, we do have biological information on the condition of commercial bass stocks, which forms part of the natural capital asset through impacting the potential of the stock to produce fish in the future. In addition, depleting stock levels may reflect trends in the underlying condition of the supporting services (but are more likely to be due to over-harvesting by humans).
Following the rapid development of commercial fishery for sea bass during the late 1970s and 1980s, a package of technical measures was introduced in 1990 in England and Wales, which resulted in an improvement to recruitment of bass and the sustainable development of the bass population and its fishery (Pawson, Kupschus & Pickett, 2007).
The recent ICES benchmark assessment of sea bass (2012) concluded that the scenario of increasing fishing mortality, declining spawning stock biomass (i.e. the biomass of all fish beyond the age or size class in which 50% of the individuals are mature) and poor recruitment to the adult stock since 2008 will lead to an expectation of further spawning stock biomass decline.
Together, extent and condition reflect the integrity of the stock of natural capital, that produces flows of ecosystem services.
Uncertainties
Give level of uncertainty in analysis* for D, E and F, and reasons for this. * Use Uncertainty scale described in introduction.
There is high agreement that there has been a continued loss in the extent of coastal saltmarsh habitat in the UK historically although there is uncertainty in recent data and on condition of coastal saltmarsh over time. The decline in commercial fish stocks is based on well-established evidence of harvesting catches.

UK NEAFO Work Package 1: Natural capital asset check – Annex 4: Case studies
eftec 117 November 2012
Key for trends
↑ Increasing ↓ Decreasing
↔ evidence shows no trend O no evidence
↑↓ both increasing and decreasing (this could reflect ambiguous evidence and/or spatially differing trends)

118
G. Drivers of changes in Extent and Condition
List policy drivers Note there may be different drivers of
changes in stock and condition
Policy drivers
Coastal saltmarsh is a priority habitat under UK and EU conservation objectives, which have driven the need for recent managed realignment schemes, but its protection under the Habitats Directive can conflict with the affordability of flood defence requirements. There may be a trade-off between coastal saltmarsh providing supporting services enabling fisheries biological productivity and societal preferences for freshwater biodiversity or farmland. Most commercial fish species are managed through the Common Fisheries Policy which sets quotas on fishery catches known as Total Allowable Catches, TACs. TACs are an overall limit on the weight of fish which fishermen may land. Currently, sea bass is not managed through the quota system. Instead, sea bass stocks are managed on an ad hoc basis, by local Inshore Fisheries and Conservation Authorities (previously Sea Fisheries Committees) and the MMO, under local and regional byelaws. These byelaws relate to small local temporal or spatial closures, and enforcement of a Minimum Landing Size. However sea bass migrate large distances and occupy more than one fisheries management organisational boundary. The management of the species at the wrong spatial scale may result in a decline in the stock as a whole, a local extinction, or eventually, stock collapse (See Section Q). Therefore an ecosystem-based approach to the management of sea bass is currently under consideration (see Section M).
List biophysical drivers Biophysical Drivers A rise in sea level can cause landward shifts in coastal saltmarsh communities, but in some instances, coastal squeeze may occur, whereby the coastal margin is squeezed between the fixed landward boundary (artificial or otherwise) and the rising sea level. The supply of juveniles to the saltmarsh over time may be variable. The slow growth, late maturity and long lifespan of sea bass in Britain is indicative of this species being close to the Northern limits of its range (Lancaster 1991). Bass stocks are vulnerable to high natural mortality (low

UK NEAFO Work Package 1: Natural capital asset check – Annex 4: Case studies
eftec 119 November 2012
numbers of fish surviving to a size where they are taken commercially); and other environmental factors, such as the effects of temperature (e.g. cold winters wiping out an entire year class); predation; and cannibalism. These elements may be difficult to measure, because of time lags in the ability of fish stocks to recover after depletion, partly due to the associated decline in the total reproductive ability of the stock. The access of juveniles to the saltmarsh may also be variable, both because of anthropological barriers to the passage of fish through the estuaries, and because of local variations in the estuarine carrying capacity and the resiliance of each estuary to environmental purturbations. The quality and condition of the saltmarshes will affect the ability of the habitat to support feeding and refuge nursery functions.
List socio-economic & other drivers Socio-economic & other drivers Land drainage for agriculture, coastal development including the development of built capital, for example demand for new ports driven by increased levels of international trade. Important fisheries habitats (e.g. nursery grounds) can also be impacted by run-off from farming affecting terrestrial provisioning services. The study assumes that there are no anthropological barriers to the passage of juvenile sea bass between saltmarshes and the sea (e.g. due to estuary-specific point-source and diffuse pollution; new coastal transport, industrial or housing developments; illegal fishing; abstraction; sea-angling etc.).
H. What are the asset’s main ecosystem functions?
List important ecosystem functions (or supporting and intermediate ecosystem services) that support the main final services from the asset. Supporting and intermediate services are defined in the UKNEA.
Note that supporting and intermediate services may originate from other assets that co-produce final services. Coastal saltmarsh is an important habitat in the ecological cycle that supports fisheries through the provision of nursery grounds for juvenile fish. The ecosystem functions that the saltmarsh provide to the fisheries production, include primary production (e.g. of microphytobenthos as a direct or indirect food source); and the provision of saltmarsh vegetation as fish refuge. Sea bass are also prey items for other fish, bird species (such as gulls, gannets and herons) and seals (grey seals). The complex and interrelated nature of ecosystems means that

120
the natural capital asset is likely to play a role indirectly throughout the environment and its loss may therefore have unforeseen consequences on other ES flows.
I. Integrity Test: Is the ability of the asset to support ecosystem services being maintained?
Give details for different services (if relevant), consider the trends under questions E and F and the services from question D.
If no, what are drivers of decline (see question G)? Continued loss of coastal saltmarsh, albeit at a reducing rate, will restrict the availability of nursery grounds to juvenile fish and may constrain the maintenance or recovery of fish stocks that are already over-exploited. The ability of fish stocks to recover following deterioration depends in part on any changes in ecological functions and processes that occur as a result of their depletion, for example through a reduction in the available food and refuge to the juveniles, or even in the estuarine carrying capacity as a whole.
Notes: Non-essential supporting information that can be useful for decision-makers includes:
- are the ecosystem services provided by the asset rival or non-rival goods?
- are the ecosystem services provided by the asset market or non-market goods?
- Some main final services may rely on supporting and intermediate services from natural capital assets not considered in the asset check. Links to the status of these other assets may be an important factor for the asset check. It may be possible to consider their status/trend/management within the asset check, but where the links become complex, such analysis may not be feasible. However, these interdependencies should be noted; furthermore the natural capital underpinning the final services in question may justify a separate asset check.

UK NEAFO Work Package 1: Natural capital asset check – Annex 4: Case studies
eftec 121 November 2012
1.4.3. Performance of natural capital asset In this context ‘performance’ is fitness to carry out the role which is required of a capital asset. This is regarded as useful because defining the target performance of natural capital assets captures both the current and future quantity and quality of an asset. Human ‘requirements’ include basic human needs, but also reflect infinite wants, so the definition of performance is usually subjective.
Question Guidance on Answer
J. Is there a measure of the current output of services from the asset?
Either a direct measure of levels of services (see question D), or an indication of this based on the amount of the asset (stock) and its ability to provide the service (condition) (see question I)
Previous writers have estimated that each hectare of coastal saltmarsh could support fisheries productivity that results in £1-£67 of commercial fish landings per year on the east coast of the UK8. Fisheries also have non-use values in terms of the socio-cultural values that are placed on healthy fish stocks and a healthy marine environment. These values are determined by society’s understanding and appreciation of the marine environment and fish stocks. Some of the value of fish stocks to society is currently lost through unsustainable management of fisheries. An estimated $50 billion a year is lost through poor management and inefficiencies in fisheries globally, and in the EU fisheries currently operate at a net cost to society (Arnason et al, 2009). Effective management of fisheries and the coastal saltmarshes that support them could increase the value of fisheries. There is also a specific interest in sea bass as a recreational fish species (recreational angling). However, although the recreational sector makes a significant contribution to the UK economy estimated at £538m per annum (Drew 2004), it is currently unknown what proportion of this activity is directly attributable to sea bass. Also, for the specific purpose of this analysis a valuation of the recreational value of sea bass was considered not appropriate due to the risk of double counting the value of this provisioning ecosystem service. The Environment Agency (2011) has estimated the extent of coastal saltmarsh in England and Wales. This analysis excluded all non-discreet pioneer vegetation which is particularly difficult to identify from aerial surveys and is subject to large seasonal variation. Although this survey is the largest and most comprehensive survey to date, it does not provide an estimate of saltmarsh condition. In addition, the links between condition and fish nursery function are not yet fully understood.
8 Calculation based on productivity value/ha/yr of £36 to £67.5 ha/year (Stevenson, 2001) and £1.12 to £50.85 /ha/yr (Fonseca, 2009)

122
K. What goods and benefits do these services support?
Services, goods and benefits are defined in the UKNEA: services support the provision of goods to people, for who they have economic, health and/or shared social values.
The services support use values: food (rival) in terms of fish; recreational services through providing a habitat for a rich variety of biodiversity (non-rival); a healthy climate through carbon sequestration (non-rival); pollution control through the absorption of micro-pollutants in storm runoff (non-rival); and flood control through providing a natural barrier to storm surges and sea level rise (non-rival).
L. What is the target performance from the asset?
Summarise performance: the role that capital performs in providing beneficial services - see below for guidance on definition
Coastal saltmarsh is a priority habitat under UK and EU conservation objectives. The UK BAP (1999) states that approximately 80% of the area of coastal saltmarsh in Great Britain is designated as Sites of Special Scientific Interest. The Habitats Directive requires the maintenance or restoration of coastal saltmarsh to a favourable conservation status and to be protected through conservation measures adopted through the designation of sites as Special Areas of Conservation (SACs) as a habitat listed under Annex 1 (JNCC, 2010). Coastal saltmarsh was one of six habitats of concern with continuing/accelerating decline in the 2008 BAP progress report. Action is now advocated by Natural England (2010) to ensure that ‘wherever possible the creation of upper coastal saltmarsh should be facilitated by, for example, managed realignment of flood defences which restore natural tidal processes and reduce coastal squeeze’. Coastal saltmarsh is a priority habitat under UK BAP with target performance being no further net loss of extent of the vegetated part of the intertidal sediment ecosystems (coastal saltmarsh). Currently losses are estimated at 100ha per year, and there is a further target to create 40ha/year to offset historical losses. The UK BAP objective also aims to achieve favourable or recovering condition by appropriate management of a yet to be defined area of intertidal sediment habitat currently in unfavourable condition by 2015 (Biodiversity Action Reporting System, 2008). The ‘performance’ of the asset also relates to supporting the condition of fish stocks. Harvesting quotas are set for commercial fish species through the Common Fisheries Policy (CFP) which are determined by maximum sustainable yields/maximum economic yields through bio-economic modelling. However these targets are set to ensure that harvesting of the fish stock is sustainable insofar as the population is able to repopulate itself sufficiently year-on-year; they are based on the stock that the saltmarsh helps to produce. Higher quotas mean healthier fish populations and may be seen as an outcome of improved coastal saltmarsh habitat. As sea bass is currently a non-quota species, the most accurate evidence relating to the health of this species is reflected in the state of the spawning stock biomass as described in Section F.

UK NEAFO Work Package 1: Natural capital asset check – Annex 4: Case studies
eftec 123 November 2012
Coastal areas, especially those that rely on commercial fishing activity, will be most greatly impacted by declining coastal saltmarsh condition and reduced fish stocks.
Uncertainties
Give level of uncertainty* in answer to L and reasons for this. * Use Uncertainty scale described in introduction.
There is established but incomplete evidence on sea bass biology (including juveniles), stock movements and stock exploitation, to develop a basic management plan for the species. The importance of coastal saltmarshes as nursery grounds for sea bass has also been demonstrated (e.g. Colclough, et al., 2010). However there is a need to update and fine-tune this data, both spatially and temporally to improve confidence in management decisions and to ensure that appropriate stock management outcomes are achieved.
Defining performance: Answering these questions can help define performance, but not all questions can be answered for all assets
What policy targets are there for the asset?
(e.g. maximum sustainable yield for fish stocks, global concentrations of GHG) See Section L.
What is the trend in the main services the asset provides?
See question d for services, and UKNEA synthesis report Figure 5 for trends.
As set out in the UKNEA Synthesis Report (2011, Figure 5) the trend in the stock of commercial fish species in UK coastal margin areas (including coastal saltmarsh) is ‘some deterioration’. The flood defence service of some coastal saltmarsh has been replaced by man-made sea defence, thereby reducing the potential quality of this habitat to deliver Ecosystem Services.
What types of goods are supported by the asset?
(e.g. food, drinking water, pollution control) See UKNEA synthesis report Figure 10 for terminology
See Section K. Who benefits from the goods?
Identify the number and location of beneficiaries
All consumers in the countries in which sea bass are sold, benefit from increased standard of living through greater supply of a variety of goods (fish), as well as gaining health benefits. Local economic benefits are secured throughout the commercial fishing supply chain and may include fishing, ports, local restaurants etc. Society benefits more widely through a healthier population thereby reducing healthcare spending (assuming that greater fish harvest from UK waters reduces prices which in turn increases

124
consumption of fish) and from use and non-use values associated with cultural services.
What wellbeing results from the goods?
Use measures of the levels and trends in wellbeing supported by the asset See previous comment.
M. Are any future changes in target performance expected?
How is target performance expected to change? Consider exogenous factors like those associated with the drivers under question F, and the asset’s role in climate change adaptation.
There are opportunities to address the problems faced in fisheries in the reforms to Common Fisheries Policy and Marine Strategy Framework Directive (MSFD) planned to be introduced in 2013 and by 2016 respectively. It remains to be seen whether intertidal habitats will be protected as part of these policies. The UK Government is reviewing the impact of physical barriers to fish passage. Subsequent legislative changes to fish passage could see some estuaries and their associated saltmarshes, becoming more accessible to sea bass and other fishes of commercial value in the future. The UK government is currently conducting a scientific assessment of the catch, effort and socio-economic aspects of shore-based and boat-based recreational angling around the UK coast, entitled ‘Sea-angling 2012’. This evidence will be used to determine whether national or international changes need to be made to the way recreational sea bass fishing is managed in the UK to improve the status of sea bass stocks. Once the national project is complete, the research is expected to be continued at a local level, through IFCAs. Following a recent decline in the sea bass spawning stock biomass in conjunction with an increase in bass landings in recent years, the UK Government is currently reviewing management options for sustainable sea bass commercial exploitation. Options include increasing the Minimum Landing Size of bass, and/or reducing fishing mortality through restrictions on fishing effort or landings. These options could be applied to the UK fleet or the European fleet as a whole. The decision depends in part on an assessment of the geographic extent and degree of mixing of the stocks, and on the ability of the UK to implement either approach without inadvertently causing an increase in incidental mortality of sea bass through increased discarding. In parallel, the UK government and European Commission is reviewing options to implement a discards ban to reduce incidental fishing mortality, under the EU Common Fisheries Policy. Any reductions in commercial and recreational fishing mortality in conjunction with protection of saltmarsh nursery habitats are likely to contribute to a recovery of the spawning stock biomass. In these cases, scenario analysis could be a very helpful tool to explore possible future changes.

UK NEAFO Work Package 1: Natural capital asset check – Annex 4: Case studies
eftec 125 November 2012
N. Can future target performance be defined?
What is the target level of future performance of the asset? What are the drivers of this (see question G).
The ‘performance’ of the natural capital asset can be defined by its production of the ‘flow’ of ES which in this case is the availability of nursery habitat in which fish mature over time. It is also intended to maintain the extent and condition of coastal saltmarsh for other ES such as pollution and flood control as well as recreational services, ceteris paribus (i.e. assuming that demands for these ES continue and that increasing provision of these ES does not impact the provision of other ES that aren’t related to this natural capital asset). It should be noted that the condition of coastal saltmarsh is not the only factor impacting the size of stocks, which naturally fluctuate in response to (intra- and inter-specific) competition, other factors in fish lifecycles and harvesting. Therefore while fish stocks may improve as a result of improved condition of the saltmarsh, fish stocks are not a good proxy for coastal saltmarsh condition. However, as noted previously, the fish stock itself forms part of the natural capital asset through supporting the future provision of ES (i.e. future fish stocks) and performance of this can be measured through assessments of the extent of stocks. As described above, an introduction of a Total Allowable Catch or an increase to the Minimum Landing Size of bass would reflect the condition of the stock, with higher TAC’s suggesting healthier stock levels as account is taken of the bio-economics of the stock.
There is no target for the ‘performance’ of coastal saltmarsh in the UK in terms of the extent or quality of the habitat that would be required to maintain fish stocks at commercially viable levels and avoid threshold effects, or to provide other services such as flood defence (which may be substitutable). However, the national BAP targets specify target performance as being no further net loss of extent of the vegetated part of the intertidal sediment ecosystems (coastal saltmarsh).
Notes:
Non-essential supporting information that can be useful for decision-makers includes:
- Has target performance changed over time? If so how?
- Distributional issues: what is the distribution of the beneficiaries of the goods supported by the ecosystem services from the asset?
- Do the goods provided by the ecosystem services from the asset have use and/or non-use values?
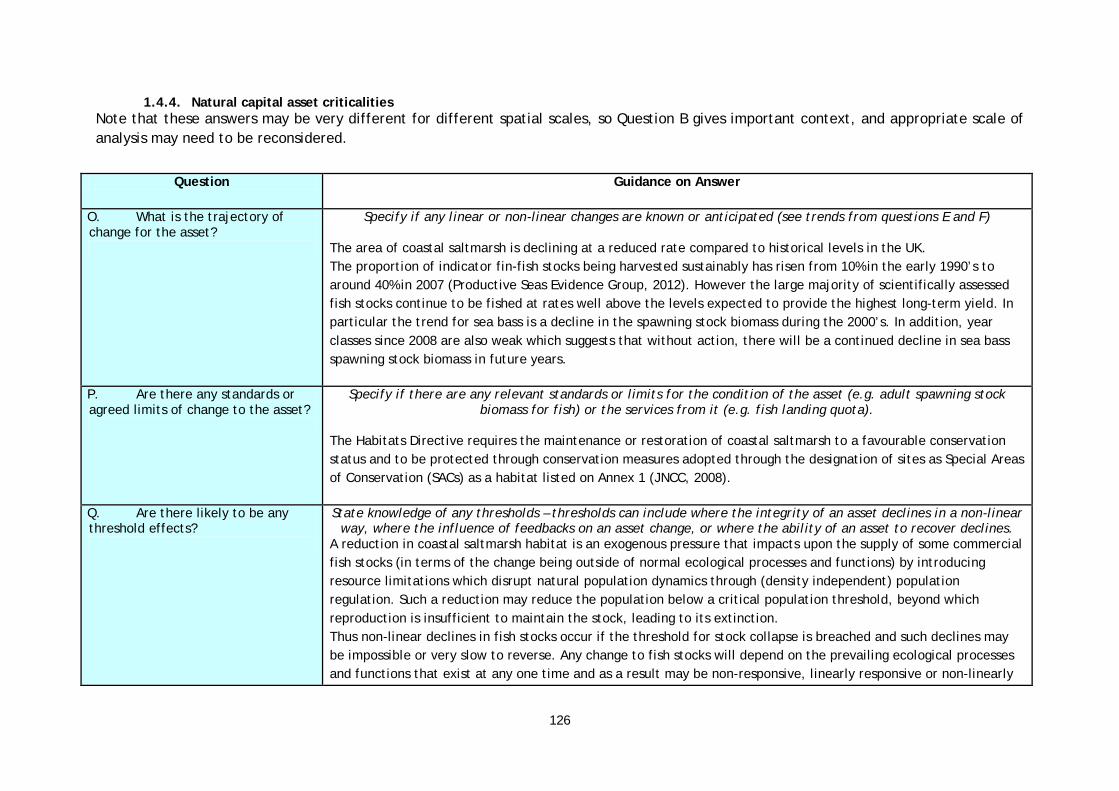
126
1.4.4. Natural capital asset criticalities Note that these answers may be very different for different spatial scales, so Question B gives important context, and appropriate scale of analysis may need to be reconsidered.
Question Guidance on Answer
O. What is the trajectory of change for the asset?
Specify if any linear or non-linear changes are known or anticipated (see trends from questions E and F) The area of coastal saltmarsh is declining at a reduced rate compared to historical levels in the UK. The proportion of indicator fin-fish stocks being harvested sustainably has risen from 10% in the early 1990’s to around 40% in 2007 (Productive Seas Evidence Group, 2012). However the large majority of scientifically assessed fish stocks continue to be fished at rates well above the levels expected to provide the highest long-term yield. In particular the trend for sea bass is a decline in the spawning stock biomass during the 2000’s. In addition, year classes since 2008 are also weak which suggests that without action, there will be a continued decline in sea bass spawning stock biomass in future years.
P. Are there any standards or agreed limits of change to the asset?
Specify if there are any relevant standards or limits for the condition of the asset (e.g. adult spawning stock biomass for fish) or the services from it (e.g. fish landing quota).
The Habitats Directive requires the maintenance or restoration of coastal saltmarsh to a favourable conservation status and to be protected through conservation measures adopted through the designation of sites as Special Areas of Conservation (SACs) as a habitat listed on Annex 1 (JNCC, 2008).
Q. Are there likely to be any threshold effects?
State knowledge of any thresholds – thresholds can include where the integrity of an asset declines in a non-linear way, where the influence of feedbacks on an asset change, or where the ability of an asset to recover declines.
A reduction in coastal saltmarsh habitat is an exogenous pressure that impacts upon the supply of some commercial fish stocks (in terms of the change being outside of normal ecological processes and functions) by introducing resource limitations which disrupt natural population dynamics through (density independent) population regulation. Such a reduction may reduce the population below a critical population threshold, beyond which reproduction is insufficient to maintain the stock, leading to its extinction. Thus non-linear declines in fish stocks occur if the threshold for stock collapse is breached and such declines may be impossible or very slow to reverse. Any change to fish stocks will depend on the prevailing ecological processes and functions that exist at any one time and as a result may be non-responsive, linearly responsive or non-linearly

UK NEAFO Work Package 1: Natural capital asset check – Annex 4: Case studies
eftec 127 November 2012
responsive to improvements in coastal saltmarsh habitat condition/extent. The probability of a fish stock collapse increases with increasing pressure on the supporting services that underlie the productivity of fish stocks, such as loss of nursery habitats (i.e. coastal saltmarsh) and other pressures such as over-harvesting which impact the size of the stock and therefore its ability to support future ES flows. Deegan et al (2012) identify threshold effects associated with nutrient loading of saltmarsh habitat. Saltmarsh is comprised of above-ground leaf biomass, below-ground biomass of bank-stabilizing roots, and microbial decomposition of organic matter. The loading of nutrients disrupts the habitats natural balance. As a result the geomorphic stability that exists is also disrupted and can lead to saltmarsh turning to un-vegetated mud. The impact of deteriorating coastal saltmarsh quality on the production of other services is unclear, in part because it depends on the alternative land use (the land previously defined as ‘coastal saltmarsh’ habitat may continue to exist in some form). Notwithstanding alternative land uses, the levels of flood hazard and pollution regulation services, and of biodiversity, may have thresholds associated with declines in saltmarsh. For example, as saltmarsh area diminishes the costs of engineered flood hazard regulation increase at an increasing rate (King and Lester, 1995). As saltmarsh is lost from within the Natura 2000 network of designated habitats, the capacity of that network to support viable populations of certain species may be lost. The impact on recreation is more ambiguous as the alternative land use is likely to provide at least some recreational value. It is likely that a decline in the condition of the saltmarsh will have deleterious consequences on the fish stock e.g. through a reduction in water temperature below a critical level; or through an increase in pollution above a critical level acting as a barrier to migration; or through a reduction in feeding and refuge areas. However there are still uncertainties around critical elements of recruitment to the adult stock. Therefore it is not currently possible to quantify the range of threshold effects beyond which the stock as a whole, might collapse.
R. What is the reversibility of changes to the asset?
Can changes to the asset be reversed? (e.g. can the asset, and its functions, be restored or recreated?) The (re)creation of coastal saltmarsh through managed realignment schemes is reasonably well understood (Nottage & Robertson 2005). The decline in the area of coastal saltmarsh is potentially reversible, although its full ecological value may not be restored (Mossman et al., 2012). In terms of the flood and pollution defence the ES are likely to be reversible on a like-for-like basis as the supporting services that produce them are not too complex. However, for biodiversity and fish stocks the supporting services are more complex, with ecological processes and functions interacting over time and being sensitive to changes in the dynamic balance of ecosystems which may take long periods to recover from. For example, Fonseca (2009) demonstrated that restored and ancient UK saltmarshes are both important feeding grounds for juvenile sea bass but that feeding patterns can be highly

128
spatially and temporally variable as sea bass are opportunistic feeders, limited only by their own gape size, prey availability and available feeding time. Fonseca (2009) concluded that during the period of fastest growth (summer) sea bass in their first year of life benefit greatly from feeding habitats with deep creeks and soft sediments, regardless of the age or restoration status of the site. In general, commercial fish stocks can potentially recover reasonably quickly from sub-optimal population levels, but there are thresholds beyond which recovery may be very slow or impossible (see section Q).
S. What is the cumulative effect of impacts on the asset?
What patterns of impacts result from past, current and future trends and drivers (see questions D, E and F)? Loss of coastal saltmarsh habitat, and therefore deterioration of its role in the ecological cycle that supports fisheries, has been accruing over several decades through the cumulative effects of land drainage for agriculture, coastal development and coastal squeeze caused by sea level rise. Effects on other parts of the ecological cycle that supports fisheries (e.g. from some fishing gears on sub-tidal benthic habitats, from pollution and from over-fishing that reduces adult stocks) create a cumulative pressure on fish stocks.
T. What risks are associated with current trends in the asset integrity?
Identify risks of significant detrimental impacts: see answers to questions N, and relate this to answers to questions P – S.
Demand exceeds supply for UK provisioning services from the natural capital asset that supports commercial fish stocks. For some commercial fish species the extent of coastal saltmarsh natural capital assets is a constraint on their supply. For most fish stocks increases in supply (i.e. fish catches/harvests) to meet demand cannot be sustained, and increase the risk of fish stock collapse.
U. What substitutes exist for the main ecosystem services from the asset?
For the services identified in G, are substitutes available? If so what supplies are available or potentially available?
Sea bass do not have to be caught in the UK, they can be imported. In addition, there are alternative fish species that don’t depend on coastal saltmarsh habitats for nursery grounds. These include farmed fish or non-migratory marine stocks. The extent to which these are deemed substitutes is a matter of consumer preference. There are man-made substitutes for flood hazard protection and the treatment of pollution through water treatment works although this is related to drinking water and does not relate to the impact of pollution on seawater and the associated ecological impacts. The cultural services supported by coastal saltmarsh through biodiversity and landscape values are non-substitutable at a local level, but there are substitutes at a national

UK NEAFO Work Package 1: Natural capital asset check – Annex 4: Case studies
eftec 129 November 2012
level.
Uncertainties
Give level of uncertainty* in analysis and reasons for this. * Use Uncertainty scale described in introduction.
Competing explanations (low agreement, albeit with significant evidence) – Scientific uncertainties remain surrounding sea bass stocks and their dependence on coastal saltmarsh habitats. Although an estimate exists of the extent of saltmarshes in England and Wales, it does not include a comprehensive review of the condition or quality of these habitats as fish nursery grounds. Also, although a quantitative estimate of juvenile bass abundance in Essex saltmarshes exists, this data is locally specific and may not be representative of all bass nursery grounds for the stock as a whole. At present the science is uncertain as to when limits in the ecological cycle that supports fisheries will be crossed and what the consequences will be.
Non-essential supporting information that can be useful for decision-makers includes:
- What is the level of investment needed in the natural capital to maintain it above the limits/thresholds identified above?
- What are the distributional (social group/intergenerational) implications of the criticality identified?
- For question T, define on what basis the substitute(s) are identified (e.g. which ecosystem services the substitute provides).

130
1.4.5. Natural capital asset check
Question Guidance on Answer
V. Tradeoffs?
If one or more of the asset’s key ecosystem services (see question D) are increased, does this lead to reductions in other services?
Managed realignment to increase the area of saltmarsh usually removes land from agricultural use. When this is the case, loss of crops or livestock may be of similar value to gains in fisheries productivity in the short term. Protecting the spawning stock biomass of sea bass to more sustainable levels may require reduced harvesting or more selective efforts, which may require short-term falls in fish consumption (assuming imports don’t compensate) and reduction in incomes for those dependent on fishing for their livelihood, in the short term.
W. Synergies?
If one or more of the asset’s key ecosystem services (see question D) are increased, does this lead to increases in other services?
An increase in coastal saltmarsh nursery grounds for sea bass is likely to have beneficial impacts to the ecosystem as a whole, by increasing food web stability and reducing vulnerability to perturbations. The regeneration of the sea bass stocks in the area may also improve the fishing quality for recreational sea anglers, bringing additional ES benefits. Improving the extent and condition of coastal saltmarsh may improve biodiversity which is known to have beneficial impacts on wider ecological processes and functions.
Uncertainties
Give level of uncertainty* in analysis and reasons for this. * Use Uncertainty scale described in introduction.
Speculative: the extent to which trade-offs and synergies exist between the condition of coastal saltmarsh, the ES it provides for and other ES is unclear.
X. Sustainability test: is the asset currently able to give the target performance?
Compare integrity in question I and performance in question L. As the extent of coastal saltmarsh declines in the UK, its input to productive fisheries is also declining. Coastal saltmarsh provide nursery grounds for juvenile bass, and as such may act as a limiting factor to the recruitment of the stock. With climate change, bass populations would be expected to increase in UK waters and it is likely that, in conjunction with overfishing, the availability of nursery habitats is now acting as a constraint on this increase in bass stocks. Loss of nursery habitat will continue this trend, with the threat of stock reductions. This trend has been slowing, but is likely to continue.

UK NEAFO Work Package 1: Natural capital asset check – Annex 4: Case studies
eftec 131 November 2012
Restricted habitat availability is therefore also constraining the ability of the UK’s environment and economy to adapt to climate change.
The implementation of the Habitats Directive and UK BAP targets through managed realignment is reducing the decline in coastal saltmarsh habitat. The majority of fish stocks are continuing to decline and to be harvested unsustainably.
If yes - will this performance be sustained into the future?
Relate changes from question O and criticalities from P and Q to future changes identified in questions M and N. Give timescale – from question C.
N/A
If no – state why?
Is this because target performance is unrealistic, or because integrity of asset is compromised, or both? The implementation of the Habitats Directive and UK BAP targets are intended to restore coastal saltmarsh habitat. A slowing in the decline of coastal saltmarsh is being seen through managed realignment. Revisions to the CFP and MSFD may also contribute to this objective if intertidal habitats are protected as part of these policies. However, declines in coastal saltmarsh habitat and sea bass spawning stock biomass continue, suggesting that more needs to be done to sustain the extent and condition of coastal saltmarsh. Issues around illegal, unreported and unregulated fishing also mean that amendments to the relevant byelaws may not deliver sustainable sea bass stock levels.
Y. Red flags? This is a warning if future target performance is at risk, for example because: - the asset is underperforming (see question X) and continuing to decline (see Question O), or
- there is prospect of collapse (a limit or threshold – see questions P and Q) which could be irrecoverable (i.e. being irreversible, see question R, and with no substitute, see question U)
The extent and condition of coastal saltmarsh continues to decline and the majority of commercial fish stocks continue to be overexploited meaning that there is a risk that suitable nursery grounds for fish stocks and mature fish may fail to coincide, leading to stock collapse. The declining trend suggests that the current fisheries exploitation and fish passage measures in place are not sufficient and pose a threat to the future of some commercial fish stocks in the UK. Whilst coastal saltmarsh can be recovered as shown by managed realignment, the complexity of ecological food webs and their exploitation patterns, means that the

132
reintroduction of the habitat may not lead to an immediate resurgence in fish stocks, if at all.
Uncertainties
Give level of uncertainty* in analysis and reasons for this. Use Uncertainty scale described in introduction.
Speculative: There is insufficient evidence on where the threshold ‘stock’ of coastal saltmarsh, below which the ‘flow’ of fish landings is impeded, actually is. A precautionary approach would be in line with the Habitats Directive objective that the maintenance and restoration of coastal saltmarsh is pursued.
1.4.6. Conclusions A summary of the asset check should reflect the uncertainties in the evidence available, conclusions on integrity and sustainability of the natural capital asset, and future sustainability of the asset is assessed in terms of whether it is expected to deliver the target performance, and the presence of red flags. Where these issues are quantified relevant data should be included.

UK NEAFO Work Package 1: Natural capital asset check – Annex 4: Case studies
eftec 133 November 2012
Summary of Saltmarsh-fisheries natural capital asset check
Asset Trends in natural asset integrity Target performance Criticalities Sustainability of performance
Red Flags
Coastal Saltmarsh
Habitat and the
supporting services
underlying commercial fish stocks
There is approximately 40,000ha of coastal saltmarsh in England and Wales (Environment Agency 2011). The extent of coastal saltmarsh is declining at a rate of around 100 ha/yr due to historical land claim from the sea, ongoing loss from coastal development and relative sea level rise, but has been slowed by managed realignment. The proportion of indicator fin-fish stocks being harvested sustainably was 10% 1990’s and around 40% in 2007. The 2012 ICES benchmark assessment of bass in the North Sea, English Channel, Celtic Sea and Irish Sea (ICES subareas IV & VII, excluding south and west Ireland) shows a recent decline in spawning stock biomass and increasing fishing mortality (F) during the 2000’s. Year classes since 2008 appear very weak, leading to an expectation of a continued decline in spawning stock biomass to the detriment of commercial and recreational fisheries. There is agreement over the continued loss in the extent of coastal saltmarsh in the UK, although there is uncertainty in recent data.
Coastal saltmarsh is a priority habitat under UK (UK BAP) and EU (Habitats Directive) conservation objectives. These require the maintenance or restoration of coastal saltmarsh to a favourable conservation status. Action is advocated by Natural England (2010) to ensure that ‘wherever possible the creation of upper coastal saltmarsh should be facilitated by, for example, managed realignments of flood defences which restore natural tidal processes and reduce coastal squeeze’. Assessments of the health of sea bass stocks will be reflected in biological assessments, future Spawning Stock Biomass estimates and landings estimates.
Coastal saltmarsh plays key role in development of juvenile fish. Currently supply of coastal saltmarsh habitat is potentially insufficient to support demand for fish stocks (i.e. it could be a limiting factor). Non-linear declines in fish stocks will occur if the threshold for stock collapse is breached and this may be irreversible. Deteriorating coastal saltmarsh quality has impacts on other ES (e.g. flood hazard regulation, biodiversity and recreation), but this is partly because it depends on alternative land uses.
As the extent of coastal saltmarsh declines in the UK, its input to productive fisheries declines. Coastal saltmarsh is already understood to be a limiting factor in the sustainability of some commercial fish stocks (e.g. bass). The implementation of the Habitats Directive and UK BAP targets is reducing the decline in coastal saltmarsh habitat through managed realignment. The majority of fish stocks are continuing to decline and to be harvested unsustainably.
The extent and condition of coastal saltmarsh continues to decline and the majority of commercial fish stocks continue to be overexploited. The declining trend in fish stocks suggests that the current measures in place are not sufficient and pose a threat to the future of some commercial fish stocks in the UK. The risk that the coincidence of suitable nursery grounds with sufficient spawning stock biomass may decline leading to stock collapse results in a RED FLAG. However uncertainties remain around the resilience of the stock to saltmarsh nursery ground collapse. Whilst coastal saltmarsh can be recovered through managed realignment, the complexity of ecological food webs means that reintroducing habitat may not lead to resurgence in fish stocks. The impact on other ES from deteriorating saltmarsh and therefore the need for ‘red flags’ in these areas is unclear.

134
1.4.7. References Arnason, R., Kelleher, K., & Willman, R. (2009) The Sunken Billions. The World Bank. Washington.
Attrill, M.J., Bilton, D.T., Rowden, A.A., Rundle, S.D. & Thomas, R.M. (1999) The impact of encroachment and bankside development on the habitat complexity and supralittoral invertebrate communities of the Thames Estuary foreshore. Aquatic Conservation – Marine and Freshwater Ecosystems 9, 237–247.
Beck, M.W., Heck, K.L., Able, K.W., Childers, D.L., Egglestone, D.B. Gillanders, B.M., Halpern, B., Hays, C.G., Hoshino, K., Minello, T.L., Orth, R.J., Sheridan, P.F., Weinstein, M. (2001) The identification, conservation and management of estuarine and marine nurseries for fish and invertebrates. Bioscience 51: 633-641.
Biodiversity Action Reporting System (2008) Available Online: http://ukbars.defra.gov.uk/archive/outcomes/targets_nationals_2008.asp?X=%7B5BCEED59-EFC5-4C33-90D2-87D9884F6AF6%7D&C=3&flipLang=&txtLogout= [Accessed 15/04/13]
Colclough, S., Fonseca, l., Astley, T., Thomas, K. & Watts, W. (2005) Fish Utilisation of Managed Realignments. Fisheries Management and Ecology 12, 1–10
Colclough, S., Fonseca, L., Watts, W. & Dixon, M. (2010) High tidal flats, salt marshes and managed realignments as habitats for fish. Paper to 12th International Waddensea Symposium. Environment Agency.
Defra (2012) Fish Stocks. Available Online: http://www.defra.gov.uk/environment/marine/cfp/fish-stocks/ [Accessed 08/12/12]
Deegan, L.A., Johnson, D. S., Warren, R. S., Peterson, B. J., Fleeger J. W., Fagherazzi, S. & Wollheim, W. M. (2012) Coastal eutrophication as a driver of salt marsh loss. Nature. 490
Drew Associates (2004) Research into the Economic Contribution of Sea Angling England and Wales For Economic and Statistics Division, DEFRA, March 2004
Elliott, M. & Hemingway K.L (2002) Fishes in Estuaries. Blackwell Science Oxford.
Elliott, M. & Taylor C.J.L. (1989) The Structure and Functioning of an Estuarine/marine Fish Community in the Forth estuary, Scotland. Proceedings of the 21st European Marine Biology Symposium, Gdansk, September 1986. Gdansk: Polish Academy of Sciences, Institute of Oceanology. pp. 227–240.
Environment Agency (2011) The extent of saltmarsh in England and Wales: 2006-2009. ISBN: 978-1-84911-233-8.
Esteves, L.S., 2013. Is managed realignment a sustainable long-term coastal management approach? In: Conley, D.C., Masselink, G., Russell, P.E. and O’Hare, T. J. (eds.), Proceedings 12th International Coastal Symposium (Plymouth,England), Journal of Coastal Research , Special Issue No. 65, pp. 933-938, ISSN 0749-0208
Fonseca, L. (2009) Fish utilisation of managed realignment areas and saltmarshes in the Blackwater Estuary, Essex, S. E. England. PhD thesis, Queen Mary University of London.
ICES. 2012. Report of the Inter-Benchmark Protocol on New Species (Turbot and Sea bass; IBPNew 2012) ICES CM 2012 / ACOM: 45.

UK NEAFO Work Package 1: Natural capital asset check – Annex 4: Case studies
eftec 135 November 2012
JNCC (2010) Council Directive 92/43/EEC on the Conservation of natural habitats and of wild fauna and flora. Available Online: http://jncc.defra.gov.uk/page-1374 [Accessed 08/12/12]
Jones, L. et al (2011) Coastal Margins In: The UK National Ecosystem Assessment Technical Report. UK National Ecosystem Assessment, UNEP-WCMC, Cambridge.
King, S. & Lester, J. (1995) The value of salt marsh as a sea defence. Marine Pollution Bulletin. 30 (3) pp 180–189
Lancaster J. (1991) The feeding ecology of juvenile bass Dicentrarchus labrax. PhD thesis. University of Wales.
Luisetti, T., Turner, K., Bateman, I., Morse-Jones, S., Adams, C., Fonseca, L. (2011) Coastal and marine ecosystem services valuation for policy and management: Managed realignment case studies in England. Ocean & Coastal Management. 54 (3) pp 212–224
McLusky, D.S., Bryant, D.M. & Elliott, M. (1992) The impact of land-claim on macrobenthos, fish and shorebirds on the Forth estuary, eastern Scotland. Aquatic Conservation: Marine and Freshwater Ecosystems 2, 211–222.
Mossman, H.L., A.J. Davy and A. Grant, (2012) Does managed coastal realignment create saltmarshes with ‘equivalent biological characteristics’ to natural reference sites? Journal of Applied Ecology. 49 (6) pp 1446–1456
Natural England (2010) Managing for species: Integrating the needs of England’s priority species into habitat management (NERR024). Available Online: http://publications.naturalengland.org.uk/publication/30025?category=65029 [Accessed 17/12/12]
Nottage, A. & Robertson, P. (2005) The Saltmarsh Creation Handbook: A Project Manager's Guide to the Creation of Saltmarsh and Intertidal Mudflat. RSPB, Sandy.
Pawson, M.G., Kupschus, S., Pickett, G.D. 2007 The status of sea bass (Dicentrarchus labrax) stocks around England and Wales, derived using a separable catch-at-age model, and implications for fisheries management. ICES Journal of Marine Science, 64: 346-356.
Pickett, G. D., Pawson, M.G. (1994) Sea Bass: Biology, Exploitation and Conservation. In: Pitcher TJ (ed) Chapman & Hall Fish and Fisheries Series. Chapman & Hall, London, pp 325.
Phelan, N., Shaw, A. & Baylis, A. (2009) The extent of Salt marsh in England and Wales: 2006–2009. Environment Agency. Peterborough.
Productive Seas Evidence Group (2012). Fisheries. Available Online: http://chartingprogress.defra.gov.uk/fisheries Accessed [09/01/2013]
Stevenson, J. (2001) The application of a production function model to estimate the indirect use value of salt marshes in Scotland: linkages to the fishing industry. MSc Thesis, Institute of Ecology and Resource Management, University of Edinburgh
UK BAP (1999) UK Biodiversity Group, Tranche 2 Action Plans, Maritime Species and Habitats. Available Online: http://jncc.defra.gov.uk/PDF/UKBAP_Tranche2-ActionPlans-Vol5-1999.pdf [Accessed 12/12/12]
UK Marine Monitoring and Assessment Strategy Community (UKMMAS) (2010). Charting Progress 5 Feeder report: Productive Seas. Published by Department for Environment Food and Rural Affairs on behalf of UKMMAS.
UK National Ecosystem Assessment (2011) The UK National Ecosystem Assessment. UNEP-WCMC, Cambridge.
Watts, B. (2012) Environment Agency, pers comm July 2012.

136
1.5. Urban green space asset check
1.5.1. Natural capital asset
Question Guidance on Answer
A. Define Natural Capital asset being checked
Specify natural capital asset, e.g. habitat type and/or ecosystem services (e.g. peat bogs, carbon sequestration in woodland, all carbon sequestration in habitats)
Natural capital assets can be defined as: ‘the configuration of living and/or non-living processes and functions over time and space, which produce through their existence and/or some combination of their functions, a positive economic or social value.’
The natural capital being checked is urban green space, including formal parks and gardens, sports fields, urban woods/forests/wetlands, undeveloped land and agricultural land at the urban fringe. Urban green space comprises land that is accessible or inaccessible to the public; and consists of the space itself and any vegetation on it.
B. What is the spatial scale for which the asset check is being conducted
UK, England/ Scotland/ Wales, Regional, County, Local? The spatial scale of the asset check attempts to be national but different aspects of the check are reported a different scales due to data limitations. The description of recreational use of urban green space (Question D; Appendix I) is for England. The description of current condition and trends in condition (Question F; Appendix II) is for England and analysed at the local authority level. The sustainability test (Question X; Appendix III) is performed for five cities (Aberdeen, Bristol, Glasgow, Norwich and Sheffield) and the analysis is performed at the postcode level.
C. Define the timescale for the asset check.
Take into account rate of change in asset, decision-making timescales, and timescales over which services from the asset can change. Past timescales should avoid reference to historical periods (>50 years) unless they are relevant to decision-making. Different timescales may be appropriate for different services from a natural
capital asset.
Current measures of the extent of urban green space and recreational use.

UK NEAFO Work Package 1: Natural capital asset check – Annex 4: Case studies
eftec 137 November 2012
D. What are the main ecosystem services the asset provides?
List main ecosystem services the asset provides (or contributes to providing)
Urban green space provides multiple ecosystem services:
• Space for outdoor recreation and relaxation (Kotchen and Powers, 2006; Smith et al., 2002)
• Space and habitat for wildlife (Harrison et al., 1995)
• Micro-climate stabilisation – e.g. cooling urban heat islands (Eliasson, 2000).
• Reduction of air and noise pollution
• Water retention
• Water purification
• Environmental education
• Local food production - in allotments, gardens and agricultural land.
• Improved health and well-being – lowering stress levels and providing opportunities for exercise (Henwood et al., 2001; Sallis et al., 2002; Francis et al., 2012; Pereira et al., 2012; Mitchell and Popham, 2008; Natural England, 2011).
• Non-use values (existence and bequest values) for the preservation of urban green space (Brander and Koetse, 2011).
The main ecosystem services provided by urban green space that are directly addressed in this asset check are recreation opportunities and visual aesthetic enjoyment. The case study focuses on these ecosystem services since they are relatively well understood and considered to be the most significant from an economic perspective (i.e., in terms of value). A description of recreational use of urban green space in England based on the Monitor of Engagement with the Natural Environment survey data is provided in Appendix I.
Recreational use of urban green space is non-rival up to a point but can become rival in cases of over-crowding.

138
Recreation and aesthetic enjoyment are non-market services for most urban green spaces – private and communally owned gardens are an exception. These two final ecosystem services (recreation and aesthetic enjoyment) generally do not rely on inputs from other forms of natural capital. There may be some interdependencies with other natural capital assets in the provision of ecosystem services, such as with water bodies in cases where urban green spaces are located alongside water bodies (e.g. rivers, canals, lakes).
Notes: It is useful to define these parameters for the analysis clearly at the outset. If a subset of a natural asset is being checked (e.g. peat bogs in Scotland are a subset of all peat bogs in the UK), then this can affect availability of data and interpretation of results. Our approach in the scoping study for Defra assumes that an asset needs to have some physical measurement, and defines natural capital assets as:
…stock that can be managed or protected in order to have a positive economic or social value. However, in further work looking at the definition of natural capital we have defined it as:
…the configuration of living and/or non-living processes and functions over time and space, that produce through their existence and/or some combination of their functions, a positive economic or social value.

UK NEAFO Work Package 1: Natural capital asset check – Annex 4: Case studies
eftec 139 November 2012
1.5.2. Integrity of natural capital asset
Question Guidance on Answer Trends
Past trend Current trend Future Trend Summary of Trends (see key*)
E. What is the extent of the natural capital asset?
Can be area, volume, number The total extent of urban green space in Great Britain is just under 290,000 ha (based on the Land Cover Map 2007). This comprises different broad habitat types but almost 70% of green open space is ‘improved grassland’, 16% is broadleaved woodland, and 9% is arable and horticulture. An overview of the habitat types of urban green space is provided in Appendix IV together with a map of urban green space in London.
Describe/ quantify trend
The available data does not support an analysis of past trends in the extent of green urban space due to changes in land use classifications in spatial data/maps
Describe/ quantify trend
No evidence
Describe expected future trend
No evidence
Insert symbol
O
F. What is the condition of the natural capital asset?
Can be measured through different ecological data, e.g. conservation status,
age structure, or proxies such as ecosystem processes
Quantitative information on the condition of urban green space with national coverage is not available. The available data distinguishes between different types of urban green space, which may to a limited extent indicate it’s suitability for different purposes. Condition can be defined along several dimensions reflecting the multiple services provided by green open space (see Green Flag Award criteria). Taking residents’ satisfaction with local
Describe/ quantify trend
In 2000, fewer than 44 per cent of green space managers perceived that the condition of urban green space in their local authority to be improving or stable; and more than 55 per cent considered green spaces to be declining in quality (NAO, 2006).
Describe/ quantify trend
In 2005, 16% of green space managers perceived the condition of urban green space in their local authority to be declining, 41% stable, and 43% improving (NAO, 2006).
Describe expected future trend
No evidence but likely to continue improving.
Insert symbol
↑

140
parks and green spaces as an indicator of condition, on average 73% of urban residents in England are ‘satisfied’ or ‘highly satisfied’ (NAO, 2006). In 2005, 80% of local authority green space managers considered the condition of green space in their local authority to be ‘fair’, 8% ‘good’, and 12% ‘poor’ (NAO, 2006)
Together, extent and condition reflect the integrity of the stock of natural capital, that produces flows of ecosystem services.
Uncertainties
Give level of uncertainty in analysis* for D, E and F, and reasons for this. * Use Uncertainty scale described in introduction.
D (ecosystem services provided by the asset): Well established: high agreement based on significant evidence. There is a large and well developed scientific literature that has identified and examined the provision of ecosystem services from urban green space. The understanding of some ecosystem services from urban green space is less well developed or characterised by lower consensus (e.g. health benefits). E (extent of the asset): Well established: high agreement based on significant evidence. There are high quality and high resolution land cover maps for the UK that include urban green space. Nationally collated data on distinct (administratively recognised) parcels of urban green space is, however, not available. This is available at the local authority level. F (condition of asset): Established but incomplete evidence: high agreement based on limited evidence. Quantitative information on the condition of urban green space with national coverage is not available. Evidence from qualitative surveys of residents and local authority green space managers is available (albeit somewhat out-dated).
Key for trends
↑ increasing ↓ decreasing
↔ evidence shows no trend O no evidence
↑↓ both increasing and decreasing (this could reflect ambiguous evidence and/or spatially differing trends)

UK NEAFO Work Package 1: Natural capital asset check – Annex 4: Case studies
eftec 141 November 2012
G. Drivers of changes in Extent and Condition
List policy drivers Note there may be different drivers of
changes in stock and condition
Policy drivers
Key national and local policies to enhance urban green space include: • Revised planning rules, (Planning Policy Guidance Note 17, July 2002)
calling upon local authorities to assess the existing and future needs of their communities for open space and to set local standards for the maintenance and adequate supply of facilities
• Establishment in 2003 of a separate unit within the Commission for
Architecture and the Built Environment – CABE Space to champion public spaces focussing initially on parks and green spaces
• Promotion of a Green Flag Award scheme to provide national
standards and encourage better green space management • Introduction in July 2004 of a new Public Service Agreement (number
8) requiring the delivery of cleaner, safer and greener public spaces in deprived communities and across the country with measurable improvement by 2008
• The Biodiversity Action Plan process, arising from the UK Biodiversity
Action Plan (1995), aims to deliver conservation objectives at the local level through a framework of local BAP partnerships, in which local authorities should be key players.
• Local sustainable community strategy targets
See English Nature (2003); NAO (2006); and Natural England (2010).
List biophysical drivers Biophysical Drivers
No biophysical drivers identified.

142
List socio-economic & other drivers Socio-economic & other drivers
Demand for alternative land uses in urban areas, particularly residential development.
H. What are the asset’s main ecosystem functions?
List important ecosystem functions (or supporting and intermediate ecosystem services) that support the main final services from the asset. Supporting and intermediate services are defined in the UKNEA.
Note that supporting and intermediate services may originate from other assets that co-produce final services.
• Water flow control • Habitat for plants and animals • Micro-climate stabilisation • Air filtration • Noise dampening
I. Integrity Test: Is the ability of the asset to support ecosystem services being maintained?
Give details for different services (if relevant), consider the trends under questions E and F and the services from question D.
If no, what are drivers of decline (see question G)?
Broadly at a national level the ability of the asset to support ecosystem services is maintained. At specific locations where there is a limited extent of urban green space and declining quality this is not the case.
Notes: Non-essential supporting information that can be useful for decision-makers includes:
- are the ecosystem services provided by the asset rival or non-rival goods?
- are the ecosystem services provided by the asset market or non-market goods?
- Some main final services may rely on supporting and intermediate services from natural capital assets not considered in the asset check. Links to the status of these other assets may be an important factor for the asset check. It may be possible to consider their status/trend/management within the asset check, but where the links become complex, such analysis may not be feasible. However, these interdependencies should be noted; furthermore the natural capital underpinning the final services in question may justify a separate asset check.
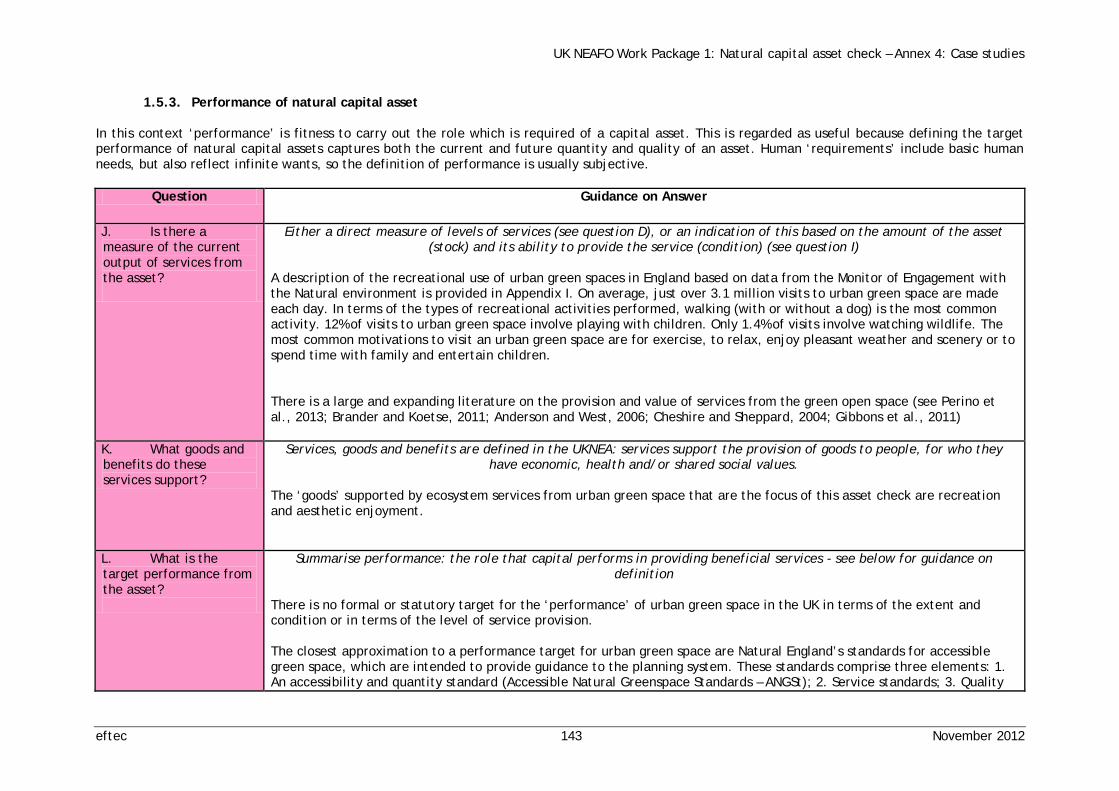
UK NEAFO Work Package 1: Natural capital asset check – Annex 4: Case studies
eftec 143 November 2012
1.5.3. Performance of natural capital asset In this context ‘performance’ is fitness to carry out the role which is required of a capital asset. This is regarded as useful because defining the target performance of natural capital assets captures both the current and future quantity and quality of an asset. Human ‘requirements’ include basic human needs, but also reflect infinite wants, so the definition of performance is usually subjective.
Question Guidance on Answer
J. Is there a measure of the current output of services from the asset?
Either a direct measure of levels of services (see question D), or an indication of this based on the amount of the asset (stock) and its ability to provide the service (condition) (see question I)
A description of the recreational use of urban green spaces in England based on data from the Monitor of Engagement with the Natural environment is provided in Appendix I. On average, just over 3.1 million visits to urban green space are made each day. In terms of the types of recreational activities performed, walking (with or without a dog) is the most common activity. 12% of visits to urban green space involve playing with children. Only 1.4% of visits involve watching wildlife. The most common motivations to visit an urban green space are for exercise, to relax, enjoy pleasant weather and scenery or to spend time with family and entertain children. There is a large and expanding literature on the provision and value of services from the green open space (see Perino et al., 2013; Brander and Koetse, 2011; Anderson and West, 2006; Cheshire and Sheppard, 2004; Gibbons et al., 2011)
K. What goods and benefits do these services support?
Services, goods and benefits are defined in the UKNEA: services support the provision of goods to people, for who they have economic, health and/or shared social values.
The ‘goods’ supported by ecosystem services from urban green space that are the focus of this asset check are recreation and aesthetic enjoyment.
L. What is the target performance from the asset?
Summarise performance: the role that capital performs in providing beneficial services - see below for guidance on definition
There is no formal or statutory target for the ‘performance’ of urban green space in the UK in terms of the extent and condition or in terms of the level of service provision. The closest approximation to a performance target for urban green space are Natural England’s standards for accessible green space, which are intended to provide guidance to the planning system. These standards comprise three elements: 1. An accessibility and quantity standard (Accessible Natural Greenspace Standards – ANGSt); 2. Service standards; 3. Quality

144
standard (Green Flag Award scheme). These are described separately below. See Natural England (2010) for further detail.
1. Accessible Natural Greenspace Standards (ANGSt):
• That no person should live more than 300m from their nearest area of natural greenspace of at least 2ha in size; • Provision of at least 1ha of Local Nature Reserve per 1,000 population; • That there should be at least one accessible 20ha site within 2km from home; • That there should be one accessible 100ha site within 5km; • That there should be one accessible 500ha site within 10km.
2. Service standards. Natural England has developed visitor service standards for three distinct types of natural green
space (National Nature Reserves; Country Parks; Local Nature Reserves). These service standards cover a range of core facilities and services that visitors should expect to find at each site type. It may be possible to adapt these service standards to apply to other forms of green space but they were not developed for urban green space.
3. Green Flag quality and management criteria. The Green Flag criteria can be used to set the overall quality standard for
all parks and green spaces within an area, town, city or region. The criteria include:
• A welcoming place – The overall impressions for any member of the community approaching and entering the park or green space should be positive and inviting, regardless of the purpose for which they are visiting.
• Healthy, safe, and secure – The park or green space must be a healthy, safe and secure place for all members of the community to use. Relevant issues must be addressed in management plans and implemented on the ground. New issues that arise must be addressed promptly and appropriately.
• Clean and well maintained – For aesthetic as well as health and safety reasons, issues of cleanliness and maintenance must be adequately addressed.
• Sustainability – Methods used in maintaining the park or green space and its facilities should be environmentally sound, relying on best practices available according to current knowledge. Management should be aware of the range of techniques available to them, and demonstrate that informed choices have been made and are regularly reviewed.
• Conservation and heritage – Particular attention should be paid to the conservation and appropriate management of natural features, flora and fauna, landscape features, and buildings and structural features.
• Community involvement – Management should actively pursue the involvement of members of the community who represent as many park or greenspace user groups as possible.
• Marketing – There should be a marketing strategy in place that promotes the usage of green space and natural areas, demonstrating the benefits and explaining how to get to the most significant areas. This will need to be regularly reviewed.
• Management – A Green Flag Award application must have a management plan or strategy in place that reflects the aspirations of Local Agenda 21, and clearly and adequately addresses all the above criteria and any other
UK NEAFO Work Package 1: Natural capital asset check – Annex 4: Case studies
eftec 145 November 2012
relevant aspects of the park or green space’s management. The plan must be actively implemented and regularly reviewed. Financially sound management of the park or green space must also be demonstrated.
Uncertainties
Give level of uncertainty* in answer to L and reasons for this. * Use Uncertainty scale described in introduction.
L (Target performance): Competing explanations: low agreement, albeit with significant evidence.
Defining performance: Answering these questions can help define performance, but not all questions can be answered for all assets
What policy targets are there for the asset?
(e.g. maximum sustainable yield for fish stocks, global concentrations of GHG)
There are no quantitative policy targets for either the asset (extent and condition) or ecosystem services provided. Recognition of role of the asset in providing services is explicit in Government policy documents but no explicit quantitative performance standard is defined.
What is the trend in the main services the asset provides?
See question d for services, and UKNEA synthesis report Figure 5 for trends.
No data to assess trend in services provided by the asset. MENE data provides information on public engagement with the natural environment in England but this survey has only been running since 2009. MENE provides information on service provision but has limited information on the underlying assets (green space extent and condition).
What types of goods are supported by the asset?
(e.g. food, drinking water, pollution control) See UKNEA synthesis report Figure 10 for terminology
The ‘goods’ supported by urban green space that are the focus of this asset check are recreation and aesthetic enjoyment.
Who benefits from the goods?
Identify the number and location of beneficiaries
Regarding the demographics of recreationists at urban green spaces, to a small degree, visitors to urban green spaces tend to be younger, of lower social grade and from larger households than the general population. More detail is provided in Appendix I. Beneficiaries of the goods provided by urban open space are urban residents that live in close proximity to the asset. There is an expanding evidence base that shows that the use of urban open space and associated benefits falls rapidly with distance (Cheshire and Sheppard, 2004; Gibbons et al., 2011; Appendix I).
146
What wellbeing results from the goods?
Use measures of the levels and trends in wellbeing supported by the asset
Estimates of the wellbeing derived from the goods supported by urban green space (or more precisely the changes in wellbeing resulting from alternative scenarios for change in the asset) are available in Perino et al. (2013).
M. Are any future changes in target performance expected?
How is target performance expected to change? Consider exogenous factors like those associated with the drivers under question F, and the asset’s role in climate change adaptation.
No
N. Can future target performance be defined?
What is the target level of future performance of the asset? What are the drivers of this (see question G).
There is no formal or statutory target for the ‘performance’ of urban green space in the UK in terms of the extent and condition or in terms of the level of service provision.
Notes:
Non-essential supporting information that can be useful for decision-makers includes:
- Has target performance changed over time? If so how?
- Distributional issues: what is the distribution of the beneficiaries of the goods supported by the ecosystem services from the asset?
- Do the goods provided by the ecosystem services from the asset have use and/or non-use values?

UK NEAFO Work Package 1: Natural capital asset check – Annex 4: Case studies
eftec 147 November 2012
1.5.4. Natural capital asset criticalities
Note that these answers may be very different for different spatial scales, so Question B gives important context, and appropriate scale of analysis may need to be reconsidered.
Question Guidance on Answer
O. What is the trajectory of change for the asset?
Specify if any linear or non-linear changes are known or anticipated (see trends from questions E and F)
The extent of the asset is generally stable. The condition of the asset is generally stable or improving. Any changes are linear.
P. Are there any standards or agreed limits of change to the asset?
Specify if there are any relevant standards or limits for the condition of the asset (e.g. adult spawning stock biomass for fish) or the services from it (e.g. fish landing quota).
There are a number of proposed standards (non-statutory) that aim to influence the planning system, which at the local authority level determines the extent of changes to the asset.
Q. Are there likely to be any threshold effects?
State knowledge of any thresholds – thresholds can include where the integrity of an asset declines in a non-linear way, where the influence of feedbacks on an asset change, or where the ability of an asset to recover declines.
There is evidence that the use of services and associated value of services from urban green space decline rapidly and in a non-linear way with distance between the asset and its beneficiaries. (Cheshire and Sheppard, 2004; Gibbons et al., 2011; Appendix I). A similar effect is observed with other determinants of accessibility (e.g. restricted access, crime etc.) The relationship between the extent of the asset and the provision of services, however, is generally observed to be linear (i.e. value of services declines with extent but in a linear way – no thresholds in extent have been observed or quantified). There is limited information on the nature of the relationship between the condition of urban green space and the provision and value of services.
R. What is the reversibility of changes to the asset?
Can changes to the asset be reversed? (e.g. can the asset, and its functions, be restored or recreated?)
Changes to the asset (both in terms of extent and condition) are technically reversible (see Landscape Institute (2011) for examples of creation of new urban green spaces). In practice, however, it is only over the long run that land that has been converted to residential, commercial or industrial uses is converted to urban green space.
S. What is the cumulative effect of impacts on the asset?
What patterns of impacts result from past, current and future trends and drivers (see questions D, E and F)?
It is likely that in general the extent of urban green space will remain stable and that the condition will improve.

148
At local scales this pattern may be different.
T. What risks are associated with current trends in the asset integrity?
Identify risks of significant detrimental impacts: see answers to questions N, and relate this to answers to questions P – S.
The provision of services from urban green space is highly localised (use and values drop rapidly with distance). Therefore there may be high local risks with the loss of local urban green spaces. At the national scale, or even city scale, this is not the case. At local scales (which is the scale at which the asset delivers services) there is a high degree of variation in the extent and condition of the asset. There is a risk that the generally improving national condition of the asset masks the need to address specific local problems with the integrity of the asset.
U. What substitutes exist for the main ecosystem services from the asset?
For the services identified in G, are substitutes available? If so what supplies are available or potentially available?
Substitutes for green open space include private gardens, gyms, countryside and natural areas in rural landscapes. These are all likely to have low substitutability (low elasticities of substitution) and not provide an equivalent level or breadth of services.
Uncertainties
Give level of uncertainty* in analysis and reasons for this. * Use Uncertainty scale described in introduction.
Competing explanations: low agreement, albeit with significant evidence
Non-essential supporting information that can be useful for decision-makers includes:
- What is the level of investment needed in the natural capital to maintain it above the limits/thresholds identified above?
- What are the distributional (social group/intergenerational) implications of the criticality identified?
- For question T, define on what basis the substitute(s) are identified (e.g. which ecosystem services the substitute provides).

UK NEAFO Work Package 1: Natural capital asset check – Annex 4: Case studies
eftec 149 November 2012
1.5.5. Natural capital asset check
Question Guidance on Answer
V. Tradeoffs?
If one or more of the asset’s key ecosystem services (see question D) are increased, does this lead to reductions in other services?
There are possible trade-offs between cultural services (recreation) and regulating/supporting services (habitat for biodiversity, water flow regulation) since the former can functionally disturb the latter.
W. Synergies?
If one or more of the asset’s key ecosystem services (see question D) are increased, does this lead to increases in other services?
Increases in the extent and condition of green urban space will lead to increases in multiple ecosystem services. It is not necessarily the case that increases in one ecosystem service will have any positive functional effect on others.
Uncertainties
Give level of uncertainty* in analysis and reasons for this. * Use Uncertainty scale described in introduction.
Established but incomplete evidence: high agreement based on limited evidence
X. Sustainability test: is the asset currently able to give the target performance?
Compare integrity in question I and performance in question L.
Taking the ANGSt standard as the target performance, the asset is currently not able to meet this target performance. The first three ANGSt criteria were tested using spatial data on the extent and location of green urban space for five cities (Aberdeen, Bristol, Glasgow, Norwich and Sheffield). For these cities, which are considered to be representative of Great Britain (Perino et al, 2013), criterion 1 (at least one 2 ha patch of green space within 300 m) is met for between 30-48% of households; all cities meet criterion 2 with between 2.06-4.03 hectares of green space per 1,000 of population; and criterion 3 (at least one 20 ha patch of green space within 2 km) is met for between 68-91% of households. A full explanation of this analysis and results are provided in Appendix III.
If yes - will this performance be sustained into the future?
Relate changes from question O and criticalities from P and Q to future changes identified in questions M and N. Give timescale – from question C.
If no – state why?
Is this because target performance is unrealistic, or because integrity of asset is compromised, or both? The asset fails this sustainability test partly because the performance target (ANGSt standard) is hard to achieve. Nevertheless, the particularly poor result for ANGSt standard 1 does indicate that a high proportion of households do not have access to even a relatively small area of green space at close proximity to their homes.
150
This indicates a problem in terms of the spatial distribution of green space.
Y. Red flags? This is a warning if future target performance is at risk, for example because: - the asset is underperforming (see question X) and continuing to decline (see Question O), or
- there is prospect of collapse (a limit or threshold – see questions P and Q) which could be irrecoverable (i.e. being irreversible, see question R, and with no substitute, see question U)
No prospect of general collapse but the provision of services is highly localised. At local scales the asset may be highly under-provided.
Uncertainties
Give level of uncertainty* in analysis and reasons for this. Use Uncertainty scale described in introduction.
Established but incomplete evidence: high agreement based on limited evidence

UK NEAFO Work Package 1: Natural capital asset check – Annex 4: Case studies
eftec 151 November 2012
1.5.6. Conclusions
Summary of Urban Green Space natural capital asset check
Asset Trends in natural asset integrity
Target performance Criticalities Sustainability of performance Red Flags
Urban green space, including formal parks and gardens, sports fields, urban woods/forests/wetlands, undeveloped land and agricultural land at the urban fringe. The scale of reporting is national. The scale of analysis is variable depending on data.
Broadly at a national level the ability of the asset to support ecosystem services is maintained or improved. At specific locations where there is a limited extent of urban green space and declining condition this is not the case.
The closest approximation to a performance target for urban green space are Natural England’s standards for accessible green space, which are intended to provide guidance to the planning system. These standards comprise three elements: 1. An accessibility and quantity standard (Accessible Natural Greenspace Standards – ANGSt); 2. Service standards; 3. Quality standard (Green Flag Award scheme).
There is evidence that the use of services from urban green space declines rapidly and in a non-linear way with distance between the asset and its beneficiaries. This has important implications for the spatial allocation and performance of the asset. At local scales (which is the scale at which the asset delivers services) there is a high degree of variation in the extent and condition of the asset. There is a risk that the generally improving national condition of the asset masks the need to address specific local problems with the integrity of the asset.
Taking the ANGSt standard as the target performance, the asset is currently not able to meet this target performance. The first three ANGSt criteria were tested using spatial data on the extent and location of green urban space for five cities (Aberdeen, Bristol, Glasgow, Norwich and Sheffield). For these cities, which are considered to be representative of Great Britain (Perino et al, 2013), criterion 1 (at least one 2 ha patch of green space within 300 m) is met for between 30-48% of households; all cities meet criterion 2 with between 2.06-4.03 hectares of green space per 1,000 population; and criterion 3 (at least one 20 ha patch of green space within 2 km) is met for between 68-91% of households.
No prospect of general collapse but the provision of services is highly localised. At local scales the asset may be highly under-provided.

152
1.5.7. References Anderson, S.T. and West, S.E. (2006). Open space, residential property values, and spatial context.
Regional Science and Urban Economics, 36, 773-789.
Brander, L.M. and Koetse, M.J. (2011). The value of urban open space: meta-analyses of contingent valuation and hedonic pricing results. Journal of Environmental Management, 92: 2763-2773.
Cheshire, P. and Sheppard, S. (2004). Capitalising the Value of Free Schools: The Impact of Supply Characteristics and Uncertainty. Economic Journal, 114, F397-424
Eliasson, I., (2000). The use of climate knowledge in urban planning. Landscape and Urban Planning, 48: 31-44.
Francis, J., Wood, L.J., Knuiman, M., and Giles-Corti, B. (2012). Quality or quantity? Exploring the relationship between public open space attributes and mental health in Perth, Western Australia. Social Science & Medicine. 74: 1570-1577.
Gibbons, S., Mourato, S., and Resende, G. (2011). The Amenity Value of English Nature : A Hedonic Price Approach. SERC DP 0074: LSE.
Handley, J., Pauleit, S., Slinn, P., Barber, A., Baker, M., Jones, C. and Lindley, S. (2003). Accessible Natural Green Space Standards in Towns and Cities: A Review and Toolkit for their Implementation. English Nature Research Reports No. 526
Harrison, C. Burgess, J., Millward, A. and Dawe, G. (1995). Accessible natural greenspace in towns and cities: A review of appropriate size and distance criteria. Guidance for the preparation of strategies for local sustainability. English Nature Research Reports No. 153.
Henwood, K., (2001). Exploring linkages between the environment and health: is there a role for environmental and countryside agencies in promoting benefits to health? A Report for the Forestry Commission, University of East Anglia, Norwich.
Kotchen, M.J., Powers, S.M., 2006. Explaining the Appearance and Success of Voter Referenda for Open-Space Conservation. Journal of Environmental Economics and Management. 52, 373–390.
Landscape Institute (2011). Local green infrastructure: Helping communities make the most of their landscape.
Mitchell, R. and Popham, F., (2008). Effect of exposure to natural environment on health inequalities: an observational population study. The Lancet, 372: 1655-1660.
National Audit Office (2006). Enhancing green open space. Report by the Comptroller and Auditor General.
Natural England (2010). ‘Nature nearby’: Accessible natural greenspace guidance.
Natural England (2011). Green space access, green space use, physical activity and overweight. Natural England Commissioned Report NECR067.
Pereira, G., Foster, S., Martin, K., Christian, H., Boruff, B., Knuiman, M., Giles-Corti, B. (2012). The association between neighbourhood greenness and cardiovascular disease: an observational study. BMC Public Health. DOI: 10.1186/1471-2458-12-466.
Perino, G., Andrews, B., Kontoleon A. and Bateman, I. (2013). The value of urban green space in Britain: a methodological framework for spatially referenced benefit transfer. Environmental and Resource Economics.
Sallis, J.F., Kraft, K., and Linton, L.S. (2002). How the environment shapes physical activity: A trans-disciplinary research agenda. American Journal of Preventive Medicine, 22, 208.
Smith, V.K., Poulos, C., Kim, H., 2002. Treating Open Space as an Urban Amenity. Resource and Energy Economics. 24, 107–129.

UK NEAFO Work Package 1: Natural capital asset check – Annex 4: Case studies
eftec 153
1.5.8. Appendix Appendix I. Recreational use of urban green space: Analysis of the Monitor of Engagement in the Natural Environment (MENE) data 2009-2012 This Appendix describes the recreational use of urban green space in England. The analysis uses data from the Monitor of Engagement in the Natural Environment (MENE) survey for the period 2009-2012. MENE is a TNS administered survey commissioned by Natural England, Defra and the Forestry Commission to: 1. understand how people use, enjoy and are motivated to protect the natural environment; 2. provide data that monitors changes in use and enjoyment of the natural environment over time, at a range of different spatial scales and for key groups within the population.9
The focus of this analysis is on visits to the natural environment10 that include urban green spaces. It should be noted that the recreational visits described in this analysis may also include other types of natural environment, i.e. they are not necessarily visits exclusively to urban green space.
The average number of visits to the natural environment in England is just over 8 million per day. This includes all types of visit activities, locations and durations. On average, just over 3.1 million visits to urban green space are made each day. Figure 1 shows the types of activities that are undertaken on visits to urban green space. Walking, with or without a dog, is the most common activity. 12% of visits to urban green space involve playing with children. Only 1.4% of visits involve watching wildlife.
Figure 2 shows the various motivations indicated for making a visit to urban green space. The most common motivations are for exercise (with or without a dog), to relax, enjoy pleasant weather and scenery or to spend time with family and entertain children.
Regarding the distances that people travel to access a natural environment recreation location that includes urban green space, almost 50% of visits are within one mile of home and almost 75% are within two miles of home. Figure 3 shows the proportion of visits to sites at varying distance from place of residence. There is evidence of a strong “distance decay” effect, whereby visitation rates to urban green space drop rapidly with distance from place of residence. This implies that urban green spaces that are proximate to, or contained within, residential centres receive substantially more visits than relatively distant green spaces (e.g. green space at the urban fringe).
Figure 4 shows the average expenditure per visit to an urban green space. By far the largest category of expenditure is food and drink. Figure 5 shows total daily expenditure during visits to a river, lake or canal. The total across all categories of expenditure is just over £ 18 million per day.
Regarding the demographics of recreationists at urban green spaces, Figures 6-8 show the characteristics (age, social grade, and household size) of visitors in comparison to the characteristics of the population as a whole. To a small degree, visitors to urban green spaces tend to be younger, of lower social grade and from larger households.
9 Documentation and data for the Monitor of Engagement in the Natural Environment can be found at: http://www.naturalengland.org.uk/ourwork/research/mene.aspx 10 For the purposes of the MENE survey the natural environment is defined as the green open spaces in and around towns and cities, as well as the wider countryside and coastline.
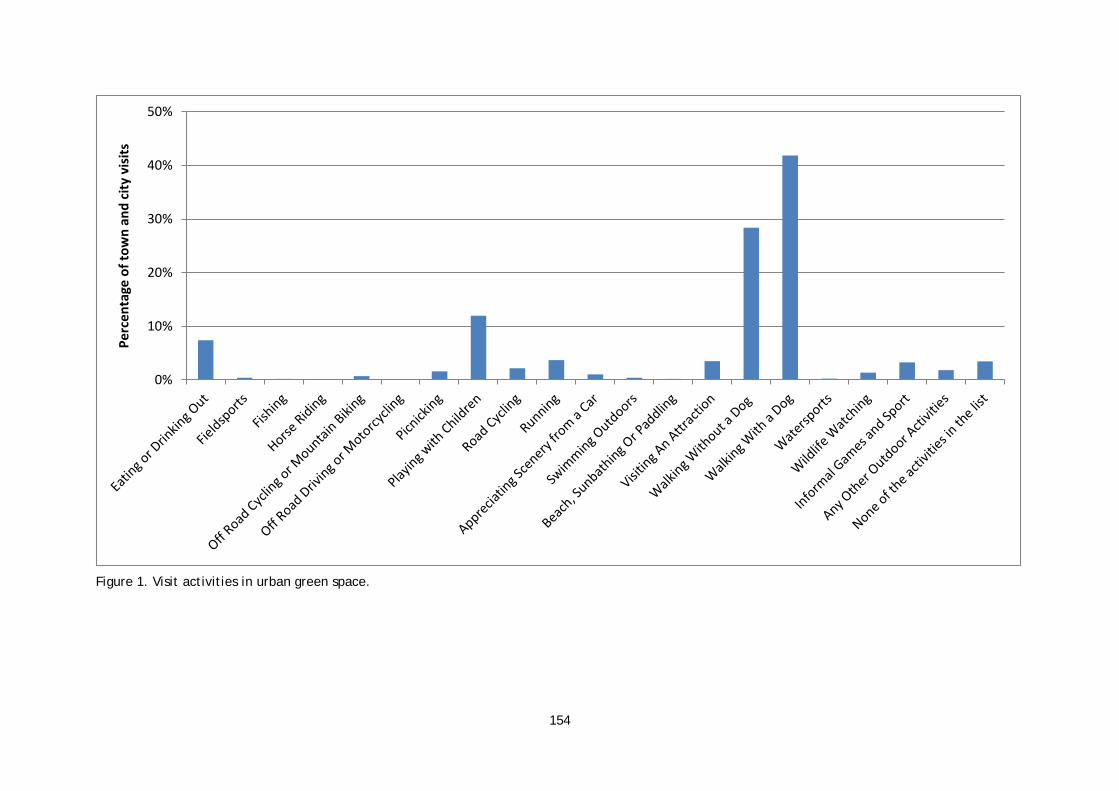
154
Figure 1. Visit activities in urban green space.
0%
10%
20%
30%
40%
50%Pe
rcen
tage
of t
own
and
city
vis
its

UK NEAFO Work Package 1: Natural capital asset check – Annex 4: Case studies
eftec 155 November 2012
Figure 2. Motivations for visits to urban green space
0%
10%
20%
30%
40%
50%Pe
rcen
tage
of t
own
and
city
vis
its

156
Figure 3. Distance from home to visit locations at urban green space
0%
10%
20%
30%
40%
50%
60%
Less than1 mile
1 or 2miles
3 to 5miles
6 to 10miles
11 to 20miles
21 to 40miles
41 to 60miles
61 to 80miles
81 to 100miles
More than100 miles
Perc
enta
ge o
f tow
n an
d ci
ty v
isits

UK NEAFO Work Package 1: Natural capital asset check – Annex 4: Case studies
eftec 157 October 2012
Figure 4. Average expenditure during visits to urban green space
Figure 5. Total daily expenditure during visits to urban green space
0.00
0.50
1.00
1.50
2.00
2.50
3.00
3.50
4.00
Aver
age
expe
nditu
re p
er v
isit
(£)
0
2,000,000
4,000,000
6,000,000
8,000,000
10,000,000
12,000,000
Tota
l exp
endi
ture
per
vis
it (£
)

158
Figure 6. Proportion of visitors to urban green space by age group
Figure 7. Proportion of visitors to urban green space by social grade
0
5
10
15
20
25
16-24 25-34 35-44 45-54 55-64 65+
%
Age Group
Visitors to urbangreen space
Population
0
5
10
15
20
25
30
35
AB C1 C2 DE
%
Social Grade
Visitors to urbangreen space
Population

UK NEAFO Work Package 1: Natural capital asset check – Annex 4: Case studies
eftec 159 October 2012
Figure 8. Proportion of visitors to urban green space by household size.
0
5
10
15
20
25
30
35
40
1 2 3 4 5+
%
Household size
Visitors to urbangreen space
Population

160
Appendix II. Satisfaction and trends in quality of urban green space
This Appendix describes the perception of the quality of local green space by residents of urban local authorities; and the perception of green space condition and trend in condition by local authority green space managers. The analysis is based on data from the National Audit Office survey of local authorities (National Audit Office, 2006). The survey of residents’ satisfaction was conducted in 2003-2004 and covers 150 urban local authorities in England. The survey of local authority green space managers was conducted in 2005 and covers 89 urban local authorities in England. The summary of residents’ satisfaction with their local parks and green spaces (Table 1) shows that the average level of satisfaction is reasonably high (72% are satisfied or highly satisfied). There is, however, substantial variation in the degree of satisfaction with a low of 53% in Bristol and a high of 92% in Cambridge. The perception of the condition of green space by local authority green space managers in 2005 is predominantly ‘fair’, with only 12% considered ‘poor’ and 8% considered ‘good’ (see Table 2). Interestingly there doesn’t appear to be a close correspondence between residents’ satisfaction and green space managers’ perceptions of condition. Regarding the perception of the trends in condition by local authority green space managers, the view is generally optimistic with 43% and 41% seeing improving or stable condition respectively. Only 16% of managers see declining condition (see Table 3). Table 1. Percentage of residents who were 'satisfied' or 'very satisfied' with their local parks and green spaces
Percentage of residents
Mean 72 Min 53 Max 92
Table 2. Perception of condition of green space by local authority green space managers
Green space condition Percentage of green space managers
Poor 12% Fair 80% Good 8%
Table 3. Perception of trend in condition of green space by local authority green space managers
Trend in green space condition Percentage of green space managers
Declining 16% Stable 41% Improving 43%

UK NEAFO Work Package 1: Natural capital asset check – Annex 4: Case studies
eftec 161 October 2012
Appendix III. Sustainability test: Does urban green space meet the ANGSt standards? This Appendix describes the “sustainability test” for urban green space as a natural capital asset. The test is of whether the asset is currently able to give the target performance (see question X in the Natural Capital Asset Check). The text below explains the target performance to be tested, the data, analysis and results of the test.
Performance standard The performance standard to be tested is the Accessible Natural Greenspace Standards (ANGSt) model developed by English Nature (now part of Natural England - an executive non-departmental public body responsible to Defra). The ANGSt standards are defined in terms of minimum distances from place of residence to natural green spaces of various size; and in terms of minimum area of green space per city resident. The ANGSt standards are:
1. That no person should live more than 300 m from their nearest area of natural green space of at least 2 ha in size;
2. Provision of at least 1 ha of Local Nature Reserve per 1,000 population;
3. That there should be at least one accessible 20 ha site within 2 km from home;
4. That there should be one accessible 100 ha site within 5 km;
5. That there should be one accessible 500 ha site within 10 km.
These standards are based on the recognition of the role of urban natural green spaces in supporting biodiversity and providing social benefits. A review of appropriate size and distance criteria for accessible natural green space in towns and cities, which serves as a basis for the ANGSt standards, is provided in Harrison et al. (1995). A review of the scientific context of the ANGSt standards and their implementation is provided by Handley et al. (2003). The analysis described in this note tests the first three ANGSt standards. Standards 4 and 5 are not tested due to data limitations. Moreover, the definition of green open space used in the test is somewhat broader than the definition of natural green space as intended in the ANGSt standards and includes all formal recreation sites.
Data The data used for this analysis was developed for the UK NEA1 case study on urban green space and is described in Perino et al. (2013). The data covers five cities (Aberdeen, Bristol, Glasgow, Norwich and Sheffield) that are of varying size and location and considered to be broadly representative of UK cities (albeit without representation of small urban areas). The spatial extent of each city is defined as the developed land use area (OS Meridian DLUA) within the 2001 census District Area boundary. Spatially referenced data on individual parcels of accessible green space were obtained from city councils, the UK Forestry Commission and Natural England. These data are used within a GIS to compute a layer of Formal Recreation Sites (FRS) for each city, which describes the location and extent of green space. Euclidean distances from the centroid of each postcode area to the centroid of each FRS are calculated. A 3 km maximum distance was imposed for this calculation, reflecting an empirically based cut-off distance beyond which the direct use of green space is assumed to be zero. This distance variable was adjusted for the present analysis (sustainability test) to measure the distance from the centroid of each 6-digit

162
postcode area to the edge of each FRS since for accessibility standards, the distance to edge is of greater relevance. This adjustment was made by subtracting a distance equal to the radius of a circle with the same area as each FRS. The number of households resident within each postcode area were obtained from the 2010 UK National Statistics Postcode Directory. In summary, we use data on the area of individual parcels of green space, distances between green spaces and postcode areas, and the number of households within each postcode area for five representative UK cities.
Analysis For each postcode area, compliance with ANGSt standards 1 and 3 is assessed, i.e. the presence of parcels of green space of at least 2 ha within 300 m and at least 20 ha within 2 km. Binary variables for each standard are computed taking the value 0 if the standard is not met and the value 1 if it is. These binary variables are then multiplied by the number of households in each postcode area to obtain the number of households for which each standard is met. For each city, compliance with ANGSt stand 2 is assessed, i.e. the extent of green space for every 1,000 of population.
Results The results of the analysis are presented in Table 1 and Figure 1. Compliance with Standard 1 is relatively low with the standard being met for only 27% of households in Norwich. Glasgow has the highest rate of compliance but still for only 48% of households. Standard 2 (at least 1 ha of green space per 1,000 people) is met and exceeded in every city. Norwich again performs relatively poorly with just over 2 ha per 1,000 people whereas Aberdeen performs relatively well with 4 ha per 1,000 people. It should be noted, however, that this standard has been assessed using a different definition of target land use than that specified in the ANGSt guidance. The ANGSt guidance relates to Local Nature Reserve rather than green space in general. Data on Local Nature Reserves was not available to test this stricter definition of the standard.11 Compliance with Standard 3 is high in comparison to compliance with Standard 1 but still not complete. There is also substantial variation in compliance across cities. The standard is met for 68% of households in Aberdeen and for 91% of households in Glasgow. Table 1. Compliance with ANGSt standards for accessibility of green space for Aberdeen, Bristol, Glasgow, Norwich and Sheffield.
Standard 1 Standard 2 Standard 3
% of households with 1 ha within 300 m
Area of green space per 1,000 population (ha)
% of households with 20 ha within 2 km
Aberdeen 30% 4.03 68% Bristol 34% 2.39 90% Glasgow 48% 3.83 91% Norwich 27% 2.06 83% Sheffield 45% 2.77 83%
11 The National Playing Fields Association (NPFA) have a similarly defined standard for a minimum of 2.4 ha (6 acres) of outdoor playing space per 1,000 population – the so-called “6 Acre Standard”. Norwich and Bristol do not meet this standard.

UK NEAFO Work Package 1: Natural capital asset check – Annex 4: Case studies
eftec 163 October 2012
Figure 1. Compliance with ANGSt standards for accessibility of green space for Aberdeen, Bristol, Glasgow, Norwich and Sheffield.
0.00
0.50
1.00
1.50
2.00
2.50
3.00
3.50
4.00
4.50
5.00
0%
10%
20%
30%
40%
50%
60%
70%
80%
90%
100%
Aberdeen Bristol Glasgow Norwich Sheffield
Area
per
1,0
00 p
opul
atio
n
% o
f hou
seho
lds m
eetin
g AN
GSt c
riter
ion
% of households with 1 hawithin 300 m% of households with 20ha within 2 kmArea of green space per1,000 population (ha)

164
Appendix IV: Area of urban green space in different broad habitat types
Table 1. Area of urban green space by habitat type
Habitat Area (ha) Percentage Broadleaved Woodland 45,119 16% Coniferous Woodland 5,217 2% Arable and Horticulture 24,768 9% Improved Grassland 195,392 68% Rough Grassland 5,842 2% Neutral Grassland 1,032 0% Calcareous Grassland 245 0% Acid Grassland 305 0% Fen, Marsh, Swamp 112 0% Heather 1,698 1% Heather Grassland 1,528 1% Bog 27 0% Inland Rock 652 0% Freshwater 4,949 2%
Total 286,886

UK NEAFO Work Package 1: Natural capital asset check – Annex 4: Case studies
eftec 165 November 2012

166
1.6. Tees estuary asset check
1.6.1. Natural capital asset
Question Guidance on Answer
A. Define Natural
Capital asset being
checked
In this case study we will consider a variety of ecosystem services supported by functions within estuaries. Estuaries are amongst the most productive ecosystems in the world encompassing a variety of terrestrial and marine ecosystems1,2. The total value of ecosystem services at the UK coastal margin is valued at £48 billion, with coastal defence, carbon sequestration and cultural services considered the most valuable, as well as contribution to biodiversity3. Subsequently this case study will analyse the role of estuaries in supporting hazard regulation, climate regulation, waste breakdown & detoxification, fish production and recreation. The natural capital includes all the ecological components within the river, mudflats, saltmarshes, fore dunes and open beaches (ecosystem assets) which together contribute to the provision of ecosystem services from the estuarine ecosystem. The spatial extent and functional quality of these ecosystem assets is determined by biological stocks, natural cycles and energy & mineral resources (See Appendix 1, Figure A). For regulating services the natural capital is defined through extent and structure of the ecosystem assets. This is determined by the combined functioning of individual assets such as sediment type and erosion/accretion rate, nutrient cycling, water quality and tidal inundation (see Appendix 1). In turn these will influence the abundance and diversity of benthic species, affecting the prey availability for estuarine, marine and migratory fish utilising the estuary and thereby contributing to the provisioning service. Saltmarshes provide spawning grounds for some estuarine and marine fish thereby contributing to fisheries production. Spawning success is influenced by the ecological quality and extent of saltmarsh habitats, as well as current fish stocks. Salmon and sea trout rely on estuaries as migratory routes from the sea to inland reservoirs and lakes for spawning. These populations are dependent on estuarine water quality and food availability at the time of migration, the quality and extent of spawning grounds inland and catch rates in rivers and open sea. The estuary also supports recreational activities. The natural capital is defined through the spatial extent and quality of open beaches and bathing water which provide areas for activities to take place, as well as the attractiveness of the landscape. The contribution of biodiversity to recreational activities will be considered as part of this case study using two flagship species: migratory waterbirds and seal populations. The natural capital asset therefore includes the functional configuration of ecological processes underpinning the ecosystem assets, as well as the contribution of the asset in maintaining healthy waterbird and seal populations (see Appendix 1 for definitions of natural capital for flagship species).
B. What is the spatial scale
for which the asset check
is being conducted
The main focus of this asset check is to test whether the tool is applicable at a local scale. The asset check will be undertaken for the Tees Estuary, North East England but an overview of UK estuaries will be provided for sections E, F and G. A map and description of the Tees Estuary is provided in Appendix 1.

UK NEAFO Work Package 1: Natural capital asset check – Annex 4: Case studies
eftec 167 November 2012
C. Define the timescale for
the asset check.
The asset check will focus on the past 20 years of estuarine change, as well as future predictions based on long term changes. Industrialised estuaries are in the process of reaching new equilibriums, different to that of a time of higher pollution inputs, and these changes in process may well be influencing the ecosystem goods and services provided by these systems, positively and negatively4.
D. What are the main
ecosystem services the
asset provides?
Estuaries contribute to a wide range of ecosystem services (see UK NEA, Coastal Margins for full discussion). This case study will consider what are currently considered to be the key ecosystem services provided by estuarine habitats (based on UK NEA, Synthesis of Key Findings, Figure 5). Sand dunes, saltmarshes and intertidal mudflats are important natural flood defences in estuaries and coastal margin habitats3. Mudflats and saltmarshes dissipate wave energy, thus reducing the risk of erosion damaging coastal defences, whilst sand dunes act as a natural barrier to storm surges and high tides5. Mudflats have an important role in nutrient cycling which supports waste breakdown. In industrialised estuaries mudflats are a sink for heavy metals and other contaminants6. Sand dunes, saltmarshes, and to lesser extent intertidal mudflats are important for climate regulation as they sequester and store organic carbon7. Saltmarshes provide nursery grounds for commercial and recreational fish species8 and estuaries are important migratory routes inland for salmon and sea trout, thus contributing to healthy fish stocks9. Cultural ecosystem services contributing to coastal tourism are valued at £17 billion3. Sand dunes and open beaches provide areas for recreation and contribute to the tourism economy of coastal towns. Added value is provided by flagship species such as waterbirds and seals which provide wildlife watching experiences and contribute to educational visits. Polychaete worms such as lugworm and ragworm, peeler crabs and some bivalves are collected as bait use by recreational sea anglers10.

168
1.6.2. Integrity of natural capital asset
Question Summary Past trend Current trend Future trend Summary of trends
E. What is the
extent of
the natural
capital
asset?
The UK has more than 120 estuaries covering an area of over 308,000 ha11. Changes in the extent of estuaries post 1994 are unknown, but historical data suggests over 12% of the intertidal area has been lost prior to 1994, predominantly as a result of land reclamation. Mapping of mudflats is limited but is it estimated there are 290,000 ha throughout the UK11. Saltmarsh area is estimated at 45,000 ha3. Sand dunes are the only habitat showing an increasing trend between 1950 and 200612 with a current estimated extent of 70,000ha3. Further loss of saltmarshes and mudflats is expected as a result of sea level rise causing coastal squeeze, as well as further development of built capital13.
The Tees Estuary lost 90% of its intertidal area over the past 200 years as a result of intensive land reclamation14 (Appendix 2, Figures C & D).
Land reclamation has now ceased and the estuary has approximately 358 ha of intertidal mudflats15, 88ha of saltmarsh16 and 295 ha of sand dunes17 (Appendix 2, Figure E). Two mudflats (North Tees and Bran Sands) are experiencing erosion (20 mm per year) and are expected to erode further due to estuarine dynamics and sea level rise18.
The Tees Estuary will be subject to sea level rise (up to 20 cm). 13ha of intertidal habitat is expected to be lost in the next 100 years due coastal squeeze19. The Greatham Creek managed realignment scheme aims to deliver at least 29ha of intertidal habitat through managed realignment including 7.9ha of mudflats and 21.7 ha of saltmarsh19. Seal Sands, the largest mudflat in the Tees Estuary, is currently accreting and is showing signs of pioneer saltmarsh vegetation, suggesting the mudflat will transition to saltmarsh18.
↑↓
F. What is the
condition
of the
There are a variety of indicators for the condition of the estuarine natural capital which are measured under two main reporting systems: Environmental Quality
The Tees was the most polluted estuary in the UK during the 1970s when the river received 1.37 x10⁶ m3 of industrial effluents and
2005 – 2010 water quality data shows the majority of pollutants are now below Environmental Quality Standard (EQS) but some metals (including copper)
Water quality is expected to further improve. There is low risk that historically sequestered metals and other contamination could be leeched into the water
↑

UK NEAFO Work Package 1: Natural capital asset check – Annex 4: Case studies
eftec 169 November 2012
natural
capital
asset?
Standards (Environment Agency) and Habitat Conservation Assessments (JNCC and Natural England) (full discussion of the data can be found in Appendix 2). Nationally, 42% of SACL designated estuaries are in unfavourable condition and have a future outlook of “unfavourable, bad and deteriorating”. Deteriorating water quality and erosion are considered to be the main pressures11. The national assessments for mudflats, saltmarsh and sand dunes are unfavourable - bad and deteriorating11. The overall outlook for the Tees Estuary is positive. Historically it was one of the most polluted estuaries in the UK. Changes in industrial practices and rationalisation of sewage treatment have gradually improved water quality over the past 20 years. This has resulted in the return of Harbour Seals and migratory salmon to the estuary. “The Tees is the only known estuary in Europe where Harbour Seals have re-colonised as a direct
0.11 x10⁶ m3 of sewage20. have exceeded EQS limits19. Ammonia concentrations still exceed EQS by 241% at the Tees Barrage and 136% at Newport Bridge21. In Tees Bay the three main bathing waters all reached the minimum standard under the Bathing Water Quality Directive for the past five years22. In 1998 dissolved oxygen (DO)N levels varied between 24% and 62%23. By 2005 all monitoring sites were recording DO levels of at least 80% which is a strong improvement21.
column due to sea level rise and on-going sediment disturbance24,25.
The 1987 regime shift in the North Sea (attributed to the North Atlantic Oscillation) aligned with a marked change in benthic speciesO in the Tees Estuary with some species benefitting and others declining 26.
1994 marks a second, more positive shift in benthic species with a marked increase in biomass and diversity26. 1990-1994 invertebrate monitoring highlighted a general increase in macro-faunal diversity but a decline in ragworm and mud snails. Cockle populations have also shown declines on Seal Sands and there is also concern over the high levels of metals in mussel tissues from Bran
There is discussion that intertidal benthic populations are declining but there are no data confirming this. Possible causes include the spread of macroalgal mats on Seal Sands, the construction of the Tees Barrage and high levels of bait collection. Climate driven changes in the North Sea may also have an impact. The reduction is benthic species could negatively affect waterbirds, as well as migratory and estuarine fish
O
L SAC: Special Area for Conservation designated under the Habitats and Wildbirds Directive (76/409/EEC). N Dissolved oxygen essential for the survival of all aquatic organisms and a level of 40% or above is considered acceptable for migratory fish. O Benthic species are those organisms living on the bottom of the river such as crustaceans and polychaete worms which are prey for fish and waterbirds.

170
result of environmental improvements”28. Current concerns are the impact of the Tees Barrage on estuarine dynamics, opportunistic macroalgaeM (macroalgal mats) on the intertidal areas and the continued decline of some waterbird populations. Future concerns include continued erosion of intertidal habitats and the accompanying risk of historical contamination leeching into the water column, additional development of ports and industry which could further affect estuarine dynamics and the impacts of increasing recreational activities.
Sands21. in terms of prey availability. Ecological processes such as nutrient cycling could also be adversely affected by species declines27.
Prior to 1926 the Tees was noted for its catches of salmon and sea trout. Stocks collapsed from 10,000 (1867) to zero from 1930-1980 due to severe pollution9.
Since 1982 salmon rod catches have increased and in 2008 the Tees was ranked the 25th best river for salmon catches in England and Wales9.
The Tees is expected to achieve its conservation management target for salmon stocks between 2023 and 20299.
↑
The Tees Harbour Seal Population was estimated at 1000 individuals in the early 1800s. As industry, land reclamation and shipping increased numbers declined to zero by 193021.
As water quality improved during the 1980s, Harbour Seals returned to the estuary. 2012 recorded the highest Harbour Seal count since records began in 1989 (88 individuals counted)28.
There is no sign of the population stabilising as yet, but national population data is needed in order to assess if these increases are part of a national trend or are attributed local factors28.
↑
Populations of knot and dunlin were at their highest during the 1970s and have continued to decline due to habitat loss and/or reduced prey availability21.
72% of the SPA habitats are in unfavourable recovering condition, 3% are unfavourable no change and 25% are favourable29 (Appendix 2: Figure E).
Increasing recreational activities, bait collection and changes in structure and functioning of mudflats will further affect the quality of the intertidal area available for foraging. Climate change is also expected to affect where waterbirds migration patterns.
↓
Together, extent and condition reflect the integrity of the stock of natural capital that produces flows of ecosystem services.
Uncertainties
D: Established but incomplete evidence. There is a wide range of literature documenting some of the ecosystem services provided by various coastal margin habitats (as synthesised in the NEA) but further quantification is needed. E: Established but incomplete evidence. There is a high agreement that there has been a continued loss of intertidal habitats over time throughout the UK. Currently there are no data for trends in changes of UK estuarine area post 1994 but JNCC deems data on the current
M During the 1990s mats of the green algae Entermorpha, started to appear on Seal Sands. The species is associated with eutrophication (nutrient enrichment). The Environment Agency refer to Entermorpha as opportunistic macroalgae in their work on the Water Framework Directive. For this report it will be referred to as macroalgal mats.

UK NEAFO Work Package 1: Natural capital asset check – Annex 4: Case studies
eftec 171 November 2012
spatial extent good. For mudflats there is limited mapping of the UK extent and no data on recent changes in extent, subsequently the data is considered poor by JNCC. Mapping of the national extent of saltmarshes is limited and present trends are unknown. Data for national sand dune extent is considered moderate quality by JNCC. For the Tees Estuary the historic intertidal habitat loss is well documented. The current habitat areas are approximations based on the best available data from Natural England and the Environment Agency (see Appendix 2 for details). F: Established but incomplete evidence. Nationally the JNCC have a medium confidence in their judgements for condition of estuaries, mudflats, saltmarsh and sand dunes. At the Tees Estuary assessments of water quality and sediment contamination from the Environment Agency are well established and complete. Monitoring of the seal population has taken place annually since 1989 by INCA it is not known if the population increase is part of a national trend. There is confidence in the monitoring of the waterbird populations which has taken place since the 1970s as part of the Wetland Bird Survey (WeBs). Further monitoring work is needed to establish the exact causes of the decline in waterbird populations; recreational activities monitoring began in 2011 and a report on the macro faunal populations on the intertidal is due in summer 2013. Salmon data is provided by the Environment Agency as part of their River Tees Salmon Action Plan Review and this is considered reliable. There is no reliable data on the numbers of marine or estuarine fish in the estuary as the Tees does not support a commercial fishery, therefore no judgements on the fisheries provisioning service can be made as part of this asset check.
Key for trends
↑ increasing ↓ decreasing
↔ evidence shows no trend O no evidence
↑↓ both increasing and decreasing (this could reflect ambiguous evidence and/or spatially differing trends)
G. Drivers of changes
in Extent and
Condition
Policy Drivers The 1974 Control of Pollution Act was a milestone in the clean-up of the Tees Estuary and tighter regulations came into force under this Act in 1984. Under the Water Framework Directive (WFD) (2000/60/EC) the Tees Estuary must reach good chemical and ecological status by 2015 (subject to certain limited exceptions). Seal Sands mudflat is designated as a Sensitive Area (Eutrophic) – SA(E) under the Urban Waste Water Treatment Directive (UWWTD). This requires nutrient removal within seven years of the designation. Other policies influencing water quality include the Bathing Waters Directive (76/160/EEC) and the Tioxide Directive (78/176/EEC). Policies influencing flood risk management include the Coast Protection Act 1949, National Flood and Coastal Erosion Risk Management Strategy – England and The EU Floods Directive (2007/60/EC). Further developments of hard engineered coastal defences are expected to exacerbate the impacts of coastal squeeze on intertidal habitats30. In contrast soft defences, such as

172
managed realignment lead to habitat creation31. The Greatham Creek managed realignment scheme aims to create 29ha of intertidal area to offset the impacts of coastal squeeze following the £30 million development of coastal defences at Redcar19. Saltmarshes, mudflats and sand dunes are priority habitats under UK and EU conservation objectives. The Teesmouth and Cleveland Coast is designated as Special Protection Area (SPA) under the EU Habitats and Wild Birds Directives (76/409/EEC) and the intertidal areas are designated as a European Marine Site (EMS). The site was also designated as a Ramsar Site in 1995 under the Ramsar Convention. Under the Habitats Directive sites must be maintained at favourable condition. However, the stipulation of “no net loss” of these habitats under the Directive can at times conflict with the priorities of managed realignment schemes, as well as natural estuary dynamics32. Biophysical Drivers The main biophysical drivers are estuary dynamics which influence sediment transport. Continued marine erosion of the estuary training walls (manmade walls from blast furnace slag constructed in the 1800s to canalise the river) is thought to have greatly accelerated the deposition of sand and mud onto the surrounding mudflats. This accretion of mudflats may be encouraging the colonisation of pioneer saltmarsh vegetation. Estuary dynamics can affect the remobilisation of historic contaminants which can impact benthic species and in turn affect waterbird populations. Rising sea levels are expected to reduce intertidal habitat by 13 ha in the next 100 years due to coastal squeeze19. Warmer sea temperatures and milder winters are negatively affecting the mudflats by encouraging the growth of macroalgal mats21. Simulations have demonstrated that changes in rainfall patterns and sea level rise will constrain dune plants to narrow areas, resulting in a breakdown of the successional process and a drying out of the dune system33. Socio-economic & other drivers Historically the main driver of change has been the extensive reclamation of the intertidal areas, wide scale industrialisation on the banks of the Tees and the associated high pollution loading throughout the 19th and 20th centuries. PD Ports is the third largest port in the UK, supporting the chemical and process industries which dominate the North and South Tees. The Stockton-On-Tees Regeneration strategy identifies the need to maximise the river and port as key economic assets34. Further expansion of the port and related infrastructure could have adverse effect on the integrity on the ecosystem assets. PD Ports has a legal requirement to maintain the navigable course of the Tees Estuary and Seaton Channel. Dredging to maintain channels affects re-suspension and vessel forces, which added to the natural tidal flows, density driven and wave induced currents further affects sediment transport in the estuary. These changes in sedimentation rates are thought to be one of the reasons for accretion of Seal Sands and erosion of Bran Sands and the North Tees mudflat18. Ballast water has the potential to release non-native organisms to the marine environment although there have been no effects reported for the Tees. On the intertidal however, the introduction of Spartina anglica has reduced the diversity of saltmarsh vegetation and the value of the habitat as a feeding ground for waterbirds15. The Tees Barrage (built in 1994) effectively halved the length of the tidal estuary and altered the biological and physical environment downstream. These changes in estuary dynamics are thought to be one of the causes of macroalgal mats on Seal Sands18. The macroalgal mats are thought to be responsible for a change in feeding usage by waterbirds and a reduction in benthic species4. A second potential cause is nutrient enrichment due to point source pollution from Waste Water Treatment Works, as well as diffuse pollution from agriculture further upstream (within a Nitrate Vulnerable Zone)35. Recreational use of the estuary is increasing following improvements in the seascape. A Defra Risk Review highlighted that recreational activities are having negative impacts on many intertidal habitats36. There is evidence that recreational activities are

UK NEAFO Work Package 1: Natural capital asset check – Annex 4: Case studies
eftec 173 November 2012
altering waterbird usage of the Tees Estuary and dog walking and bait collection are thought to be having the most detrimental effects37,38. Laying of tyres for bait collection could also be altering erosion rates on Bran Sands although no causal link has been established. This activity takes place on Bran Sands and Greatham Creek and the Tees is one of the key places for this activity in the North East. Recreation negatively affects the sand dune habitats through erosion, fires, fly tipping and camping activities39. Natural dune dynamics and biodiversity are reduced through artificial stabilization of the system, such as fencing along the seaward side of the dune. Sand extraction has taken place at North Gare since 1955 with 48,000 tonnes of sand permitted for extraction annually which could also have an adverse effect on the North Gare Dunes, as well as affecting the wider estuary dynamics40. Beach cleaning commonly removes seaweed as well as other dead or stranded biota depriving the ecosystem of valuable nutritional inputs and also affecting sand dune succession40.
H. What are the
asset’s main
ecosystem
functions?
See Section A and Appendix 1
I. Integrity Test: Is
the ability of the
asset to support
ecosystem services
being maintained?
The assets ability to support regulating services is compromised by current and expected changes in estuarine dynamics (natural changes in sediment transport, dredging operations, the Tees Barrage and in future sea level rise). Continued erosion of North Tees and Bran Sands increases the risk that these mudflats will switch from being a sink of metal contaminants to a source. Reduction of the intertidal area will also reduce erosion protection granted to sea walls behind. Accretion of Seal Sands and the transition to saltmarsh will have significant benefits for coastal defence and carbon sequestration due to changes in vegetation structure. Improvements in water quality (post 1980) have improved the assets ability to support salmon populations migrating inland for spawning. Populations are not expected to reach their conservation target until 2025 and water quality is still considered the main limiting factor alongside catch rates in the North East Coast Net fishery, predation and loss of spawning grounds and rearing habitat inland. One of the main concerns at present is the utilisation of the fish pass at the Tees Barrage and the delay in passing. In terms of estuarine and marine fish the current integrity is unknown as there is little data available on the populations9. The assets ability to support cultural services is increasing. Improvements in water quality and overall seascape have resulted in in increased use of the area for recreational activities. Local Development Framework Policies indicate that there is a clear drive to encourage coastal access and recreation to enhance wellbeing41,42. Redcar and Cleveland Borough Council aim to increase visitor numbers by 10,000 per annum by 2025. The assets ability to support the designated waterbird populations appears to be declining. Possible causes include the spread of macroalgal mats across Seal Sands which limits foraging area4, increasing recreational activities37,38, increased bait collection and improvements in sewage treatment works. Sewage outfalls provide directly edible matter for some waterbirds, as well as enhancing benthic populations close to the outfall due to nutrient enrichment. Rationalisation of sewage outfalls has the potential to reduce ben prey for a variety of species including Knot, Purple Sandpiper and Dunlin43.

174
1.6.3. Performance of natural capital asset
Question
J. Is there a
measure of the
current output of
services from the
asset?
Regulating Services The value of hazard regulation function currently provided by sand dunes was estimated at £4,748,169. The expected hazard regulation benefit of saltmarsh on Seal Sands was estimated at £2,803,610. These were calculated following the replacement cost method demonstrated by Beaumont et al (2010) (see Appendix 3). Current estimates of carbon sequestration are available for saltmarsh (2.1 tC/ha/yr), intertidal mudflats (1.6 tC/ha/year) and sand dunes (between 0.58 and 0.73 tC/ha/yr)44. Combining the carbon sequestration potential of the Tees Estuary habitats with a range of carbon values allows the value of carbon dioxide (CO2) sequestration to be estimated (see Appendix 3). The current value of CO2 sequestration for saltmarshes varies between £19,000 and £58,000; mudflats between £61,000 and £181,000; and sand dunes between £8,000 and £68,000 depending on the DECC carbon value taken (non-traded low, central or high45). It is well documented that the Tees Estuary is a sink for metal contamination but current mudflat erosion and rising seas suggest that there will be a reduction in the output of this service over time46,47. Andrews et al (2006) demonstrated that it is possible to value containment sequestration in terms of avoided clean-up costs7. Due to time and data constraints it was not possible to replicate this for the Tees. Provisioning Services Freshwater recreational angling in the River Tees has been constant since 1994 with approximately 2000 angler days per annum and an average declared rod catch of 100 per annum since 20009. The North East Coast Salmon Fishery declared catches of over 60,000 fish during the 1970s and 1980s, prior to the net buyout (2003) the 5yr mean salmon catch was 31,109 and afterwards it was 9,0199. Cultural Services The Tees Estuary is an important recreational resource for local people. A 2010 visitor survey indicated that 34% of visitors live within one mile of the estuary and over 50% of those surveyed visited the site at least once per week. The most popular recreational activities are walking and dog walking (60% of visitors) followed by bird watching and recreational sea angling (each 8% of visitors)37. Regionally, the value of the tourism economy is small. In 2008, the Direct Gross Value Added (DGVA) from tourism to the North East economy was £70 million for Hartlepool and Stockton-On-Tees and £80 million for South Teesside48.
K. What goods and
benefits do these
services support?
The core industrial land of the north Tees is at potential risk from coastal flooding and the Seaton Dunes provide the primary flood protection. At the mouth of the estuary, the potential flood area includes the nuclear power station and significant areas of north bank to Teesport. Manmade defences set back from the shoreline protect this area, but the intertidal foreshore provides additional defence by reducing coastal erosion. On the south Tees the Coatham Dunes provide a good width of protection to the northern flank of Redcar steel works and to the towns of Warrenby and Coatham49.
Continued waste breakdown and detoxification by mudflats has limited the flow of historic pollutants into the North Sea and the potential detrimental effects on the marine ecosystem. The release of these historical contaminants could have a wide ranging impact on benthic health and result in high clean-up costs21,46. The continued storage of historical pollutants by sediments has

UK NEAFO Work Package 1: Natural capital asset check – Annex 4: Case studies
eftec 175 November 2012
contributed to increased water quality by avoided clean-up costs7.
Carbon storage provided by sand dunes and saltmarshes contributes to global carbon sequestration efforts in response to climate change. When considering the CO2 emissions from Teesside Industry (4202 kT CO2e in 2005) the contribution of the local sand dunes and saltmarshes is small50.
Saltmarshes support estuarine and marine fish stocks by providing spawning and nursery grounds which contribute to the North Sea fishing industry8,51,. The estuary supports salmon populations migrating inland for spawning which provides recreational opportunities for freshwater anglers and a source of food further upstream. Invertebrate species in the intertidal habitats provide bait for sea angling.
The seascape is an important setting for recreational activities and this resource has improved from water quality. Local Development Framework Policies demonstrate a drive to encourage coastal access and recreation to enhance local wellbeing41,42. Recreational activities available at the coast affect the quality of life for residents by improving their mental and physical wellbeing52,53. This is especially important in areas of high deprivation; 18% of the Tees Valley population are in the national most deprived 5% 54.
L. What is the
target
performance
from the asset?
This case study outlines the importance of a range ecosystem services provided by the natural capital asset and the target performance will be different depending on which ecosystem service is considered. Current target performance of the asset is defined using the existing policy targets for the asset. The implications on the various ecosystem services will be considered in Section M. The Teesmouth and Cleveland Coast is designated as a Special Protection Area under the EU Habitats and Wildbirds Directive (76/409/EEC). Mudflats, saltmarsh and sand dunes are also priority habitats under local and national Biodiversity Action Plans. The target performance under these policies is the restoration and maintenance of the habitats to reach favourable conservation status and there should be no net loss of these habitats. Through these designations migratory waterbird populations should also be maintained. Their performance is also affected by spring/summer breeding success, and more recently climate change which is altering migration patterns. Target performance under the Water Framework Directive states the estuary should reach good ecological and good chemical status by 2015. Under the Urban Waste Water Treatment Directive nutrient removal should have been completed on Seal Sands by 2009. Salmon stocks have a conservation limit of 14.9 million eggs as part of the River Tees Salmon Action Plan and the likelihood of achieving this target is affected by a range of factors. These include catch rates (commercial and recreational angling will affect the numbers of salmon migrating inland to spawn), estuarine water quality (migratory fish populations need a dissolved oxygen level above 40%), and finally the quality and extent of inland spawning grounds (to enable successful spawning). In terms of cultural services Redcar and Cleveland Borough Council have a target of increasing visitor numbers by 10,000 per annum by 2025. A range of local authorities in the area recognise the importance of the seascape in providing space for recreational activities and its contribution to human wellbeing. There are no target performances defined for the asset in terms of its contribution to flood defence, water detoxification and carbon sequestration.

176
Uncertainties J: Established but incomplete evidence. Calculating the replacement cost for the flood defences provides a crude estimate. Values can be overestimated due to scaling issues, it does not consider the value of the land being protected or the risk of flooding and it fails to capture the full value of the ecosystem service55. The current value of the carbon sequestration service is consistent with current methodology. However calculating future values for this service is limited due to the data limitations for future habitat areas. This valuation would be strengthened if data were available on the stocks of carbon already sequestered within the sediments. Data on salmon stocks are well established through Environment Agency monitoring. An assessment of the output of the estuary in terms of marine and estuarine fish production was not possible as there was limited evidence available on fish populations within the estuary. An assessment of bait stocks was not possible as current monitoring data has not yet been released. Monitoring of waterbird and seal populations are well established and provide detailed evidence. K: Established but incomplete evidence. Ecosystem services and goods provided by coastal margin habitats are well established and researched throughout literature. More detailed data is needed to fully apply the approach to the habitats of the Tees Estuary, especially when considering provisioning services.
Defining performance: Answering these questions can help define performance, but not all questions can be answered for all assets
What policy targets are there for the asset?
See Section L
What is the trend in the main services the asset provides?
As set out in the UK NEA Synthesis Report (2011, Figure 5) the trend in provisioning services provided by coastal margin habitats (which includes saltmarsh and sand dunes) shows “some deterioration”. Trends in wild species diversity show “some deterioration” whilst cultural services are either stable (local places) or shows signs of some improvement (landscapes/seascapes). The contribution to climate regulation is showing signs of improvement and hazard regulation remains stable although there trend for water quality are unknown. These national trends are similar to the trends identified in this NCAC for the Tees Estuary. Recreational activities are increasing due to environmental improvements. There are declines in waterbird populations which are an indicator of the conservation value of the site. Flood defence, water detoxification and carbon sequestration are relatively stable at present but changing pressures may lead to their decline. Salmon and seal populations are continually increasing due to improvements in water quality.
What types of goods are supported by the asset?
Use values: Carbon sequestration (non-rival); pollution control (non-rival); food (e.g. fish and shellfish – rival) and recreation (non-rival). Non-use values: Coastal erosion prevention (non-rival) and wild species diversity (non-rival).
Who benefits from the goods?
The economic value of the Tees Estuary is dependent on the continued existence of the natural assets provided by the estuary; sheltered deep water for shipping movement, protected shoreline for development and water flow for effluent disposal and dispersion. Chemicals, iron, steel and metal manufacture, although declining, are significant presence in the Tees Valley with many these industries located on the banks of the Tees. Manufacturing accounts for 11.3% of employment within the Tees Valley56. The Tees Valley is not recognised as a tourist destination; 43% of visitors to the area are residents and the majority of visitors are day trippers56. The wellbeing value of the seascape is important to local

UK NEAFO Work Package 1: Natural capital asset check – Annex 4: Case studies
eftec 177 November 2012
people. 18% of the Tees Valley population are in the nationally most deprived 5% and the benefits of living near the coast may mitigate some of the negative health effects of socio-economic deprivation57. The Tees is not used as a port for commercial fishing and any fishing which does take place is recreational. Economic benefits will be limited to angling shops and clubs in the local area. Sea angling is enhanced by the readily available bait from the intertidal habitats. Freshwater anglers upstream of the estuary benefit from increasing salmon stocks, as do commercial fishermen in the North East Coast Net Fishery.
What wellbeing results from the goods?
See above
M. Are any future
changes in target
performance
expected?
The Marine and Coastal Access Act 2009 introduced marine spatial planning in managing the UK inshore and offshore. The inshore plans will consider existing shoreline management plans, offer opportunities to strengthen natural environment protection and offer additional approaches to management. The Tees Estuary will be part of the North East Inshore but there is no date as to when planning for this area will commence.
N. Can future target
performance be
defined?
The performance of a natural capital asset can be defined by its contribution to ecosystem service flows. Analysis is complex when dealing with a variety of services across multiple habitats due to feedbacks, thresholds and cumulative effects. Consideration needs to be given to the possible trade-offs in achieving target performance for one ecosystem service and the scale dependent values of ecosystem services. Due to these two considerations future target performance is not defined for the estuarine asset, instead the trade-offs in achieving target performance under the different policies (Section L) is discussed, as well as the impacts on the asset of achieving target economic performance. Target Performance under the EU Habitats Directive There should be no net loss of the habitats designated under the Habitats Directive (76/409/EEC) activities causing adverse effect on the site features should be managed. The no net loss target will contribute to the maintenance of the regulating and provisioning services. Maintaining the extent and quality of habitats for waterbirds will maintain, or possibly increase benthic populations, which in turn will maintain food sources for estuarine and migratory fish. Managing the area for conservation could restrict the variety of recreational activities taking place throughout the estuary. Recreational activities, in particular bait digging and dog walking are shown to be having a negative effect on waterbird populations37,38. The Habitats Directive stipulates that a change in habitat type, for example, the natural transition of mudflats to saltmarshes, renders the site in unfavourable condition. On Seal Sands, the target performance from a conservation perspective is maintaining a mudflat. When considering regulating services a transition to saltmarsh would be preferable. Provisioning services would be further enhanced if the mudflat transitions to saltmarsh as this would provide spawning grounds for estuarine and marine fish.

178
Target Performance under the Water Framework Directive Achieving good chemical and ecological status would benefit all three ecosystem service groups. Good ecological status implies species rich sub-tidal and intertidal sediments which are essential for the functioning of the ecosystem assets, as well supporting the individual assets. Good chemical status would involve nutrient removal, reducing the impacts of eutrophication on the intertidal mudflats and benefit benthic health. The functional quality of the intertidal habitats would improve, benefitting waterbird and fish populations. The reduction in algal mats would benefit the on-going colonisation of the mudflat to saltmarsh (improving the regulating services provision, but at a cost to conservation status). Achieving target performance would also benefit sea based recreational activities such as kite surfing and swimming. The Role of the Tees Estuary in Economic Performance for the North East When considering target performance, the estuary’s function in supporting the economic development of Teesside should not be ignored “A prime objective of Tees Valley and One North East is to support and develop world class process, energy, steel and port industries”58. The River Tees is a critical element in the regional infrastructure; PD Ports is the third largest port in the UK and is the largest chemical handling port, supporting chemical and process industries which dominate the North and South Tees. Future development proposals (petrochemical, ship decommissioning, off-shore wind, logistics, and energy generation) include significant river works (capital dredging, piling, placement of materials, etc) which could have a range of detrimental impacts on the natural capital asset.

UK NEAFO Work Package 1: Natural capital asset check – Annex 4: Case studies
eftec 179 November 2012
1.6.4. Natural capital asset criticalities
Question Guidance on Answer
O. What is the
trajectory of
change for the
asset?
Water quality is expected to continue improving in the estuary following the Water Framework Directive (WFD) and Urban Waste Water Treatment Directive (UWWTD) targets. Salmon populations are expected to continue increasing, achieving their conservation target by 2029. Harbour seal populations are continually increasing and the population has shown no signs of stabilising. There is concern that continued erosion of Bran Sands and the North Tees mudflat will increase the liklihood of historic metals contamination being re-suspended into the water column and the subsequent effects of this on the estuarine ecosystem. 13ha of intertidal habitats are expected to be lost by 2100 based on current estuary dynamics and expected sea level rise. This will be offset through the creation of 29ha of intertidal habitat through the Greatham Creek Managed realignment scheme. Natural migration of dune systems inland will be restricted due to manmade structures, meaning coastal squeeze could reduce the area of this habitat. It is anticipated that there will be a reduction in this habitat but there is no data available on the rate or extent of loss. The quality of intertidal habitats for certain waterbirds (knot, shelduck and dunlin) appears to be in continual decline due to reductions in their preferred prey and loss of roost sites. In contrast, the increase in some species, notably redshank suggests that the overall habitat quality is being maintained. The anticipated transition to saltmarsh on Seal Sands will further reduce the foraging area for waterbirds and will likely see a reduction in the numbers using the site during over winter migration. Increasing recreational activities on intertidal areas will further exacerbate pressure on the waterbirds but voluntary codes of conduct written with local groups may mitigate some of the problems.
P. Are there any
standards or
agreed limits of
change to the
asset?
The WFD states the Tees Estuary must reach good chemical and ecological status by 2015 (subject to certain limited exceptions). Seal Sands is designated as a Sensitive Area (Eutrophic) under of the UWWTD and nutrient removal was required within seven years of the designation. This has not been achieved. In 1999 the Environment Agency had a target of limiting Entermorpha (macroalgal mats) to 25% of the intertidal area, by 2008 mats covered between 50 and 60% of Seal Sands18. The Environment Agency’s strategy for the management of salmon fisheries in England and Wales requires the production of an individual Salmon Action Plan (SAP) for each principal salmon river indicating the conservation limits and management targets. The Tees is not achieving its current conservation limit which is to be expected for a river in a recovery phase. Based on its current recovery the river is expected to achieve its management target between 2023 and 20299. The EU Habitats Directive requires designated habitats to be maintained or restored to favourable conservation status and that there should be no net loss of these habitats. Under the Directive Seal Sands will be considered to be in unfavourable condition if the transition to saltmarsh continues. Saltmarsh will support a different waterbird population than the one the site was originally designated for.
Q. Are there likely
to be any
threshold
There will be a variety of threshold effects associated with changes in structure and functioning of the Tees Estuary although identification of threshold points and timescales are limited. The provision of hazard regulation is non-linear subject to habitat area59 and narrow fringes of habitat will not reduce wave energy to a level that will not damage structures behind60. As areas of intertidal habitat disappear the cost of engineered flood defences will increase at an increasing rate61. For the Tees Estuary the continued erosion of the North Tees and Bran Sands mudflat may reduce the erosion protection granted to the hard engineered defences behind. However, for Seal Sands the transition from

180
effects?
mudflat to saltmarsh will improve the natural erosion protection granted to the hard defences protecting the North Tees Industry. It is likely that nutrient enrichment has exceeded the threshold level on Seal Sands contributing to the spread of macroalgal mats. This is attributed to invertebrate declines of 90% causing a change in feeding patterns and for waterbirds and a subsequent decline in shelduck (45%) and knot (34%)4,29. It is unclear if this local loss of habitat will reduce the capacity of the remaining habitat network throughout the region to support waterbird populations throughout winter. There are potential threshold effects associated with the continued erosion of Bran Sands and North Tees mudflat due to the release of historic contaminants into the water column. Large quantities of metal inhibit organism’s vital functions, including reproduction and subsequently benthic diversity may change resulting in changes in prey availability higher in the food web. The Environment Agency calculated that should sediment from the estuary be suspended the levels of Arsenic and Mercury would exceed their Environmental Quality Status (EQS) by 66% and 480% respectively19. At present there are no data on the rate of leeching so it is not possible to determine if and when a threshold may be reached. Exceeding these EQS’ is also dependent on the background concentrations of metals within the water column (which are decreasing). Increased collection of invertebrates such as rag worm, lugworm and peeler crabs can significantly affect invertebrate populations. Excessive digging will limit the diversity and age range of species and if a threshold is crossed it may be difficult for certain species to recover. There is no evidence on the threshold level needed to maintain these populations. Evidence from 1990-1994 monitoring suggests that whilst overall macro faunal diversity in the estuary is increasing, species used for bait are decreasing21.
R. What is the
reversibility of
changes to the
asset?
From the outset the Tees Estuary appears to be a highly adaptable system and is yet to experience any long term (over 100 years) significant non – reversible threshold effects. The estuary has experienced significant changes in structure and functioning throughout the 19th and 20th centuries which resulted in a 90% reduction of the intertidal area, the collapse of the salmon and seal populations during the 1930s and the declaration that the Tees was the most polluted estuary in the UK during the 1970s. The Tees entered a period of recovery during the late 1970s as a result of the tighter regulations on industry due to the Control of Pollution Act (1974). Since then it has shown a degree of reversibility, with water quality significantly improving as demonstrated by the return of salmon and seals to the estuary during the late 1980s. Whilst both populations are continuing to increase, neither has reached their levels prior to population collapse during the 1930s. Recovery of salmon populations to their conservation limit is expected to take at least another 10 years. Even though there has been extensive loss of intertidal habitats the Tees Estuary is still considered internationally important for waterbird populations. In more recent years the Estuary and surrounding resorts are becoming increasingly important for recreational activities following improvements in the seascape. Limiting the spread of macroalgal mats on Seal Sands is complex. The present accretion rates suggest that the mats will be replaced by saltmarsh, potentially halting the effects of nutrient enrichment4. Future saltmarsh habitat is not expected to suffer threshold effects associated with nutrient loading based on the assumption that the limiting factor for macroalgal growth is physical, rather than chemical-nutrient based4,62. It is not expected that reduction in nutrient enrichment via transition to saltmarsh habitat will halt or reverse declines in the waterbirds utilising Seal Sands. The saltmarsh habitat will support different benthic species and increased vegetation will limit the area available for foraging18. Considering current and future pressures there are some measures available to reduce or reverse asset decline. Managed realignment schemes can recreate saltmarsh and intertidal mudflats, although full ecological productivity may not be restored. The restoration of these intertidal areas would restore the hazard regulation and waste detoxification services on a like for like basis as the supporting services are not overly complex. Restoration of wild species diversity is more difficult, due to longer
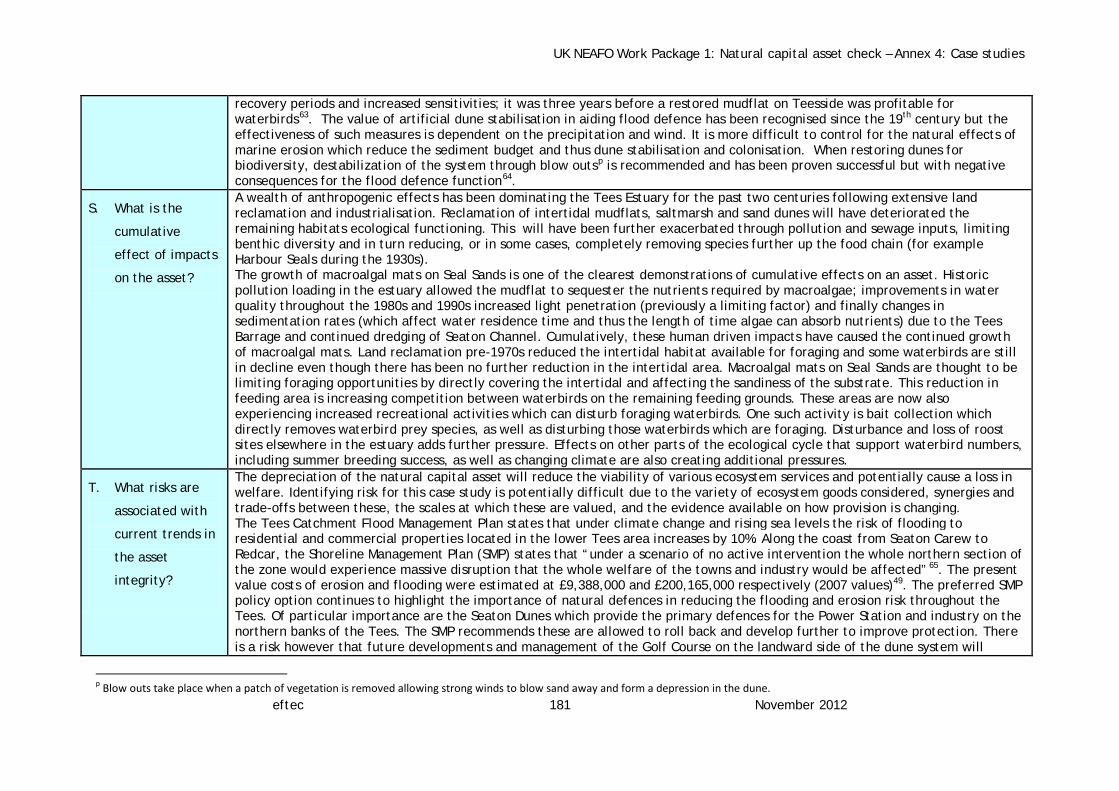
UK NEAFO Work Package 1: Natural capital asset check – Annex 4: Case studies
eftec 181 November 2012
recovery periods and increased sensitivities; it was three years before a restored mudflat on Teesside was profitable for waterbirds63. The value of artificial dune stabilisation in aiding flood defence has been recognised since the 19th century but the effectiveness of such measures is dependent on the precipitation and wind. It is more difficult to control for the natural effects of marine erosion which reduce the sediment budget and thus dune stabilisation and colonisation. When restoring dunes for biodiversity, destabilization of the system through blow outsp is recommended and has been proven successful but with negative consequences for the flood defence function64.
S. What is the
cumulative
effect of impacts
on the asset?
A wealth of anthropogenic effects has been dominating the Tees Estuary for the past two centuries following extensive land reclamation and industrialisation. Reclamation of intertidal mudflats, saltmarsh and sand dunes will have deteriorated the remaining habitats ecological functioning. This will have been further exacerbated through pollution and sewage inputs, limiting benthic diversity and in turn reducing, or in some cases, completely removing species further up the food chain (for example Harbour Seals during the 1930s). The growth of macroalgal mats on Seal Sands is one of the clearest demonstrations of cumulative effects on an asset. Historic pollution loading in the estuary allowed the mudflat to sequester the nutrients required by macroalgae; improvements in water quality throughout the 1980s and 1990s increased light penetration (previously a limiting factor) and finally changes in sedimentation rates (which affect water residence time and thus the length of time algae can absorb nutrients) due to the Tees Barrage and continued dredging of Seaton Channel. Cumulatively, these human driven impacts have caused the continued growth of macroalgal mats. Land reclamation pre-1970s reduced the intertidal habitat available for foraging and some waterbirds are still in decline even though there has been no further reduction in the intertidal area. Macroalgal mats on Seal Sands are thought to be limiting foraging opportunities by directly covering the intertidal and affecting the sandiness of the substrate. This reduction in feeding area is increasing competition between waterbirds on the remaining feeding grounds. These areas are now also experiencing increased recreational activities which can disturb foraging waterbirds. One such activity is bait collection which directly removes waterbird prey species, as well as disturbing those waterbirds which are foraging. Disturbance and loss of roost sites elsewhere in the estuary adds further pressure. Effects on other parts of the ecological cycle that support waterbird numbers, including summer breeding success, as well as changing climate are also creating additional pressures.
T. What risks are
associated with
current trends in
the asset
integrity?
The depreciation of the natural capital asset will reduce the viability of various ecosystem services and potentially cause a loss in welfare. Identifying risk for this case study is potentially difficult due to the variety of ecosystem goods considered, synergies and trade-offs between these, the scales at which these are valued, and the evidence available on how provision is changing. The Tees Catchment Flood Management Plan states that under climate change and rising sea levels the risk of flooding to residential and commercial properties located in the lower Tees area increases by 10%. Along the coast from Seaton Carew to Redcar, the Shoreline Management Plan (SMP) states that “under a scenario of no active intervention the whole northern section of the zone would experience massive disruption that the whole welfare of the towns and industry would be affected”65. The present value costs of erosion and flooding were estimated at £9,388,000 and £200,165,000 respectively (2007 values)49. The preferred SMP policy option continues to highlight the importance of natural defences in reducing the flooding and erosion risk throughout the Tees. Of particular importance are the Seaton Dunes which provide the primary defences for the Power Station and industry on the northern banks of the Tees. The SMP recommends these are allowed to roll back and develop further to improve protection. There is a risk however that future developments and management of the Golf Course on the landward side of the dune system will
p Blow outs take place when a patch of vegetation is removed allowing strong winds to blow sand away and form a depression in the dune.
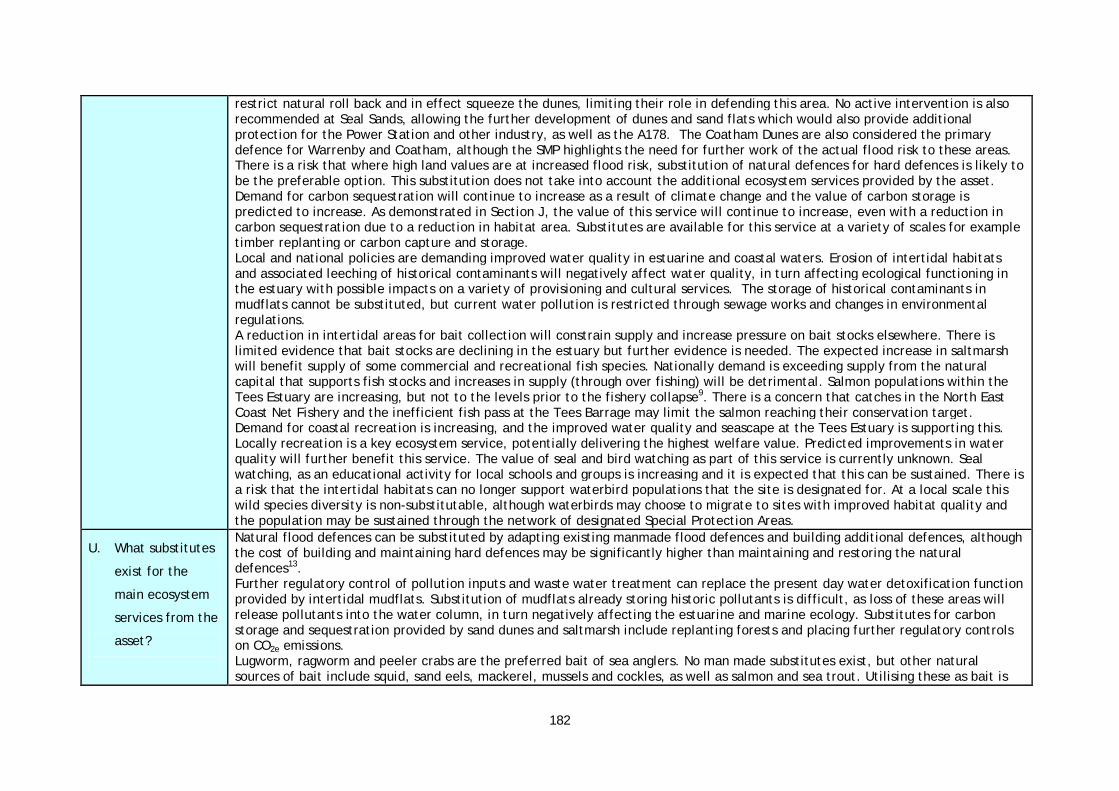
182
restrict natural roll back and in effect squeeze the dunes, limiting their role in defending this area. No active intervention is also recommended at Seal Sands, allowing the further development of dunes and sand flats which would also provide additional protection for the Power Station and other industry, as well as the A178. The Coatham Dunes are also considered the primary defence for Warrenby and Coatham, although the SMP highlights the need for further work of the actual flood risk to these areas. There is a risk that where high land values are at increased flood risk, substitution of natural defences for hard defences is likely to be the preferable option. This substitution does not take into account the additional ecosystem services provided by the asset. Demand for carbon sequestration will continue to increase as a result of climate change and the value of carbon storage is predicted to increase. As demonstrated in Section J, the value of this service will continue to increase, even with a reduction in carbon sequestration due to a reduction in habitat area. Substitutes are available for this service at a variety of scales for example timber replanting or carbon capture and storage. Local and national policies are demanding improved water quality in estuarine and coastal waters. Erosion of intertidal habitats and associated leeching of historical contaminants will negatively affect water quality, in turn affecting ecological functioning in the estuary with possible impacts on a variety of provisioning and cultural services. The storage of historical contaminants in mudflats cannot be substituted, but current water pollution is restricted through sewage works and changes in environmental regulations. A reduction in intertidal areas for bait collection will constrain supply and increase pressure on bait stocks elsewhere. There is limited evidence that bait stocks are declining in the estuary but further evidence is needed. The expected increase in saltmarsh will benefit supply of some commercial and recreational fish species. Nationally demand is exceeding supply from the natural capital that supports fish stocks and increases in supply (through over fishing) will be detrimental. Salmon populations within the Tees Estuary are increasing, but not to the levels prior to the fishery collapse9. There is a concern that catches in the North East Coast Net Fishery and the inefficient fish pass at the Tees Barrage may limit the salmon reaching their conservation target. Demand for coastal recreation is increasing, and the improved water quality and seascape at the Tees Estuary is supporting this. Locally recreation is a key ecosystem service, potentially delivering the highest welfare value. Predicted improvements in water quality will further benefit this service. The value of seal and bird watching as part of this service is currently unknown. Seal watching, as an educational activity for local schools and groups is increasing and it is expected that this can be sustained. There is a risk that the intertidal habitats can no longer support waterbird populations that the site is designated for. At a local scale this wild species diversity is non-substitutable, although waterbirds may choose to migrate to sites with improved habitat quality and the population may be sustained through the network of designated Special Protection Areas.
U. What substitutes
exist for the
main ecosystem
services from the
asset?
Natural flood defences can be substituted by adapting existing manmade flood defences and building additional defences, although the cost of building and maintaining hard defences may be significantly higher than maintaining and restoring the natural defences13. Further regulatory control of pollution inputs and waste water treatment can replace the present day water detoxification function provided by intertidal mudflats. Substitution of mudflats already storing historic pollutants is difficult, as loss of these areas will release pollutants into the water column, in turn negatively affecting the estuarine and marine ecology. Substitutes for carbon storage and sequestration provided by sand dunes and saltmarsh include replanting forests and placing further regulatory controls on CO2e emissions. Lugworm, ragworm and peeler crabs are the preferred bait of sea anglers. No man made substitutes exist, but other natural sources of bait include squid, sand eels, mackerel, mussels and cockles, as well as salmon and sea trout. Utilising these as bait is

UK NEAFO Work Package 1: Natural capital asset check – Annex 4: Case studies
eftec 183 November 2012
likely to create pressures elsewhere in the marine ecosystem. Recreational anglers can choose to fish for salmon on different rivers or choose to fish for a different species. Commercially, the North East Coast Fishery is a mixed species fishery and other fish can be caught alongside salmon. Fish can also be imported from abroad if the consumer demands it. At the local level there are no substitutes for the loss of intertidal foraging and roost sites, hence the sites status as an SPA. On a national scale however there are substitutes through the network of SPAs and SACs which provide alternative foraging and roosting sites providing these areas are not at carrying capacity. The cultural services supported by mudflats, saltmarsh, sand dunes and open beaches through wild species diversity and landscape values are non-substitutable at the local level. Nationally, alternative seascapes are available along the British Coast.
Uncertainties
O: Competing explanations: low agreement, albeit with significant evidence. There is no definitive trajectory of change for the asset: the ability of the asset to support some services is improving (water quality, salmon populations, seal populations, recreation) whilst some are in decline (waterbird populations, flood defence, water detoxification and carbon sequestration). There are no readily identifiable timescales for these changes. Q: Speculative: low agreement based on limited evidence. Estuaries are naturally dynamic systems and we do not have the capacity to model the impacts of medium to long term changes32. This makes it difficult to determine the point where recoverability of the natural capital asset declines. Determining individual threshold effects for a variety of ecosystem services is difficult due to the complex and interlinked nature of the estuarine habitats. Within the literature attempts have been made to determine thresholds for some services and these are the ones discussed for this asset check. R: Established but incomplete evidence: high agreement based on limited evidence. Continued monitoring of the Tees Estuary by various bodies since the 1970s has provided a wealth of evidence which can be used to demonstrate the reversibility of the overall system. Restoration of mudflats, saltmarshes and sand dunes is well documented in literature. There is a still a lack of evidence for reversibility in terms of the individual ecosystem services.

184
1.6.5. Natural capital asset check Question Guidance on Answer
V. Tradeoffs?
There is a trade-off between conservation and recreation at the Tees Estuary. The 2008 Defra Risk Review34 of on-going activities within EMS’ identified that increasing recreational activities pose a significant risk to EMSq. At the Tees dog walking and bait collection, are shown to disturb foraging and roosting waterbirds, and are attributed to population declines37,38,66. Recreational activities at the Tees Estuary and surrounding coastal area increasing due to environmental improvements and enhanced built capital at the coastal resorts of Redcar and Seaton Carew. The transition of Seal Sands from mudflat to saltmarsh will have significant benefits for hazard regulation and carbon sequestration. Saltmarshes provide nursery grounds for estuarine and marine fish species. This transition however will cause further loss of intertidal mudflats for foraging and may adversely affect the designated waterbird populations; hence this site would be notified as unfavourable under the habitat regulations assessments. Roosting opportunities would be significantly improved, in particularly benefitting redshank, shelduck and teal. Continued bait collection on Bran Sands is having a detrimental impact on the site for waterbirds. A closure of the site would allow the invertebrate population to recover, as well as providing undisturbed areas for foraging waterbirds. Closure of this site would likely exacerbate bait collection at other sites (up to 100 miles away). The fear for the Tees would be collectors entering Seal Sands illegally to collect bait there instead. It is difficult to manage sand dune systems for biodiversity and flood defence simultaneously. Destabilization of dunes, through artificial blow outs will encourage vegetation and improve biodiversity but this will have negative effects on the flood defence function. Managed realignment, such as the current scheme at Greatham Creek, will increase the intertidal area but usually at a loss of agricultural land. Whilst this will strengthen fish stocks through new spawning grounds, potentially stabilise waterbird populations and improve the flood defence function there will be a loss of agricultural crops or grazing land. Additional tradeoffs arise when built assets and economic target performance are considered. The Tees Barrage provides benefits for homes and businesses upstream of the barrage by restricting tidal flooding and significantly improving upstream river quality. Downstream the barrage has altered hydrodynamics, affecting sediment transport, water quantity, and salinity gradients. Future economic growth of the port will require significant river works including capital dredging, piling and placement of materials. Whilst these projects are subject to Habitats Regulations Assessments (Article 6 (3) to prevent adverse effect on the conservation interests), if there are imperative reasons of over-riding public interest for the development developments causing adverse effect can be permitted (Article 6(4)). Whilst there needs to be mitigation in terms of waterbirds, this will not extend to other ecosystem services affected by the developments (potentially of greater value than waterbird conservation, see Section 3).
W. Synergies?
Ongoing improvements in estuarine water quality are expected to benefit the ecological functioning which underpins delivery of the ecosystem services. Creation of saltmarsh, either by natural transition of mudflats or through managed realignment schemes will benefit flood defence and carbon sequestration, as well as increasing nursery grounds for fish species and providing additional roost sites for waterbirds. Managing the intertidal habitats under “no net loss” help maintain the regulating and provisioning services delivered by the natural capital asset.
q EMS: European Marine Sites are the intertidal areas of Special Protection Areas.

UK NEAFO Work Package 1: Natural capital asset check – Annex 4: Case studies
eftec 185 November 2012
Uncertainties
Established but incomplete evidence: tradeoffs and synergies between the key ecosystem services provided by coastal margins have been discussed within the literature. For the Tees Estuary there is well documented evidence of the effects of environmental change and this evidence can be related to ecosystem services provision.
X. Sustainability
test: is the asset
currently able to
give the target
performance?
As discussed in section 3, defining target performances for a range of ecosystem services is complex and instead three different target performances are identified for the estuarine asset: Target Performance under the EU Habitats Directive, Target Performance under the Water Framework Directive and The Role of the Tees Estuary in Economic Performance for the North East. Sustainability Test: EU Habitats Directive The intertidal habitats at the Tees Estuary are not supporting the waterbirds the site was originally designated for. Expected declines in the quality and extent of intertidal area, through increased recreational use and the spread of macroalgal mats in the short term, and coastal squeeze in the longer term will further limit the target performance of the asset for conservation. Sustainability Test: Water Framework Directive Under the WFD, the estuary is required to reach Good Ecological and Good Chemical status by 2015. The Environment Agency expects the estuary will achieve “Good Ecological Potential” and “High Chemical Status” by 2027. Water quality is continuously improving in the estuary, benefitting overall ecological functioning, and subsequently ecosystem services delivery. Achieving target performance will be hindered by erosion of intertidal habitats leaching historical pollution into the water column. The current spread of macroalgal mats on Seal Sands also restricts the estuary from reaching target performance. The Role of the Tees Estuary in Economic Performance for the North East As the extent of the natural flood defences decrease there is increased risk of coastal flooding affecting the industrial areas of the North and South Tees. Future re-development and expansion of the site may be hindered by the Habits Regulations if operations such as capital dredging, piling and shoreline development are deemed to have adverse effect on the SPA. Such developments are likely to have negative impacts on the future sustainability of the natural capital asset in delivering the suite of ecosystem services discussed throughout this asset check.
Y. Red flags? Estuaries are highly dynamic showing natural cycles of accretion and erosion which buffers some effects of perturbations. This is highly evident for the Tees which has shown a high degree of reversibility following large scale anthropogenic changes. The Tees is still reaching a new equilibrium and therefore current underperformance could be addressed as the estuary reaches a new steady state over the next 10 – 20 years. The main concern at present is the continued effects of macroalgal mats on Seal Sands and the subsequent impacts on waterbird populations. This risk is intensified by increasing recreational activities which are limiting foraging and roosting opportunities elsewhere in the estuary. In the longer term predicted declines in extent pose significant risks for regulating services, in particular the role of natural flood defences in defending the industrial landscape and role of mudflats in sequestering historical contaminants. There is a low risk that leeching of historical contaminants could have negative effects on water quality. This is limited by controls on degrading and new port developments. Evidence is needed to assess the potential impacts of changes in structure and functioning on the estuarine and marine fish populations which contribute to the North Sea Fish Stocks.

186
Uncertainties
Speculative: There is insufficient evidence on where the threshold stock of the habitats, below which affects the flow of ecosystem services considered in this case studies. Non-linear changes have been determined for some services (notably coastal defence) but not all. Current management under the Habitats Directive, whilst preferable for maintaining the quality and extent of habitats (predominantly for conservation) may negatively affect the emerging services, such as bait collection and recreation unless suitable management of the two can be identified.
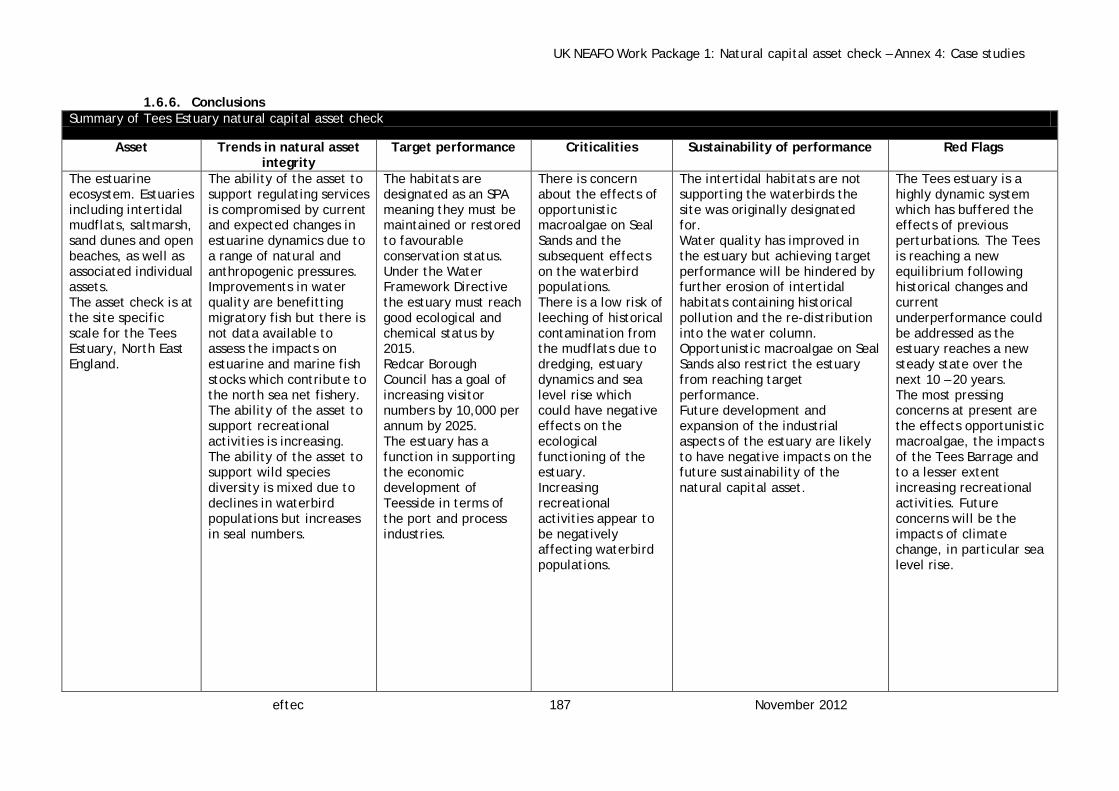
UK NEAFO Work Package 1: Natural capital asset check – Annex 4: Case studies
eftec 187 November 2012
1.6.6. Conclusions Summary of Tees Estuary natural capital asset check
Asset Trends in natural asset integrity
Target performance Criticalities Sustainability of performance Red Flags
The estuarine ecosystem. Estuaries including intertidal mudflats, saltmarsh, sand dunes and open beaches, as well as associated individual assets. The asset check is at the site specific scale for the Tees Estuary, North East England.
The ability of the asset to support regulating services is compromised by current and expected changes in estuarine dynamics due to a range of natural and anthropogenic pressures. Improvements in water quality are benefitting migratory fish but there is not data available to assess the impacts on estuarine and marine fish stocks which contribute to the north sea net fishery. The ability of the asset to support recreational activities is increasing. The ability of the asset to support wild species diversity is mixed due to declines in waterbird populations but increases in seal numbers.
The habitats are designated as an SPA meaning they must be maintained or restored to favourable conservation status. Under the Water Framework Directive the estuary must reach good ecological and chemical status by 2015. Redcar Borough Council has a goal of increasing visitor numbers by 10,000 per annum by 2025. The estuary has a function in supporting the economic development of Teesside in terms of the port and process industries.
There is concern about the effects of opportunistic macroalgae on Seal Sands and the subsequent effects on the waterbird populations. There is a low risk of leeching of historical contamination from the mudflats due to dredging, estuary dynamics and sea level rise which could have negative effects on the ecological functioning of the estuary. Increasing recreational activities appear to be negatively affecting waterbird populations.
The intertidal habitats are not supporting the waterbirds the site was originally designated for. Water quality has improved in the estuary but achieving target performance will be hindered by further erosion of intertidal habitats containing historical pollution and the re-distribution into the water column. Opportunistic macroalgae on Seal Sands also restrict the estuary from reaching target performance. Future development and expansion of the industrial aspects of the estuary are likely to have negative impacts on the future sustainability of the natural capital asset.
The Tees estuary is a highly dynamic system which has buffered the effects of previous perturbations. The Tees is reaching a new equilibrium following historical changes and current underperformance could be addressed as the estuary reaches a new steady state over the next 10 – 20 years. The most pressing concerns at present are the effects opportunistic macroalgae, the impacts of the Tees Barrage and to a lesser extent increasing recreational activities. Future concerns will be the impacts of climate change, in particular sea level rise.

188
Natural Capital
1.6.7. Appendix Appendix I. Definition of Estuarine Natural Capital and Study Scale Defining Natural Capital This case study will consider a variety of ecosystem services supported by functions within one estuary: The Tees Estuary, North East England. Estuaries are “complex ecosystems linking terrestrial and aquatic systems, encompassing interdependent sub tidal, intertidal and surrounding terrestrial habitats”2. Due to this complexity, and the decision to focus on a variety of ecosystem services provided by one specific estuary, the Broad Habitats Delineations and Individual Asset Approach was chosen to define the natural capital67. Estuaries are comprised of three ecosystem assets; intertidal mudflats, saltmarsh, and sand dunes & open beaches. The spatial extent of these habitats, the linkages between them and functional quality will determine the flow of the ecosystem services provided. The extent and functional quality of these ecosystem assets is determined by biological stocks, natural cycles and energy & mineral resources (Figure A).
Figure A: Defining natural capital: links between individual and ecosystem assets The main factor influencing the structure and composition of mudflats is exposure to wave action, which in turn determines sediment grain size2. Grain size will affect levels of nutrients, carbon and metals stored in the sediments46, as well as species composition of the mudflats4. Saltmarsh development is determined by the colonisation of mudflats by key plant species (in Europe Salicornia or Suaeda). Sediment accretion raises the level of the new marsh and reduces frequency and duration of tidal inundation, allowing in time for more complex saltmarshes to develop68. High levels vegetation will reduce wave velocity, thus improving the flood defence function on the saltmarsh, as well as reducing the rate of sediment erosion. The main factor influencing the structure and composition of open beaches and sand dunes is sediment supply from eroding coasts
Individual Assets Biological Stocks:
• Flagship species such as migratory and breeding
waterbirds;
• Fish including marine, estuarine and migratory;
• Benthos and macro fauna including polychaete
worms, cockles and mussels;
• Vegetation in the littoral and supralittoral zones.
Natural cycles: • Water cycles (including the tidal cycle and water
quality).
• Nutrient cycle (including soils and air).
Energy and mineral resources: • Sediment type and budgets.
Ecosystem Assets Habitat Stocks: • Intertidal mudflat
• Saltmarsh
• Sand dune and open
beaches

UK NEAFO Work Package 1: Natural capital asset check – Annex 4: Case studies
eftec 189 November 2012
and the seabed which is washed on shore and redistributed by the wind. Dune formation is initiated through seed germination along the strandline and a supply of new sand is vital for the continued existence of the embryonic community and the long-term survival of the dune ecosystem. The system will develop from embryonic dunes through to fixed dune grassland. This case study will focus primarily on the fore-dune in delivering flood defence benefits. Defining Natural Capital For hazard regulation, waste breakdown & detoxification and climate regulation the natural capital is defined through extent and structure of the ecosystem assets, as well as the combined functioning of individual assets including sediment type and budget, nutrient cycling, water quality and tidal inundation, and vegetation cover. The case study will consider the contribution of natural asset in maintaining fish stocks and the provision of bait for recreational sea angling. Intertidal mudflats provide habitats for benthic species including polychaete worms and peeler crabs. Benthic health is dependent on food availability (plankton, detritus, algae) and reproductive success10, as well as water and sediment quality. Benthic species are prey for estuarine, marine and migratory fish species utilising the estuary. Saltmarshes provide spawning grounds for some estuarine and marine fish thereby contributing to fish populations. The spawning success is influenced by the ecological quality and extent of the saltmarsh habitat, as well as the current fish stocks in providing populations for breeding success. Salmon rely on estuaries as migratory routes from the sea to inland reservoirs and lakes for spawning. These populations are dependent on water quality and food availability in the estuary at the time of migration, as well as nursery grounds inland for reproductive success and catch rates in rivers and open sea which will influence population dynamics. For this case study the natural capital depends on the extent and quality of the intertidal habitats in providing feeding and nursery grounds for various fish species; benthic health which determines species biomass and diversity and water quality. The Tees Estuary supports recreational activities. The natural capital is defined through the spatial extent and quality of open beaches and bathing water which provide areas for activities to take place, as well as the quality of the landscape. The contribution of biodiversity to recreational activities will be considered as part of this case study using two flagship species: migratory waterbirds and the Tees Harbour seal colony. During their migration waterbirds depend on intertidal mudflats for foraging69. The extent of the intertidal mudflats, as well as the density, availability and seasonal predictability of macro-faunal prey will determine the number of birds which can exploit a site until the carrying capacity of the site is reached66. The quality and extent of roosting sites (including saltmarsh) during high tides will also affect over winter survival. Survival during the winter months is important in determining waterbird population trends70. It is also recognised that the spring and summer breeding season will influence waterbird populations and thus the numbers of waterbirds migrating to an estuary each year11. This factor will be considered when discussing the over winter population trends, however a full analysis of spring and summer breeding will not form part of this asset check. Estuaries are also important for seal colonies and successful colonies can be used as indicators for the health of the estuary21.The natural capital asset includes the ecological elements which contribute to maintaining the breeding success of the Harbour Seal colonies. Study Scale The Tees Estuary flows through the heavily industrialized conurbation of Teesside, comprising the towns of Stockton-on-Tees, Billingham and Middlesbrough, which have a combined population in excess of 400000 (Figure B). The 15 km stretch from Newport Bridge (Middlesbrough) to estuary mouth, is lined by port facilities and industrial sites, including one of the largest chemical and petrochemical complexes outside the USA and the third largest UK Port by volume. During the 1970s the Tees was considered to be the most polluted river in the UK20.
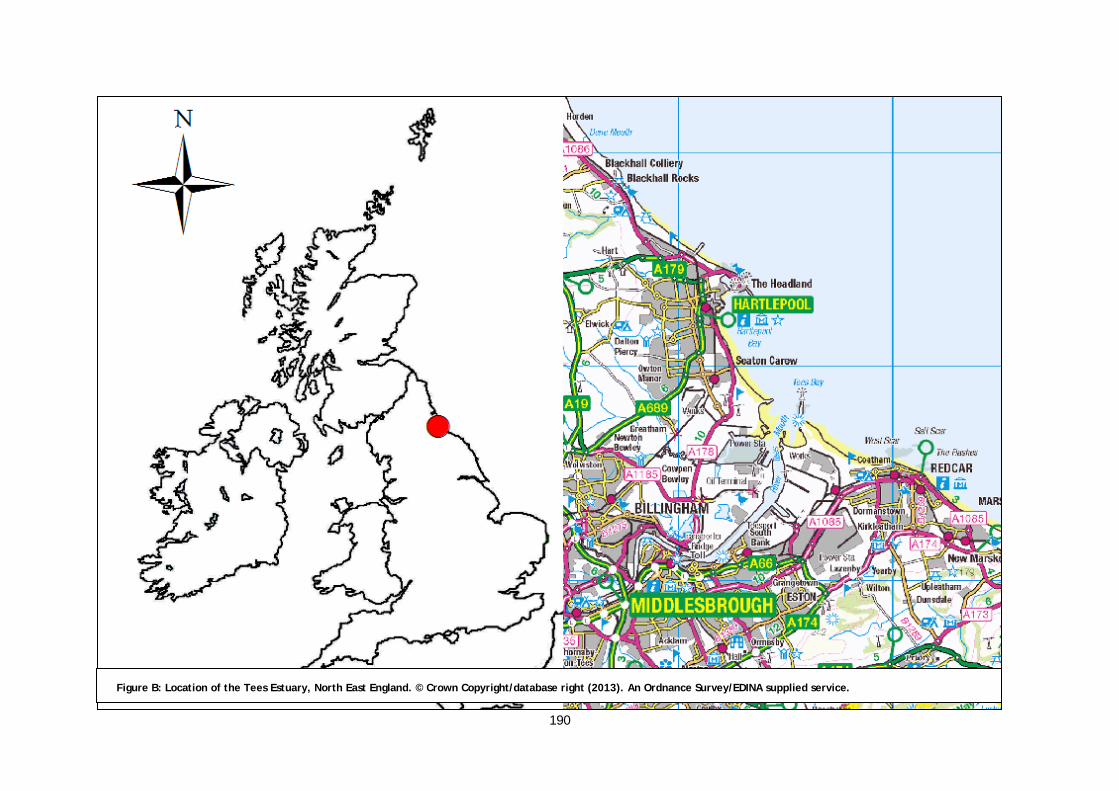
190
Figure B: Location of the Tees Estuary, North East England. © Crown Copyright/database right (2013). An Ordnance Survey/EDINA supplied service.

UK NEAFO Work Package 1: Natural capital asset check – Annex 4: Case studies
eftec 191 November 2012
Appendix 2: Extent and Condition of the Natural Capital Asset Extent of Natural Capital Asset The extent of land reclamation at the Tees Estuary is shown in Figures C and D. Current habitat area is shown in Figure E and habitat condition in Figure F.
Figure C: Tees Estuary historic map 1849. Courtesy of INCA.
Figure D: Tees Estuary present day. © Crown Copyright/database right (2013). An Ordnance Survey/EDINA supplied service.

192
Condition of Natural Capital Asset
JNCC and Natural England report on the condition of sites designated under the Habitats and Wildbirds Directives (92/43/EEC). The assessments report on the sites ability to support designated waterbirds and the presence of indicator plant species. On a national scale the overall assessment is one of unfavourable - bad and deteriorating for mudflats, saltmarsh and sand dunes11,12.
The Teesmouth and Cleveland Coast Special Protection Area is divided into five SSSIs for reporting (Figure F). 72% of the SSSI units are in unfavourable recovering condition, 3% are unfavourable no change and 25% are favourable. The main reason for the unfavourable condition assessments is the declines in designated waterbird species which do not follow the national trends. Seal Sands has had severe declines in numbers of shelduck (47%) and knot (34%), Seaton Dunes and Common have had declines in sanderling, ringed plover, knot and turnstone and at South Gare and Coatham Sands there have been declines in knot (65%) and breeding little tern (96%) (comparisons are made using the oldest reliable WebS dataset 1989-1994)29.
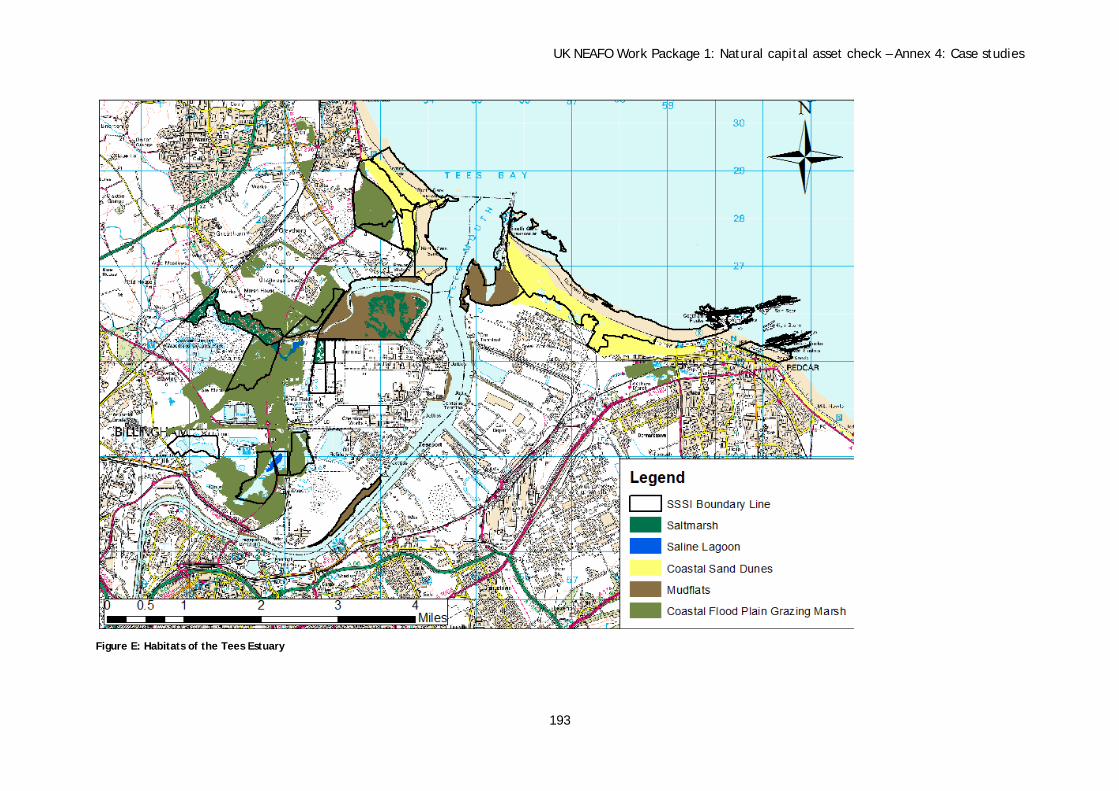
UK NEAFO Work Package 1: Natural capital asset check – Annex 4: Case studies
193
Figure E: Habitats of the Tees Estuary

194
Figure F: SSSI Condition assessments

UK NEAFO Work Package 1: Natural capital asset check – Annex 4: Case studies
195
Appendix 3: Performance of Natural Capital Asset: Methodology and Analysis Hazard Regulation Function As discussed by Beaumont et al, (2010) one approach of valuing coastal defence is to estimate the coastal expenditure avoided, i.e. cost of replacing a habitat with a sea wall55. For the Tees Estuary a replacement cost is calculated using Environment Agency replacement costs (difference in cost between sea wall construction and maintaining equivalent natural habitats) and linear length of sand dune habitats (lengths calculated in ArcGIS). The potential future value of Seal Sands as a flood defence is also calculated based on the expected transition to saltmarsh habitat (estimated 2030) (Table A). The net present value (NPV) of saltmarsh was calculated using a discount rate of 3.5% as set out in the HM Treasury Greenbook. Table A: Cost estimates to replace saltmarsh and sand dunes with sea walls at the Tees Estuary
Sub Habitat Type Total Habitat Length (m) Tees Estuary 2012
Predicted Habitat Length (m) Tees Estuary 2030
Average costs to replace habitat with manmade sea wall (£ per m) (2007 Figures)
Total Replacement Cost for habitat (2007 price)
Total Replacement Cost for habitat (2012 price)
NPV (saltmarsh, benefits expected in 2030)
Saltmarsh 0 3055* 1522** £4,649,710 £5,207,675 £2,803,610
Sand Dune 2851 - 1487 £4,239,437 £4,748,169 -
* Projected total habitat length if Seal Sands full transitions to saltmarsh
** cost of maintaining saltmarsh assumed to be £0 per m

196
Climate Regulation
The Natural England review of carbon sequestration by habitats indicates that saltmarsh habitats sequester 2.1 tC/ha/yr; intertidal mudflats sequester 1.6 tC/ha/year; and sand dunes between 0.58 and 0.73 tC/ha/yr44. Carbon is converted to carbon dioxide (CO2) by applying a molecular weight of 3.67. As demonstrated by Beaumont et al, combining the carbon sequestration estimates with data for habitat area, estimates of CO2 sequestered by these habitats can be derived (Table B) 55.
Table B: Potential carbon storage for intertidal mudflats and sand dunes at the Tees Estuary
Habitat Area (ha) Potential annual carbon sequestration (tC/ha/yr)
CO2 sequestration rates (tCO2/ha/yr)
CO2 sequestration potential of Tees Estuary
Habitats (tCO2/yr)
Saltmarsh 88 2.1 7.7 678.2
Intertidal Mudflat 358 1.6 5.9 2112.2
Sand Dune 295 0.58 (lower) 2.1 619.5
0.73 (upper) 2.7 796.5
Combining these sequestration rates with the 2012 DECC carbon value the £/ha/yr values can be derived for the provision of C sequestration by habitats55. For this analysis the DECC non-traded 2013 values (real 2011) were used to calculate the current value of the service (Table C). These figures allow us to calculate the estimated value of the habitats at the Tees Estuary in terms of CO2 sequestration (Figure G).
Table C: Value of annual carbon dioxide sequestration for Tees Estuary habitats (real 2011 prices)
DECC CO2 price (£/tC02) (2013 predicted) 45 Value of Annual Carbon Storage Potential (£/tCO2/ha/yr)
Saltmarsh Intertidal Mudflat
Sand dune (low)
Sand dune (upper)
DECC non traded value of CO2 (low)
£29.00 £223.50 £171.10 £60.90 £78.30
DECC non traded value of CO2
(centre point) £57.00 £439.30 £336.30 £119.70 £153.90
DECC non traded value of CO2 (high)
£86.00 £662.80 £507.40 £180.60 £232.20

UK NEAFO Work Package 1: Natural capital asset check – Annex 4: Case studies
197
Figure G: Estimated value of carbon sequestration of Tees Estuary habitats in 2013 (real prices 2011)
The current and future values of this service can also be compared. Future habitat areas were calculated based on predicted sea level rise, proposed managed realignment schemes and expected transition to saltmarsh. It should be noted that these are best estimates based on current data availability and that no data is available on predicted changes in sand dune coverage (Table D). Taking the DECC central non-traded carbon value, the value of saltmarshes for carbon dioxide sequestration between 2013 and 2030 increases by approximately £107,172 (Figure H). This is due to increased habitat area, and increased carbon value. The value of mudflats for carbon dioxide sequestration between 2013 and 2030 declines by approximately £47,138 (Figure I) (DECC central non traded price) due to a decline in habitat area.
Table D: Predicted changes in habitat area
Habitat Current Area (ha) Predicted Increase (ha) Predicted Decrease (ha)
Future Area (2030) (ha)
Saltmarsh 88 167.7 n/a 255.7
Intertidal Mudflat 358 7.9 198.1 167.8
Sand Dune 295 n/a n/a n/a

198
Figure H: Estimated value of carbon dioxide sequestration service provided by Tees Estuary saltmarshes, 2013 and 2030.
Figure I: Estimated value of carbon sequestration service provided by Tees Estuary mudflats 2013 and 2030

UK NEAFO Work Package 1: Natural capital asset check – Annex 4: Case studies
199
As also discussed by Beaumont et al (2010) it is possible to calculate the value of carbon stock stored in coastal margin habitats. To replicate this study for the Tees Estuary data is needed on the above and below ground vegetation, and in soils up to 15cm depth which is unavailable at present.
Recreational Activities
In 2010 Natural England and the Teesmouth and Cleveland Coast Management Group commissioned a report into the effects of recreational activities at the Teesmouth and Cleveland Coast. The results of the September 2010 visitor survey are presented here.
289 surveys were completed across six sites along the Teesmouth and Cleveland Coast (Figure J) over a two week period in September 2010. An overview of visit rate, distance travelled, preferred activity and site attributes are presented in Figure K.
Figure J: Recreational survey site

200
Figure K: An overview of the visitor survey results

UK NEAFO Work Package 1: Natural capital asset check – Annex 4: Case studies
201
Top Two Site Attributes Activity Visit Rate and Modal Visit Distance
Access
Walking
Every day
Convenience
Dog walking
Twice weekly
Natural environment
Birdwatching
Monthly
Tranquility
Sea angling
Live at site
Views
Photography
Travel between 5 and 10 miles
Frequency of activity
Over 10% of respondents
Over 20% of respondents
Over 40% of respondents
Distance Travelled to Site
The distances respondents travelled to the survey sites were calculated using the website www.postcode.org.uk. The postcodes for the survey sites were compared with the first four digits of the respondent’s postcodes and then the distances travelled were calculated. The distances were then placed in one of eight bands ranging from ‘at site’ (band one) to ‘over 50 miles’ (band eight).
Across the entire EMS 32% of visitors lived within the same area, followed by 30% travelling between 5 and 10 miles (Figure L). All sites except South Gare were most popular with people from the same area.

202
Figure L: Survey results: Question 15: Distances travelled to each of the survey sites
51 miles and over
31-50 miles
21-30 miles
11-20 miles
5-10 miles
3-4 miles
1-2 miles
Same Area

UK NEAFO Work Package 1: Natural capital asset check – Annex 4: Case studies
203
Visitor Frequency
Overall 24% of the respondents visited the EMS “a couple of times a week”, with 18% visiting the site daily and 15% weekly (Figure M).
Figure M: Visor frequency across all survey sites
Daily Couple of times a week Weekly Couple of times a month Monthly Less often Other

204
Main Recreational Activity
Over 60% of respondents either chose walking or dog walking as their main activity (Figure N). Sea angling and birdwatching both accounted for 8% of responses and all activities accounted for less than 8% of responses.
Figure N: Recreational activities undertaken at each site
Walking Dog Walking Angling Bird Watching Photography
Sea Surfing RNLI Museum Sand Surfing Bait Digging Relaxing
Boat Watching Children Off Road Driving Diving Horse Riding
Cycling Shopping Fossil Finding Running Metal Detection
Sea Watching Shell Collecting Wood Collecting

UK NEAFO Work Package 1: Natural capital asset check – Annex 4: Case studies
205
Site Attributes
The most important site attribute overall was convenience/close to home (23% of responses). This relates to the previous finding from the postcode information that 30% of respondents live within the same area as the site. This was closely followed by the natural environment and what it provides (22%). Other important site attributes included views (15%), access (14%), tranquillity (10%) and to a lesser extent parking (6%). All other features accounted for less than 5% of the total responses (Figure O).
Figure O: The most important attributes of each site
Convenient Natural Environment Views Access
Tranquility Parking Other Good for Children
Safe Good for Dogs Bridle Paths

206

UK NEAFO Work Package 1: Natural capital asset check – Annex 4: Case studies
207
2. Lakes and Reservoirs Asset Check October 2012 Introduction This is the first elaborated version of the asset check approach being developed through a scoping study for Defra and the UKNEA follow-on WP1. Any comments on this are welcome and should be sent to the project manager, Ian Dickie: [email protected] This proposed approach lays out a series of questions, the answers to which form the analysis in, and aim to provide conclusions from, a natural capital asset check. The working definition of a ‘natural capital asset check’ is:
An assessment of the current and future performance of natural capital assets, with performance measured in terms of their ability to support human well-being.
Thus, the purpose of a natural capital asset check is to assess how changes in a natural capital asset affect human wellbeing. It incorporates concepts of integrity, performance, red flags and sustainability. It is organised in the following main steps:
1. The asset.
2. Integrity of the asset.
3. Performance of the asset.
4. Asset criticalities.
5. Asset check.
6. Conclusions Notes on the Tables: The questions in the tables are in coloured boxes . The tables also include guidance on answering the questions in italics that can be overwritten as the proposed approach is completed. Uncertainty can be described using the following scale, adopted from the UKNEA:
Well established: high agreement based on significant evidence Established but incomplete evidence: high agreement based on limited evidence Competing explanations: low agreement, albeit with significant evidence Speculative: low agreement based on limited evidence

208
2.1.1. Natural capital asset
Question Answer
Z. Define Natural Capital asset being checked
Lakes & Reservoirs
AA. What is the spatial scale for which the asset check is being conducted
The spatial scale of the asset check varies dependent on data limitations. UK or GB (GB lakes database or UK Lakes Net) – Q.E (extent) National: England & Wales (EA, Defra data), Scotland (SEPA, SG data) River Basin Districts (EA/SEPA data) Local (individual site examples)
BB. Define the timescale for the asset check.
This asset check focuses on the period 2006-2012 (1st Reporting cycle of WFD and Habitats Directive cycle), as limited data are available on lakes before this. The condition of assets can change over this 6 year reporting period. The asset check really needs to be based on seasonal to annual data over multiple years to be ecologically-relevant and assess trends in status and service provision/delivery. Current WFD monitoring may be sufficient in frequency and scale to assess the condition in terms of water quantity and quality, but some important elements of biodiversity (e.g. fish) may need more frequent and more widespread monitoring than current, using non-destructive techniques (e.g. hydroacoustics)
CC. What are the main ecosystem services the asset provides?
Three main assets: water quantity, water quality and biodiversity, that together provide: 1. Provisioning services: water supply (domestic, industry, agriculture), energy production (Hydro-power) 2. Regulating services: flood/drought/flow regulation, water purification, climate regulation 3. Cultural services: recreation (water sports, angling, bird-watching), tourism & national heritage, science
& education, nature conservation (particularly charismatic species) 4. Supporting services: nutrient cycling, primary production, biodiversity (environmental flows)
Data are available on the asset (water quantity and quality), but due to data limitations the main services considered in this asset check are water supply and hydropower and to a limited extent recreation.

UK NEAFO Work Package 1: Natural capital asset check – Annex 4: Case studies
209
2.1.2. Integrity of natural capital asset
Question Answer Trends
Past trend Current trend Future Trend Summary of Trends (see key*)
DD. What is the extent of the natural capital asset?
Data from the GB lakes database (v2.2): There are 14,342 lakes & reservoirs in GB >=0.01 km2. Of these 685 are reservoirs The total surface area of these are 2024 km2 and approximately 37,587 x106 m3 by volume. Of this: Scotland: 89% vol. of water, 73% area England: 8% vol., 23% area Wales: 3% vol. 4% area There are 481 larger lakes and reservoirs >0.5 km2 in GB: 1264 km2 surface area 34,566 x106 m3 volume (i.e. 92% of >1ha)
Most reservoirs constructed in 19th century. Kielder Water & Rutland Water, the largest artificial reservoirs in the UK were built in the 1970s
Current & planned new reservoir construction in SE England
↔ Established but
incomplete evidence
EE. What is the condition of the natural capital asset?
Condition of quantity: water level – draw-down data is not readily available. Chemical quality: WFD chemical status, Nitrate, total phosphorus and dissolved oxygen data available for larger lakes (>0.5 km2) as part of WFD monitoring. Biological quality (WFD status): England CurrentStatus Total % High 1 0.2%
Limited data on past trends as lakes were not routinely monitored in the UK prior to 2006 WFD monitoring Some data from few sites e.g. CEH long-term monitoring, Broads Authority
CEH data highlights both improvements (Loch Leven, Esthwaite Water) and declines (Loweswater) in water quality in relation to nutrient enrichment, largely due to site-specific issues (e.g. improved sewage
Expected future improvements due to requirement to meet WFD targets but dependent on the success of catchment management actions to reduce diffuse nutrient pollution, invasive species and climate
↑↓
Speculative as the impacts of climate
change and invasives are so
uncertain as is the success of diffuse pollution control

210
Good 209 33.7% Moderate 350 56.4% Poor 54 8.7% Bad 7 1.1% 66% of sites in England are moderate status or worse and currently fail the WFD target of good ecological status. The best RBD is Northumbria with 67% of sites in good status and the worst region is Humber with only 14% of sites in good status. 61% of 122 sites in Wales are moderate status or worse. Data can be broken down into River Basin districts and individual water bodies (Source: EA – see accompanying notes at end) Data also available to download from SEPA & EANI on water quality and biological status.
treatment/diversion, agricultural change)
change
Uncertainties
Current status “Well Established”. Trends “Established but incomplete evidence” – sufficient time series only available for 10-20 lakes and reservoirs in UK
Key for trends
↑ increasing ↓ decreasing
↔ evidence shows no trend O no evidence
↑↓ both increasing and decreasing (this could reflect ambiguous evidence and/or spatially differing trends)
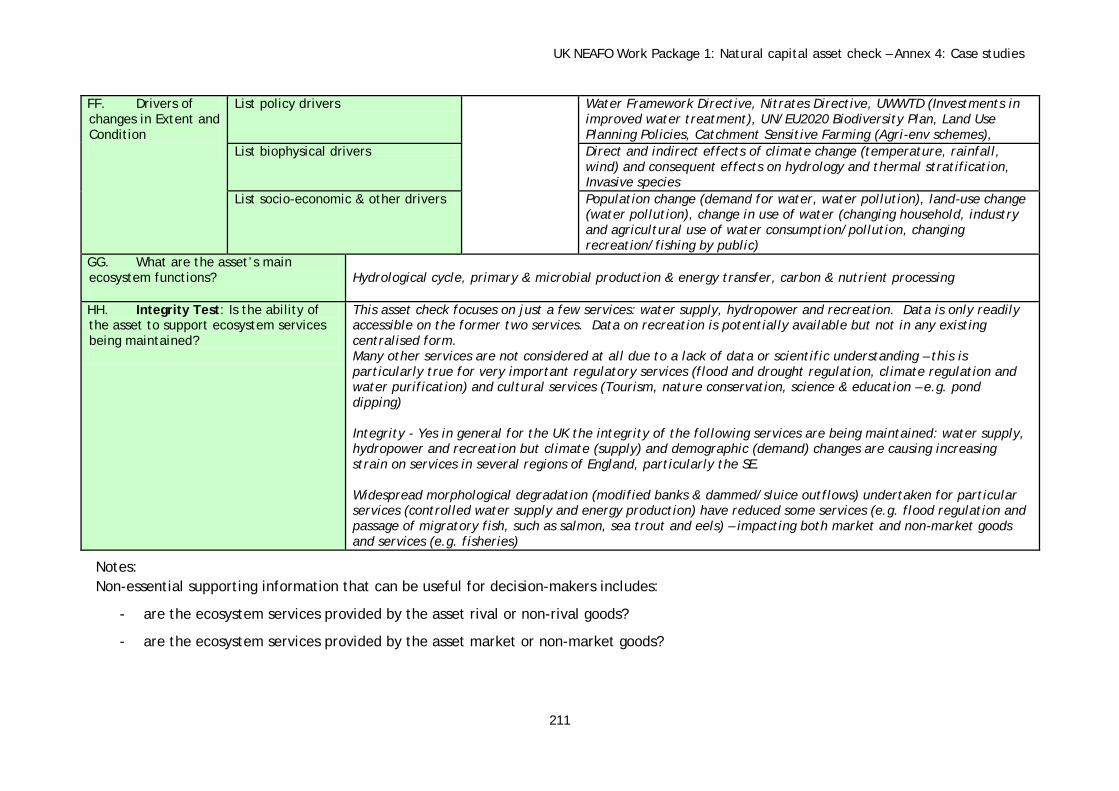
UK NEAFO Work Package 1: Natural capital asset check – Annex 4: Case studies
211
FF. Drivers of changes in Extent and Condition
List policy drivers Water Framework Directive, Nitrates Directive, UWWTD (Investments in improved water treatment), UN/EU2020 Biodiversity Plan, Land Use Planning Policies, Catchment Sensitive Farming (Agri-env schemes),
List biophysical drivers Direct and indirect effects of climate change (temperature, rainfall, wind) and consequent effects on hydrology and thermal stratification, Invasive species
List socio-economic & other drivers Population change (demand for water, water pollution), land-use change (water pollution), change in use of water (changing household, industry and agricultural use of water consumption/pollution, changing recreation/fishing by public)
GG. What are the asset’s main ecosystem functions?
Hydrological cycle, primary & microbial production & energy transfer, carbon & nutrient processing
HH. Integrity Test: Is the ability of the asset to support ecosystem services being maintained?
This asset check focuses on just a few services: water supply, hydropower and recreation. Data is only readily accessible on the former two services. Data on recreation is potentially available but not in any existing centralised form. Many other services are not considered at all due to a lack of data or scientific understanding – this is particularly true for very important regulatory services (flood and drought regulation, climate regulation and water purification) and cultural services (Tourism, nature conservation, science & education – e.g. pond dipping) Integrity - Yes in general for the UK the integrity of the following services are being maintained: water supply, hydropower and recreation but climate (supply) and demographic (demand) changes are causing increasing strain on services in several regions of England, particularly the SE. Widespread morphological degradation (modified banks & dammed/sluice outflows) undertaken for particular services (controlled water supply and energy production) have reduced some services (e.g. flood regulation and passage of migratory fish, such as salmon, sea trout and eels) – impacting both market and non-market goods and services (e.g. fisheries)
Notes: Non-essential supporting information that can be useful for decision-makers includes:
- are the ecosystem services provided by the asset rival or non-rival goods?
- are the ecosystem services provided by the asset market or non-market goods?

212
- Some main final services may rely on supporting and intermediate services from natural capital assets not considered in the asset check. Links to the status of these other assets may be an important factor for the asset check. It may be possible to consider their status/trend/management within the asset check, but where the links become complex, such analysis may not be feasible. However, these interdependencies should be noted; furthermore the natural capital underpinning the final services in question may justify a separate asset check.

UK NEAFO Work Package 1: Natural capital asset check – Annex 4: Case studies
213
2.1.3. Performance of natural capital asset In this context ‘performance’ is fitness to carry out the role which is required of a capital asset. This is regarded as useful because defining the target performance of natural capital assets captures both the current and future quantity and quality of an asset. Human ‘requirements’ include basic human needs, but also reflect infinite wants, so the definition of performance is usually subjective.
Question Guidance on Answer
II. Is there a measure of the current output of services from the asset?
• Water supply: abstraction data available from Defra (see Appendix 1) – but only distinguishes surface and groundwaters. Lakes & reservoirs are not distinguished from river abstractions.
• Hydropower: Data available from Dept. Of Energy & Climate Change – see Appendix 1 • Fisheries and Recreational angling: data should be available at regional (fisheries boards) or local level (e.g. Loch Leven
daily fish catch data, Windermere angling records & Charr catch) • Recreation (general): Natural England MENE study examines the use of freshwaters (lakes, rivers, canals considered
together). Lake shores a favoured location for (dog) walkers. • Recreation (watersports): Data not currently available in centralised database
JJ. What goods and benefits do these services support?
Water – for drinking, industry (e.g. cooling water), irrigation for agriculture (Defra data) Fish – EA angling rod catch data for rivers only Energy – hydropower (see Appendix 1) Public health and well-being (recreation & tourism) Economic benefits of tourism (e.g. Cumbrian Lake District, Broadland, Loch Lomond, Loch Ness) & recreation (e.g. sailing clubs, water sports events)
KK. What is the target performance from the asset?
• Quantity: EA maximum abstraction targets for reservoirs? Targets associated with renewable energy obligations for hydropower?
• Quality: quality targets for water supply (Nitrates Directive target) & recreation (Bathing Water quality (Faecal Indicator Organisms & cyanobacteria)
• Biodiversity: WFD Status & Habitats Directive targets Uncertainties
Water supply and energy production: Well established: high agreement based on significant evidence Recreation: Established but incomplete evidence: high agreement based on limited evidence – lack of centralised database Low certainty for most other services: “Speculative: low agreement based on limited evidence” This is largely because of a lack of data or scientific understanding on most regulatory and cultural services.
Defining performance: Answering these questions can help define performance, but not all
What policy targets are there for the asset?
WFD standards, priority substances (toxic chemicals) Uncertain what renewable energy targets and water supply targets are – targets
presumably held by water companies What is the trend in the main services the asset provides?
1. Water supply (domestic, industry, agriculture) – decreasing (see Appendix 1) 2. energy production (Hydro-power) – increasing (see Appendix 1)

214
questions can be answered for all assets
3. Recreation (water sports): increasing [anecdotal evidence] 4. Recreation (angling): No data 5. Tourism: No centralised data explicit to freshwaters 6. Biodiversity & nature conservation – mixed picture. Data available from NE,
SNH, Wales (see Appendix 1)
What types of goods are supported by the asset?
Drinking water, energy Limited: food (fish) and fibre (reed thatching)
Who benefits from the goods?
Local households, businesses and farmers from water and energy In some cases there is spatial separation, e.g. water supply to London Water supply data available on population numbers per region
What wellbeing results from the goods?
Drinking water essential for life Limited data (NE MENE study has reasons why people visit freshwaters)
LL. Are any future changes in target performance expected?
Yes expected increases in water demand due to reduced supply (climate change) and increased demand (demographic changes) in some southern regions of England Expected increases in quality due to WFD & Habitats Directive implementation Water supply: Water company future targets? Energy production targets? Future recreation targets?
MM. Can future target performance be defined?
Models of future supply and demand for clean water for drinking, industry, energy production are available (SCENES Project & follow-up) based on models of climate change, land-use and demographic changes

UK NEAFO Work Package 1: Natural capital asset check – Annex 4: Case studies
215
2.1.4. Natural capital asset criticalities
Question Answer
NN. What is the trajectory of change for the asset?
• Water quantity: depends on supply (rainfall) & demand management (SCENES scenarios). Expect climate change to vary across UK – in SE England increased temperature and decreased rainfall, but Scotland may get wetter (summers?)
• Water quality: positive, stepped changes in water quality as legislation introduced/practice change, possibly less improvement in rural regions impacted by diffuse pollution
• Biodiversity – improvements and losses OO. Are there any standards or agreed limits of change to the asset?
WFD provide standards for the assets but not for the services Abstraction/draw-down limits for reservoirs?
PP. Are there likely to be any threshold effects?
Water quantity – drought thresholds Water quality threshold – temp effects on nutrient release, nutrient thresholds for algal blooms (see Appendix 1) Biodiversity – water level change thresholds for macrophytes, inverts and fish; environmental flows (flushing) Recreation-threshold for cyanobacteria (see Appendix 1). Switch from macrophyte-dominated state to phytoplankton dominated state with enrichment (Scheffer et al., 1993)
QQ. What is the reversibility of changes to the asset?
Water quality & biodiversity restoration (e.g. Norfolk Broads, Loch Leven, Windermere) Irreversible losses of endemic fish species (e.g. vendace in Bassenthwaite)
RR. What is the cumulative effect of impacts on the asset?
Multiple stressors combine to reduce quantity and quality further – e.g. drought and algal blooms Time lags – legacy P in sediments of lakes and reservoirs (delay recovery)
SS. What risks are associated with current trends in the asset integrity?
Increasing frequency and magnitude of droughts in England Impacts of invasive species – particularly in warmer southern England
TT. What substitutes exist for the main ecosystem services from the asset?
Water supply – desalinisation (energy intensive), compost toilets (substitute for household water use), re-use of grey water Hydropower – other renewables Freshwater fisheries – coastal and marine fisheries Water purification: treatment plants or constructed wetlands Recreation: coastal waters for angling and water sports
Uncertainties
Uncertainty in criticalities as a whole? Established but incomplete evidence: high agreement based on limited evidence (water quality improvements) & Speculative: low agreement based on limited evidence (climate change-related criticalities)
- What is the level of investment needed in the natural capital to maintain it above the limits/thresholds identified above? - What are the distributional (social group/intergenerational) implications of the criticality identified? - For question T, define on what basis the substitute(s) are identified (e.g. which ecosystem services the substitute provides).

216
2.1.5. Natural capital asset check
Question Guidance on Answer
UU. Tradeoffs?
Yes. In general, trade-off between water quantity services (abstraction - water supply, hydropower) and water quality or biodiversity-related services due to pollutant dilution effects & morphological changes (lake level lowering, fish barriers to passage) There are trade-offs between services at the landscape scale where management of agriculture to reduce nutrient run-off to freshwater may entail decreases in productivity (e.g. using less fertiliser, less intensive)
VV. Synergies?
Yes increasing water quality will increase most biodiversity-related services and also water supply (reduced treatment costs) e.g. improved macrophyte and invertebrate habitats likely to result in improved fish populations and, therefore, more sustainable fish composition and abundance for angling
Uncertainties
Some relationships well established, others speculative due to limited evidence
WW. Sustainability test: is the asset currently able to give the target performance?
• Scotland: generally yes – both quantity and quality are generally high, so sustainable water supply, hydropower and recreational use. Central belt possibly shows some unsustainable services (water purification?)
• England: more regionally variable: North – sustainable, South – more at risk of being unsustainable given climate and demographic changes
• Biodiversity targets (WFD & Habitats Directive): generally sustainable – partic in NW England & Scotland.
If yes - will this performance be sustained into the future?
• Scotland: generally yes – both quantity and quality are generally high and unlikely to change dramatically • England: regionally variation in risk: North – sustainable, South –at risk of being unsustainable given
climate and demographic changes • Wales – intermediate?
If no – state why?
Water purification service unsustainable due to excessive nutrient loading in some regions
XX. Red flags? The assets are delivering services adequately at present but there is limited knowledge of climate change impacts, demand management and tipping points.
Uncertainties
Speculative: low agreement based on limited evidence

UK NEAFO Work Package 1: Natural capital asset check – Annex 4: Case studies
217
2.1.6. Conclusions A summary of the asset check should reflect the uncertainties in the evidence available, conclusions on integrity and sustainability of the natural capital asset, and future sustainability of the asset is assessed in terms of whether it is expected to deliver the target performance, and the presence of red flags. Where these issues are quantified relevant data should be included.
Table: Summary of natural capital asset check
Asset Trends in natural asset integrity
Target performance Criticalities Sustainability of performance
Red Flags
Lakes & Reservoirs Generally national or River Basin District-scale data Some well researched individual site examples
Integrity maintained in general for UK for water supply, hydropower and recreation, but climate (supply) and demographic (demand) changes are causing increasing strain on services in several regions of England, particularly the South-east. Widespread morphological degradation (modified banks & dammed/sluice outflows) undertaken for particular services (controlled water supply and energy production) have reduced some services (e.g. flood regulation and passage of migratory fish, such as salmon, sea trout and eels) – impacting both market and non-market goods and services (e.g. fisheries).
Quantity: EA maximum abstraction targets (or just for rivers?) Meet renewable energy obligations? Quality: quality targets for water supply (Nitrates Directive target) & recreation (Bathing Water quality (Faecal Indicator Organisms & cyanobacteria) Biodiversity: WFD Status & Habitats Directive targets, Angling performance targets?
WFD provide standards for the assets, but not for the services. Water quantity thresholds – drought. Water quality threshold – temp effects on nutrient release, climate/ nutrient thresholds for algal blooms Biodiversity – water level change thresholds for macrophytes, inverts and fish; environmental flows (flushing) threshold for cyanobacteria
Scotland: generally yes – both quantity and quality are generally high, so sustainable water supply, hydropower and recreational use. Central belt possibly shows some unsustainable services (water purification?) England: more regionally variable: North – sustainable, South – more at risk of being unsustainable given climate and demographic changes Wales – intermediate. Biodiversity targets (WFD & Habitats Directive): generally sustainable – particularly in NW England & Scotland.
The assets are delivering services adequately at present, but there is limited knowledge of climate change impacts, demand management and tipping points.

218
2.1.7. Appendix
Appendix 1: Evidence used in NCAC of Lakes & Reservoirs
E. What is the extent of the natural capital asset? A detailed inventory of lakes and reservoirs in the UK has been compiled (GB lakes database; Hughes et al., 2004) and a UK version is searchable online18. The database holds information on lake area and volume (Table 1), conservation designations and catchment characteristics which can be used for assessing and mapping the extent of Natural Capital. It is evident that a large proportion of lakes (73% by area, 89% by volume) are located in Scotland (Table 1). Table 1: Number, area and volume of lakes ≥1 ha (0.01 km2) by country
Country Number Area (km2) Vol. (x106 m3) England 5710 467 3054 Scotland 8033 1473 33546 Wales 599 84 986 Total 14342 2024 37587
Source: GB lakes database v2.2 Note: Volumes are an estimate based on area x estimated mean depth The EC Water Framework Directive assesses the ecological health of lakes and reservoirs >0.5 km2. The corresponding monitoring data covers only 481 (3%) of the 14,342 lakes in GB, but these 481 lakes and reservoirs account for approximately 90% of the volume of water in GB (Table 2). Table 2: Number, area and volume of lakes ≥0.5 km2 by country
Source: GB lakes database v2.2 Note: Volumes are an estimate based on area x mean depth (usually measured)
F. What is the condition of the natural capital asset? The quality of lakes and reservoirs has traditionally been monitored with three standard measures: Total Phosphorus (a measure of nutrient stress), Phytoplankton Chlorophyll-a (response of algae to nutrient enrichment) and Secchi depth (a measure of water clarity). Since 2007, more elaborate biological indices have been introduced for assessing lake ecosystem health for the Water Framework Directive (WFD) based on phytoplankton, macrophytes and invertebrates, alongside supporting physical, chemical and hydrological data. Metrics for fish are still under-development.
2.1.8. Lakes – current condition (WFD Status) The current ecological status of lakes and reservoirs in England & Wales was reported in 2011 for the 1st River Basin Planning cycle of the WFD19. Table 4 shows the results in relation to the 5 quality status classes, broken down into the nine River Basin Districts in England. This clearly highlights that 66% of sites in England are moderate status or worse and currently fail the WFD target of good ecological status. The best region is Northumbria with 67% of sites in good status and the worst region is Humber with only 14% of sites in good status. 18 http://www.uklakes.net/ 19 www.environment-agency.gov.uk/wfd
Co untry Numb e r Are a (km 2 ) Vo l. (x10 6 m 3 )England 115 201 2461Scotland 339 1013 31240Wales 27 51 865T o ta l 481 1264 34566% o f >1ha 3% 62% 92%

UK NEAFO Work Package 1: Natural capital asset check – Annex 4: Case studies
219
Table 4. Summary results of ecological status classification in lakes and reservoirs in the River Basin Districts of England. Data summarised from the 1st cycle of WFD Assessment3
River Basin District High Good Moderate Poor Bad Total %HG %MPB
Anglian 12 22 11 1 46 26% 74% Humber 19 104 10 1 134 14% 86% North West 1 45 112 6 164 28% 72% Northumbria 49 23 1 73 67% 33% Severn 13 12 6 1 32 41% 59% Solway Tweed 3 7 10 30% 70% South East 7 18 5 30 23% 77% South West 29 25 5 1 60 48% 52% Thames 33 26 10 3 72 46% 54% Total 1 210 349 54 7 621 34% 66%
Data on the condition of Scottish lochs and reservoirs is available to download from SEPA from 10 Area Advisory Groups (similar to River Basin Districts in England): http://www.sepa.org.uk/water/river_basin_planning/scotland.aspx These data generally show a higher proportion of Scottish sites achieving WFD good status. Data on Welsh lakes is quite similar to England, with 61% of lakes & reservoirs failing the WFD target of good ecological status (Table 5) Table 5. Summary results of ecological status classification in lakes and reservoirs in the River Basin Districts of Wales. Data summarised from the 1st cycle of WFD Assessment3
RBD Name Good Moderate Poor Total %Good Dee 9 11 1 21 43% Severn 19 18 2 39 49% Western Wales 20 33 9 62 32% Wales Total 48 62 12 122 39% Wales Total % 39% 51% 10%
Data from Natural England highlights the generally higher quality of lakes in Protected Areas, indicating that about 50% of lakes and reservoirs notified as features in SSSIs are in favourable condition with about 30% of those in unfavourable condition showing an improving status (Table 6). It should be noted that this uses a different classification scheme, based mainly on aquatic plant data and nutrient chemistry data, whereas the WFD classification is based on more biological groups and adopts a one-out-all-out rule in the status assessment, downgrading a site if any of the biological quality elements are not in good status. Table 6. Condition assessment results of freshwater SSSIs in England [Source: Stewart Clarke & George Hinton, Natural England]
2.1.9. Lakes – trends in water quality Prior to 2006, when monitoring of lakes for the WFD was introduced, there was very limited monitoring of lakes in the UK. Exceptions in the UK include CEH’s long-term monitoring sites in the English Lake District (1945+) & Loch Leven in Scotland (1968+) and monitoring by environment agencies and research groups at Lough Neagh, The Broads, some of the Cheshire meres and a few drinking water reservoirs with algal bloom problems. These long-term datasets highlight reductions in water quality and biodiversity through the 20th century, but particularly since the 1950s, and improvements in recent decades, largely due to reductions in

220
point source pollution from sewage effluent (e.g. Carvalho et al., 2012; Moss et al., 2005; Phillips et al, 2005). In addition to this, the “Lakes Tour” is a seasonal survey carried out every 5 years by CEH of the 20 major lakes in the English Lake District20(Maberly et al., 2011,). This highlights recovery from acidification and also both improvements (Esthwaite Water) and declines (Loweswater) in water quality in relation to nutrient enrichment, largely due to site-specific issues (e.g. fish farming, agricultural change) (Fig. 1).
Fig. 1. Trends in TP, Chl-a and Secchi depth in (a) Esthwaite Water and (b) Loweswater. Taken from Maberly et al. (2011)2
J. Is there a measure of the current output of services from the asset? Lakes and reservoirs provide many valuable ecosystem services, such as water supply, recreation (angling and water sports) and tourism. However, the flow and value of these services has not been systematically quantified. It is possible that existing WFD biological and chemical measures can be used as proxies for indicating the quality, or capacity, of lakes and reservoirs for particular services, but do not indicate the actual flow or delivery of services. For example the WFD metric for algal blooms is based on the abundance of potentially toxic cyanobacteria and can be related to the quality of the water for water supply and recreational activities (i.e. potential capacity), but does not indicate actual water use or numbers of recreational users. Fish data could potentially be used to measure the quality of the site for recreational angling, but angling numbers and fish catch better reflect the actual service delivered. Data are available on the provision of some services, but these are not necessarily broken down for lakes and reservoirs, but are reported in terms of freshwaters in general.
2.1.10. Water supply In England and Wales, two-thirds of drinking water comes from surface water, including reservoirs, lakes and rivers, and the rest from groundwaters (Foundation for Water Research website - http://www.euwfd.com/html/lakes_and_reservoirs.html). Aggregated annual data on abstraction in England & Wales from “non-tidal surface water and groundwater” (i.e. rivers, lakes and groundwater) is available from Defra21 (Table 7). The mean abstraction for the period 2006-2011 can be used to assess current abstraction. About 12 million m3 is abstracted annually, about 50% of which is for public water supply, 33% for electricity supply. It should be noted that abstractions of <20m3/day became exempt from
20 Maberly et al., 2011. A survey of the lakes of the English Lake District: The Lakes Tour 2010. Centre for Ecology & Hydrology, 148pp. http://nora.nerc.ac.uk/14563/ 21 http://www.defra.gov.uk/statistics/environment/inland-water/iwfg12-abstrac/

UK NEAFO Work Package 1: Natural capital asset check – Annex 4: Case studies
221
requiring a licence after 1 April 2005. As a result over 22,000 licences, mainly for agricultural or private water supply purposes, were deregulated. In terms of trends, it is clear that abstraction has been declining from 2000, particularly for electricity supply, other industry and fish/cress farming (Fig. 4)
Figure 4: Trends in volume of water abstracted from non-tidal surface and groundwaters in England & Wales for various uses (million cubic metres)4 Criticalities / thresholds /Sustainability Reservoir ‘draw-down’ occurs when abstraction from the reservoir exceeds recharge from feeder streams and rivers, but is typical in a reservoir in summer, causing lowering of the water level. This has impacts on marginal vegetation, and consequently, invertebrate, fish and bird habitats for feeding and breeding. Research in Finland is developing assessment schemes to measure the impact of drawdown on aquatic vegetation (Hellsten 2001 and later references). Water companies have plans to develop several new or extended water supply reservoirs in the SE England to cope with increasing demand (EA, Sep, 2006). Most other regions have plentiful rainfall in relation to demand.
2.1.11. Hydropower The total hydroelectric installed capacity in the UK at the end of 2011 was approximately 1676 megawatts (MW), which is around 1.9% of the current total UK generating capacity and 14% of renewable electricity generation capacity (DECC, 20)22. About 1500 MW (89%) of the UK’s hydropower is produced in Scotland, with most large-scale schemes located in the Scottish Highlands (about 10% of Scotland's energy requirements comes from hydro power). In 2012, hydro generation fell by 8.1 per cent on the year earlier, from 5,700 GWh to 5,200 GWh, as rainfall levels in 2012 were 24 per cent lower than those of 2011, which were the highest in at least the last decade. August 2012 saw the return to generation, however, of Glendoe, near Loch Ness, the UK’s newest, and second largest, hydro station. Rio Tinto Alcan’s £45 million modernisation project of its hydropower plant supplying electricity for its operations in Lochaber in the Scottish Highlands has the capacity to generate the plant’s required electricity supply, as well as the potential to generate additional power. As a result of the increased power generation, it is expected that aluminium production could increase from 43,000 tonnes per year to 50,000 tonnes per year. The Rio Tinto Alcan plant in Lochaber contributes over £8 million a year to the Highlands economy and employs 170 people, making it one of the Highlands’ largest private sector employers. It also helps underpin an additional 400 jobs through indirect employment and supply chain opportunities.
22 https://www.gov.uk/government/organisations/department-of-energy-climate-change/series/renewables-statistics

222
Figure 5: United Kingdom gross electricity supplied from Hydro between 1920 and 2010 (GWh), including for pumped-storage schemes. Source: http://webarchive.nationalarchives.gov.uk/20130109092117/http://decc.gov.uk/en/content/cms/statistics/energy_stats/source/renewables/renewables.aspx Sustainability Rainfall variation affects the quantity and timing of service delivered. Further large-scale hydropower development plans are currently limited as most economic locations have been developed and further developments are limited due to environmental impacts on river biodiversity (including economically important migratory fish, such as salmon)
2.1.12. Recreation & Tourism Lakes and reservoirs are important for angling (trout angling particularly economically important), watersports (sailing, windsurfing, open water swimming, triathlon), and popular destinations for general leisure activities (particularly dog walking) (Natural England MENE survey). No centralised database exists for data on angling or recreation although statistics for individual water bodies are generally available online. Some high profile lakes are extremely important tourist destinations: The Broads, Cumbrian Lake District (particularly Windermere & Ullswater), Cotswold Water Park, Loch Lomond & Loch Ness.
Q. Thresholds and Sustainability Targets for Freshwater Services Currently, there is limited quantitative understanding of the ecological conditions needed to sustain many freshwater goods and services. From a qualitative perspective, generally lower levels of algal biomass and low densities of cyanobacteria are important in maintaining water supply (with lower treatment costs) in many reservoirs and increasing quality for game fisheries, water sports, recreation and tourism in and around lakes and reservoirs in general. Algal blooms have led to cancellation of national water sports events (e.g. Great North Swim in Windermere) with consequent economic impacts. Higher nutrients and consequently higher algal productivity can, however, lead to increased fish production, but with changes in fish community structure that may require a shift from a game to a coarse fishery and reduction in habitat for the UKs most threatened fish species. In terms of algal blooms, recent work has documented exceedance of WHO health risk thresholds for recreational use and this work has also identified water quality targets (phosphorus concentrations) in relation to increasing probabilities of exceedance23 (Figure 2). Sustainability targets for phosphorus could, therefore, vary depending on the use of a lake or reservoir and the need for limiting the likelihood of algal blooms.
23 Carvalho et al. (2013) Sustaining recreational quality of European lakes: minimising the health risks from algal blooms through phosphorus control. Journal of Applied Ecology, 50, 315-323.

UK NEAFO Work Package 1: Natural capital asset check – Annex 4: Case studies
223
Fig. 2: Recreational health risk in >1500 European Lakes based on exceedance of WHO cyanobacterial health thresholds and % lakes exceeding WHO thresholds in relation to TP concentrations

224
2.1.13. References to Lakes and Reservoirs Case Study Carvalho L, McDonald C, de Hoyos C, Mischke U, Phillips G, Borics G, Poikane S., Skjelbred B,
Lyche Solheim A, Van Wichelen J. & Cardoso A.C., 2013. Sustaining recreational quality of European lakes: minimising the health risks from algal blooms through phosphorus control. Journal of Applied Ecology, 50, 315-323.
Carvalho L, Ferguson C.A., Gunn I.D.M., Bennion H., Spears B. and May L. 2012. Water quality of Loch Leven: responses to enrichment, restoration and climate change, Hydrobiologia, 681:35-47.
Hellsten, S, 2001 Effects of lake water level regulation on aquatic macrophyte stands in northern Finland and options to predict these impacts under varying conditions. Acta Botanica Fennica,
Hughes M, Hornby D D, Bennion H, Kernan M, Hilton J, Phillips G and Thomas R 2004 The development of a GIS-based inventory of standing waters in Great Britain together with a risk-based prioritisation protocol. Water, Air, and Soil Pollution 4: 73–84
Maberly, S.C.; De Ville, M.M.; Thackeray, S.J.; Feuchtmayr, H.; Fletcher, J.M.; James, J.B.; Kelly, J.L.; Vincent, C.D.; Winfield, I.J.; Newton, A.; Atkinson, D.; Croft, A.; Drew, H.; Saag, M.; Taylor, S.; Titterington, H. 2011 A survey of the lakes of the English Lake District: The Lakes Tour 2010. NERC/Centre for Ecology & Hydrology, 148pp.
Moss B, Barker T, Stephen D, Williams A, Balayla D, Beklioglu M & Carvalho L. 2005. Consequences of reduced nutrient loading on a lake system in a lowland catchment: deviations from the norm? Freshwater Biology, 50, 1687-1705.
Phillips G., Kelly A., Pitt J.-A., Sanderson R. & Taylor E. (2005) The recovery of a very shallow eutrophic lake, 20 years after the control of effluent derived phosphorus. Freshwater Biology, 50, 1365-2427.
Scheffer M., Hosper S.H., Meijer M-L., Moss B. & Jeppesen E., 1993. Alternative equilibria in shallow lakes. Trends in Ecology & Evolution, 8: 275–279.

UK NEAFO Work Package 1: Natural capital asset check – Annex 4: Case studies
225
2.1.14. Appendix 4: List of References 1 MILLENNIUM ECOSYSTEM ASSESSMENT (2005) Ecosystems and Human Well-being. World Resources Institute, Washington, DC.
2 JOINT NATURE CONSERVATION COMMITTEE (2004) Common Standards Monitoring Guidance. [Online] Available at: http://jncc.defra.gov.uk/page-2199. 3 NATIONAL ECOSYSTEM ASSESSMENT (NEA) 2011. The UK National Ecosystem Assessment: Synthesis of the Key Findings. UNEP-WCMC, Cambridge. 4 ELLIOTT, M., S. BOYES AND D. BURDON, (2008) A scientific understanding of the Tees Estuary to Determine the Cause of Macroalgal Mats at Seal sands, Report to the Environment Agency. 5 MÖLLER, I.; SPENCER,T., FRENCH, J.R., DIXON,M., and LEGGETT, D.J., (1999) Wave transformation over saltmarshes: a field and modelling study from North Norfolk, England. Estuarine, Coastal and Shelf Science. 49, 411-426. 6 MCLUSKY, D.S (2001) North Sea Estuaries. Senckenbergiana maritime. 31 (2) 177-186 7 ANDREWS, J.E., BURGESS, D., CAVE, R.R., COOMBES, E.G., JICKELLS, T.D., PAKRES, D.J. AND TURNER, R.K. (2006). Biogeochemical value of managed realignment, Humber estuary, UK. Science of the Total Environment. 371; 19-30.
8 COLCLOUGH,S., L. FONSECA, T. ASTLEY, K . T HOMAS & W. WATTS (2005) Fish utilisation of managed Realignments. Fisheries Management and Ecology. 12, 351–360. 9 ENVIRONMENT AGENCY (2009) River Tees Salmon Action Plan Review. [Online] Available at: http://www.environment-agency.gov.uk/static/documents/Leisure/Tees_SAP_Final_Report_Feb_2009.pdf
10 FOWLER, S.L. (1999) Guidelines for managing the collection of bait and other shoreline animals within UK marine Special Areas of Conservation. Report to English Nature UK Marine SACs Project. 11 JOINT NATURE CONSERVATION COMMITTEE (2007) Second Report by the UK under Article 17 on the implementation of the Habitats Directive from January 2001 to December 2006: Conservation status assessment for Habitat: H1130 - Estuaries Peterborough: JNCC. Available from: www.jncc.gov.uk/article17 12 JOINT NATURE CONSERVATION COMMITTEE (2007) Second Report by the UK under Article 17 on the implementation of the Habitats Directive from January 2001 to December 2006: Conservation status assessment for Habitat: H2130: Fixed dunes with herbaceous vegetation (`grey dunes`) Peterborough: JNCC. Available from: www.jncc.gov.uk/article17 13 LUISETTI, T., TURNER, R.K., BATEMAN, I.J., JONES, S., ADAMS, C. & FONSECA, L. (2011) Coastal and marine ecosystem services valuation for policy and management: Managed realignment case studies in England. Ocean & Coastal Management. 54 (3) 212-224.
14 MCKLUSKY, D.S & ELLIOTT, M. (2004) The Estuarine Ecosystem: Ecology, Threats and Management. Oxford University Press, Oxford. 15 TEES VALLEY BIODIVERSITY ACTION PLAN (2010) Intertidal mudflats and saltmarsh Habitat Action Plan 2010-2014. [Online] http://teesvalleybiodiversity.org.uk/wp-content/uploads/2008/02/TV-mudflats-and-saltmarsh-last-revised-Feb-2010.pdf 16 ENVIRONMENT AGENCY (undated) Saltmarsh Extents [Online] Available at: http://www.geostore.com/environment-agency/
17 NATURAL ENGLAND (undated) GIS Digital Boundary Data Sets. [Online] Available at: http://www.gis.naturalengland.org.uk/pubs/gis/tech_ds.htm
18 DONOGHUE. D.M., ZONG, Y., DUNFORD, R. & WATT, P. (undated) An investigation of the sediment budget, the fate of contaminants, and dating sediment contamination in the Teesmouth and Cleveland Coast SPA. [Online] http://www.geography.dur.ac.uk/EA_Tees/EA_Final_WP1_Report.pdf 19 ENVIRONMENT AGENCY (undated) Greatham North FAS Scoping Consultation Document. [Online] http://www.marinemanagement.org.uk/licensing/public_register/eia/documents/screening_scoping/greatham_north.pdf.
20 HARDY, F. G., EVANS, S. M. AND TREMAYNE, M. A. (1993) Long-term changes in the marine macroalgae of three polluted estuaries in north-east England. Journal of Experimental Marine Biology and Ecology. 172, 81-92
21MANN, J.A. (2009) The state of the natural environment of the Tees Valley - A summary of environmental changes from 1995. INCA

226
22 ENVIRONMENT AGENCY (undated) Bathing Waters Quality at Designated Beaches [Online] Available at: http://www.geostore.com/environment-agency/
23 ENVIRONMENT AGENCY (1999) Tees Estuary Present and Future: State of the Tees Estuary and Strategy into the Millennium.
24 JONES, B and A. TURKI (1997) Distribution and Speciation of Heavy Metals in Surficial Sediments from the Tees Estuary, North-east England. Marine Pollution Bulletin. 34 (10) 768 – 779
25 PETHICK, J.S. (2001) Coastal management and sea-level rise. CATENA. 42 (2-4), 307-367.
26 WARWICK, R.M., C. M. ASHMAN, A. R. BROWN, K. R. CLARKE, B. DOWELL, B. HART, R. E. LEWIS, N. SHILLABEER, P. J. SOMERFIELD, J. F. TAPP (2002) Inter-annual changes in the biodiversity and community structure of the macrobenthos in Tees Bay and the Tees estuary, UK, associated with local and regional environmental events. Marine Ecology Progress Series. 234: 1–13.
27 ELLOITT, M. AND C.J.L. TAYLOR (1989) The structure and functioning of an estuarine/marine fish community in the Forth estuary, Scotland. Proceedings of the 21st. European Marine Biology Conference.
28 WOODS, R. (2012) Tees Seals Research Programme Monitoring Report No.24 (1989 – 2012)
29 NATURAL ENGLAND (2010). Nature on the Map. [Online] www.natureonthemap.org.uk/identify.aspx
30 PETHICK, J.S (2002) Estuarine and Tidal Wetland Restoration in the United Kingdom: Policy Versus Practice. Restoration Ecology. 10 (3) 431-437.
31 TURNER, R.K., BURGESS, D., HADLEY., COOMBE, E & JACKSON, N. (2007) Cost–benefit appraisal of coastal managed realignment policy. Global Environmental Change. 17; 397–407.
32 PETHICK, J.S. AND S. CROOKS (2000) Development of a coastal vulnerability index: a geomorphological perspective. Environmental Conservation. 27 (4): 359–367.
33 FEAGIN, R.A, SHERMAN, D & GRANT, W.E. (2005) Coastal erosion, global sea-level rise, and the loss of sand dune plant habitats. Front Ecol Environ. 3(7): 359–364.
34 STOCKTON –ON-TEES BOROUGH COUNCIL (undated) Regeneration Strategy for Stockton Borough 2007-2012/ [Online] Available at: http://www.stockton.gov.uk/resources/regenandeconomicdev/regenerationstrategy/regenerationstrategy.pdf
35 INCA (2009) Teesmouth and Cleveland Coast European Marine Site Management Scheme Spring 2009. [Online] Available at: http://www.inca.uk.com/wp-content/uploads/2009/08/marine-site.pdf
36 COYLE, M.D. & WIGGINS, S.M. (2010) European Marine Site Risk Review. Natural England Research Reports, Number 038.
37 SIMPSON, K.H. (2011) A Study into Recreational Disturbance at the Teesmouth and Cleveland Coast European Marine Site. Submitted to the Teesmouth and Cleveland Coast Management Group.
38 LINAKER, R. (2013) Recreational Disturbance at the Teesmouth and Cleveland Coast European Marine Site. Bird disturbance field work. Winter 2011/2012. Submitted to Teesmouth and Cleveland Coast Management Group.
39 TEES VALLEY BIODIVERSITY ACTION PLAN (2010) Sand dunes Habitat Action Plan 2010-2014. [Online] http://teesvalleybiodiversity.org.uk/wp-content/uploads/2008/02/TV-Sand-dunes-Action-plan-latest-version-Jan-2010.pdf
40 BROWN, A. C., & MCLACHLAN, A. (2002). Sandy shore ecosystems and the threats facing them: some predictions for the year 2025. Environmental Conservation, 29(1), 62-77.
41 REDCAR AND CLEVELAND BOROUGH COUNCIL. (2010). Redcar and Cleveland Regeneration Masterplan. [Online] Available at: http://www.redcar-cleveland.gov.uk/regeneration-rcbc.nsf/4288A7C042686DAF802577B50035E9E0/$File/Redcar-Area-Spatial-Framework.pdf
42 HARTLEPOOL BOROUGH COUNCIL. (2010) Hartlepool Local Development Framework. Core Strategy Preferred Options Report. [Online] http://www.hartlepool.gov.uk/downloads/file/6657/core_strategy_preferred_options-november_2010
43 BURTON, N.H.K AND A.P GODDARD (2007) Impacts of changes in sewage disposal on waterbirds wintering on the Northumbrian coast. Final Report. BTO Research Report No. 442 .

UK NEAFO Work Package 1: Natural capital asset check – Annex 4: Case studies
227
44 NATURAL ENGLAND (2012) Carbon storage by habitat: Review of the evidence of the impacts of management decisions and condition of carbon stores and sources (NERR043). [Online] http://publications.naturalengland.org.uk/publication/1412347
45 DECC (2011) A brief guide to the carbon valuation methodology for UK policy appraisal. [Online] Available at: https://www.gov.uk/government/uploads/system/uploads/attachment_data/file/41793/3136-guide-carbon-valuation-methodology.pdf
46 PLATER, A.J. et al. (1998) Historical contaminant fluxes in the Tees Estuary, UK: Geochemical, Magentic and Radionuclide Evidence. Marine Pollution Bulletin. 37, 343-360.
47 PLATER, A.J. AND APPLEBY, P.G. (2004) Tidal sedimentation in the Tees Estuary during the 20th century: radionuclide and magnetic evidence of pollution and sedimentary response. Estuarine, Coastal and Shelf Science. 60, 179-192.
48 ONS (2011) The Sub-Regional Value of Tourism in the UK in 2008. [Online] Available at: http://www.ons.gov.uk/ons/dcp171776_239218.pdf
49 SCARBOROUGH BOROUGH COUNCIL (2006) Shoreline Management Plan 2 River Tyne to Flamborough Head. Report to the North East Coastal Authorities Group. [Online] Available at: http://www.northeastsmp2.org.uk/finalSMP2.htm
50 TEES VALLEY UNLIMITED (undated). Tees Valley Climate Change Strategy 2010 – 2020. [Online] Available at: http://www.darlington.gov.uk/dar_public/documents/_Place/CommunityServices/Environment/Climate/TVCCPReport.pdf
51 ELLIOTT, M., M.G. O’REILLY, C.J.L.TAYLOR (1990) The Forth estuary: a nursery and overwintering area for North Sea fishes. Hydrobiologia. 95 (1), 89-103
52 PRETTY, J. J. PEACOCKA, R. HINEA, M. SELLENSA, N. SOUTHB & M. GRIFFINA. (2007). Green exercise in the UK Countryside: Effects on Health and Psychological wellbeing, and Implications for Policy and Planning. Journal of Environmental Planning and Management . 50(2); 211-231
53 COX, M., JOHNSTONE, R. & ROBINSON, J. (2005) Effects of Coastal Recreation on Social Aspects of Human Well-being. Proceedings of the Coastal Zone Asia Pacific Conference 156.
54 Department for Communities and Local Government (2011) The English Indices of Deprivation 2010. [Online] Available at: https://www.gov.uk/government/uploads/system/uploads/attachment_data/file/6871/1871208.pdf
55 BEAUMONT, N.J., et al (2010) National Ecosystem Assessment (NEA): Economic Analysis Coastal Margin and Marine Habitats, Final Report. [Online] Available at: http://uknea.unep-wcmc.org/LinkClick.aspx?fileticket=O%2B8tTp%2F5ZPg%3D&tabid=82
56 TEES VALLEY UNLIMITED (2010) Tees Valley Economic Assessment 2009/2010. [Online] Available at: https://www.teesvalleyunlimited.gov.uk/media/64618/eaexecutive_summary.pdf
57 WHEELER, B. W., WHITE, M., STAHL-TIMMINS, W., & DEPLEDGE, M. H. (2012). Does living by the coast improve health and wellbeing? Health & Place.
58 TEES VALLEY UNLIMITED (2011) Economic and Regeneration Statement of Ambition. [Online] Available at: https://www.teesvalleyunlimited.gov.uk/media/10538/statement_of_ambition.pdf
59 BARBIER, E., et al (2008) Coastal Ecosystem-Based Management with Nonlinear Ecological Functions and Values. Science. 319 (5861); 321-323
60 KOCH, E. W., BARBIER, E. B., SILLIMAN, B. R., REED, D. J., PERILLO, G. M., HACKER, S. D., & WOLANSKI, E. (2009). Non-linearity in ecosystem services: temporal and spatial variability in coastal protection. Frontiers in Ecology and the Environment, 7(1), 29-37.
61 KING, S.E. and Lester, J.N. (1995) The Value of Salt Marsh as a Sea Defence. Marine Pollution Bulletin. 30 (3) 180-189.
62 DEEGAN, L. et al. (2012) Coastal eutrophication as a driver of salt marsh loss. Nature. 490, 388–392.
63 EVANS, P.R., R. M. WARD, M. BONE and M. LEAKEY (1998) Creation of Temperate-Climate Intertidal Mudflats: Factors Affecting Colonization and Use by Benthic Invertebrates and their Bird Predators. Marine Pollution Bulletin. 37, 530-545.
64 ARENS, S.M. & GEELEN, L. (2006) Dune landscape rejuvenation by intended destabilisation in the Amsterdam water supply dunes. Journal of Coastal Research, 22(5), 1094–1107

228
65 ENVIRONMENT AGENCY (2009) Tees Catchment Flood Management Plan [Online] Available at: http://www.environment-agency.gov.uk/research/planning/114022.aspx 66 GOSS-CUSTARD, J.D., STILLMAN, R.A., WEST, A.D., CALDOW, R.W.G. & MCGRORTY, S. (2002) Carrying capacity in overwintering migratory birds. Biological Conservation. 105: 27–41
67 EFTEC (2013) DEFINITION OF NATURAL CAPITAL to inform the Natural Capital Committee.
68 BOORMAN, L.A. (2003) Saltmarsh Review. An overview of coastal saltmarshes, their dynamic and sensitivity characteristics for conservation and management. JNCC Report, No. 334
69 DAVIDSON, N.C. (1990) The Conservation of British North Sea Estuaries. Hydrobiologia. 195 (1)145-162.
70 ROBINSON, R.A., et al. (2005) Climate change and migratory species. A Report for Defra Research Contract CR0302. [Online] http://www.bto.org/sites/default/files/u196/downloads/rr414.pdf

UK NEAFO Work Package 1: Natural capital asset check – Annex 4: Case studies
229
3. Acknowledgements Advisors and contributors: Barnaby Andrews (UEA) Tom Breeze (Reading University) Leila Fonseca (Defra) Dave Goulson (Stirling) Bob Pailor (Tees Industry Nature Conservation Association) Grischa Perino (University of Hamburg) Robert Woods (Tees Industry Nature Conservation Association)