Embed Size (px)
Citation preview

Topic : Oil &Gas
November 2017
| Paris| Lyon | Brussels | London| New York| Houston| Toronto| Amsterdam | Roma | Milano | Casablanca | Dubaï| Riyad | Abu Dhabi| Hong Kong| Singapour
Paris office12, rue Magellan,Paris FrancePhone : (33) 1 42 77 76 17Internet : www.sia-partners.com
*For a diesel road tractor (Iveco Stralis) covering over 100 000 km / year compared to an equivalent Euro 5 vehicle. The price is calculated for the life span of the vehicle (7 years) for a current French fuel price (January 2016).
LNG as a fuel, a solution to the tightening of environmental rules & regulations inthe transport sector
A 16% decrease of CO2 emissions, up to 90% of pollutants avoided, 3% cheaper*
2Energy Lab © Sia Partners
Executive summary
The use of LNG as a fuel
LNG as a road fuel
LNG as a marine fuel
0
1
2
3
4 Conclusion and perspectives
5 For more information
- Contacts : C. de Lorgeril, J. Hamidi, M. Larquetoux

3Energy Lab © Sia Partners
0 Executive Summary
- Contacts : C. de Lorgeril, J. Hamidi, M. Larquetoux

4Energy Lab © Sia Partners
Executive summary
The tightening rules & regulations on emissions (particulate matter, SOx, NOx…), have propelled the use of natural gas as a fuel to the forefront.This fossil resource, essentially composed of methane, allows a reduction of CO2 emissions up to 24 % compared with gasoline and emits almostno local pollutants. While the use of gas as a fuel has existed for several decades for cars, the use of Liquefied Natural Gas (LNG) as a fuel hasreached today a satisfying level of technological maturity for heavy duty vehicles (trucks and buses) and large sea vessels allowing large-scaledistribution of this fuel.
For road transport, LNG is seen as an interesting solution for vehicles conceived for long distances such as trucks and buses. The sector is mainlyled by China which still counts more than 90% of LNG refuelling stations worldwide. However, the pace of this market’s growth slowed downlately, especially due to less subsidies and governmental incentives, yielding place to the development of new markets. Europe is committed to thedevelopment of LNG as a road fuel especially through the project Blue Corridors. In this study, Sia Partners forecasts an increased demand in thesector : the global GNL as a road fuel consumption would rise from 2 Mtpa* to 26 Mtpa in 2030, representing 5% of global LNG demandworldwide.
In maritime transport, the activity is mainly concentrated in Northern Europe. However, the IMO’s decision taken on the 27th October 2016 toapply a 0.5% Global Sulphur cap from January 1st 2020 will reinforce the already ongoing development of LNG bunkering projects in Europe, Asiaand the US. Despite the recent shipping crisis, the demand for LNG as a fuel in this sector could still reach more than 29 Mtpa by 2040, whichwould represent 13% of global fuel demand in shipping. Sia Partners projects an increase in demand for LNG marine fuel from less than 0.5 Mtpatoday to more than 22 Mtpa in 2030, representing between 9% and 11% of global marine fuel demand.
In spite of the recent fall in oil prices which weakened the position of LNG as a cheap fuel for road and maritime transportation since our latestpublication **on this topic was released, the supercool fuel’s development perspectives remain positive. Total demand for LNG fuel is estimated tobe around 50 Mtpa by 2030 according to Sia Partners.
Global environmental policies aiming at reducing CO2 emissions and cutting SOx, NOx and particulate matter from transportation put LNG in afavourable position. Some players of oil sector see in this market the opportunity to reorient or diversify its activities in times of low barrel prices(read Sia Partner’s study *on this topic). This trend was manifested in the recent talks between Total and the French gas player ENGIE aboutacquiring part of LNG business portfolio from ENGIE. Ultimately, the environmental benefits of the fuel are even more reinforced with thepossibility of biomethane liquefaction.
Please find out below the entire Sia Partners analysis on LNG as a fuel and its development prospects globally.
0
- Contacts : C. de Lorgeril, J. Hamidi, M. Larquetoux ** Only available in French
* Million tons per annum

5Energy Lab © Sia Partners
1 Analysis of the natural gas as a fuel global market
A global context suitable to LNG development for road and maritimetransport
- Contacts : C. de Lorgeril, J. Hamidi, M. Larquetoux
6Energy Lab © Sia Partners
General context: Global stakes of the transport sector1
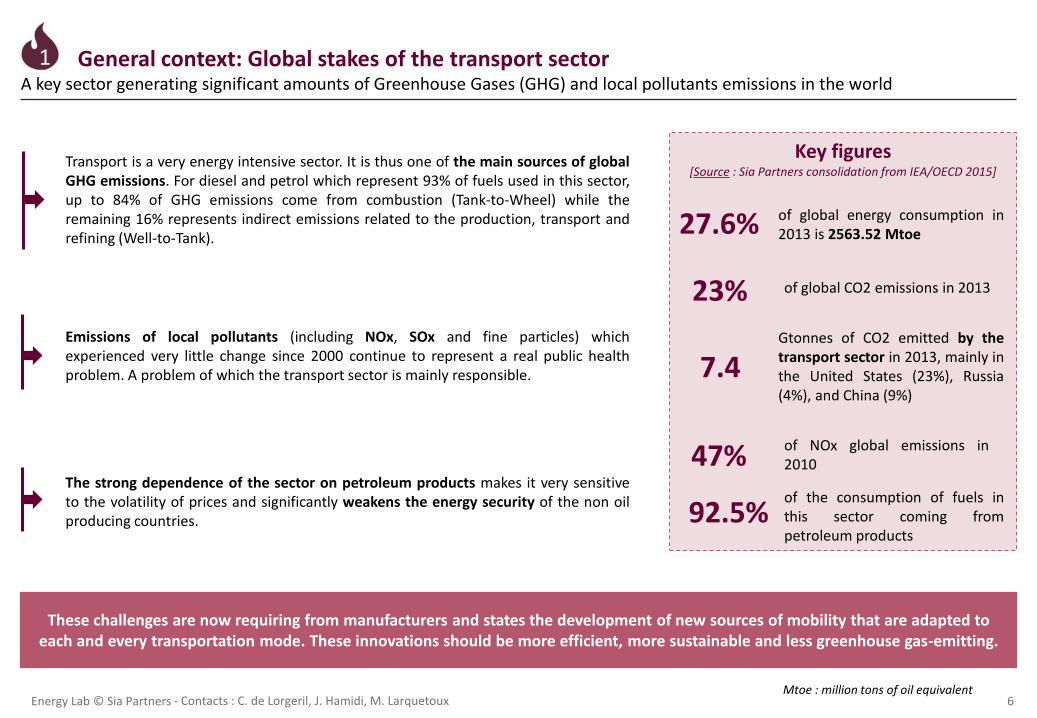
These challenges are now requiring from manufacturers and states the development of new sources of mobility that are adapted to each and every transportation mode. These innovations should be more efficient, more sustainable and less greenhouse gas-emitting.
Key figures [Source : Sia Partners consolidation from IEA/OECD 2015]
Transport is a very energy intensive sector. It is thus one of the main sources of globalGHG emissions. For diesel and petrol which represent 93% of fuels used in this sector,up to 84% of GHG emissions come from combustion (Tank-to-Wheel) while theremaining 16% represents indirect emissions related to the production, transport andrefining (Well-to-Tank).
Emissions of local pollutants (including NOx, SOx and fine particles) whichexperienced very little change since 2000 continue to represent a real public healthproblem. A problem of which the transport sector is mainly responsible.
The strong dependence of the sector on petroleum products makes it very sensitiveto the volatility of prices and significantly weakens the energy security of the non oilproducing countries.
27.6% of global energy consumption in2013 is 2563.52 Mtoe
23% of global CO2 emissions in 2013
Gtonnes of CO2 emitted by thetransport sector in 2013, mainly inthe United States (23%), Russia(4%), and China (9%)
7.4
of NOx global emissions in201047%of the consumption of fuels inthis sector coming frompetroleum products
92.5%
A key sector generating significant amounts of Greenhouse Gases (GHG) and local pollutants emissions in the world
Mtoe : million tons of oil equivalent
1
- Contacts : C. de Lorgeril, J. Hamidi, M. Larquetoux

7Energy Lab © Sia Partners
General context : Different transportation modes
Regarding their size and technological maturity, the road and sea vehicles market are the most favorable to the emergence of new oil-free engines.
Aviation
Road transport
Railway
Inland navigation
Maritime transport
1939.4 Mtoe
299.8 Mtoe
271.7 Mtoe
65.58 Mtoe
< 160 Mtoe
[Source : Sia Partners consolidation according to IEA 2015]
++
++
-
+
+
Even if they represent only a small shareof the market, the number of alternativeengines (gas, hydrogen, electricity) isincreasing and most of them aremarketable products.
Due to the tightening of rules ®ulations, heavy fuel has to face intensecompetition from LNG and diesel and theuse of additional particulate filters.
Alternative fuels (LNG, GTL) are beingtested but no industrialization is foreseenin the short term.
Less GHG producing locomotives, usingLNG, are being developed but are still atthe experimental stage.
New LNG waterway vehicles are beingcurrently developed, however the trend isstill very localized for the moment.
85% of the GHG emissions and local pollutants related to transportation are generated by road and sea vehicles
Main emissions**Main fuels* Alternative engines developmentTotal
consumption*
** In relative share of the total emissions in the transport sector* Figures of 2013
Mtoe : million tons of oil equivalent
1
100%
Die…
24%
75%
0,05%
Diesel
Heavy fuel
Others
39%
54%
7%
Diesel
Gasoline
Others
Aviation…
35%
59%
6%
Electricity
Diesel
Coal
34%
5%
43%
75%
PM
Nox
Sox
GHG
38%
92%40%
11%
PM
Nox
Sox
GHG
- Contacts : C. de Lorgeril, J. Hamidi, M. Larquetoux

8Energy Lab © Sia Partners
General context: Environmental assets of natural gas
*Discovered volumes having a 90% probability that they can be extracted profitably**Proven reserves, reserves growth, and yet undiscovered resources that are judgedlikely to be ultimately producible using current technology
Natural gas can reduce GHG emissions by up to 24%
Gasoline
-97%-24%
BiomethaneNatural gasLPGDiesel
Natural gas has significant reserves and important environmental advantages over other fossil resources. These assets are notat the expense of its price which makes it a very interesting fuel.
World reserves of Oil & Gas (in current consumption years)
Well-to-wheel** GHG emissions of main fuels (gCO2eq/km)
Natural gas reserves, mainly concentrated in Eurasia and theUnited States, could be substantial depending on futurediscoveries and the improvement of extraction technologies.
Natural gas emits up to 24% less greenhouse gases than oil.Since biomethane has an almost neutral carbon footprint, itsaddition to the gas energetic mix allows a significant decrease inthe carbon impact of gas as a fuel.
**Emissions 'from well to wheel' including emissions due to the production and transport of fuel
[Source : Sia Partners consolidation according to IEA 2016]
[Source : Sia Partners consolidation according to JRC 2007]
Reference vehicle with a gasoline engine consuming 7 liters per 100 km
Gas can also be produced by anaerobic digestion of organicwaste. It is then called biomethane which is mainly produced inEurope today. It represented a global volume of 1 Mtoe in theworld in 2013. (WBA,2016)
Mtoe : million tons of oil equivalent
1
5
124141
156164
Since it is mainly composed of methane, natural gas emitsalmost no local pollutants (SOx, NOx, fine particles…).
Oil
Gas Proven Reserves*
Remaining RecoverableResources**
61 221
17448
- Contacts : C. de Lorgeril, J. Hamidi, M. Larquetoux

9Energy Lab © Sia Partners
General context: Economic assets of natural gas
In spite of the 2014 drop in oil prices, LNG conserves a significant financial and environmental advantage over conventional fuels especially with the increasingly strong regulatory constraints. Furthermore, with the predicted recovery of oil prices in
the upcoming years, LNG should be still playing an increasingly important role as a transportation fuel.
The spread between natural gas and oil prices decreased due to the fall of oil prices, a tendency that should be reversed in the upcoming years
Past and forecasted evolution of Oil-Natural Gas spread* ($/boe)A comparison between the 2013 and 2015 scenarios
*A positive spread means that gas is cheaper than oil
Comparison of fuel prices in a selection of ports in July 2017 ($/boe)
[Source : Sia Partners consolidation according to Ferc and ShipandBunker]
Boe: Baril of Oil Equivalent
1
[Source : Sia Partners consolidation according to WEO 2013 & 2015]
0,00
10,00
20,00
30,00
40,00
50,00
60,00
70,00
80,00
90,00
100,00
20
00
20
01
20
02
20
03
20
04
20
05
20
06
20
07
20
08
20
09
20
10
20
11
20
12
20
13
20
14
20
15
20
16
20
20
20
30
20
40
Oil/
Gas
sp
read
(U
SD/b
oe)
USA according to WEO 2013 Japan according to WEO 2013
Europe according to WEO 2013 USA according to WEO 2015
Japan according to WEO 2015 Europe according to WEO 2015
Historical data Trends
63
79
62
78
41
43
41
47
27
36
15
29
Europe (Antwerp)
Canada (Vancouver)
U.S (New Orleans)
China (Kaohsiung)
LNG price HFO price MGO price
- Contacts : C. de Lorgeril, J. Hamidi, M. Larquetoux

10Energy Lab © Sia Partners
Examples of target vehicles
General context: Natural gas as as a fuel
Compressed Natural Gas (CNG)
Operation :• Extraction of pipeline gas• Compression at 200 bars in service stations tanks• CNG distribution
Advantages: Easy access, slightly reduced cost of production, nosupply problems
Liquified Natural Gas (LNG)
Operation :• Gas liquefaction during its extraction (at -163°C)• LNG transportation to a methane terminal• LNG supply in stations and ports• LNG distributionAdvantages: high vehicle autonomy, reduced storage size, usefulfor regions with no pipelines connections
[Source : consolidation Sia Partners according to WEO 2015]
The Natural Gas for Vehicles (NGV) sector gathering CNG and LNG as a road fuel, consumed in 2013 almost 65,5 Mtoe (2,9% of worlddemand in the transport sector), half of this demand coming from light-duty vehicles. This corresponds to 2% of the world gas production inthe same year. [WEO 2015]
Regarding its flexibility of use, natural gas can be used as a fuel for almost all types of vehicles
Carrier trucks
Road tractorsBusesCars
Commercial vehicles Ferries
Container ships
High fuel consumption
per year
Low fuel consumption
per year
LNG, with a better energy density than CNG is preferred for vehicles requiring a greater autonomy and having a large annual consumption.These are mainly long distance trucks and seagoing commercial vessels.
The still emerging LNG as a road fuel industry only represents for the moment a small share of global natural gas consumption for transport.However, this share will significantly grow on mid and long-term with the expansion of LNG for long distance heavy-duty vehicles.
Heavy duty road transport Maritime transport
The use of natural gas as a fuel should experience a strong growth in the upcoming years driven by increasingly mature technologies and a tighter environmental regulatory framework. In the case of LNG, this growth should be mainly observed in
both road and maritime transportation sectors.
1
- Contacts : C. de Lorgeril, J. Hamidi, M. Larquetoux

11Energy Lab © Sia Partners
2 LNG as a road fuelAn efficient alternative for heavy duty vehicles diesel
- Contacts : C. de Lorgeril, J. Hamidi, M. Larquetoux

12Energy Lab © Sia Partners
Road transport: Context and stakes
Euro 6 standards require vessels to abide by stricter emissions limits. Diesel fuelled vehicles must thus be equipped with scrubbers (EGR, SCR) that tend to be rather heavy and expensive. Alternative fuels such as LNG are, for their part, in total
compliance with Euro 6 requirements.
The tightening global standards of pollutants emissions in road transport are serving the interest of LNG
China has alreadyimplemented tighterrestrictions in some provincesand cities
US 2010
China IV
Euro 5
*Indicative comparison, testcycles may be differentdepending on the country
Euro standard equivalent
Comparison of Euro standards with an LNG vehicle emissions (The Euro 3 standard is taken as a reference)
* Information provided byIveco for a test cycleidentical to Euro standardson a Stralis engine
[Source : Sia Partners consolidation according to ICCT]
[Source : Sia Partners consolidation according to Ivéco, European Union]
A comparison of pollutants emissions standards implementation schedules* in several countries
2
Euro 3
Euro 3
Euro 3
Euro 4
Euro 4
Euro 4 Euro 5
Euro 6
Euro 6
Euro 6
2004 2006 2008 2010 2012 2014 2016 2018 2020
United States
China
European Union
Euro 3
Euro 4
Euro 5
Euro 6
- Contacts : C. de Lorgeril, J. Hamidi, M. Larquetoux
0%
20%
40%
60%
80%
100%
Exp
ecte
d d
ecre
ase
of
emis
sio
n c
om
par
ed t
o t
he
Euro
3 s
tan
dar
d
CO NMHC
CH4 NOx
PM
Euro III Euro IV Euro V Euro VI LNG Engine*

13Energy Lab © Sia Partners
Road transport: The interest of using LNG as a fuel
LNG as a road fuel has rather low paybacks and substantial environmental benefits compared to diesel. These factors have recently enhanced the development of its use for heavy duty vehicles in several countries.
LNG enables to reduce emissions of pollutants and CO2 with a payback of less than 3 years
Eco
no
mic
cr
iter
iaO
ther
s En
viro
nm
enta
l cr
iter
ia
Purchase price
Operating costs*
Cost of a service station
Others
CO2
Fine particles
Noise
NOx
Autonomy
LNG tractor truck
Performance of a LNG Tractor truck (a standard Euro 5 tractor truck is taken as reference)
- 16%
- 85%
- 90%
- 50%
100 000 € – 1000 000 k€
+ 45 000 – 55 000 €
- 18 000 €/an
~ 1300 km
Lighter vehicles (no filters) Enhanced driving comfort
[Source : Sia Partners consolidation according to Ivéco, Mercedes, Fuelswitch, Transports Mendy ]In addition to largely meeting the Euro 6standard, LNG reduces CO2 emissions of thevehicle while the diesel filters tend toincrease these emissions.
The low cost of the LNG allows in the case oftrucks (travelling about 100 000 km/year) toreach paybacks of less than 3 years.
The development of LNG requires theestablishment of a network of dedicatedfueling stations that are still not enoughspread today.
Euro 5 diesel tractor truck
+ 0 – 8%
- 66%
- 77%
=
Already existing infrastructure
+ 12 000 €
=
~ 1 500 km
Adding EGR and SCR filters increasing the PTAC
*For a pre-tax price of LNG equal to 0.72 €/kg and a price of diesel equal to 1.3 €/l for a truck travelling 100 000 km/year
Influence of the criterion on the technical solution
favorable adverselittle influence
2
- Contacts : C. de Lorgeril, J. Hamidi, M. Larquetoux

14Energy Lab © Sia Partners
Road transport: Situational analysis of the LNG sectorThe number of LNG refilling stations have been multiplied by more than 8 in 4 years and 90% of this growth comes from China
The extremely rapid growth of the LNG as a road fuel sector in China in recent years heralds a significant potential of development for the rest of the world, the United States and Europe topping the list. For the latter, a true dynamic was
unleashed to push the development of the sector.
Development of LNG service stations in the world
Main players of the LNG as a road fuel sector
[Source : Sia Partners consolidation according to NGVA,US department of Energy]
[Source : Sia Partners consolidation]
Manufacturers are today highly geographicallysegmented. Even though some are trying to taketheir chance in foreign markets (Volvo,Daimler...), there is no international leader fornow.
The sector of LNG as a road fuel has experienceda very fast development in the last few yearswith an average growth rate above 100% duringthis period.
China is the leader of this growth (cf. focus),followed by the US and Europe. These threeplayers represent almost 99% of the markettoday.
The Chinese ENN showed interest in theAmerican market by integrating the joint ventureBluLNG, the number 2 LNG constructor in the US.The group also invests in Europe and has twooffices in the Netherlands and the UK.
2
-
500
1 000
1 500
2 000
2 500
3 000
3 500
4 000
2008 2009 2010 2011 2012 2013 2014 2015
China Europe US
Vehicleconstructors
Stationbuilders
PetroChina
ENN
CNOOC
Ivéco
Renault TrucksVolvo
Mercedes-BenzScania
BluLNG
Clean Energy
Axégaz
LNG24 GNVert
Gas Natural FenosaRolande LNG
Freightliner
DaimlerKenworth
Peterbilt
CAMC
Sinotruck
Dongfeng
China US Europe
Sinopec
- Contacts : C. de Lorgeril, J. Hamidi, M. Larquetoux
15Energy Lab © Sia Partners
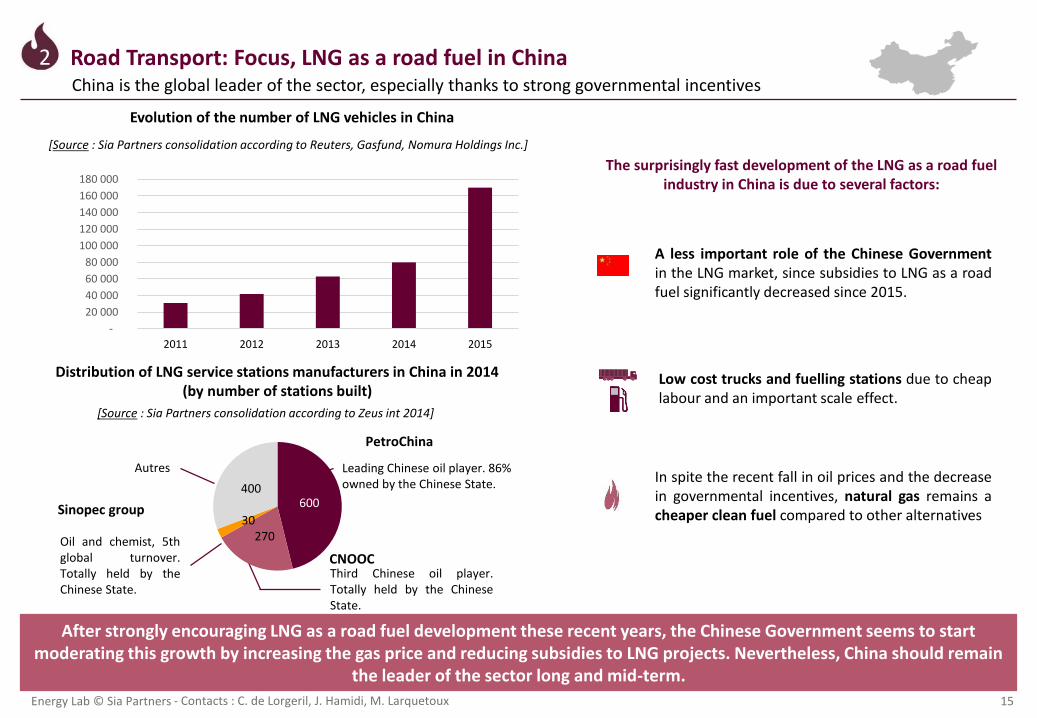
Road Transport: Focus, LNG as a road fuel in ChinaChina is the global leader of the sector, especially thanks to strong governmental incentives
After strongly encouraging LNG as a road fuel development these recent years, the Chinese Government seems to start moderating this growth by increasing the gas price and reducing subsidies to LNG projects. Nevertheless, China should remain
the leader of the sector long and mid-term.
The surprisingly fast development of the LNG as a road fuel industry in China is due to several factors:
A less important role of the Chinese Governmentin the LNG market, since subsidies to LNG as a roadfuel significantly decreased since 2015.
Low cost trucks and fuelling stations due to cheaplabour and an important scale effect.
In spite the recent fall in oil prices and the decreasein governmental incentives, natural gas remains acheaper clean fuel compared to other alternatives
Evolution of the number of LNG vehicles in China
[Source : Sia Partners consolidation according to Reuters, Gasfund, Nomura Holdings Inc.]
Distribution of LNG service stations manufacturers in China in 2014 (by number of stations built)
[Source : Sia Partners consolidation according to Zeus int 2014]
600
27030
400
Sinopec group
PetroChina
Leading Chinese oil player. 86% owned by the Chinese State.
Third Chinese oil player.Totally held by the ChineseState.
Oil and chemist, 5thglobal turnover.Totally held by theChinese State.
CNOOC
Autres
2
-
20 000
40 000
60 000
80 000
100 000
120 000
140 000
160 000
180 000
2011 2012 2013 2014 2015
- Contacts : C. de Lorgeril, J. Hamidi, M. Larquetoux

16Energy Lab © Sia Partners
Road transport: Development perspectives of the LNG sectorThe LNG as a road fuel sector could exceed 26 mtpa by 2030, representing 5,3% of world demand for LNG
The development of LNG as a road fuel seems promising in the short and medium term for the three current leaders: China, United States and Europe. This growth will take place simultaneously with that of marine LNG since the two sectors can take
advantage of multimodal facilities.
The regulatory framework is taking shapewith the adoption in 2014 by the UNECE* ofthe 110 regulation which defines vehiclescertification and LNG as a road fuel facilities.
The low life expectancy of trucks (6 to 10years) allows a rapid renewal of the worldfleet (approximately 7% per year),encouraging the development of the sector.
Evolution of the expected growth of LNG as a road fuel under different scenarios[Source : Sia Partners consolidation according to Shell 2014, Gazprom 2011, WEO 2016 & Navigant research]
The development of the sector will gothrough the financing of infrastructure.The European Union, by the Blue Corridorproject, aims to create a station every 400kmalong key axes.
*United Nations Economic Commission for Europe organisation grouping 56 States members including the European Union and the United States.
2
0,00
5,00
10,00
15,00
20,00
25,00
30,00
35,00
40,00
45,00
2015 2020 2025 2030
Other comparative pre-2014 oil price drop scenariiPre and post 2014 oil price drop Sia Partners scenarii
Sia Partners, New Realistic Scenario
Pace Global, (European Union only) Scenario published in November 2014
Sia Partners, High Scenario published in November 2014
Sia Partners, Low Scenario published in November 2014
Shell, Low Scenario published in November 2014
Shell, High Scenario published in November 2014
- Contacts : C. de Lorgeril, J. Hamidi, M. Larquetoux

17Energy Lab © Sia Partners
3 LNG as a maritime fuelA market concentrated in Europe and that is going global
- Contacts : C. de Lorgeril, J. Hamidi, M. Larquetoux

18Energy Lab © Sia Partners
Maritime transport: Context and stakes
Due to the tightening regulations on Sulphur emissions, ship-owners are now hesitant on the technical solution to adopt. LNG seems to be an attractive solution both technically and economically.
Ship-owners have four technical solutions to deal with these restrictions:
Tougher regulations on Sulphur emissions will compel some ship-owners to a conversion of their vessels
Sulphur emissions from ships are framed by the IMO * in some specific SECA zones **
0%
1%
2%
3%
4%
5%
2000 2005 2010 2015 2020 2025
0.5%0.1%
In and out of these zones, the regulation will harden in the upcoming years
Sox
pro
po
rtio
n in
th
e f
ue
l (%
) Hors SECA
SECA
Scrubbers
Allowing for strong investmentand a more important fuelconsumption to avoid SOxemissions.
Marine gasoline use (MGO)
Less emitting fuel but much moreexpensive than HFO. It is possibleto install two tanks to use this fuelin SECA areas.
Shift to an LNG-powered motor
Less emitting fuel cheaper thanMGO and HFO but requiringheavy investment for theconversion of the ship.
[Source : Sia Partners consolidation according to IMO, Wärtsilä, WorldMaritimeNews, DNVGL] [Source : Sia Partners consolidation according to Wärtsilä 2016, Ship & Bunker]
3
Current emission control areas (≤0.1% SOx)
Main shipping routes
**Sulphur Emission Control Areas*International Maritime Organisation
3.5%
Global Sulphur cap
Several suppliers have releasednew hybrid fuel productscontaining a maximum of 0.10%m/m Sulphur
Hybrid fuels (ULSFO)
China has already planned a 0.5% Sulphur limit in 3 maritime zones to be applied on January 1st 2019
The IMO decided to apply the 0.5% Global Sulphur Cap starting from 2020 in October 2016. This decision will largely benefit to LNG bunkering.
Current NOx emission control area
- Contacts : C. de Lorgeril, J. Hamidi, M. Larquetoux
19Energy Lab © Sia Partners
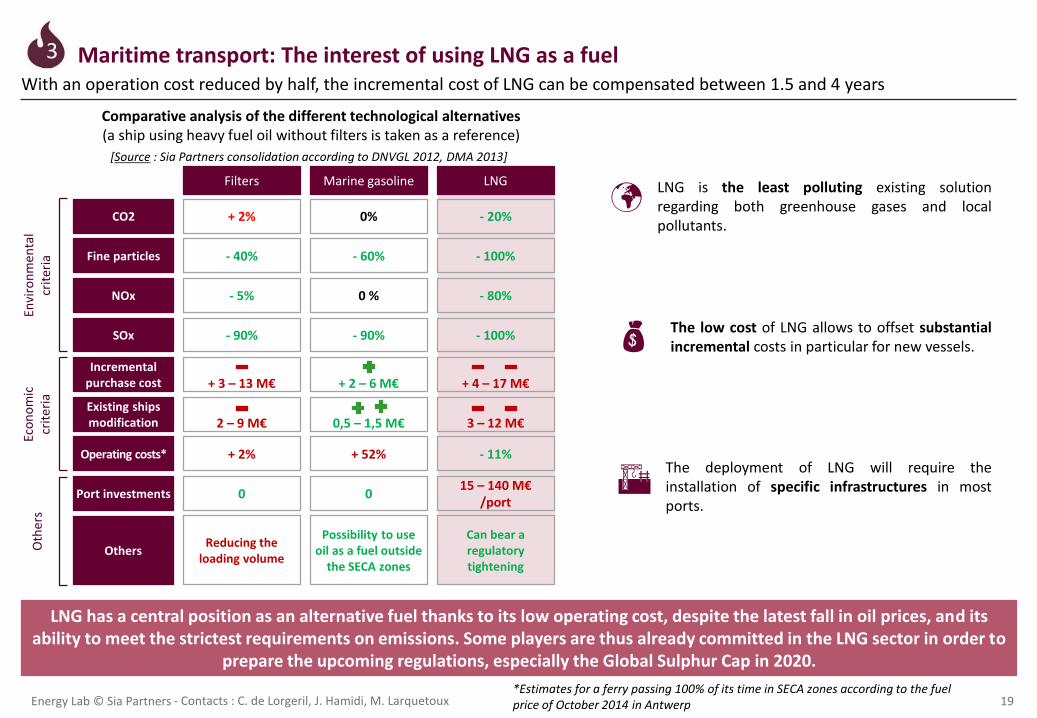
Comparative analysis of the different technological alternatives (a ship using heavy fuel oil without filters is taken as a reference)
LNG has a central position as an alternative fuel thanks to its low operating cost, despite the latest fall in oil prices, and its ability to meet the strictest requirements on emissions. Some players are thus already committed in the LNG sector in order to
prepare the upcoming regulations, especially the Global Sulphur Cap in 2020.
Maritime transport: The interest of using LNG as a fuelWith an operation cost reduced by half, the incremental cost of LNG can be compensated between 1.5 and 4 years
LNG is the least polluting existing solutionregarding both greenhouse gases and localpollutants.
The low cost of LNG allows to offset substantialincremental costs in particular for new vessels.
The deployment of LNG will require theinstallation of specific infrastructures in mostports.
Eco
no
mic
cr
iter
iaO
ther
sEn
viro
nm
enta
l cr
iter
ia
Incremental purchase cost
Existing ships modification
Operating costs*
Port investments
Others
CO2
Fine particles
SOx
NOx
+ 4 – 17 M€
3 – 12 M€
- 11%
15 – 140 M€/port
Can bear a regulatory tightening
LNG
- 20%
- 100%
- 100%
- 80%
+ 3 – 13 M€
2 – 9 M€
+ 2%
0
Reducing the loading volume
Filters
+ 2%
- 40%
- 90%
- 5%
+ 2 – 6 M€
0,5 – 1,5 M€
+ 52%
0
Possibility to use oil as a fuel outside
the SECA zones
Marine gasoline
0%
- 60%
- 90%
0 %
*Estimates for a ferry passing 100% of its time in SECA zones according to the fuel price of October 2014 in Antwerp
[Source : Sia Partners consolidation according to DNVGL 2012, DMA 2013]
3
- Contacts : C. de Lorgeril, J. Hamidi, M. Larquetoux

20Energy Lab © Sia Partners
Maritime transport: Situational analysis of the LNG sectorMainly used in Europe, LNG represents less than 1% of global consumption of marine fuels
The market is mainly concentrated today in the Baltic sea with more than 75% of existing supply. This model could be exportedto the rest of the world with the extension of the SECA regulations in 2020.
Existing LNG supply infrastructures and those under construction
Existing LNG ships and those under construction in the world
The development of LNG ships has recently accelerated,surpassing the 100 level of existing or under constructionvessels.
The main part of the existing supply infrastructures aresituated in Northern Europe today. Many projects startbeing planned around the world.
This concentration of infrastructures encourages mainly'short-sea' shipbuilding (ferry or ro-ro type) in the SECAzone.
[Source : Sia Partners consolidation according to DNVGL 2015]
3
0
50
100
150
2000 2002 2004 2006 2008 2010 2012 2014 2016 2018Tota
l nu
mb
er o
f sh
ips*
LNG ships in operation LNG ships in order
* Excluding LNG carriers and inland waterway vessels
[Source : Sia Partners consolidation according to DNVGL 2015]
- Contacts : C. de Lorgeril, J. Hamidi, M. Larquetoux
21Energy Lab © Sia Partners
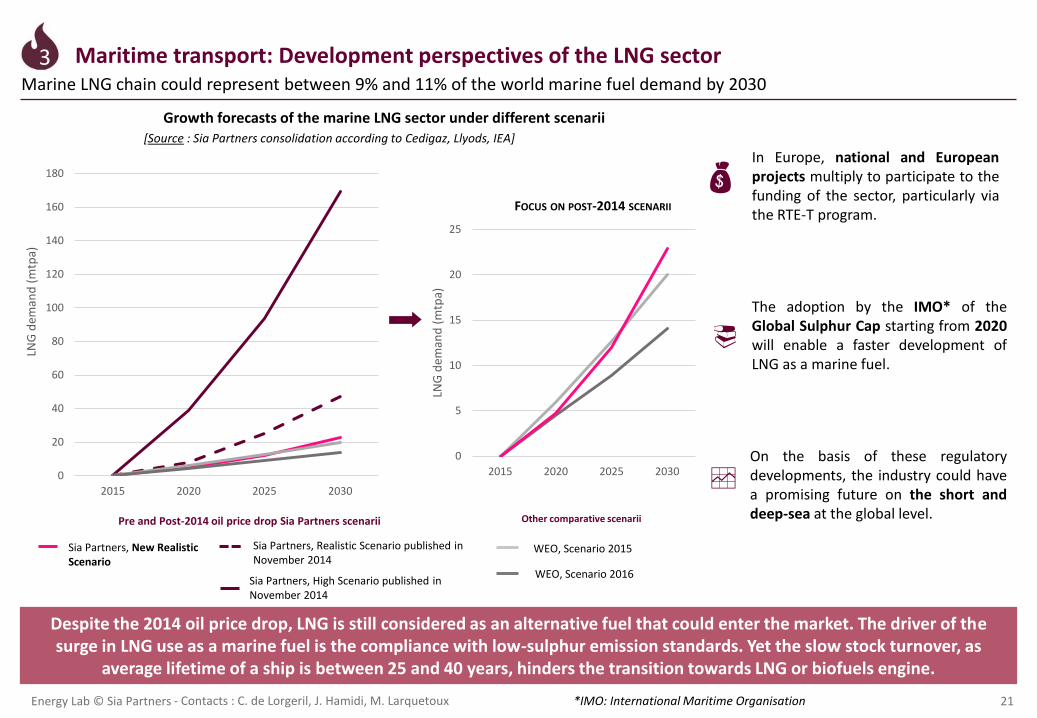
Maritime transport: Development perspectives of the LNG sectorMarine LNG chain could represent between 9% and 11% of the world marine fuel demand by 2030
Despite the 2014 oil price drop, LNG is still considered as an alternative fuel that could enter the market. The driver of the surge in LNG use as a marine fuel is the compliance with low-sulphur emission standards. Yet the slow stock turnover, as
average lifetime of a ship is between 25 and 40 years, hinders the transition towards LNG or biofuels engine.
The adoption by the IMO* of theGlobal Sulphur Cap starting from 2020will enable a faster development ofLNG as a marine fuel.
On the basis of these regulatorydevelopments, the industry could havea promising future on the short anddeep-sea at the global level.
In Europe, national and Europeanprojects multiply to participate to thefunding of the sector, particularly viathe RTE-T program.
Growth forecasts of the marine LNG sector under different scenarii[Source : Sia Partners consolidation according to Cedigaz, Llyods, IEA]
3
*IMO: International Maritime Organisation
Sia Partners, New Realistic Scenario
Sia Partners, High Scenario published in November 2014
WEO, Scenario 2016
WEO, Scenario 2015
Other comparative scenariiPre and Post-2014 oil price drop Sia Partners scenarii
0
20
40
60
80
100
120
140
160
180
2015 2020 2025 2030
LNG
dem
and
(mtp
a)
0
5
10
15
20
25
2015 2020 2025 2030
LNG
dem
and
(m
tpa)
Sia Partners, Realistic Scenario published in November 2014
FOCUS ON POST-2014 SCENARII
- Contacts : C. de Lorgeril, J. Hamidi, M. Larquetoux
22Energy Lab © Sia Partners
4 Conclusion and perspectivesLNG as a fuel is destined to grow around the world and could become a major player in the transport sector
- Contacts : C. de Lorgeril, J. Hamidi, M. Larquetoux
23Energy Lab © Sia Partners
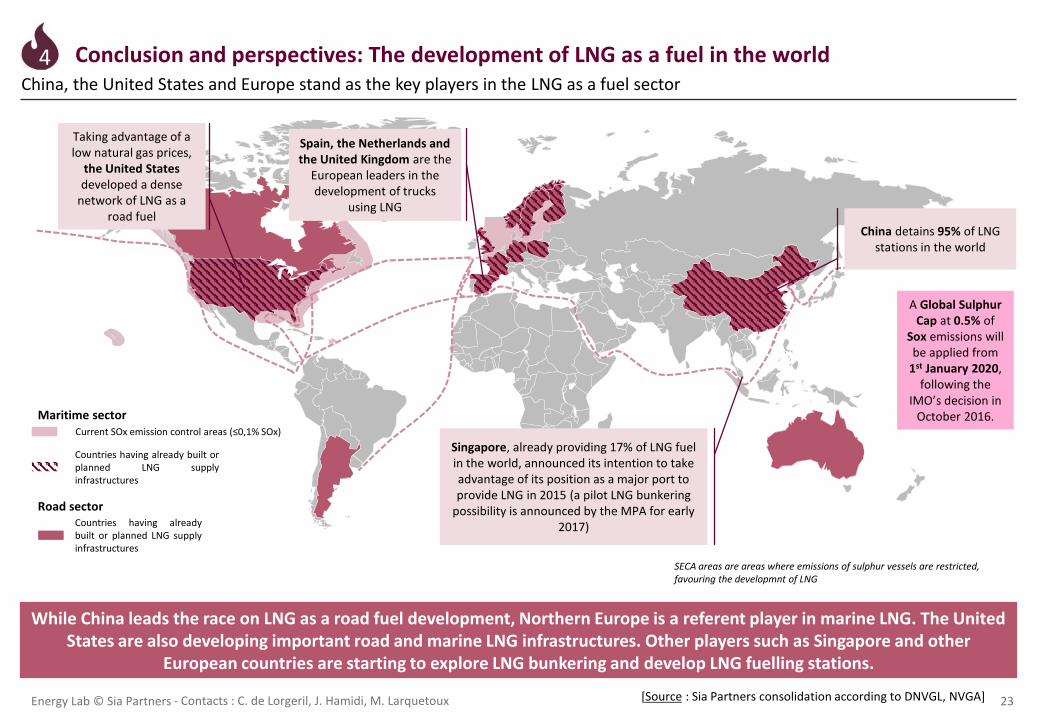
Conclusion and perspectives: The development of LNG as a fuel in the worldChina, the United States and Europe stand as the key players in the LNG as a fuel sector
4
China detains 95% of LNG stations in the world
Singapore, already providing 17% of LNG fuel in the world, announced its intention to take advantage of its position as a major port to provide LNG in 2015 (a pilot LNG bunkering
possibility is announced by the MPA for early 2017)
Spain, the Netherlands and the United Kingdom are the
European leaders in the development of trucks
using LNG
Taking advantage of a low natural gas prices,
the United States developed a dense
network of LNG as a road fuel
[Source : Sia Partners consolidation according to DNVGL, NVGA]
SECA areas are areas where emissions of sulphur vessels are restricted, favouring the developmnt of LNG
While China leads the race on LNG as a road fuel development, Northern Europe is a referent player in marine LNG. The United States are also developing important road and marine LNG infrastructures. Other players such as Singapore and other
European countries are starting to explore LNG bunkering and develop LNG fuelling stations.
Countries having alreadybuilt or planned LNG supplyinfrastructures
Maritime sector
Road sector
Countries having already built orplanned LNG supplyinfrastructures
Current SOx emission control areas (≤0,1% SOx)
A Global Sulphur Cap at 0.5% of
Sox emissions will be applied from
1st January 2020, following the
IMO’s decision in October 2016.
- Contacts : C. de Lorgeril, J. Hamidi, M. Larquetoux

24Energy Lab © Sia Partners
0,00
50,00
100,00
150,00
200,00
2015 2020 2025 2030
LNG
dem
and
(mtp
a)
Even though growth perspectives have been hindered since the oil prices collapse in 2014, they now represent 9% of the world demand for LNG, and they are still favorable given the evolution of the regulatory framework. Oil & Gas players are showing growing
interest towards this alternative, and the race between stakeholders is on to reach a still unoccupied status of world leader.
LNG as a fuel may represent almost 50 mtpa in 2030 according to Sia Partners realistic scenarios
Forecasts of growth in the sector of LNG fuel under different scenarios
[Source : Sia Partners consolidation according to Shell, Pace Global]
mtpa : million tonnes (of LNG) per annum (per year)
4
Sia Partners, New Realistic Scenario
Sia Partners, High Scenario published in November 2014
Sia Partners, Realistic Scenario published in November 2014
- Contacts : C. de Lorgeril, J. Hamidi, M. Larquetoux
Conclusion and perspectives: The development of LNG as a fuel in the world

25Energy Lab © Sia Partners
Conclusion and perspectives: The development of LNG as a fuel in the worldMain evolutions in the sector since November 2014, the publication date of the latest Sia Partner’s analysis on this topic
4
Many evolutions took place since the latest Sia Partners study on LNG as a fuel was published in November 2014. Overall, the fall in oil prices that occurred at the end of 2014, slowed down the growth of LNG as a fuel giving it less optimistic perspectives on the mid-term. However, the recent restrictions on emissions from maritime transportation and the COP 21 and 22 goals to reduce emissions from road transportation, place LNG as a
clean fuel with bullish growth perspectives.
A sharp fall in oil prices since 2014, slows down LNG growth …
• The fall in oil prices from 100 $/barrel mid-2014 to over 50 $currently, slowed down the development of LNG as fuel.
• Almost 80% of LNG in the world is traded on long-term contractswith prices indexed on or at least related to oil prices.
… but, stricter restrictions on emissions maintain bright perspectives for LNG as a road and maritime fuel
Road transportation Maritime transportation
Although the economic situation seems to be slowing down the growth of LNG as a fuel, many LNG projects are being developed and the fuel is gaining ground in governmental policies worldwide. The increasing use of biomethane also reinforces the positive
environmental impact of LNG.
• In October 2016, the IMOadopted a 0.5% Global SulphurCap starting from January 1st
2020.• The NOx restriction areas
were also extended by theIMO.
• China started applying SOxand NOx restrictions onshorein many ports since 2017.
• The UN’s COP 21 defined more ambitious goals to reduce emissions coming from road transportation.
• LNG is seen as a viable road fuel to meet these targets.
• Although China and the USremain world leaders, the EUis developing important infrastructure for LNG as a road fuel through the project Blue Corridors.
Brent crude oil price evolution according to Investing.com, October 2017
- Contacts : C. de Lorgeril, J. Hamidi, M. Larquetoux

26Energy Lab © Sia Partners
Comparative analysis between LNG and bio LNG on strategic factors
Small scale bioLNG represents a real development axe for greener LNG as a fuel. Despite a slightly higher cost, bioLNG has advantages other than reducing the environmental impact. Due to its local production, it guarantees a security of supply, and
an independence from the international gas market price.
Conclusion and perspectives: The development of LNG as a fuel in the worldBiomethane offers interesting development perspectives of bioLNG, a renewable alternative for gas-fuelled vehicles and ships
Bio LNG is an emerging fuelproduced thanks to liquefactionof biomethane.
Bio LNG allows vehiclesautonomy over 1000 km, whichmakes it a suitable fuel for longdistance transportation.
GHG emission reduction
E.U. incentives
LNG Bio LNG
[Source : Sia Partners analysis according to ADEME, European Commission, EAFO]
4
10% share of fuels produced from renewable sources
in the transport fuel mix by 2020
Financial and legal support for the deployment of alternative fuels
infrastructures
Filling stations in Europein 2016
107 distributed in 11 countries
Fewdistributed in UK, Sweden, the
Netherlands
Energy independence Local production from agricultural and industrial waste and sewage sludge
Extraction from natural gas deposit
+–
Methanation Purification Liquefaction
Production process of liquefied biomethane
TransportationBiogas sources
Production
Biogas Biomethane Liquefied biomethaneWaste
Exploitation
24%Well to wheel emissions avoided
compared to diesel
80%Well to wheel emissions avoided
compared to diesel
The use of BioLNG preventsreduces by 50% Nox emissionsand by 95% fines particlescompared to Diesel.
- Contacts : C. de Lorgeril, J. Hamidi, M. Larquetoux

27Energy Lab © Sia Partners
BioLNG as a fuel is a complementary business model for biomethane producers, but liquefaction activity experiences fast change and growth.
Conclusion and perspectives: The development of LNG as a fuel in the worldBiomethane liquefaction is a vehicle for flexibility for the disposal of production surplus among producers
4
1197
581
1311
318 291
455322
0
200
400
600
800
1000
1200
1400
Germany Sweden U.K. Switzerland France Austria Finland
(Nm
3 / h
of
bio
met
han
e)
Average production capacity of biomethane European facilities
Liquefaction technologies
Nitrogen refrigerant
Single cycle mixed refrigerant
ERIEE cryogenics
Stirling cycle
Associated flows
Electric consumption
0.24 kWh/Nm3 0.5 kWh/Nm3
(Purification + liquefaction)N.A.0.47 kWh/Nm3
(Wärtsilä)
>310 Nm3/h >620 Nm3/h 70< Flow< 2000 Nm3/h
6< Flow< 930 Nm3/h
Associated flows
Actors
Progress has still to be made in small scale liquefactiontechnology to make it less expensive. Liquefactiondoes not benefit from economies of scale yet with theamount of biogas provided. Furthermore, in France itis still more profitable to inject biomethane in thenetwork due to preferential injection prices andrather low production volumes.
BioLNG as a fuel can be seen as a complementary usefor biomethane producers offering higher flexibility.The production surplus can be liquefied and supplyfilling stations with an eco-friendly fuel produced fromlocal renewable sources.
Despite the remaining hindrances such as the lack ofmaturity in liquefaction technologies, Europeanbiomethane production and existing refuellinginfrastructures are favourable to the development ofbioLNG as a fuel. Thus, numerous Oil & Gas playerssuch as Air Liquide are investing in the market andsmaller players are also developing their owntechnologies such as Cryopur.
- Contacts : C. de Lorgeril, J. Hamidi, M. Larquetoux

28Energy Lab © Sia Partners
Conclusion and perspectives: The development of LNG as a fuel in the worldBioLNG as a road fuel is a recent and flourishing market that may take advantage of the already existing LNG infrastructure
4
BioGNVAL, Valenton2013
CryoPur - Suez - SIAAP
EGE Biogass, Oslo 2013
Wärtsilä Oil & Gas Systems - Norwegian Cambi
AS
Lidköping2011
Swedish Biogas - FordonsGasAlbury, UK2008
Gasrec – Linde – Sita UK
TrondheimFin 2017
Purac – Biokraft - Wärtsilä
Identified bioLNG as a road fuel production plants in Europe
Identified bioLNG production plant
Project of bioLNG production plant
LNG filling station
Project of LNG filling station
Caption
- Contacts : C. de Lorgeril, J. Hamidi, M. Larquetoux

29Energy Lab © Sia Partners
Conclusion and perspectives: The development of LNG as a fuel in the worldBioLNG is a promising fuel with almost no environmental impact but its development is shadowed by rather costly technologies
4
Development prospects for marine transport
BioLNG as a fuel allows transport sector to meet higher standards regarding GHG emissions reduction and may benefit from regulatory drivers.
Development of LNG and bio LNG as a marine fuel is increasingly being considered.
The Rotterdam Port started a study in collaboration with theNational LNG Platform and several firms to assess theopportunities to develop LNG as a marine fuel in the port ofRotterdam. This study is expected to be released by the endof 2017 (more information).
German government acts for the development of LNG as amarine fuel : they announced earlier in September 2017 thelaunch of a funding plan to support investments in LNG shipconversion. Hamburg will also host soon a LNG terminal (moreinformation).
Investment in LNG infrastructure is an opportunity for the later deployment of bioLNG
Bio LNG is a fuel made from renewable sources, and does not belong tothe biofuel category, whose development is hindered by E.U.
Bio LNG is an alternative solution to sell biomethane production andenables producers to yield benefits from production surplus.
The French « Plan Climat » foresees the creation of a « clean mobility fund »to sustain the development of filling infrastructures for alternative fuels,and tax benefits to be given for the purchase of trucks fuelled by naturalgas.
Still, Third and Fourth Generations of bioGNL, resulting from microalgaerecovery, allow production of biogas in larger amount than formergenerations.
STRENGTHS
OPPORTUNITIES
BioLNG as a transport fuel is an emerging market and its deploymentrequire investments in production facilities and filling infrastructures.
THREATS
Low volume of production may slow down the full scale deployment ofthis fuel.
WEAKNESSES
- Contacts : C. de Lorgeril, J. Hamidi, M. Larquetoux

30Energy Lab © Sia Partners
5 For more information
- Contacts : C. de Lorgeril, J. Hamidi, M. Larquetoux

31Energy Lab © Sia Partners
Tel:
Mail:
Mail: Mail:
Le magazine Energies et Environnement de Sia Partnershttp://energie.sia-partners.com/
@SiaEnergie
Vos contacts
Charlotte de LORGERIL
Associate Partner
+33 6 24 73 18 34
@cdelorgeril
Jihane HAMIDI
Consultant
Marion LARQUETOUX
Junior consultant
- Contacts : C. de Lorgeril, J. Hamidi, M. Larquetoux
@jihamidi @mlarquetoux

Driving ExcellenceFollow us on LinkedIn and Twitter @SiaPartners
Abu DhabiPO Box 54605West Tower #605Abu Dhabi Mall - UAE
AmsterdamBarbara Strozzilaan 1011083 HN Amsterdam -Netherlands
BrusselsAv Henri Jasparlaan, 1281060 Brussels - Belgium
Casablanca14, avenue Mers Sultan20500 Casablanca -Morocco
Charlotte401 N. Tryon Street, 10th FloorCharlotte, NC 28202 - USA
DohaPO Box 27774 DohaTornado Tower #2238West Bay - Qatar
DubaiPO Box 502665Shatha Tower office #2115Dubai Media CityDubai - UAE
Hong Kong23/F, The Southland Building48 Connaught Road CentralCentral - Hong Kong
Montreal2000 McGill CollegeSuite 600Montreal QC H3A 3H3 -Canada
Paris12 rue Magellan75008 Paris - France
RiyadhPO Box 91229Office 8200 - 12, Izdihar cityRiyadh 11633 - KSA
RomeVia Quattro Fontane 11600184 Roma - Italy
TokyoLevel 20 Marunouchi Trust Tower-Main1-8-3 Marunouchi, Chiyoda-kuTokyo 100-0005 Japan
London2nd Floor, 4 EastcheapLondon EC3M 1AE –United Kingdom
Luxembourg7 rue Robert StumperL-2557 Luxembourg
Lyon3 rue du Président Carnot69002 Lyon - France
MilanVia Gioberti 820123 Milano - Italy
Houston800 Town and Country Blvd Suite 300Houston TX 77024
Singapore 137 Market Street #10-02 Grace Global Raffles048943 Singapore
New York40 Rector Street, Suite 1111New York, NY 10006 – USA