Embed Size (px)
Citation preview

IPO trends worldwide and experiences from the
Warsaw Stock Exchange
Tomasz Konieczny
2 July 2010

PricewaterhouseCoopers Page 2
Agenda
Recent IPO trends
Experiences from Warsaw
Privatisation through the WSE

PricewaterhouseCoopers Page 3
Agenda
Recent IPO trends
Experiences from Warsaw
Privatisation through the WSE

PricewaterhouseCoopers Page 4
Source: PricewaterhouseCoopers – IPO Watch Europe
Number and value of IPOs on the European markets 2003-2009
149
433
573
295
126
771806
0
150
300
450
600
750
900
2003 2004 2005 2006 2007 2008 2009
Nu
mb
er
of
IPO
s
0
20,000
40,000
60,000
80,000
100,000
Valu
e o
f IP
Os (
€m
)
Number of IPOs Value of IPOs (€m)
Recent IPO trends
PricewaterhouseCoopers Page 5
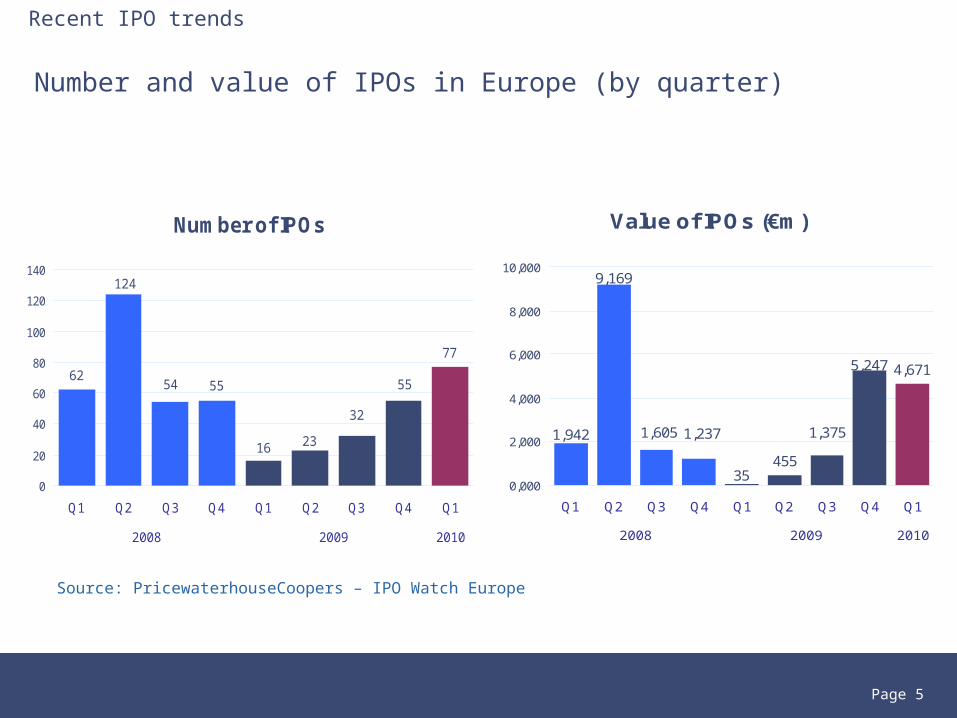
Number and value of IPOs in Europe (by quarter)
Source: PricewaterhouseCoopers – IPO Watch Europe
Value of IPOs (€m)
455
4,671
1,375
5,247
9,169
35
1,6051,942 1,237
0,000
2,000
4,000
6,000
8,000
10,000
Q1 Q2 Q3 Q4 Q1 Q2 Q3 Q4 Q1
2008 2009 2010
Number of IPOs
62
77
124
55
32
16 23
54 55
0
20
40
60
80
100
120
140
Q1 Q2 Q3 Q4 Q1 Q2 Q3 Q4 Q1
2008 2009 2010
Recent IPO trends

PricewaterhouseCoopers Page 6
Number and value of IPOs on main EU regulated markets in 2009
12
9
6
0
2
4
6
8
10
12
Warsaw London Euronext
Number of IPOs
Source: PricewaterhouseCoopers – IPO Watch Europe
1 584
620
1 907
0.000
0.500
1.000
1.500
2.000
Warsaw London Euronext
Value of IPOs (€m)
Recent IPO trends

PricewaterhouseCoopers Page 7
Number and value of IPOs on main exchange regulated markets in 2009
26
14
28
0
5
10
15
20
25
30
Warsaw (NewConnect) London (AIM) Euronext (Marche Libre)
Number of IPOs
Source: PricewaterhouseCoopers – IPO Watch Europe
10
655
10
200
400
600
Warsaw (NewConnect)
London (AIM) Euronext (Marche Libre)
Value of IPOs (€m)
Recent IPO trends

PricewaterhouseCoopers Page 8
Agenda
Recent IPO trends
Experiences from Warsaw
Privatisation through the WSE

PricewaterhouseCoopers Page 9
Warsaw Stock Exchange (WSE)
• WSE runs several markets:
- Main Market – EU regulated
- alternative markets (New Connect for equities, Catalyst for debt) – exchange regulated
• According to FESE data, WSE market capitalisation at the end of May 2010 was EUR 118,224 million
• As of 18 June 2010 there were:
- 381 companies listed on the WSE Main Market, 23 of which were non-domestic (including two Estonian entities)
- 135 companies listed on the NewConnect market, 2 of which were non-domestic
Experiences from Warsaw

PricewaterhouseCoopers Page 10
020 00040 00060 00080 000
100 000120 000140 000160 000
Market capitalisation of mid-size European marketsas of May 2010
Source: FESE
Experiences from Warsaw
€ ‘000

PricewaterhouseCoopers Page 11
WSE and selected other regional exchanges
Stock exchange
Market capitalisation
(€m)
Number of companies
(main + alternative)
WSE 118.2 508
Vienna 76.9 113
Prague 32.8 26
Budapest 21.1 46
Source: FESE, May 2010
Experiences from Warsaw

PricewaterhouseCoopers Page 12
Number and average offering value of domestic IPOs on the WSE main market by total assets and revenue of issuers (2006-2009)*
0-12 12-37 37-61 61-243 >243 Total
0-12 58 (€5.1m) 16 (€8.0m) - 1 (€1.5m) - 75 (€5.8m)
12-73 6 (€9.0m) 19 (€10.9m) 7 (€12.2m) 6 (€11.9m) - 38 (€10.9m)
37-61 1 (€6.8m) 3 (€20.2m) 2 (€12.2m) 3 (€25.6m) - 9 (€18.7m)
61-243 1 (€258.0m) 2 (€41.6m) 3 (€100.0m) 7 (€89.1m) 2 (€36.8m) 15 (€89.3m)
>243 - - - - 5 (€435.5m) 5 (€435.5m)
Total 66 (€9.2m) 40 (€11.9m) 12 (€34.1m) 17 (€45.4m) 7 (€321.6m) 142 (€31.9m)
Revenue (EUR million)
To
tal a
ss
ets
(E
UR
mill
ion
)
Experiences from Warsaw
Source: PricewaterhouseCoopers, prospectuses and current reports of listed companies
* Translated from PLN to EUR using 4.1082 PLN/1€ exchange rate (end-December 2009 exchange rate)

PricewaterhouseCoopers Page 13
Number of domestic IPOs on the WSE main market by % of equity offered (2006-2009)
43
40
24
15
2 1
0
5
10
15
20
25
30
35
40
45
0-20 20-30 30-40 40-50 50-60 >60
Nu
mb
er o
f IP
Os
% of equity offered
Experiences from Warsaw
Source: PricewaterhouseCoopers, prospectuses and current reports of listed companies

PricewaterhouseCoopers Page 14
Average cost of domestic IPOs on the WSE main market by offering value (2006-2009)*
6.3%
3.8%
3.2%
2.5%
1.0%
0%
1%
2%
3%
4%
5%
6%
7%
0-12 12-37 37-61 61-243 >243
Offering value (EUR million)
Experiences from Warsaw
Source: PricewaterhouseCoopers, prospectuses and current reports of listed companies
* Translated from PLN to EUR using 4.1082 PLN/1€ exchange rate (end-December 2009 exchange rate), does not include underwriting fees (if any)

PricewaterhouseCoopers Page 15
WSE key success factors
• Strong market institutions and regulations
• Pension funds in Poland invest up to 40% of their assets in equities of the companies listed on the regulated market
• Large individual investor base
• Privatisation of the biggest state-owned enterprises through an IPO
• Relatively large internal market
• Ability to compete with London and other exchanges for the biggest CEE companies
• Poland’s resilient economy
Experiences from Warsaw

PricewaterhouseCoopers Page 16
Agenda
Recent IPO trends
Experiences from Warsaw
Privatisation through the WSE

PricewaterhouseCoopers Page 17
Privatisation through the Warsaw Stock Exchange (WSE)
Ciech, KGHM, PKN Orlen, PKO BP, PZU, …..
• Interesting examples where the Treasury managed to:
• increase management effectiveness through privatisation
• reduce the Treasury’s ownership below 50%
• ensure high free float
• retain control over the strategically important companies
• ensure high transparency
• As a result of the privatisation process:
• The WSE helped the Treasury privatise companies
• The Treasury helped the WSE increase its capitalisation and attract domestic and foreign investors
Experiences from Warsaw

PricewaterhouseCoopers
Treasury’s ownership of selected companies privatised through the WSE
Page 18
Company Shareholder Ownership (% of capital)
PKN Orlen AVIVA OFE 5.08%
Oil&gas ING OFE 5.17%
Treasury 27.52%
Free-float 62.23%
KGHM Treasury 31.79%
Mining Free-float 68.21%
PKO BP BGK Bank (state-owned) 10.25%
Banks Treasury 40.99%
Free-float 48.76%
PZU EUREKO B.V. 12.99%
Insurance Treasury 45.19%
Free-float 41.82%
Ciech PZU OFE 6.12%
Chemicals Pioneer Pekao Investment Management SA 19.64%
Treasury 36.68%
Free-float 37.56%
Source: WSE, valid as of 17.05.2010
Experiences from Warsaw

PricewaterhouseCoopers
Privatisation of banks through the WSE
• The government’s strategy was to:• privatise the banks• ensure that banks will go public and stay listed on the WSE• sell strategic stakes to foreign banking groups to ensure the
transfer of know-how
• The aim was to:• increase the banks’ efficiency• open up a new source of capital• ensure high transparency of banks (acting as public companies)• limit the ability to transfer of funds (e.g. during crisis) to foreign
headquarters, due to the transparency and rules applicable to public companies
• promote corporate governance
Page 19
Experiences from Warsaw
PricewaterhouseCoopers Page 20
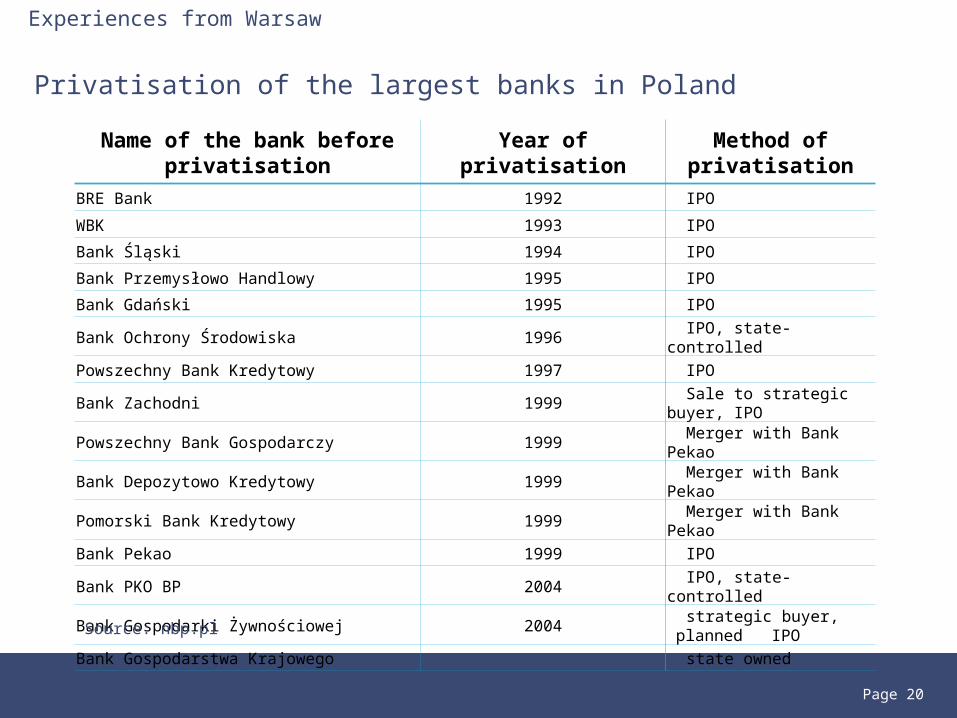
Privatisation of the largest banks in Poland
Experiences from Warsaw
Name of the bank before privatisation
Year of privatisationMethod of
privatisation
BRE Bank 1992 IPO
WBK 1993 IPO
Bank Śląski 1994 IPO
Bank Przemysłowo Handlowy 1995 IPO
Bank Gdański 1995 IPO
Bank Ochrony Środowiska 1996 IPO, state-controlled
Powszechny Bank Kredytowy 1997 IPO
Bank Zachodni 1999 Sale to strategic buyer, IPO
Powszechny Bank Gospodarczy 1999 Merger with Bank Pekao
Bank Depozytowo Kredytowy 1999 Merger with Bank Pekao
Pomorski Bank Kredytowy 1999 Merger with Bank Pekao
Bank Pekao 1999 IPO
Bank PKO BP 2004 IPO, state-controlled
Bank Gospodarki Żywnościowej 2004 strategic buyer, planned
IPO
Bank Gospodarstwa Krajowego state owned
Source: nbp.pl

Thank you!
Tomasz KoniecznyPartner
[email protected]+48 502 18 42 85+48 22 523 42 85
© 2010 PricewaterhouseCoopers. All rights reserved. “PricewaterhouseCoopers” refers to the network of member firms of PricewaterhouseCoopers International Limited, each of which is a separate and independent legal entity. *connectedthinking is a trademark of PricewaterhouseCoopers LLP (US).


![[piotr konieczny] google hacking](https://img.dokumen.tips/doc/110x75/552952e34a7959cc158b46e7/piotr-konieczny-google-hacking.jpg)


