Embed Size (px)
Citation preview
Insert textSecond level
Third levelTribal Group plc
24 November 2009
Peter Martin
Chief Executive
Introduction
2
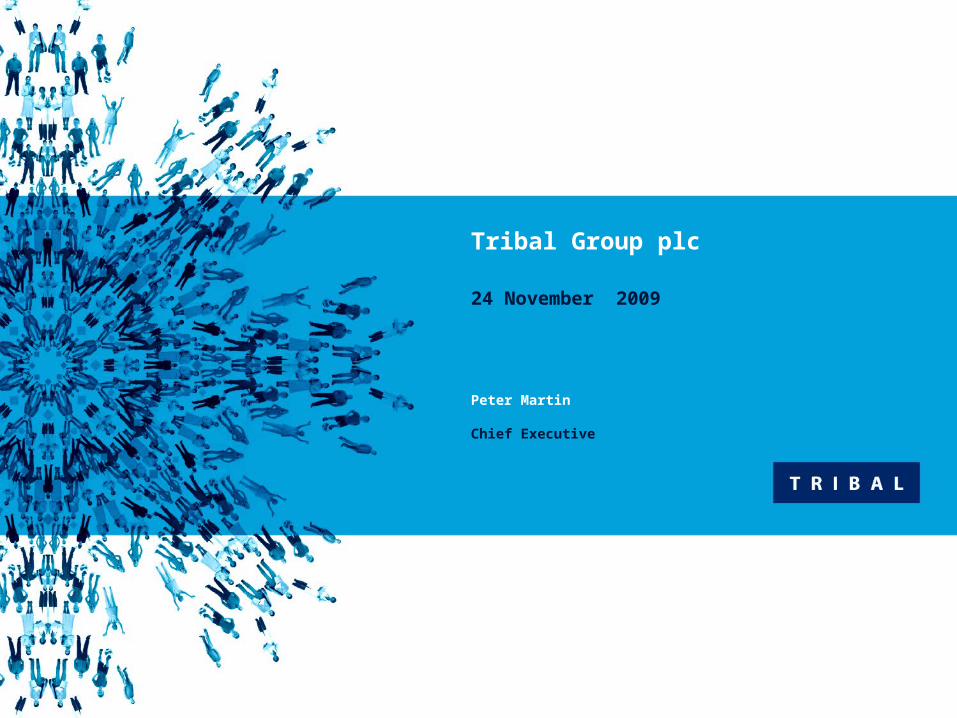
Turnover ~ £250m
Profitable, well financed, cash generative
Professional services that deliver improvements in public services
Business focus: EducationHealthGovernment
UK-based but increasingly international
Strategic objective to increase committed / repeatable income
Competitive advantage: domain expertise allied to technology capability

3
Market Analysis
2009 H1 Revenue : £125.2m
Education 37%Government 36%Health 17%UK Public Sector
6%
4%Other
International
90%
100%
Government Spending
4
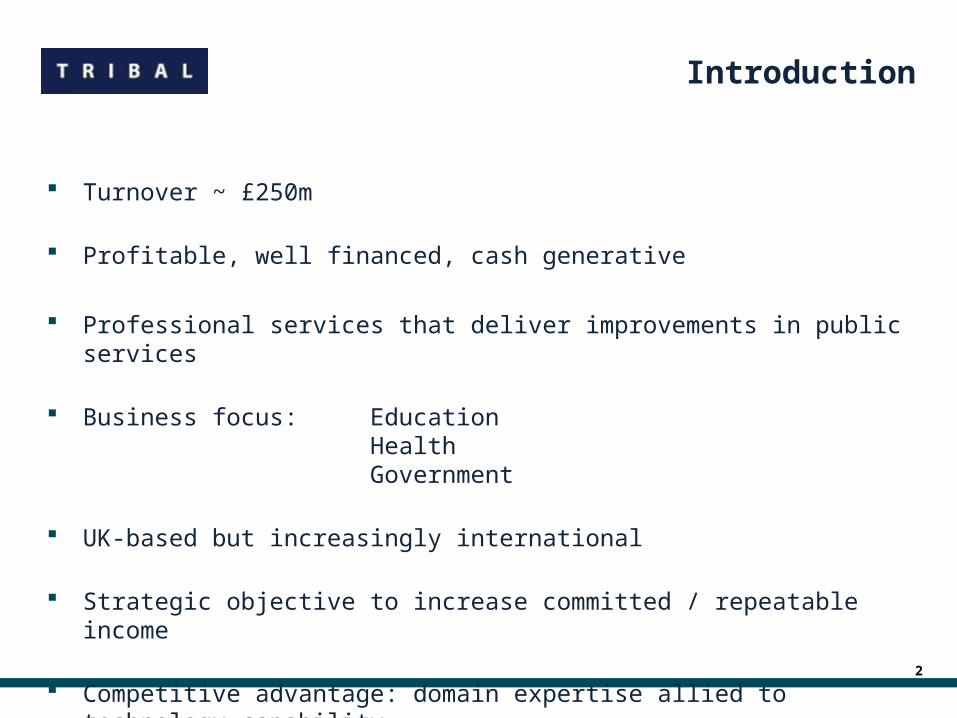
Budget 2009
CSR07 March 2011
- £5bn efficiency savings / assumed in 10/11, but... - Real growth over period of 46%
April 2011 March 2014
- Total spending -0.1% real per annum- Adjusting for ‘known’ increases (debt interest, welfare costs, etc.)
-2.3% real decline per annum
Source: IFS

Government Spending
5
Even assuming no deterioration in government estimates, financial pressures on public sector organisations will increase significantly
Period of healthy real increases several years of real cuts
However, pressure to maintain quality / improve outcomes will remain
Anticipated response:- Reduce costs- Increase productivity- Improve efficiency- More competitive tendering- Further outsourcing opportunities- Collaboration / innovation
Education
6
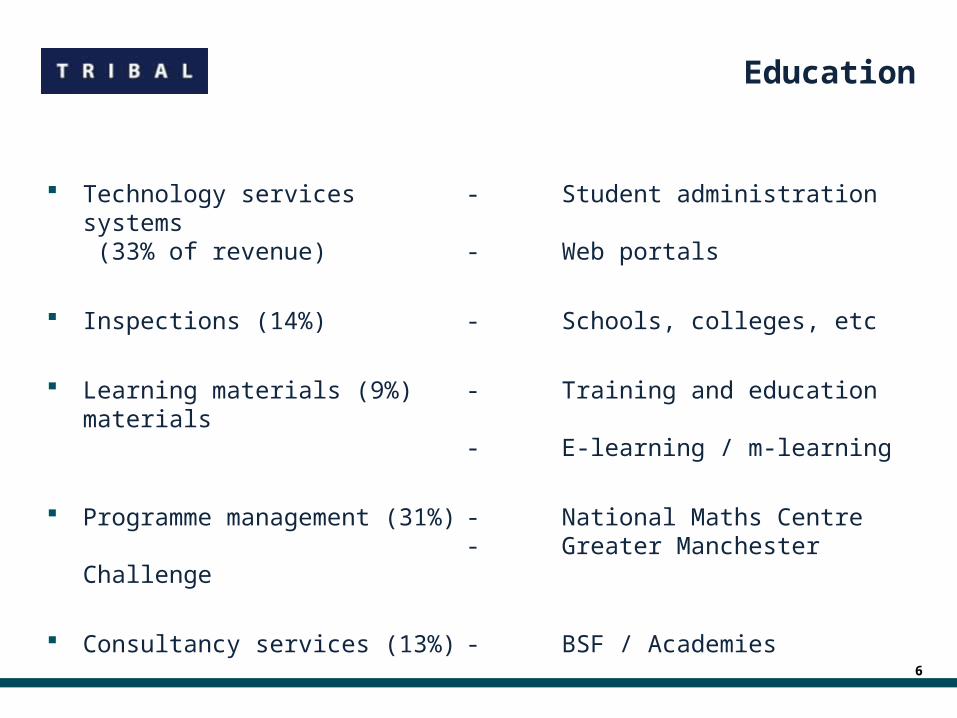
Technology services - Student administration systems (33% of revenue) - Web portals
Inspections (14%) - Schools, colleges, etc
Learning materials (9%) - Training and education materials- E-learning / m-learning
Programme management (31%) - National Maths Centre- Greater Manchester Challenge
Consultancy services (13%) - BSF / Academies
Education Opportunity
7
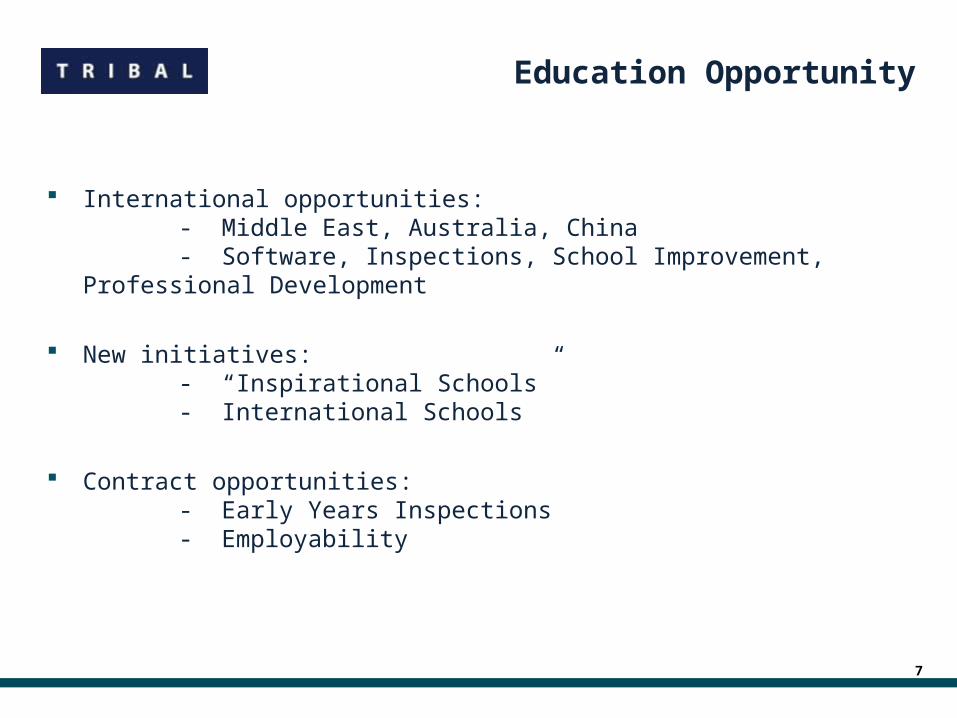
International opportunities:- Middle East, Australia, China- Software, Inspections, School Improvement, Professional
Development
New initiatives:- “Inspirational Schools”- International Schools
Contract opportunities:- Early Years Inspections- Employability

Health
8
Operating at all levels within health- Department of Health- Strategic Health Authorities- Primary Care Trusts (PCTs)- Acute Trusts
Range of professional services- Strategy (DH commercial strategy)- Informatics (National Patient Database, CIO Programme Office)- Commissioning (PCT support)- Wellness (Healthy FE)- Analytics (clinical coding support for hospitals)- Service design (productivity / efficiency)
Health Opportunity
9
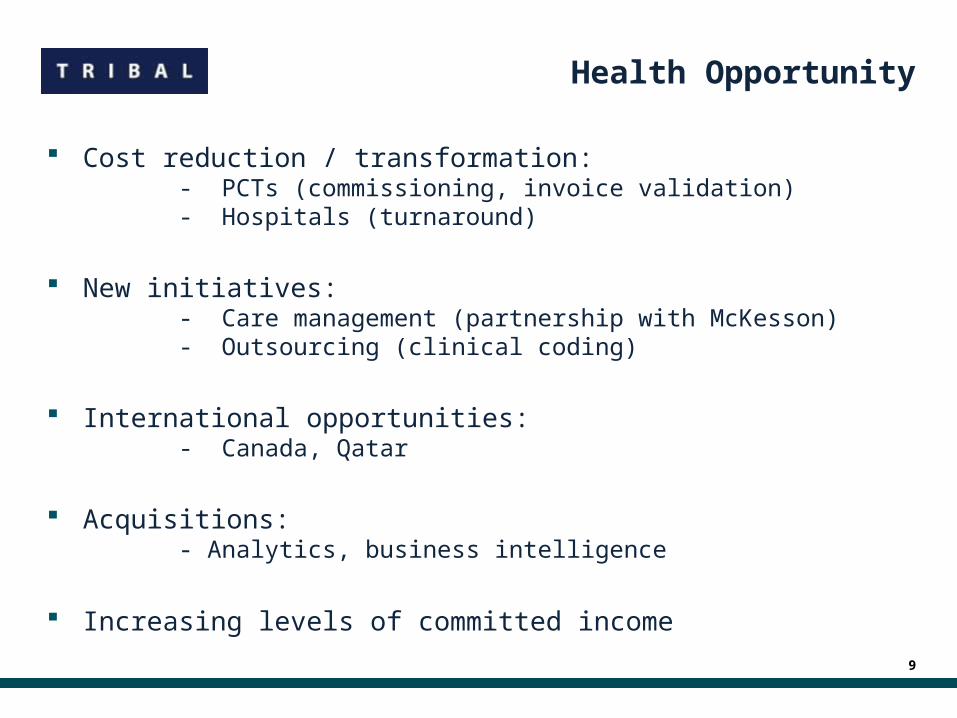
Cost reduction / transformation:- PCTs (commissioning, invoice validation)- Hospitals (turnaround)
New initiatives:- Care management (partnership with McKesson)- Outsourcing (clinical coding)
International opportunities:- Canada, Qatar
Acquisitions:- Analytics, business intelligence
Increasing levels of committed income
Government
10
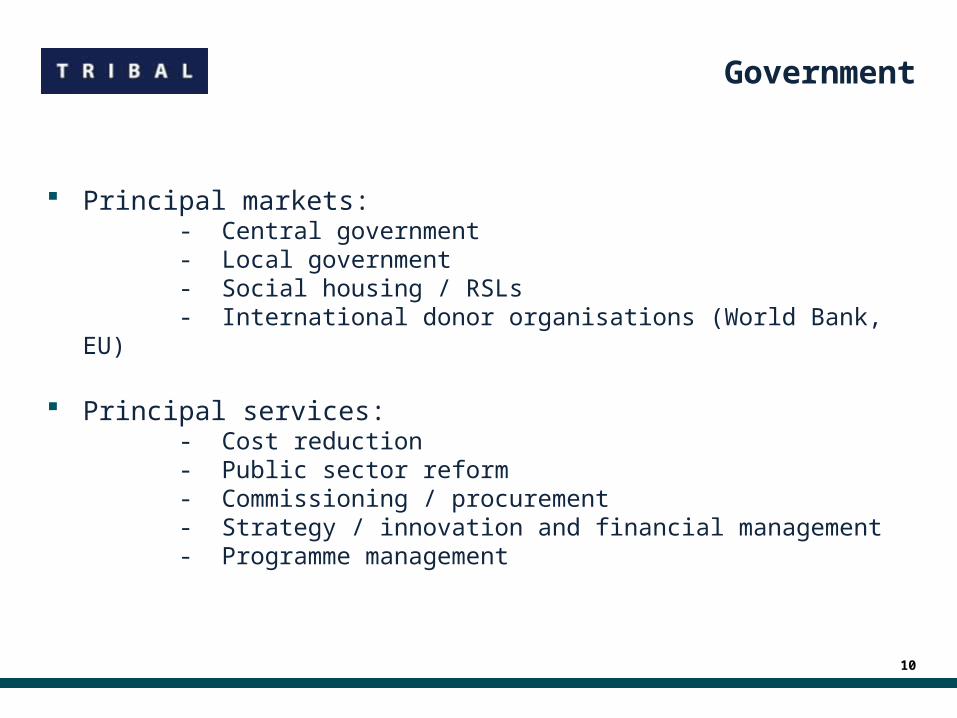
Principal markets:- Central government- Local government- Social housing / RSLs- International donor organisations (World Bank, EU)
Principal services:- Cost reduction- Public sector reform- Commissioning / procurement- Strategy / innovation and financial management- Programme management
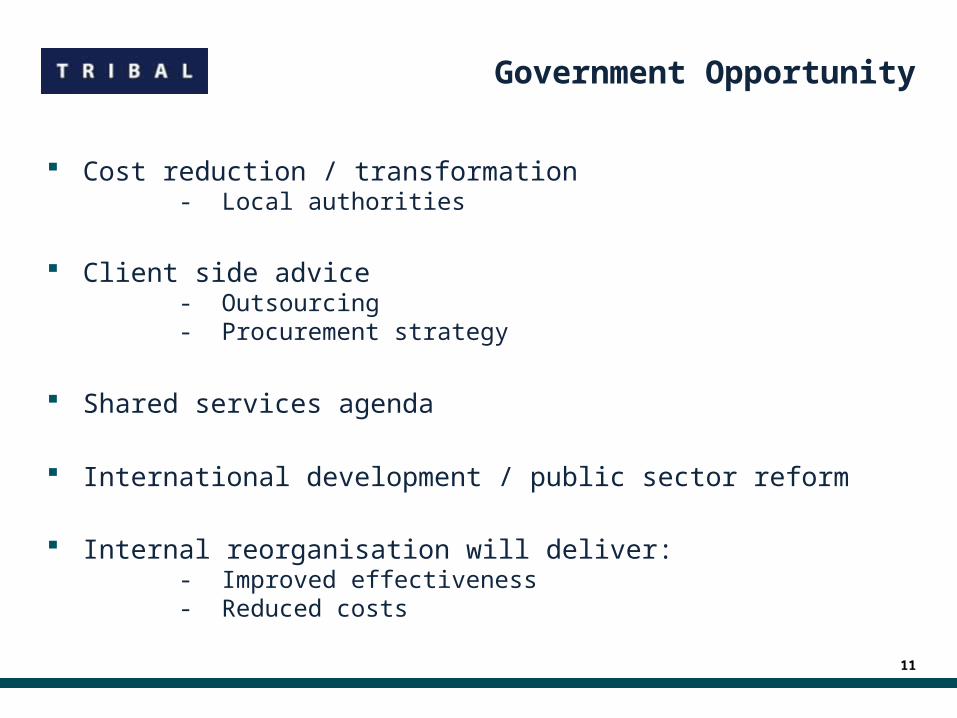
Government Opportunity
11
Cost reduction / transformation- Local authorities
Client side advice- Outsourcing- Procurement strategy
Shared services agenda
International development / public sector reform
Internal reorganisation will deliver:- Improved effectiveness- Reduced costs
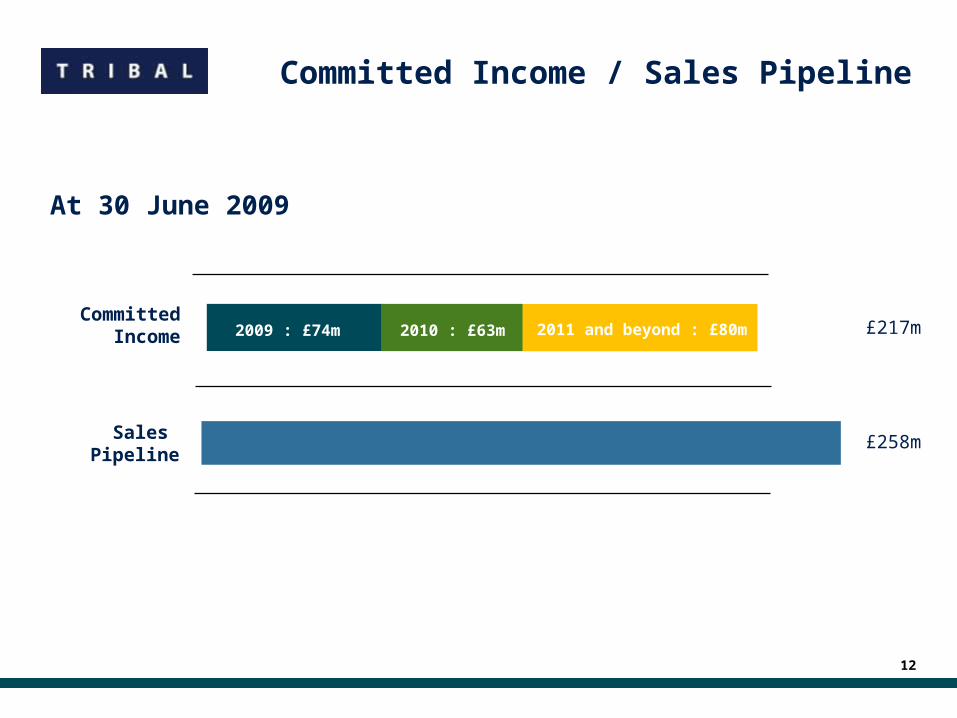
Committed Income / Sales Pipeline
12
2009 : £74m 2010 : £63m 2011 and beyond : £80m
£4m £258m
£217m
Sales Pipeline
Committed Income
At 30 June 2009
13
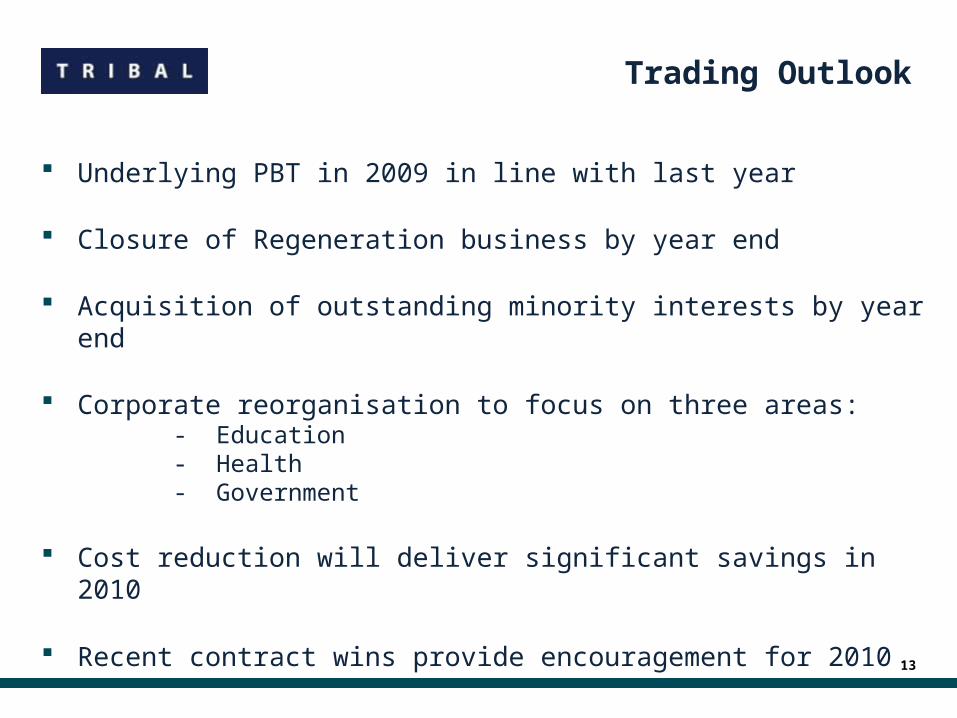
Trading Outlook
Underlying PBT in 2009 in line with last year
Closure of Regeneration business by year end
Acquisition of outstanding minority interests by year end
Corporate reorganisation to focus on three areas:- Education- Health- Government
Cost reduction will deliver significant savings in 2010
Recent contract wins provide encouragement for 2010

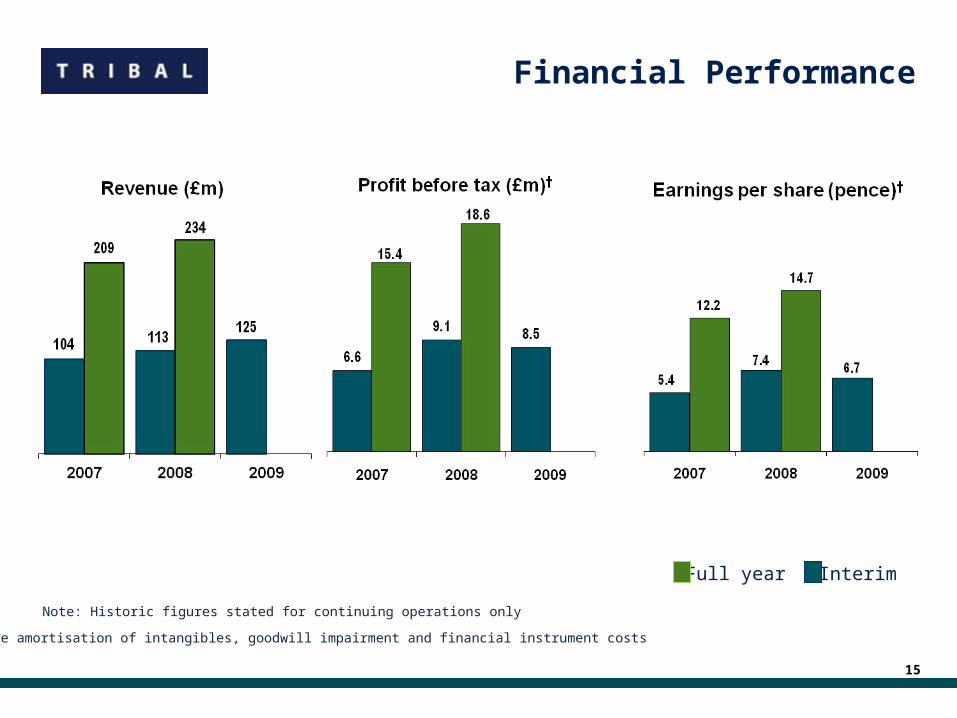
Financial Performance
Note: Historic figures stated for continuing operations only
Full year Interim
† Before amortisation of intangibles, goodwill impairment and financial instrument costs
15

H1 09 Business Review
Progress in a challenging trading environment
Continued strength in many sectors
Difficult conditions in specific areas
Restructuring programme largely completed
Substantially increased committed income
Healthy sales pipeline
International development progressed
16

H1 09 Financial Highlights
Six months ended 30 June 2009 2008 Change
Revenue £125.2m £113.3m +11%
Profit before tax* £8.5m £9.1m -7%
Underlying profit before tax** £9.3m £9.1m +2%
Earnings per share* 6.7p 7.4p -9%
Dividend per share 1.85p 1.7p +9%
Operating cash flow £12.3m £20.6m
Operating cash conversion 153% 207%
* : Before amortisation of intangibles and financial instrument costs** : Profit before tax* restated before restructuring costs of £0.8m
17
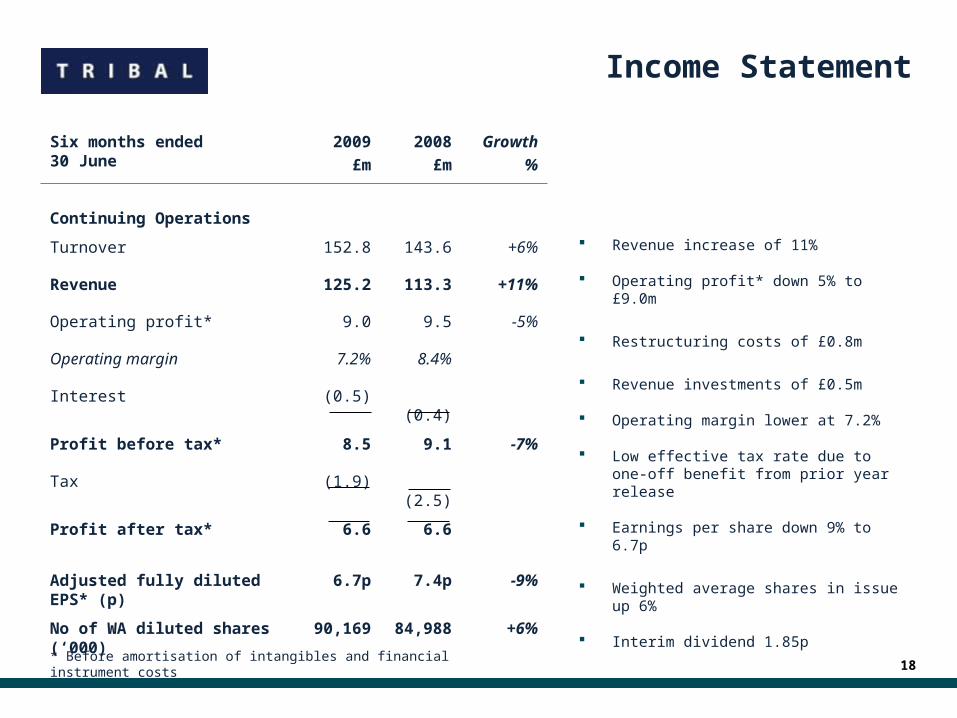
Income Statement
Six months ended 30 June
2009
£m
2008
£m
Growth
%
Continuing Operations
Turnover 152.8 143.6 +6%
Revenue 125.2 113.3 +11%
Operating profit* 9.0 9.5 -5%
Operating margin 7.2% 8.4%
Interest (0.5) (0.4)
Profit before tax* 8.5 9.1 -7%
Tax (1.9) (2.5)
Profit after tax* 6.6 6.6
Adjusted fully diluted EPS* (p) 6.7p 7.4p -9%
No of WA diluted shares (‘000) 90,169 84,988 +6%
Revenue increase of 11%
Operating profit* down 5% to £9.0m
Restructuring costs of £0.8m
Revenue investments of £0.5m
Operating margin lower at 7.2%
Low effective tax rate due to one-off benefit from prior year release
Earnings per share down 9% to 6.7p
Weighted average shares in issue up 6%
Interim dividend 1.85p
18* Before amortisation of intangibles and financial instrument costs
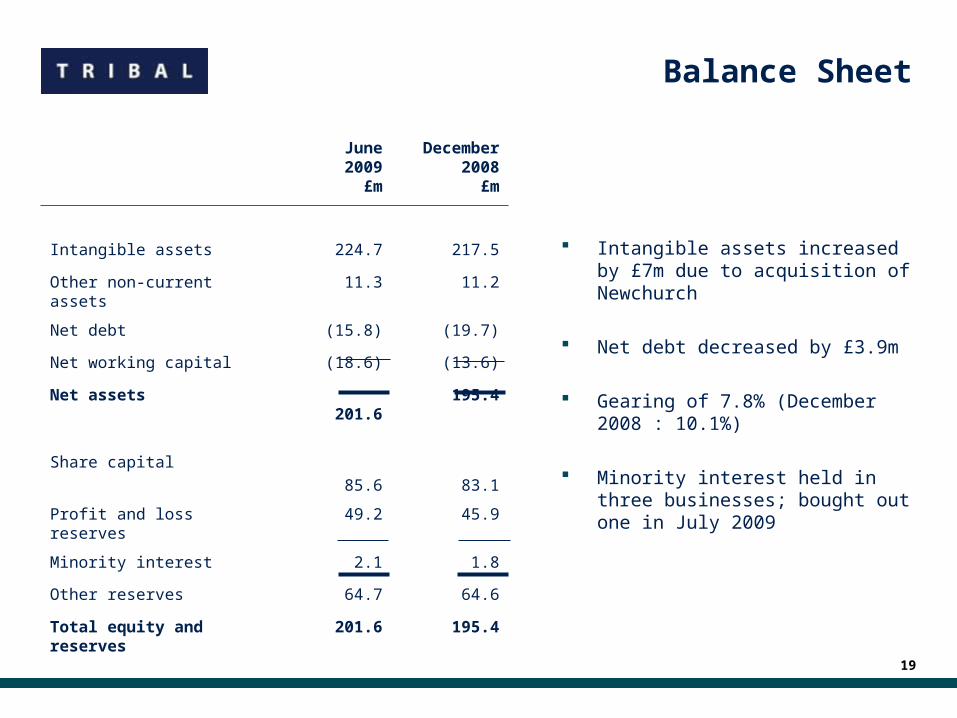
Balance Sheet
June2009
£m
December2008
£m
Intangible assets 224.7 217.5
Other non-current assets 11.3 11.2
Net debt (15.8) (19.7)
Net working capital (18.6) (13.6)
Net assets 201.6 195.4
Share capital 85.6 83.1
Profit and loss reserves 49.2 45.9
Minority interest 2.1 1.8
Other reserves 64.7 64.6
Total equity and reserves 201.6 195.4
Intangible assets increased by £7m due to acquisition of Newchurch
Net debt decreased by £3.9m
Gearing of 7.8% (December 2008 : 10.1%)
Minority interest held in three businesses; bought out one in July 2009
19
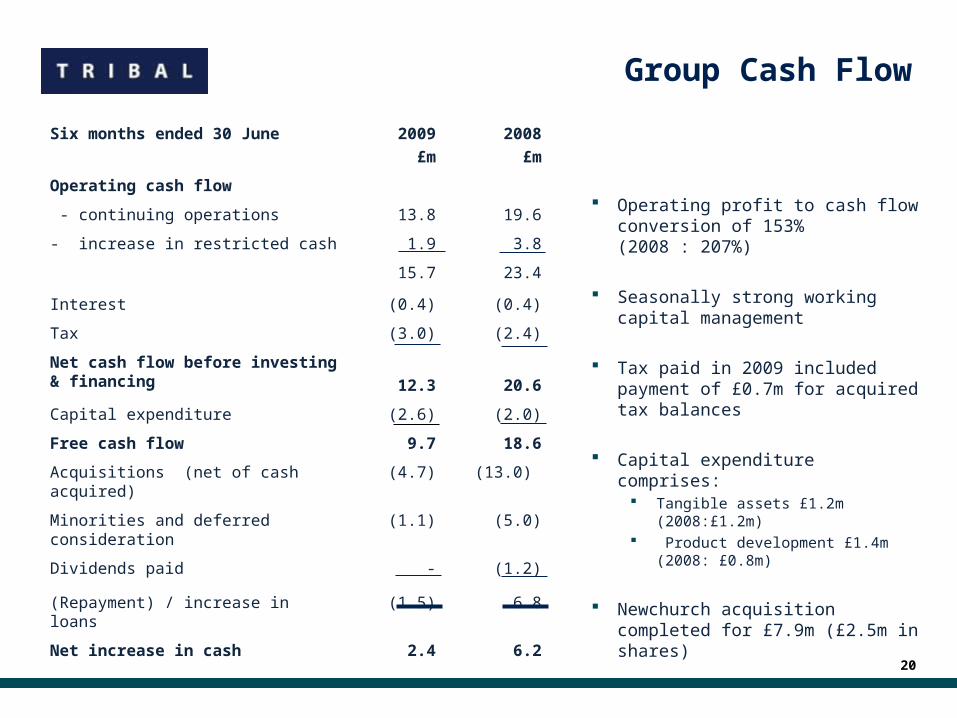
Group Cash Flow
Six months ended 30 June 2009
£m
2008
£m
Operating cash flow
- continuing operations 13.8 19.6
- increase in restricted cash 1.9 3.8
15.7 23.4
Interest (0.4) (0.4)
Tax (3.0) (2.4)
Net cash flow before investing & financing 12.3 20.6
Capital expenditure (2.6) (2.0)
Free cash flow 9.7 18.6
Acquisitions (net of cash acquired) (4.7) (13.0)
Minorities and deferred consideration (1.1) (5.0)
Dividends paid - (1.2)
(Repayment) / increase in loans (1.5) 6.8
Net increase in cash 2.4 6.2
Operating profit to cash flow conversion of 153% (2008 : 207%)
Seasonally strong working capital management
Tax paid in 2009 included payment of £0.7m for acquired tax balances
Capital expenditure comprises: Tangible assets £1.2m (2008:£1.2m) Product development £1.4m (2008:
£0.8m)
Newchurch acquisition completed for £7.9m (£2.5m in shares)
20
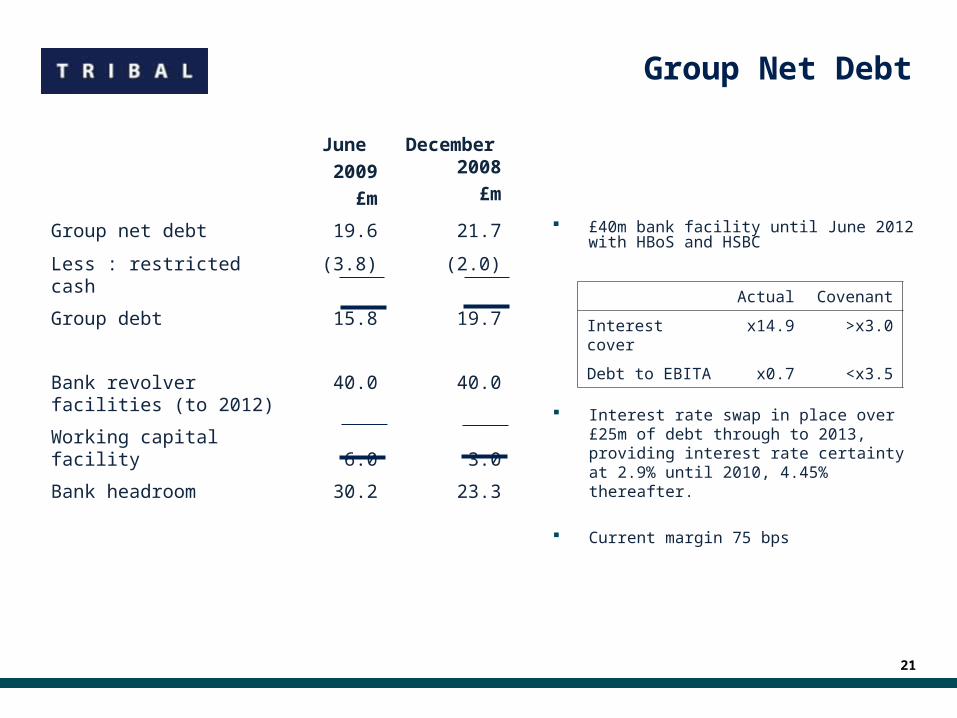
£40m bank facility until June 2012 with HBoS and HSBC
Actual Covenant
Interest cover x14.9 >x3.0
Debt to EBITA x0.7 <x3.5
21
Group Net Debt
June
2009
£m
December2008
£m
Group net debt 19.6 21.7
Less : restricted cash (3.8) (2.0)
Group debt 15.8 19.7
Bank revolver facilities (to 2012)
40.0 40.0
Working capital facility 6.0 3.0
Bank headroom 30.2 23.3
Interest rate swap in place over £25m of debt through to 2013, providing interest rate certainty at 2.9% until 2010, 4.45% thereafter.
Current margin 75 bps

Tribal Group plc
This presentation is intended only as a summary of certain information already announced or published by Tribal Group plc ("Tribal"), and accordingly reference should be made to the relevant announcement/publication and not to this presentation. Tribal, its directors, employees, agents or advisers do not accept or assume responsibility to any person to whom this presentation is shown or into whose hands it may come and any such responsibility or liability is expressly disclaimed. This presentation may contain forward-looking statements. Any forward-looking statement has been made by Tribal in good faith based on the information available up to the time of approval of this presentation and should be treated with caution due to the inherent uncertainties, including economic, business and political risk factors, underlying such forward-looking information. To the extent that this presentation contains any statement dealing with any time after the date of its preparation, such statement is merely predictive and speculative as it relates to events and circumstances which are yet to occur and therefore the facts stated and views expressed may change. Tribal undertakes no obligation to update these forward-looking statements.
![Chapter 1 DP Title 1 · Web view[insert a–g stability class] stability class ground-level temperature inversion, [insert degrees] degree wind direction standard deviation, and [insert](https://img.dokumen.tips/doc/110x75/5aa7f88b7f8b9a424f8cf63f/chapter-1-dp-title-1-viewinsert-ag-stability-class-stability-class-ground-level.jpg)


![COURSE DOCUMENT COMPUTER SCIENCE...[Course Title] [Level X] Page 2 of 22 Version [insert version number] Accredited for use from [insert date] COMPUTER SCIENCE [INSERT COURSE CODE](https://img.dokumen.tips/doc/110x75/600227659633fb3fd076423a/course-document-computer-science-course-title-level-x-page-2-of-22-version.jpg)

![California Department of Transportation | Caltrans - I ... · Web viewVISUAL IMPACT ASSESSMENT [Insert Project Name (for Moderate Level VIA)] [Insert Date] California Department of](https://img.dokumen.tips/doc/110x75/60412a29bbf81012d4232760/california-department-of-transportation-caltrans-i-web-view-visual-impact.jpg)


![I. PURPOSE OF STUDY - Caltrans - California … · Web viewVISUAL IMPACT ASSESSMENT [Insert Project Name (for Moderate Level VIA)] [Insert Date] California Department of Transportation](https://img.dokumen.tips/doc/110x75/5b1d8a627f8b9ab06b8bbaaf/i-purpose-of-study-caltrans-california-web-viewvisual-impact-assessment.jpg)