Embed Size (px)
Citation preview

mMAPS 2.3 User Guide
mMAPS
Table Of Content
1. Introduction to mMAPs ................................ ................................ .............................. 3
. 2 mMAPS Base………………………………………………………………………………………………………… . 5
3. Mapping - m MAPS Features ................................ ................................ ....................... 6
4. Styles & Symbols get Easier. ................................ ................................ ....................... 7
5. GUI Conventions ................................ ................................ ................................ ......... 8
6. Working with mMAPs ................................ ................................ .............................. 11
6.1 mMAPS at a glance ................................ ................................ ................................ 11
6.2 Opening a Map file ................................ ................................ ................................ . 12
Site Creation 6.3 ................................ ................................ ................................ ........... 13
6.3.1 : Create site data from excel/csv/.txt - ................................ ............................. 13
6.4 Export Point Data ................................ ................................ .............................. 14
7. Working with Layers ................................ ................................ ................................ 20
7.1 Managing Layers in mMAPs ................................ ................................ ................... 20
User Guide

mMAPS 2.3 User Guide
1
7.2 GUI in TOC Window ............................................................................................... 21
7.3 Working with layers in TOC window....................................................................... 22
7.4 Search a Location .....................................................................................................23
7.5 Reordering Layers.....................................................................................................24
7.5.1 Resizing Labels..................................................................................................24
7.5.2 Getting Layer Information............................................................................... 25
8. Grid............................................................................................................................... 27
9. Calculate Distance and Area......................................................................................... 29
10. Thematic...................................................................................................................... 31
10.1 Create Thematic..................................................................................................... 31
10.2 Save Thematic ....................................................................................................... 34
10.3 Load Thematic ...................................................................................................... 35
11. Cell Search .................................................................................................................. 36
12. Neighbors Audit .......................................................................................................... 38
Neighbors Addition and Deletion................................................................................. 41
13. Drive Length Calculation.............................................................................................. 45
14. Query........................................................................................................................... 46
15. Layer Offset................................................................................................................. 48
16. Google View................................................................................................................ 49
17. Merging of two layers................................................................................................. 50
18. Characteristics of Selection ........................................................................................ 52
19. Start Editing............................................................................................................... 54

mMAPS 2.3 User Guide
2
19.1 Editing of the Layer:-........................................................................................ 54 19.2 Editing of the Layer from Attributes:- ............................................................. 55
19.3 Editing of the export layer:- .............................................................................56
20. Distance Matrix.......................................................................................................58
21. MapProperties........................................................................................................60
22. Default Layer...........................................................................................................62
23. KML Converter........................................................................................................ 67
24. Transmission Link ................................................................................................... 69
25. Super Polygon .........................................................................................................75
26. Ring buffer………………………………………………………………………………………………………....78
27. Voronoi…………………………………………………………………………………………………………......80
28. Spatial Query...........................................................................................................82
29. Prediction File Analysis............................................................................................84
30. Plugin.......................................................................................................................86
31. Coverage Analysis....................................................................................................88
32. KPI Analysis..............................................................................................................89
33. CM Validation (Clash Report)...................................................................................91
34. Histogram.................................................................................................................93
35. CPICH Power Distribution.........................................................................................93
36. Site Sharing...............................................................................................................94
37. Geo Coding................................................................................................................95
38. Feedback....................................................................................................................96

mMAPS 2.3 User Guide
3
1 Introduction to mMAPS mMAPS helps the telecom business by its efficiency contributing to perform better both
technically and financially. It was developed to be independent from the mobile telecomm
vendors therefore it may be used during the post processing by the vendors and the mobile operators, too.
SYSTEM REQUIREMENTS:
OS Windows XP Professional/Window 7/Window8 or Higher
PROCESSOR Pentium IV or Higher
MEMORY 1 GB or Higher
HARD DISK 40 GB or Higher
SOFTWARE .Net Framework v4.0 & Visual FoxPro
With mMAPS, you get the complete range of computer mapping at your disposal. You can
display your Geo reference data as points, lines, polygons etc. You can also make thematic
and run queries on the working data. mMAPS makes you visualize the distance between
various sites and even in case of co-located sites of different technologies; it can show you
the sites with different shapes and sizes. With mMAPS you can visualize all your digital data and have everything at your fingertips. You can use any map available from mMAPS
like street / highway maps to world maps. You can also create your own maps .After you’ve
organized your data visually, you’ll save the results to files, or send them to any of the
dozens of printers and plotters through mMAPS.
Today, we deal with huge quantities of information Site data, physical data, distances and
various other physical attributes. mMAPS helps you store all this information digitally and makes it visible on your computer screen at the click of a finger.
mMAPS 2.3 User Guide
4
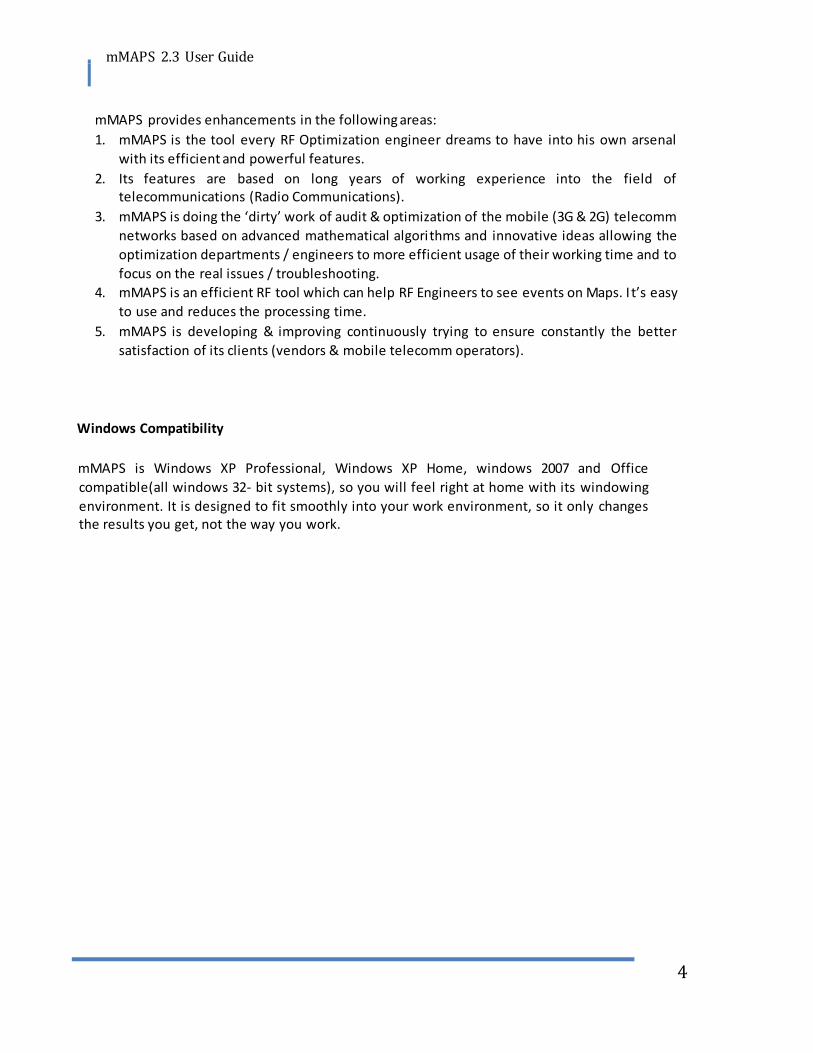
mMAPS provides enhancements in the following areas:
1. mMAPS is the tool every RF Optimization engineer dreams to have into his own arsenal
with its efficient and powerful features.
2. Its features are based on long years of working experience into the field of telecommunications (Radio Communications).
3. mMAPS is doing the ‘dirty’ work of audit & optimization of the mobile (3G & 2G) telecomm
networks based on advanced mathematical algorithms and innovative ideas allowing the
optimization departments / engineers to more efficient usage of their working time and to
focus on the real issues / troubleshooting.
4. mMAPS is an efficient RF tool which can help RF Engineers to see events on Maps. I t’s easy
to use and reduces the processing time.
5. mMAPS is developing & improving continuously trying to ensure constantly the better
satisfaction of its clients (vendors & mobile telecomm operators).
Windows Compatibility
mMAPS is Windows XP Professional, Windows XP Home, windows 2007 and Office
compatible(all windows 32- bit systems), so you will feel right at home with its windowing
environment. It is designed to fit smoothly into your work environment, so it only changes the results you get, not the way you work.

mMAPS 2.3 User Guide
5
2 mMAPS Base:
• Map Server 1.0 - Map Server is an open source development environment for building spatially enabled internet applications. It can run as a (CGI) program or via
MapScript which supports several programming languages.
• Visual studio 2010 - Microsoft Visual Studio is an integrated development
environment (IDE) from Microsoft. It is used to develop computer programs for Microsoft Windows, as well as web sites, web applications and web services. Visual
Studio uses Microsoft software development platforms such as Windows API,
Windows Forms, Windows Presentation Foundation, Windows Store and Microsoft
Silverlight. It can produce both native code and managed code.

mMAPS 2.3 User Guide
6
3 Mapping - mMAPS Features We have made several important changes to simplify your work and enhance the look of your
maps:
value.
We are using visual elements of mMAPS to make the application more visually appealing and
consistent with other Windows XP products. If you use mMAPS on Windows classic or with
Window 7, and you have set your current display theme to Windows classic (in the Themes
or Appearance tabs) or window 7 (in the Window Color and Appearance folder) you may
notice that the dialog box elements display differently as shown in figure above.
Due to this variation there is no change in the product functionality, the functionality will be always
same.
Note : - File name should not contain space, special character or start with any numerical

mMAPS 2.3 User Guide
7
4 Styles & Symbols get Easier.
Now day a lot of users are facing lots of problem to share a color or styles or symbols, we have
added reference grids to list boxes in the symbol style, font style, and color to make it easier.
In the latest version of mMAPS a user can change the symbols, change the boundary width, angle
and size color as per desire requirements.
1. Just go to the “Layer Properties” of any layer in the “MAP TOC window”
2. Go to “Styles” in “Layer Properties”.
3. Select the desired “symbol” or “color”.
mMAPS 2.3 User Guide
8
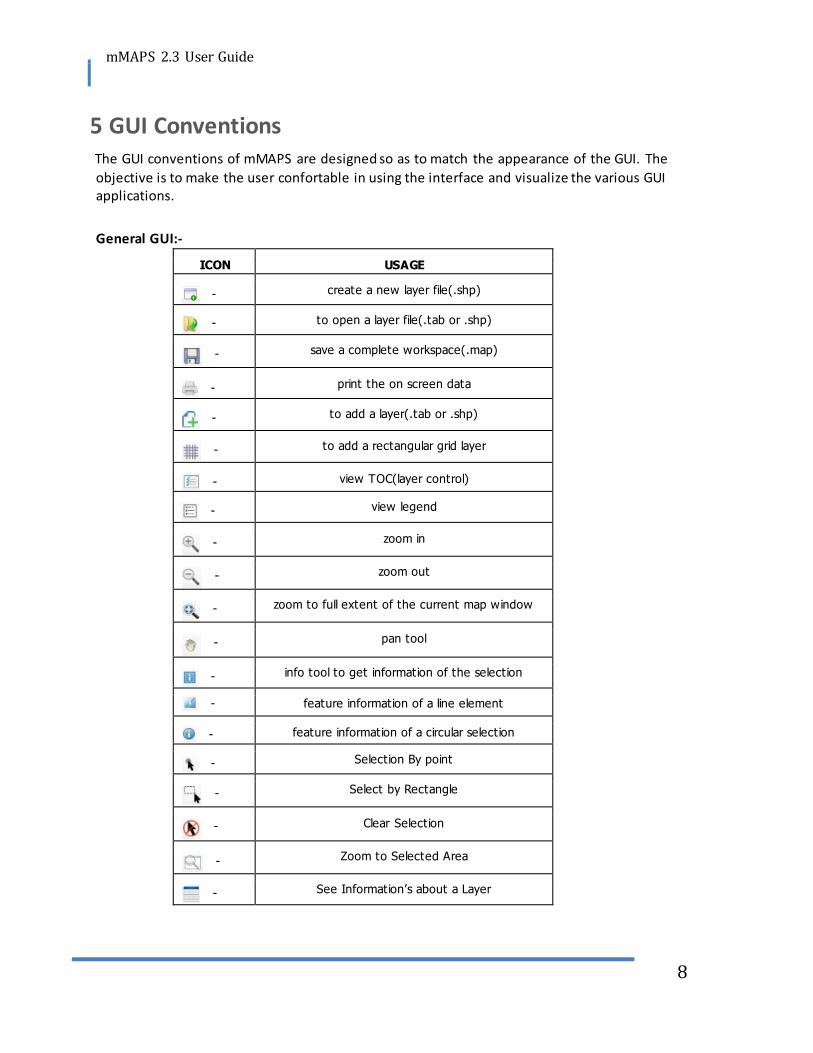
5 GUI Conventions The GUI conventions of mMAPS are designed so as to match the appearance of the GUI. The
objective is to make the user confortable in using the interface and visualize the various GUI applications.
General GUI:-
ICON USAGE
- create a new layer file(.shp)
- to open a layer file(.tab or .shp)
- save a complete workspace(.map)
- print the on screen data
- to add a layer(.tab or .shp)
- to add a rectangular grid layer
- view TOC(layer control)
- view legend
- zoom in
- zoom out
- zoom to full extent of the current map window
- pan tool
- info tool to get information of the selection
- feature information of a line element
- feature information of a circular selection
- Selection By point
- Select by Rectangle
- Clear Selection
- Zoom to Selected Area
- See Information’s about a Layer

mMAPS 2.3 User Guide
9
To Merge two layers
- Represents Thematic Settings
- Get drive length of Particular Layer
- measure distance and area
- Start Editing a layer
- Stop Editing a layer
GUI for editing:-
ICON USAGE
- To Add new feature/symbol
- To draw circles
- To draw new lines
- To draw rectangles for polygon layer
- To draw new polygons
- Combine and rotate
- To modify/edit the shapes Polygons
- Save polygon after editing
More GUI convention:-
ICON USAGE
-
Cell(BCCH, SC & BSIC) search
-
To search for pervious BCCH
-
To search for next BCCH
-
Visualize Table 232 for GSM network
-
To add a default layer for editing
-
Import neighbor

mMAPS 2.3 User Guide
10
-
To visualize the neighbor data
-
To Add Neighbor
-
To Delete Neighbor
-
Selected Cell Neighbor Export
-
All Cell Neighbor Export
-
Logs of all editing done in the project
-
To display Google maps
-
Import/Create Transmission Link from Excel
-
Add new Link
-
Delete Exist new Link
Export Link Data
Apply legend on Transmission Link

mMAPS 2.3 User Guide
11
6 Working with mMAPS
6.1 mMAPS at a glance

mMAPS 2.3 User Guide
12
6.2 Opening a Map file
To open a workspace:
1. Select File > Open Map. The Open dialog box is displayed.
2. Select Map file (*.map) from the drop-down list.
3. Specify the name, directory and drive for the workspace you want to open.
4. Click OK.
Any previously opened tables and windows will be left untouched when you open a map.
When you exit mMAPS, the mMap map (.map ) stores the last session when you intensely save the map;
.
To open a map:
1. Choose File > Open map. The Open dialog box displays.
2. Choose map (*.map) from the Files of type drop-down list.
3. Specify the name, directory and drive for the workspace you want to open.
4. Click OK.
How Renaming Tables Affects map.
When you change the name of a table listed in a map, you invalidate the workspace. Table names are stored in the workspace file, so if you change the name of the table, the workspace
cannot find it.
For example, you created a map called CUSTOMER MAP that contains the table ROAD. If you
later rename the ROAD table to DELHI, mMAPS will not be able to open the ROAD.MAP map.
It will try to open the ROAD table and not be able to locate it.
To work with the data in your database, you open the file or table that contains the data.

mMAPS 2.3 User Guide
13
6.3 Site Creation
mMAPS support excels, comma-separated values and tab delimited files to import site
data to the map. In the import option we have two types format to import site data, Import
Point Data and Import Point Data from Excel.
Import Point Data support comma-separates values and tab delimited format and import point
data from excel support only excel file.
6.3.1 Create site data from excel/csv/.txt:-
1-Point Data:
1. Click on File in main menu.
2. Move cursor on Import and select the option Import Point Data from Excel (This option will be used only for excel file format for rest two select Import Point Data).
3. Window named Import Point Data from Excel will appear (as shown in figure).
4. Browse the path of the excel file and load the file.
5. Click on Set Decimal, a window appear ‘Decimal Value’ in which every field except Lat,
Long field of your excel file will mention in the FieldName column with the default value
‘0’ in column DecimalPlace. Lat, Long field have a default value ’10’ in column
DecimalPlace.
This value represents the decimal place of the number. Give value of 5(or any up to your
requirement) to Latitude and Longitude and other (if you have any field in float).
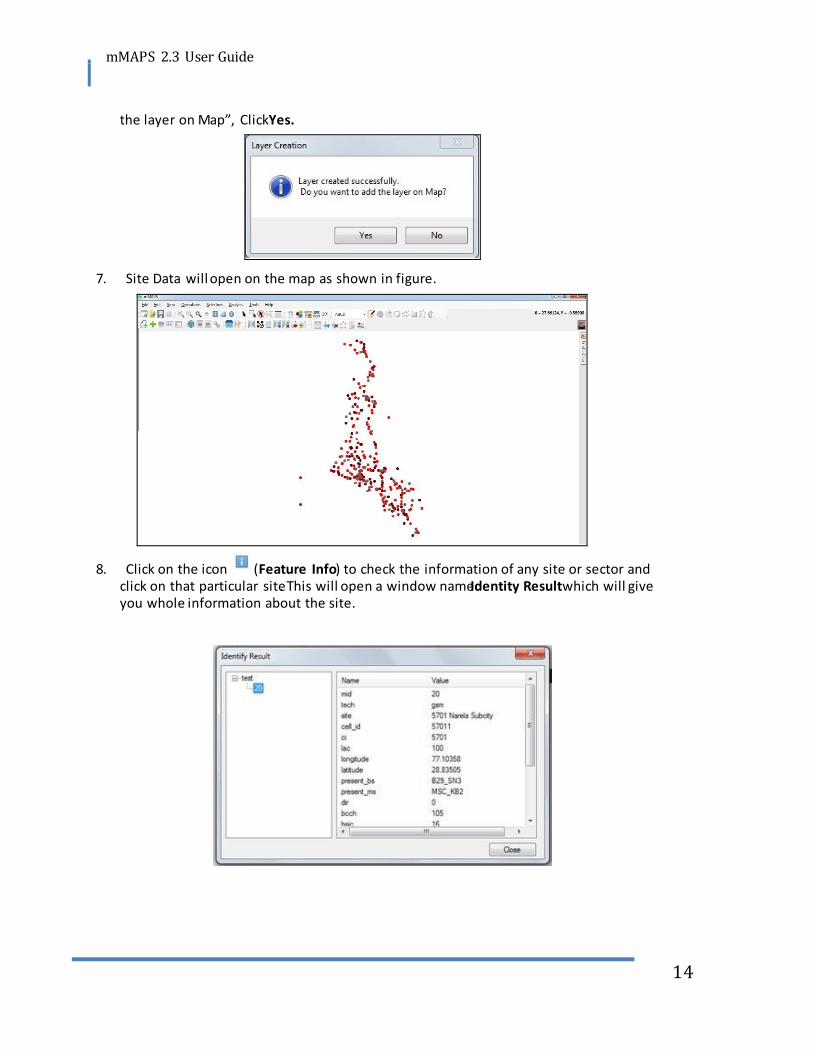
6. Then click on Load, a message appear “Layer created successfully. Do you want to add
For non - Directional Data
For Decimal Value
mMAPS 2.3 User Guide
14
you whole information about the site.
the layer on Map”, Click Yes.
7. Site Data will open on the map as shown in figure.
8. Click on the icon ( Feature Info ) to check the information of any site or sector and click on that particular site . This will open a window name Identity Result which will give
mMAPS 2.3 User Guide
15
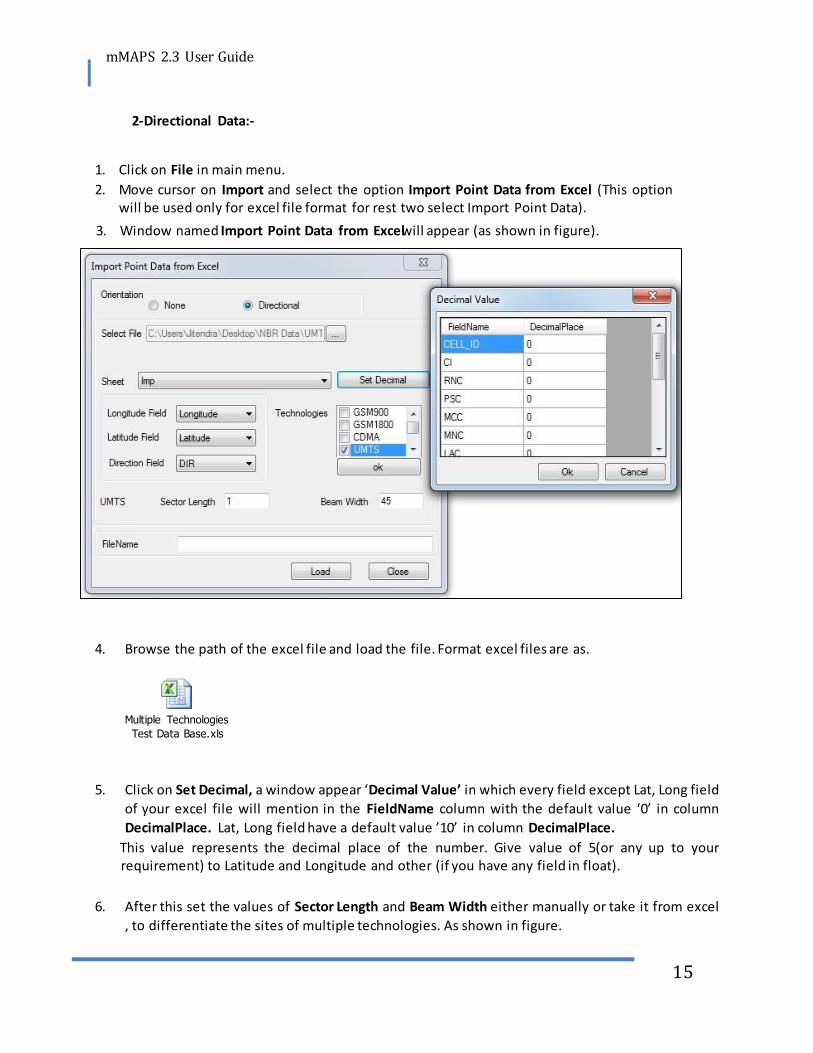
2-Directional Data:-
1. Click on File in main menu.
2. Move cursor on Import and select the option Import Point Data from Excel (This option will be used only for excel file format for rest two select Import Point Data).
4. Browse the path of the excel file and load the file. Format excel files are as.
Multiple Technologies
Test Data Base.xls
5. Click on Set Decimal, a window appear ‘Decimal Value’ in which every field except Lat, Long field
of your excel file will mention in the FieldName column with the default value ‘0’ in column
DecimalPlace. Lat, Long field have a default value ’10’ in column DecimalPlace.
This value represents the decimal place of the number. Give value of 5(or any up to your requirement) to Latitude and Longitude and other (if you have any field in float).
6. After this set the values of Sector Length and Beam Width either manually or take it from excel
, to differentiate the sites of multiple technologies. As shown in figure.
3. Window named Import Point Data from Excel will appear (as shown in figure).

mMAPS 2.3 User Guide
16
7. Then click on Load, a message appear “Layer created successfully. Do you want to add the layer
on Map”, Click Yes.
8. Site Data will open on the map as shown in figure.

mMAPS 2.3 User Guide
17
give you whole information about the sector.
Single Technology Presantation on Maps: -
Multiple Tec hnology Prese ntation on Map: -
9. Click on the icon ( Feature Info ) to check the information of any site or sector and click on that particular sector. This will open a window name Identity Result which will

mMAPS 2.3 User Guide
18
6.4 Export Point Data mMAPS can also have export option which helps to export the point data form the map and save it to the excel and comma-separated values file. It will help to fetch the data from
shape file or tab file from the map in excel and comma-separated values (.csv) format.
Steps to export point data in excel file:-
a. Go to View on the main menu, open TOC.
d. Move the cursor to the Option, on extreme down right of layer attribute window.
e. Click on Options, and select from the drop down.
f. From this drop down window as shown in above figure, select the format in which file is needed (as in figure Export to XLS is selected).
g. Give path to save the exported file, and click Save.
b. Select the point layer whose export is needed.
c. Click on the icon to open attribute table of that layer.

mMAPS 2.3 User Guide
19
h. Once file is saved a message will appear “Excel File exported successfully”.

mMAPS 2.3 User Guide
20
7 Working with Layers
In mMAPS, each table is displayed as a separate layer. Each layer contains the attribute info
for the map objects, such as regions, points, lines etc.
Once you have created your layer, you can add data to the layers edit data or reorder the layer display.
7.1 Managing Layers in mMAPS
The key to control your map layer is the TOC window. It shows all the layers contained in
the current Map file in the order of display and their attributes. These attributes can be viewed on the map using labels. The icons above each check box column represent the
attributes.
It is easy to change a layer’s, or multiple layers’, attributes using the check boxes.
You also have options available to change the Display and Label settings just by double clicking
the layer.
You can also modify thematic maps and reorder, add, or remove layers.
To Open a TOC (which will open a table of all layers you have in your map):-
1. From View of main menu, open TOC or press Ctrl+T.
2. This will open a window Map Toc, in this window you will able to see the list of layer
present on the map.
3. In TOC you can move your layer up and down by using move a layer UP and move a layer DOWN
4. Visibility of the layer can also be select by clicking on the check box in the second column
(Name Visible) of the TOC.

mMAPS 2.3 User Guide
21
5. For display the labels of the layer click on the check box in the third column (Name Label)
of the TOC.
6. Display properties of the site symbol can be modified from the Layer Properties option, to
open layer properties click on the icon .
7. Rests of the option available in the TOC are mention in the next topic GUI in TOC
7.2 GUI in TOC Window
ICON USAGE
-
Add a layer
- Refresh the map window
-
Zoom to a particular layer
Label properties
-
Open attributes
-
Layer properties
Window .

mMAPS 2.3 User Guide
22
-
Delete a layer
- Move a layer UP
- Move a layer DOWN
- Set transparency of raster image
7.3 Working with layers in TOC window
To access the Layer Control dialog box:
1. In the Map window, do one of the following:
• On the Map menu go to “View” and Click “TOC”
• Click the Layer whom you want visible.
• If you want labeling of layer click on label, if you wish to change label properties click .
• To change the properties of layer, click and change the properties.
• To delete any layer click .
• To add any new layer in TOC window , click .
• To refresh TOC window click .
• To scroll up and down the layers in TOC window click .
When you create a thematic in mMAPS, the thematic shading is added to your map as a separate layer. It is drawn on top of the layer, from which it gets the raw data. Separating
thematic layers from its base layer provides you with several important options:
• Graduated symbol thematic maps do not require that your base layer contain point objects. Instead, graduated symbol objects are built regardless of the map object type. Therefore, even if
your base layer contains region or line objects, you will still be able to create a graduated symb ols
map.

mMAPS 2.3 User Guide
23
• You can have multiple thematic layers per base layer. In some cases, you do not have to add
another base layer to the map to create another thematic layer.
• You can use Layer Control to turn the display on or off for a given thematic layer. The l ayer it is based on can continue to display.
7.4 Adding a Layer to the Map
You can add a layer to the current Map window at a time or use the multi -select functionality to add multiple layers simultaneously.
7.5 Search a Location
To search a location or for finding any latitude-longitude in the map follows below mention
steps:-
1. Click on the Operation in the main menu.
2. Click on Go to XY (you can also use Ctrl+G to open this feature).
3. A window Go to XY appears as shown in figure, input the latitude and longitude need to search.
4. Click OK, the location will show comes in the center.

mMAPS 2.3 User Guide
24
7.6 Reordering Layers
Map layers display in the order that they are listed in the Layer Control dialog box, with
the bottom layer drawn first and the top layer drawn last. It is important to order your
layers correctly.
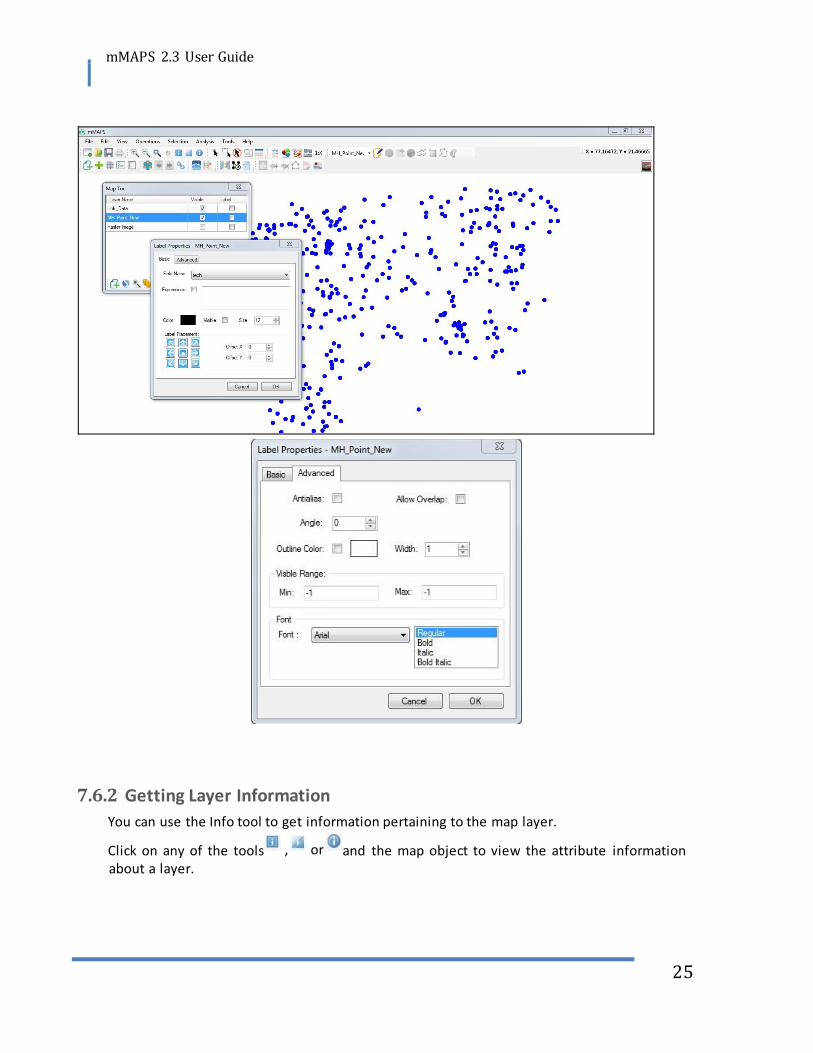
7.6.1 Resizing Labels
You can resize the labels of the various layers using the layer properties interface on the TOC
window.
Here you can resize, change font, change angle of label, allow overlapping text, as well as change
color of the labels.
mMAPS 2.3 User Guide
25
7.6.2 Getting Layer Information
You can use the Info tool to get information pertaining to the map layer.
Click on any of the tools and the map object to view the attribute information about a layer.
, or

mMAPS 2.3 User Guide
26

mMAPS 2.3 User Guide
27
8 Grid
3. Set the range for the Grid measure according to your need and then Click “Make Grid”.
4. Save the Grid at a particular path and then open this Grid from the same as shown
To create rectangle grids follow given steps: -
1. Click on the button “Add Grid Layer”. 2. A window name Frmgridextent will appear.
below.

mMAPS 2.3 User Guide
28
Your grid will look like the below given figure.

mMAPS 2.3 User Guide
29
9 Calculate Distance and Area
1. To calculate distance and area select button from the menu bar.
2. A “Measure” window appears in top with two options, one for “Distance” and second for
“Area”. Make your selection.
3. Then Select the measuring unit in which you want to measure the distance and Area from
the “Display Units” option.
4. Now select the point on map and drag it till the point where you need to measure
distance. This feature will help you to measure the distance between two geospatial
points.
For example you can see the straight line made in the below given figure and the calculated
distance is shown in the “Current Distance” option of the “Measure” window.

mMAPS 2.3 User Guide
30
Similarly using the same feature you can measure the area. Area can be measure by drawing a polygon of any shape for which we needs to calculate the area.
For example you can see the polygon made in the below given figure and the calculated area
shown in the “Total Area” option of the “Measure” window.

mMAPS 2.3 User Guide
31
10 Thematic
10.1 Create Thematic
1. Go to “Analysis” and select “Thematic” or follow short cut key “Ctrl+H” this will leave you on
the window name “Thematic Window”.
2. Select the layer and the fieldname from the drop down.
3. Select the “From” and “To” and set the values for ranges one by one and click “Add”. Similarly
add all the ranges you want.
4. Click on “Stats” to check the Sample Count of each range and click “OK”.

mMAPS 2.3 User Guide
32
Thematic can be created in three ways by Ranges, Custom and Individual.
In the Ranges option you just need to select the attribute and the no. of ranges you in
the Total Ranges box, this will give you auto created ranges according to the values given in your attribute.
In Custom Thematic option is used by classifying the ranges manually by using From and To
option.
In Individual Thematic option user just need to select the attribute from the drop down given in the thematic window and click Classify, this will automatically create the ranges
by taking all the individual value of the attribute in the thematic ranges.
For example you can see in the below given window the ranges in the “Map Legend” window and log file with the different ranges of RSRP in different color.

mMAPS 2.3 User Guide
33

mMAPS 2.3 User Guide
34
10.2 Save Thematic
After create thematic just click at save option for saving of thematic.

mMAPS 2.3 User Guide
35
After that provide the destination path, File name and then save this file.
1. For Load the Thematic file click on Load option then give the path where you have saved
the file and then open this file.
2. Now this file has been loaded.
3. After loading the thematic file click on STATS option for calculate the sample counts and click ok. The loaded thematic will show on your map.
10.3 Load T hematic

mMAPS 2.3 User Guide
36
11 Cell Search
1. Go to “Tools” in the main menu and open cell search or click on button or use short cut
Ctrl+F10.
2. A window appears for Cell Search.
3. Select the site layer from the drop down window.
4. In Field 1 select the BCCH, BSIC or Scrambling Code and provide the value.
5. If you want to search two option in a combination you can select “AND” & “OR” feature
from the drop down provided as operator.
6. It also have next & previous icon to chec k for next BCCH & there interference cells.

mMAPS 2.3 User Guide
37

mMAPS 2.3 User Guide
38
12 Neighbors Audit
1. Click on Tool in main menu.
2. Move cursor on Neighbors and select the option Import Neighbor Data.
3. Window named Import Neighbor Data will appear (as shown in figure).
4. Browse the path of the *.csv and *.txt file and load the file. The format of Neighbor data is shown
in figure:-

mMAPS 2.3 User Guide
39
5. Then click on Create Neighbor, Importing will be started. Do you want to import neighbor on
Map”, Click Ok after complete the processing bar (as shown in figure).
6. Neighbor Data will import on the map.
7. Click on the icon (Show Neighbor) to check the Neighbor of any sector, click on that
particular sector. This will open on a map which will show you whole neighbor of the sector also
shows one way (With red line), Co-Channel (With green line) and ADj-Channel (With yellow line).

mMAPS 2.3 User Guide
40
Multiple Technologies Neighbors Presentation:-
Single Technology Neighbors Presentation: -

mMAPS 2.3 User Guide
41
Neighbors Addition and Deletion
12.1 Neighbor Addition
1. Click on the icon (Add Neighbor) to Add new neighbor.
2. Select any cell (Parent Cell) for which we require to add neighbor by clicking and holding left
key and drag it up to target cell.

mMAPS 2.3 User Guide
42
3. Window named “Add Neighbor” will appear (as shown in figure).
4. Click on Add, a Window will appear named “Add both way or one way”(as shown in figure).
5. After adding neighbor the updated data will automatically save at the location of imported
neighbor data in new text file.

mMAPS 2.3 User Guide
43
12.2 Neighbor Deletion
1. Click on the icon (Delete Neighbor) to delete neighbor.
2. Select any cell (Parent Cell) for which we require to delete neighbor by clicking and
3. Window named “Delete Neighbor” will appear (as shown in figure).
4. Click on Delete, a Window will appear named “Delete both way or one way”(as shown in
figure).
holding left key and drag it up to target cell.

mMAPS 2.3 User Guide
44
5. After delete neighbor the updated data will automatically save at the location of imported
neighbor data in new text file.

mMAPS 2.3 User Guide
45
13 Drive Length Calculation
1. Go to ”Analysis” in the main menu, and click on “Drive Length”
2. A Select Layer window appears, in which select the layer from the drop down whose
distance is to be calculated and Unit in which you want to get the result .
Output window provide the total distance of the selected layer, as shown in given below
figure.
mMAPS 2.3 User Guide
46
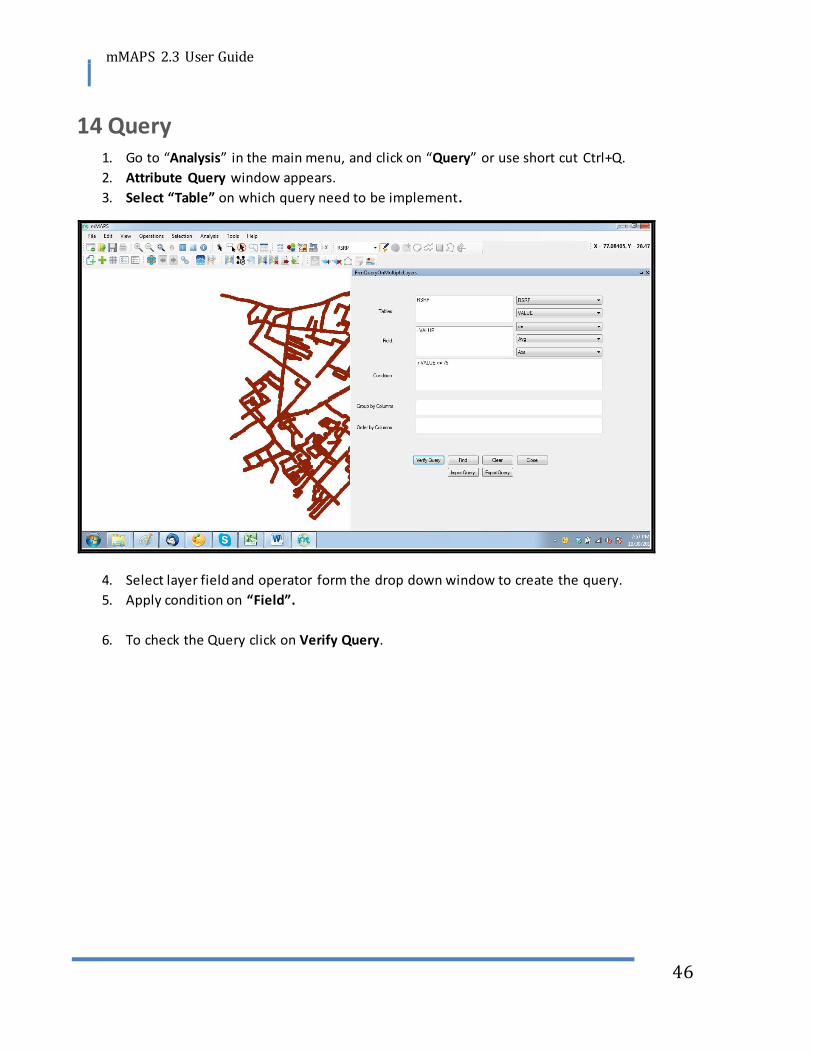
14 Query 1. Go to “Analysis” in the main menu, and click on “Query” or use short cut Ctrl+Q.
2. Attribute Query window appears.
3. Select “Table” on which query need to be implement.
4. Select layer field and operator form the drop down window to create the query.
5. Apply condition on “Field”.
6. To check the Query click on Verify Query.

mMAPS 2.3 User Guide
47
7. Then click on “Find” and go to “options” in the down right of output window and click on “Export
to Layer”.
8. You can also use other options like Export to CSV, Export to xls, and Zoom to selection or search.
Query will be created as a different layer on Map TOC, this can be saved as shape (.shp) file.

mMAPS 2.3 User Guide
48
15 Layer Offset 1. Go to Map TOC select the layer and double click on the layer to open the “Layer
Properties” window.
2. Enter the values of “Offset X” and “Offset Y” you can change the unit of the offset from
the drop down given below in the layer properties.
3. Click “OK”. Output will shift the layer and provide a duplicate layer. This feature will help
you to compare the values of two layers.

mMAPS 2.3 User Guide
49
16 Google View 1. Go to “View” of the main menu and select “Google Map”
3. You can change the “Map Type” by double click on the Google Map Layer on the TOC, which
will take you to the window “Google Map Properties”
2. Figure given below is the snapshot of the Google view.

mMAPS 2.3 User Guide
50
17 Merging of two layers
• A very intelligent feature which is required by most of the technical people is merging of layers. mMAPS launch along with this features , here you will be able to merge two layer of
select layer in Layer1 and Layer 2 to be merged and save the same at any output location
with desired filename.
same type . To do this just Go to “ Operations ” of the main menu and select
“ GeoProcessing ” or icon on .
A Merge layers window will be opened and ask for the layers for merging. We have to

mMAPS 2.3 User Guide
51
• Save the output merged file at any desired location with desired name.
• After editing done go to “ Stop editing ”
• After that finally in Message layer box click “Yes” to load on map and “No” to just save.

mMAPS 2.3 User Guide
52
18 Characteristics of Selection • Selection is a temporary table, when we make point or rectangular selection mMAPS create a table
to selected objects.
• Selecting from the screen: Select selection, point selection, Rectangle Select tool, Radial select,
polygon select.
• When you select map objects in a Selectable layer, mMAPS highlights the objects

mMAPS 2.3 User Guide
53
• To convert selections into permanent tables, on the “menu” click “selection” and after” Save As”.
Once you’ve saved the temporary selection table as a permanent table, you can treat the new
table like any other table. Selection tables are totally dependent on the table from which th ey
were created.
• Using the Point Select Tool
Use the Select tool to select objects one at a time or to select all objects that are
generally in the same area of the Map window. You select an object by clicking it using
the mouse.
• Using the Rectangle select Tool
Use the Rectangle Select tool to select multiple objects at a time or to select all
objects that are generally in the same area of the Map window. You select the area by
dragging over the area or objects using the mouse.
• Using the Clear selection
Use the clear selection to deselect all of the selected objects. You use this most
often when you have selected too many objects and want to start over. To select an object using the Select tool:
- Choose the “clear selection” button from the Main toolbar.
• Using the Zoom to selection
Use the Zoom to selection icon to zoom to the layer/selected area on the extent
on maps. This is also available on the Selection tab in main menu or can be run by using
Ctrl+z.

mMAPS 2.3 User Guide
54
19 Start Editing
Making the Layers “Editable”
To make changes to the layer objects, you must make the layer editable. You can only make
one layer editable at a time.
To make a layer editable, we have provided the START EDITING and STOP EDITING buttons.
We can select the layer we want to edit using the drop down box and then start editing.
We can save the edits or save it as another layer.
19.1 Editing of the Layer:-
To start the editing of any layer, first click on the button (Start Editing) to enable editing
on the layer and follow the below mentioned steps:-
2. Once editing option is enabled, now the required editing of the layer can be done, there are
multiple options available for edit. Suppose site need to be relocated, select the site.
3. Move it to the correct place by select drag and drop.

mMAPS 2.3 User Guide
55
4. When all the editing is done click on the button (Stop Editing) to disable the enable option.
5. After that a window appears that will give message that layer is being edited, and ask to save.
6. Click Save.
19.2 Editing of the Layer from Attributes:-
Please click on button for show attributes. The window will appear with layer attributes. Follow
the below mentioned steps:-
1- Click “Option” button for editing the value. Multiple options available as shown in above
picture.
2- Click “Start Edit Mode”.

mMAPS 2.3 User Guide
56
3- Change the value of data as per your requirement, than click on “Stop Edit Mode” it will ask
to you for saving it, click ok and data will save automatically on MAP.
19.3 Editing of the export layer:-
Please click on button start edit mode for edit. Follow the below mentioned steps: -

mMAPS 2.3 User Guide
57
1- Click “Option” button new feature as shown in above picture and click on map where
you have required adding new route. As shown in below picture some route added at
layer.
2- Click “Stop edit mode” to save added layer.
3- The value of added layer will be change from show attributed option. Description of same
available at 19.2.

mMAPS 2.3 User Guide
58
20 Distance Matrix This tool can be used to calculate the distance from two layers or single layer a selected object
(or group of objects i.e. Layer) to the closest objects of same or different layer within the
defined range or radius.
To perform this task go to Tool > Distance Matrix, below given window will be opened.
• Give the input for Origin Layer which means the layer whose object would be you origin to find
the distance with respective Field.
• Then select the Target Layer, the layer which will be considered as the object to be considered
while calculating the distance from the origins.
• Select Unit for the output of result (distance).
• Then enter range or the radius to specify how far you need to do this calculation.
• Co-located sites: - This option is given to consider the co-located object (object on the same
Latitude-longitude). If you want consider the points on same Latitude-longitude.
• Click Find for results.

mMAPS 2.3 User Guide
59
• To take this export on excel click on “Export to Excel” and save it to the desired location.

mMAPS 2.3 User Guide
60
21 Map Properties
• In the latest version of mMAPS software tool we can view and change the projection of maps along with units.
• For this just go to “View” in the main menu and select “Map Properties”.
• As shown below anyone can also change the units.
A Window will be open in the map screen with the name “ FrmMapProperties”
Now anyone can view and change the projection and units as shown below

mMAPS 2.3 User Guide
61
• Save the output merged file at any desired location with desired name.

mMAPS 2.3 User Guide
62
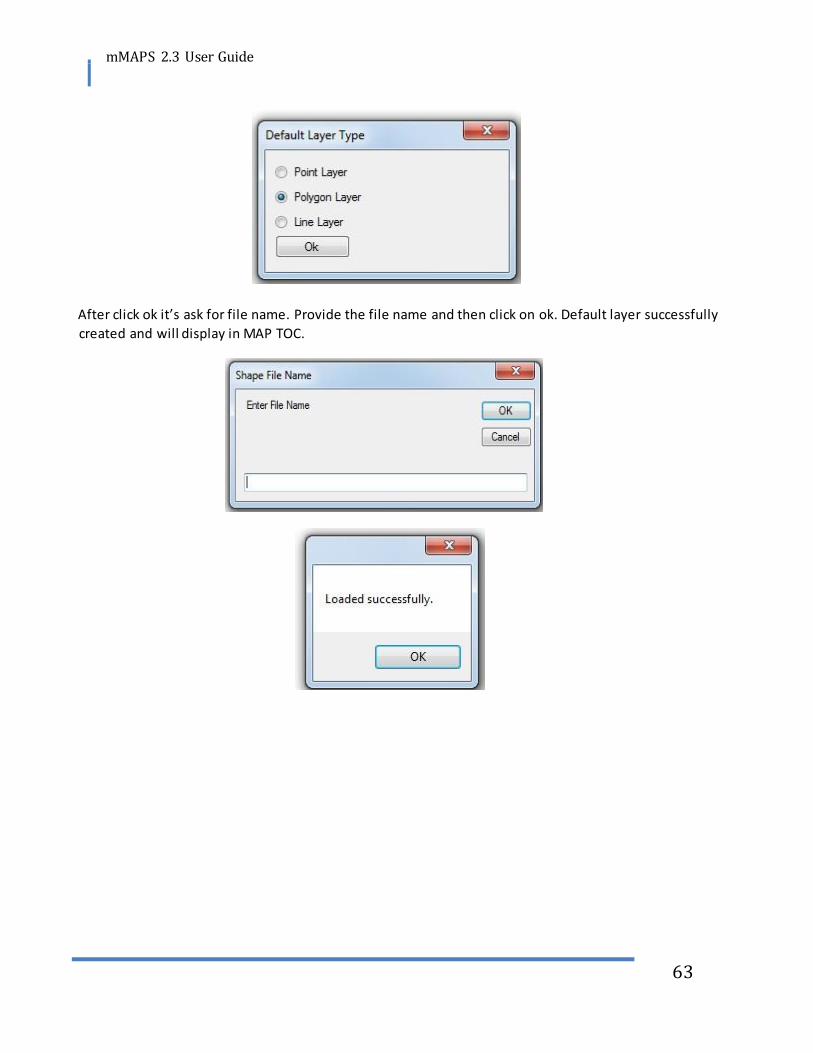
22 Default Layer
Put the number of field/column you have required to add in table and cl ick ok the window will appears.
Put the field name as per your requirement and click ok. A window will appear with multiple layer type, click one of its which you need to create.
For creation of polygon/ line layer/ circle etc. we use default layer.
To create default layer click on this icon a window will appears as shown in figure.
mMAPS 2.3 User Guide
63
After click ok it’s ask for file name. Provide the file name and then click on ok. Default layer successfully
created and will display in MAP TOC.

mMAPS 2.3 User Guide
64
ICON USAGE
- To Add new symbol
- To draw circles
- To draw new lines
- To draw rectangles for polygon layer
- To draw new polygons
Click for polygon creation and start drawing on map a window will appears with asking for
name of fields.Put the name of fields and click ok.
After that click start editing which enable multiple layer

mMAPS 2.3 User Guide
65
We can see its field value by applying labeling on it.
A polygon will create at Map window. To save it click stop editing fetures and it wil l ask
for saving it. After saving it a polygon will create with it assign values on fields.

mMAPS 2.3 User Guide
66
We can also check the value of polygon by clicking at polygon.

mMAPS 2.3 User Guide
67
23 KML Converter
Click to set the label properies of layer. Than click ok. The window will apear as
Open Site Dat a base for which you need to convert KML on MAP.
To create default layer click on this icon a window will appears as shown in figure.
Right Click on Map Go to “MAP TOC” on top

mMAPS 2.3 User Guide
68
Go to Filesave as select Layer change Foramate to .KML and click ok. This
will generate a KML file at your location.
……………………………………………………………….END………………………………………………………………………

mMAPS 2.3 User Guide
69
24 Transmission Link
24.1 Create Link
1. First create point data before creating Transmission link.
2. Go To FileImport Import Point Data from Excel Click Orientation none Import excel data Select Latitude/Longitude field Put name of file than click
ok your data will create at map.
3. Click icon for importing data from .csv file. The mendotory fields of this files
as below,however you can add fore filed as per your requirement.
Link
Name SITE_A Long_A Lat_A SITE_B Long_B Lat_B Modulation Frequency

mMAPS 2.3 User Guide
70
4. After importing the window will appear as below picture. Click load.
5. The link layer will Created at map with label of site link name.
Use icon for thematic at link.
This display also available at Google Map with multiple views.

mMAPS 2.3 User Guide
71
24.2 Add new Link
24.2.1 Click Icon for adding new link.
24.2.2 Select any site (SiteA) for which we require to add link by clicking and holding left key and
drag it up to SiteB (For End). Click add The window will appear as shown in below picture.
mMAPS 2.3 User Guide
72
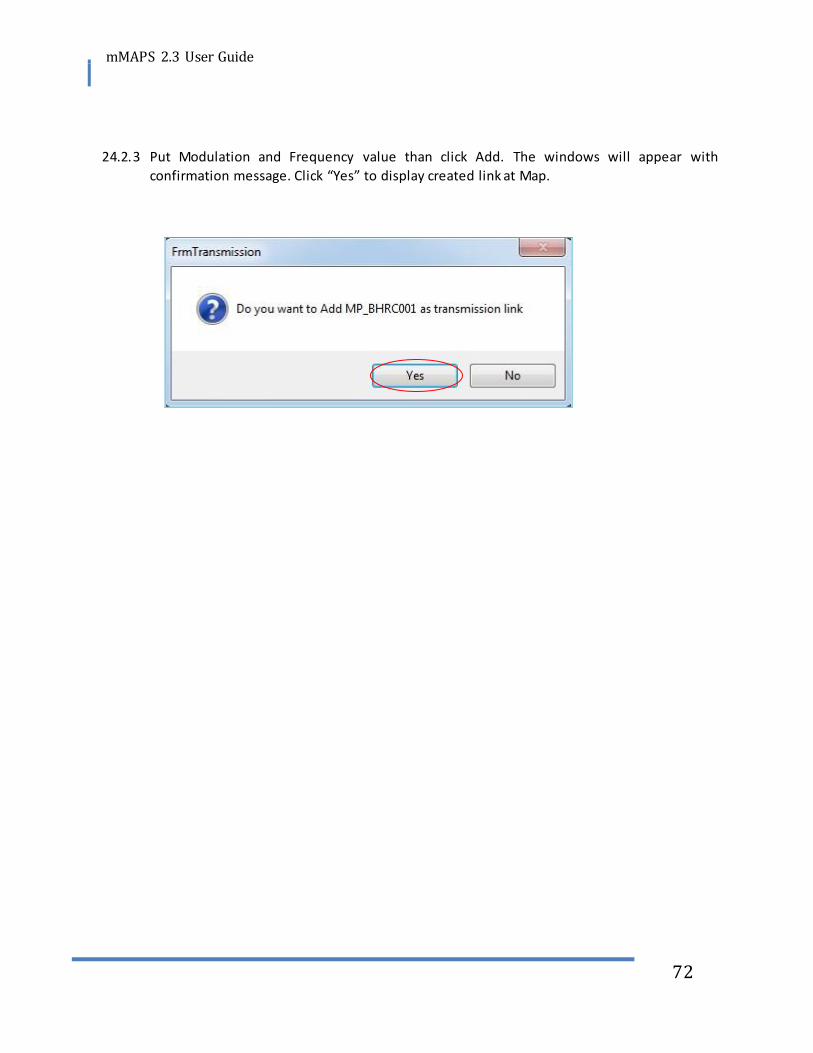
24.2.3 Put Modulation and Frequency value than click Add. The windows will appear with
confirmation message. Click “Yes” to display created link at Map.

mMAPS 2.3 User Guide
73
24.3 Delete Old Link
24.3.1 Click Icon for delete a link.
24.3.2 Select site (SiteA) for which we required to delete link by clicking and drag it up to SiteB (For
End). The window will appear as shown in below picture.
24.3.3 By Clicking Delete link will delete from Map.

mMAPS 2.3 User Guide
74
24.4 Export Transmission Data
After add/Delete you can export your data by clicking icon in .csv format.

mMAPS 2.3 User Guide
75
25 Super Polygon
Open two different polygon layer.
Click selection Boundary OverLay. Window will appear like below

mMAPS 2.3 User Guide
76
Final result for intersection as below.
Click Intersection or Union . Data will save at desired place.

mMAPS 2.3 User Guide
77

mMAPS 2.3 User Guide
78
26 Creating Ring Buffer
Ring Buffer window will appear. Put the desired radius and the Unit of measurement.
For Creating Ring buffer. S elect some sites on which you want to put Ring shown as below.
After that, Go to Analysis , Se lect Ring Buffer.

mMAPS 2.3 User Guide
79
Ring Buffer Created. It will show like this given as below. One can now get the information about the
sites under Ring & also Copy the Ring data to a sheet.

mMAPS 2.3 User Guide
80
27 Voronoi For creating Voronoi, open the sitedata & then Go to Analysis & Select Voronoi.
FrmVoronoi1 window will appear.
• Select the Layer on which you want to put Voronoi.
• Select the field on the basis of which you want Voronoi layer.
After Selecting both the fields. Select OK & then Add the layer on the map.

mMAPS 2.3 User Guide
81
Voronoi layer will look like this as shown below.

mMAPS 2.3 User Guide
82
28 Spatial Query 1. Go to “Analysis” in the main menu, and click on “Spatial Query”.
2. Spatial Query window appears.
3. Select “Table”, put conditions & give Destination table & then select value field on which
query need to be implement.

mMAPS 2.3 User Guide
83
4. After that you will get the output in excel format by clicking on Export.
5. It will calculate area of that boundary.

mMAPS 2.3 User Guide
84
29. Prediction File Area 1. Go to “Analysis” in the main menu, and click on “Spatial Query”.
2. Select “Table”, put conditions & give Destination table & then select value field on which
query need to be implement.

mMAPS 2.3 User Guide
85
3. After that you will get the output in excel format by clicking on Export.
4. Calculate area according to that value for each site within the boundary.

mMAPS 2.3 User Guide
86
30 Plugin (.csv files) 1. Click on Plugin to import .csv files.
2. After importing the .csv logfile select X & Y field, save the file.

mMAPS 2.3 User Guide
87
3. Open the .shp file then it will show you the output as shown in figure.

mMAPS 2.3 User Guide
88
31 Coverage Analysis with Drive Route File This feature is used to calculate “Area” & “number of samples” of CW drive route on a Range basis.
1. Go to “Analysis” in the main menu, and click on “Coverage Analysis”.
2. Coverage Analysis window appears.
3. Select “Layer” on which query need to be implement.
4. After that you will get the output in excel format by clicking on Export.
mMAPS 2.3 User Guide
89
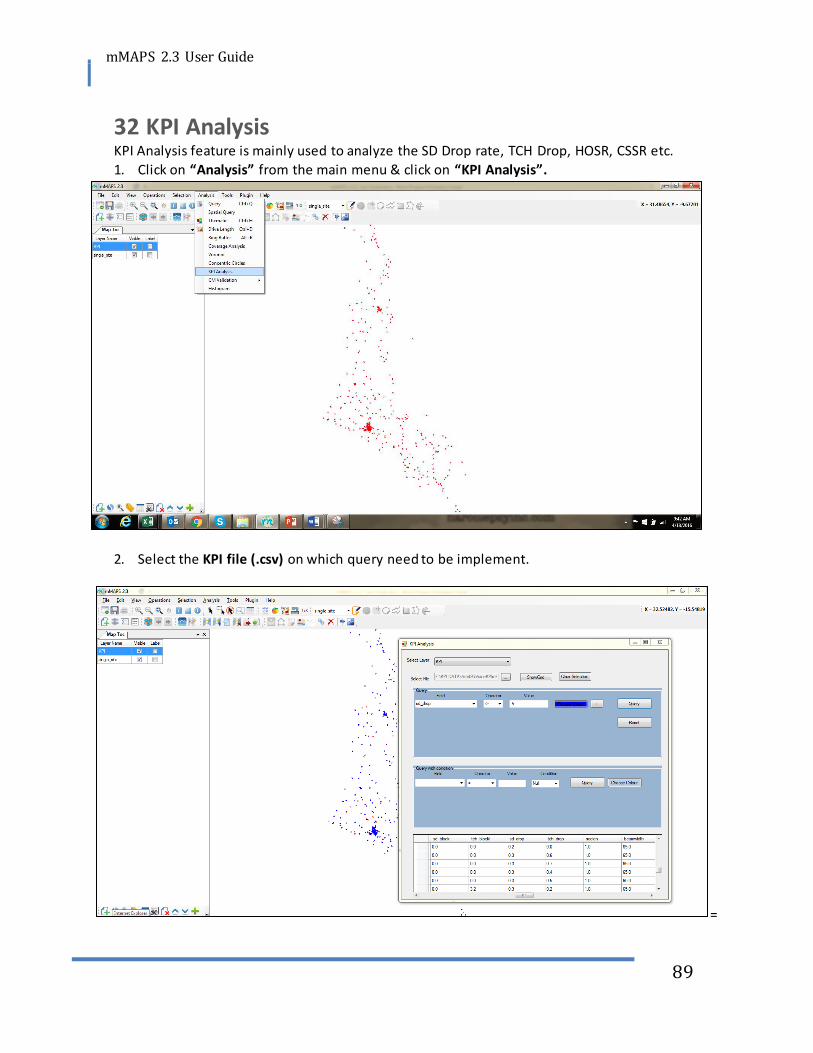
32 KPI Analysis KPI Analysis feature is mainly used to analyze the SD Drop rate, TCH Drop, HOSR, CSSR etc.
1. Click on “Analysis” from the main menu & click on “KPI Analysis”.
2. Select the KPI file (.csv) on which query need to be implement.
=

mMAPS 2.3 User Guide
90
3. Two types of query one is simple Query & other is Query with Condition.
4. On the basis of Query we can display colour on sites.
5. By clicking on show grid, attributes will open & we can export it in excel & .csv file.

mMAPS 2.3 User Guide
91
33 CM Validation ( Clash Report)
This feature supports all the technologies like GSM/UMTS/LTE.7 types of Clash Report are:
1. BCCH Clash Report
2. BCCH-BSIC Clash Report 3. Adjacent Clash Report
4. Scrambling Code Clash Report
5. PCI Clash Report
6. PCI-MOD-3 Clash Report
7. PCI-MOD-30 Clash Report
1. Go to “Analysis” in the main menu, and click on “CM Validation –Clash Report”.
2. A window of Clash Report will appear.

mMAPS 2.3 User Guide
92
3. Select layer & add neighbour file then click on any clash report on the basis of technology. 4. By clicking on show all it shows all the clashing by lines on sites.
5. We can also check the clashing of individual cells by clicking on column of table.
6. Export data in excel format.

mMAPS 2.3 User Guide
93
34 Histogram of BCCH/PSC/PCI 1. Click on “Analysis” from the main menu & click on “Histogram”. 2. After that select the layer & the field based on technology. 3. Graph is generated by clicking on graph.
35 CPICH Power Distribution
1. From the histogram we will get the CPICH Power Distribution Graph.

mMAPS 2.3 User Guide
94
36 Site Sharing
1. Go to “Tools” in the main menu, and click on “Site Sharing”.
2. A window of site sharing will open & then select the tables or fields.
3. A window site sharing will appear & also calculated the distance between source & two targets.
mMAPS 2.3 User Guide
95
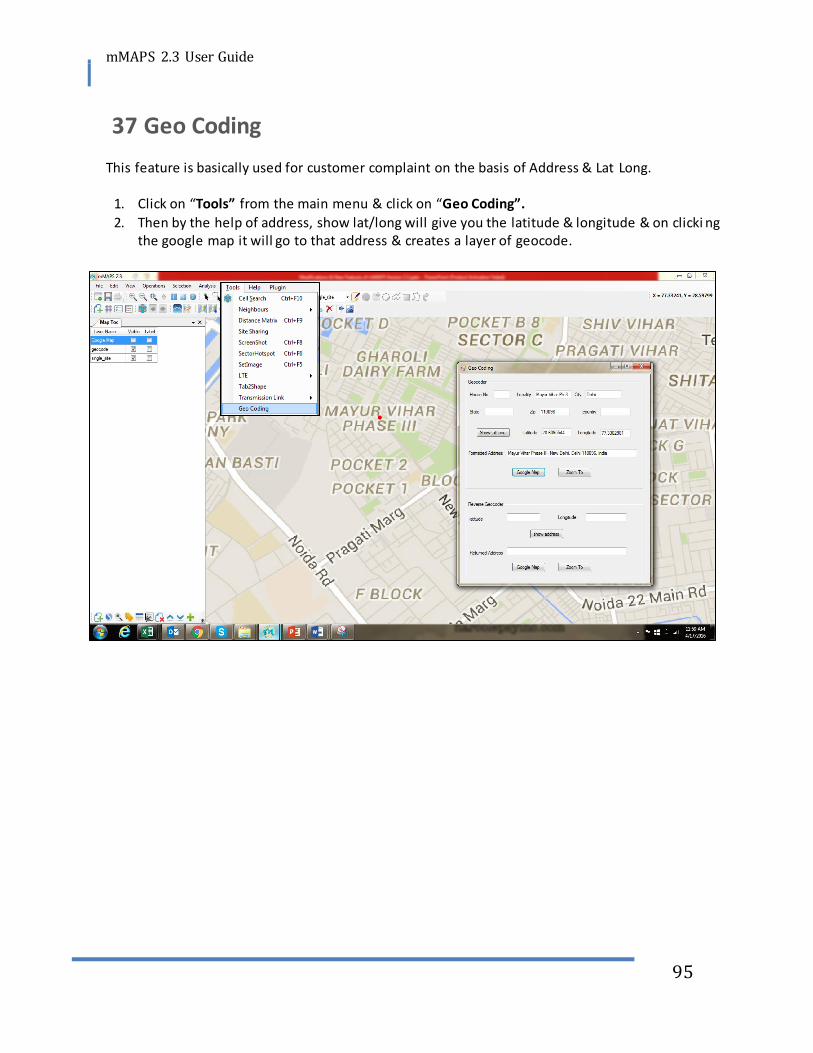
37 Geo Coding
This feature is basically used for customer complaint on the basis of Address & Lat Long.
1. Click on “Tools” from the main menu & click on “Geo Coding”. 2. Then by the help of address, show lat/long will give you the latitude & longitude & on clicki ng
the google map it will go to that address & creates a layer of geocode.
--------------------------------------------------------END------------------------------------------------------------

mMAPS 2.3 User Guide
96
38 Feedback
1. Click on “Help” from the main menu & click on “Feedback”. 2. If you want to share any feedback or snapshot of any error then use this feature by simply
filling all the details like Name, Company Name, Email id etc. 3. It will automatically send to this id ([email protected]).