Embed Size (px)
Citation preview

UNITED STATESSECURITIES AND EXCHANGE COMMISSION
Washington, D.C. 20549_____________________________________________________________
Form 10-K_____________________________________________________________
(Mark One)x ANNUAL REPORT PURSUANT TO SECTION 13 OR 15(d) OF THE SECURITIES EXCHANGE ACT OF 1934 For the fiscal year ended October 31, 2017
oro TRANSITION REPORT PURSUANT TO SECTION 13 OR 15(d) OF THE SECURITIES EXCHANGE ACT OF 1934 For the transition period from to
Commission File Number: 001-36334_____________________________________________________________
Keysight Technologies, Inc.(Exact name of registrant as specified in its charter)
Delaware 46-4254555State or other jurisdiction of
Incorporation or organization I.R.S. Employer
Identification No.Address of principal executive offices: 1400 Fountaingrove Parkway, Santa Rosa, CA 95403
Registrant's telephone number, including area code: (800) 829-4444Securities registered pursuant to Section 12(b) of the Act:
Title of each class Name of each exchange on which registered
Common Stockpar value $0.01 per share
New York Stock Exchange, Inc.
Securities registered pursuant to Section 12(g) of the Act: None_____________________________________________________________
Indicate by check mark if the registrant is a well-known seasoned issuer, as defined in Rule 405 of the Securities Act. Yes xNo o
Indicate by check mark if the registrant is not required to file reports pursuant to Section 13 or Section 15(d) of the Act. Yes oNo x
Indicate by check mark whether the registrant (1) has filed all reports required to be filed by Section 13 or 15(d) of the Securities Exchange Act of 1934 during thepreceding 12 months (or for such shorter period that the registrant was required to file such reports), and (2) has been subject to such filing requirements for the past 90 days.Yes xNo o
Indicate by check mark whether the registrant has submitted electronically and posted on its corporate website, if any, every Interactive Data File required to be submittedand posted pursuant to Rule 405 of Regulation S-T (§232.405 of this chapter) during the preceding 12 months (or for such shorter period that the registrant was required tosubmit and post such files). Yes xNo o
Indicate by check mark if disclosure of delinquent filers pursuant to Item 405 of Regulation S-K (§229.405 of this chapter) is not contained herein, and will not becontained, to the best of registrant's knowledge, in definitive proxy or information statements incorporated by reference in Part III of this Form 10-K or any amendment to thisForm 10-K. o
Indicate by check mark whether the registrant is a large accelerated filer, an accelerated filer, a non-accelerated filer, or a smaller reporting company. See the definitions of"large accelerated filer," "accelerated filer," "smaller reporting company," and "emerging growth company" in Rule 12b-2 of the Exchange Act.
Large accelerated filer x Accelerated filer o
Non-accelerated filer o
Smaller reporting company o
Emerging growth company o (do not check if a smaller reporting company)
If an emerging growth company, indicate by check mark if the registrant has elected not to use the extended transition period for complying with any new or revisedfinancial accounting standards provided pursuant to Section 13(a) of the Exchange Act. o
Indicate by check mark whether the registrant is a shell company (as defined in Rule 12b-2 of the Exchange Act). Yes oNo x
The aggregate market value of common equity held by non-affiliates as of April 30, 2017 was approximately $5 billion, based upon the closing price of the Registrant'scommon stock as quoted on New York Stock Exchange on such date. Shares of stock held by officers, directors and 5 percent or more stockholders have been excluded in thatsuch persons may be deemed to be affiliates. This determination of affiliate status is not necessarily a conclusive determination for other purposes.
As of December 15, 2017, there were 187,284,245 shares of our common stock outstanding._____________________________________________________________

DOCUMENTS INCORPORATED BY REFERENCE
Document Description 10-K Part Portions of the Proxy Statement for the Annual Meeting of Stockholders (the "Proxy Statement") to be held on March 22, 2018 and to be filed pursuant toRegulation 14A within 120 days after registrant's fiscal year ended October 31, 2017 are incorporated by reference into Part III of this Report.
III

Table of Contents
TABLE OF CONTENTS
PageForward-Looking Statements 3
PART I Item 1 Business 3Item 1A Risk Factors 18Item 1B Unresolved Staff Comments 30Item 2 Properties 30Item 3 Legal Proceedings 30Item 4 Mine Safety Disclosures 30
PART II Item 5 Market for the Registrant's Common Equity, Related Stockholder Matters and Issuer Purchases of Equity Securities 31Item 6 Selected Financial Data 32Item 7 Management's Discussion and Analysis of Financial Condition and Results of Operations 33Item 7A Quantitative and Qualitative Disclosures About Market Risk 51Item 8 Financial Statements and Supplementary Data 52Item 9 Changes in and Disagreements with Accountants on Accounting and Financial Disclosure 104Item 9A Controls and Procedures 104Item 9B Other Information 104
PART III Item 10 Directors, Executive Officers and Corporate Governance 104Item 11 Executive Compensation 105Item 12 Security Ownership of Certain Beneficial Owners and Management and Related Stockholder Matters 105Item 13 Certain Relationships and Related Transactions, and Director Independence 106Item 14 Principal Accounting Fees and Services 106
PART IV Item 15 Exhibits, Financial Statement Schedules 106
2

Table of Contents
Forward-Looking Statements
This report contains forward-looking statements including, without limitation, statements regarding trends, seasonality, cyclicality and growth in, and driversof, the markets we sell into, our strategic direction, our future effective tax rate and tax valuation allowance, earnings from our foreign subsidiaries, remediationactivities, new product and service introductions, the ability of our products to meet market needs, changes to our manufacturing processes, the use of contractmanufacturers, the impact of local government regulations on our ability to pay vendors or conduct operations, our liquidity position, our ability to generate cashfrom operations, growth in our businesses, our investments, the potential impact of adopting new accounting pronouncements, our financial results, our purchasecommitments, our contributions to our pension plans, the selection of discount rates and recognition of any gains or losses for our benefit plans, our cost-controlactivities, savings and headcount reduction recognized from our restructuring programs and other cost saving initiatives, and other regulatory approvals, theintegration of our completed acquisitions and other transactions, our transition to lower-cost regions, the existence of economic instability, and our and thecombined group's estimated or anticipated future results of operations, that involve risks and uncertainties. Our actual results could differ materially from theresults contemplated by these forward-looking statements due to various factors, including but not limited to those risks and uncertainties discussed in Item 1A andelsewhere in this Form 10-K.
PART I
Item 1. Business
Overview
Keysight Technologies, Inc. ("we," "us," "Keysight" or the "company”), incorporated in Delaware on December 6, 2013, is a measurement company providingelectronic design and test solutions to communications and electronics industries. We provide electronic design and test instrumentation systems and relatedsoftware, software design tools, and services that are used in the design, development, manufacture, installation, deployment, validation, optimization and secureoperation of electronics systems. Related services include start-up assistance, instrument productivity, application services and instrument calibration and repair.We also offer customization, consulting and optimization services throughout the customer's product lifecycle.
On April 18, 2017, pursuant to the terms of an Agreement and Plan of Merger dated January 30, 2017, between Keysight and Ixia (the "Merger Agreement"),we acquired all of the outstanding common stock of Ixia for $1,622 million, net of $72 million of cash acquired, pursuant to an exchange offer for $19.65 per share(the "Merger Consideration"). Pursuant to the Merger Agreement, any outstanding and unexercised Ixia stock options with an exercise price below the MergerConsideration and any outstanding Ixia restricted stock awards were cancelled and converted into the right to receive a cash payment equal to the mergerconsideration of $19.65 per share (minus the exercise price for the Ixia stock options). The vested portion of the awards associated with prior service of Ixiaemployees represented approximately $47 million of the total consideration. We funded the acquisition with a combination of cash and proceeds from debt andequity financings.
On August 31, 2017, we acquired all of the outstanding common stock of ScienLab for $60 million, net of $2 million of cash acquired. ScienLab is aGermany-based company that provides test solutions to automotive original equipment manufacturers and Tier 1 suppliers in the automotive and energy markets.This acquisition complements our portfolio, allowing end-to-end solutions for hybrid electric vehicles, electric vehicles, and battery test solutions that address e-mobility market dynamics. We funded the acquisition using existing cash. As a result of the acquisition, ScienLab has become a wholly-owned subsidiary ofKeysight.
We have a comprehensive sales strategy that uses our direct sales force, distributors, resellers and manufacturer's representatives. The strategy varies based onthe size of customer, the complexity of products and geographical coverage. We generated $3.2 billion of net revenue in 2017 and $2.9 billion of net revenue infiscal year 2016 and 2015. Of our total net revenue of $3.2 billion for the fiscal year ended October 31, 2017, we generated 33 percent in the United States and 67percent outside the United States. As of October 31, 2017, we had approximately 12,600 employees worldwide. Our primary research and development sites are inCalifornia, Colorado, Georgia and Texas in the United States and outside of the United States in China, Finland, Germany, U.K., India, Japan, Malaysia, Romania,Singapore and Spain.
Net revenue, income from operations and assets by business segment as of and for the fiscal years ended October 31, 2017, 2016 and 2015 are shown inNote 20, "Segment Information," to our consolidated financial statements, which we incorporate by reference herein.
We had more than 16,000 direct customers for our products and services in fiscal year 2017 and greater than 32,000 customers including indirect channels. Nosingle customer represented 10 percent or more of our net revenue. Many of our customers acquire products and services across multiple segments.
3

Table of Contents
Strategies
With a singular focus on electronic design and test, we deliver market-leading solutions across a wide range of industries, including commercialcommunications, aerospace, defense and government, automotive, energy, semiconductor and electronic industrial. Additionally, we provide test, security andvisibility solutions that validate, secure and optimize networks and applications from engineering concept to live deployment. Our research and developmentfocuses on our customers' design and test challenges, from design simulation to prototype validation to manufacturing test, to optimization in the network. Ourcompany’s goal is to increase the productivity of our customers by speeding their product "time-to-market.” Market and customer opportunities are driven byevolving technology standards, as well as the need for faster data rates and new form factors, from feature-rich solutions to modular solutions to handheldinstruments. Our strategic focus is to deliver market-leading solutions and growth by investing in the following areas:
• New wireless communication measurement solutions. We are investing in the development of new wireless communications test solutions to satisfy thecommercial communications end market that is being driven by growth in mobile data and evolving wireless standards, particularly 5G. Theacquisition of Anite in the fourth quarter of fiscal 2015 strengthened our wireless software design and test portfolio, and its Network Test businessexpanded our served addressable market. Our early 5G solutions have also been gaining tangible traction. With our technical breadth andexpertise and strategic engagement with market-leading customers and partners around the world, we have leading-edge solutions for 5Gapplications available when needed, even as development schedules accelerate.
• Industry-focused solutions across form factors. With our focus on industry solutions, we provide customers with solutions that utilize our leading-edgetechnology across form factors, from feature-rich solutions to modular solutions to handheld instruments. We have the broadest portfolio of software,hardware and service solutions in the industry and continue to leverage our strength in feature-rich instrumentation into a portfolio of modular andhandheld measurement solutions to address our customers’ complex design and measurement needs.
• New automotive design and measurement solutions. We are actively investing in the development of new automotive test solutions to address the rapidlyemerging electric, hybrid electric, connected and autonomous vehicle segments. In support of this strategy we successfully completed the acquisition ofScienLab, an automotive electrical energy test provider, during fiscal 2017.
• First to market network test solutions. The rapidly growing number of high-speed, connected devices requires service providers and data center operatorsto continuously update their networks to deliver higher levels of data transfer performance, improve customer quality of service and enhance networksecurity. The acquisition of Ixia in the second quarter of FY17 established Keysight Technologies as a market leader in next generation network test andnetwork visibility solutions.
• Enhanced and expanded software solutions. An increasing percentage of measurement science and functionality is delivered through software solutions.Our portfolio of software solutions and software productivity tools is extensive and represents a significant corporate asset. We continue to invest insoftware development to capitalize on its growth potential and provide industry-leading measurement applications, electronic design automation ("EDA")software and software protocol design and test solutions.
• New services solutions. Our services business represents a meaningful growth opportunity as we invest in expanding our services solutions portfolio. Ourfocus on growing services through multi-vendor managed services and asset management builds upon a strong foundation of global repair and calibrationcapabilities. In addition, our used equipment remarking business provides an excellent foundation to grow our technology refresh programs. We are alsoexpanding our services solutions into new areas, such as tiered product and solution technical support.
Strengths
Our Electronic Measurement Business originated in 1939. Our legacy encompasses more than 75 years of innovation, measurement science expertise and deepcustomer relationships. We do business with most Fortune 1000 companies that are developing electronic products. We help accelerate innovation to connect andsecure the world. The following strengths are significant:
• Technology Leadership as a Competitive Differentiator. Proprietary software and hardware technologies unavailable on the commercial market anddeveloped by our fourteen R&D centers around the world enable many Keysight products to deliver the best design and measurement solution capabilityavailable for our customers’ engineering requirements. Built on an intellectual property foundation developed over several decades, Keysight’s EDAcomputer aided design software for radio and microwave frequency designs is the premiere tool used by over two-thirds of the world’s engineers doing
4

Table of Contents
design work in this field. Some of Keysight’s hardware technologies are designed and manufactured in our own in-house integrated circuit fabricationfacilities, which were purpose-built and optimized to deliver unmatched performance and capabilities across the broad portfolio of Keysightinstruments. Once developed, these technologies can be deployed into multiple instrument form factors, which includes benchtop instruments, modularinstruments and handheld portable instruments. For Keysight, deploying technology across all the instrument form factors provides multiple revenuestreams from a single technology investment. The result is that Keysight is recognized as being a product leader in five core engineering instrumentationcategories; RF and Microwave Design Simulation software, Network Test, Network Analyzers, Signal Analyzers, and Signal Sources.
• Broad Portfolio of Solutions to Address Customer Needs. Keysight has the broadest portfolio of electronic design and test solutions in the industry. Ourhardware product portfolio spans many technologies, price points and form factors. We address time and frequency domain applications with RF,microwave, high-speed digital and general instrumentation. In addition, we have a broad portfolio of software products including EDA software for RFand high-speed digital design, hundreds of measurement application solutions to help customers make specific measurements quickly and consistently,and software tools for programming.
• Industry-Leading Commitment to Product Quality and Reliability. Keysight has a reputation in the industry for high-quality and high-reliability electronicmeasurement instrumentation and software. Ensuring quality and reliability is an integral part of our new product development processes.
• Large Installed Base. We have a large installed base of equipment because of the breadth of our product portfolio and our long history of producing high-performance and high-quality products. This installed base enables a strong and growing Services Solutions Group that provides a wide range ofcalibration and repair services, on both a per incident and contract basis, and provides a significant source of loyal customers for future sales.
• Sales Channel with Global Reach. We have a worldwide and comprehensive sales channel. We have experienced management teams and highly technicalsales and application engineers in all parts of the world, including a strong local presence in emerging markets. Our sales channel strategy is segmentedby customer size, customer location and product characteristics. We deploy a direct sales organization focused on selling higher performance productsand industry solutions to global and geographic accounts. Approximately 77 percent of our business comes from customer interactions with our directsales organization. To ensure broad geographic coverage and further drive growth, we maintain a network of over 700 channel partners to complementour direct sales force.
• Centralized Order Fulfillment. Our order fulfillment organization allows us to leverage the scale and scope of our business to provide high-quality,market-leading instrument solutions to our customers while generating competitive gross margins. Keysight has a central order fulfillment organizationthat supplies solutions to customers across geographies. Our Penang, Malaysia site is our largest manufacturing facility, with a proven track record ofoperational excellence, technology capability and quality. We have an established network of suppliers and subcontractors, especially in Asia, thatcomplements our in-house capabilities.
• Business Model. Our operating model incorporates a substantial amount of cost structure flexibility with the intent to be materially profitable across thebusiness cycle. Our variable compensation programs, sales channel strategy and the outsourced components of our supply chain have been implementedto improve the flexibility of our cost structure.
Operating Segments
In fiscal 2016, we completed an organizational change to align our organization with the industries we serve which resulted in three reportable operatingsegments, Communications Solutions Group (“CSG”), Electronic Industrial Solutions Group (“EISG”), and Services Solutions Group (“SSG”). CSG and EISG arefrom our previous Measurement Solutions segment, while SSG was formerly reported as the company's Customer Support and Services segment. Prior periodamounts were revised in 2016 to conform to the presentation. On April 18, 2017, we completed the acquisition of Ixia, which became our fourth reportablesegment, the Ixia Solutions Group (“ISG”). The new organizational structure continues to include centralized enterprise functions that provide support across thegroups.
Communications Solutions Group
The Communications Solutions Group serves customers spanning the worldwide commercial communications end market, which includes internetinfrastructure, and the aerospace, defense and government end market. The group provides electronic design and test software, instruments, and systems used in thesimulation, design, validation, manufacturing, installation and optimization of electronic equipment. This business generated revenue of $1.7 billion in fiscal 2017,$1.8 billion in fiscal 2016 and $1.7 billion in fiscal 2015.
5

Table of Contents
Communications Solutions Group Markets
Our Communications Solutions Group serves the following two markets:
Commercial Communications Market
We market our electronic design and test solutions to network equipment manufacturers (“NEMs”), wireless device manufacturers, and communicationsservice providers, including the component manufacturers within the supply chain for these customers. Growth in mobile data traffic and increasing complexity insemiconductors and components are drivers of test demand across the communications market.
NEMs manufacture and sell products to enable the transmission of voice, data and video traffic. The NEMs’ customers are communications service providersthat deploy and operate the networks and services, as well as distribute end‑user subscriber devices, including wireless personal communication devices andset‑top boxes. To meet their customers’ demands, NEMs require test and measurement instruments, systems and solutions for the development, production andinstallation of each optical, electrical and wireless network technology.
Wireless device manufacturers require design and test solutions for the design, development, manufacture and repair of a variety of mobile devices. Thesemobile devices are used for voice, data and video delivery to individuals who connect wirelessly to the service provider’s network. The device manufacturers’customers are large and small service providers, enterprises and consumers who purchase devices directly from retailers. Wireless device manufacturers requiredesign and test solutions that enable technology development in conformance with the latest standards.
Communications service providers require reliable data center and network equipment that enables new service offerings and allows their networks to operatewith ever‑increasing capacities. To achieve this, communications service providers require a range of sophisticated test instruments and systems to ensureconformance to communication standards and network requirements and to evaluate network performance.
Component manufacturers design, develop and manufacture electronic and optical components and modules used in network equipment and mobile devices.The component manufacturers require test and measurement products to verify that the performance of their components and modules meets the specifications oftheir customers.
Aerospace, Defense and Government Market
We market our electronic design and test solutions to manufacturers and research laboratories within the aerospace and defense industries. This marketincludes commercial and government customers and their contracted suppliers. The modernization of satellite, radar and surveillance systems worldwide is a driverof test demand within the aerospace and defense market.
Government customers include departments or ministries of defense and related agencies around the world. Contractors support the government andcommercial customers by providing design and manufacturing capabilities for a variety of programs. We also sell to sub‑contractors and component manufacturerswithin the supply chain.
Customers use our electronic measurement instruments to develop and manufacture a wide variety of electronic components and systems used in aerospaceand defense industries, including commercial and military aircraft, space, satellite, radar, intelligence and surveillance. Customers test the electrical parameters of abroad spectrum of components and assemblies and final products and often require large systems containing multiple electronic instruments.
Communications Solutions Group Products
Our electronic design and test solutions include RF and microwave instruments, digital instruments and various other general purpose test instruments andtargeted test solutions. We offer these products and related software in a variety of form factors, including benchtop, modular and handheld, depending on thespecific requirements of the customer application.
Software Solutions
Our high-frequency EDA software tools are used to model, simulate and analyze communications product designs at the circuit and system levels. Ourmeasurement application software is an extension of our hardware solutions and enables a wide range of measurement capability used across all end markets todesign and manufacture next-generation electronic components and products. The acquisition of Anite provides the software tools used to design and test thesoftware portion of wireless devices and test the performance of networks.
6

Table of Contents
RF and Microwave Products
Our RF and microwave test instruments and related software and EDA software tools are used mainly in wireless and aerospace and defense applications.These products are required for the design and production of wireless network products, communications links, mobile devices and base stations. RF andmicrowave test instruments include signal analyzers, signal generators, network analyzers, one-box testers and power meters. The acquisition of Anite provides thesoftware and hardware tools used to design and test the software portion of wireless devices and test the performance of networks.
Digital Products
Our digital test products are used by research and development engineers across a broad range of industries to validate the function and performance of theirdigital product and system designs. These designs include a wide range of products from simple digital control circuits to complex high-speed systems such ascomputer servers and the latest generation gaming consoles. The test products offered include oscilloscopes, logic and serial protocol analyzers, logic‑signalsources, arbitrary waveform generators, and bit error rate testers. Our customers also use our high‑frequency EDA software tools to model signal integrityproblems in digital design applications as digital speeds continue to increase.
Other Products
Our suite of fiber optic test products measure and analyze a wide variety of critical optical and electrical parameters in fiber optic networks and theircomponents. Components which can be tested with our solutions include source lasers, optical amplifiers, filters and other passive components. Test productsinclude optical modulation analyzers, optical component analyzers, optical power meters, and optical laser source products.
Communications Solutions Group Customers
Our customers include commercial companies and government agencies around the world. We have customers across the lifecycle that design, develop,manufacture, install and monitor a variety of commercial and government communications networks. Commercial customers include original equipment andcontract manufacturers of electronic components, semiconductors, wireless devices and network equipment, as well as network service providers that implement,maintain and manage communication networks and services. Other commercial customers include defense contractors and sub-contractors. Government customersinclude departments or ministries of defense, government agencies and related research institutes.
Our customers use our products to conduct research and development to manufacture, and to install and maintain radio frequency, microwave frequency,digital, semiconductor, and optical products and systems. Many of our customers purchase solutions across several of our major product lines for their differentbusiness units.
No single customer represented 10 percent or more of the group's net revenue.
In general, the orders and revenues from many of the Communications Solutions Group markets and product categories are seasonal, traditionally marked bylower business levels in the first and third quarters of the fiscal year and higher volumes in the second and fourth quarters of the fiscal year. The seasonal impact ofour business is tempered by broader economic trends and the diversity of our electronic measurement products and customers, which span multiple industries.
Communications Solutions Group Sales and Support
We have a comprehensive sales strategy, using a direct sales force, resellers, manufacturer’s representatives and distributors to meet our customers’ needs.
Our direct sales force focuses on addressing our largest customer needs and recommending solutions involving the effective use and deployment of ourequipment, systems and capabilities. Some of our direct sales force concentrates on more complex products such as our high‑performance instruments, wherecustomers require strategic consultation. Our direct sales force consists of field and application engineers who have in‑depth knowledge of the customers’ businessand technology needs. Our application engineers provide a combination of consulting, systems integration and application and software engineering services thatare pervasive across all stages of the sale, implementation and support of our complex systems and solutions.
To complement our direct sales force, we have agreements with channel partners around the world. These partners, including resellers, manufacturer’srepresentatives and distributors, serve customers across both the commercial communications and the aerospace, defense and government end markets and areexpected to provide the same level of service and support as our direct sales force. Lower dollar sales transactions are also served by our tele‑sales and electroniccommerce channels.
7

Table of Contents
Communications Solutions Group Manufacturing
We concentrate our Communications Solutions Group manufacturing efforts primarily on final assembly and test of our products. To maximize ourproductivity and our ability to respond to market conditions, we use contract manufacturers for the production of printed circuit boards, sheet metal fabrication,metal die-casting, plastic molding and standard electronic components. We also manufacture proprietary devices and assemblies in our own fabrication facilitiesfor competitive advantage. We have manufacturing facilities in California and Colorado in the United States. Outside of the United States we have manufacturingcentralized in Malaysia with other manufacturing facilities in China, Germany and Japan. Our Penang, Malaysia site is our largest test and measurementmanufacturing facility with proven operational excellence through scale, scope and expertise.
Within our business, there are three Technology Centers that collectively provide key components and sub‑systems. The three Technology Centers are locatedin Boeblingen, Germany, Colorado Springs, Colorado and Santa Rosa, California. These technologies include optical components and sub‑systems, Application-Specific Integrated Circuits (“ASICs”), thick and thin film circuits, high speed probes and precision machining. These Technology Centers provide a competitiveadvantage by developing unique technologies for our solutions.
We generally only manufacture products when we have received firm orders for delivery and do not generally hold large stocks of finished inventory.
Communications Solutions Group Competition
The market for electronic design and test solutions is highly competitive across our targeted markets. In the commercial communications market, our primarycompetitors are Rohde & Schwarz GmbH & Co. KG, Tektronix, Inc. (a subsidiary of Fortive Corporation), Anritsu Corporation, Cobham plc, LeCroy Corporation(a subsidiary of Teledyne Technologies), National Instruments Corporation and Teradyne, Inc. In the aerospace, defense and government market, our primarycompetitors are Rohde & Schwarz GmbH, & Co. KG, Cobham plc, LeCroy Corporation and Tektronix, Inc.
Our electronic design and test solutions offer a wide range of products and related software, and these products compete primarily on the basis of productquality, differentiated capability, leading-edge technology and long-term value to our customers.
Electronic Industrial Solutions Group
The Electronic Industrial Solutions Group provides test and measurement solutions across a broad set of electronic industrial end markets, focusing on high-growth applications in the automotive and energy industry and measurement solutions for semiconductor design and manufacturing, consumer electronics,education and general electronics manufacturing. The group provides electronic design and test software, instruments, and systems used in the simulation, design,validation, manufacturing, installation and optimization of electronic equipment. This business generated revenue of $836 million in fiscal 2017, $776 million infiscal 2016 and $758 million in fiscal 2015.
Electronic Industrial Solutions Group Markets
We market our electronic design and test solutions to customers with significant electronic content across a broad set of electronic industrial end markets.These industries design, develop and manufacture a wide range of products, including those produced in high volumes, such as computers, computer peripherals,electronic components, consumer electronics, enterprise servers, storage networks and automotive electronics. The components, printed circuit assemblies andfunctional devices for these products may be designed, developed and manufactured by electronic components companies, by original equipment manufacturers orby contract manufacturers. Other industrial applications for our products include power, energy, automotive, medical, research and education.
Customers use test solutions in developing and manufacturing a wide variety of electronic components and systems. These customers’ test requirementsinclude testing the electrical parameters of digital, radio frequency, and microwave frequency components and assemblies; testing multiple parameters of theprinted circuit boards used in almost every electronic device; testing of the final product; and testing of systems containing multiple electronic instruments. Forsemiconductor and board test applications, customers use our solutions in the design, development, manufacture, installation, deployment, and operation ofsemiconductor and printed circuit assemblies.
Electronic Industrial Solutions Group Products
Our electronic industrial products include design and design verification tools, a broad range of electronic test and measurement instruments, comprehensivemanufacturing systems, material analysis and university education solutions to train the next generation of engineers and scientists.
8

Table of Contents
Design tools include design-for-test (“DFT”) for printed circuit assemblies and automotive radar, and EDA software for wireless and wired communicationlinks in industrial, automotive and power semiconductor devices.
Design verification solutions include physical signal characterization and protocol compliance, notably for those links used in industrial, energy andautomotive devices and products. Major industry forces are electrifying transportation and changing how electrical energy is generated, stored and controlled.Examples of verification solutions include those that help design engineers qualify and characterize power semiconductor devices, photo-voltaic/electricalvehicle/storage inverters, AC power analysis, DC battery cells/modules and automotive body/safety/engine electronic modules. High-precision and higher-bandwidth power analysis products address the increased power efficiency required with the proliferation of battery-powered and energy-efficient devices. Withthe recent acquisition of ScienLab, EISG now has the solutions required to test the components in the electrified drive train.
General purpose test and measurement products include hand-held (portable), benchtop instrument and modular forms. Capability includes Digital Multi-Meters, Function Generators, Waveform Synthesizers, Counters, Data Acquisition (“DAQ”), Audio Analyzers, LCR Meters, thermal imaging, low-cost USBmodular, precision SMU (“Source Measurement Units”), ultra-high precision device current analyzers, test executive software platforms and a wide variety ofpower supplies ranging from bench to highly scalable AC/DC modular supplies and electronically programmable loads. These products are increasingly integratedwith solution-specific software that enable our customers to dramatically accelerate and improve the effectiveness of their product design, design validation,manufacturing and support activities. Our products also support fundamental measurement science for voltage, current, frequency, signal pulse width, sub-nano-meter distance and complex electronic measurements. This enables industry and government agencies to determine fundamental electrical parameters and ensurecustomers can calibrate and ensure traceability measurement metrology.
Comprehensive manufacturing systems include: printed-circuit-board-assembly (“PCBA”) testers that ensure complex boards and components are assembledproperly, IC parametric testers that ensure semiconductor wafers are processed consistently with high-precision and sub-nano-meter positioning systems forsemiconductor wafer manufacturing. We provide effective and efficient manufacturing test solutions for complex transportation electronic control/safety systemsthat include radar, autonomous capability, and state-of-the-art wired and wireless components. Our flexible and scalable manufacturing systems offer the best-in-class value to enable our manufacturing customers to deliver outstanding yield, quality and productivity resulting in lower overall cost of test.
Material analysis products include atomic-force and scanning-electron microscopy to enable deeper understanding of materials that are driving breakthroughsin new semiconductor devices and sensors used in Internet of Things (“IoT”) and electronic manufacturing processes.
Our highly regarded test and measurement products and software have a long history of broad adoption and use in universities and research centers that teachthe next generation of engineers and scientists and enable basic research to flourish. Increasing global competition in education is driving the need for efficient andtimely education solutions and we are making those available in areas such as IoT, 5G communications technology and smart devices.
Electronic Industrial Solutions Group Customers
Our customers include original equipment and contract manufacturers of electronic industrial products and services. These customers use our solutions toperform research and development, manufacturing and support their products and services. Customer products include semiconductor devices, printed circuitassemblies, electronic modules and systems. Our customers range from the largest multi-national global companies to the smallest start-ups and includeuniversities and government agencies around the world.
No single customer represented 10 percent or more of the group's net revenue.
In general, the orders and revenues from many of the electronic industrial measurement markets and product categories are seasonal, traditionally marked bylower business levels in the first and third quarters of the fiscal year and higher volumes in the second and fourth quarters of the fiscal year. The seasonal impact ofour business is tempered by broader economic trends and the diversity of our electronic measurement products and customers, which span multiple industries.
Electronic Industrial Solutions Group Sales and Support
We have a comprehensive sales strategy, using a direct sales force, resellers, manufacturer’s representatives and distributors to meet our customers’ needs.
Our direct sales force focuses on addressing our largest customer needs and recommending solutions involving the effective use and deployment of ourequipment, systems and capabilities. Some of our direct sales force concentrates on more complex products, such as our high‑performance instruments, wherecustomers require strategic consultation. Our direct sales force consists
9

Table of Contents
of field and application engineers who have in‑depth knowledge of the customers’ business and technology needs. Our application engineers provide acombination of consulting, systems integration and application and software engineering services that are pervasive across all stages of the sale, implementationand support of our complex systems and solutions.
To complement our direct sales force, we have agreements with channel partners around the world. These partners, including resellers, manufacturer’srepresentatives and distributors, serve customers across the automotive and energy, general electronics measurement and semiconductor measurement markets andare expected to provide the same level of service and support as our direct sales force. Lower dollar sales transactions are also served by our tele‑sales andelectronic commerce channels.
Electronic Industrial Solutions Group Manufacturing
We concentrate our electronic industrial measurement manufacturing efforts primarily on final assembly and test of our products. To maximize ourproductivity and our ability to respond to market conditions, we use contract manufacturers for the production of printed circuit boards, sheet metal fabrication,metal die-casting, plastic molding and standard electronic components. We also manufacture proprietary devices and assemblies in our own fabrication facilitiesfor competitive advantage. We have manufacturing facilities in California and Colorado in the United States. Outside of the United States we have manufacturingcentralized in Malaysia, with other manufacturing facilities in China, Germany and Japan. Our Penang, Malaysia site is our largest test and measurementmanufacturing facility, with proven operational excellence through scale, scope and expertise.
Within our business, there are three Manufacturing Technology Centers that collectively provide key components and sub‑systems. The three ManufacturingTechnology Centers are located in Boeblingen, Germany, Colorado Springs, Colorado and Santa Rosa, California. These technologies include optical componentsand sub‑systems, ASICs, thick and thin film circuits, high speed probes and precision machining. These Manufacturing Technology Centers provide a competitiveadvantage by developing unique technologies for our solutions.
We generally only manufacture products when we have received firm orders for delivery and do not generally hold large stocks of finished inventory.
Electronic Industrial Solutions Group Competition
The market for electronic industrial design and test solutions is highly competitive across our targeted markets. In the electronic industrial test market, ourprimary competitors are Rohde & Schwarz GmbH & Co. KG, Anritsu Corporation, Keithley/Tektronix/Fluke, Inc. (subsidiaries of Fortive Corporation), LeCroyCorporation (a subsidiary of Teledyne Technologies), National Instruments Corporation, Teradyne, Inc. and Advantest.
Our electronic industrial design and test solutions offer a wide range of products, solutions and related software, and these compete primarily on the basis ofproduct quality, differentiated capability, leading edge technology and long-term value to our customers.
Ixia Solutions Group
The Ixia Solutions Group helps customers validate the performance and security resilience of their networks and associated applications. The group’s test,visibility, and security products help organizations and their customers strengthen their physical and virtual networks. Enterprises, service providers, networkequipment manufacturers, and governments worldwide rely on the group's solutions to validate new products before shipping and secure ongoing operation of theirnetworks with better visibility and security. The group’s product solutions consist of high-performance hardware platforms, software applications, and services,including warranty and maintenance offerings. From the date of acquisition, this business generated revenue of $256 million in fiscal 2017.
Ixia Solutions Group Markets
We market our network test hardware platforms, software applications and services, and our network visibility products to network equipment manufacturers,service providers, enterprises and governments worldwide. Our network test customers use our products to evaluate the performance of their equipment andnetworks during the design, manufacture, and pre-deployment stages, as well as after the equipment is deployed in a network. Our network visibility productsimprove the way our customers manage their data centers, save valuable IT time and maximize return on IT investments.
Ixia Solutions Group Products and Services
Our product solutions consist of our hardware platforms, such as our chassis, interface cards and appliances, software application tools, and services, includingour warranty and maintenance offerings and professional services. Our highly scalable and flexible products enable our customers to configure solutions based ontheir specific networks and use cases.
10

Table of Contents
ISG Test Products
We offer a comprehensive suite of software applications in conjunction with our network test hardware platforms that provide customers with the ability toperform a broad range of data, signaling, voice, video, and application testing for layers 1-7 of the network stack. These solutions measure and analyze theperformance, functionality, interoperability, service quality, and conformance of networks, network equipment and applications that run on these networks. Ourtechnology-specific application test suites are targeted at a wide range of popular application and security performance and conformance requirements acrossvarious protocols, interfaces and types of devices. These include automated and targeted delivery, functionality and performance test for technologies and devices,including storage, video, voice, intelligent networks, specific applications, routing, switching, Wi-Fi, broadband, wireless, software defined networks, and virtualnetworks and functions. Our application and security load modules recreate cyber security attacks, including exploits, malware, denial of service ("DoS") andmobile malware. These load modules provide application and threat assessment solutions at Internet-scale, and create massive-scale, high fidelity simulation andtesting conditions for battle-testing infrastructures, devices, applications and people. All of these technologies are used in a variety of physical and virtualenvironments, including (but not limited to) R&D test environments, change management and scenario planning for production networks.
ISG Visibility Products
Our visibility solutions provide real-time, end-to-end visibility, insight and security into physical, virtual, Software Defined Networking ("SDN") and NetworkFunctions Virtualization ("NFV") networks; delivering the control, coverage, intelligence and performance customers need in a seamless fashion to protect andimprove crucial networking, data center and cloud business assets. Our comprehensive network visibility platform ranges from network test access points("TAPs"), to high-density, high-availability, cutting edge solutions designed for large and complex data centers and networks. Our proprietary software includespatented filtering and content handling technology that ensures each monitoring tool gets exactly the right data needed for analysis, all powered by the easy to use,drag-and-drop management system. Our advanced processing technologies enable additional intelligence and functionality, including de-duplication, packetslicing, time-stamping, real-time application and threat data, network flow, and session aware mobility load balancing. Our Hawkeye solution quickly andeffectively validates network performance, isolates problems, and proactively detects issues by running scheduled verification tests on any site using wireline orwireless connections. Using a combination of hardware and software agents called Performance Endpoints, Hawkeye simulates application traffic and sends keyperformance metrics to a central console for fast action.
Services
Our service revenues primarily consist of our technical support, warranty and software maintenance services. We also offer training and professional services.
We offer technical support, warranty, and software maintenance services with the sale of our hardware and software products. Many of our products includeup to one year of these services with the initial product purchase. Our customers may choose to extend the services for annual or multi-year periods. Our technicalsupport services are delivered by our global team of technically knowledgeable and responsive customer service and support staff, and include assistance with theset-up, configuration, and operation of Ixia products. Our warranty and software maintenance services include the repair or replacement of defective product, bugfixes, and unspecified when and if available software upgrades.
Our technical support and software maintenance services also include our Application Threat Intelligence ("ATI") subscription service for our application andsecurity platforms, which provides a comprehensive suite of application protocols, threat intelligence, software updates and responsive technical support. The ATIsubscription service provides full access to the latest security attacks, global malicious site and geolocation data, and application updates for use in real-world test,visibility, security and assessment scenarios. Our customers may choose to purchase the ATI subscription service for annual or multi-year periods.
Ixia Solutions Group Customers
Today’s networks and data centers are continuously improving their performance and scale in order to accommodate the plethora of applications and serviceswe now rely upon to do business, communicate, capture memories, plan, travel and more. Applications drive network capacity, influence quality of experience,introduce potential vulnerabilities, and lead to more innovations. Every organization from device manufacturers, to service providers, to enterprise and governmentorganizations, seeks to optimize networks and data centers in order to accelerate, secure, and scale the delivery of these applications.
Our solutions provide the insight needed for organizations to make real-time decisions that optimize performance, harden security and increase the scalabilityof networks facing constantly changing requirements. Our line of hardware, software, and other services cater to the needs of network equipment manufacturers("NEMs"), service providers, and enterprise and government organizations. Our solutions provide an end-to-end approach for our customers to test devices andsystems prior to deployment,
11

Table of Contents
validate the performance and security of networks and data centers after every change, and help them continuously monitor network application and securitybehavior to manage performance.
We provide solutions and services to each of our customer segments, including those set forth below:
• NEMs. NEMs provide voice, video, and data and service infrastructure equipment to customer network operators, service providers and network users.Such users require high standards of functionality, performance, security, and reliability. To meet these higher standards, NEMs must ensure the qualityof their products during development and manufacturing (prior to deployment). Failure to ensure the consistent functionality and performance of theirproducts may result in the loss of customers, increased research and development costs, increased support costs, and losses resulting from the return ofproducts. These equipment manufacturers are also, in many cases, large enterprises, and therefore have the same challenges that can be met using ourassessment and monitoring solutions within their own internal network.
• Service Providers. Service providers seek to deliver a growing variety of high quality, advanced network services ranging from traditionaltelecommunications and Internet services, to social networking, cloud storage and entertainment streaming. Failure to provide a quality experience to theend user can be costly through high subscriber churn rates and reduced revenues. To ensure quality of experience and service assurance, service providerR&D and network engineering groups must verify the performance and functionality of staged networks during equipment selection and network design,prior to deployment and after any change to the production network. Our network test systems emulate millions of mobile subscribers to realisticallypredict end-user quality of experience delivered by providers’ infrastructure and services. Post-deployment, service providers depend on our visibilitysolutions to help monitor and secure their networks and ensure user experience and services performance.
• Enterprises and Government. Enterprise and government organizations depend on their networks and data centers to get business done, and they devoteenormous resources to ensure applications and services run optimally and securely. These customers rely on our solutions to help evaluate equipmentduring selection, optimize and harden their network designs in labs prior to roll-out, and once rolled out, continuously monitor the production network toensure optimal performance and security of the contents flowing through it. Our security solutions are also used by major organizations to train their staffon the new generation of “cyber warfare and mitigation techniques” to recognize and defend against massive cyber-attacks.
No single customer represented 10 percent or more of the group’s net revenue.
We do not have long-term or volume purchase contracts that commit our customers to future product purchases, and as a result our customers may reduce ordiscontinue purchasing from us at any time.
Ixia Solutions Group Sales and Support
Sales . We use our global direct sales force to market and sell our products and solutions. In addition, we use distributors, value added resellers, systemintegrators, and other partners to complement our direct sales and marketing efforts for certain vertical and geographical markets. We depend on many of ourdistributors, resellers, and other partners to generate sales opportunities and manage the sales process. Our direct sales force maintains close contact with ourcustomers and supports our distributors, resellers, and other partners. Another key component of our go-to-market strategy for certain products is strategicrelationships with technical partners, consisting of network monitoring and management companies to complement their monitoring or security solutions. We workwith technical partners in two main ways: (i) through customer referrals and recommendations and (ii) through automation integration/interoperability thatprovides a differentiated solution for our customers.
Ixia Technical Support . Our global team of technical support and field engineers have a high level of networking and product expertise. We enable ourcustomers to make the best use of our products to accomplish their goals, help answer questions and resolve issues they encounter, and minimize downtime.Customers can reach our technical support team by phone, email or website. We have regional support offices in the United States, Europe and multiple countriesin Asia.
Support services our team provides for our customers often include:
• assisting new customers with product installation and licensing,
• providing configuration assistance and expert advice on best practices,
• investigating and quickly solving user issues,
• troubleshooting and quickly repairing or replacing hardware as needed, and
12

Table of Contents
• providing access to our self-service portal where customers can report new cases and access our extensive knowledge base articles.
We also offer premium support options for customers who require even higher levels of service. We have invested in developing our case managementsystem, support phone system, and other tools to increase our global support capability thereby allowing us to respond quickly, route customers to the best supportengineer, and effectively manage their requests to resolution.
Ixia Solutions Group Manufacturing
Our manufacturing and supply operations consist primarily of new product introduction, test and manufacturing, test engineering, supply chain management,procurement, quality assurance, order management, final assembly, configuration testing, fulfillment and logistics. We outsource the manufacture, assembly andtesting of printed circuit board assemblies, certain interface cards, and certain chassis to third-party contract manufacturers and assembly companies, the mostsignificant of which are located in Malaysia and Mexico. This manufacturing process enables us to operate without dedicating substantial space and personnelsolely to manufacturing operations.
Ixia Solutions Group Competition
The market for providing network test and monitoring systems is highly competitive, and we expect this competition to continue in the future. We currentlycompete with network test and monitoring solution vendors such as Spirent Communications, Gigamon and NetScout. We also compete either directly or indirectlywith large Ethernet switch vendors and network management, analysis, compliance and test tool vendors that offer point solutions that address a subset of theissues that we solve. Additionally, some of our significant customers have developed or may develop in-house products for their own use or for sale to others.
We believe that we compete favorably in the markets we serve. We intend to remain competitive through ongoing research and development efforts thatenhance existing systems and result in the development of new products and features. We will also seek to expand our market presence through marketing andsales efforts.
Services Solutions Group
The Services Solution Group provides worldwide integrated service solutions to optimize customers test equipment and productivity, including repair andcalibration services, professional services and remanufactured equipment. This business generated revenue of $419 million in fiscal 2017, $402 million in fiscal2016 and $401 million in fiscal 2015.
Services Solutions Group Markets
Services Solutions Group broadly addresses the same markets as the Communications Solutions Group and Electronic Industrial Solutions Group, whichincludes commercial communications, aerospace, defense and government, internet infrastructure, automotive and energy, semiconductor manufacturing andgeneral electronics and manufacturing industries.
Services Solutions Group Products
Keysight offers the following general types of services and products under the Services Solutions Group:
• Accredited Product Support Services. Comprehensive product support services that include repair, parts, and accredited calibrations of Keysight andnon-Keysight test equipment.
• Professional Services. Training and engineering services to optimize equipment adoption, utilization, and design and test processes.
• Remanufactured Equipment. Refurbished used equipment, including Keysight Premium Used, which ensures the same high quality as our newequipment.
• Asset Management Program. Full service solution to optimize customer’s asset tracking, servicing and utilization requirements throughout theproduct life cycle.
Services Solutions Group Customers
The customers for our Services Solutions Group include customers of the Communications Solutions Group and Electronic Industrial Solutions Group. Nosingle customer represented 10 percent or more of the group's net revenue.
13

Table of Contents
Services Solutions Group Sales and Operations
Services Solutions Group shares the same industry‑leading sales, marketing and support resources as the Communications Solutions Group and ElectronicIndustrial Solutions Group, including the same direct sales force and complementary channel partners.
Customer demand is fulfilled through regional service centers by trained technicians and engineers, located in close proximity to customers at 70 Keysightservice locations in more than 30 countries. Our global presence, with localized service proximity, is an important factor in sustaining our customers’ equipmentuptime and utilization requirements.
Services Solutions Group Competition
The Services Solutions Group competes with independent test equipment service providers, government measurement laboratories and other originalequipment manufacturers. Many of these competitors offer a wide range of services and can support instruments from multiple manufacturers. Service quality, costand turn‑around time drive competitiveness within our served industries. In addition, some of our instrument customers have in‑house calibration and repaircapabilities. Our primary service competitors are Trescal Limited, Fortive Corporation, and Ceprei Laboratories. Due to differing country and regulatoryaccreditation standards, the services provided may vary greatly from country to country.
The following discussions of Research and Development, Marketing, Backlog, Intellectual Property, Materials, Environmental and InternationalOperations include information common to each of our businesses.
Research and Development
Research and development ("R&D") expenditures were $498 million in fiscal 2017, $425 million in fiscal 2016 and $387 million in fiscal 2015. We anticipatethat we will continue to have significant R&D expenditures in order to maintain our competitive position with a continuous flow of innovative, high-qualitycustomer solutions, products and services. We are committed to investing in R&D and have focused our development efforts on key strategic opportunities in orderto align our business with available markets and position ourselves for growth.
Our R&D efforts focus on improvements to existing products and development to support new product introductions and complete customer solutions alignedto our industry. We conduct R&D in four principal areas: enabling technologies, system design, simulation and measurement. Our R&D seeks to improve onvarious technical competencies in electronics, software, systems and solution delivery. R&D investments are focused on delivering technology and solutions tomarket in the short term, as well as building a strong foundation for future solutions over a longer time horizon.
Marketing
We have several ongoing programs to support the sale and distribution of our products and solutions and to inform existing and potential customers, partnersand distributors about the capabilities and benefits of our expansive product, solution and service portfolio. Our marketing efforts promote the Keysight businessthrough participating in industry trade shows and technical conferences, sponsoring technical seminars and webinars that highlight our solutions and advertising indigital media publications and physical locations. Additionally, we write and distribute various forms of marketing collateral including brochures, white papers,application notes, solutions briefs and articles for online and print journals. Finally, we communicate to our existing and potential customers through our corporatewebsite and various social media outlets such as LinkedIn, Facebook, Twitter and our corporate blog.
Backlog
Backlog represents the amount of revenue expected from orders that have already been booked, including orders for goods and services that have not beendelivered to customers, orders invoiced but not yet recognized as revenue, and orders for goods that were shipped but not invoiced, awaiting acceptance bycustomers.
At October 31, 2017, our unfilled backlog was approximately $950 million, as compared to approximately $807 million at October 31, 2016. Consistent withour strategy, we are seeing an increase in solution sales, which have a longer order-to-revenue conversion cycle; however, we expect that a majority of the unfilledbacklog will be recognized as revenue within six months. We believe backlog on any particular date, while indicative of short-term revenue performance, is notnecessarily a reliable indicator of medium or long-term revenue performance.
Intellectual Property
We generate patent and other intellectual property rights covering significant inventions and other innovations in order to
14

Table of Contents
create a competitive advantage. Although we believe that our licenses, patents and other intellectual property rights have value, in general no single license, patentor other intellectual property right is in itself material, other than the Keysight mark. In addition, our intellectual property rights may be challenged, invalidated orcircumvented or may otherwise not provide significant competitive advantage.
Materials
Our manufacturing operations employ a wide variety of semiconductors, electromechanical components and assemblies and raw materials such as plasticresins and sheet metal. We purchase materials from thousands of suppliers on a global basis. Some of the parts that require custom design work are not readilyavailable from alternate suppliers due to their unique design or the length of time necessary for design work. Our long-term relationships with suppliers allow us toproactively manage technology road maps and product discontinuance plans and monitor their financial health. Even so, some suppliers may still extend their leadtimes, limit supplies, increase prices or cease to produce necessary parts for our products. If these are unique components, we may not be able to find a substitutequickly or at all. To address the potential disruption in our supply chain, we use a number of techniques, including qualifying multiple sources of supply andredesign of products for alternative components. In addition, while we generally attempt to keep our inventory at minimal levels, we do purchase incrementalinventory as circumstances warrant to protect the supply chain.
Environmental
Our R&D, manufacturing and distribution operations involve the use of hazardous substances and are regulated under international, federal, state and locallaws governing health and safety and the environment. We apply strict standards for protection of the environment and occupational health and safety to sitesinside and outside the United States, even if not subject to regulation imposed by foreign governments. We believe that our properties and operations at ourfacilities comply in all material respects with applicable environmental laws and occupational health and safety laws. However, the risk of environmental liabilitiescannot be completely eliminated and there can be no assurance that the application of environmental and health and safety laws will not require us to incursignificant expenditures. We are also regulated under a number of international, federal, state, and local laws regarding recycling, product packaging and productcontent requirements. The environmental, product content/disposal and recycling laws are gradually becoming more stringent and may cause us to incur significantexpenditures in the future.
Some of our properties are undergoing remediation by HP Inc. ("HP") for subsurface contaminations that were known at the time of Agilent’s separation fromHP in 1999. In connection with Agilent’s separation from HP, HP and Agilent entered into an agreement pursuant to which HP agreed to retain the liability for thissubsurface contamination, perform the required remediation and indemnify Agilent with respect to claims arising out of that contamination. Agilent has assignedits rights and obligations under this agreement to Keysight in respect of facilities transferred to Keysight in our separation from Agilent on November 1, 2014 ("theseparation"). As a result, HP has access to a limited number of our properties to perform remediation. Although HP agreed to minimize interference with on-siteoperations at such properties, remediation activities and subsurface contamination may require us to incur unreimbursed costs and could harm on-site operationsand the future use and value of the properties. In connection with the separation, Agilent will indemnify us directly for any liabilities related thereto. We cannot besure that HP will continue to fulfill its remediation obligations or that Agilent will continue to fulfill its indemnification obligations.
In connection with the separation, Agilent also agreed to indemnify us for any liability associated with contamination from past operations at all propertiestransferred from Agilent to us. We cannot be sure that Agilent will fulfill its indemnification obligations.
We maintain a comprehensive Environmental Site Liability insurance policy which may cover certain clean-up costs or legal claims related to environmentalcontamination. This policy covers specified active, inactive and divested locations.
International Operations
Our net revenue originating outside the United States, as a percentage of our total net revenue, was approximately 67 percent in fiscal 2017, 2016 and 2015,the majority of which was from customers other than foreign governments. Revenues from external customers are generally attributed to regions based upon thelocation of our sales representative.
Long-lived assets located outside of the United States as a percentage of our total long-lived assets was approximately 66 percent in fiscal year 2017 and57 percent in fiscal year 2016, with the increase primarily driven by acquisitions. Approximately 29 percent and 30 percent of our long-lived assets were located inJapan in fiscal years 2017 and 2016, respectively. Approximately 9 percent and 13 percent of our long-lived assets were located in Malaysia in fiscal years 2017and 2016, respectively.
15

Table of Contents
Most of our sales in international markets are made by foreign sales subsidiaries. In countries with low sales volumes, sales are made through variousrepresentatives and distributors. However, we also sell into international markets directly from the United States.
Our international business is subject to risks customarily encountered in foreign operations, including interruption to transportation flows for delivery of partsto us and finished goods to our customers, changes in a specific country's or region's political or economic conditions, trade protection measures, import or exportlicensing requirements, consequences from changes in tax laws and regulatory requirements, difficulty in staffing and managing widespread operations, differinglabor regulations, differing protection of intellectual property and geopolitical turmoil, including terrorism and war. We are also exposed to foreign currencyexchange rate risk inherent in our sales commitments, anticipated sales and expenses, and assets and liabilities denominated in currencies other than the localfunctional currency, and may also become subject to interest rate risk inherent in any debt we incur, or investment portfolios we hold. There may be an increasedrisk of political unrest in regions where we have significant manufacturing operations such as Southeast Asia. However, we believe that our internationaldiversification provides stability to our worldwide operations and reduces the impact on us of adverse economic changes in any single country. Financialinformation about our international operations is contained in Note 20, "Segment Information," to our consolidated financial statements.
Acquisition of Material Assets
On April 18, 2017, pursuant to the terms of an Agreement and Plan of Merger dated January 30, 2017, between Keysight and Ixia (the "Merger Agreement"),we acquired all of the outstanding common stock of Ixia for $1,622 million, net of $72 million of cash acquired, pursuant to an exchange offer for $19.65 per share(the "Merger Consideration"). Pursuant to the Merger Agreement, any outstanding and unexercised Ixia stock options with an exercise price below the MergerConsideration and any outstanding Ixia restricted stock awards were cancelled and converted into the right to receive a cash payment equal to the mergerconsideration of $19.65 per share (minus the exercise price for the Ixia stock options). The vested portion of the awards associated with prior service of Ixiaemployees represented approximately $47 million of the total consideration. We funded the acquisition with a combination of cash and proceeds from debt andequity financings.
On August 31, 2017, we acquired all of the outstanding common stock of ScienLab for $60 million, net of $2 million of cash acquired. ScienLab is aGermany-based company that provides test solutions to automotive original equipment manufacturers and Tier 1 suppliers in the automotive and energy markets.This acquisition complements our portfolio, allowing end-to-end solutions for hybrid electric vehicles, electric vehicles, and battery test solutions that address e-mobility market dynamics. We funded the acquisition using existing cash. As a result of the acquisition, ScienLab has become a wholly-owned subsidiary ofKeysight.
Executive Officers of the Registrant
The names of our executive officers and their ages, titles and biographies as of December 1, 2017 appear below:
Ronald S. Nersesian , 58, has served as President and Chief Executive Officer of Keysight since December 2013 and, prior to the Separation, served asExecutive Vice President of Agilent. Mr. Nersesian served as President of Agilent from November 2012 to September 2013 and as Chief Operating Officer,Agilent from November 2011 to September 2013. From November 2011 to November 2012, Mr. Nersesian served as Agilent’s Executive Vice President and ChiefOperating Officer. Mr. Nersesian serves on the Board of Directors of Trimble Inc.
Neil Dougherty , 48, has served as Senior Vice President and Chief Financial Officer of Keysight since December 2013 and, prior to the Separation, served asVice President and Treasurer of Agilent, since 2012. He served as Senior Director in Agilent’s Corporate Development Group from 2010 to 2012, and from 2006to 2010, he served as Agilent’s Assistant Treasurer.
Jay Alexander, 54, has served as Senior Vice President and Chief Technology Officer of Keysight since May 2014 and, from October 2009 until prior to theSeparation, he served as Vice President and General Manager for the Oscilloscope and Protocol Division of Agilent.
Ingrid Estrada , 53, has served as Senior Vice President, Chief People & Administrative Officer and Chief of Staff since August 2017. Previously, she servedas Keysight’s senior vice president, Human Resources, from December 2013 until August 2017. Prior to the Separation, she served as Vice President and GeneralManager of Global Sourcing of Agilent from 2011.
Satish Dhanasekaran, 45, has served as Senior Vice President and president of the Communications Solutions Group (CSG) since July 2017. Previously, heserved as Keysight's vice president and general manager, Wireless Devices and Operators business segment, as well as a variety of customer-facing leadershippositions.
16

Table of Contents
Bethany Mayer, 56, has served as Senior Vice President and president of the Ixia Solutions Group (ISG) since April 2017. Previously, she served as a directorof Ixia, and as Ixia's President and Chief Executive Officer, from September 2014 until April 2017. Prior to Ixia, she served in various executive roles with HP.Ms. Mayer resigned from Keysight effective December 1, 2017.
Soon Chai Gooi , 56, has served as Senior Vice President and President of the Electronic Industrial Solutions Group since November 2015. From December2013 to November 2015, Mr. Gooi served as Senior Vice President of Order Fulfillment and Infrastructure for Keysight. Prior to the Separation, Mr. Gooi servedas President, from November 2012 to September 2013, and as Senior Vice President, from December 2011 to November 2012, of Agilent's Order Fulfillment andSupply Chain.
John Page, 53, has served as Senior Vice President and President of Services Solutions Group since November 2015 and most recently served as vicepresident of business finance of Keysight from February 2014 to November 2015. Prior to joining Keysight, Mr. Page served as the Chief Financial Officer ofNanosys, Inc. from 2010 to 2014.
Mark Wallace, 52 , has served as Senior Vice President of Worldwide Sales since November 2016. From November 2014 to November 2016, Mr. Wallaceserved as Vice President and General Manager of Americas Field Operations, and prior to the Separation from Agilent, as Americas Field Operations VicePresident of Agilent's Electronic Measurement Group since November 2011.
Stephen Williams , 45, has served as Senior Vice President, General Counsel and Secretary of Keysight since December 2013 and, prior to the Separation,served as Agilent’s Vice President, Assistant General Counsel and Assistant Secretary since November 2009.
John Skinner , 55, has served as Vice President, Corporate Controller and Principal Accounting Officer of Keysight since December 2013 and, prior to theSeparation, Mr. Skinner served as Vice President, Agilent and Controller of Global Infrastructure and Enterprise Financial Planning and Analysis from April 2012to December 2013.
Investor Information
We are subject to the informational requirements of the Securities Exchange Act of 1934 (“Exchange Act”). Therefore, we file periodic reports, proxystatements and other information with the Securities and Exchange Commission (“SEC”). Such reports, proxy statements and other information may be read andcopied by visiting the Public Reference Room of the SEC at 100 F Street N.E., Washington, D.C. 20549. You may obtain information on the operation of thePublic Reference Room by calling the SEC at 1-800-SEC-0330. In addition, the SEC maintains an Internet site (http://www.sec.gov) that contains reports, proxyand information statements and other information regarding issuers that file electronically.
You can access financial and other information at our Investor Relations website. The address is www.investor.keysight.com. We make available, free ofcharge, copies of our annual report on Form 10-K, current reports on Form 8-K and amendments to those reports filed or furnished pursuant to Section 13(a) or15(d) of the Exchange Act as soon as reasonably practicable after filing such material electronically or otherwise furnishing it to the SEC.
Our Corporate Governance Standards, the charters of our Audit and Finance Committee, our Compensation Committee, our Nominating and CorporateGovernance Committee, our Executive Committee as well as our Standards of Business Conduct are available on our website at www.investor.keysight.com under“Corporate Governance.” These items are also available in print to any stockholder in the United States and Canada who requests them by calling (800) 829-4444.This information is also available by writing to the company at the address on the cover of this Annual Report on Form 10-K.
17

Table of Contents
Item 1A. Risk Factors
Risks, Uncertainties and Other Factors That May Affect Future Results
Risks Related to Our Business
Depressed and uncertain general economic conditions may adversely affect our operating results and financial condition.
Our business is sensitive to negative changes in general economic conditions, both inside and outside the United States. The continued economic downturnmay adversely impact our business, resulting in:
• reduced demand for our products, delays in the shipment of orders or increases in order cancellations;• increased risk of excess and obsolete inventories;• increased price pressure for our products and services; and• greater risk of impairment to the value, and a detriment to the liquidity, of our future investment portfolio.
In addition, macroeconomic developments, such as the recent downturn in Europe, the economic slowdown in Asia and the results of the recent U.S. andother national elections, economic uncertainties caused by the result of the United Kingdom's referendum advising for its exit from the European Union couldnegatively affect our ability to conduct business in those geographies. Financial difficulties experienced by our suppliers and customers, including distributors,could result in product delays and inventory issues. Risks to accounts receivable could result in delays in collection and greater bad debt expense.
Our operating results and financial condition could be harmed if the markets into which we sell our products decline or do not grow as anticipated.
Visibility into our markets is limited. Our quarterly sales and operating results are highly dependent on the volume and timing of technology-related spendingand orders received during the fiscal quarter, which are difficult to forecast and may be cancelled by our customers. In addition, our revenues and earningsforecasts for future fiscal quarters are often based on the expected seasonality or cyclicality of our markets. However, the markets we serve do not alwaysexperience the seasonality or cyclicality that we expect. Any decline in our customers' markets would likely result in a reduction in demand for our products andservices. The broader semiconductor market is one of the drivers for our business, and therefore, a decrease in the semiconductor market could harm our business.Also, if our customers' markets decline, we may not be able to collect on outstanding amounts due to us. Such declines could harm our financial position, results ofoperations, cash flows and stock price, and could limit our profitability. Also, in such an environment, pricing pressures could intensify. Since a significant portionof our operating expenses is relatively fixed in nature due to sales, R&D and manufacturing costs, if we were unable to respond quickly enough, these pricingpressures could further reduce our operating margins.
If we do not introduce successful new products and services in a timely manner to address increased competition, rapid technological changes and changingindustry standards, our products and services will become obsolete, and our operating results will suffer.
We generally sell our products in industries that are characterized by increased competition through frequent new product and service introductions, rapidtechnological changes and changing industry standards. In addition, many of the markets in which we operate are seasonal and cyclical. Without the timelyintroduction of new products, services and enhancements, our products and services will become technologically obsolete over time, in which case our revenue andoperating results would suffer. The success of new products and services will depend on several factors, including but not limited to our ability to:
• properly identify customer needs;• innovate and develop new technologies, services and applications;• successfully commercialize new technologies in a timely manner;• manufacture and deliver our products in sufficient volumes and on time;• differentiate our offerings from our competitors' offerings;• price our products competitively;• anticipate our competitors' development of new products, services or technological innovations; and control product quality in our manufacturing process.
18

Table of Contents
Dependence on contract manufacturing and outsourcing other portions of our supply chain may adversely affect our ability to bring products to market anddamage our reputation. Dependence on outsourced information technology and other administrative functions may impair our ability to operate effectively.
As part of our efforts to streamline operations and to cut costs, we outsource aspects of our manufacturing processes and other functions and continue toevaluate additional outsourcing. If our contract manufacturers or other outsourcers fail to perform their obligations in a timely manner or at satisfactory qualitylevels, our ability to bring products to market and our reputation could suffer. For example, during a market upturn, our contract manufacturers may be unable tomeet our demand requirements, which may preclude us from fulfilling our customers' orders on a timely basis. The ability of these manufacturers to perform islargely outside of our control. Additionally, changing or replacing our contract manufacturers or other outsourcees could cause disruptions or delays. In addition,we outsource significant portions of our information technology ("IT") and other administrative functions. Since IT is critical to our operations, any failure of ourIT providers to perform could impair our ability to operate effectively. In addition to the risks outlined above, problems with manufacturing or IT outsourcingcould result in lower revenues and unrealized efficiencies, and could impact our results of operations and stock price. Much of our outsourcing takes place indeveloping countries and, as a result, may be subject to geopolitical uncertainty.
Failure to adjust our purchases due to changing market conditions or failure to estimate our customers' demand could adversely affect our income.
Our income could be harmed if we are unable to adjust our purchases to market fluctuations, including those caused by the seasonal or cyclical nature of themarkets in which we operate. The sale of our products and services are dependent, to a large degree, on customers whose industries are subject to seasonal orcyclical trends in the demand for their products. For example, the consumer electronics market is particularly volatile, making demand difficult to anticipate.During a market upturn, we may not be able to purchase sufficient supplies or components to meet increasing product demand, which could materially affect ourresults. In the past, we have seen a shortage of parts for some of our products. In addition, some of the parts that require custom design are not readily availablefrom alternate suppliers due to their unique design or the length of time necessary for design work. Should a supplier cease manufacturing such a component, wewould be forced to reengineer our product. In addition to discontinuing parts, suppliers may also extend lead times, limit supplies or increase prices due to capacityconstraints or other factors. In order to secure components for the production of products, we may continue to enter into non-cancellable purchase commitmentswith vendors, or at times make advance payments to suppliers, which could impact our ability to adjust our inventory to declining market demands. Priorcommitments of this type have resulted in an excess of parts when demand for electronic products has decreased. If demand for our products is less than we expect,we may experience additional excess and obsolete inventories and be forced to incur additional charges.
Our operating results may suffer if our manufacturing capacity does not match the demand for our products.
Because we cannot immediately adapt our production capacity and related cost structures to rapidly changing market conditions, when demand does not meetour expectations, our manufacturing capacity will likely exceed our production requirements. If, during a general market upturn or an upturn in our business, wecannot increase our manufacturing capacity to meet product demand, we will not be able to fulfill orders in a timely manner, which could lead to ordercancellations, contract breaches or indemnification obligations. This inability could materially and adversely limit our ability to improve our income, margin andoperating results. By contrast, if, during an economic downturn, we had excess manufacturing capacity, then our fixed costs associated with excess manufacturingcapacity would adversely affect our income, margins and operating results.
Industry consolidation and consolidation among our customer base may lead to increased competition and may harm our operating results.
There is potential for industry consolidation in our markets. As companies attempt to strengthen or hold their market positions in an evolving industry,companies could be acquired or may be unable to continue operations. Companies that are strategic alliance partners in some areas of our business may acquire orform alliances with our competitors, thereby reducing their business with us. We believe that industry consolidation may result in stronger competitors and couldlead to more variability in our operating results and could have a material adverse effect on our business, operating results, and financial condition. Furthermore,particularly in the communications market, rapid consolidation would lead to fewer customers, with the effect that loss of a major customer could have a materialimpact on results not anticipated in a customer marketplace composed of more numerous participants.
Additionally, if there is consolidation among our customer base, our customers may be able to command increased leverage in negotiating prices and otherterms of sale, which could adversely affect our profitability. In addition, if, as a result of increased leverage, customer pressures require us to reduce our pricingsuch that our gross margins are diminished, we could decide not to sell our products under such less favorable terms, which would decrease our revenue.Consolidation among our customer base may also lead to reduced demand for our products, replacement of our products by the combined entity with those of ourcompetitors and cancellations of orders, each of which could harm our operating results.
19

Table of Contents
Economic, political and other risks associated with international sales and operations could adversely affect our results of operations.
Because we sell our products worldwide, our business is subject to risks associated with doing business internationally. We anticipate that revenue frominternational operations will continue to represent a majority of our total revenue. However, there can be no assurances that our international sales will continue atexisting levels or grow in accordance with our effort to increase foreign market penetration. In addition, many of our employees, contract manufacturers, suppliers,job functions and manufacturing facilities are located outside the United States. Accordingly, our future results could be harmed by a variety of factors, includingbut not limited to:
• interruption to transportation flows for delivery of parts to us and finished goods to our customers;• changes in foreign currency exchange rates;• changes in a specific country's or region's political, economic or other conditions;• trade protection measures, sanctions, and import or export licensing requirements or restrictions;• negative consequences from changes in tax laws;• difficulty in staffing and managing widespread operations;• differing labor regulations;• differing protection of intellectual property;• unexpected changes in regulatory requirements; and• volatile political environments or geopolitical turmoil, including regional conflicts, terrorism, and war.
We centralize most of our accounting processes at two locations: India and Malaysia. These processes include general accounting, inventory cost accounting,accounts payable and accounts receivables functions. If conditions change in those countries, it may adversely affect operations, including impairing our ability topay our suppliers. Our results of operations, as well as our liquidity, may be adversely affected and possible delays may occur in reporting financial results.
Additionally, we must comply with complex foreign and U.S. laws and regulations, such as the U.S. Foreign Corrupt Practices Act, the U.K. Bribery Act andother local laws prohibiting corrupt payments to governmental officials, and anti-competition regulations. Violations of these laws and regulations could result infines and penalties, criminal sanctions, restrictions on our business conduct and on our ability to offer our products in one or more countries, and could alsomaterially affect our brand, ability to attract and retain employees, international operations, business and operating results. Although we actively maintain policiesand procedures designed to ensure ongoing compliance with these laws and regulations, there can be no assurance that our employees, contractors or agents willnot violate these policies and procedures.
In addition, although a substantial amount of our products are priced and paid for in U.S. Dollars, many of our products are priced in local currencies and asignificant amount of certain types of expenses, such as payroll, utilities, tax and marketing expenses, are paid in local currencies. Our hedging programs aredesigned to reduce, but not entirely eliminate, within any given 12-month period, the impact of currency exchange rate movements, including those caused bycurrency controls, which could impact our business, operating results and financial condition by resulting in lower revenue or increased expenses. However, forexpenses beyond a 12-month period, our hedging strategy will not mitigate our exchange rate risk. In addition, our currency hedging programs involve third-partyfinancial institutions as counterparties. The weakening or failure of these counterparties may adversely affect our hedging programs and our financial conditionthrough, among other things, a reduction in the number of available counterparties, increasingly unfavorable terms or the failure of counterparties to perform underhedging contracts.
Key customers or large orders may expose us to additional business and legal risks that could have a material adverse impact on our operating results andfinancial condition .
Certain key customers have substantial purchasing power and leverage in negotiating contractual arrangements with us. These customers may demandcontract terms that differ considerably from our standard terms and conditions. Large orders may also include severe contractual liabilities for us if we fail toprovide the quantity and quality of product at the required delivery times. While we attempt to contractually limit our potential liability under such contracts, wemay have to agree to some or all of these types of provisions to secure these orders and to continue to grow our business. Such actions expose us to significantadditional risks, which could result in a material adverse impact on our operating results and financial condition.
Our business will suffer if we are not able to retain and hire key personnel.
Our future success depends partly on the continued service of our key research, engineering, sales, marketing, manufacturing, executive and administrativepersonnel. If we fail to retain and hire a sufficient number of these personnel, we may not be able to maintain or expand our business. The markets in which weoperate are dynamic, and we may need to respond with reorganizations, workforce reductions and site closures from time to time. We believe our pay levels arecompetitive within the regions that we
20

Table of Contents
operate. However, there is also intense competition for certain highly technical specialties in geographic areas in which we operate, and it may become moredifficult to retain key employees.
Any inability to complete acquisitions on acceptable terms could negatively impact our growth rate and financial performance.
Our ability to grow revenues, earnings and cash flow depends in part upon our ability to identify and successfully acquire and integrate businesses atappropriate prices and realize anticipated synergies and business performance. Appropriate targets for acquisition are difficult to identify and complete for a varietyof reasons, including but not limited to, limited due diligence, high valuations, business and intellectual property evaluations, other interested parties, negotiationsof the definitive documentation, satisfaction of closing conditions, the need to obtain antitrust or other regulatory approvals on acceptable terms, and availability offunding. The inability to close appropriate acquisitions on acceptable terms could adversely impact our growth rate, revenue, and financial performance.
Our acquisitions, strategic alliances, joint ventures and divestitures may result in financial results that are different than expected.
In the normal course of business, we may engage in discussions with third parties relating to possible acquisitions, strategic alliances, joint ventures anddivestitures. As a result of such transactions, our financial results may differ from our own or the investment community's expectations in a given fiscal quarter, orover the long term. If market conditions or other factors lead us to change our strategic direction, we may not realize the expected value from such transactions.Further, such transactions often have post-closing arrangements, including, but not limited to, post-closing adjustments, transition services, escrows orindemnifications, the financial results of which can be difficult to predict. In addition, acquisitions and strategic alliances may require us to integrate a differentcompany culture, management team and business infrastructure. We may have difficulty developing, manufacturing and marketing the products of a newlyacquired company in a way that enhances the performance of our businesses or product lines to realize the value from expected synergies. Depending on the sizeand complexity of an acquisition, the successful integration of the entity depends on a variety of factors, including but not limited to:
• the retention of key employees and/or customers;• the management of facilities and employees in different geographic areas; and• the compatibility of our infrastructure, policies and organizations with those of the acquired company.
If we do not realize the expected benefits or synergies of such transactions, our consolidated financial position, results of operations, cash flows and stockprice could be negatively impacted.
In addition, effective internal controls are necessary for us to provide reliable and accurate financial reports and to effectively prevent fraud. We are devotingsignificant resources and time to comply with the internal control over financial reporting requirements of the Sarbanes-Oxley Act of 2002. However, we cannot becertain that these measures will ensure that we design, implement and maintain adequate control over our financial processes and reporting in the future, especiallyin the context of acquisitions of other businesses. Any difficulties in the assimilation of acquired businesses into our control system could harm our operatingresults or cause us to fail to meet our financial reporting obligations. Inferior internal controls could also cause investors to lose confidence in our reportedfinancial information, which could have a negative effect on the trading price of our stock and our access to capital. All of these efforts require varying levels ofmanagement resources, which may divert our attention from other business operations.
We have outstanding debt and may incur other debt in the future, which could adversely affect our financial condition, liquidity and results of operations.
We currently have outstanding debt as well as availability to borrow under a revolving credit facility. We may borrow additional amounts in the future and usethe proceeds from any future borrowing for general corporate purposes, future acquisitions, expansion of our business or repurchases of our outstanding shares ofcommon stock.
Our incurrence of this debt, and increases in our aggregate levels of debt, may adversely affect our operating results and financial condition by, among otherthings:
• requiring a portion of our cash flow from operations to make interest payments on this debt;• increasing our vulnerability to general adverse economic and industry conditions;• reducing the cash flow available to fund capital expenditures and other corporate purposes and to grow our business; and• limiting our flexibility in planning for, or reacting to, changes in our business and the industry.Our current revolving credit facility and term loan imposes restrictions on us, including restrictions on our ability to create liens on our assets and the ability of
our subsidiaries to incur indebtedness, and requires us to maintain compliance with specified financial ratios. Our ability to comply with these ratios may beaffected by events beyond our control. In addition, the indenture governing our senior notes contains covenants that may adversely affect our ability to incur certainliens or engage in certain types
21

Table of Contents
of sale and leaseback transactions. If we breach any of the covenants and do not obtain a waiver from the lenders, then, subject to applicable cure periods, ouroutstanding indebtedness could be declared immediately due and payable.
Environmental contamination from past operations could subject us to unreimbursed costs and could harm on-site operations and the future use and value ofthe properties involved, and environmental contamination caused by ongoing operations could subject us to substantial liabilities in the future.
Some of our properties are undergoing remediation by HP Inc. ("HP") for subsurface contaminations that were known at the time of Agilent's separation fromHP in 1999. In connection with Agilent's separation from HP, HP and Agilent entered into an agreement pursuant to which HP agreed to retain the liability for thissubsurface contamination, perform the required remediation and indemnify Agilent with respect to claims arising out of that contamination. Agilent has assignedits rights and obligations under this agreement to Keysight in respect of facilities transferred to us in the separation. As a result, HP will have access to a limitednumber of our properties to perform remediation. Although HP agreed to minimize interference with on-site operations at such properties, remediation activitiesand subsurface contamination may require us to incur unreimbursed costs and could harm on-site operations and the future use and value of the properties. Inconnection with the separation, Agilent will indemnify us directly for any liabilities related thereto. We cannot be sure that HP will continue to fulfill itsremediation obligations or that Agilent will continue to fulfill its indemnification obligations.
In connection with the separation from Agilent, Agilent also agreed to indemnify us for any liability associated with contamination from past operations at allproperties transferred from Agilent to Keysight. We cannot be sure that Agilent will fulfill its indemnification obligations.
Our current manufacturing processes involve the use of substances regulated under various international, federal, state and local laws governing theenvironment. As a result, we may become subject to liabilities for environmental contamination, and these liabilities may be substantial. Although our policy is toapply strict standards for environmental protection at our sites inside and outside the United States, even if the sites outside the United States are not subject toregulations imposed by foreign governments, we may not be aware of all conditions that could subject us to liability.
We and our customers are subject to various governmental regulations, compliance with which may cause us to incur significant expenses, and if we fail tomaintain satisfactory compliance with certain regulations, we may be forced to recall products and cease their manufacture and distribution, and we could besubject to civil or criminal penalties.
We and our customers are subject to various significant international, federal, state and local regulations, including, but not limited to, health and safety,packaging, product content, labor and import/export regulations. These regulations are complex, change frequently and have tended to become more stringent overtime. We may be required to incur significant expenses to comply with these regulations or to remedy violations of these regulations. Any failure by us to complywith applicable government regulations could also result in cessation of our operations or portions of our operations, product recalls or impositions of fines andrestrictions on our ability to carry on or expand our operations. If demand for our products is adversely affected or our costs increase, our business would suffer.
Our products and operations are also often subject to the rules of industrial standards bodies, like the International Standards Organization, as well asregulation by other agencies such as the U.S. Federal Communications Commission. We also must comply with work safety rules. If we fail to adequately addressany of these regulations, our businesses could be harmed.
Third parties may claim that we are infringing their intellectual property rights, and we could suffer significant litigation or licensing expenses or be preventedfrom selling products or services.
From time to time, third parties may claim that one or more of our products or services infringe their intellectual property rights. We analyze and take actionin response to such claims on a case-by-case basis. Any dispute or litigation regarding patents or other intellectual property could be costly and time-consumingdue to the complexity of our technology and the uncertainty of intellectual property litigation and could divert our management and key personnel from businessoperations. A claim of intellectual property infringement could cause us to enter into a costly or restrictive license agreement (which may not be available underacceptable terms, or at all), require us to redesign certain of our products (which would be costly and time-consuming) and/or subject us to significant damages oran injunction against the development and sale of certain products or services. In certain of our businesses, we rely on third-party intellectual property licenses, andwe cannot ensure that these licenses will be available to us in the future on terms favorable to us or at all.
22

Table of Contents
Third parties may infringe our intellectual property rights, and we may suffer competitive injury or expend significant resources enforcing our intellectualproperty rights.
Our success depends in part on our proprietary technology, including technology we obtained through acquisitions. We rely on various intellectual propertyrights, including patents, copyrights, trademarks and trade secrets, as well as confidentiality provisions and licensing arrangements, to establish our proprietaryrights. If we do not enforce our intellectual property rights successfully, our competitive position may suffer, which could harm our operating results.
Our pending patent, copyright and trademark registration applications may not be allowed or competitors may challenge the validity or scope of our patents,copyrights or trademarks. In addition, our patents, copyrights, trademarks and other intellectual property rights may not provide us with a significant competitiveadvantage. In preparation for the separation and distribution, we have applied for trademarks related to our new global brand name in various jurisdictionsworldwide. Any successful opposition to our applications in material jurisdictions could impose material costs on us or make it more difficult to protect our brand.Different jurisdictions vary widely in the level of protection and priority they give to trademark and other intellectual property rights.
We may be required to spend significant resources monitoring our intellectual property rights, and we may or may not be able to detect infringement of suchrights by third parties. Our competitive position may be harmed if we cannot detect infringement and enforce our intellectual property rights in a timely manner, orat all. In some circumstances, we may choose to not pursue enforcement due to a variety of reasons. In addition, competitors may avoid infringement by designingaround our intellectual property rights or by developing non-infringing competing technologies. Intellectual property rights and our ability to enforce them may beunavailable or limited in some countries, which could make it easier for competitors to capture market share and could result in lost revenues to the company.Furthermore, some of our intellectual property is licensed to others, which allows them to compete with us using that intellectual property.
We are or will be subject to ongoing tax examinations of our tax returns by the IRS and other tax authorities. An adverse outcome of any such audit orexamination by the IRS or other tax authority could have a material adverse effect on our results of operations, financial condition and liquidity.
We are or will be subject to ongoing tax examinations of our tax returns by the IRS and other tax authorities in various jurisdictions. We regularly assess thelikelihood of adverse outcomes resulting from ongoing tax examinations to determine the adequacy of our provision for income taxes. These assessments canrequire considerable estimates and judgments. Intercompany transactions associated with the sale of inventory, services, intellectual property and cost sharingarrangements are complex and affect our tax liabilities. The calculation of our tax liabilities involves uncertainties in the application of complex tax laws andregulations in multiple jurisdictions. The outcomes of any tax examinations could have an adverse effect on our operating results and financial condition. Due tothe complexity of tax contingencies, the ultimate resolution of any tax matters related to operations may result in payments greater or less than amounts accrued.
Our operations may be adversely impacted by changes in our business mix or changes in the tax legislative landscape.
Our effective tax rate may be adversely impacted by, among other things, changes in the mix of our earnings among countries with differing statutory taxrates, changes in the valuation allowance of deferred tax assets, and changes in tax laws. We cannot give any assurance as to what our effective tax rate will be inthe future because, among other things, there is uncertainty regarding the tax policies of the jurisdictions where we operate. Changes in tax laws, such as tax reformin the United States or changes in tax laws resulting from the Organization for Economic Co-operation and Development’s (“OECD”) multi-jurisdictional plan ofaction to address “base erosion and profit shifting” and the taxation of the “Digital Economy” could impact our effective tax rate.
If tax incentives change or cease to be in effect, our income taxes could increase significantly.
We benefit from tax incentives extended to certain of our foreign subsidiaries to encourage investment or employment. Several jurisdictions have granted ustax incentives that require renewal at various times in the future, the most significant being Singapore. We do not expect incentives granted by other jurisdictions tohave a material impact on our financial statements. The Singapore tax incentive requires that specific conditions be satisfied, which include achieving thresholds ofemployment, ownership of certain assets, as well as specific types of investment activities within Singapore. We believe that we will satisfy such conditions in thefuture as needed, but cannot guarantee that such conditions will be satisfied. Our Singapore tax incentive is due for renewal in fiscal 2024, but we cannot guaranteethat Singapore will not revoke the tax incentive earlier.
Singapore announced potential changes to its IP incentive programs in its 2017 budget. Such potential changes could result in a reduction in tax incentive benefitsand an early termination of or changes to our existing Singapore incentive in 2021. No changes have been finalized, and it is unclear to what extent, if at all,changes will be made to the tax incentives or any specific conditions. We cannot guarantee that we will qualify for any new incentive regime or that suchconditions will be satisfied.
23

Table of Contents
Our taxes could increase if the incentives are not renewed upon revocation or expiration. If we cannot or do not wish to satisfy all or portions of the taxincentive conditions, we may lose the related tax incentive and could be required to refund the benefits that the tax incentives previously provided. As a result, oureffective tax rate could be higher than it would have been had we maintained the benefits of the tax incentives and could harm our operating results.
If we suffer a loss to our factories, facilities or distribution system due to a catastrophic event, our operations could be significantly harmed.
Our factories, facilities and distribution system are subject to catastrophic loss due to fire, flood, terrorism or other natural or manmade disasters. In particular,several of our facilities could be subject to a catastrophic loss caused by earthquake or other natural disasters due to their locations. For example, our productionfacilities, headquarters and laboratories in California and our production facilities in Japan are all located in areas with above-average seismic activity. If any ofthese facilities were to experience a catastrophic loss, it could disrupt our operations, delay production, shipments and revenue and result in large expenses to repairor replace the facility. If such a disruption were to occur, we could breach our agreements, our reputation could be harmed and our business and operating resultscould be adversely affected. In addition, since we have consolidated our manufacturing facilities, we are more likely to experience an interruption to our operationsin the event of a catastrophe in any one location. Although we carry insurance for property damage and business interruption, we do not carry insurance orfinancial reserves for interruptions or potential losses arising from earthquakes or terrorism. Also, our third-party insurance coverage will vary from time to time inboth type and amount depending on availability, cost and our decision with respect to risk retention. Economic conditions and uncertainties in global markets mayadversely affect the cost and other terms upon which we are able to obtain third-party insurance. If our third-party insurance coverage is adversely affected, or tothe extent we have elected to self-insure, we may be at a greater risk that our operations will be harmed by a catastrophic loss.
If we experience a significant disruption in, or breach in security of, our information technology systems, our business could be adversely affected.
We rely on several centralized information technology systems to provide products and services, maintain financial records, process orders, manage inventory,process shipments to customers and operate other critical functions. If we experience a prolonged system disruption in the information technology systems thatinvolve our interactions with customers or suppliers, it could result in the loss of sales and customers and significant incremental costs, which could adverselyaffect our business. In addition, our information technology systems may be susceptible to damage, disruptions or shutdowns due to power outages, hardwarefailures, computer viruses, attacks by computer hackers, telecommunication failures, user errors, catastrophes or other unforeseen events. Furthermore, securitybreaches of our information technology systems could result in the misappropriation or unauthorized disclosure of confidential information belonging to thecompany or our employees, partners, customers or suppliers, which could result in significant financial or reputational damage to the company.
Man-made problems such as cybersecurity attacks, computer viruses or terrorism may disrupt our operations and harm our business, reputation and operatingresults
Despite our implementation of network security measures, our network may be vulnerable to cybersecurity attacks, computer viruses, break-ins and similardisruptions. Cybersecurity attacks, in particular, are evolving and include, but are not limited to, malicious software, attempts to gain unauthorized access to data,and other electronic security breaches that could lead to disruptions in systems, unauthorized release of confidential or otherwise protected information andcorruption of data. Any such event could have a material adverse effect on our business, operating results and financial condition.
Our daily business operations require us to retain sensitive data such as intellectual property, proprietary business information and data related to customers,suppliers and business partners within our networking infrastructure. The ongoing maintenance and security of this information is pertinent to the success of ourbusiness operations and our strategic goals, and organizations like Keysight are susceptible to multiple variations of attacks on our networks on a daily basis.
Our networking infrastructure and related assets may be subject to unauthorized access by hackers, employee errors, or other unforeseen activities. Suchissues could result in the disruption of business processes, network degradation and system downtime, along with the potential that a third party will exploit ourcritical assets such as intellectual property, proprietary business information and data related to our customers, suppliers and business partners. To the extent thatsuch disruptions occur, they may cause delays in the manufacture or shipment of our products and the cancellation of customer orders and, as a result, our businessoperating results and financial condition could be materially and adversely affected resulting in a possible loss of business or brand reputation.
In addition, the effects of war or acts of terrorism could have a material adverse effect on our business, operating results and financial condition. Thecontinued threat of terrorism and heightened security and military action in response to this threat, or any future acts of terrorism, may cause further disruption tothe economy and create further uncertainties in the economy. Energy shortages, such as gas or electricity shortages, could have similar negative impacts. To theextent that such disruptions or uncertainties result in delays or cancellations of customer orders or the manufacture or shipment of our products, our business,operating results and financial condition could be materially and adversely affected.
24

Table of Contents
Our business and financial results may be adversely affected by various legal and regulatory proceedings.
We are subject to legal proceedings, lawsuits and other claims in the normal course of business and could become subject to additional claims in the future,some of which could be material. The outcome of existing proceedings, lawsuits and claims may differ from our expectations because the outcomes of litigationare often difficult to reliably predict. Various factors or developments can lead us to change current estimates of liabilities and related insurance receivables whereapplicable, or permit us to make such estimates for matters previously not susceptible to reasonable estimates, such as a significant judicial ruling or judgment, asignificant settlement, significant regulatory developments or changes in applicable law. A future adverse ruling, settlement or unfavorable development couldresult in charges that could adversely affect our business, operating results or financial condition.
We have substantial cash requirements in the United States, although most of our cash is generated outside of the United States. The failure to maintain a levelof cash sufficient to address our cash requirements in the United States could adversely affect our financial condition and results of operations.
Although the cash generated in the United States from our operations, including any cash and non-permanently invested earnings repatriated to the UnitedStates, is expected to cover our normal operating requirements and debt service requirements, a substantial amount of additional cash may be required for specialpurposes such as the maturity of our current and future debt obligations, any dividends that may be declared, any future stock repurchase programs and anyacquisitions. If we encounter a significant need for liquidity domestically that we cannot fulfill through borrowings, equity offerings or other internal or externalsources, the transfer of cash into the United States may incur an overall tax rate higher than our tax rates have been in the past and negatively impact after-taxearnings.
We may need additional financing in the future to meet our capital needs or to make opportunistic acquisitions, and such financing may not be available onterms favorable to us, if at all, and may be dilutive to existing shareholders.
We may need to seek additional financing for our general corporate purposes. For example, we may need to increase our investment in R&D activities or needfunds to make acquisitions. We may be unable to obtain any desired additional financing on terms favorable to us, if at all. If adequate funds are not available onacceptable terms, we may be unable to fund our expansion, successfully develop or enhance products or respond to competitive pressures, any of which couldnegatively affect our business. If we finance acquisitions by issuing additional convertible debt or equity securities, our existing stockholders may experience sharedilution, which could affect the market price of our stock. If we raise additional funds through the issuance of equity securities, our shareholders will experiencedilution of their ownership interest. If we raise additional funds by issuing debt, we may be subject to further limitations on our operations and ability to paydividends due to restrictive covenants.
Adverse conditions in the global banking industry and credit markets may adversely impact the value of our cash investments or impair our liquidity.
Our cash and cash equivalents are invested or held in a mix of money market funds, time deposit accounts and bank demand deposit accounts. Disruptions inthe financial markets may, in some cases, result in an inability to access assets such as money market funds that traditionally have been viewed as highly liquid.Any failure of our counterparty financial institutions or funds in which we have invested may adversely impact our cash and cash equivalent positions and, in turn,our results and financial condition.
Future investment returns on pension assets may be lower than expected or interest rates may decline, requiring us to make significant additional cashcontributions to our future plans.
We sponsor several defined benefit pension plans that cover many of our salaried and hourly employees. The Federal Pension Protection Act of 2006 requiresthat certain capitalization levels be maintained in each of the U.S. plans, and there may be similar funding requirements in the plans outside the United States.Because it is unknown what the investment return on and the fair value of our pension assets will be in future years or what interest rates and discount rates may beat any point in time, no assurances can be given that applicable law will not require us to make future material plan contributions. Any such contributions couldadversely affect our financial condition.
Risks Related to Our Common Stock
Our share price may fluctuate significantly.
Our common stock is listed on NYSE under the ticker symbol “KEYS.” The market price of our common stock may fluctuate widely, depending on manyfactors, some of which may be beyond our control, including but not limited to:
• actual or anticipated fluctuations in our operating results due to factors related to our business;• success or failure of our business strategy;
25

Table of Contents
• our quarterly or annual earnings, or those of other companies in our industry;• our ability to obtain third-party financing as needed;• announcements by us or our competitors of significant acquisitions or dispositions;• changes in accounting standards, policies, guidance, interpretations or principles;• the failure of securities analysts to cover our common stock;• changes in earnings estimates by securities analysts or our ability to meet those estimates;• the operating and share price performance of other comparable companies;• investor perception of our company;• natural or other disasters that investors believe may affect us;• overall market fluctuations;• results from any material litigation or government investigations;• changes in laws or regulations affecting our business; and• general economic conditions and other external factors.
Stock markets in general have experienced volatility that has often been unrelated to the operating performance of a particular company. These broad marketfluctuations could adversely affect the trading price of our common stock.
In addition, when the market price of a company’s shares drops significantly, shareholders often institute securities class action lawsuits against the company.A lawsuit against us could cause us to incur substantial costs and could divert the time and attention of management and other resources.
We do not currently pay dividends on our common stock.
We do not currently pay dividends on our common stock. The payment of any dividends in the future, and the timing and amount thereof, to our stockholdersfall within the discretion of our board of directors. The board's decisions regarding the payment of dividends will depend on many factors, such as our financialcondition, earnings, capital requirements, debt service obligations, restrictive covenants in our debt, industry practice, legal requirements, regulatory constraintsand other factors that the board deems relevant. We cannot guarantee that we will pay a dividend in the future or continue to pay any dividends if we commencepaying dividends.
Certain provisions in our amended and restated certificate of incorporation and bylaws, and of Delaware law, may prevent or delay an acquisition of thecompany, which could decrease the trading price of our common stock.
Our amended and restated certificate of incorporation and amended and restated bylaws contain, and Delaware law contains, provisions that are intended todeter coercive takeover practices and inadequate takeover bids by making such practices or bids unacceptably expensive to the bidder and to encourage prospectiveacquirers to negotiate with our board of directors rather than to attempt a hostile takeover. These provisions include but are not limited to:
• the inability of our shareholders to call a special meeting;• the inability of our shareholders to act without a meeting of shareholders;• rules regarding how shareholders may present proposals or nominate directors for election at shareholder meetings;• the right of our board to issue preferred stock without shareholder approval;• the division of our board of directors into three classes of directors, with each class serving a staggered three-year term, and this classified board provision
could have the effect of making the replacement of incumbent directors more time consuming and difficult;• a provision that shareholders may only remove directors with cause;• the ability of our directors, and not shareholders, to fill vacancies on our board of directors; and• the requirement that the affirmative vote of shareholders holding at least 80% of our voting stock is required to amend certain provisions in our amended
and restated certificate of incorporation (relating to the number, term and removal of our directors, the filling of our board vacancies, the advance notice tobe given for nominations for elections of directors, the calling of special meetings of shareholders, shareholder action by written consent, the ability of theboard of directors to amend the bylaws, elimination of liability of directors to the extent permitted by Delaware law, exclusive forum for certain types ofactions and proceedings that may be initiated by our shareholders and amendments of the certificate of incorporation) and certain provisions in our amendedand restated bylaws (relating to the calling of special meetings of shareholders, the business that may be conducted or considered at annual or specialmeetings, the advance notice of shareholder business and nominations, shareholder action by written consent, the number, tenure, qualifications and removalof our directors, the filling of our board vacancies, director and officer indemnification and amendments of the bylaws).
26

Table of Contents
In addition, because we have not chosen to be exempt from Section 203 of the Delaware General Corporation Law (the "DGCL"), this provision could alsodelay or prevent a change of control that some shareholders may favor. Section 203 provides that, subject to limited exceptions, persons that acquire, or areaffiliated with a person that acquires, more than 15% of the outstanding voting stock of a Delaware corporation (an "interested stockholder") shall not engage inany business combination with that corporation, including by merger, consolidation or acquisitions of additional shares, for a three-year period following the dateon which the person became an interested stockholder, unless (i) prior to such time, the board of directors of such corporation approved either the businesscombination or the transaction that resulted in the stockholder becoming an interested stockholder; (ii) upon consummation of the transaction that resulted in thestockholder becoming an interested stockholder, the interested stockholder owned at least 85% of the voting stock of such corporation at the time the transactioncommenced (excluding for purposes of determining the voting stock outstanding (but not the outstanding voting stock owned by the interested stockholder) thevoting stock owned by directors who are also officers or held in employee benefit plans in which the employees do not have a confidential right to tender or votestock held by the plan); or (iii) on or subsequent to such time the business combination is approved by the board of directors of such corporation and authorized ata meeting of shareholders by the affirmative vote of at least two-thirds of the outstanding voting stock of such corporation not owned by the interested stockholder.
We believe these provisions will protect our shareholders from coercive or otherwise unfair takeover tactics by requiring potential acquirers to negotiate withour board of directors and by providing our board of directors with more time to assess any acquisition proposal. These provisions are not intended to make usimmune from takeovers. However, these provisions will apply even if the offer may be considered beneficial by some shareholders and could delay or prevent anacquisition that our board of directors determines is not in the best interests of the company and our shareholders. These provisions may also prevent or discourageattempts to remove and replace incumbent directors.
Our amended and restated certificate of incorporation designates that the state courts in the State of Delaware or, if no state court located within the State ofDelaware has jurisdiction, the federal court for the District of Delaware, as the sole and exclusive forum for certain types of actions and proceedings that maybe initiated by our shareholders, which could discourage lawsuits against the company and our directors and officers.
Our amended and restated certificate of incorporation provide that unless the board of directors otherwise determines, the state courts in the State of Delawareor, if no state court located within the State of Delaware has jurisdiction, the federal court for the District of Delaware, will be the sole and exclusive forum for anyderivative action or proceeding brought on our behalf, any action asserting a claim of breach of a fiduciary duty owed by any of our directors or officers to thecompany or our shareholders, any action asserting a claim against us or any of our directors or officers arising pursuant to any provision of the DGCL or Keysight'samended and restated certificate of incorporation or bylaws, or any action asserting a claim against us or any of our directors or officers governed by the internalaffairs doctrine. This exclusive forum provision may limit the ability of our shareholders to bring a claim in a judicial forum that such shareholders find favorablefor disputes with us or our directors or officers, which may discourage such lawsuits against us and our directors and officers.
Risks Related to the Acquisition of Ixia
We may not realize all of the anticipated benefits of the Merger or those benefits may take longer to realize than expected. We may also encounter significantunexpected difficulties in integrating the two businesses.
Our ability to realize the anticipated benefits of the Merger will depend, to a large extent, on our ability to integrate our and Ixia’s businesses. The combinationof two independent businesses is a complex, costly and time-consuming process. As a result, we will be required to devote significant management attention andresources to integrating Ixia’s business practices and operations with our existing business practices and operations. The integration process may disrupt thebusinesses and, if implemented ineffectively or if impacted by unforeseen negative economic or market conditions or other factors, we may not realize the fullanticipated benefits of the Merger. Our failure to meet the challenges involved in integrating the two businesses to realize the anticipated benefits of the Mergercould cause an interruption of, or a loss of momentum in, our activities and could adversely affect our results of operations.
In addition, the overall integration of the businesses may result in material unanticipated problems, expenses, liabilities, competitive responses, loss ofcustomer relationships, and diversion of management's attention. The difficulties of combining the operations of the companies include but are not limited to:
• the diversion of management's attention to integration matters;• difficulties in achieving anticipated cost savings, synergies, business opportunities and growth prospects from combining Ixia’s business with our business;• difficulties entering new markets or manufacturing in new geographies where we have no or limited direct prior experience;• difficulties in the integration of operations and systems;• difficulties in the assimilation of employees;
27

Table of Contents
• difficulties in managing the expanded operations of a significantly larger and more complex company;• successfully managing relationships with our strategic partners and supplier and customer base; and• challenges in maintaining existing, and establishing new, business relationships.
Many of these factors will be outside of our control and any one of them could result in increased costs, decreases in the amount of expected revenues anddiversion of management's time and energy, which could materially impact the business, financial condition and our results of operations. In addition, even if theoperations of our business and Ixia’s business are integrated successfully, we may not realize the full benefits of the Merger, including the synergies, cost savingsor sales or growth opportunities that we expect. These benefits may not be achieved within the anticipated time frame, or at all. Furthermore, additionalunanticipated costs may be incurred in the integration of the businesses. All of these factors could decrease or delay the expected accretive effect of the Merger andnegatively impact us. As a result, we cannot be certain that the combination of our and Ixia’s businesses will result in the realization of the full benefits anticipatedfrom the Merger.
Uncertainties associated with the Merger may cause a loss of employees and may otherwise materially adversely affect the future business and operations ofthe combined company.
The combined company’s success after the Merger will depend in part upon the ability of the combined company to retain executive officers and keyemployees. In some of the fields in which we and Ixia operate, there are only a limited number of people in the job market who possess the requisite skills and itmay be increasingly difficult for the combined company to hire personnel over time.
Current and prospective employees of each company may experience uncertainty about their roles with the combined company following the Merger. Inaddition, key employees may depart because of issues relating to the uncertainty and difficulty of integration or a desire not to remain with the combined companyfollowing the Merger. The loss of services of any key personnel or the inability to hire new personnel with the requisite skills could restrict the ability of thecombined company to develop new products or enhance existing products in a timely manner, to sell products to customers or to manage the business of thecombined company effectively. Also, the business, financial condition and results of operations of the combined company could be materially adversely affectedby the loss of any of its key employees, by the failure of any key employee to perform in his or her current position, or by the combined company’s inability toattract and retain skilled employees.
We and Ixia will incur direct and indirect costs as a result of the Merger.
We and Ixia will incur substantial expenses in connection with and as a result of completing the Merger and, over a period of time following the completion ofthe Merger, we further expect to incur substantial expenses in connection with coordinating our businesses, operations, policies and procedures and Ixia’s. Whilewe have assumed that a certain level of transaction expenses will be incurred, factors beyond our control could affect the total amount or the timing of theseexpenses. Many of the expenses that will be incurred, by their nature, are difficult to estimate accurately.
Risks Related to the Separation
We will be subject to continuing contingent liabilities of Agilent following the separation.
After the separation, there are several significant areas where the liabilities of Agilent may become our obligations. For example, under the Internal RevenueCode and the related rules and regulations, each corporation that was a member of the Agilent U.S. consolidated group during a taxable period or portion of ataxable period ending on or before the effective time of the distribution is severally liable for the U.S. federal income tax liability of the entire Agilent U.S.consolidated group for that taxable period. Consequently, if Agilent is unable to pay the consolidated U.S. federal income tax liability for a prior period, we couldbe required to pay the entire amount of such tax, which could be substantial and in excess of the amount allocated to it as agreed between us and Agilent at the timeof separation. Other provisions of federal law establish similar liability for other matters, including laws governing tax-qualified pension plans, as well as othercontingent liabilities.
There could be significant liability if the distribution is determined to be a taxable transaction.
A condition to the distribution is that Agilent received an opinion of Baker & McKenzie LLP, tax counsel to Agilent, regarding the qualification of theseparation and the distribution as a reorganization within the meaning of Sections 355(a) and 368(a)(1)(D) of the Code. The opinion relies on certain facts,assumptions, representations and undertakings from Agilent and Keysight, including those regarding the past and future conduct of the companies' respectivebusinesses and other matters. If any of these facts, assumptions, representations or undertakings are incorrect or not satisfied, Agilent and its shareholders may notbe able to rely on the opinion, and could be subject to significant tax liabilities. Notwithstanding the opinion of tax counsel, the IRS could determine
28

Table of Contents
on audit that the distribution is taxable if it determines that any of these facts, assumptions, representations or undertakings are not correct or have been violated orif it disagrees with the conclusions in the opinion.
If the distribution were determined to be taxable for U.S. federal income tax purposes, Agilent and its shareholders that are subject to U.S. federal income taxcould incur significant U.S. federal income tax liabilities. For example, if the distribution failed to qualify for tax-free treatment, Agilent would for U.S. federalincome tax purposes be treated as if it had sold the Keysight common stock in a taxable sale for its fair market value, and Agilent's shareholders, who are subject toU.S. federal income tax, would be treated as receiving a taxable distribution in an amount equal to the fair market value of the Keysight common stock received inthe distribution. In addition, if the separation and distribution failed to qualify for tax-free treatment under federal, state and local tax law and/or foreign tax law,Agilent and Keysight could each incur significant tax liabilities under U.S. federal, state, local and/or foreign tax law.
Under the agreement between Agilent and Keysight pertaining to tax matters, as finalized at the time of separation, we are generally required to indemnifyAgilent against taxes incurred by Agilent that arise as a result of our taking or failing to take, as the case may be, certain actions that result in the distributionfailing to meet the requirements of a tax-free distribution under Section 355 of the Code. Under the agreement between Agilent and Keysight, as finalized at thetime of separation, we may also be required to indemnify Agilent for other contingent tax liabilities, which could materially adversely affect our financial position.
29

Table of Contents
Item 1B. Unresolved Staff Comments
None.
Item 2. Properties
Our executive offices are located in the United States in an owned facility in Santa Rosa, California. We own or lease a total of approximately 160 operatingfacilities located throughout the world that handle manufacturing production, research and development, administration, assembly, sales, quality, assurance testing,distribution and packaging of our products. These facilities are primarily located in the following countries: China, Germany, India, Japan, Malaysia, Singapore,Spain, Taiwan, United Kingdom and the United States. As of October 31, 2017, we own or lease a total of approximately 6.3 million square feet of spaceworldwide, of which we own approximately 4.2 million square feet and lease 2.1 million square feet. Our sales and support facilities occupy a total ofapproximately 0.6 million square feet. Our manufacturing plants, R&D facilities and warehouse and administrative facilities occupy approximately 5.7 millionsquare feet. All of these facilities are well maintained and suitable for the operations conducted in them.
Item 3. Legal Proceedings
We are involved in lawsuits, claims, investigations and proceedings, including, but not limited to, patent, commercial and environmental matters, which arisein the ordinary course of business. There are no matters pending that we currently believe are reasonably possible of having a material impact to our business,consolidated financial condition, results of operations or cash flows.
Item 4. Mine Safety Disclosures
Not applicable.
30

Table of Contents
PART II
Item 5. Market for the Registrant's Common Equity, Related Stockholder Matters and Issuer Purchases of Equity Securities
Our common stock is listed on the New York Stock Exchange ("NYSE") with the ticker symbol "KEYS.’’ The following table sets forth the high and low saleprices per quarter for the fiscal years 2017 and 2016 as reported in the consolidated transaction reporting system for the New York Stock Exchange:
Fiscal 2017 High Low Dividends
First Quarter (ended January 31, 2017) $ 38.28 $ 31.81 —Second Quarter (ended April 30, 2017) $ 39.36 $ 35.05 —Third Quarter (ended July 31, 2017) $ 42.98 $ 35.62 —Fourth Quarter (ended October 31, 2017) $ 44.79 $ 39.21 — Fiscal 2016 High Low Dividends
First Quarter (ended January 31, 2016) $ 33.48 $ 22.15 —Second Quarter (ended April 30, 2016) $ 28.39 $ 21.07 —Third Quarter (ended July 31, 2016) $ 31.87 $ 25.49 —Fourth Quarter (ended October 31, 2016) $ 33.14 $ 26.87 —
There were 23,622 shareholders of record of Keysight common stock as of December 15, 2017.
We have not paid any dividends, and we do not anticipate paying any cash dividends in the foreseeable future. All decisions regarding the declaration andpayment of dividends and repurchase stock are at the discretion of our Board of Directors and will be evaluated regularly in light of our financial condition,earnings, growth prospects, funding requirements, applicable law, and any other factors that our Board deems relevant.
The information required by this item with respect to equity compensation plans will be included under the caption Equity Compensation Plans in our proxystatement for the 2018 annual meeting of stockholders, to be filed with the Securities and Exchange Commission pursuant to Regulation 14A, and is incorporatedherein by reference.
ISSUER PURCHASES OF EQUITY SECURITIES
The table below summarizes information about the company’s purchases, based on trade date; of its equity securities registered pursuant to Section 12 of theExchange Act during the quarterly period ended October 31, 2017. The total number of shares of common stock purchased by the company during the fiscal yearended October 31, 2017 is 2,288,516 shares.
Period
Total Number ofShares of CommonStock Purchased (1)
Weighted AveragePrice Paid per Share of
Common Stock (2)
Total Number ofShares of CommonStock Purchased asPart of Publicly
Announced Plans orPrograms (1)
MaximumApproximate DollarValue of Shares ofCommon Stock that
May Yet BePurchased Under the
Program (1)
August 1, 2017 through August 31, 2017 — N/A — $ 138,515,618September 1, 2017 through September 30,2017 — N/A — $ 138,515,618October 1, 2017 through October 31, 2017 — N/A — $ 138,515,618
Total — N/A —
(1) On February 18, 2016, the Board of Directors approved a stock repurchase program authorizing the purchase of up to $200 million of the company’scommon stock. Under the program, shares may be purchased from time to time, subject to general business and market conditions and other investmentopportunities, through open market purchases, privately negotiated transactions or other means. The stock repurchase program may be commenced,suspended or discontinued at any time at the company’s discretion and does not have an expiration date. All such shares and related costs are held astreasury stock and accounted for using the cost method.
(2) The weighted average price paid per share of common stock does not include the cost of commissions.
31

Table of Contents
Item 6. Selected Financial Data (Unaudited)
The following table presents the selected combined and consolidated financial data, which should be read in conjunction with our consolidated financialstatements and related notes and Management's Discussion and Analysis of Financial Condition and Results of Operations included elsewhere in this Form 10-K.We derived the selected financial data as of October 31, 2017 and for each of the fiscal years in the three-year period ended October 31, 2017 from our auditedconsolidated financial statements included elsewhere in this Form 10-K. We derived the selected financial data as of October 31, 2013 from audited combinedfinancial statements that are not included in this Form 10-K.
Our historical combined and consolidated financial statements before November 1, 2014 include certain expenses of Agilent that were allocated to us forcertain functions, including general corporate expenses related to information technology, research and development, finance, legal, insurance, compliance andhuman resources activities. These costs may not be representative of the costs we have incurred or will incur as an independent public company. The historicalfinancial information included here may not necessarily reflect our financial position and results of operations or what our financial position and results ofoperations would have been had we been an independent, publicly-traded company during the historical periods presented or be indicative of our futureperformance as an independent company.
Years Ended October 31,
2017 2016 2015 2014 2013 (in millions, except per share data)Combined and Consolidated Statement of Operations Data: Net revenue $ 3,189 $ 2,918 $ 2,856 $ 2,933 $ 2,888Income before taxes $ 179 $ 366 $ 388 $ 475 $ 501Net income $ 102 $ 335 $ 513 $ 392 $ 457Net income per share (a)
Basic $ 0.57 $ 1.97 $ 3.04 $ 2.35 $ 2.74Diluted $ 0.56 $ 1.95 $ 3.00 $ 2.35 $ 2.74
Weighted average shares used in computing net income per share (a) Basic 180 170 169 167 167Diluted 182 172 171 167 167
(a) On November 1, 2014, Agilent Technologies, Inc. distributed 167 million shares of Keysight common stock to existing holders of Agilent common stock. Basicand diluted net income per share for all periods through October 31, 2014 is calculated using the shares distributed on November 1, 2014. Refer to Note 6 of theconsolidated financial statements for information regarding earnings per common share.
October 31,
2017 2016 2015 2014 2013 (in millions)Combined and Consolidated Balance Sheet Data: Cash and cash equivalents and short-term investments $ 818 $ 783 $ 483 $ 810 $ —Working capital $ 1,358 $ 1,210 $ 893 $ 1,081 $ 412Total assets $ 5,933 $ 3,796 $ 3,501 $ 3,041 $ 2,028Long-term debt $ 2,038 $ 1,093 $ 1,092 $ 1,090 $ —Stockholders'/Invested equity $ 2,310 $ 1,513 $ 1,302 $ 769 $ 1,245
32

Table of Contents
Item 7. Management's Discussion and Analysis of Financial Condition and Results of Operations
You should read the following discussion in conjunction with the consolidated financial statements and notes thereto included elsewhere in this Annual Reporton Form 10-K. This Management's Discussion and Analysis of Financial Condition and Results of Operations contains forward-looking statements. The forward-looking statements contained herein include, without limitation, statements regarding trends, seasonality, cyclicality and growth in, and drivers of, the markets wesell into, our strategic direction, our future effective tax rate and tax valuation allowance, earnings from our foreign subsidiaries, remediation activities, newproduct and service introductions, the ability of our products to meet market needs, changes to our manufacturing processes, the use of contract manufacturers, theimpact of local government regulations on our ability to pay vendors or conduct operations, our liquidity position, our ability to generate cash from operations,growth in our businesses, our investments, the potential impact of adopting new accounting pronouncements, our financial results, our purchase commitments, ourcontributions to our pension plans, the selection of discount rates and recognition of any gains or losses for our benefit plans, our cost-control activities, savingsand headcount reduction recognized from our restructuring programs and other cost saving initiatives, and other regulatory approvals, the integration of ouracquisitions and other transactions, our transition to lower-cost regions, the existence of economic instability, and our and the combined group's estimated oranticipated future results of operations, that involve risks and uncertainties. Our actual results could differ materially from the results contemplated by theseforward-looking statements due to various factors, including those discussed in Item 1A and elsewhere in this Form 10-K.
Overview and Executive Summary
Keysight Technologies, Inc. ("we," "us," "Keysight" or the "company") incorporated in Delaware on December 6, 2013 and became an independent publicly-traded company following the separation from Agilent Technologies, Inc. ("Agilent") on November 1, 2014. We are a measurement company providing electronictest and design solutions to communications and electronics industries. Following the acquisition of Ixia, we also provide testing, visibility, and security solutions,strengthening applications across physical and virtual networks for enterprises, service providers, and network equipment manufacturers.
We provide electronic design and test instrumentation systems and related software, software design tools, and services that are used in the design,development, manufacture, installation, deployment, validation, optimization and secure operation of electronics systems. Related services include start-upassistance, instrument productivity, application services and instrument calibration and repair. We also offer customization, consulting and optimization servicesthroughout the customer's product lifecycle.
We invest in product development to address the changing needs of the market and facilitate growth. We are investing in research and development to designmeasurement solutions that will satisfy the changing needs of our customers. These opportunities are being driven by evolving technology standards and the needfor faster data rates and new form factors.
In fiscal year 2016, we completed an organizational change to align our organization with the industries we serve which resulted in three reportable operatingsegments: Communications Solutions Group, Electronic Industrial Solutions Group and Services Solutions Group. The Communications Solutions Group servescustomers spanning the worldwide commercial communications end market, which includes internet infrastructure, and the aerospace, defense and government endmarket. The Electronic Industrial Solutions Group provides test and measurement solutions across a broad set of electronic industrial end markets. The ServicesSolutions Group provides repair, calibration and consulting services, and remarkets used Keysight equipment. On April 18, 2017, we completed the acquisition ofIxia, which became our fourth reportable segment, the Ixia Solutions Group (“ISG”). The group provides testing, visibility and security solutions, strengtheningapplications across physical and virtual networks for enterprises, service providers and network equipment manufacturers. In addition, our global team of expertsprovides startup assistance, consulting, optimization and application support across all of our end markets.
Years ended October 31, 2017, 2016 and 2015
Keysight’s total orders in 2017 were $3,406 million, an increase of 15 percent when compared to 2016. Foreign currency movements had a negligible impacton the year-over-year comparison. Orders associated with acquisitions accounted for 9 percentage points of order growth for the year ended October 31, 2017when compared to 2016. Total orders in 2016 were $2,953 million, an increase of 3 percent when compared to 2015. Foreign currency movements had anunfavorable impact of 1 percent on the year-over-year comparison. Orders associated with acquisitions accounted for 5 percentage points of order growth for theyear ended October 31, 2016 when compared to 2015.
Net revenue of $3,189 million for the year ended October 31, 2017 increased 9 percent when compared to 2016. Foreign currency movements had a negligibleimpact on the year-over-year comparison. Revenue associated with acquisitions accounted for 7 percentage points of revenue growth for the year endedOctober 31, 2017 when compared to 2016. Excluding acquisitions, revenue grew year-over-year with growth in the Electronic Industrial Solutions Group, drivenby semiconductor measurement and automotive and energy markets and growth in the Services Solutions Group. The Communications Solution Group revenuewas
33

Table of Contents
flat as gains in the commercial communications market were offset by declines in the aerospace, defense and government market. Net revenue of $2,918 million in2016 increased 2 percent when compared to 2015. Foreign currency movements had no impact on the year-over-year comparison. The revenue increase associatedwith acquisitions accounted for approximately 5 percentage points for the year ended October 31, 2016 when compared to 2015. Excluding acquisitions, revenuedeclined year-over-year as weakness in the smartphone supply chain and restructuring and consolidation activities in the industry offset strength in 5G technologiesand data center expansion.
Net income was $102 million in 2017 compared to net income of $335 million and $513 million in 2016 and 2015, respectively. In 2017, 2016 and 2015, wegenerated operating cash flows of $313 million, $416 million and $376 million, respectively. The decline in net income for the year ended October 31, 2017 isprimarily driven by the unfavorable impact from amortization of acquisition-related balances.
In fiscal 2015, we initiated a phased program associated with our separation from Agilent to resize and optimize our infrastructure from the one that had beenestablished to serve a diversified technology company. The focus of the first phase of the program was on the IT infrastructure to support finance, sales and humanresources. The second phase of the program, which was initiated in the third quarter of fiscal 2016, primarily addressed the optimization of the IT infrastructure tosupport the services business. We recognized costs related to this program of $20 million, $24 million and $20 million in the years ended October 31, 2017, 2016and 2015, respectively. We expect to recognize additional costs estimated to range from $2 million to $3 million through fiscal 2018.
Impact of Northern California Wildfires
During the week of October 8, 2017, wildfires in northern California adversely impacted the Keysight corporate headquarters site in Santa Rosa, CA. Ourheadquarters was under mandatory evacuation for more than three weeks, and while direct damage to our core facilities was limited, our buildings did experiencesome smoke and other fire-related impacts. Cleaning and additional restoration efforts are ongoing in both production and non-production areas of the site. Toensure business continuity, the company has leased temporary office space that will support Santa Rosa employees who are not immediately re-occupying the site.Keysight is insured for the damage caused by the fire, including business interruption insurance, and though we do not expect the fire to have a net impact on ourbusiness results, the disruption will impact the seasonality of revenue in the first half of fiscal 2018.
For the three and twelve months ended October 31, 2017, we recognized costs of $16 million, net of $2 million of estimated insurance recovery, including thewrite-off of damaged fixed assets, unabsorbed overhead costs, cleaning and other direct costs related to the impact of this event.
As we are still in the investigation phase, we have only recognized an insurance receivable for known losses for which we believe insurance reimbursement isprobable in excess of our self-insured retention amount of $10 million. In many cases, our insurance coverage exceeds the amount of these covered losses, but nogain contingencies have been recognized as our ability to realize those gains remains uncertain for financial reporting purposes. We currently estimate that totallosses and expenses related to the fire will range from $80 million to $110 million, primarily including cleaning and recovery costs, and believe that the expenseswill be recoverable under our insurance policy. There may be a difference in timing of costs incurred and the related insurance reimbursement.
Outlook
Looking forward, we believe our increased investments in R&D combined with our completed acquisitions, which have expanded of our technology portfolioand the size of our addressable market, positions Keysight for growth. We remain focused on delivering value through innovative solutions targeted at fastergrowing markets where customers are investing in next-generation digital and electronic technologies. Internally, we are continuously working to improveoperational efficiency within, and across, all functions.
34

Table of Contents
Currency Exchange Rate Exposure
Our revenues, costs and expenses, and monetary assets and liabilities are exposed to changes in foreign currency exchange rates as a result of our globaloperating and financing activities. We hedge revenues, expenses and balance sheet exposures that are not denominated in the functional currencies of oursubsidiaries on a short-term and anticipated basis. The result of the hedging has been included in our consolidated statement of operations. We experience somefluctuations within individual lines of the consolidated balance sheet and consolidated statement of operations because our hedging program is not designed tooffset the currency movements in each category of revenues, expenses, monetary assets and liabilities. Our hedging program is designed to hedge currencymovements on a relatively short-term basis of up to a rolling twelve-month period. Therefore, we are exposed to currency fluctuations over the longer term. To theextent that we are required to pay for all, or portions, of an acquisition price in foreign currencies, we may enter into foreign exchange contracts to reduce the riskthat currency movements will impact the U.S. dollar cost of the transaction.
35

Table of Contents
Results from Operations-Years ended October 31, 2017, 2016 and 2015
Orders and Net Revenue
In general, recorded orders represent firm purchase commitments from our customers with established terms and conditions for products and services that willbe delivered within six months. Consistent with our strategy, we are seeing an increase in solution sales, which have a longer order-to-revenue conversion cycle;however, the majority of recorded orders will be delivered within six months.
Revenue reflects the delivery and acceptance of the products and services as defined on the customer’s terms and conditions. Cancellations are recorded in theperiod received from the customer and historically have not been material.
Year Ended October 31, 2017 over 2016 % Change
2016 over 2015 % Change 2017 2016 2015
(in millions) Orders $ 3,406 $ 2,953 $ 2,853 15% 3%
Net revenue: Products $ 2,664 $ 2,440 $ 2,408 9% 1%Services and other 525 478 448 10% 7%
Total net revenue $ 3,189 $ 2,918 $ 2,856 9% 2%
Year Ended October 31, 2017 over 2016 % Change
2016 over 2015 % Change 2017 2016 2015
% of total net revenue: Products 84% 84% 84% — —Services and other 16% 16% 16% — —
Total 100% 100% 100%
Orders
Total orders for the year ended October 31, 2017 were $3,406 million, an increase of 15 percent when compared to 2016. Foreign currency movements had anegligible impact on the year-over-year comparison. Orders associated with acquisitions accounted for 9 percentage points of order growth for the year endedOctober 31, 2017 when compared to 2016. Orders grew across all operating segments with growth in all regions. Total orders for the year ended October 31, 2016were $2,953 million, an increase of 3 percent when compared to 2015. Foreign currency movements had an unfavorable impact of 1 percentage point on the year-over-year compare. Orders associated with acquisitions accounted for 5 percentage points of order growth for the year ended October 31, 2016 when compared to2015. Orders grew across all operating segments with growth in all regions.
Net Revenue
The following table provides the percent change in revenue for the years ended October 31, 2017 and 2016 by geographic region, including and excluding theimpact of currency changes, as compared to the respective prior year.
Year over Year % Change
2017 over 2016 2016 over 2015
Geographic Region actual currencyadjusted actual
currencyadjusted
Americas 11% 11% —% 1 %Europe 6% 7% 3% 5 %Japan 5% 6% 5% (1)%Asia Pacific ex-Japan 11% 11% 3% 4 %
Total revenue 9% 10% 2% 2 %
Net revenue of $3,189 million for the year ended October 31, 2017 increased 9 percent when compared to 2016. Foreign currency movements had a negligibleimpact on the year-over-year comparison. Revenue associated with acquisitions accounted for 7 percentage points of revenue growth for the year endedOctober 31, 2017 when compared to 2016. Net revenue of $2,918 million for the year ended October 31, 2016 increased 2 percent when compared to 2015.Foreign currency movements
36

Table of Contents
had a negligible impact on the year-over-year comparison. Revenue associated with acquisitions accounted for 5 percentage points of revenue growth for the yearended October 31, 2016 when compared to 2015.
Revenue from the Communications Solutions Group represented approximately 54 percent of total revenue in 2017 and was flat when compared to 2016. TheCommunications Solutions Group contribution to total revenue growth was negligible in 2017, with growth in Japan and Asia Pacific excluding Japan offset bydeclines in the Americas and Europe when compared to 2016. The Communications Solutions Group revenue remained flat as strength in 5G technologies and datacenter technologies was offset by decline in the aerospace, defense and government market. In 2016, the Communications Solutions Group representedapproximately 60 percent of total revenue and increased 3 percent when compared to 2015. The Communications Solutions Group contributed 1 percentage pointto total revenue growth in 2016, with growth in Europe, Japan and Asia Pacific excluding Japan, while the Americas revenue was flat when compared to 2015.Excluding revenue from Anite, the Communications Solutions Group revenue declined year-over-year as weakness in the smartphone supply chain andrestructuring and consolidation activities in the industry offset strength in 5G technologies and data center expansion.
Revenue from the Electronic Industrial Solutions Group represented approximately 27 percent of total revenue in 2017 and grew 8 percent year-over-yearwhen compared to the same period last year, driven by strong growth in semiconductor measurement and automotive and energy markets. The Electronic IndustrialSolutions Group contributed 2 percentage points to total revenue growth in 2017, with growth in Asia Pacific excluding Japan and Europe, partially offset bydeclines in Japan, while revenue from the Americas remained flat. Revenue from the Electronic Industrial Solutions Group represented approximately 26 percentof total revenue in 2016 and grew 2 percent year-over-year when compared to the same period last year. The Electronic Industrial Solutions Group contributed 1percentage point to total revenue growth in 2016, with growth in Asia Pacific excluding Japan and Japan, partially offset by declines in Europe and the Americas.
Revenue from the Ixia Solutions Group represented approximately 6 percent of total revenue in 2017. Revenue from the Ixia Solutions Group contributed 7percentage points to total revenue growth in 2017.
Revenue from the Services Solutions Group represented approximately 13 percent of total revenue in 2017 and grew 4 percent when compared year-over-year.The Services Solutions Group contribution to the total revenue growth was negligible in 2017, with growth in all regions. Revenue from the Services SolutionsGroup represented approximately 14 percent of total revenue in 2016 and was flat when compared year-over-year. The Services Solutions Group contribution tototal revenue growth was negligible in 2016, with growth in the Americas and Japan, partially offset by decline in Asia Pacific excluding Japan, while Europe wasflat.
Backlog
Backlog represents the amount of revenue expected from orders that have already been booked, including orders for goods and services that have not beendelivered to customers, orders invoiced but not yet recognized as revenue, and orders for goods that were shipped but not invoiced, awaiting acceptance bycustomers.
At October 31, 2017, our unfilled backlog was approximately $950 million as compared to approximately $807 million at October 31, 2016. Consistent withour strategy, we are seeing an increase in solution sales, which have a longer order-to-revenue conversion cycle; however, we expect that a majority of the unfilledbacklog will be recognized as revenue within six months. We believe backlog on any particular date, while indicative of short-term revenue performance, is notnecessarily a reliable indicator of medium or long-term revenue performance.
37

Table of Contents
Costs and Expenses
Year Ended October 31, 2017 over 2016 % Change
2016 over 2015 % Change 2017 2016 2015
Gross margin on products 54.7% 57.3% 57.4% (3) ppts — pptGross margin on services and other 46.5% 47.4% 45.6% (1) ppts 2 pptsTotal gross margin 53.4% 55.7% 55.6% (2) ppts — pptOperating margin 7.5% 13.9% 15.1% (6) ppts (1) ppt
(in millions) Research and development $ 498 $ 425 $ 387 17% 10%Selling, general and administrative $ 1,049 $ 818 $ 787 28% 4%Other operating expense (income), net $ (84) $ (25) $ (18) 237% 37%
Gross margin declined 2 percentage points in 2017 compared to 2016, primarily driven by the unfavorable impacts from amortization of acquisition-relatedassets, fire-related costs at our corporate headquarters, an increase in people-related costs and an increase in warranty expense due to a lower compare as a result ofa one-time reduction in the standard warranty accrual during the three months ended July 31, 2016. Gross margin remained flat in 2016 compared to 2015 as thefavorable impacts from a higher percentage of revenue from software and R&D solutions, lower inventory and warranty charges were offset by unfavorableimpacts from acquisition-related intangible amortization.
Excess and obsolete inventory charges were $16 million in 2017, $17 million in 2016 and $28 million in 2015. Sales of previously written-down inventorywere $1 million in 2017, $2 million in 2016 and $2 million in 2015.
Research and development expense increased 17 percent in 2017 compared to 2016 primarily driven by the addition of Ixia to the cost structure, an increase inpeople-related costs, acquisition-related compensation costs and our continued investment in research and development programs. As a percentage of total revenue,research and development expenses increased 1 percentage point to 16 percent in 2017 from 15 percent in 2016. Research and development expense increased 10percent in 2016 compared to 2015 due to increased expenses associated with acquired companies and our continued investment in research and developmentprograms. As a percentage of total revenue, research and development expenses increased 1 percentage point to 15 percent in 2016 from 14 percent in 2015. Weexpect investment in research and development to continue at current levels and have focused our development efforts on strategic growth opportunities.
Selling, general and administrative expenses increased 28 percent for 2017, compared to the same period last year, primarily driven by the addition of Ixia toour cost structure, increases in amortization of acquisition-related assets, acquisition and integration costs, acquisition-related compensation costs, investments insales resources, people-related costs and the unfavorable impact from fire-related costs at our corporate headquarters and restructuring-related costs. Selling,general and administrative expenses increased 4 percent for 2016, compared to the same period last year, primarily driven by increased expenses associated withacquired companies, higher field selling costs, higher intangible amortization and higher separation-related costs, partially offset by the favorable impact fromforeign currency movements and lower share-based compensation expense.
Other operating expense (income), net for 2017 was income of $84 million, which primarily includes a $68 million gain from a settlement related to our Japanpension fund and rental income. Other operating expense (income), net for 2016 was income of $25 million, which primarily includes rental income.
Operating margin decreased 6 percentage points in 2017 when compared to 2016, primarily driven by increases in amortization of acquisition-related assets,acquisition and integration costs, investments in sales resources and people-related costs, partially offset by favorable impact from higher revenue and revenuemix. Operating margin decreased 1 percentage point in 2016 when compared to 2015, primarily driven by the impacts of acquisition-related intangibleamortization, higher integration costs and the addition of the Anite cost structure, partially offset by favorable impacts from foreign currency movements and lowershare-based compensation expense.
As of October 31, 2017, our headcount was approximately 12,600 compared to 10,300 in 2016. The increase is primarily driven by acquisition of Ixia.
38

Table of Contents
Interest Expense
Interest expense for the year ended October 31, 2017 and 2016 was $80 million and $47 million, respectively, and relates to interest on our senior notes issuedin October 2014 and April 2017. The increase in interest expense for the year ended October 31, 2017 is primarily due to costs related to a bridge loan facility thatexpired in April, interest expense and amortization of debt issuance costs on $700 million of senior notes issued in April 2017, and new borrowings under a seniorunsecured term loan and revolving credit facility. The new debt issuances provided partial funding for the acquisition of Ixia.
Income Taxes
Year Ended October 31,
2017 2016 2015 (in millions)Provision (benefit) for income taxes $ 77 $ 31 $ (125)
For 2017, the effective tax rate was 43 percent, which is higher than the U.S. statutory rate primarily due to the payment of a prior year Malaysia taxassessment of $68 million, including tax and penalties, which we are currently in the process of appealing to the Special Commissioners of Income Tax (“SCIT”)in Malaysia.
For 2016, the effective tax rate was 8 percent, which is lower than the U.S. statutory rate primarily due to a higher percentage of earnings in the non-U.S.jurisdictions taxed at lower statutory tax rates. Also, the tax rate was lower than the U.S. statutory rate due to the net tax benefit of $45 million resulting from therepatriation of earnings from Japan, which includes a U.S. tax expense of $27 million offset by $72 million of foreign tax credits recorded in connection with therepatriation.
For 2015, the effective tax rate was a benefit of 32 percent, which is lower than the U.S. statutory rate primarily due to the retroactive benefit of two taxincentives in Singapore approved during 2015. Also, the tax rate was lower than the U.S. statutory rate due to a higher percentage of earnings in the non-U.S.jurisdictions taxed at lower statutory tax rates.
We benefit from tax incentives in several different jurisdictions, most significantly in Singapore, and several jurisdictions have granted tax incentives thatrequire renewal at various times in the future. The tax incentives provide lower rates of taxation on certain classes of income and require various thresholds ofinvestment and employment or specific types of income in those jurisdictions. The tax incentives are due for renewal between 2024 and 2025. The impact of thetax incentives decreased income taxes by $49 million, $34 million and $250 million in 2017, 2016, and 2015, respectively.
In accordance with the guidance on the accounting for uncertainty in income taxes, for all U.S. and other tax jurisdictions, we recognize potential liabilities foranticipated tax audit issues based on our estimate of whether, and the extent to which, additional taxes and interest will be due. If our estimate of income taxliabilities proves to be less than the ultimate assessment, a further charge to expense would be required. If events occur and the payment of these amountsultimately proves to be unnecessary, the reversal of the liabilities would result in tax benefits being recognized in the period when we determine the liabilities areno longer necessary. We include interest and penalties related to unrecognized tax benefits within the provision for income taxes in the consolidated statements ofoperations. Accrued interest and penalties are included on the related tax liability line in the consolidated balance sheet.
For the majority of our entities, the open tax years for the IRS, state and most foreign audit authorities are from August 1, 2014 through the current tax year.For certain foreign entities, the tax years generally remain open, at most, back to the year 2007. Given the number of years and numerous matters that remainsubject to examination in various tax jurisdictions, we are unable to estimate the range of possible changes to the balance of our unrecognized tax benefits.
The company is being audited in Malaysia for the 2008 tax year. Although this tax year pre-dates our spin-off from Agilent, pursuant to the agreementbetween Agilent and Keysight pertaining to tax matters, as finalized at the time of separation, for certain entities including Malaysia, any historical tax liability isthe responsibility of Keysight. In the fourth quarter of this year, Keysight paid income taxes and penalties of $68 million on gains related to intellectual propertyrights, although we are currently in the process of appealing to the Special Commissioners of Income Tax (“SCIT”) in Malaysia. The company believes there arenumerous defenses to the current assessment; the statute of limitations for the 2008 tax year in Malaysia is closed and the income in question is exempt from tax inMalaysia. The company is disputing this assessment and pursuing all avenues to resolve this issue favorably for the company.
On December 15, 2017, the conference committee comprised of representatives of both the U.S. House of Representatives and the U.S. Senate approvedproposed U.S. tax reform legislation entitled Tax Cuts and Jobs Act. The Tax Cuts and Jobs Act will become law if passed by both the U.S. House ofRepresentatives and the U.S. Senate and signed by the U.S. President. If this tax
39
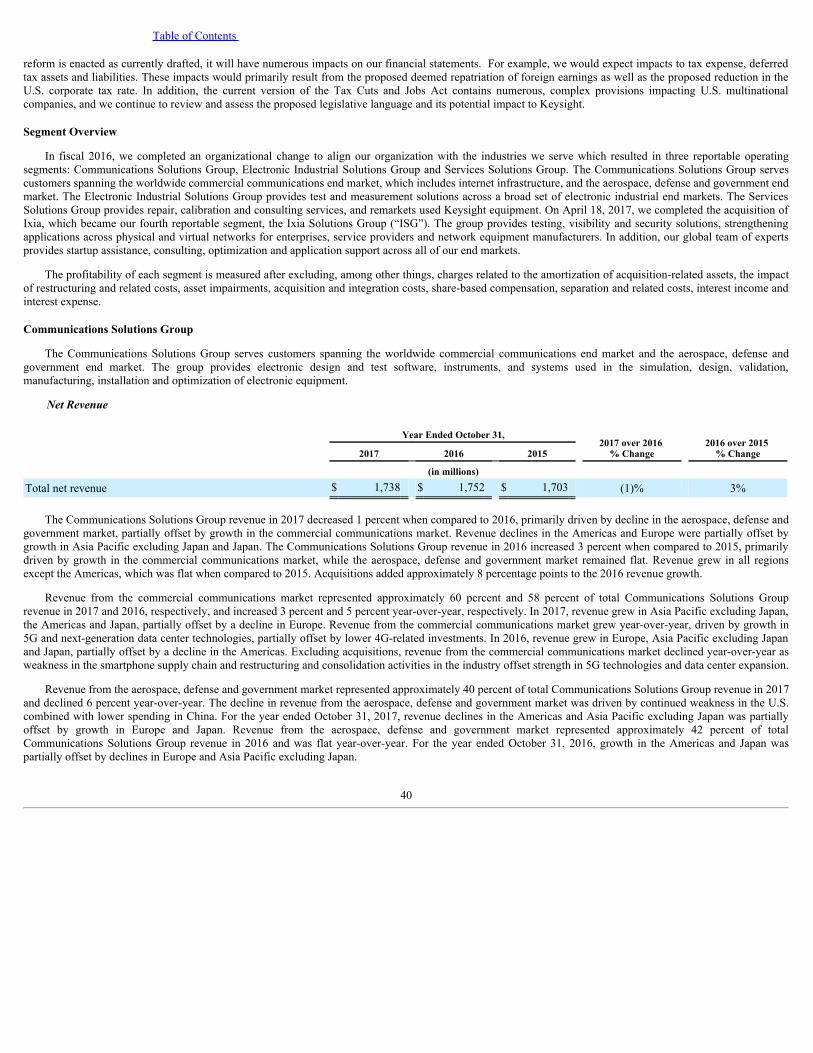
Table of Contents
reform is enacted as currently drafted, it will have numerous impacts on our financial statements. For example, we would expect impacts to tax expense, deferredtax assets and liabilities. These impacts would primarily result from the proposed deemed repatriation of foreign earnings as well as the proposed reduction in theU.S. corporate tax rate. In addition, the current version of the Tax Cuts and Jobs Act contains numerous, complex provisions impacting U.S. multinationalcompanies, and we continue to review and assess the proposed legislative language and its potential impact to Keysight.
Segment Overview
In fiscal 2016, we completed an organizational change to align our organization with the industries we serve which resulted in three reportable operatingsegments: Communications Solutions Group, Electronic Industrial Solutions Group and Services Solutions Group. The Communications Solutions Group servescustomers spanning the worldwide commercial communications end market, which includes internet infrastructure, and the aerospace, defense and government endmarket. The Electronic Industrial Solutions Group provides test and measurement solutions across a broad set of electronic industrial end markets. The ServicesSolutions Group provides repair, calibration and consulting services, and remarkets used Keysight equipment. On April 18, 2017, we completed the acquisition ofIxia, which became our fourth reportable segment, the Ixia Solutions Group (“ISG”). The group provides testing, visibility and security solutions, strengtheningapplications across physical and virtual networks for enterprises, service providers and network equipment manufacturers. In addition, our global team of expertsprovides startup assistance, consulting, optimization and application support across all of our end markets.
The profitability of each segment is measured after excluding, among other things, charges related to the amortization of acquisition-related assets, the impactof restructuring and related costs, asset impairments, acquisition and integration costs, share-based compensation, separation and related costs, interest income andinterest expense.
Communications Solutions Group
The Communications Solutions Group serves customers spanning the worldwide commercial communications end market and the aerospace, defense andgovernment end market. The group provides electronic design and test software, instruments, and systems used in the simulation, design, validation,manufacturing, installation and optimization of electronic equipment.
Net Revenue
Year Ended October 31, 2017 over 2016 % Change
2016 over 2015 % Change 2017 2016 2015
(in millions) Total net revenue $ 1,738 $ 1,752 $ 1,703 (1)% 3%
The Communications Solutions Group revenue in 2017 decreased 1 percent when compared to 2016, primarily driven by decline in the aerospace, defense andgovernment market, partially offset by growth in the commercial communications market. Revenue declines in the Americas and Europe were partially offset bygrowth in Asia Pacific excluding Japan and Japan. The Communications Solutions Group revenue in 2016 increased 3 percent when compared to 2015, primarilydriven by growth in the commercial communications market, while the aerospace, defense and government market remained flat. Revenue grew in all regionsexcept the Americas, which was flat when compared to 2015. Acquisitions added approximately 8 percentage points to the 2016 revenue growth.
Revenue from the commercial communications market represented approximately 60 percent and 58 percent of total Communications Solutions Grouprevenue in 2017 and 2016, respectively, and increased 3 percent and 5 percent year-over-year, respectively. In 2017, revenue grew in Asia Pacific excluding Japan,the Americas and Japan, partially offset by a decline in Europe. Revenue from the commercial communications market grew year-over-year, driven by growth in5G and next-generation data center technologies, partially offset by lower 4G-related investments. In 2016, revenue grew in Europe, Asia Pacific excluding Japanand Japan, partially offset by a decline in the Americas. Excluding acquisitions, revenue from the commercial communications market declined year-over-year asweakness in the smartphone supply chain and restructuring and consolidation activities in the industry offset strength in 5G technologies and data center expansion.
Revenue from the aerospace, defense and government market represented approximately 40 percent of total Communications Solutions Group revenue in 2017and declined 6 percent year-over-year. The decline in revenue from the aerospace, defense and government market was driven by continued weakness in the U.S.combined with lower spending in China. For the year ended October 31, 2017, revenue declines in the Americas and Asia Pacific excluding Japan was partiallyoffset by growth in Europe and Japan. Revenue from the aerospace, defense and government market represented approximately 42 percent of totalCommunications Solutions Group revenue in 2016 and was flat year-over-year. For the year ended October 31, 2016, growth in the Americas and Japan waspartially offset by declines in Europe and Asia Pacific excluding Japan.
40

Table of Contents
Gross Margin and Operating Margin
The following table shows the Communications Solutions Group margins, expenses and income from operations for 2017 versus 2016 , and 2016 versus 2015.
Year Ended October 31, 2017 over 2016 % Change
2016 over 2015 % Change 2017 2016 2015
Total gross margin 61.5% 60.8% 59.7% 1 ppt 1 pptOperating margin 17.9% 17.9% 19.3% — (1) ppt
(in millions) Research and development $ 302 $ 303 $ 263 —% 15%Selling, general and administrative $ 463 $ 457 $ 432 1% 6%Other operating expense (income), net $ (7) $ (9) $ (9) (27)% 5%Income from operations $ 311 $ 314 $ 329 (1)% (5)%
Gross margin in 2017 increased 1 percentage point compared to 2016, primarily due to a higher percentage of revenue from software, lower inventory chargesand lower infrastructure-related costs, partially offset by higher warranty costs. Gross margin in 2016 increased 1 percentage point compared to 2015, primarilydue to a higher percentage of revenue from software and R&D solutions, lower warranty and lower inventory charges.
Research and development expenses were flat when compared to 2016. Increased investments in R&D engineers and programs were offset by reduction ininfrastructure-related costs and discretionary spending. In 2016, research and development expenses increased 15 percent, primarily driven by acquisitions andincreased investments in R&D engineers and programs. We remain committed to investment in research and development and have focused our developmentefforts on strategic opportunities in order to capture future growth.
Selling, general and administrative expenses in 2017 increased 1 percent when compared to 2016, primarily driven by investments in sales resources. Selling,general and administrative expenses in 2016 increased 6 percent when compared to 2015, primarily driven by the acquisitions and higher field selling expenses.
Other operating expense (income) in 2017 and 2016 was income of $7 million and $9 million, respectively.
Income from Operations
Income from operations for 2017 decreased $3 million on a corresponding revenue decline of $14 million. Income from operations for 2016 decreased $15million on a corresponding revenue increase of $49 million.
Operating margin in 2017 was flat when compared to 2016, as improvement in gross margin was offset by investments in sales resources. Operating margindecreased 1 percentage point in 2016 compared to 2015, driven by investments in research and development and field selling costs.
Electronic Industrial Solutions Group
The Electronic Industrial Solutions Group provides test and measurement solutions across a broad set of electronic industrial end markets, focusing on high-growth applications in the automotive and energy industry and measurement solutions for semiconductor design and manufacturing, consumer electronics,education and general electronics manufacturing. The group provides electronic design and test software, instruments, and systems used in the simulation, design,validation, manufacturing, installation and optimization of electronic equipment.
Net Revenue
Year Ended October 31, 2017 over 2016 % Change
2016 over 2015 % Change 2017 2016 2015
(in millions) Total net revenue $ 836 $ 776 $ 758 8% 2%
41

Table of Contents
The Electronic Industrial Solutions Group revenue in 2017 increased 8 percent when compared to 2016, driven by strong growth in semiconductormeasurement, automotive and energy markets. Strong revenue growth in Asia Pacific excluding Japan and Europe was partially offset by declines in Japan and theAmericas. The Electronic Industrial Solutions Group revenue in 2016 increased 2 percent when compared to 2015 with growth in Asia Pacific excluding Japan andJapan, partially offset by declines in the Americas and Europe. The revenue increase associated with acquisitions accounted for approximately 1 percentage pointin 2016.
Gross Margin and Operating Margin
The following table shows the Electronic Industrial Solutions Group margins, expenses and income from operations for 2017 versus 2016 , and 2016 versus2015 .
Year Ended October 31, 2017 over 2016 % Change
2016 over 2015 % Change 2017 2016 2015
Total gross margin 61.1% 59.2% 58.0% 2 ppts 1 pptOperating margin 23.8% 21.8% 20.9% 2 ppts 1 ppt
(in millions) Research and development $ 121 $ 108 $ 104 12% 5%Selling, general and administrative $ 194 $ 186 $ 181 4% 2%Other operating expense (income), net $ (3) $ (4) $ (4) (13)% (8)%Income from operations $ 199 $ 169 $ 158 18% 7%
Gross margin in 2017 increased 2 percentage points compared to 2016, primarily driven by higher revenue and favorable revenue mix. Gross margin in 2016increased 1 percentage point compared to 2015, primarily driven by higher revenue, lower warranty expenses and higher system sales for new semiconductorprocess technology.
Research and development expenses in 2017 and 2016 increased 12 percent and 5 percent, respectively, primarily driven by increased investments in leading-edge technologies and key growth opportunities in our end markets. We remain committed to investment in research and development and have focused ourdevelopment efforts on strategic opportunities in order to capture future growth.
Selling, general and administrative expenses in 2017 and 2016, increased 4 percent and 2 percent, respectively, primarily driven by our focus on solutionselling and market expansion activities.
Other operating expense (income) in 2017 and 2016 was income of $3 million and $4 million, respectively.
Income from Operations
Income from operations for 2017 increased $30 million on a corresponding revenue increase of $60 million. Income from operations for 2016 increased $11million on a corresponding revenue increase of $18 million.
Operating margin increased 2 percentage points in 2017 compared to 2016, driven by higher gross margin. Operating margin increased 1 percentage point in2016 compared to 2015, driven by higher gross margin, partially offset by increased investments in R&D programs and market expansion activities.
Ixia Solutions Group
The Ixia Solutions Group helps customers validate the performance and security resilience of their networks and associated applications. The test, visibilityand security products help organizations and their customers strengthen their physical and virtual networks. Enterprises, service providers, network equipmentmanufacturers, and governments worldwide rely on the group's solutions to validate new products before shipping and secure ongoing operation of their networkswith better visibility and security. The group’s product solutions consist of our high-performance hardware platforms, software applications, and services,including warranty and maintenance offerings.
42

Table of Contents
Year Ended October 31, 2017 over 2016 % Change
2016 over 2015 % Change 2017 2016 2015
Total gross margin 76.6% —% —% n/a n/aOperating margin 16.4% —% —% n/a n/a
(in millions) Net revenue $ 256 $ — $ — n/a n/aResearch and development $ 50 $ — $ — n/a n/aSelling, general and administrative $ 103 $ — $ — n/a n/aOther operating expense (income), net $ — $ — $ — n/a n/aIncome from operations $ 42 $ — $ — n/a n/a
The above table represents the Ixia Solution Group's results from the date of acquisition.
Services Solutions Group
The Services Solutions Group provides repair, calibration and consulting services, and remarkets used Keysight equipment. In addition to providing repair andcalibration support for Keysight equipment, we also calibrate non-Keysight equipment. The group serves the same markets as Keysight’s CommunicationsSolutions and Electronic Industrial Solutions Groups, providing industry-specific services to deliver complete Keysight solutions and help customers reduce theirtotal cost of ownership for their design and test equipment. This segment was formerly reported as the company’s Customer Support and Services segment.
Net Revenue
Year Ended October 31, 2017 over 2016 % Change
2016 over 2015 % Change 2017 2016 2015
(in millions) Total net revenue $ 419 $ 402 $ 401 4% —%
The Services Solutions Group revenue in 2017 grew 4 percent compared to 2016. Acquisitions accounted for approximately 1 percentage point of totalrevenue growth. An increase in revenue from sales of used equipment and calibration services was partially offset by a decline in revenue from repair services.Revenue grew in all regions, led by strong growth in Asia Pacific excluding Japan and the Americas. Services Solutions Group revenue in 2016 remained flatcompared to 2015. Acquisitions accounted for approximately 2 percentage points of total revenue growth. An increase in revenue from calibration services andused equipment was partially offset by a decline in revenue from repair services. Growth in the Americas and Japan was partially offset by a decline in Asia Pacificexcluding Japan, while Europe remained flat.
Gross Margin and Operating Margin
The following table shows the Services Solutions Group margins, expenses and income from operations for 2017 versus 2016 , and 2016 versus 2015 .
Year Ended October 31, 2017 over 2016 % Change
2016 over 2015 % Change 2017 2016 2015
Total gross margin 41.2% 40.9% 42.9% — ppt (2) pptsOperating margin 16.3% 15.6% 17.9% 1 ppt (2) ppts
(in millions) Research and development $ 2 $ 5 $ 9 (67)% (40)%Selling, general and administrative $ 105 $ 99 $ 94 7% 5%Other operating expense (income), net $ (3) $ (2) $ (3) 25% (14)%Income from operations $ 68 $ 63 $ 72 8% (12)%
Gross margin in 2017 was flat compared to 2016, primarily driven by higher volume and favorable revenue mix offset by higher expenses associated with theinvestments we are making in additional capacity to expand our multi-vendor calibration and asset management services. Gross margin in 2016 decreased 2percentage points compared to 2015, primarily driven by flat volume
43

Table of Contents
and higher expenses associated with the investments we are making in additional capacity to expand our multi-vendor calibration and asset management services.
Research and development expenses for the Services Solutions Group represent the segment’s share of centralized investment. Research and developmentexpenses declined 67 percent when compared to 2016 and declined 40 percent in 2016 when compared to 2015, primarily driven by a change in the ServicesSolutions Group’s share of centralized investments in research and development.
For 2017, selling, general and administrative expense increased 7 percent compared to 2016 due to increased investment in sales resources, higher people-related costs and acquisitions. Selling, general and administrative expense increased 5 percent in 2016 compared to 2015 due to higher field selling costs, anincrease in infrastructure-related costs and acquisitions.
Other operating expense (income) in 2017 and 2016 was income of $3 million and $2 million, respectively.
Income from Operations
Income from operations for 2017 increased $5 million on a corresponding revenue increase of $17 million. Income from operations for 2016 decreased $9million on a corresponding revenue increase of $1 million.
Operating margin increased 1 percentage point in 2017 compared to 2016, primarily driven by higher revenue and lower share in R&D expenses, partiallyoffset by increased investment in sales resources. Operating margin decreased 2 percentage points in 2016 compared to 2015, driven by flat revenue, lower grossmargins, higher infrastructure-related costs and field selling costs.
Financial Condition
Liquidity and Capital Resources
Our financial position as of October 31, 2017 consisted of cash and cash equivalents of $818 million as compared to $783 million as of October 31, 2016.
As of October 31, 2017, approximately $767 million of our cash and cash equivalents was held outside of the U.S. in our foreign subsidiaries. Under currenttax laws, most of the cash could be repatriated to the U.S., but it would be subject to U.S. federal and state income taxes, less applicable foreign tax credits. Cashheld outside of the U.S. can be used for non-U.S. growth and expansion. Our cash and cash equivalents mainly consist of short-term deposits held at major globalfinancial institutions, investments in institutional money market funds, and similar short duration instruments with original maturities of 90 days or less. Wecontinuously monitor the creditworthiness of the financial institutions in which we invest our funds. We utilize a variety of funding strategies in an effort to ensurethat our worldwide cash is available in the locations in which it is needed. Most significant international locations have access to internal funding through anoffshore cash pool for working capital needs, in addition to temporary local overdraft and short-term working capital lines of credit for a few locations which areunable to access internal funding.
We believe our cash and cash equivalents, cash generated from operations, and ability to access capital markets and credit lines will satisfy, for at least thenext twelve months, our liquidity requirements, both globally and domestically, including the following: working capital needs, capital expenditures, businessacquisitions, contractual obligations, commitments, principal and interest payments on debt, and other liquidity requirements associated with our operations.
Net Cash Provided by Operating Activities
Cash flows from operating activities can fluctuate significantly from period to period as working capital needs and the timing of payments for income taxes,restructuring activities, pension funding, variable pay and other items impact reported cash flows.
Net cash provided by operating activities was $313 million for the year ended October 31, 2017 as compared to $416 million provided in 2016 and $376million provided in 2015.
• Net income in 2017 decreased by $233 million as compared to 2016. Changes to non-cash income and expenses in 2017 as compared to 2016 included a$91 million increase in depreciation and amortization expense, a $64 million decrease in deferred tax expense, a $69 million gain due to pensioncurtailment and settlement, a $9 million fee associated with a bridge loan facility, an impairment charge of $7 million related to cancellation of an in-process R&D project, a $7 million increase in share-based compensation expense, a $2 million decline in gain from sale of land, a $1 million decline inexcess and obsolete inventory-related charges and a $6 million increase in other miscellaneous non-cash expenses as compared to the same period lastyear. Additionally, we paid $28 million of acquisition-related compensation expense to redeem certain of Ixia's outstanding unvested stock awards as ofthe date of the Merger Agreement that were determined
44

Table of Contents
to relate to post-merger service periods and expensed in Keysight's consolidated financial statements. Further, during fiscal 2017, we paid $68 million tothe Malaysia tax authority associated with a tax assessment, including penalties, on gains related to intellectual property transfers that we are currently inthe process of appealing to the Special Commissioners of Income Tax (“SCIT”) in Malaysia.
• The aggregate of accounts receivable, inventory and accounts payable provided net cash of zero during 2017, compared to net cash used of $72 million in2016 and $27 million in 2015. The fiscal 2017 inventory change included $61 million of amortization related to the fair value adjustment to inventory dueto the Ixia acquisition. The amount of cash flow generated from or used by the aggregate of accounts receivable, inventory and accounts payable dependsupon the cash conversion cycle, which represents the number of days that elapse from the day we pay for the purchase of raw materials and componentsto the collection of cash from our customers and can be significantly impacted by the timing of shipments and purchases, as well as collections andpayments in a period.
• Net cash paid to Agilent under separation and distribution agreement was zero in 2017 and 2016 as compared to payments to Agilent of $28 million in2015.
• The aggregate of employee compensation and benefits, income taxes payable, deferred revenue, and other assets and liabilities provided net operatingcash of $30 million during 2017 as compared to net cash used of $31 million and $67 million in 2016 and 2015, respectively. The difference between2017 and 2016 activities is primarily due to an increase in deferred revenue balances as a result of acquisition activity, partially offset by an increase invariable compensation payments and other differences due to timing of accruals and collections versus payments between the periods.
• We contributed $34 million to our non-U.S. defined benefit plans during 2017 compared to $38 million in 2016 and $48 million in 2015. We did notcontribute to our U.S. Defined Benefit Plans in 2017, 2016 and 2015. We did not contribute to the U.S. Post-Retirement Benefit Plan in 2017, and wecontributed $1 million in 2016 and $1 million in 2015.
Net Cash Used in Investing Activities
Net cash used in investing activities was $1,722 million in 2017, $90 million in 2016 and $671 million in 2015. Investments in property, plant and equipmentwere $72 million in 2017, $91 million in 2016 and $92 million in 2015.
In 2017, we paid $1,622 million, net of $72 million of cash acquired, for the acquisition of Ixia, $60 million for the acquisition of ScienLab, net of $2 millionof cash acquired, and $20 million, net, for other acquisition activity. The purchase consideration includes approximately $47 million paid to Ixia employees forvested equity awards. In 2016, we used $10 million, net of cash acquired, for the acquisition of a small business and a contingent payment related to the Aniteacquisition as compared to $574 million for the acquisitions of Anite and Electroservices in 2015.
We received $8 million of proceeds from the sale of land in 2017 compared to $10 million in 2016. We also received $45 million of proceeds from the sale ofinvestments in 2017 as compared to $1 million in 2016 and $1 million in 2015.
In 2015, we invested $7 million in preferred stock of a privately held radio frequency microstructure company, accounted for using the cost method.
Net Cash Used in Financing Activities
Cash flows related to financing activities consist primarily of cash flows associated with the issuance of common stock, proceeds from and repayments ofborrowings, issuance of common stock under employee stock plans, treasury stock repurchases and debt issuance cost. Net cash provided by financing activities in2017 was $1,440 million compared to cash used of $25 million in 2016 and cash used of $19 million in 2015, primarily due to proceeds used to fund theacquisition of Ixia, including the issuance of long-term debt of $1,069 million, short-term borrowings of $212 million, and the issuance of common stock underpublic offering of $444 million, net of issuance costs. We repaid $323 million of the borrowings in 2017, including $182 million of the revolving facility, $140million of the term loan and a $1 million short-term loan acquired with the acquisition of ScienLab. In addition, during 2017, we issued common stock underemployee stock plans of $51 million compared to $43 million during 2016 and $26 million during 2015.
On February 18, 2016, our Board of Directors approved a stock repurchase program under which the company is authorized to repurchase up to $200 millionof the company’s outstanding common stock through open market purchases, privately negotiated transactions or other means. The repurchase program may besuspended or discontinued at any time at the company’s discretion. In fiscal 2016, the company used $62 million to repurchase shares.
Financing activities in 2015 also reflects $49 million of cash returned to Agilent in accordance with the separation and distribution agreement.
45

Table of Contents
Short-term debt
Revolving Credit Facility
On February 15, 2017, we entered into an amended and restated credit agreement (the “Revolving Credit Facility”) that replaced our existing $450 millionunsecured credit facility dated September 15, 2014. The Revolving Credit Facility provides for a $450 million, five-year unsecured revolving credit facility thatwill expire on February 15, 2022 and bears interest at an annual rate of LIBOR + 1.30%. In addition, the Revolving Credit Facility permits us to increase the totalcommitments under this credit facility by up to $150 million in the aggregate on one or more occasions upon request. We may use amounts borrowed under thefacility for general corporate purposes. During the year ended October 31, 2017, we borrowed and repaid $182 million of borrowings outstanding under theRevolving Credit Facility. As of October 31, 2017, we had no borrowings outstanding under the Revolving Credit Facility. We were in compliance with thecovenants of the Revolving Credit Facility during the year ended October 31, 2017.
Bridge Facility
On January 30, 2017, we entered into a commitment letter, pursuant to which certain lenders agreed to provide a senior unsecured 364-day bridge loan facilityof up to $1.684 billion (“the Bridge Facility”) for the purpose of providing the financing to support Keysight's acquisition of Ixia. Under the terms of commitmentletter, the Bridge Facility was automatically terminated upon the Ixia acquisition on April 18, 2017. For the year ended October 31, 2017, we incurred costs inconnection with the Bridge Facility of $9 million that were amortized to interest expense.
Long-term debt
Senior Notes
In April 2017, the company issued an aggregate principal amount of $700 million in senior notes ("2027 Senior Notes"). The 2027 Senior Notes were issued at99.873 percent of their principal amount. The notes will mature on April 6, 2027 and bear interest at a fixed rate of 4.60 percent per annum. The interest is payablesemi-annually on April 6 and October 6 of each year, commencing on October 6, 2017. We incurred issuance costs of $6 million in connection with the 2027Senior Notes that, along with the debt discount of $1 million, are being amortized to interest expense over the term of the senior notes. The 2027 Senior Notes areunsecured and rank equally in right of payment with all of our other senior unsecured indebtedness.
In October 2014, the company issued an aggregate principal amount of $500 million in senior notes ("2019 Senior Notes"). The 2019 Senior Notes wereissued at 99.902 percent of their principal amount. The notes will mature on October 30, 2019, and bear interest at a fixed rate of 3.30 percent per annum. Theinterest is payable semi-annually on April 30 and October 30 of each year.
In October 2014, the company issued an aggregate principal amount of $600 million in senior notes ("2024 Senior Notes"). The 2024 Senior Notes wereissued at 99.966 percent of their principal amount. The notes will mature on October 30, 2024, and bear interest at a fixed rate of 4.55 percent per annum. Theinterest is payable semi-annually on April 30 and October 30 of each year.
Senior Unsecured Term Loan
On February 15, 2017, we entered into a term credit agreement that provides for a three-year $400 million senior unsecured term loan that bears interest at anannual rate of LIBOR + 1.50%. The term loan was drawn upon the closing of the Ixia acquisition. During the year ended October 31, 2017, we repaid $140 millionof the term loan. As of October 31, 2017, we had borrowings outstanding under the term loan of $260 million, of which $10 million is due in the next twelvemonths. In connection with the term loan, we incurred issuance costs of $1 million that are being amortized to interest expense over the term of loan.
Off Balance Sheet Arrangements and Other
We have contractual commitments for non-cancellable operating leases. See Note 17, "Commitments and Contingencies," to our consolidated financialstatements for further information on our non-cancellable operating leases.
Our liquidity is affected by many factors, some of which are based on normal ongoing operations of our business and some of which arise from fluctuationsrelated to global economics and markets. Our cash balances are generated and held in many locations throughout the world. Local government regulations mayrestrict our ability to move cash balances to meet cash needs under certain circumstances. We do not currently expect such regulations and restrictions to impactour ability to pay vendors and conduct operations throughout our global organization.
46

Table of Contents
Contractual Commitments
Our cash flows from operations are dependent on a number of factors, including fluctuations in our operating results, accounts receivable collections,inventory management, and the timing of tax and other payments. As a result, the impact of contractual obligations on our liquidity and capital resources in futureperiods should be analyzed in conjunction with such factors.
The following table summarizes our total contractual obligations at October 31, 2017 (in millions). The amounts presented in the table do not reflect $41million of liabilities for uncertain tax positions as of October 31, 2017. We are unable to accurately predict when these amounts will be realized or released.However, it is reasonably possible that there could be significant changes to our unrecognized tax benefits in the next 12 months due to either the expiration of astatute of limitations or a tax audit settlement.
Total Less than one
year One to three
years Three to five
years More than five
years (in millions)Debt obligations $ 2,060 $ 10 $ 750 $ — $ 1,300Interest payments on long-term debt 547 84 147 119 197Operating lease commitments 222 51 75 43 53Capital lease commitments 5 1 1 1 2Commitments to contract manufacturers and suppliers 336 332 4 — —Retirement plans 35 35 — — —Other purchase commitments 42 42 — — —
Total $ 3,247 $ 555 $ 977 $ 163 $ 1,552
Interest on senior notes. We have contractual obligations for interest payments on our senior notes. Interest rates and payment dates are detailed above under"Long-term debt."
Operating leases. Commitments under operating leases relate primarily to leasehold property, See Note 17, "Commitments and Contingencies."
Commitments to contract manufacturers and suppliers. We purchase components from a variety of suppliers and use several contract manufacturers toprovide manufacturing services for our products. During the normal course of business, we issue purchase orders with estimates of our requirements severalmonths ahead of the delivery dates. Our agreements with these suppliers usually provide us with the option to cancel, reschedule, and adjust our requirementsbased on business needs prior to firm orders being placed. Purchase orders outstanding with delivery dates within 30 days are typically non-cancellable. Themajority of our reported purchase commitments arising from these agreements are firm, non-cancellable, and unconditional commitments. We expect to fulfillmost of our purchase commitments for inventory within one year.
In addition to the commitments to contract manufacturers and suppliers referenced above, we record a liability for firm, non-cancellable and unconditionalpurchase commitments for quantities in excess of our future demand forecasts consistent with our policy relating to excess inventory. As of October 31, 2017, theliability for our excess firm, non-cancellable and unconditional purchase commitments was $10 million, compared to $9 million as of October 31, 2016. Theseamounts are included in other accrued liabilities in our consolidated balance sheet.
Retirement plans. Commitments under the retirement plans relate to expected contributions to be made to our non-U.S. defined benefit plans for the next yearonly. Contributions beyond the next year are impractical to estimate.
We also have benefit payments due under our defined benefit retirement plans and post-retirement benefit plan that are not required to be funded in advance,but are paid in the same period that benefits are provided. See Item 8-Financial Statements and Supplementary Data, Note 15, "Retirement Plans and Post-Retirement Benefit Plans," for additional information.
Other purchase commitments. Other purchase commitments relate to contracts with professional services suppliers. We can typically cancel these contractswithin 90 days without penalties. For those contracts that are not cancellable within 90 days without penalties, we disclose the amounts we are obligated to pay to asupplier under each contract in that period before such contract can be canceled. As of October 31, 2017 , our contractual obligations with these suppliers wasapproximately $42 million within the next fiscal year, as compared to approximately $35 million as of October 31, 2016.
We had no material off-balance sheet arrangements as of October 31, 2017 or October 31, 2016.
47

Table of Contents
Critical Accounting Policies and Estimates
The preparation of financial statements in accordance with accounting principles generally accepted in the United States requires management to makeestimates and assumptions that affect the amounts reported in our consolidated financial statements and accompanying notes. Management bases its estimates onhistorical experience and various other assumptions believed to be reasonable. Although these estimates are based on management's best knowledge of currentevents and actions that may impact the company in the future, actual results may be different from the estimates. An accounting policy is deemed to be critical if itrequires an accounting estimate to be made based on assumptions about matters that are highly uncertain at the time the estimate is made, and if different estimatesthat reasonably could have been used or changes in the accounting estimate that are reasonably likely to occur could materially change the financial statements.Our critical accounting policies are those that affect our financial statements materially and involve difficult, subjective or complex judgments by management.Those policies are revenue recognition, inventory valuation, share-based compensation, retirement and post-retirement plan assumptions, valuation of goodwill andother intangible assets, warranty, restructuring and accounting for income taxes.
Revenue recognition. We enter into agreements to sell products (hardware and/or software), services, and other arrangements (multiple-elementarrangements) that include combinations of products and services. Revenue from product sales, net of trade discounts and allowances, is recognized provided thatpersuasive evidence of an arrangement exists, delivery has occurred, the price is fixed or determinable and collectability is reasonably assured. Delivery isconsidered to have occurred when title and risk of loss have transferred to the customer, for products, or when the service has been provided. Revenue is reducedfor estimated product returns, when appropriate. For sales that include customer-specified acceptance criteria, revenue is recognized after the acceptance criteriahave been met. For products that include installation, if the installation meets the criteria to be considered a separate element, product revenue is recognized upondelivery, and recognition of installation revenue occurs when the installation is complete. Otherwise, neither the product nor the installation revenue is recognizeduntil the installation is complete. Revenue from services is deferred and recognized over the contractual period or as services are rendered. We allocate revenue toeach element in our multiple-element arrangements based upon their relative selling prices. We determine the selling price for each deliverable based on a sellingprice hierarchy. The selling price for a deliverable is based on our vendor specific objective evidence ("VSOE") if available, third-party evidence ("TPE") if VSOEis not available, or estimated selling price ("ESP") if neither VSOE nor TPE is available. Revenue from the sale of software products that are not required todeliver the tangible product's essential functionality are accounted for under software revenue recognition rules. Revenue allocated to each element is thenrecognized when the basic revenue recognition criteria for that element have been met. The amount of product revenue recognized is affected by our judgments asto whether an arrangement includes multiple elements.
We use VSOE of selling price in the selling price allocation in all instances where it exists. VSOE of selling price for products and services is determinedwhen a substantial majority of the selling prices fall within a reasonable range when sold separately. TPE of selling price can be established by evaluating largelyinterchangeable competitor products or services in standalone sales to similarly situated customers. As our products contain a significant element of proprietarytechnology and the solution offered differs substantially from that of competitors, it is difficult to obtain the reliable standalone competitive pricing necessary toestablish TPE. ESP represents the best estimate of the price at which we would transact a sale if the product or service were sold on a standalone basis. Wedetermine ESP for a product or service by using historical selling prices which reflect multiple factors including, but not limited to customer type, geography,market conditions, competitive landscape, gross margin objectives and pricing practices. The determination of ESP is made through consultation with and approvalby management. We may modify or develop new pricing practices and strategies in the future. As these pricing strategies evolve, changes may occur in ESP. Theaforementioned factors may result in a different allocation of revenue to the deliverables in multiple-element arrangements, which may change the pattern andtiming of revenue recognition for these elements but will not change the total revenue recognized for the arrangement.
Inventory valuation. We assess the valuation of our inventory on a periodic basis and make adjustments to the value for estimated excess and obsoleteinventory based upon estimates about future demand and actual usage. Such estimates are difficult to make under most economic conditions. The excess balancedetermined by this analysis becomes the basis for our excess inventory charge. Our excess inventory review process includes analysis of sales forecasts, managingproduct rollovers and working with manufacturing to maximize recovery of excess inventory. If actual market conditions are less favorable than those projected bymanagement, additional write-downs may be required. If actual market conditions are more favorable than anticipated, inventory previously written down may besold to customers, resulting in lower cost of sales and higher income from operations than expected in that period.
Share-based compensation. We account for share-based awards in accordance with the provisions of the authoritative accounting guidance, which requiresthe measurement and recognition of compensation expense for all share-based payment awards made to our employees and directors. The fair value of share-basedawards for employee stock option awards was estimated using the Black-Scholes option pricing model. Awards granted under the LTP Program are based on avariety of targets, such as total shareholder return (TSR) or financial metrics such as operating margin, cost synergies and others. The awards based on TSR
48

Table of Contents
were valued using a Monte Carlo simulation model and those based on financial metrics were valued based on the market price of Keysight’s common stock on thedate of grant. Both the Black-Scholes and Monte Carlo simulation fair value models require the use of highly subjective and complex assumptions, including theoption’s expected life and the price volatility of the underlying stock. The estimated fair value of restricted stock awards is determined based on the market price ofKeysight’s common stock on the date of grant. We did not grant any option awards in 2017 and 2016. For the year ended October 31, 2015, we used the averagehistorical volatility of eleven peer companies to estimate the volatility for our stock option awards. We considered our ability to find traded options of peercompanies in the current market with similar terms and prices to our options. In estimating the expected life of our options, we considered the historical optionexercise behavior of our executives, which we believe is representative of future behavior.
Retirement and post-retirement benefit plan assumptions. Retirement and post-retirement benefit plan costs are a significant cost of doing business. Theyrepresent obligations that will ultimately be settled sometime in the future and therefore are subject to estimation. Pension accounting is intended to reflect therecognition of future benefit costs over the employees' average expected future service to Keysight based on the terms of the plans and investment and fundingdecisions. To estimate the impact of these future payments and our decisions concerning funding of these obligations, we are required to make assumptions usingactuarial concepts within the framework of accounting principles generally accepted in the U.S. Two critical assumptions are the discount rate and the expectedlong-term return on plan assets. Other important assumptions include, expected future salary increases, expected future increases to benefit payments, expectedretirement dates, employee turnover, retiree mortality rates, and investment portfolio composition. We evaluate these assumptions at least annually.
The discount rate is used to determine the present value of future benefit payments at the measurement date, which is October 31 for both U.S. and non-U.S.plans. The U.S. discount rates as of October 31, 2017 and 2016 were determined based on the results of matching expected plan benefit payments with cash flowsfrom a hypothetically constructed bond portfolio. The non-U.S. discount rates as of October 31, 2017 and 2016 were determined using spot rates along the yieldcurve to calculate disaggregated discount rates. In addition, we used this method to calculate two components of the periodic benefit cost: service cost and interestcost. If we changed our discount rate by 1 percent, the impact would be $4 million on U.S. net periodic benefit cost and $7 million on non-U.S. net periodic benefitcost. Lower discount rates increase the present value of the liability and subsequent year pension expense; higher discount rates decrease the present value of theliability and subsequent year pension expense.
The company uses alternate methods of amortization, as allowed by the authoritative guidance, that amortizes the actuarial gains and losses on a consistentbasis for the years presented. For U.S. plans, gains and losses are amortized over the average future working lifetime. For most non-U.S. plans and U.S. post-retirement benefit plans, gains and losses are amortized using a separate layer for each year's gains and losses. The expected long-term return on plan assets isestimated using current and expected asset allocations as well as historical and expected returns. Plan assets are valued at fair value. If we changed our estimatedreturn on assets by 1 percent, the impact would be $6 million on U.S. net periodic benefit cost and $13 million on non-U.S. net periodic benefit cost.
Goodwill and other intangible assets. We review goodwill for impairment annually during our fourth fiscal quarter and whenever events or changes incircumstances indicate the carrying value may not be recoverable. As defined in the authoritative guidance, a reporting unit is an operating segment, or one levelbelow an operating segment. We aggregated components of an operating segment that have similar economic characteristics into our reporting units. At the time ofan acquisition, we assign goodwill to the reporting unit that is expected to benefit from the synergies of the combination.
Companies have the option to perform a qualitative assessment to determine whether performing the two-step quantitative test is necessary. If an entitybelieves, as a result of its qualitative assessment, that it is more-likely-than-not that the fair value of a reporting unit is less than its carrying amount, thequantitative impairment test will be required. Otherwise, no further testing will be required.
The guidance includes examples of events and circumstances that might indicate that a reporting unit's fair value is less than its carrying amount. Theseexamples include macro-economic conditions such as deterioration in the entity's operating environment or industry or market considerations; entity-specificevents such as increasing costs, declining financial performance, or loss of key personnel; or other events such as an expectation that a reporting unit will be sold ora sustained decrease in the stock price on either an absolute basis or relative to peers. The qualitative indicators replace those previously used to determine whetheran interim goodwill impairment test is required. If it is determined, as a result of the qualitative assessment, that it is more-likely-than-not that the fair value of areporting unit is less than its carrying amount, the provisions of authoritative guidance require that we perform a two-step impairment test on goodwill. In the firststep, we compare the fair value of each reporting unit to its carrying value. The second step, if necessary, measures the amount of impairment by applying fair-value-based tests to the individual assets and liabilities within each reporting unit.
In 2016, we implemented changes in our organizational structure designed to align our organization with the industries we
49

Table of Contents
serve, which resulted in the formation of three reportable operating segments that are also our reporting units. On April 18, 2017, we completed the acquisition ofIxia, which became our fourth reportable operating segment. In 2017, we assessed goodwill impairment by performing a qualitative test for our four reportingunits. Based on the results of our testing, it was determined that it is more-likely-than-not that the fair values of the reporting units are greater than their carryingvalues. There was no impairment of goodwill during the years ended October 31, 2017, 2016 and 2015. Each quarter we review the events and circumstances todetermine if goodwill impairment is indicated.
Other intangible assets consist primarily of developed technologies, proprietary know-how, trademarks, customer relationships, non-compete agreements, andbacklog and are amortized using the straight-line method over estimated useful lives ranging from 3 months to 10 years. No impairments of purchased intangibleassets were recorded during the years ended October 31, 2017, 2016 and 2015.
We review other intangible assets for impairment whenever events or changes in business circumstances indicate that the carrying amount of the assets maynot be fully recoverable or that the useful lives of these assets are no longer appropriate. The authoritative accounting guidance allows a qualitative approach fortesting indefinite-lived intangible assets for impairment, similar to the impairment testing guidance for goodwill. It allows the option to first assess qualitativefactors (events and circumstances) that could have affected the significant inputs used in determining the fair value of the indefinite-lived intangible asset. Thequalitative factors assist in determining whether it is more-likely-than-not that the indefinite-lived intangible asset is impaired. An organization may choose tobypass the qualitative assessment for any indefinite-lived intangible asset in any period and proceed directly to calculating its fair value. Our indefinite-livedintangible assets are in-process research and development ("IPR&D") intangible assets. In 2017, we assessed impairment by performing a qualitative test andrecorded an impairment charge of $7 million related to the cancellation of an IPR&D project. There were no impairments in fiscal years 2016 and 2015.
Warranty. Our standard warranty term for most of our products from the date of delivery is typically three years. We accrue for standard warranty costsbased on historical trends in warranty charges. The accrual is reviewed regularly and periodically adjusted to reflect changes in warranty cost estimates. Estimatedwarranty charges are recorded within cost of products at the time related product revenue is recognized.
We also sell extended warranties that provide warranty coverage beyond the standard warranty term. Revenue associated with extended warranties is deferredand recognized over the extended coverage period.
Restructuring. The main component of our restructuring plan is related to workforce reductions. Workforce reduction charges are accrued when payment ofbenefits becomes probable and the amounts can be estimated. If the amounts and timing of cash flows from restructuring activities are significantly different fromwhat we have estimated, the actual amount of restructuring and other related charges could be materially different, either higher or lower, than those we haverecorded.
Accounting for income taxes. We must make certain estimates and judgments in determining income tax expense for financial statement purposes. Theseestimates and judgments occur in the calculation of tax credits, benefits and deductions, and in the calculation of certain tax assets and liabilities which arise fromdifferences in the timing of recognition of revenue and expense for tax and financial statement purposes, as well as interest and penalties related to uncertain taxpositions. Significant changes to these estimates may result in an increase or decrease to our tax provision in a subsequent period.
Significant management judgment is also required in determining whether deferred tax assets will be realized in full or in part. When it is more-likely-than-notthat all or some portion of specific deferred tax assets such as net operating losses or foreign tax credit carryforwards will not be realized, a valuation allowancemust be established for the amount of the deferred tax assets that cannot be realized. We consider all available positive and negative evidence on a jurisdiction-by-jurisdiction basis when assessing whether it is more likely than not that deferred tax assets are recoverable. We consider evidence such as our past operatingresults, the existence of losses in recent years and our forecast of future taxable income. At October 31, 2017, the company maintains a valuation allowance mainlyrelated to deferred tax assets for capital losses in the U.K., California research credits, and net operating losses in the U.K. and Netherlands. We intend to maintaina valuation allowance in these jurisdictions until sufficient positive evidence exists to support their reversal.
We have provided for all U.S. federal income and foreign withholding taxes on the undistributed earnings of some of our foreign subsidiaries for the portion ofearnings we do not intend to reinvest permanently. For the amount of foreign earnings that we consider reinvested permanently, should we decide to remit thisincome to the U.S. in a future period, our provision for income taxes will increase materially in that period.
The calculation of our tax liabilities involves dealing with uncertainties in the application of complex tax law and regulations in a multitude ofjurisdictions. Although the guidance on the accounting for uncertainty in income taxes prescribes the use of a recognition and measurement model, thedetermination of whether an uncertain tax position has met those thresholds will continue to require significant judgment by management. In accordance with theguidance on the accounting for uncertainty in income
50

Table of Contents
taxes, for all U.S. and other tax jurisdictions, we recognize potential liabilities for anticipated tax audit issues based on our estimate of whether, and the extent towhich, additional taxes and interest will be due. The ultimate resolution of tax uncertainties may differ from what is currently estimated, which could result in amaterial impact on income tax expense. If our estimate of income tax liabilities proves to be less than the ultimate assessment, a further charge to expense would berequired. If events occur and the payment of these amounts ultimately proves to be unnecessary, the reversal of the liabilities would result in tax benefits beingrecognized in the period when we determine the liabilities are no longer necessary. We include interest and penalties related to unrecognized tax benefits within theprovision for income taxes in the consolidated statements of operations.
New Accounting Standards
See Note 2, "New Accounting Pronouncements," to the consolidated financial statements for a description of new accounting pronouncements.
Item 7A. Quantitative and Qualitative Disclosures About Market Risk
At various times, we use derivative financial instruments to limit exposure to changes in foreign currency exchange rates and interest rates. Because derivativeinstruments are used solely as hedges and not for speculative trading purposes, fluctuations in the market values of such derivative instruments are generally offsetby reciprocal changes in the underlying economic exposures that the instruments are intended to hedge. For further discussion of derivative financial instruments,refer to Note 13, "Derivatives."
Currency exchange rate risk
We are exposed to foreign currency exchange rate risks inherent in our sales commitments, anticipated sales, and assets and liabilities denominated incurrencies other than the functional currency of our subsidiaries. We hedge future cash flows denominated in currencies other than the functional currency usingsales and expense forecasts up to twelve months in advance. Our exposure to exchange rate risks is managed on an enterprise-wide basis. This strategy utilizesderivative financial instruments, including option and forward contracts, to hedge certain foreign currency exposures with the intent of offsetting gains and lossesthat occur on the underlying exposures with gains and losses on the derivative contracts hedging them. We do not currently and do not intend to utilize derivativefinancial instruments for speculative trading purposes.
Our operations generate non-functional currency cash flows such as revenue, third-party vendor payments and inter-company payments. In anticipation ofthese foreign currency cash flows and in view of the volatility of the currency market, we enter into such foreign exchange contracts as described above tosubstantially mitigate our currency risk. Approximately 71 percent of our revenues in 2017 and 2016 and 75 percent of our revenues in 2015 were generated inU.S. dollars.
We performed a sensitivity analysis assuming a hypothetical 10 percent adverse movement in foreign exchange rates to the hedging contracts and theunderlying exposures described above. As of October 31, 2017 and 2016, the analysis indicated that these hypothetical market movements would not have amaterial effect on our consolidated financial position, results of operations or cash flows.
Interest rate risk
As of October 31, 2017, we had $2,060 million in principal amount of senior debt outstanding. The carrying amount of the fixed-rate senior notes was $1,799million, and the related fair value based on quoted prices was $1,890 million. A change in interest rates on long-term debt impacts the fair value of the company’sfixed-rate long-term debt but not the company’s earnings or cash flow because the interest on such debt is fixed. Generally, the fair market value of fixed-rate debtwill increase as interest rates fall and decrease as interest rates rise.
As of October 31, 2017, a hypothetical 10 percent increase in interest rates would have decreased the fair value of the company’s fixed-rate long-term debt byapproximately $36 million. However, since the company currently has no plans to repurchase its outstanding fixed-rate instruments before their maturity nor do theinvestors in our fixed-rate debt obligations have the right to demand we pay off these obligations prior to maturity, the impact of market interest rate fluctuationson the company’s fixed-rate long-term debt does not affect the company’s results of operations or stockholders’ equity.
51

Table of Contents
Item 8. Financial Statements and Supplementary Data
Index to Consolidated Financial Statements Page
Consolidated Financial Statements:
Report of Independent Registered Public Accounting Firm 53
Consolidated Statement of Operations for each of the three years in the period ended October 31, 2017 54
Consolidated Statement of Comprehensive Income for each of the three years in the period ended October 31, 2017 55
Consolidated Balance Sheet at October 31, 2017 and 2016 56
Consolidated Statement of Cash Flows for each of the three years in the period ended October 31, 2017 57
Consolidated Statement of Equity for each of the three years in the period ended October 31, 2017 58
Notes to Consolidated Financial Statements 59
Quarterly Summary (unaudited) 103
52

Table of Contents
REPORT OF INDEPENDENT REGISTERED PUBLIC ACCOUNTING FIRM
To the Stockholders and Board of Directors of Keysight Technologies, Inc.:
In our opinion, the accompanying consolidated balance sheets and the related consolidated statements of operations, of comprehensive income, of equity and ofcash flows present fairly, in all material respects, the financial position of Keysight Technologies, Inc. and its subsidiaries at October 31, 2017 and October 31,2016, and the results of their operations and their cash flows for each of the three years in the period ended October 31, 2017 in conformity with accountingprinciples generally accepted in the United States of America. In addition, in our opinion, the financial statement schedule listed in the index appearing under Item15(a)(2) presents fairly, in all material respects, the information set forth therein when read in conjunction with the related consolidated financial statements. Alsoin our opinion, the Company maintained, in all material respects, effective internal control over financial reporting as of October 31, 2017, based on criteriaestablished in Internal Control - Integrated Framework (2013) issued by the Committee of Sponsoring Organizations of the Treadway Commission (COSO). TheCompany's management is responsible for these financial statements and financial statement schedule, for maintaining effective internal control over financialreporting and for its assessment of the effectiveness of internal control over financial reporting, included in Management's Report on Internal Control overFinancial Reporting appearing under Item 9A. Our responsibility is to express opinions on these financial statements, on the financial statement schedule, and onthe Company's internal control over financial reporting based on our audits. We conducted our audits in accordance with the standards of the Public CompanyAccounting Oversight Board (United States). Those standards require that we plan and perform the audits to obtain reasonable assurance about whether thefinancial statements are free of material misstatement and whether effective internal control over financial reporting was maintained in all material respects. Ouraudits of the financial statements included examining, on a test basis, evidence supporting the amounts and disclosures in the financial statements, assessing theaccounting principles used and significant estimates made by management, and evaluating the overall financial statement presentation. Our audit of internal controlover financial reporting included obtaining an understanding of internal control over financial reporting, assessing the risk that a material weakness exists, andtesting and evaluating the design and operating effectiveness of internal control based on the assessed risk. Our audits also included performing such otherprocedures as we considered necessary in the circumstances. We believe that our audits provide a reasonable basis for our opinions.
As discussed in Note 2 to the consolidated financial statements, in 2017 the Company changed the manner in which it presents debt issuance costs on theconsolidated balance sheet due to the adoption of Accounting Standards Update (ASU) 2015-03, Simplifying the Presentation of Debt Issuance Costs, as well asthe manner in which it recognizes the income tax consequences of intra-entity transfers due to the adoption of ASU 2016-16, Intra-Entity Transfers of Assets OtherThan Inventory .
A company’s internal control over financial reporting is a process designed to provide reasonable assurance regarding the reliability of financial reporting and thepreparation of financial statements for external purposes in accordance with generally accepted accounting principles. A company’s internal control over financialreporting includes those policies and procedures that (i) pertain to the maintenance of records that, in reasonable detail, accurately and fairly reflect the transactionsand dispositions of the assets of the company; (ii) provide reasonable assurance that transactions are recorded as necessary to permit preparation of financialstatements in accordance with generally accepted accounting principles, and that receipts and expenditures of the company are being made only in accordance withauthorizations of management and directors of the company; and (iii) provide reasonable assurance regarding prevention or timely detection of unauthorizedacquisition, use, or disposition of the company’s assets that could have a material effect on the financial statements.
Because of its inherent limitations, internal control over financial reporting may not prevent or detect misstatements. Also, projections of any evaluation ofeffectiveness to future periods are subject to the risk that controls may become inadequate because of changes in conditions, or that the degree of compliance withthe policies or procedures may deteriorate.
As described in Management’s Report on Internal Control over Financial Reporting appearing under Item 9A, management has excluded Ixia and ScienLab fromits assessment of internal control over financial reporting as of October 31, 2017, because they were acquired by the Company in purchase business combinationsduring 2017. We have also excluded Ixia and ScienLab from our audit of internal control over financial reporting. Ixia and ScienLab are wholly-ownedsubsidiaries whose total assets and total revenues excluded from management’s assessment and our audit of internal control over financial reporting collectivelyrepresent approximately 6% and less than 1% of total assets, respectively and approximately 6% and less than 1% of total revenues, respectively, of the relatedconsolidated financial statement amounts as of and for the year ended October 31, 2017.
/s/ PricewaterhouseCoopers LLP
San Jose, CaliforniaDecember 20, 2017
53

Table of Contents
KEYSIGHT TECHNOLOGIES, INC.CONSOLIDATED STATEMENT OF OPERATIONS
(in millions, except per share data)
Year Ended October 31,
2017 2016 2015
Net revenue: Products $ 2,664 $ 2,440 $ 2,408Services and other 525 478 448
Total net revenue 3,189 2,918 2,856Costs and expenses:
Cost of products 1,206 1,042 1,025Cost of services and other 281 252 244
Total costs 1,487 1,294 1,269Research and development 498 425 387Selling, general and administrative 1,049 818 787Other operating expense (income), net (84) (25) (18)
Total costs and expenses 2,950 2,512 2,425Income from operations 239 406 431Interest income 7 3 1Interest expense (80) (47) (46)Other income (expense), net 13 4 2Income before taxes 179 366 388Provision (benefit) for income taxes 77 31 (125)
Net income $ 102 $ 335 $ 513
Net income per share:
Basic $ 0.57 $ 1.97 $ 3.04Diluted $ 0.56 $ 1.95 $ 3.00
Weighted average shares used in computing net income per share:
Basic 180 170 169Diluted 182 172 171
The accompanying notes are an integral part of these consolidated financial statements.
54

Table of Contents
KEYSIGHT TECHNOLOGIES, INC.CONSOLIDATED STATEMENT OF COMPREHENSIVE INCOME
(in millions)
Year Ended October 31,
2017 2016 2015
Net income $ 102 $ 335 $ 513Other comprehensive income (loss):
Unrealized gain (loss) on investments, net of tax benefit (expense) of $(1), $2 and $(2) 4 (11) 5Unrealized gain (loss) on derivative instruments, net of tax benefit (expense) of $(2), $2 and $5 4 (5) (10)Amounts reclassified into earnings related to derivative instruments, net of tax benefit (expense) of $(1), $(4) and zero — 8 1Foreign currency translation, net of tax benefit (expense) of zero (10) 19 (54)Net defined benefit pension cost and post retirement plan costs:
Change in actuarial net gain (loss), net of tax benefit (expense) of $(68), $53 and $25 178 (135) (67)Change in net prior service credit, net of tax benefit of $9, $10 and $11 (15) (15) (18)
Other comprehensive income (loss) 161 (139) (143)
Total comprehensive income $ 263 $ 196 $ 370
The accompanying notes are an integral part of these consolidated financial statements.
55
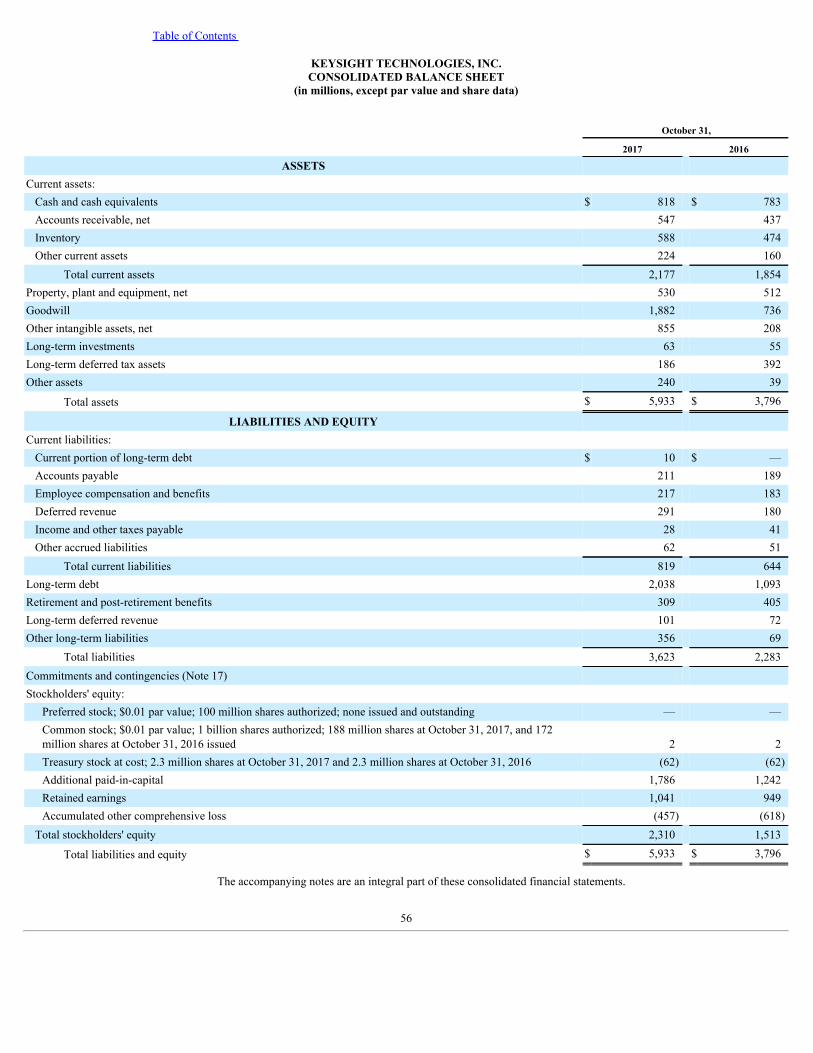
Table of Contents
KEYSIGHT TECHNOLOGIES, INC.CONSOLIDATED BALANCE SHEET
(in millions, except par value and share data)
October 31,
2017 2016
ASSETS Current assets:
Cash and cash equivalents $ 818 $ 783Accounts receivable, net 547 437Inventory 588 474Other current assets 224 160
Total current assets 2,177 1,854Property, plant and equipment, net 530 512Goodwill 1,882 736Other intangible assets, net 855 208Long-term investments 63 55Long-term deferred tax assets 186 392Other assets 240 39
Total assets $ 5,933 $ 3,796
LIABILITIES AND EQUITY Current liabilities:
Current portion of long-term debt $ 10 $ —Accounts payable 211 189Employee compensation and benefits 217 183Deferred revenue 291 180Income and other taxes payable 28 41Other accrued liabilities 62 51
Total current liabilities 819 644Long-term debt 2,038 1,093Retirement and post-retirement benefits 309 405Long-term deferred revenue 101 72Other long-term liabilities 356 69
Total liabilities 3,623 2,283Commitments and contingencies (Note 17) Stockholders' equity:
Preferred stock; $0.01 par value; 100 million shares authorized; none issued and outstanding — —Common stock; $0.01 par value; 1 billion shares authorized; 188 million shares at October 31, 2017, and 172million shares at October 31, 2016 issued 2 2Treasury stock at cost; 2.3 million shares at October 31, 2017 and 2.3 million shares at October 31, 2016 (62) (62)Additional paid-in-capital 1,786 1,242Retained earnings 1,041 949Accumulated other comprehensive loss (457) (618)
Total stockholders' equity 2,310 1,513
Total liabilities and equity $ 5,933 $ 3,796
The accompanying notes are an integral part of these consolidated financial statements.
56

Table of Contents
KEYSIGHT TECHNOLOGIES, INC.CONSOLIDATED STATEMENT OF CASH FLOWS
(in millions)
Year Ended October 31,
2017 2016 2015
Cash flows from operating activities: Net income $ 102 $ 335 $ 513Adjustments to reconcile net income to net cash provided by operating activities:
Depreciation and amortization 225 134 99Share-based compensation 56 49 55Excess tax (benefit) deficiency from share-based plans (3) 5 (4)Debt issuance expense 9 — —Deferred tax expense (benefit) (47) 17 (163)Excess and obsolete inventory related charges 16 17 28Gain on sale of land (8) (10) —Asset impairment 7 — —Pension curtailment and settlement gains (69) — —Other non-cash expenses (income), net 10 4 14Changes in assets and liabilities:
Accounts receivable (11) (42) (20)Inventory (4) (22) (25)Accounts payable 15 (8) 18Payment (to)/from Agilent, net — — (28)Employee compensation and benefits (1) 16 6Deferred revenue 90 15 (24)Income taxes payable 3 (9) 2Retirement and post-retirement benefits (15) (32) (44)Other assets and liabilities (62) (53) (51)
Net cash provided by operating activities 313 416 376 Cash flows from investing activities:
Purchases of property, plant and equipment (72) (91) (92)Proceeds from the sale of property, plant and equipment 8 10 1Acquisitions of businesses and intangible assets, net of cash acquired (1,702) (10) (574)Purchase of investments (1) — (7)Proceeds from the sale of investments 45 1 1
Net cash used in investing activities (1,722) (90) (671) Cash flows from financing activities:
Issuance of common stock under employee stock plans 51 43 26Issuance of common stock under public offerings 444 — —Treasury stock repurchases — (62) —Proceeds from issuance of long-term debt 1,069 — —Debt issuance costs (16) — —Proceeds from short-term borrowings 212 — —Repayment of debt and credit facility (323) (1) —Excess tax benefit (deficiency) from share-based plans 3 (5) 4Return of capital to Agilent — — (49)
Net cash provided by/(used in) financing activities 1,440 (25) (19)Effect of exchange rate movements 4 (1) (13)
Net increase/(decrease) in cash and cash equivalents 35 300 (327)Cash and cash equivalents at beginning of year 783 483 810
Cash and cash equivalents at end of year $ 818 $ 783 $ 483
The accompanying notes are an integral part of these consolidated financial statements.

57

Table of Contents
KEYSIGHT TECHNOLOGIES, INC.CONSOLIDATED STATEMENT OF EQUITY
(in millions, except number of shares in thousands)
Common Stock Treasury Stock
Number ofShares
ParValue
AdditionalPaid-inCapital
Number ofShares
TreasuryStock atCost
RetainedEarnings
Accumulated OtherComprehensiveIncome/(Loss)
TotalStockholders'
Equity
Balance as of October 31, 2014 167,483 $ 2 $ 1,002 — $ — $ 101 $ (336) $ 769
Net income — — — — — 513 — 513
Other comprehensive loss, net of tax — — — — — — (143) (143)
Issuance of common stock 2,108 — 18 — — — — 18
Share-based compensation — — 54 — — — — 54
Tax benefits from share-based awards issued — — 4 — — — — 4
Separation related tax and pension adjustments — — 62 — — — — 62
Reduction in cash payable to Agilent — — 25 — — — — 25
Balance as of October 31, 2015 169,591 2 1,165 — — 614 (479) 1,302
Net income — — — — — 335 — 335
Other comprehensive loss, net of tax — — — — — — (139) (139)
Issuance of common stock 2,696 — 34 — — — — 34
Share-based compensation — — 48 — — — — 48
Tax deficiency from share-based awards issued — — (5) — — — — (5)
Repurchase of common stock — — — (2,289) (62) — — (62)
Balance as of October 31, 2016 172,287 2 1,242 (2,289) (62) 949 (618) 1,513
Adjustment due to adoption of ASU 2016-16 — — — — — (10) — (10)
Net income — — — — — 102 — 102
Other comprehensive income, net of tax — — — — — — 161 161
Issuance of common stock 2,880 — 41 — — — — 41
Public offering of common stock 13,143 — 444 — — — — 444
Share-based compensation — — 56 — — — — 56
Tax benefits from share-based awards issued — — 3 — — — — 3
Balance as of October 31, 2017 188,310 $ 2 $ 1,786 (2,289) $ (62) $ 1,041 $ (457) $ 2,310
The accompanying notes are an integral part of these consolidated financial statements.
58

Table of Contents
KEYSIGHT TECHNOLOGIES, INC.
NOTES TO CONSOLIDATED FINANCIAL STATEMENTS
1. OVERVIEW, BASIS OF PRESENTATION AND SUMMARY OF SIGNIFICANT ACCOUNTING POLICIES
Overview. Keysight Technologies, Inc. ("we", "us", "Keysight" or the "company"), incorporated in Delaware on December 6, 2013, is a measurementcompany providing electronic design and test solutions to communications and electronics industries. Following the acquisition of Ixia on April 18, 2017, thecompany also provides testing, visibility, and security solutions, strengthening applications across physical and virtual networks for enterprises, service providers,and network equipment manufacturers.
Basis of Presentation. We have prepared the accompanying financial statements pursuant to the rules and regulations of the SEC and in conformity withgenerally accepted accounting principles in the U.S. ("GAAP"). Our fiscal year end is October 31. Unless otherwise stated, all years and dates refer to our fiscalyear.
Management is responsible for the fair presentation of the accompanying consolidated financial statements, prepared in accordance with GAAP, and has fullresponsibility for their integrity and accuracy. In the opinion of management, the accompanying consolidated financial statements contain all normal and recurringadjustments necessary to present fairly our consolidated balance sheet and our consolidated statement of operations, statement of comprehensive income, statementof cash flows and statement of equity.
Principles of consolidation. The consolidated financial statements include the accounts of the company and our wholly- and majority-owned subsidiaries. Allsignificant inter-company transactions have been eliminated.
Use of Estimates. The preparation of financial statements in accordance with GAAP requires management to make estimates and assumptions that affect theamounts reported in our consolidated financial statements and accompanying notes. Management bases its estimates on historical experience and various otherassumptions believed to be reasonable. Although these estimates are based on management's knowledge of current events and actions that may impact the companyin the future, actual results may be different from the estimates. Our critical accounting policies are those that affect our financial statements materially and involvedifficult, subjective or complex judgments by management. Those policies are revenue recognition, inventory valuation, share-based compensation, retirement andpost-retirement plan assumptions, valuation of goodwill and other intangible assets, warranty, restructuring and accounting for income taxes.
Acquisitions . On April 18, 2017 we acquired all of the outstanding common stock of Ixia for $1,622 million , net of $72 million of cash acquired. OnAugust 31, 2017 we acquired all of the outstanding common stock of ScienLab for $60 million , net of $2 million of cash acquired. See Note 3, "Acquisitions," forfurther discussion of the company's acquisitions of Ixia and ScienLab.
Land Sale. On April 30, 2014 we entered into a binding contract to sell land in the United Kingdom ("U.K.") that resulted in the transfer of three separate landtracts totaling approximately $34 million in May 2014, November 2015 and November 2016. In 2017 and 2016, we recognized gains of $8 million and $10 million, respectively, on the sale of the land tracts in other operating expense (income).
Revenue recognition. We enter into agreements to sell products (hardware and/or software), services and other arrangements (multiple-elementarrangements) that include combinations of products and services.
We recognize revenue, net of trade discounts and allowances, provided that (1) persuasive evidence of an arrangement exists, (2) delivery has occurred, (3) theprice is fixed or determinable and (4) collectability is reasonably assured. Delivery is considered to have occurred when title and risk of loss have transferred to thecustomer, for products, or when the service has been provided. We consider the price to be fixed or determinable when the price is not subject to refund oradjustments. We consider arrangements with extended payment terms not to be fixed or determinable, and accordingly we defer revenue until amounts becomedue. At the time of the transaction, we evaluate the creditworthiness of our customers to determine the appropriate timing of revenue recognition.
Product revenue. Our product revenue is generated predominantly from the sales of various types of test equipment and associated software. Productrevenue, including sales to resellers and distributors, is reduced for estimated returns, when appropriate. For sales or arrangements that include customer-specifiedacceptance criteria, including those where acceptance is required upon achievement of performance milestones, revenue is recognized after the acceptance criteriahave been met. For products that include installation, if the installation meets the criteria to be considered a separate element, product revenue is recognized upondelivery, and recognition of installation revenue is delayed until the installation is complete. Otherwise, neither the product nor the installation revenue isrecognized until the installation is complete.
59

Table of Contents
Where software is licensed separately, revenue is recognized when the software is delivered and has been transferred to the customer or, in the case ofelectronic delivery of software, when the customer is given access to the licensed software programs.
We also evaluate whether collection of the receivable is probable, the fee is fixed or determinable and whether any other undelivered elements of thearrangement exist on which a portion of the total fee would be allocated based on vendor-specific objective evidence ("VSOE"). When VSOE is not available wethen use third-party evidence ("TPE") or management's best estimate of selling price ("ESP").
Service revenue. Revenue from services includes repair and calibration services, extended warranty, customer and software support, consulting, training andeducation. Service revenue is deferred and recognized over the contractual period or as services are rendered and accepted by the customer. For example, customersupport contracts are recognized ratably over the contractual period, while training revenue is recognized as the training is provided to the customer. In addition,the four revenue recognition criteria described above must be met before service revenue is recognized.
Revenue recognition for arrangements with multiple deliverables. Our multiple-element arrangements are generally comprised of a combination ofmeasurement instruments, installation or other start-up services, and/or software and/or support or services. Hardware and software elements are typicallydelivered at the same time and revenue is recognized upon delivery and acceptance, if required, once title and risk of loss pass to the customer. Delivery ofinstallation, start-up services and other services varies based on the complexity of the equipment, staffing levels in a geographic location and customer preferences,and can range from a few days to a few months. Service revenue is deferred and recognized over the contractual period or as services are rendered and accepted bythe customer. Revenue from the sale of software products that are not required to deliver the tangible product's essential functionality are accounted for undersoftware revenue recognition rules which require VSOE of fair value to allocate revenue in a multiple-element arrangement. Our arrangements generally do notinclude any provisions for cancellation, termination, or refunds that would significantly impact recognized revenue.
We evaluate the deliverables in our multiple-element arrangements and conclude that they are separate units of accounting if it is determined the delivereditem or items have value to the customer on a standalone basis. For arrangements that include a general right of return relative to the delivered item(s), delivery orperformance of the undelivered item(s) has been determined to be probable and substantially in our control. We allocate revenue to each element in our multiple-element arrangements based upon their relative selling prices. We determine the selling price for each deliverable based on a selling price hierarchy. The sellingprice for a deliverable is based on VSOE if available, TPE if VSOE is not available, or ESP if neither VSOE nor TPE is available. Revenue allocated to eachelement is then recognized when the basic revenue recognition criteria for that element have been met.
Within our Ixia Solutions Group, when an arrangement contains software and non-software deliverables, we use a two-step process to allocate revenue to eachelement in the arrangement. First, we allocate the total arrangement fee to the separate non-software and software deliverables as a group based on their relativeselling prices. Then, we allocate revenue within the software group utilizing the residual method with revenue allocated to the undelivered elements based onVSOE and the residual amount allocated to the delivered elements.
We use VSOE of selling price in the selling price allocation in all instances where it exists. VSOE of selling price for products and services is determinedwhen a substantial majority of the selling prices fall within a reasonable range when sold separately. TPE of selling price can be established by evaluating largelyinterchangeable competitor products or services in standalone sales to similarly situated customers. As our products contain a significant element of proprietarytechnology and the solution offered differs substantially from that of competitors, it is difficult to obtain the reliable standalone competitive pricing necessary toestablish TPE. ESP represents the best estimate of the price at which we would transact a sale if the product or service were sold on a standalone basis. Wedetermine ESP for a product or service by using historical selling prices which reflect multiple factors including, but not limited to, customer type, geography,market conditions, competitive landscape, gross margin objectives and pricing practices. The determination of ESP is made through consultation with and approvalby management. We may modify or develop new pricing practices and strategies in the future. As these pricing strategies evolve, changes may occur in ESP. Theaforementioned factors may result in a different allocation of revenue to the deliverables in multiple-element arrangements, which may change the pattern andtiming of revenue recognition for these elements but will not change the total revenue recognized for the arrangement.
Shipping and handling costs. Our shipping and handling costs charged to customers are included in net revenue, and the associated expense is recorded incost of products for all periods presented.
Deferred revenue. Deferred revenue represents the amount that is allocated to undelivered elements in multiple-element arrangements. We limit the revenuerecognized to the amount that is not contingent on the future delivery of products or services or meeting other specified performance conditions. In addition,service revenue is deferred and recognized over the contractual period or as services are rendered and accepted by the customer.
60

Table of Contents
Accounts receivable, net. Trade accounts receivable are recorded at the invoiced amount and do not bear interest. Such accounts receivable have beenreduced by an allowance for doubtful accounts, which is our best estimate of the amount of probable credit losses in our existing accounts receivable. Wedetermine the allowance based on customer specific experience and the aging of such receivables, among other factors. The allowance for doubtful accounts wasapproximately $3 million and $2 million as of October 31, 2017 and 2016, respectively. We do not have any off-balance-sheet credit exposure related to ourcustomers. Accounts receivable are also recorded net of product returns.
Share-based compensation. We account for share-based awards made to our employees and directors, including employee stock option awards, restrictedstock units, employee stock purchases made under Keysight's Employee Stock Purchase Plan ("Keysight's ESPP") and performance share awards under KeysightTechnologies, Inc. Long-Term Performance ("Keysight's LTP") Program, using the estimated grant date fair value method of accounting. Under the fair valuemethod, we recorded compensation expense for all share-based awards of $56 million in 2017 , $49 million in 2016 and $55 million in 2015 .
Inventory. Inventory is valued at standard cost, which approximates actual cost computed on a first-in, first-out basis, not in excess of market value. Weassess the valuation of our inventory on a periodic basis and make adjustments to the value for estimated excess and obsolete inventory based on estimates aboutfuture demand and actual usage. The excess balance determined by this analysis becomes the basis for our excess inventory charge. Our excess inventory reviewprocess includes analysis of sales unit forecasts, managing product rollovers and working with manufacturing to maximize recovery of excess inventory.
Warranty. Our standard warranty term for most of our products from the date of delivery is typically three years. We accrue for standard warranty costsbased on historical trends in warranty charges. The accrual is reviewed regularly and periodically adjusted to reflect changes in warranty cost estimates. Estimatedwarranty charges are recorded within cost of products at the time related product revenue is recognized. See Note 16, "Guarantees."
We also sell extended warranties that provide warranty coverage beyond the standard warranty term. Revenue associated with extended warranties is deferredand recognized over the extended coverage period.
Taxes on income. Income tax expense is based on income or loss before taxes. Deferred income taxes reflect the effect of temporary differences betweenasset and liability amounts that are recognized for financial reporting purposes and the amounts that are recognized for income tax purposes. These deferred taxesare measured by applying currently enacted tax laws. Valuation allowances are recognized to reduce deferred tax assets to the amount that is more likely than notto be realized.
We account for uncertainty in income taxes using a two-step approach to recognizing and measuring uncertain tax positions. The first step is to evaluate thetax position for recognition by determining if the weight of available evidence indicates that it is more likely than not that the position will be sustained on audit,including resolution of related appeals or litigation processes, if any. The second step is to measure the tax benefit as the largest amount that is more than 50%likely of being realized upon settlement. We make adjustments to these reserves when facts and circumstances change, such as the closing of a tax audit or therefinement of an estimate due to new information. We classify the liability for unrecognized tax benefits as current to the extent that the company anticipatespayment (or receipt) of cash within one year. Interest and penalties related to uncertain tax positions are recognized in the provision for income taxes. Given thenumber of years and numerous matters that remain subject to examination in various tax jurisdictions, we are unable to estimate the range of possible changes tothe balance of our unrecognized tax benefits.
Goodwill and other intangible assets. Goodwill is assessed for impairment at least annually in the fourth quarter, as of September 30, on a reporting unitbasis, or more frequently when events and circumstances occur indicating that the recorded goodwill may be impaired. In accordance with the authoritativeaccounting guidance we have the option to perform a qualitative assessment to determine whether it is more-likely-than-not that the fair value of a reporting unit isless than its carrying amount. If we determine this is the case, we are required to perform the two-step goodwill impairment test to identify potential goodwillimpairment and measure the amount of goodwill impairment loss to be recognized. If we determine that it is more-likely-than-not that the fair value of thereporting unit is greater than its carrying amounts, the two-step goodwill impairment test is not required.
As defined in the authoritative guidance, a reporting unit is an operating segment, or one level below an operating segment. In 2016, we implemented changesin our organizational structure designed to align our organization with the industries we serve, which resulted in the formation of three reportable operatingsegments that are also our reporting units. On April 18, 2017 we completed the acquisition of Ixia, which became our fourth reportable operating segment, the IxiaSolutions Group, and reporting unit. In 2017, we assessed goodwill impairment by performing a qualitative test for our four reporting units. Based on the results ofour testing, it was determined that it is more-likely-than-not that the fair values of the reporting units are greater than their carrying values. There was noimpairment of goodwill during the years ended October 31, 2017, 2016 and 2015.
Other intangible assets consist primarily of developed technologies, proprietary know-how, trademarks, customer relationships, non-compete agreements, andbacklog and are amortized using the straight-line method over estimated useful lives ranging from
61

Table of Contents
3 months to 10 years. No impairments of purchased intangible assets were recorded during the year ended October 31, 2017, 2016 and 2015.
We review other intangible assets for impairment whenever events or changes in business circumstances indicate that the carrying amount of the assets maynot be fully recoverable or that the useful lives of these assets are no longer appropriate. The authoritative accounting guidance allows a qualitative approach fortesting indefinite-lived intangible assets for impairment, similar to the impairment testing guidance for goodwill. It allows the option to first assess qualitativefactors (events and circumstances) that could have affected the significant inputs used in determining the fair value of the indefinite-lived intangible asset. Thequalitative factors assist in determining whether it is more-likely-than-not that the indefinite-lived intangible asset is impaired. An organization may choose tobypass the qualitative assessment for any indefinite-lived intangible asset in any period and proceed directly to calculating its fair value. Our indefinite-livedintangible assets are in-process research and development ("IPR&D") intangible assets. In 2017, we assessed impairment by performing a qualitative test andrecorded an impairment charge of $7 million related to the cancellation of an IPR&D project. There were no impairments in 2016 and 2015.
Advertising. Advertising costs are expensed as incurred and amounted to $22 million in 2017 , $19 million in 2016 and $27 million in 2015 .
Research and development. Costs related to the research, design and development of our products are charged to research and development expense as theyare incurred.
Sales taxes. Sales taxes collected from customers and remitted to governmental authorities are not included in our revenue.
Investments. Cost method investments consisting of non-marketable equity securities are accounted for at historical cost. Trading securities are reported at fairvalue, with gains or losses resulting from changes in fair value recognized currently in earnings. Investments designated as available-for-sale are reported at fairvalue, with unrealized gains and losses, net of tax, included in accumulated other comprehensive income. The company assesses investments for impairmentwhenever events or changes in circumstances indicate that the carrying value of an investment may not be recoverable. There was no impairment recognized in2017. In 2016, cost method investments with a carrying amount of $2 million were written down to their fair value of zero , resulting in an impairment charge of $2million , which is included in other income (expense). In 2015, cost method investments with a carrying amount of $4 million were written down to their fair valueof zero , resulting in an impairment charge of $4 million , which is included in other income (expense).
Net income per share. Basic net income per share is computed by dividing net income - the numerator - by the weighted average number of common sharesoutstanding - the denominator - during the period excluding the dilutive effect of stock options and other employee stock plans. Diluted net income per share giveseffect to all potentially dilutive common stock equivalents outstanding during the period. The dilutive effect of share-based awards is reflected in diluted netincome per share by application of the treasury stock method, which includes consideration of unamortized share-based compensation expense, the tax benefitsrecorded in additional paid-in capital and the dilutive effect of in-the-money options and non-vested restricted stock units. Under the treasury stock method, theamount the employee must pay for exercising stock options, unamortized share-based compensation expense and tax benefits are assumed proceeds to be used torepurchase hypothetical shares.
Cash, cash equivalents and short term investments. We classify investments as cash equivalents if their original maturity or remaining maturity at the time ofpurchase is three months or less at the date of purchase. Cash equivalents are stated at cost, which approximates fair value.
As of October 31, 2017 , approximately $767 million of our cash and cash equivalents was held outside of the U.S. in our foreign subsidiaries. Under currenttax laws, most of the cash could be repatriated to the U.S., but it would be subject to U.S. federal and state income taxes, less applicable foreign tax credits. Ourcash and cash equivalents mainly consist of short-term deposits held at major global financial institutions, investments in institutional money market funds, andsimilar short duration instruments with original maturities of 90 days or less. We continuously monitor the creditworthiness of the financial institutions andinstitutional money market funds in which we invest our funds.
We classify investments as short-term investments if their original maturities are greater than three months and their remaining maturities are one year or less.
Restricted cash . As of October 31, 2017, restricted cash of approximately $2 million consisted of deposits held as collateral against bank guarantees and isclassified within other assets in the consolidated balance sheet. As of October 31, 2016, restricted cash of $2 million consisted of approximately $1 million ofdeposits held as collateral against bank guarantees and approximately $1 million of deposits held as collateral against foreign currency hedging contracts and isclassified within other assets and other current assets, respectively, on the consolidated balance sheet.
62

Table of Contents
Fair value of financial instruments. The carrying values of certain of our financial instruments including cash and cash equivalents, accounts receivable,accounts payable, and other accrued liabilities approximate fair value because of their short maturities. The fair value of long-term equity investments isdetermined using quoted market prices for those securities when available. For those long-term equity investments accounted for under the cost or equity method,their carrying value approximates their estimated fair value. The fair value of our long-term debt, calculated from quoted prices which are primarily Level 1 inputsunder the accounting guidance fair value hierarchy, exceeded the carrying value by approximately $91 million and $30 million as of October 31, 2017 and 2016,respectively. The fair value of foreign currency contracts used for hedging purposes is estimated internally by using inputs tied to active markets. These inputs, forexample, interest rate yield curves, foreign exchange rates, and forward and spot prices for currencies are observable in the market or can be corroborated byobservable market data for substantially the full term of the assets or liabilities. See also Note 12, "Fair Value Measurements," for additional information on the fairvalue of financial instruments.
Concentration of credit risk. Financial instruments that potentially subject us to significant concentration of credit risk include money market fundinvestments, time deposits and demand deposit balances. These investments are categorized as cash and cash equivalents and long-term investments. In addition,we have credit risk from derivative financial instruments used in hedging activities and accounts receivable. We invest in a variety of financial instruments andlimit the amount of credit exposure with any one financial institution. We have a comprehensive credit policy in place and credit exposure is monitored on anongoing basis.
Credit risk with respect to our accounts receivable is diversified due to the large number of entities comprising our customer base and their dispersion acrossmany different industries and geographies. Credit evaluations are performed on customers requiring credit over a certain amount.
Credit risk is mitigated through collateral such as letters of credit, bank guarantees or payment terms like cash in advance. No single customer accounted formore than 10 percent of accounts receivable as of October 31, 2017 or 2016 .
Derivative instruments. We are exposed to global foreign currency exchange rate risk in the normal course of business. We enter into foreign exchangehedging contracts, primarily forward contracts and purchased options to manage financial exposures resulting from changes in foreign currency exchange rates.Foreign currency exposures include committed and anticipated revenue and expense transactions (cash flow exposure) and assets and liabilities that aredenominated in currencies other than the functional currency of the subsidiary (balance sheet exposure). For cash flow hedges, contracts are designed at inceptionas hedges of the related foreign currency exposures. For option contracts, we exclude time value from the measurement of effectiveness. We formally document allrelationships between hedging instruments and hedged items, as well as our risk-management objective and strategy for undertaking various hedge transactions atthe inception of the hedge. This process includes linking all derivatives that are designated as cash flow hedges to specific forecasted transactions. We alsoformally assess, both at the hedge’s inception and on an ongoing basis, whether the hedging instruments are highly effective in offsetting changes in cash flows ofhedged items. Our foreign exchange hedging contracts generally mature within twelve months. We do not use derivative financial instruments for speculativetrading purposes.
All derivatives are recognized on the balance sheet at their fair values. For derivative instruments that are designated and qualify as a cash flow hedge, changesin the value of the effective portion of the derivative instrument is recognized in accumulated comprehensive income, a component of stockholders' equity.Amounts associated with cash flow hedges are reclassified and recognized in income when either the forecast transaction occurs or it becomes probable theforecast transaction will not occur. Derivatives not designated as hedging instruments are recorded on the balance sheet at their fair value and changes in the fairvalues are recorded in earnings in the current period. Derivative instruments are subject to master netting arrangements and qualify for net presentation in thebalance sheet. Changes in the fair value of the ineffective portion of derivative instruments are recognized in earnings in the current period. Cash flows fromderivative instruments are classified in the statement of cash flows in the same category as the cash flows from the hedged or economically hedged item, primarilyin operating activities.
Property, plant and equipment. Property, plant and equipment are stated at cost less accumulated depreciation. Additions, improvements and major renewalsare capitalized; maintenance, repairs and minor renewals are expensed as incurred. When assets are retired or disposed of, the assets and related accumulateddepreciation and amortization are removed from our general ledger, and the resulting gain or loss is reflected in the consolidated statement of operations. Buildingsand improvements are depreciated over the lesser of their useful lives or the remaining term of the lease and machinery and equipment over three to ten years. Weuse the straight-line method to depreciate assets.
Leases. We lease buildings, machinery and equipment under operating leases for original terms ranging generally from one to twenty-five years. Certainleases contain renewal options for periods up to ten years.
Capitalized software. We capitalize certain internal and external costs incurred to acquire or create internal use software. Capitalized software is included inproperty, plant and equipment and is depreciated over three years once development is complete.
63

Table of Contents
Impairment of long-lived assets. We continually monitor events and changes in circumstances that could indicate carrying amounts of long-lived assets,including intangible assets, may not be recoverable. When such events or changes in circumstances occur, we assess the recoverability of long-lived assets bydetermining whether the carrying value of such assets will be recovered through undiscounted expected future cash flows. If the total of the undiscounted futurecash flows is less than the carrying amount of those assets, we recognize an impairment loss based on the excess of the carrying amount over the fair value of theassets.
Restructuring costs. The main component of our existing restructuring plans is related to workforce reductions. Workforce reduction charges are accruedwhen payment of benefits becomes probable and the amounts can be estimated. If the amounts and timing of cash flows from restructuring activities aresignificantly different from what we have estimated, the actual amount of restructuring and other related charges could be materially different, either higher orlower, than those we have recorded.
Employee compensation and benefits. Amounts owed to employees, such as accrued salary, bonuses and vacation benefits are accounted for within employeecompensation and benefits. The total amount of accrued vacation benefit was $72 million and $66 million as of October 31, 2017 and 2016 , respectively.
Foreign currency translation. We translate and remeasure balance sheet and statement of operations items into U.S. dollars. For those subsidiaries thatoperate in a local currency functional environment, all assets and liabilities are translated into U.S. dollars using current exchange rates at the balance sheet date;revenue and expenses are translated using monthly exchange rates which approximate to average exchange rates in effect during each period. Resulting translationadjustments are reported as a separate component of accumulated other comprehensive income (loss) in stockholders' equity.
For those subsidiaries that operate in a U.S. dollar functional environment, foreign currency assets and liabilities are re-measured into U.S. dollars at currentexchange rates except for non-monetary assets and capital accounts which are remeasured at historical exchange rates. Revenue and expenses are generallyremeasured at monthly exchange rates which approximate average exchange rates in effect during each period. Gains or losses from foreign currency re-measurement are included in net income. Net gains or losses resulting from foreign currency transactions are reported in other income (expense) and were a $1million gain in 2017, zero in 2016, and a $5 million gain in 2015.
Retirement plans and post-retirement benefit plan assumptions. Retirement and post-retirement benefit plan costs are a significant cost of doing business.They represent obligations that will ultimately be settled sometime in the future and therefore are subject to estimation. Pension accounting is intended to reflectthe recognition of future benefit costs over the employees' average expected future service to Keysight based on the terms of the plans and investment and fundingdecisions. To estimate the impact of these future payments and our decisions concerning funding of these obligations, we are required to make assumptions usingactuarial concepts within the framework of GAAP. Two critical assumptions are the discount rate and the expected long-term return on plan assets. Otherimportant assumptions include, expected future salary increases, expected future increases to benefit payments, expected retirement dates, employee turnover,retiree mortality rates, and portfolio composition. We evaluate these assumptions at least annually. See Note 15, "Retirement Plans and Post-Retirement BenefitPlans."
2. NEW ACCOUNTING PRONOUNCEMENTS
In May 2014, the Financial Accounting Standards Board ("FASB") issued guidance which will replace numerous requirements in GAAP, including industry-specific requirements, and provide companies with a single revenue recognition model for recognizing revenue from contracts with customers. The core principleof the new standard is that a company should recognize revenue to show the transfer of promised goods or services to customers in an amount that reflects theconsideration to which the company expects to be entitled in exchange for those goods or services. In July 2015, the FASB deferred the effective date by one yearto December 15, 2017 for annual reporting periods beginning after that date. The FASB also permitted early adoption of the standard, but not before the originaleffective date of December 15, 2016. During 2016, the FASB issued several amendments to the standard, including clarification to the guidance on reportingrevenues as a principal versus an agent, identifying performance obligations, accounting for intellectual property licenses, assessing collectability, presentation ofsales taxes, impairment testing for contract costs and disclosure of performance obligations.
The two permitted transition methods under the new standard are (1) the full retrospective method, in which case the standard would be applied to each priorreporting period presented, and the cumulative effect of applying the standard would be recognized at the earliest period shown, or (2) the modified retrospectivemethod, in which case the cumulative effect of applying the standard would be recognized at the date of initial application. We currently anticipate adopting thestandard on November 1, 2018 and are evaluating the transition methods available. Based on the progress to date, we have not identified any material impacts ofthe new standard on the amount and timing of revenue recognition to our consolidated statement of operations; however, we have not completed our assessment,including the impact of our recent acquisitions of Ixia and ScienLab. We expect recognition of revenue for a majority of customer contracts to remain substantiallyunchanged. While we are continuing to assess all potential impacts of the standard, we currently believe the most significant impact relates to our accounting forsoftware license revenue, as under the
64

Table of Contents
new standard we expect to recognize software license revenue at the time of billing rather than over the contractual term since control of the software license istransferred, and our performance obligation is satisfied at that point in time. The new standard will also require the deferral of commissions that were previouslyexpensed as incurred and may qualify for capitalization under the new standard.
In April 2015, the FASB issued Accounting Standards Update ("ASU") 2015-03, Simplifying the Presentation of Debt Issuance Costs , to simplify thepresentation of deferred issuance costs by requiring that they be presented as a direct deduction from the carrying amount of the debt liability, consistent with debtdiscounts. The standard was effective for fiscal years beginning after December 15, 2015, and interim periods within those fiscal years. We adopted this guidanceretrospectively during the first quarter of 2017. As a result, $7 million of unamortized debt issuance costs have been reclassified from other assets to long-term debtin the consolidated balance sheet as of October 31, 2016 (see Note 18).
In May 2015, the FASB issued ASU 2015-07, Disclosures for Investments in Certain Entities that Calculate Net Asset Value per Share (or its Equivalent) ,that removes the requirement to categorize within the fair value hierarchy all investments for which fair value is measured using the net asset value per sharepractical expedient. The standard also removes the requirement to make certain disclosures for all investments that are eligible to be measured at fair value usingthe net asset value per share practical expedient. Rather, those disclosures are limited to investments for which the entity has elected to measure the fair value usingthat practical expedient. The standard was effective for fiscal years beginning after December 15, 2015, including interim periods within those fiscal years. Weadopted this guidance retrospectively during 2017 (see Note 15).
In February 2016, the FASB issued guidance that will require organizations that lease assets to recognize assets and liabilities for leases with lease terms ofmore than 12 months. Consistent with current GAAP, the recognition, measurement, and presentation of expenses and cash flows arising from a lease by a lesseeprimarily will depend on its classification as a finance or operating lease. However, unlike current GAAP, which requires only capital leases to be recognized onthe balance sheet, the new guidance will require both types of leases to be recognized on the balance sheet. The standard is effective for fiscal years beginning afterDecember 15, 2018, and interim periods within those fiscal years. Early adoption is permitted. We are evaluating the impact of adopting this guidance on ourconsolidated financial statements.
In March 2016, the FASB issued ASU 2016-09, Improvements to Employee Share-Based Payment Accounting , that amends the accounting for stock-basedcompensation and requires excess tax benefits and deficiencies to be recognized as a component of income tax expense rather than equity. This guidance alsorequires excess tax benefits and deficiencies to be presented as an operating activity on the statement of cash flows and allows an entity to make an accountingpolicy election to either estimate expected forfeitures or to account for them as they occur. The standard is effective for annual reporting periods beginning afterDecember 15, 2016. We will adopt this guidance on November 1, 2017 in the first quarter for 2018 by recording the cumulative impact of applying this guidance toretained earnings. We estimate the impact to retained earnings, including the change in the forfeiture policy, will be approximately $6 million .
The prospective inclusion of excess tax benefits and deficiencies as a component of our income tax expense will increase volatility within our provision forincome taxes as the amount of excess tax benefits or deficiencies from stock-based compensation awards are dependent on our stock price at the date the awardsvest. As a measure of sensitivity, had we adopted this guidance at the beginning of 2017, our income tax expense would have decreased by approximately $4million , which reflects the amount of excess tax benefits recognized during the year ended October 31, 2017.
In October 2016, the FASB issued ASU 2016-16, Intra-Entity Transfers of Assets Other Than Inventory , that removes the requirement under which theincome tax consequences of intra-entity transfers are deferred until the assets are ultimately sold to an outside party, except for transfers of inventory. The taxconsequences of such transfers would be recognized in tax expense when the transfers occur. The standard was effective for annual reporting periods beginningafter December 15, 2017, and interim periods within those annual periods. We elected to early adopt this guidance on a modified retrospective basis during the firstquarter of 2017. As a result, a $10 million cumulative-effect adjustment was recorded directly to retained earnings as of November 1, 2016, the beginning of theannual period of adoption, with corresponding reductions of $2 million , $6 million and $2 million to other current assets, other assets, and long-term deferred taxassets, respectively.
In January 2017, the FASB issued guidance to narrow the definition of a business and provide a framework that gives entities a basis for making reasonablejudgments about whether a transaction involves an asset or a business. The standard is effective for fiscal years beginning after December 15, 2017, and interimperiods within those fiscal years. Early adoption is permitted. We do not expect a material impact to our consolidated financial statements due to the adoption ofthis guidance.
In January 2017, the FASB issued guidance that eliminates the requirement to calculate the implied fair value of goodwill to measure a goodwill impairmentcharge. Instead, entities will record an impairment charge based on the excess of a reporting unit’s carrying amount over its fair value. The standard is effective forannual or any interim goodwill impairment tests in fiscal years
65

Table of Contents
beginning after December 15, 2019. We do not expect a material impact to our consolidated financial statements due to the adoption of this guidance.
In March 2017, the FASB issued guidance that requires the service cost component of net periodic pension cost and net periodic post-retirement benefit cost tobe included in operating expenses (together with other employee compensation costs) and the other components of the cost to be included in non-operatingexpenses. The standard is effective for annual and interim periods beginning after December 31, 2017. Early adoption is permitted. We are evaluating the impact ofadopting this guidance on our consolidated financial statements.
In May 2017, the FASB issued guidance that clarifies when changes to the terms or conditions of a share-based payment award must be accounted for asmodifications. Specifically, an entity would not apply modification accounting if the fair value, vesting conditions, and classification of the awards are the sameimmediately before and after the modification. The standard is effective for fiscal years beginning after December 31, 2017, and interim periods within those fiscalyears. Early adoption is permitted. We are evaluating the impact of adopting this guidance on our consolidated financial statements.
In August 2017, the FASB issued guidance to enable entities to better portray the economics of their risk management activities in the financial statements andenhance transparency and understandability of hedge results. The standard is effective for fiscal years beginning after December 15, 2018, and interim periodswithin those fiscal years. Early adoption is permitted. We are evaluating the impact of adopting this guidance on our consolidated financial statements.
Other amendments to GAAP that have been issued by the FASB or other standards-setting bodies that do not require adoption until a future date are notexpected to have a material impact on our consolidated financial statements upon adoption.
3. ACQUISITIONS
Acquisitions in 2017
Acquisition of Ixia
On April 18, 2017 , pursuant to the terms of an Agreement and Plan of Merger dated January 30, 2017 , between Keysight and Ixia (the "Merger Agreement"),we acquired all of the outstanding common stock of Ixia for $ 1,622 million , net of $72 million of cash acquired, pursuant to an exchange offer for $19.65 pershare (the "Merger Consideration"). Pursuant to the Merger Agreement, any outstanding and unexercised Ixia stock options with an exercise price below theMerger Consideration and any outstanding Ixia restricted stock awards were cancelled and converted into the right to receive a cash payment equal to the mergerconsideration of $19.65 per share (minus the exercise price for the Ixia stock options). The vested portion of the awards associated with prior service of Ixiaemployees represented approximately $47 million of the total consideration. We funded the acquisition with a combination of cash and proceeds from debt andequity financings. As a result of the acquisition, Ixia has become a wholly-owned subsidiary of Keysight. Accordingly, the results of Ixia are included in Keysight'sconsolidated financial statements from the date of the acquisition and are reported in the Ixia Solutions Group operating segment.
The Ixia acquisition was accounted for in accordance with the authoritative accounting guidance. The acquired assets and assumed liabilities were recorded byKeysight at their estimated fair values. Keysight determined the estimated fair values with the assistance of appraisals or valuations performed by third partyspecialists, discounted cash flow analysis, and estimates made by management. We expect to leverage and expand the existing sales channels and productdevelopment resources, and utilize the assembled workforce. The company also anticipates opportunities for growth through expanded geographic and customersegment diversity and the ability to leverage additional products and capabilities. These factors, among others, contributed to a purchase price in excess of theestimated fair value of Ixia's net identifiable assets acquired (see summary of net assets below), and, as a result, we have recorded goodwill in connection with thistransaction.
All goodwill was assigned to the Ixia Solutions Group. We do not expect the goodwill recognized or any potential impairment charges in the future to bedeductible for income tax purposes.
A portion of the overall purchase price was allocated to acquired intangible assets. Amortization expense associated with acquired intangible assets is notdeductible for tax purposes. Therefore, a deferred tax liability of approximately $186 million was established primarily for the future amortization of theseintangibles and is included in "other long-term liabilities" in the table below.
66

Table of Contents
The following table summarizes the preliminary allocation of the purchase price to the estimated fair values of the assets acquired and liabilities assumed onthe closing date of April 18, 2017 (in millions):
Cash and cash equivalents $ 72Short-term investments 44Accounts receivable 91Inventory 107Other current assets 34Property, plant and equipment 50Goodwill 1,117Other intangible assets 744Other assets 4
Total assets acquired 2,263Accounts payable (10)Employee compensation and benefits (32)Deferred revenue (35)Income and other taxes payable (1)Other accrued liabilities (32)Other long-term liabilities (459)
Net assets acquired $ 1,694
The fair values of cash and cash equivalents, short-term investments, accounts receivable, other current assets, accounts payable, employee compensation andbenefits, and other accrued liabilities were generally determined using historical carrying values given the short-term nature of these assets and liabilities. The fairvalues for acquired inventory, property, plant and equipment, intangible assets, and deferred revenue were determined with the input from third-party valuationspecialists. The fair values of certain other assets and certain other liabilities were determined internally using historical carrying values and estimates made bymanagement. During the third quarter of 2017, the fair value measurements of assets acquired and liabilities assumed as of the acquisition date were refined. Thetotal purchase price allocation adjustment to goodwill in the third quarter was approximately $137 million and related primarily to an increase in the allocation todeferred tax liabilities. Initially during the second quarter of 2017 upon closing of the acquisition, the company recorded a deferred tax liability of $113 million fornon-permanently invested earnings based on a preliminary calculation. During the third quarter of 2017, the company obtained additional information to allow therefinement of this calculation and made adjustments to increase the deferred tax liability for non-permanently invested earnings by $149 million , to decrease thedeferred tax liability by $9 million for conformance of transfer pricing policies, and to decrease the deferred tax liability by $3 million for other adjustments relatedto the Ixia U.S. group. During the fourth quarter of 2017, the company made adjustments to increase the deferred tax liability and recognize additional withholdingtax receivable. These fourth quarter adjustments were under $1 million. If additional information becomes available, we may revise the preliminary purchase priceallocation during the remainder of the measurement period (which will not exceed 12 months from the acquisition date). Any such revisions or changes may bematerial.
Valuation of Intangible Assets Acquired
The components of intangible assets acquired in connection with the Ixia acquisition were as follows (in millions):
Estimated Fair
Value Estimated useful lifeDeveloped product technology $ 423 4 yearsCustomer relationships 234 7 yearsTradenames and trademarks 12 3 yearsBacklog 8 90 daysTotal intangible assets subject to amortization 677 In-process research and development 67
Total intangible assets $ 744
As noted above, the intangible assets were valued with input from valuation specialists using the income approach, which includes the discounted cash flow,cost-savings, and relief from royalty methods. The in-process research and development was valued using the multi-period excess earnings method under theincome approach by discounting forecasted cash flows directly related to the products expecting to result from the projects, net of returns on contributory assets. Adiscount rate of 14% was used to value the research and development projects, adjusted to reflect additional risks inherent in the acquired projects. The primary
67

Table of Contents
in-process projects acquired relate to next generation products which will be released in the near future. Total costs to complete for all Ixia in-process research anddevelopment were estimated at approximately $12 million as of the close date.
Acquisition and integration costs directly related to the Ixia acquisition were recorded in the consolidated statement of operations as follows:
Year Ended October 31, 2017 (in millions)Cost of products and services $ 2Research and development 1Selling, general and administrative 42Other income (expense), net 10
Total acquisition and integration costs $ 55
Such costs are expensed in accordance with the authoritative accounting guidance. In addition, for the year ended October 31, 2017, we incurred $28 millionof acquisition-related compensation expense to redeem certain of Ixia's outstanding unvested stock awards as of the date of the Merger Agreement that weredetermined to relate to post-merger service periods.
Acquisition of ScienLab
On August 31, 2017 , we acquired all of the outstanding common stock of ScienLab for $60 million , net of $2 million of cash acquired. ScienLab is aGermany-based company that provides test solutions to automotive original equipment manufacturers and Tier 1 suppliers in the automotive and energy markets.This acquisition complements our portfolio, allowing end-to-end solutions for hybrid electric vehicles, electric vehicles, and battery test solutions that address e-mobility market dynamics. We funded the acquisition using existing cash. As a result of the acquisition, ScienLab has become a wholly-owned subsidiary ofKeysight. Accordingly, the results of ScienLab are included in Keysight's consolidated financial statements from the date of the acquisition and are reported in theElectronic Industrial Solutions Group operating segment. For the period from September 1, 2017 to October 31, 2017, ScienLab's net revenue and net loss was $1million and $2 million , respectively.
The ScienLab acquisition was accounted for in accordance with the authoritative accounting guidance. The acquired assets and assumed liabilities wererecorded by Keysight at their estimated fair values. Keysight determined the estimated fair values with the assistance of appraisals or valuations performed by thirdparty specialists, discounted cash flow analysis, and estimates made by management. We expect to leverage and expand the existing sales channels and productdevelopment resources, and utilize the assembled workforce. The company also anticipates opportunities for growth through expanded geographic and customersegment diversity and the ability to leverage additional products and capabilities. These factors, among others, contributed to a purchase price in excess of theestimated fair value of ScienLab's net identifiable assets acquired (see summary of net assets below), and, as a result, we have recorded goodwill in connectionwith this transaction.
All goodwill was assigned to the Electronic Industrial Solutions Group. We do not expect the goodwill recognized or any potential impairment charges in thefuture to be deductible for income tax purposes.
A portion of the overall purchase price was allocated to acquired intangible assets. Amortization expense associated with acquired intangible assets is notdeductible for tax purposes. Therefore, a deferred tax liability of approximately $13 million was established primarily for the future amortization of theseintangibles and is included in "other long-term liabilities" in the table below.
68

Table of Contents
The following table summarizes the preliminary allocation of the purchase price to the estimated fair values of the assets acquired and liabilities assumed onthe closing date of August 31, 2017 (in millions):
Cash and cash equivalents $ 2Accounts receivable 3Inventory 16Other current assets 1Goodwill 23Other intangible assets 40
Total assets acquired 85Accounts payable (1)Deferred revenue (3)Income and other taxes payable (2)Current portion of long-term debt (1)Other long-term liabilities (16)
Net assets acquired $ 62
The fair values of cash and cash equivalents, accounts receivable, other current assets, accounts payable, deferred revenue, and current portion of long-termdebt were generally determined using historical carrying values given the short-term nature of these assets and liabilities. The fair values for acquired inventoryand intangible assets were determined with the input from third-party valuation specialists. The fair values of certain other liabilities were determined internallyusing historical carrying values and estimates made by management. As additional information becomes available, we may revise the preliminary purchase priceallocation during the remainder of the measurement period (which will not exceed 12 months from the acquisition date). Any such revisions or changes may bematerial.
Valuation of Intangible Assets Acquired
The components of intangible assets acquired in connection with the ScienLab acquisition were as follows (in millions):
Estimated Fair
Value Estimated useful lifeDeveloped product technology $ 33 6 yearsCustomer relationships 4 5 yearsNon-compete agreements 1 3 yearsTradenames and trademarks 1 3 yearsBacklog 1 6 months
Total intangible assets $ 40
As noted above, the intangible assets were valued with input from valuation specialists using the income approach, which includes the discounted cash flow,cost-savings, and relief from royalty methods.
Acquisition and integration costs directly related to the ScienLab acquisition totaled $1 million for the year ended October 31, 2017 which were recorded inselling, general and administrative expenses.
Acquisitions in 2015Acquisition of Anite
On August 13, 2015 , we acquired all of the share capital of Anite plc ("Anite.") Anite was a U.K.-based global company with strong software expertise and aleading supplier of wireless test solutions. As a result of the acquisition, Anite has become a wholly-owned subsidiary of Keysight. Accordingly, the results ofAnite are included in Keysight's consolidated financial statements from the date of the acquisition. For the period from August 14, 2015 to October 31, 2015,Anite's net revenue was $25 million and net loss was $14 million . This acquisition strengthened our wireless software design and test portfolio and its NetworkTest business expanded our served addressable market. Coupled with Keysight's expertise in helping customers design and test hardware, we can now providecustomers with more comprehensive wireless solutions. Anite’s Network Test business will also enable us to provide innovative solutions that help customersdeliver an outstanding experience for mobile users in the network.
The consideration paid was approximately $558 million , net of $43 million of cash acquired. We funded the acquisition using our existing cash. In connectionwith the acquisition of Anite, we entered into several foreign currency forward contracts to mitigate the currency exchange risk associated with the payment of thepurchase price in British Pound currency. The aggregate notional
69

Table of Contents
amount of the currencies hedged was $608 million . These foreign exchange contracts did not qualify for hedge accounting treatment and were not designated ashedging instruments. The resulting loss on settlement, on the date of acquisition, was $2 million and was recorded in other income (expense) in the consolidatedstatement of operations for the year ended October 31, 2015.
The Anite acquisition was accounted for in accordance with the authoritative accounting guidance. The acquired assets and assumed liabilities were recordedby Keysight at their estimated fair values. Keysight determined the estimated fair values with the assistance of appraisals or valuations performed by third partyspecialists, discounted cash flow analysis, and estimates made by management. We expect to leverage and expand the existing sales channels and productdevelopment resources, and utilize the assembled workforce. The company also anticipates opportunities for growth through expanded geographic and customersegment diversity and the ability to leverage additional products and capabilities. These factors, among others, contributed to a purchase price in excess of theestimated fair value of Anite's net identifiable assets acquired (see summary of net assets below), and, as a result, we have recorded goodwill in connection withthis transaction.
All goodwill was allocated to the Communications Solutions Group reporting unit. We do not expect the goodwill recognized to be deductible for income taxpurposes. Any potential impairment charges made in the future associated with goodwill will not be tax deductible.
A portion of the overall purchase price was allocated to acquired intangible assets. Amortization expense associated with acquired intangible assets is notdeductible for tax purposes. Therefore, a deferred tax liability of approximately $47 million was established primarily for the future amortization of theseintangibles and is included in "other long-term liabilities" in the table below.
The following table summarizes the final allocation of the purchase price to the estimated fair values of the assets acquired and liabilities assumed on theclosing date of August 13, 2015 (in millions):
Cash and cash equivalents $ 43Accounts receivable 32Inventory 19Deferred tax assets 1Other current assets 10Property, plant and equipment 31Intangible assets 244Goodwill 324Long-term deferred tax assets 5
Total assets acquired 709Accounts payable (10)Employee compensation and benefits (3)Deferred revenue (17)Income and other taxes payable —Other accrued liabilities (26)Other long-term liabilities (50)
Net assets acquired $ 603
The fair value of cash and cash equivalents, accounts receivable, other current assets, accounts payable, employee compensation and benefits, and otheraccrued liabilities were generally determined using historical carrying values given the short-term nature of these assets and liabilities. The fair values for acquiredinventory, property, plant and equipment, intangible assets, and deferred revenue were determined with the input from third-party valuation specialists. The fairvalues of certain other assets and certain other liabilities were determined internally using historical carrying values and estimates made by management.
Valuations of intangible assets acquired
The components of intangible assets acquired in connection with the Anite acquisition were as follows (in millions):
Estimated Fair Value Estimated useful lifeDeveloped product technology $ 182 6 yearsCustomer relationships 31 8 yearsTradenames and trademarks 19 10 yearsTotal intangible assets subject to amortization 232 In-process research and development 12
Total intangible assets $ 244
70
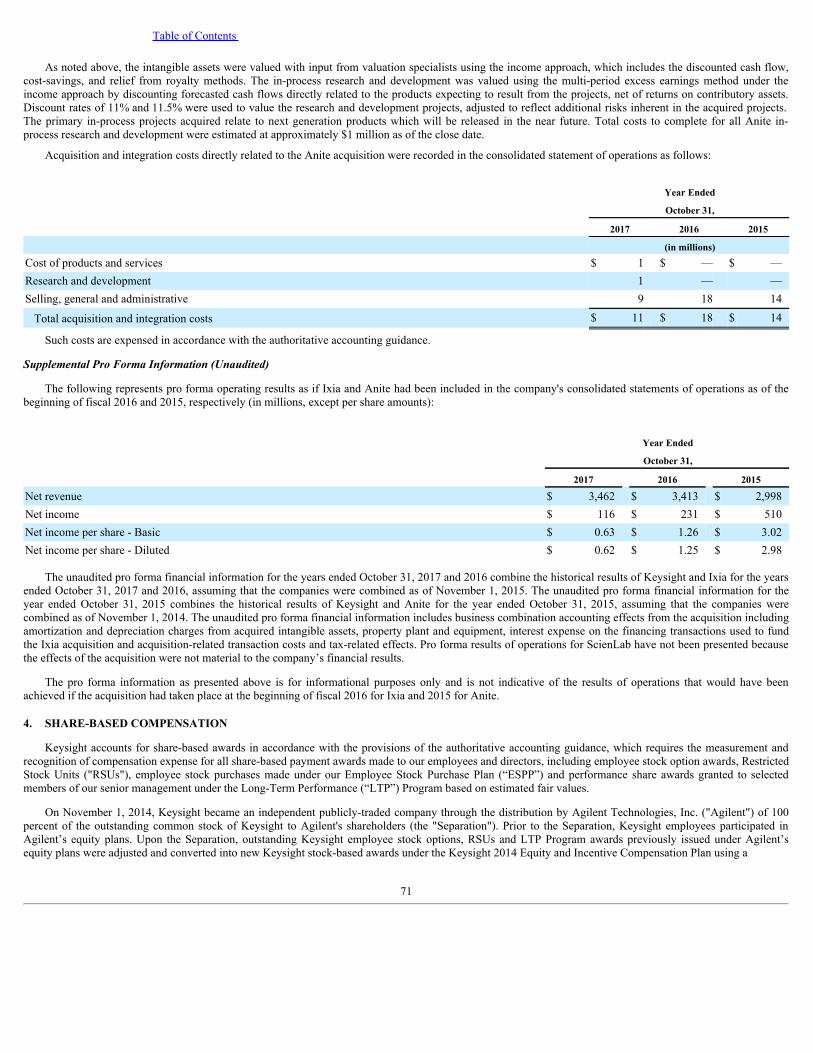
Table of Contents
As noted above, the intangible assets were valued with input from valuation specialists using the income approach, which includes the discounted cash flow,cost-savings, and relief from royalty methods. The in-process research and development was valued using the multi-period excess earnings method under theincome approach by discounting forecasted cash flows directly related to the products expecting to result from the projects, net of returns on contributory assets.Discount rates of 11% and 11.5% were used to value the research and development projects, adjusted to reflect additional risks inherent in the acquired projects.The primary in-process projects acquired relate to next generation products which will be released in the near future. Total costs to complete for all Anite in-process research and development were estimated at approximately $1 million as of the close date.
Acquisition and integration costs directly related to the Anite acquisition were recorded in the consolidated statement of operations as follows:
Year Ended October 31,
2017 2016 2015 (in millions)Cost of products and services $ 1 $ — $ —Research and development 1 — —Selling, general and administrative 9 18 14
Total acquisition and integration costs $ 11 $ 18 $ 14
Such costs are expensed in accordance with the authoritative accounting guidance.
Supplemental Pro Forma Information (Unaudited)
The following represents pro forma operating results as if Ixia and Anite had been included in the company's consolidated statements of operations as of thebeginning of fiscal 2016 and 2015, respectively (in millions, except per share amounts):
Year Ended October 31,
2017 2016 2015
Net revenue $ 3,462 $ 3,413 $ 2,998Net income $ 116 $ 231 $ 510Net income per share - Basic $ 0.63 $ 1.26 $ 3.02Net income per share - Diluted $ 0.62 $ 1.25 $ 2.98
The unaudited pro forma financial information for the years ended October 31, 2017 and 2016 combine the historical results of Keysight and Ixia for the yearsended October 31, 2017 and 2016, assuming that the companies were combined as of November 1, 2015. The unaudited pro forma financial information for theyear ended October 31, 2015 combines the historical results of Keysight and Anite for the year ended October 31, 2015, assuming that the companies werecombined as of November 1, 2014. The unaudited pro forma financial information includes business combination accounting effects from the acquisition includingamortization and depreciation charges from acquired intangible assets, property plant and equipment, interest expense on the financing transactions used to fundthe Ixia acquisition and acquisition-related transaction costs and tax-related effects. Pro forma results of operations for ScienLab have not been presented becausethe effects of the acquisition were not material to the company’s financial results.
The pro forma information as presented above is for informational purposes only and is not indicative of the results of operations that would have beenachieved if the acquisition had taken place at the beginning of fiscal 2016 for Ixia and 2015 for Anite.
4. SHARE-BASED COMPENSATION
Keysight accounts for share-based awards in accordance with the provisions of the authoritative accounting guidance, which requires the measurement andrecognition of compensation expense for all share-based payment awards made to our employees and directors, including employee stock option awards, RestrictedStock Units ("RSUs"), employee stock purchases made under our Employee Stock Purchase Plan (“ESPP”) and performance share awards granted to selectedmembers of our senior management under the Long-Term Performance (“LTP”) Program based on estimated fair values.
On November 1, 2014, Keysight became an independent publicly-traded company through the distribution by Agilent Technologies, Inc. ("Agilent") of 100percent of the outstanding common stock of Keysight to Agilent's shareholders (the "Separation"). Prior to the Separation, Keysight employees participated inAgilent’s equity plans. Upon the Separation, outstanding Keysight employee stock options, RSUs and LTP Program awards previously issued under Agilent’sequity plans were adjusted and converted into new Keysight stock-based awards under the Keysight 2014 Equity and Incentive Compensation Plan using a
71

Table of Contents
formula designed to preserve the intrinsic value and fair value of the awards immediately prior to the Separation. These adjusted awards retained the vestingschedule and expiration date of the original awards.
Description of Keysight’s Share-Based Plans
Incentive compensation plans. The 2014 Equity and Incentive Compensation Plan (the "2014 Stock Plan") was originally adopted by the Board of Directors("the Board") on July 16, 2014, subsequently amended and restated by the Board on September 29, 2014 and on January 22, 2015 and became effective as ofNovember 1, 2014 (the “Effective Date”). The Board initially reserved 25 million shares of company common stock that may be issued under the 2014 Stock Plan,plus any shares forfeited or cancelled under the 2014 Stock Plan and subsequently reduced the number to 17 million shares. The 2014 Stock Plan provides for thegrant of awards in the form of stock options, SARs, restricted stock, RSUs, performance shares and performance units with performance-based conditions onvesting or exercisability, and cash awards. The 2014 Stock Plan has a term of ten years . As of October 31, 2017, approximately 5 million shares were available forfuture awards under the 2014 Stock Plan.
Stock options granted under the 2014 Stock Plan may be either "incentive stock options," as defined in Section 422 of the Internal Revenue Code, or non-statutory. Options generally vest at a rate of 25 percent per year over a period of four years from the date of grant and generally have a maximum contractual termof ten years . The exercise price for stock options is generally not less than 100 percent of the fair market value of our common stock on the date the stock award isgranted.
Effective November 1, 2014, the Compensation Committee of the Board of Directors approved the Performance awards plan, which is a performance stockaward program administered under the 2014 Stock Plan, for the company's executive officers and other key employees. Participants in this program are entitled toreceive unrestricted shares of the company's stock after the end of a three-year period, if specified performance targets are met. Performance awards are generallydesigned to meet the criteria of a performance award with the performance metrics and peer group comparison set at the beginning of the performance period.Based on the performance metrics the final award may vary from zero to 200 percent of the target award. The maximum contractual term for awards under thePerformance awards program is three years . Awards granted under the LTP Program are based on a variety of targets, such as total shareholder return (TSR) orfinancial metrics such as operating margin, cost synergies and others. We consider the dilutive impact of this program in our diluted net income per sharecalculation only to the extent that the performance conditions are met.
Restricted stock units under our share-based plans are granted to directors, executives and employees. The estimated fair value of the restricted stock unitawards granted under the 2014 Stock Plan is determined based on the market price of Keysight common stock on the date of grant. Restricted stock units generallyvest, with some exceptions, at a rate of 25 percent per year over a period of four years from the date of grant.
Effective November 1, 2014, the company adopted the Employee Stock Purchase Plan. The ESPP allows eligible employees to contribute up to ten percent oftheir base compensation to purchase shares of Keysight common stock at 85 percent of the closing market price at purchase date. Shares authorized for issuance inconnection with the ESPP are subject to an automatic annual increase of the lesser of one percent of the outstanding shares of Keysight common stock onNovember 1, or an amount determined by the Compensation Committee of our Board of Directors. Under the terms of the ESPP, in no event shall the number ofshares issued under the ESPP exceed 75 million shares.
Under our ESPP, employees purchased 1,085,382 shares for $32 million in 2017, 1,234,111 shares for $30 million in 2016 and 493,289 shares for $14 millionin 2015. As of October 31, 2017, common stock authorized and available for issuance under our ESPP was 22,187,218 shares, which includes shares issued inNovember 2017 to participants in consideration of the aggregate contribution totaling $17 million as of October 31, 2017.
Impact of Share-based Compensation Awards
All share-based awards compensation expense has been recognized using a straight-line amortization method and as required by guidance, has been reducedfor estimated forfeitures.
72

Table of Contents
The impact on our results for share-based compensation was as follows:
Year Ended October 31,
2017 2016 2015 (in millions)Cost of products and services $ 11 $ 11 $ 12Research and development 9 8 9Selling, general and administrative 36 30 34
Total share-based compensation expense $ 56 $ 49 $ 55
At October 31, 2017 and 2016 no share-based compensation expense was capitalized within inventory. The income tax benefit (deficiency) realized from theexercised stock options and similar awards recognized was $3 million in 2017 , $(5) million in 2016 and $4 million in 2015 .
Valuation Assumptions
The following assumptions were used to estimate the fair value of employee stock options and LTP Program grants.
Year Ended October 31,
2017 2016 2015
Stock Option Plans: Weighted average risk-free interest rate N/A N/A 1.60%Dividend yield N/A N/A 0%Weighted average volatility N/A N/A 31%Expected life N/A N/A 4.9 years
LTP Program: Volatility of Keysight shares 27% 25% 26%Volatility of index/ peer group 15% 14%-54% 17%-67%Price-wise correlation with selected peers 57% 38% 38%
The fair value of share-based awards for employee stock option awards was estimated using the Black-Scholes option pricing model. Shares granted under theLTP Program were valued using a Monte Carlo simulation model. Both the Black-Scholes and Monte Carlo simulation fair value models require the use of highlysubjective and complex assumptions, including the option’s expected life and the price volatility of the underlying stock. The estimated fair value of restrictedstock awards is determined based on the market price of Keysight’s common stock on the date of grant. Prior to the Separation, it was determined based on themarket price of Agilent’s common stock on the date of grant, adjusted for expected dividend yield.
We did not grant any option awards in 2017 and 2016. For the year ended October 31, 2015, we used the average historical volatility of eleven peer companiesto estimate the volatility for our stock option awards. We considered our ability to find traded options of peer companies in the current market with similar termsand prices to our options.
As of November 1, 2014, Agilent’s fiscal 2013 LTP Program grants to Keysight executives were classified as liability awards in our consolidated financialstatements as the payout of Keysight shares is dependent upon Agilent Total Shareholder Return (“TSR”) as compared to its peer companies at the end of fiscal2015. The final payout resulted in reversal of $4 million of expense recorded for those awards.
73

Table of Contents
Share-based Payment Award Activity
Employee Stock Options
The following table summarizes employee stock option award activity made to our employees and directors for 2017 :
Options
Outstanding
WeightedAverage
Exercise Price
(in thousands) Outstanding at October 31, 2016 3,276 $ 25Granted — $ —Exercised (922) $ 20Forfeited and expired — $ —
Outstanding at October 31, 2017 2,354 $ 27
There were no forfeited or expired options in 2017.
The options outstanding and exercisable for equity share-based payment awards at October 31, 2017 were as follows:
Options Outstanding Options Exercisable
Range ofExercise Prices
NumberOutstanding
WeightedAverageRemainingContractual
Life
WeightedAverageExercisePrice
AggregateIntrinsicValue
NumberExercisable
WeightedAverageRemainingContractual
Life
WeightedAverageExercisePrice
AggregateIntrinsicValue
(in thousands) (in years) (in thousands) (in thousands) (in years) (in thousands)
$0 - 25 766 3.9 $ 19 $ 19,522 766 3.9 $ 19 $ 19,522
$25.01 - 30 667 6.1 $ 30 9,905 477 6.1 $ 30 7,088
$30.01 - 40 921 7.0 $ 31 12,593 438 7.0 $ 31 5,984 2,354 5.7 $ 27 $ 42,020 1,681 5.3 $ 25 $ 32,594
The aggregate intrinsic value in the table above represents the total pre-tax intrinsic value, based on Keysight's closing stock price of $44.67 at October 31,2017 , that would have been received by award holders had all award holders exercised their awards that were in-the-money as of that date. The total number of in-the-money awards exercisable at October 31, 2017 was approximately 1.7 million .
The following table summarizes the aggregate intrinsic value of options exercised and the fair value of options granted in 2017 , 2016 and 2015 :
Aggregate
Intrinsic Value
WeightedAverageExercisePrice
Per Share Value UsingBlack-Scholes
Model
(in thousands) Options exercised in fiscal 2015 $ 15,160 $ 16 Black-Scholes per share value of options granted during fiscal 2015 $ 9.20Options exercised in fiscal 2016 $ 5,656 $ 19 Black-Scholes per share value of options granted during fiscal 2016 N/AOptions exercised in fiscal 2017 $ 16,385 $ 20 Black-Scholes per share value of options granted during fiscal 2017 N/A
As of October 31, 2017 the unrecognized share-based compensation costs for outstanding stock option awards, net of expected forfeitures, was approximately$1 million , which is expected to be amortized over a weighted average period of 1 year. See Note 5, "Income Taxes," for the tax impact on share-based awardexercises.
74

Table of Contents
Non-vested Awards
The following table summarizes non-vested award activity in 2017 primarily for our LTP Program and restricted stock unit awards:
Shares
WeightedAverage
Grant Date Fair Value
(in thousands) Non-vested at October 31, 2016 3,056 $ 30Granted 1,822 $ 37Vested (1,205) $ 29Forfeited (33) $ 33
Non-vested at October 31, 2017 3,640 $ 33
As of October 31, 2017 the unrecognized share-based compensation cost for non-vested restricted stock awards, net of expected forfeitures, wasapproximately $47 million , which is expected to be amortized over a weighted average period of 2.7 years. The total fair value of restricted stock awards vestedwas $43 million for 2017, $33 million for 2016 and $36 million for 2015.
5. INCOME TAXES
The domestic and foreign components of income before taxes are:
Year Ended October 31,
2017 2016 2015 (in millions)U.S. operations $ (147) $ (30) $ (6)Non-U.S. operations 326 396 394
Total income before taxes $ 179 $ 366 $ 388
The provision (benefit) for income taxes is comprised of:
Year Ended October 31,
2017 2016 2015 (in millions)U.S. federal taxes:
Current $ 21 $ (15) $ 12Deferred (56) (13) (7)
Non-U.S. taxes: Current 101 32 24Deferred 9 28 (158)
State taxes, net of federal benefit: Current 2 (1) 1Deferred — — 3
Total provision (benefit) for income taxes $ 77 $ 31 $ (125)
The income tax provision does not reflect potential future tax savings resulting from excess deductions associated with our various share-based award plans.
75
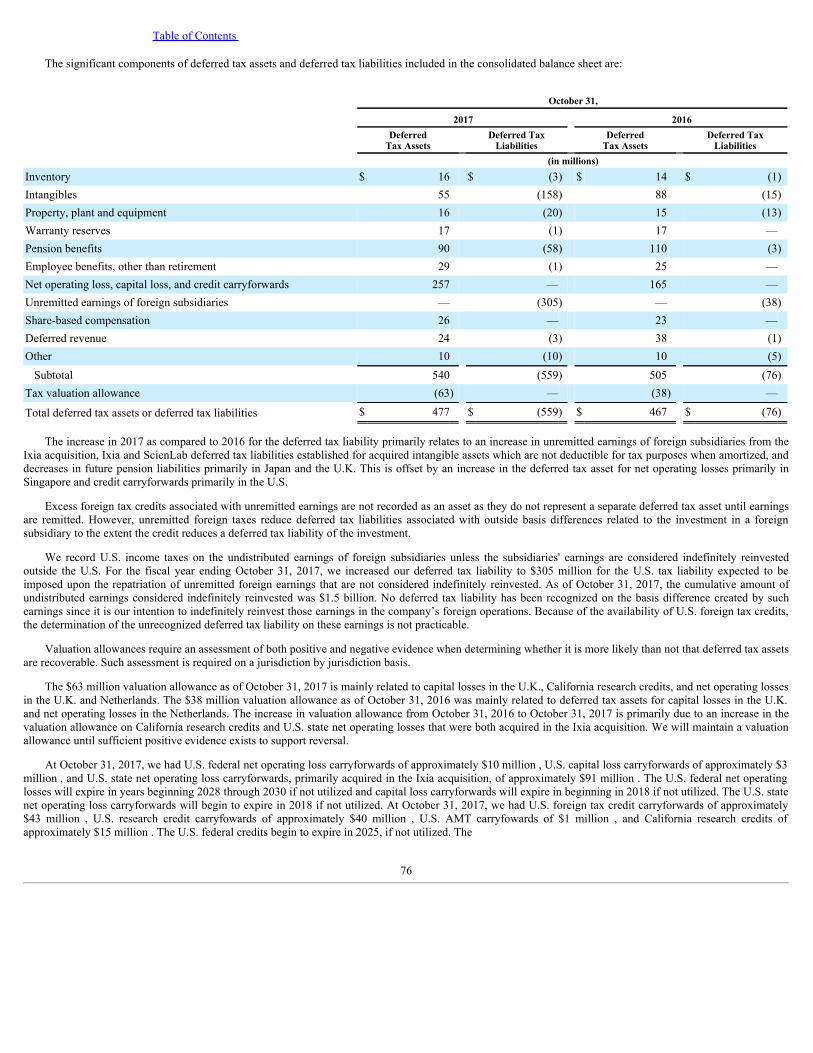
Table of Contents
The significant components of deferred tax assets and deferred tax liabilities included in the consolidated balance sheet are:
October 31,
2017 2016
DeferredTax Assets
Deferred TaxLiabilities
DeferredTax Assets
Deferred TaxLiabilities
(in millions)Inventory $ 16 $ (3) $ 14 $ (1)Intangibles 55 (158) 88 (15)Property, plant and equipment 16 (20) 15 (13)Warranty reserves 17 (1) 17 —Pension benefits 90 (58) 110 (3)Employee benefits, other than retirement 29 (1) 25 —Net operating loss, capital loss, and credit carryforwards 257 — 165 —Unremitted earnings of foreign subsidiaries — (305) — (38)Share-based compensation 26 — 23 —Deferred revenue 24 (3) 38 (1)Other 10 (10) 10 (5)
Subtotal 540 (559) 505 (76)Tax valuation allowance (63) — (38) —
Total deferred tax assets or deferred tax liabilities $ 477 $ (559) $ 467 $ (76)
The increase in 2017 as compared to 2016 for the deferred tax liability primarily relates to an increase in unremitted earnings of foreign subsidiaries from theIxia acquisition, Ixia and ScienLab deferred tax liabilities established for acquired intangible assets which are not deductible for tax purposes when amortized, anddecreases in future pension liabilities primarily in Japan and the U.K. This is offset by an increase in the deferred tax asset for net operating losses primarily inSingapore and credit carryforwards primarily in the U.S.
Excess foreign tax credits associated with unremitted earnings are not recorded as an asset as they do not represent a separate deferred tax asset until earningsare remitted. However, unremitted foreign taxes reduce deferred tax liabilities associated with outside basis differences related to the investment in a foreignsubsidiary to the extent the credit reduces a deferred tax liability of the investment.
We record U.S. income taxes on the undistributed earnings of foreign subsidiaries unless the subsidiaries' earnings are considered indefinitely reinvestedoutside the U.S. For the fiscal year ending October 31, 2017, we increased our deferred tax liability to $305 million for the U.S. tax liability expected to beimposed upon the repatriation of unremitted foreign earnings that are not considered indefinitely reinvested. As of October 31, 2017, the cumulative amount ofundistributed earnings considered indefinitely reinvested was $1.5 billion. No deferred tax liability has been recognized on the basis difference created by suchearnings since it is our intention to indefinitely reinvest those earnings in the company’s foreign operations. Because of the availability of U.S. foreign tax credits,the determination of the unrecognized deferred tax liability on these earnings is not practicable.
Valuation allowances require an assessment of both positive and negative evidence when determining whether it is more likely than not that deferred tax assetsare recoverable. Such assessment is required on a jurisdiction by jurisdiction basis.
The $63 million valuation allowance as of October 31, 2017 is mainly related to capital losses in the U.K., California research credits, and net operating lossesin the U.K. and Netherlands. The $38 million valuation allowance as of October 31, 2016 was mainly related to deferred tax assets for capital losses in the U.K.and net operating losses in the Netherlands. The increase in valuation allowance from October 31, 2016 to October 31, 2017 is primarily due to an increase in thevaluation allowance on California research credits and U.S. state net operating losses that were both acquired in the Ixia acquisition. We will maintain a valuationallowance until sufficient positive evidence exists to support reversal.
At October 31, 2017, we had U.S. federal net operating loss carryforwards of approximately $10 million , U.S. capital loss carryforwards of approximately $3million , and U.S. state net operating loss carryforwards, primarily acquired in the Ixia acquisition, of approximately $91 million . The U.S. federal net operatinglosses will expire in years beginning 2028 through 2030 if not utilized and capital loss carryforwards will expire in beginning in 2018 if not utilized. The U.S. statenet operating loss carryforwards will begin to expire in 2018 if not utilized. At October 31, 2017, we had U.S. foreign tax credit carryforwards of approximately$43 million , U.S. research credit carryfowards of approximately $40 million , U.S. AMT carryfowards of $1 million , and California research credits ofapproximately $15 million . The U.S. federal credits begin to expire in 2025, if not utilized. The
76
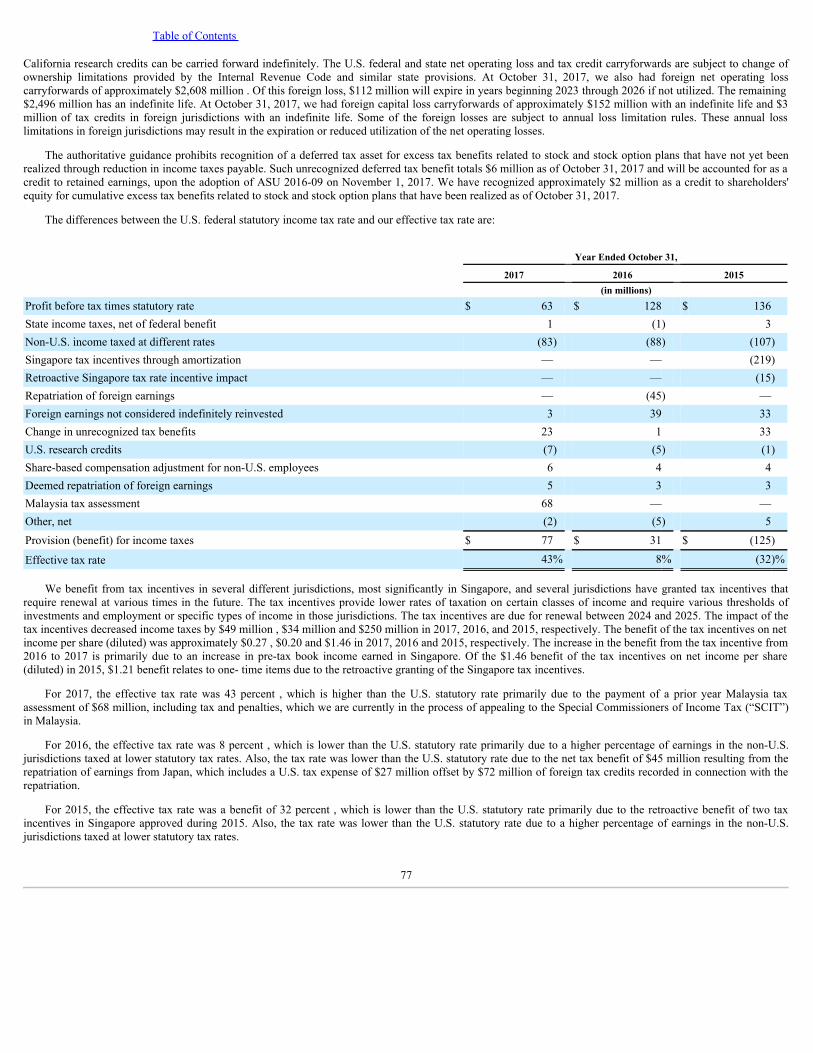
Table of Contents
California research credits can be carried forward indefinitely. The U.S. federal and state net operating loss and tax credit carryforwards are subject to change ofownership limitations provided by the Internal Revenue Code and similar state provisions. At October 31, 2017, we also had foreign net operating losscarryforwards of approximately $2,608 million . Of this foreign loss, $112 million will expire in years beginning 2023 through 2026 if not utilized. The remaining$2,496 million has an indefinite life. At October 31, 2017, we had foreign capital loss carryforwards of approximately $152 million with an indefinite life and $3million of tax credits in foreign jurisdictions with an indefinite life. Some of the foreign losses are subject to annual loss limitation rules. These annual losslimitations in foreign jurisdictions may result in the expiration or reduced utilization of the net operating losses.
The authoritative guidance prohibits recognition of a deferred tax asset for excess tax benefits related to stock and stock option plans that have not yet beenrealized through reduction in income taxes payable. Such unrecognized deferred tax benefit totals $6 million as of October 31, 2017 and will be accounted for as acredit to retained earnings, upon the adoption of ASU 2016-09 on November 1, 2017. We have recognized approximately $2 million as a credit to shareholders'equity for cumulative excess tax benefits related to stock and stock option plans that have been realized as of October 31, 2017.
The differences between the U.S. federal statutory income tax rate and our effective tax rate are:
Year Ended October 31,
2017 2016 2015 (in millions)Profit before tax times statutory rate $ 63 $ 128 $ 136State income taxes, net of federal benefit 1 (1) 3Non-U.S. income taxed at different rates (83) (88) (107)Singapore tax incentives through amortization — — (219)Retroactive Singapore tax rate incentive impact — — (15)Repatriation of foreign earnings — (45) —Foreign earnings not considered indefinitely reinvested 3 39 33Change in unrecognized tax benefits 23 1 33U.S. research credits (7) (5) (1)Share-based compensation adjustment for non-U.S. employees 6 4 4Deemed repatriation of foreign earnings 5 3 3Malaysia tax assessment 68 — —Other, net (2) (5) 5Provision (benefit) for income taxes $ 77 $ 31 $ (125)
Effective tax rate 43% 8% (32)%
We benefit from tax incentives in several different jurisdictions, most significantly in Singapore, and several jurisdictions have granted tax incentives thatrequire renewal at various times in the future. The tax incentives provide lower rates of taxation on certain classes of income and require various thresholds ofinvestments and employment or specific types of income in those jurisdictions. The tax incentives are due for renewal between 2024 and 2025. The impact of thetax incentives decreased income taxes by $49 million , $34 million and $250 million in 2017, 2016, and 2015, respectively. The benefit of the tax incentives on netincome per share (diluted) was approximately $0.27 , $0.20 and $1.46 in 2017, 2016 and 2015, respectively. The increase in the benefit from the tax incentive from2016 to 2017 is primarily due to an increase in pre-tax book income earned in Singapore. Of the $1.46 benefit of the tax incentives on net income per share(diluted) in 2015, $1.21 benefit relates to one- time items due to the retroactive granting of the Singapore tax incentives.
For 2017, the effective tax rate was 43 percent , which is higher than the U.S. statutory rate primarily due to the payment of a prior year Malaysia taxassessment of $68 million, including tax and penalties, which we are currently in the process of appealing to the Special Commissioners of Income Tax (“SCIT”)in Malaysia.
For 2016, the effective tax rate was 8 percent , which is lower than the U.S. statutory rate primarily due to a higher percentage of earnings in the non-U.S.jurisdictions taxed at lower statutory tax rates. Also, the tax rate was lower than the U.S. statutory rate due to the net tax benefit of $45 million resulting from therepatriation of earnings from Japan, which includes a U.S. tax expense of $27 million offset by $72 million of foreign tax credits recorded in connection with therepatriation.
For 2015, the effective tax rate was a benefit of 32 percent , which is lower than the U.S. statutory rate primarily due to the retroactive benefit of two taxincentives in Singapore approved during 2015. Also, the tax rate was lower than the U.S. statutory rate due to a higher percentage of earnings in the non-U.S.jurisdictions taxed at lower statutory tax rates.
77

Table of Contents
The breakdown between current and long-term income tax assets and liabilities, excluding deferred tax assets and liabilities, was as follows for the years 2017and 2016 :
October 31,
2017 2016 (in millions)Current income tax assets (included within other current assets) $ 40 $ 29Current income tax liabilities (included within income and other taxes payable) (7) (19)Long-term income tax assets (included within other assets) — 6Long-term income tax liabilities (included within other long-term liabilities) (39) (21)
Total $ (6) $ (5)
The calculation of our tax liabilities involves uncertainties in the application of complex tax law and regulations in a multitude of jurisdictions. Although theguidance on the accounting for uncertainty in income taxes prescribes the use of a recognition and measurement model, the determination of whether an uncertaintax position has met those thresholds will continue to require significant judgment by management. In accordance with the guidance on the accounting foruncertainty in income taxes, for all U.S. and other tax jurisdictions, we recognize potential liabilities for anticipated tax audit issues based on our estimate ofwhether, and the extent to which, additional taxes and interest will be due. The ultimate resolution of tax uncertainties may differ from what is currently estimated,which could result in a material impact on income tax expense. If our estimate of income tax liabilities proves to be less than the ultimate assessment, a furthercharge to expense would be required. If events occur and the payment of these amounts ultimately proves to be unnecessary, the reversal of the liabilities wouldresult in tax benefits being recognized in the period when we determine the liabilities are no longer necessary.
The aggregate changes in the balances of our unrecognized tax benefits including all federal, state and foreign tax jurisdictions are as follows:
2017 2016 2015 (in millions)Balance, beginning of year $ 51 $ 50 $ 129
Reductions due to spin transaction — — (113)Additions due to acquisition 22 — 2Additions for tax positions related to the current year 31 5 34Additions for tax positions from prior years 52 1 2Reductions for tax positions from prior years (9) (4) (4)Settlements with taxing authorities — — —Statute of limitations expirations (1) (1) —
Balance, end of year $ 146 $ 51 $ 50
As of October 31, 2017, we had $166 million of unrecognized tax benefits including interest and penalties which, if recognized, would affect our effective taxrate. However, approximately $4 million of the unrecognized tax benefits were related to state income tax positions which, if recognized, would be in the form of adeferred tax asset that would likely not affect our effective tax rate due to a valuation allowance. Under the terms of the agreement between Agilent and Keysightpertaining to tax matters, as finalized at the time of separation, the unrecognized tax benefits as of separation differed from the amount allocated using the separatereturn methodology, therefore, a $113 million reduction in the unrecognized tax benefits occurred as of November 1, 2014 upon separation.
We recognized a tax expense of $18 million , $1 million , and zero of interest and penalties related to unrecognized tax benefits in 2017, 2016 and 2015,respectively. Cumulatively, interest and penalties accrued as of the end of October 31, 2017, 2016 and 2015 were $20 million , $2 million and $1 million ,respectively. The increase in interest and penalties from October 31, 2016 to October 31, 2017 is primarily due to $18 million of penalties paid for the Malaysia taxassessment relating to the 2008 tax year.
For the majority of our entities, the open tax years for the IRS, state and most foreign audit authorities are from August 1, 2014 through the current tax year.For certain foreign entities, the tax years generally remain open, at most, back to the year 2007 . Given the number of years and numerous matters that remainsubject to examination in various tax jurisdictions, we are unable to estimate the range of possible changes to the balance of our unrecognized tax benefits.
The company is being audited in Malaysia for the 2008 tax year. Although this tax year pre-dates our spin-off from Agilent, pursuant to the agreementbetween Agilent and Keysight pertaining to tax matters, as finalized at the time of separation, for certain
78

Table of Contents
entities including Malaysia, any historical tax liability is the responsibility of Keysight. In the fourth quarter of this year, Keysight paid income taxes and penaltiesof $68 million on gains related to intellectual property rights, although we are currently in the process of appealing to the Special Commissioners of Income Tax(“SCIT”) in Malaysia. The company believes there are numerous defenses to the current assessment; the statute of limitations for the 2008 tax year in Malaysia isclosed and the income in question is exempt from tax in Malaysia. The company is disputing this assessment and pursuing all avenues to resolve this issuefavorably for the company.
6. NET INCOME PER SHARE
The following is a reconciliation of the numerator and denominator of the basic and diluted net income per share computations for the periods presentedbelow.
Year Ended October 31,
2017 2016 2015 (in millions)Numerator:
Net income $ 102 $ 335 $ 513
Denominator: Basic weighted-average shares 180 170 169Potential common shares— stock options and other employee stock plans 2 2 2
Diluted weighted-average shares 182 172 171
The dilutive effect of share-based awards is reflected in diluted net income per share by application of the treasury stock method, which includes considerationof unamortized share-based compensation expense, the tax benefits recorded in additional paid-in capital and the dilutive effect of in-the-money options and non-vested restricted stock units. Under the treasury stock method, the amount the employee must pay for exercising stock options and unamortized share-basedcompensation expense and tax benefits that would be recorded in additional paid-in capital when the award becomes deductible are collectively assumed to be usedto repurchase hypothetical shares. An increase in the fair market value of the company's common stock can result in a greater dilutive effect from potentiallydilutive awards.
We exclude stock options with exercise prices greater than the average market price of our common stock from the calculation of diluted earnings per sharebecause their effect would be anti-dilutive. For the year ended 2017, 2016 and 2015, we excluded zero , 1.7 million shares and zero shares from the calculation ofdiluted earnings per share, respectively. In addition, we also exclude from the calculation of diluted earnings per share, stock options, ESPP, LTP Program andrestricted stock awards, whose combined exercise price, unamortized fair value and excess tax benefits collectively were greater than the average market price ofour common stock because their effect would also be anti-dilutive. For the years ended October 31, 2017, 2016 and 2015, we excluded 7,760 shares, 26,200 sharesand 46,300 shares, respectively, from the calculation of diluted earnings per share.
7. SUPPLEMENTAL CASH FLOW INFORMATION
Net cash paid for income taxes was $121 million in 2017 , $23 million in 2016 and $40 million in 2015 . The 2017 payments include $68 million paid to theMalaysia tax authority associated with a tax assessment on gains related to intellectual property transfers that we are currently in the process of appealing to theSpecial Commissioners of Income Tax (“SCIT”) in Malaysia.
Cash paid for interest was $64 million in 2017, $44 million in 2016 and $46 million in 2015. In 2017, we also paid fees of $9 million in connection with abridge loan facility that were amortized to interest expense and classified as financing activity.
The following table summarizes our non-cash investing activities that are not reflected in the consolidated statement of cash flows:
Year Ended October 31,
2017 2016 2015 (in millions)Non-cash investing activities: Capital expenditures in accounts payables $ (4) $ (11) $ 10Capital expenditures in other long-term liabilities 4 1 —
$ — $ (10) $ 10
79

Table of Contents
8. INVENTORY
October 31,
2017 2016 (in millions)Finished goods $ 286 $ 218Purchased parts and fabricated assemblies 302 256
Total inventory $ 588 $ 474
The increase in inventory was driven primarily by business acquisitions. Inventory-related excess and obsolescence charges recorded in total cost of productswere $16 million in 2017 , $17 million in 2016 and $28 million in 2015 . We record excess and obsolete inventory charges for both inventory on our site as well asinventory at our contract manufacturers and suppliers where we have non-cancellable purchase commitments.
9. PROPERTY, PLANT AND EQUIPMENT, NET
October 31,
2017 2016 (in millions)
Land $ 63 $ 66Buildings and leasehold improvements 678 679Machinery and equipment 1,008 931
Total property, plant and equipment 1,749 1,676Accumulated depreciation and amortization (1,219) (1,164)
Property, plant and equipment, net $ 530 $ 512
Asset impairments were zero in 2017, 2016 and 2015. In 2017 we recognized a loss of $5 million related to assets that were damaged or destroyed due to thenorthern California wildfires. Depreciation expense was $92 million in 2017 , $85 million in 2016 and $81 million in 2015 . Buildings and leasehold improvementsinclude assets held under capital lease of $4 million and $1 million at October 31, 2017 and 2016, respectively.
10. GOODWILL AND OTHER INTANGIBLE ASSETS
The goodwill balances as of October 31, 2017 , 2016 and 2015 and the movements in 2017 and 2016 for each of our reportable segments were as follows:
CommunicationsSolutions Group
Electronic IndustrialSolutions Group
Ixia SolutionsGroup
Services SolutionsGroup Total
(in millions)Goodwill as of October 31, 2015 $ 433 $ 204 $ — $ 63 $ 700Foreign currency translation impact 12 9 — 1 22Goodwill arising from acquisitions and otheradjustments 11 3 — — 14Goodwill as of October 31, 2016 456 216 — 64 736Foreign currency translation impact (15) 1 — 1 (13)Goodwill arising from acquisitions — 23 1,117 19 1,159
Goodwill as of October 31, 2017 $ 441 $ 240 $ 1,117 $ 84 $ 1,882
80

Table of Contents
Other intangible assets as of October 31, 2017 and 2016 consisted of the following:
Other Intangible Assets as of October 31, 2017 Other Intangible Assets as of October 31, 2016
Gross Carrying
Amount
AccumulatedAmortization andImpairments Net Book Value
GrossCarryingAmount
AccumulatedAmortization
and Impairments Net BookValue
(in millions)Developed technology $ 808 $ 252 $ 556 $ 309 $ 159 $ 150Backlog 13 12 1 4 4 —Trademark/Tradename 33 8 25 20 4 16Customer relationships 304 61 243 65 35 30Non-compete agreements 1 — 1 — — —
Total amortizable intangible assets 1,159 333 826 398 202 196In-Process R&D 29 — 29 12 — 12
Total $ 1,188 $ 333 $ 855 $ 410 $ 202 $ 208
In 2017, we recorded additions to goodwill and other intangible assets of $1,159 million and $785 million , based on the preliminary allocation of the purchaseprices to the estimated fair values of the assets acquired and liabilities assumed in the acquisition of Ixia and other acquisitions. There was no foreign exchangetranslation impact to other intangible assets in 2017. In 2017, we transferred $43 million from in-process R&D to developed technology as projects weresuccessfully completed and recorded an impairment charge of $7 million related to the cancellation of an in-process R&D project.
In 2016, we recorded additions to goodwill and other intangible assets of $14 million and $19 million , respectively, due to an acquisition in 2016 and arevision to the preliminary purchase price allocation of the Anite acquisition, which was completed in 2015. We recorded $4 million of foreign exchangetranslation impact to other intangible assets in 2016.
Amortization of other intangible assets was $131 million in 2017, $43 million in 2016, and $15 million in 2015. Future amortization expense related toexisting finite-lived purchased intangible assets is estimated to be $198 million in 2018, $196 million in 2019, $194 million in 2020, $126 million in 2021, $50million in 2022, and $62 million thereafter.
11. INVESTMENTS
Net book value of investments as of October 31, 2017 and 2016 were as follows:
October 31,
2017 2016 (in millions)Long-Term Cost method investments $ 16 $ 15Trading securities 13 11Available-for-sale investments 34 29
Total $ 63 $ 55
Cost method investments consist of non-marketable equity securities and are accounted for at historical cost. Trading securities are reported at fair value, withgains or losses resulting from changes in fair value recognized currently in earnings. Investments designated as available-for-sale consists of equity securities andare reported at fair value, with unrealized gains and losses, net of tax, included in accumulated other comprehensive income (loss).
Investments in available-for-sale securities at estimated fair value were as follows:
October 31, 2017 October 31, 2016
Amortized Cost
GrossUnrealizedGains
GrossUnrealizedLosses
FairValue Amortized Cost
GrossUnrealizedGains
GrossUnrealizedLosses
FairValue
(in millions)Long-Term Equity securities $ 15 $ 19 $ — $ 34 $ 15 $ 14 $ — $ 29
81

Table of Contents
All of our investments, excluding trading securities, are subject to periodic impairment review. The impairment analysis requires significant judgment toidentify events or circumstances that would likely have a significant adverse effect on the future value of the investment. We consider various factors indetermining whether an impairment is other-than-temporary, including the severity and duration of the impairment, forecasted recovery, the financial condition andnear-term prospects of the investee, and our ability and intent to hold the investment for a period of time sufficient to allow for any anticipated recovery in marketvalue. There was no impairment recognized in the year ended 2017. In 2016, cost method investments with a carrying amount of $2 million were written down totheir fair value of zero , resulting in an impairment charge of $2 million , which is included in other income (expense). In 2015, cost method investments with acarrying amount of $4 million were written down to their fair value of zero , resulting in an impairment charge of $4 million , which is included in other income(expense).
Realized gains or losses on the sale of available-for-sale or cost method securities were zero in 2017, 2016 and 2015. Net unrealized gains on our tradingsecurities portfolio were $2 million of unrealized gains in 2017 , zero in 2016 and $1 million of unrealized gains in 2015 .
12. FAIR VALUE MEASUREMENTS
The authoritative guidance defines fair value as the price that would be received from selling an asset or paid to transfer a liability in an orderly transactionbetween market participants at the measurement date. When determining the fair value measurements for assets and liabilities required or permitted to be recordedat fair value, we consider the principal or most advantageous market and assumptions that market participants would use when pricing the asset or liability.
Fair Value Hierarchy
The guidance establishes a fair value hierarchy that prioritizes inputs used in valuation techniques into three levels. A financial instrument's categorizationwithin the fair value hierarchy is based upon the lowest level of input that is significant to the fair value measurement. There are three levels of inputs that may beused to measure fair value:
Level 1 — applies to assets or liabilities for which there are quoted prices in active markets for identical assets or liabilities.
Level 2 — applies to assets or liabilities for which there are inputs other than quoted prices included within Level 1 that are observable, either directly orindirectly, for the asset or liability such as: quoted prices for similar assets or liabilities in active markets; quoted prices for identical or similar assets or liabilitiesin less active markets; or other inputs that can be derived principally from, or corroborated by, observable market data.
Level 3 — applies to assets or liabilities for which there are unobservable inputs to the valuation methodology that are significant to the measurement of thefair value of the assets or liabilities.
82

Table of Contents
Financial Assets and Liabilities Measured at Fair Value on a Recurring Basis
Financial assets and liabilities measured at fair value on a recurring basis as of October 31, 2017 and 2016 were as follows:
Fair Value Measurements as of October 31, 2017 Fair Value Measurements as of October 31, 2016
Total Level 1 Level 2 Level 3 Total Level 1 Level 2 Level 3
(in millions)Assets:
Short-term
Cash equivalents Money market funds $ 403 $ 403 $ — $ — $ 471 $ 471 $ — $ —
Derivative instruments (foreign exchange contracts) 6 — 6 — 4 — 4 —Long-term
Trading securities 13 13 — — 11 11 — —Available-for-sale investments 34 34 — — 29 29 — —
Total assets measured at fair value $ 456 $ 450 $ 6 $ — $ 515 $ 511 $ 4 $ —Liabilities:
Short-term Derivative instruments (foreign exchange contracts) $ 1 $ — $ 1 $ — $ 8 $ — $ 8 $ —
Long-term Deferred compensation liability 13 — 13 — 11 — 11 —
Total liabilities measured at fair value $ 14 $ — $ 14 $ — $ 19 $ — $ 19 $ —
Our money market funds, trading securities, and available-for-sale investments are generally valued using quoted market prices and therefore are classifiedwithin Level 1 of the fair value hierarchy. Our deferred compensation liability are classified as Level 2 because the inputs used in the calculations are observable,although the values are not directly based on quoted market prices. Our derivative financial instruments are classified within Level 2, as there is not an activemarket for each hedge contract, but the inputs used to calculate the value of the instruments are tied to active markets.
Trading securities (which are earmarked to pay the deferred compensation liability) and deferred compensation liability are reported at fair value, with gains orlosses resulting from changes in fair value recognized currently in earnings. Investments designated as available-for-sale and certain derivative instruments arereported at fair value, with unrealized gains and losses, net of tax, included in accumulated other comprehensive income (loss). Realized gains and losses from thesale of these instruments are recorded in earnings.
13. DERIVATIVES
We are exposed to foreign currency exchange rate fluctuations and interest rate changes in the normal course of our business. As part of risk managementstrategy, we use derivative instruments, primarily forward contracts and purchased options to hedge economic and/or accounting exposures resulting from changesin foreign currency exchange rates.
Cash Flow Hedges
We enter into foreign exchange contracts to hedge our forecasted operational cash flow exposures resulting from changes in foreign currency exchange rates.These foreign exchange contracts, carried at fair value, have maturities between one and twelve months. These derivative instruments are designated and qualify ascash flow hedges under the criteria prescribed in the authoritative guidance. The changes in the value of the effective portion of the derivative instrument arerecognized in accumulated other comprehensive income. Amounts associated with cash flow hedges are reclassified to cost of sales in the consolidated statementof operations when the forecasted transaction occurs. If it becomes probable that the forecasted transaction will not occur, the hedge relationship will be de-designated and amounts accumulated in other comprehensive income will be reclassified to other income (expense) in the current period. Changes in the fair valueof the ineffective portion of derivative instruments are recognized in earnings in the consolidated statement of operations in the current period. We record thepremium paid (time value) of an option on the date of purchase as an asset. For options designated as cash flow hedges, changes in the time value are excludedfrom the assessment of hedge effectiveness and are recognized in other income (expense) over the life of the option contract. The ineffectiveness for the yearsended October 31, 2017, 2016 and 2015 was not significant .
83

Table of Contents
Other Hedges
Additionally, we enter into foreign exchange contracts to hedge monetary assets and liabilities that are denominated in currencies other than the functionalcurrency of our subsidiaries. These foreign exchange contracts are carried at fair value and do not qualify for hedge accounting treatment and are not designated ashedging instruments. Changes in value of the derivative are recognized in other income (expense) in the consolidated statement of operations, in the current period,along with the offsetting foreign currency gain or loss on the underlying assets or liabilities.
In connection with the acquisition of Anite, which closed on August 13, 2015, Keysight entered into foreign currency forward contracts to mitigate thecurrency exchange risk associated with the payment of the purchase price in British Pound currency. The aggregate notional amount of the currencies hedged was$608 million. These foreign exchange contracts did not qualify for hedge accounting treatment and were not designated as hedging instruments. The resulting losson settlement, on the date of acquisition, was $2 million and was recorded in other income (expense) in the consolidated statement of operations for the year endedOctober 31, 2015.
Our use of derivative instruments exposes us to credit risk to the extent that the counterparties may be unable to meet the terms of the agreement. We do,however, seek to mitigate such risks by limiting our counterparties to major financial institutions which are selected based on their credit ratings and other factors.We have established policies and procedures for mitigating credit risk that include establishing counterparty credit limits, monitoring credit exposures, andcontinually assessing the creditworthiness of counterparties.
A number of our derivative agreements contain threshold limits to the net liability position with counterparties and are dependent on our corporate credit ratingdetermined by the major credit rating agencies. The counterparties to the derivative instruments may request collateralization, in accordance with derivativeagreements, on derivative instruments in net liability positions.
The aggregate fair value of all derivative instruments with credit-risk-related contingent features that were in a net liability position as of October 31, 2017was immaterial . The credit-risk-related contingent features underlying these agreements had not been triggered as of October 31, 2017 .
There were 127 foreign exchange forward contracts open as of October 31, 2017 and designated as cash flow hedges. There were 71 foreign exchange forwardcontracts and zero foreign exchange option contract open as of October 31, 2017 not designated as hedging instruments. The aggregated notional amounts bycurrency and designation as of October 31, 2017 were as follows:
Derivatives in Cash Flow
Hedging Relationships Derivatives Not Designated as
Hedging Instruments
ForwardContracts
ForwardContracts
Currency Buy/(Sell) Buy/(Sell)
(in millions)Euro $ — $ 36British Pound — (15)Singapore Dollar 10 (1)Malaysian Ringgit 62 (3)Japanese Yen (101) (38)Other currencies (14) (6)
$ (43) $ (27)
84

Table of Contents
Derivative instruments are subject to master netting arrangements and are disclosed gross in the balance sheet in accordance with the authoritative guidance .The gross fair values and balance sheet presentation of derivative instruments held in the consolidated balance sheet as of October 31, 2017 and 2016 were asfollows:
Fair Values of Derivative Instruments
Asset Derivatives Liability Derivatives
Fair Value Fair Value
Balance Sheet Location October 31,
2017 October 31,
2016 Balance Sheet Location October 31,
2017 October 31,
2016(in millions)
Derivatives designated as hedginginstruments: Cash flow hedges Foreign exchange contracts
Other current assets $ 5 $ 2 Other accrued liabilities $ — $ 4 Derivatives not designated as hedginginstruments: Foreign exchange contracts
Other current assets 1 2 Other accrued liabilities 1 4
Total derivatives $ 6 $ 4 $ 1 $ 8
The effect of derivative instruments for foreign exchange contracts designated as hedging instruments and not designated as hedging instruments in ourconsolidated statement of operations was as follows:
2017 2016 2015 (in millions)Derivatives designated as hedging instruments:
Cash flow hedges Foreign exchange contracts: Gain (loss) recognized in accumulated other comprehensive income $ 6 $ (7) $ (15)Gain (loss) reclassified from accumulated other comprehensive income into cost of sales $ (1) $ (12) $ (1)
Derivatives not designated as hedging instruments: Gain (loss) recognized in other income (expense), net $ 6 $ (10) $ (7)
The estimated amount of existing net gain at October 31, 2017 expected to be reclassified from accumulated other comprehensive income to cost of saleswithin the next twelve months is $3 million .
14. RESTRUCTURING
We initiated a targeted workforce reduction program in July 2015 that was designed to restructure our operations and cost structure for optimization ofresources and cost savings. Approximately 100 employees of our total workforce were impacted by this program. In 2015, we also announced a voluntary pre-retirement notification program for retirement-eligible employees to provide early notice of their planned retirement in return for severance benefits.Approximately 160 employees of our total workforce opted for this program. Severance payments under both programs were complete at October 31, 2016 .
We initiated a targeted workforce reduction program in November 2016 that is expected to reduce Keysight's total headcount by between 60 to 200employees. The timing and scope of workforce reductions will vary based on local legal requirements. This targeted workforce management program was designedto support our site consolidation strategy, align with our new industry segment structure and improve efficiency. As of October 31, 2017, approximately 85employees exited under this workforce reduction program, which we expect to be substantially complete by the end of first quarter of fiscal 2018.
85

Table of Contents
A summary of balances and restructuring activity for the above plans is shown in the table below:
Workforce reduction U.S. Pre-retirement
Plan (in millions)Balance at October 31, 2015 $ 4 $ 2
Cash payments (4) (2)Balance at October 31, 2016 — —
Income statement expense 8 —Cash payments (6) —
Balance at October 31, 2017 $ 2 $ —
The restructuring accrual of $2 million at October 31, 2017 relating to workforce reduction is recorded in other accrued liabilities in the consolidated balancesheet.
A summary of the charges in the consolidated statement of operations resulting from all restructuring activities, including acquisition and other activities, isshown below:
Year Ended October 31,
2017 2016 2015
(in millions)Cost of products and services $ 1 $ — $ 4Research and development 3 — 2Selling, general and administrative 8 — 10
Total restructuring and other related costs $ 12 $ — $ 16
15. RETIREMENT PLANS AND POST-RETIREMENT BENEFIT PLANS
General. Substantially all of our employees are covered under various defined benefit and/or defined contribution retirement plans. Additionally, we sponsorpost-retirement health care benefits for our eligible U.S. employees. We provide U.S. employees, who meet eligibility criteria under the KeysightTechnologies, Inc. Retirement Plan ("RP"), defined benefits which are based on an employee's base or target pay during the years of employment and on length ofservice. For eligible employees' service through October 31, 1993, the benefit payable under the RP is reduced by any amounts due to the eligible employees'service under our defined contribution Deferred Profit-Sharing Plan ("DPSP"), which was closed to new participants as of November 1993.
In addition, in the U.S. we maintain the Supplemental Benefits Retirement Plan ("SBRP"), a supplemental unfunded non-qualified defined benefit plan toprovide benefits that would be provided under the RP but for limitations imposed by the Internal Revenue Code. The RP and the SBRP comprise the "U.S. Plans."
As of October 31, 2017 , the fair value of plan assets of the DPSP for U.S. employees was $297 million . The obligation for the DPSP eligible employeesequals the fair value of the DPSP assets due to the benefit payable under the RP being the greater of the RP and DPSP.
Eligible employees outside the U.S. generally receive retirement benefits under various retirement plans ("Non-U.S. Plans") based upon factors such as yearsof service and/or employee compensation levels. Eligibility is generally determined in accordance with local statutory requirements.
401(k) defined contribution plan . Eligible U.S. employees may participate in the Keysight Technologies, Inc. 401(k) Plan (the "401(k) Plan"). Enrollment inthe 401(k) Plan is automatic for employees who meet eligibility requirements unless they decline participation. Under the 401(k) Plan, we provide matchingcontributions to employees up to a maximum of 4 percent of an employee's annual eligible compensation. The maximum contribution to the 401(k) Plan is 50percent of an employee's annual eligible compensation, subject to regulatory limitations. Employees hired on or after August 1, 2015 are not eligible to participatein the RP or the U.S. Post-Retirement Benefit Plan. We provide matching contributions to these employees under the 401(k) Plan up to a maximum of 6 percent ofthe employee's annual eligible compensation. The 401(k) Plan employer expense included in income from operations was $16 million in 2017, $14 million in 2016and $14 million in 2015.
Post-retirement medical benefit plans. In addition to receiving retirement benefits, U.S. employees who meet eligibility requirements as of their terminationdate may participate in the Keysight Technologies, Inc. Health Plan for Retirees ("U.S. Post-Retirement Benefit Plan"). Eligible retirees who were less than age 50as of January 1, 2005 and who retire after age 55 with 15 or more years of service (age 54 with 14 or more years of service for workforce managed terminations)are eligible for a fixed amount which can be utilized to pay for premiums under a Keysight sponsored pre-Medicare medical plan, non-Keysight sponsored
86

Table of Contents
medical, dental and vision plans purchased in the individual insurance market, as well as Medicare Part A, Medicare Part B, prescription drug premiums, andeligible premiums paid for coverage under another employer's retiree medical, retiree vision and retiree dental plan provided such premiums were not paid on apre-tax basis. Eligible retirees who were at least age 50 as of January 1, 2005 and who retire after age 55 with 15 or more years of service (age 54 with 14 or moreyears of service for workforce managed terminations) currently choose from managed-care or indemnity options, with the company subsidization level or stipenddependent on a number of factors including eligibility and length of service. Grandfathered retirees receive a fixed monthly subsidy toward pre- 65 premium costs(subsidy capped at 2011 levels) and a fixed monthly stipend post- 65 . The subsidy amounts will not increase.
Components of net periodic benefit cost. The company uses alternate methods of amortization, as allowed by the authoritative guidance, which amortizes theactuarial gains and losses on a consistent basis for the years presented. For the U.S. Plans, gains and losses are amortized over the average future working lifetime.For most Non-U.S. Plans and the U.S. Post-Retirement Benefit Plan, gains and losses are amortized using a separate layer for each year's gains and losses.
On December 15, 2016, we transferred a portion of the assets and obligations of our Japanese Employees’ Pension Fund ("EPF") to the Japanese government.The remaining portion of the EPF was transferred to a new Keysight Japan corporate defined benefit pension plan. The difference between the obligations settledwith the government of $142 million and the assets transferred to the government of $51 million resulted in an increase in the funded status of the new definedbenefit pension plan of $91 million. The settlement resulted in a gain of $68 million which is included in other operating expense (income) in the consolidatedstatement of operations. Previously accrued salary progression of $4 million was derecognized at the time of settlement.
For the years ended October 31, 2017 , 2016 and 2015 , components of net periodic benefit cost (benefit) and other amounts recognized in othercomprehensive income were comprised of:
Defined Benefit Plans
U.S. Post-Retirement Benefit Plan U.S. Plans Non-U.S. Plans
2017 2016 2015 2017 2016 2015 2017 2016 2015 (in millions)Net periodic benefit cost (benefit)
Service cost — benefits earned during theperiod $ 22 $ 21 $ 22 $ 18 $ 19 $ 18 $ 1 $ 1 $ 1Interest cost on benefit obligation 21 22 20 23 32 41 7 9 7Expected return on plan assets (33) (37) (38) (74) (74) (72) (11) (14) (13)Amortization: Net actuarial loss 15 9 4 33 27 27 21 20 12 Prior service credit (8) (7) (7) (1) (1) (1) (15) (17) (21)
Net periodic benefit cost (benefit) 17 8 1 (1) 3 13 3 (1) (14)Curtailments and settlements — — — (69) — — — — —
Net periodic benefit cost (benefit) $ 17 $ 8 $ 1 $ (70) $ 3 $ 13 $ 3 $ (1) $ (14)Other changes in plan assets and benefitobligations recognized in other comprehensive(income) loss
Net actuarial loss (gain) $ 4 $ 60 $ 57 $ (145) $ 188 $ 51 $ (16) $ 5 $ 31Amortization:
Net actuarial loss (15) (9) (4) (33) (27) (27) (21) (20) (12)Prior service credit 8 7 7 1 1 1 15 17 21
Settlement — — — (24) — — — — —Curtailment — — — 1 — — — — —Foreign currency — — — 1 (5) 24 — — —
Total recognized in other comprehensive(income) loss (3) 58 60 (199) 157 49 (22) 2 40Total recognized in net periodic benefit cost(benefit) and other comprehensive (income) loss $ 14 $ 66 $ 61 $ (269) $ 160 $ 62 $ (19) $ 1 $ 26
Funded status. As of October 31, 2017 and 2016 , the funded status of the defined benefit and post-retirement benefit plans was as follows:
87

Table of Contents
U.S. DefinedBenefit Plans
Non-U.S. DefinedBenefit Plans
U.S.Post-RetirementBenefit Plan
2017 2016 2017 2016 2017 2016 (in millions)Change in fair value of plan assets:
Fair value — beginning of year $ 464 $ 475 $ 1,317 $ 1,343 $ 171 $ 179Actual return on plan assets 72 16 136 79 26 5Employer contributions — — 34 38 — 1Settlements — — (51) — — —Benefits paid (21) (27) (42) (40) (15) (14)Currency impact — — 46 (103) — —
Fair value — end of year $ 515 $ 464 $ 1,440 $ 1,317 $ 182 $ 171
Change in benefit obligation: Benefit obligation — beginning of year $ 610 $ 559 $ 1,508 $ 1,425 $ 214 $ 223Service cost 22 21 18 19 1 1Interest cost 21 22 23 32 7 9Settlements — (1) (142) — — —Curtailments — — (12) — — —Actuarial loss (gain) 43 36 (69) 192 (5)Benefits paid (21) (27) (42) (40) (15) (14)Currency impact — — 54 (120) — —
Benefit obligation — end of year $ 675 $ 610 $ 1,338 $ 1,508 $ 207 $ 214
Overfunded (Underfunded) status of PBO $ (160) $ (146) $ 102 $ (191) $ (25) $ (43)
Amounts recognized in the consolidated balance sheet consist of: Other assets $ — $ — $ 211 $ 12 $ — $ — Employee compensation and benefits (1) (1) — — — — Retirement and post-retirement benefits (159) (145) (109) (203) (25) (43)
Net asset (liability) (a) $ (160) $ (146) $ 102 $ (191) $ (25) $ (43)
Amounts recognized in accumulated other comprehensive income (loss): Actuarial losses $ 135 $ 145 $ 385 $ 586 $ 45 $ 83 Prior service credits (11) (18) (1) (3) (42) (58)
Total $ 124 $ 127 $ 384 $ 583 $ 3 $ 25(a) Certain of our immaterial defined benefit plans are not included in these disclosures.
The amounts in accumulated other comprehensive income expected to be amortized into net periodic benefit cost (benefit) during 2018 are as follows:
U.S. DefinedBenefit Plans
Non-U.S. DefinedBenefit Plans
U.S. Post-RetirementBenefit Plan
(in millions)Amortization of net prior service credit $ (7) $ (1) $ (15)Amortization of actuarial net loss $ 12 $ 25 $ 16
Investment policies and strategies as of October 31, 2017 . In the U.S., our RP and U.S. Post-Retirement Benefit Plan target asset allocations areapproximately 70 percent to equities and approximately 30 percent to fixed income investments. Our DPSP target asset allocation is approximately 60 percent toequities and approximately 40 percent to fixed income investments. The general investment objective for all our plan assets is to obtain the optimum rate ofinvestment return on the total investment portfolio consistent with the assumption of a reasonable level of risk. Specific investment objectives for the plans'portfolios are to: maintain and enhance the purchasing power of the plans' assets; achieve investment returns consistent with the level of risk being taken; and earnperformance rates of return in accordance with the benchmarks adopted for each asset class. Outside of the U.S., our target asset allocation is from 36 to 60 percent to equities, from 40 to 64 percent to fixed income investments, from zero to 20 percent to real estate investments and from zero to 14 percent to cash,depending on the plan. All plans' assets are broadly diversified. Due to fluctuations in capital markets, our actual allocations of plan assets as of October 31, 2017 ,differ from the target allocation. Our policy is to periodically bring the actual allocation in line with the target allocation.
88

Table of Contents
Equity securities include exchange-traded common stock and preferred stock of companies from broadly diversified industries. Fixed income securitiesinclude a portfolio of corporate bonds of companies from diversified industries, government securities, mortgage-backed securities, asset-backed securities,derivative instruments and other. Portions of the cash and cash equivalent, equity, and fixed income investments are held in commingled funds.
Fair Value . The measurement of the fair value of pension and post-retirement plan assets uses the valuation methodologies and the inputs as described inNote 12, "Fair Value Measurements."
Cash and Cash Equivalents - Cash and cash equivalents consist of short-term investment funds. The funds also invest in short-term domestic fixed incomesecurities and other securities with debt-like characteristics emphasizing short-term maturities and quality. Cash and cash equivalents are classified as Level 1investments except when the cash and cash equivalents are held in commingled funds, which have a daily net asset value ("NAV") derived from quoted prices forthe underlying securities in active markets; these are classified as assets measured at NAV.
Equity - Some equity securities consisting of common and preferred stock are held in commingled funds, which have daily NAVs derived from quoted pricesfor the underlying securities in active markets; these are classified as assets measure at NAV. Commingled funds which have quoted prices in active markets areclassified as Level 1 investments.
Fixed Income - Some of the fixed income securities are held in commingled funds, which have daily NAVs derived from the underlying securities; these areclassified as assets measured at NAV. Commingled funds which have quoted prices in active markets are classified as Level 1 investments.
Other Investments - Other investments include property-based pooled vehicles which invest in real estate. Market NAVs are regularly published in thefinancial press or on corporate websites and so these investments are classified as Level 3 investments or assets measured at NAV.
The following table presents the fair value of U.S. Defined Benefit Plans assets classified under the appropriate level of the fair value hierarchy as ofOctober 31, 2017 and 2016:
Fair Value Measurement
as of October 31, 2017 Using
October 31,
2017
Quoted Pricesin Active
Markets forIdentical Assets
(Level 1)
SignificantOther
ObservableInputs(Level 2)
SignificantUnobservable
Inputs(Level 3)
Assets Measured atNAV (b)
(in millions)Cash and cash equivalents $ 5 $ — $ 5 $ — $ —Equity 371 114 1 — 256Fixed income 139 16 75 — 48Other investments — — — — —
Total assets measured at fair value $ 515 $ 130 $ 81 $ — $ 304
(b) Per ASU 2015-07, certain instruments that are measured at fair value using the NAV per share practical expedient have not been categorized in the fair valuehierarchy. The fair value amounts presented in this table are intended to permit reconciliation of the fair value hierarchy to the total value of plan assets.
Fair Value Measurement
as of October 31, 2016 Using
October 31,
2016
Quoted Pricesin Active
Markets forIdentical Assets
(Level 1)
SignificantOther
ObservableInputs(Level 2)
SignificantUnobservable
Inputs(Level 3)
Assets Measured atNAV (b)
(in millions)Cash and cash equivalents $ 6 $ — $ 6 $ — $ —Equity 337 92 1 — 244Fixed income 121 15 68 — 38Other investments — — — — —
Total assets measured at fair value $ 464 $ 107 $ 75 $ — $ 282
89

Table of Contents
(b) Per ASU 2015-07, certain instruments that are measured at fair value using the NAV per share practical expedient have not been categorized in the fair valuehierarchy. The fair value amounts presented in this table are intended to permit reconciliation of the fair value hierarchy to the total value of plan assets.
For U.S. Defined Benefit Plans, there was no activity relating to assets measured at fair value using significant unobservable inputs (Level 3) during 2017 and2016.
The following table presents the fair value of U.S. Post-Retirement Benefit Plan assets classified under the appropriate level of the fair value hierarchy as ofOctober 31, 2017 and 2016:
Fair Value Measurement as of
October 31, 2017 Using
October 31,
2017
Quoted Pricesin Active
Markets forIdentical Assets
(Level 1)
SignificantOther
ObservableInputs(Level 2)
SignificantUnobservable
Inputs(Level 3)
Assets Measured atNAV (b)
(in millions)Cash and cash equivalents $ 3 $ 1 $ 2 $ — $ —Equity 132 41 — — 91Fixed income 47 5 25 — 17Other investments — — — — —
Total assets measured at fair value $ 182 $ 47 $ 27 $ — $ 108
(b) Per ASU 2015-07, certain instruments that are measured at fair value using the NAV per share practical expedient have not been categorized in the fair valuehierarchy. The fair value amounts presented in this table are intended to permit reconciliation of the fair value hierarchy to the total value of plan assets.
Fair Value Measurement as of
October 31, 2016 Using
October 31,
2016
Quoted Pricesin Active
Markets forIdentical Assets
(Level 1)
SignificantOther
ObservableInputs(Level 2)
SignificantUnobservable
Inputs(Level 3)
Assets Measured atNAV (b)
(in millions)Cash and cash equivalents $ 3 $ 1 $ 2 $ — $ —Equity 122 33 — — 89Fixed income 46 6 26 — 14Other investments — — — — —
Total assets measured at fair value $ 171 $ 40 $ 28 $ — $ 103
(b) Per ASU 2015-07, certain instruments that are measured at fair value using the NAV per share practical expedient have not been categorized in the fair valuehierarchy. The fair value amounts presented in this table are intended to permit reconciliation of the fair value hierarchy to the total value of plan assets.
For U.S. Post-Retirement Benefit Plan, there was no activity relating to assets measured at fair value using significant unobservable inputs (Level 3) during2017 and 2016.
90

Table of Contents
The following table presents the fair value of Non-U.S. Defined Benefit Plans assets classified under the appropriate level of the fair value hierarchy as ofOctober 31, 2017 and 2016:
Fair Value Measurement as of
October 31, 2017 Using
October 31,
2017
Quoted Pricesin Active
Markets forIdentical Assets
(Level 1)
SignificantOther
ObservableInputs(Level 2)
SignificantUnobservable
Inputs(Level 3)
Assets Measured atNAV (b)
(in millions)Cash and cash equivalents $ — $ — $ — $ — $ —Equity 757 156 2 — 599Fixed income 677 — 200 — 477Other investments 6 — — 3 3
Total assets measured at fair value $ 1,440 $ 156 $ 202 $ 3 $ 1,079
(b) Per ASU 2015-07, certain instruments that are measured at fair value using the NAV per share practical expedient have not been categorized in the fair valuehierarchy. The fair value amounts presented in this table are intended to permit reconciliation of the fair value hierarchy to the total value of plan assets.
Fair Value Measurement as of
October 31, 2016 Using
October 31,
2016
Quoted Pricesin Active
Markets forIdentical Assets
(Level 1)
SignificantOther
ObservableInputs(Level 2)
SignificantUnobservable
Inputs(Level 3)
Assets Measured atNAV (b)
(in millions)Cash and cash equivalents $ 36 $ 28 $ 8 $ — $ —Equity 660 137 3 — 520Fixed income 615 11 240 — 364Other investments 6 — — 3 3
Total assets measured at fair value $ 1,317 $ 176 $ 251 $ 3 $ 887
(b) Per ASU 2015-07, certain instruments that are measured at fair value using the NAV per share practical expedient have not been categorized in the fair valuehierarchy. The fair value amounts presented in this table are intended to permit reconciliation of the fair value hierarchy to the total value of plan assets.
91

Table of Contents
For Non-U.S. Defined Benefit Plans assets measured at fair value using significant unobservable inputs (Level 3), the following table summarizes the changein balances during 2017 and 2016:
Year Ended October 31,
2017 2016 (in millions)Balance, beginning of year $ 3 $ —
Realized gains — —Unrealized gains/(losses) — —Purchases, sales, issuances, and settlements — 3Transfers in (out) — —
Balance, end of year $ 3 $ 3
The table below presents the combined projected benefit obligation ("PBO"), accumulated benefit obligation ("ABO") and fair value of plan assets, groupingplans using comparisons of the PBO and ABO relative to the plan assets as of October 31, 2017 and 2016:
2017 2016
Benefit
Obligation Fair Value ofPlan Assets
Benefit
Obligation Fair Value ofPlan Assets
PBO PBO
(in millions) (in millions)U.S. defined benefit plans where PBO exceeds the fair value of plan assets $ 675 $ 515 $ 610 $ 464U.S. defined benefit plans where fair value of plan assets exceeds PBO — — — —
Total $ 675 $ 515 $ 610 $ 464
Non-U.S. defined benefit plans where PBO exceeds or is equal to the fair value of plan assets $ 378 $ 269 $ 1,329 $ 1,126Non-U.S. defined benefit plans where fair value of plan assets exceeds PBO 960 1,171 179 191
Total $ 1,338 $ 1,440 $ 1,508 $ 1,317
ABO ABO
U.S. defined benefit plans where ABO exceeds the fair value of plan assets $ 629 $ 515 $ 581 $ 464U.S. defined benefit plans where the fair value of plan assets exceeds ABO — — — —
Total $ 629 $ 515 $ 581 $ 464
Non-U.S. defined benefit plans where ABO exceeds or is equal to the fair value of plan assets $ 364 $ 269 $ 1,290 $ 1,126Non-U.S. defined benefit plans where fair value of plan assets exceeds ABO 952 1,171 171 191
Total $ 1,316 $ 1,440 $ 1,461 $ 1,317
Contributions and estimated future benefit payments . During 2018, we do not expect to contribute to the U.S. Defined Benefit Plans or the U.S. Post-Retirement Benefit Plan, and we expect to contribute $35 million to the Non-U.S. Defined Benefit Plans. The following table presents expected future benefitpayments for the next 10 years .
U.S. DefinedBenefit Plans
Non-U.S. DefinedBenefit Plans
U.S. Post-RetirementBenefit Plan
(in millions)2018 $ 32 $ 37 $ 172019 $ 35 $ 32 $ 182020 $ 40 $ 37 $ 172021 $ 46 $ 40 $ 162022 $ 47 $ 42 $ 16
2023 - 2027 $ 266 $ 236 $ 73
92

Table of Contents
Assumptions . The assumptions used to determine the benefit obligations and expense for our defined benefit and post-retirement benefit plans are presentedin the tables below. The expected long-term return on assets below represents an estimate of long-term returns on investment portfolios consisting of a mixture ofequities, fixed income and other investments in proportion to the asset allocations of each of our plans. We consider long-term rates of return, which are weightedbased on the asset classes (both historical and forecasted) in which we expect our pension and post-retirement funds to be invested. Discount rates reflect thecurrent rate at which pension and post-retirement obligations could be settled based on the measurement dates of the plans - October 31. The U.S. discount rates asof October 31, 2017 and 2016 were determined based on the results of matching expected plan benefit payments with cash flows from a hypothetically constructedbond portfolio. The Non-U.S. discount rates as of October 31, 2017 and 2016 were determined using spot rates along the yield curve to calculate disaggregateddiscount rates. In addition, we used this method to calculate two components of the periodic benefit cost: service cost and interest cost. The range of assumptionsthat were used for the Non-U.S. Defined Benefit Plans reflects the different economic environments within various countries.
Assumptions used to calculate the net periodic benefit cost (benefit) for the year ended October 31, 2017 and 2016 were as follows:
For years ended October 31,
2017 2016
U.S. Defined Benefit Plans: Discount rate 3.50% 4.00%Average increase in compensation levels 3.00% 3.00%Expected long-term return on assets 7.50% 8.00%
Non-U.S. Defined Benefit Plans: Discount rate 0.40-2.63% 0.76-3.80%Average increase in compensation levels 2.50-3.50% 2.50-3.50%Expected long-term return on assets 4.00-6.50% 4.00-6.50%
U.S. Post-Retirement Benefits Plan: Discount rate 3.50% 4.00%Expected long-term return on assets 7.50% 8.00%Current medical cost trend rate 6.00% 7.00%Ultimate medical cost trend rate 3.50% 3.50%Medical cost trend rate decreases to ultimate rate in year 2029 2028
Assumptions used to calculate the benefit obligation as of October 31, 2017 and 2016 were as follows:
As of the years ended October 31,
2017 2016
U.S. Defined Benefit Plans: Discount rate 3.75% 3.50%Average increase in compensation levels 3.00% 3.00%
Non-U.S. Defined Benefit Plans: Discount rate 0.59-2.52% 0.40-2.63%Average increase in compensation levels 2.50-3.25% 2.50-3.50%
U.S. Post-Retirement Benefits Plan: Discount rate 3.50% 3.50%Current medical cost trend rate 6.00% 6.00%Ultimate medical cost trend rate 3.50% 3.50%Medical cost trend rate decreases to ultimate rate in year 2029 2028
Health care trend rates do not have a significant effect on the total service and interest cost components or on the post-retirement benefit obligation amountsreported for the U.S. Post-Retirement Benefit Plan for the years ended October 31, 2017 and 2016.
93

Table of Contents
16. GUARANTEES
Standard Warranty
Our standard warranty term for most of our products from the date of delivery is typically three years. We accrue for standard warranty costs based onhistorical trends in warranty charges. The accrual is reviewed regularly and periodically adjusted to reflect changes in warranty cost estimates. Estimated warrantycharges are recorded within cost of products at the time related product revenue is recognized.
Activity related to the standard warranty accrual, which is included in other accrued and other long-term liabilities in our consolidated balance sheet, is asfollows:
Year Ended October 31,
2017 2016 (in millions)Beginning balance $ 44 $ 53Accruals for warranties, including change in estimates 33 23Settlements made during the period (32) (32)
Ending balance 45 $ 44
Accruals for warranties due within one year $ 24 $ 23Accruals for warranties due after one year 21 21
Ending balance at October 31 $ 45 $ 44
During the year ended October 31, 2016, we reduced the standard warranty accrual by $5 million as a result of lower than expected historical warrantycharges. This benefit was recognized in the consolidated statement of operations for the year ended October 31, 2016.
Indemnifications to Agilent
In connection with our separation from Agilent, we agreed to indemnify Agilent against certain damages and expenses that it might incur in the future. Theseindemnifications primarily cover damages relating to liabilities of the electronic measurement business of Agilent which was contributed to Keysight. Additionally,if the distribution of Keysight common stock to the Agilent shareholders were determined to be taxable for U.S. federal income tax purposes, Agilent and itsshareholders that are subject to U.S. federal income tax could incur significant U.S. federal income tax liabilities. If such determination is the result of our taking orfailing to take certain actions, then under the agreement between Agilent and Keysight pertaining to tax matters, as finalized at the time of separation, we aregenerally required to indemnify Agilent against such tax liabilities. Pursuant to the agreement pertaining to tax matters, we may also be required to indemnifyAgilent for other contingent tax liabilities, which could materially adversely affect our financial position. In our opinion, the fair value of these indemnificationobligations was not material as of October 31, 2017 .
Indemnifications to Avago
In connection with the sale of Agilent's semiconductor products business in December 2005, Agilent agreed to indemnify Avago, its affiliates and other relatedparties against certain damages and expenses that it might incur in the future. The continuing indemnifications primarily cover damages and expenses relating toliabilities of the businesses that Agilent retained and did not transfer to Avago, as well as pre-closing taxes and other specified items. In connection with ourseparation from Agilent, we have agreed to indemnify Agilent in connection with the indemnification obligations of Agilent with respect to Avago. In our opinion,the fair value of these indemnification obligations was not material as of October 31, 2017 .
Indemnifications to Verigy
In connection with the spin-off of Verigy, Agilent agreed to indemnify Verigy and its affiliates against certain damages which it might incur in the future.These indemnifications primarily cover damages relating to liabilities of the businesses that Agilent did not transfer to Verigy, liabilities that might arise underlimited portions of Verigy's IPO materials that relate to Agilent, and costs and expenses incurred by Agilent or Verigy to effect the IPO, arising out of thedistribution of Agilent's remaining holding in Verigy ordinary shares to Agilent's stockholders, or incurred to effect the separation of the semiconductor testsolutions business from Agilent to the extent incurred prior to the separation on June 1, 2006. On July 4, 2011, Verigy announced the completion by AdvantestCorporation of its acquisition of Verigy. Verigy operates as a wholly-owned subsidiary of Advantest and Agilent's
94

Table of Contents
indemnification obligations to Verigy should be unaffected. In connection with our separation from Agilent, we have agreed to indemnify Agilent in connectionwith the indemnification obligations of Agilent with respect to Verigy. In our opinion, the fair value of these indemnification obligations was not material as ofOctober 31, 2017 .
Indemnifications to HP Inc.
Agilent has given multiple indemnities to HP Inc. ("HP") in connection with Agilent's activities prior to its spin-off from HP for the businesses that constitutedAgilent prior to the spin-off. These indemnifications cover a variety of aspects of Agilent's business, including, but not limited to, employee, tax, intellectualproperty and environmental matters. The agreements containing these indemnifications have been previously disclosed as exhibits to Agilent's registrationstatement on Form S-1 filed on August 16, 1999. As part of our separation from Agilent, we have agreed to assume these indemnification obligations of Agilentrelating to the electronic measurement business with respect to HP. In our opinion, the fair value of these indemnification obligations was not material as ofOctober 31, 2017 .
Indemnifications to Officers and Directors
Our corporate by-laws require that we indemnify our officers and directors, as well as those who act as directors and officers of other entities at our request,against expenses, judgments, fines, settlements and other amounts actually and reasonably incurred in connection with any proceedings arising out of their servicesto Keysight and such other entities, including service with respect to employee benefit plans. In addition, we have entered into separate indemnification agreementswith each director and each board-appointed officer of Keysight which provide for indemnification of these directors and officers under similar circumstances andunder additional circumstances. The indemnification obligations are more fully described in the by-laws and the indemnification agreements. We purchasestandard insurance to cover claims or a portion of the claims made against our directors and officers. Since a maximum obligation is not explicitly stated in our by-laws or in our indemnification agreements and will depend on the facts and circumstances that arise out of any future claims, the overall maximum amount of theobligations cannot be reasonably estimated. Historically, we have not made payments related to these obligations, and the fair value for these indemnificationobligations was not material as of October 31, 2017 .
Other Indemnifications
As is customary in our industry and as provided for in local law in the U.S. and other jurisdictions, many of our standard contracts provide remedies to ourcustomers and others with whom we enter into contracts, such as defense, settlement, or payment of judgment for intellectual property claims related to the use ofour products. From time to time, we indemnify customers, as well as our suppliers, contractors, lessors, lessees, companies that purchase our businesses or assetsand others with whom we enter into contracts, against combinations of loss, expense, or liability arising from various triggering events related to the sale and theuse of our products and services, the use of their goods and services, the use of facilities and state of our owned facilities, the state of the assets and businesses thatwe sell and other matters covered by such contracts, usually up to a specified maximum amount. In addition, from time to time we also provide protection to theseparties against claims related to undiscovered liabilities, additional product liability or environmental obligations. In our experience, claims made under suchindemnifications are rare and the associated estimated fair value of the liability was not material as of October 31, 2017 .
In connection with the previous sales of several of Agilent’s businesses, Agilent agreed to indemnify the buyers of such businesses, their respective affiliatesand other related parties against certain damages that they might incur in the future. The continuing indemnifications primarily cover damages relating to liabilitiesof the businesses that Agilent retained and did not transfer to the buyers, as well as other specified items. In connection with our separation from Agilent, weagreed to assume the indemnification obligations of Agilent to the extent that the retained businesses were part of the electronic measurement business. In ouropinion, the fair value of these indemnification obligations was not material as of October 31, 2017.
17. COMMITMENTS AND CONTINGENCIES
Operating Lease Commitments. We lease certain real and personal property from unrelated third parties under non-cancellable operating leases. Futureminimum lease payments under operating leases as of October 31, 2017 were $51 million in 2018, $44 million in 2019, $31 million in 2020, $23 million in 2021,$20 million in 2022 and $53 million thereafter. Future minimum sublease income under leases as of October 31, 2017 was $1 million in 2018, $1 million in 2019,$1 million in 2020, $1 million in 2021, $1 million in 2022 and none thereafter. Certain leases require us to pay property taxes, insurance and routine maintenance,and include escalation clauses. Total rent expense was $51 million in 2017, $45 million in 2016 and $43 million in 2015.
Capital Lease Commitments. We had capital lease obligations of $4 million and $1 million as of October 31, 2017 and October 31, 2016, respectively. Thecurrent portion of the total obligation is included in other accrued liabilities and the remaining long-term portion is included in other long-term liabilities on theconsolidated balance sheet. Future minimum lease payments, including
95

Table of Contents
financing charges, under capital leases as of October 31, 2017 were $1 million in 2018, zero in 2019, $1 million in 2020, zero in 2021, $1 million in 2022 and $2million thereafter. Assets held under capital leases are included in net property, plant, and equipment on the consolidated balance sheet.
Contingencies. We are involved in lawsuits, claims, investigations and proceedings, including, but not limited to, patent, commercial and environmentalmatters, which arise in the ordinary course of business. There are no matters pending that we currently believe are reasonably possible of having a material impactto our business, consolidated financial condition, results of operations or cash flows.
18. DEBT
Short-Term Debt
Revolving Credit Facility
On February 15, 2017 , we entered into an amended and restated credit agreement (the “Revolving Credit Facility”) that replaced our existing $450 millionunsecured credit facility dated September 15, 2014. The Revolving Credit Facility provides for a $450 million , five-year unsecured revolving credit facility thatwill expire on February 15, 2022 and bears interest at an annual rate of LIBOR + 1.30% . In addition, the Revolving Credit Facility permits us to increase the totalcommitments under this credit facility by up to $150 million in the aggregate on one or more occasions upon request. We may use amounts borrowed under thefacility for general corporate purposes. During the year ended October 31, 2017, we borrowed and repaid $182 million of borrowings outstanding under theRevolving Credit Facility. As of October 31, 2017, we had no borrowings outstanding under the Revolving Credit Facility. We were in compliance with thecovenants of the Revolving Credit Facility during the year ended October 31, 2017.
Bridge Facility
On January 30, 2017 , we entered into a commitment letter, pursuant to which certain lenders agreed to provide a senior unsecured 364 -day bridge loanfacility of up to $1.684 billion (“the Bridge Facility”) for the purpose of providing the financing to support Keysight's acquisition of Ixia. Under the terms ofcommitment letter, the Bridge Facility was automatically terminated upon the Ixia acquisition on April 18, 2017 . For the year ended October 31, 2017, weincurred costs in connection with the Bridge Facility of $9 million that were amortized to interest expense.
Long-Term Debt
The following table summarizes the components of our long-term debt:
October 31,
2017 2016 (in millions)3.30% Senior Notes due 2019 ($500 face amount less unamortized costs of $2 and $3) $ 498 $ 4974.55% Senior Notes due 2024 ($600 face amount less unamortized costs of $4 and $4) 596 5964.60% Senior Notes due 2027 ($700 face amount less unamortized costs of $6 and zero) 694 —Term loan ($260 face amount less unamortized costs of zero) 260 — 2,048 1,093Less: Current portion of long-term debt 10 —
Total $ 2,038 $ 1,093
2019 Senior Notes
In October 2014, the company issued an aggregate principal amount of $500 million in senior notes ("2019 Senior Notes"). The 2019 Senior Notes wereissued at 99.902 percent of their principal amount. The notes will mature on October 30, 2019, and bear interest at a fixed rate of 3.30 percent per annum. Theinterest is payable semi-annually on April 30 and October 30 of each year. We incurred issuance costs of $4 million in connection with the 2019 Senior Notes thatare being amortized to interest expense over the term of the senior notes.
2024 Senior Notes
In October 2014, the company issued an aggregate principal amount of $600 million in senior notes ("2024 Senior Notes"). The 2024 Senior Notes wereissued at 99.966 percent of their principal amount. The notes will mature on October 30, 2024, and bear interest at a fixed rate of 4.55 percent per annum. Theinterest is payable semi-annually on April 30 and October 30 of each
96

year. We incurred issuance costs of $5 million in connection with the 2024 Senior Notes that are being amortized to interest expense over the term of the seniornotes.
2027 Senior Notes
In April 2017, the company issued an aggregate principal amount of $700 million in senior notes ("2027 Senior Notes"). The 2027 Senior Notes were issued at99.873 percent of their principal amount. The notes will mature on April 6, 2027 and bear interest at a fixed rate of 4.60 percent per annum. The interest is payablesemi-annually on April 6 and October 6 of each year, commencing on October 6, 2017. We incurred issuance costs of $6 million in connection with the 2027Senior Notes that, along with the debt discount of $1 million, are being amortized to interest expense over the term of the senior notes. The 2027 Senior Notes areunsecured and rank equally in right of payment with all of our other senior unsecured indebtedness.
Senior Unsecured Term Loan
On February 15, 2017, we entered into a term credit agreement that provides for a three-year $400 million senior unsecured term loan that bears interest at anannual rate of LIBOR + 1.50%. The term loan was drawn upon the closing of the Ixia acquisition. During the year ended October 31, 2017, we repaid $140 millionof the term loan. As of October 31, 2017, we had borrowings outstanding under the term loan of $260 million , of which $10 million is due in the next twelvemonths. In connection with the term loan, we incurred issuance costs of $1 million that are being amortized to interest expense over the term of loan.
As of October 31, 2017 and October 31, 2016, we had $26 million and $18 million , respectively, of outstanding letters of credit unrelated to the credit facilitythat were issued by various lenders.
19. STOCKHOLDERS' EQUITY
Issuance of Common Stock
In March 2017, we completed a public offering of our common stock and issued 13,142,856 shares for total cash proceeds of $444 million , net ofunderwriting discounts and offering costs.
Stock Repurchase Program
On February 18, 2016, the Board of Directors approved a stock repurchase program authorizing the purchase of up to $200 million of the company’s commonstock. Under the program, shares may be purchased from time to time, subject to general business and market conditions and other investment opportunities,through open market purchases, privately negotiated transactions or other means. All such shares and related costs are held as treasury stock and accounted for attrade date using the cost method. The stock repurchase program may be commenced, suspended or discontinued at any time at the company’s discretion and doesnot have an expiration date.
For the year ended October 31, 2017, we did not repurchase any shares of common stock under the stock repurchase program. For the year ended October 31,2016, we repurchased 2.3 million shares of common stock for $62 million . All such shares and related costs are held as treasury stock and accounted for at tradedate using the cost method.
Accumulated other comprehensive income
The following table summarizes the components of our accumulated other comprehensive loss as of October 31, 2017 and 2016, net of tax effect:
October 31,
2017 2016 (in millions)Unrealized gain on equity securities, net of tax (expense) of $(5) and $(4) $ 14 $ 10Foreign currency translation, net of tax (expense) of $(63) and $(63) (39) (29)Unrealized losses on defined benefit plans, net of tax benefit of $82 and $141 (433) (596)Unrealized losses on derivative instruments, net of tax benefit (expense) of $(2) and $1 1 (3)
Total accumulated other comprehensive loss $ (457) $ (618)
97

Table of Contents
Changes in accumulated other comprehensive income by component and related tax effects for the years ended October 31, 2017 and 2016 were as follows:
Net defined benefit pension cost and
post retirement plan costs:
Unrealized gainon equitysecurities
Foreigncurrencytranslation
ActuarialLosses
Prior servicecredits
Unrealized gains(losses) onderivatives Total
(in millions)
At October 31, 2015 $ 21 $ (48) $ (511) $ 65 $ (6) $ (479)Other comprehensive income (loss) beforereclassifications (13) 19 (244) — (7) (245)Amounts reclassified out of accumulated othercomprehensive income — — 56 (25) 12 43Tax (expense) benefit 2 — 53 10 (2) 63Other comprehensive income (loss) for the twelve monthsended October 31, 2016 (11) 19 (135) (15) 3 (139)At October 31, 2016 10 (29) (646) 50 (3) (618)Other comprehensive income (loss) beforereclassifications 5 (10) 177 (a) — 6 178Amounts reclassified out of accumulated othercomprehensive income — — 69 (24) 1 46Tax (expense) benefit (1) — (68) 9 (3) (63)Other comprehensive income (loss) for the twelve monthsended October 31, 2017 4 (10) 178 (15) 4 161
At October 31, 2017 $ 14 $ (39) $ (468) $ 35 $ 1 $ (457)(a) This includes pension curtailment and settlement of $(1) million and $24 million, respectively.
Reclassifications out of accumulated other comprehensive loss for the twelve months ended October 31, 2017 and 2016 were as follows:
Details about accumulated other comprehensive loss components Amounts Reclassified from other
comprehensive loss Affected line item in statement of
operations Year Ended October 31,
2017 2016
(in millions) Unrealized loss on derivatives $ (1) $ (12) Cost of products 1 4 Provision for income tax — (8) Net of Income Tax Net defined benefit pension cost and post retirement plan costs: Actuarial net loss (69) (56) Prior service benefit 24 25 (45) (31) Total before income tax 14 8 Provision for income tax (31) (23) Net of income tax Total reclassifications for the period $ (31) $ (31)
An amount in parentheses indicates a reduction to income and an increase to the accumulated other comprehensive income.
Reclassifications of prior service benefit and actuarial net loss in respect of retirement plans and post retirement pension plans are included in the computationof net periodic cost (see Note 15, "Retirement Plans and Post Retirement Pension Plans").
20. SEGMENT INFORMATION
We provide electronic design and test instruments and systems and related software, software design tools, and related services that are used in the design,development, manufacture, installation, deployment and operation of electronics equipment. Related
98

Table of Contents
services include start-up assistance, instrument productivity and application services and instrument calibration and repair. Additionally, we provide test, securityand visibility solutions that validate, secure and optimize networks and applications from engineering concept to live deployment. We also offer customization,consulting and optimization services throughout the customer's product life cycle.
In fiscal 2016, we completed an organizational change to align our organization with the industries we serve which resulted in three reportable operatingsegments, Communications Solutions Group (“CSG”), Electronic Industrial Solutions Group (“EISG”), and Services Solutions Group (“SSG”). CSG and EISG arefrom our previous Measurement Solutions segment, while SSG was formerly reported as the company's Customer Support and Services segment. The neworganizational structure continues to include centralized enterprise functions that provide support across the groups. Prior period amounts were revised in 2016 toconform to the presentation. On April 18, 2017, we completed the acquisition of Ixia, which became our fourth reportable segment, the Ixia Solutions Group(“ISG”).
Our operating segments were determined based primarily on how the chief operating decision maker views and evaluates our operations. Segment operatingresults are regularly reviewed by the chief operating decision maker to make decisions about resources to be allocated to each segment and to assess performance.Other factors, including market separation and customer specific applications, go-to-market channels, products and services and manufacturing are considered indetermining the formation of these operating segments.
Descriptions of our four reportable segments are as follows:
The Communications Solutions Group serves customers spanning the worldwide commercial communications end market, which includes internetinfrastructure, and the aerospace, defense and government end market. The group provides electronic design and test software, instruments, and systems used in thesimulation, design, validation, manufacturing, installation and optimization of electronic equipment.
The Electronic Industrial Solutions Group provides test and measurement solutions across a broad set of electronic industrial end markets, focusing on high-growth applications in the automotive and energy industry and measurement solutions for semiconductor design and manufacturing, consumer electronics,education and general electronics manufacturing. The group provides electronic design and test software, instruments, and systems used in the simulation, design,validation, manufacturing, installation and optimization of electronic equipment.
The Ixia Solutions Group helps customers validate the performance and security resilience of their networks and associated applications. The test, visibilityand security products help organizations and their customers strengthen their physical and virtual networks. Enterprises, service providers, network equipmentmanufacturers, and governments worldwide rely on the group's solutions to validate new products before shipping and secure ongoing operation of their networkswith better visibility and security. The group’s product solutions consist of high-performance hardware platforms, software applications, and services, includingwarranty and maintenance offerings.
The Services Solutions Group provides repair, calibration and consulting services, and remarkets used Keysight equipment. In addition to providing repair andcalibration support for Keysight equipment, we also calibrate non-Keysight equipment. The group serves the same markets as Keysight’s CommunicationsSolutions and Electronic Industrial Solutions Groups, providing industry-specific services to deliver complete Keysight solutions and help customers reduce theirtotal cost of ownership for their design and test equipment.
A significant portion of the segments' expenses, other than the Ixia Solutions Group expenses, arise from shared services and infrastructure that we havehistorically provided to the segments in order to realize economies of scale and to efficiently use resources. These expenses, collectively called corporate charges,include costs of centralized research and development, legal, accounting, real estate, insurance services, information technology services, treasury and othercorporate infrastructure expenses. Charges are allocated to the segments, and the allocations have been determined on a basis that we consider to be a reasonablereflection of the utilization of services provided to or benefits received by the segments. The Ixia Solutions Group will not be allocated these charges untilintegrated into the shared services and infrastructure.
The following tables reflect the results of our reportable segments under our management reporting system. These results are not necessarily in conformitywith GAAP. The performance of each segment is measured based on several metrics, including income from operations. These results are used, in part, by thechief operating decision maker in evaluating the performance of, and in allocating resources to, each of the segments.
99

Table of Contents
The profitability of each of the segments is measured after excluding share-based compensation expense, restructuring and asset impairment charges,investment gains and losses, interest income, interest expense, acquisition and integration costs, separation and related costs, amortization related to acquisition-related balances and other items as noted in the reconciliations below.
CommunicationsSolutions Group
Electronic IndustrialSolutions Group Ixia Solutions Group
Services SolutionsGroup
TotalSegments
(in millions)Year ended October 31, 2017:
Total net revenue $ 1,737 $ 836 $ 197 $ 419 $ 3,189Amortization of acquisition-related balances 1 — 59 — 60Total segment revenue $ 1,738 $ 836 $ 256 $ 419 $ 3,249Segment income from operations $ 311 $ 199 $ 42 $ 68 $ 620Depreciation expense $ 52 $ 20 $ 7 $ 13 $ 92
Year ended October 31, 2016: Total net revenue $ 1,740 $ 776 $ — $ 402 $ 2,918Amortization of acquisition-related balances 12 — — — 12Total segment revenue $ 1,752 $ 776 $ — $ 402 $ 2,930Segment income from operations $ 314 $ 169 $ — $ 63 $ 546Depreciation expense $ 53 $ 20 $ — $ 12 $ 85
Year ended October 31, 2015: Total net revenue $ 1,697 $ 758 $ — $ 401 $ 2,856Amortization of acquisition-related balances 6 — — — 6Total segment revenue $ 1,703 $ 758 $ — $ 401 $ 2,862Segment income from operations $ 329 $ 158 $ — $ 72 $ 559Depreciation expense $ 49 $ 19 $ — $ 13 $ 81
The following table reconciles reportable segments' income from operations to our total enterprise income before taxes:
Year Ended October 31,
2017 2016 2015 (in millions)Total reportable segments' income from operations $ 620 $ 546 $ 559Share-based compensation expense (56) (49) (55)Restructuring and related costs (11) — (14)Amortization of acquisition-related balances (256) (56) (23)Acquisition and integration costs (57) (18) (16)Acquisition-related compensation expense (28) — —Separation and related costs (20) (24) (20)Pension curtailment and settlement gains 69 — —Northern California wildfire-related costs (16) — —Other (6) 7 —Income from operations, as reported 239 406 431Interest income 7 3 1Interest expense (80) (47) (46)Other income (expense), net 13 4 2
Income before taxes, as reported $ 179 $ 366 $ 388
Major customers. No customer represented 10 percent or more of our total net revenue in 2017 , 2016 or 2015 .
100
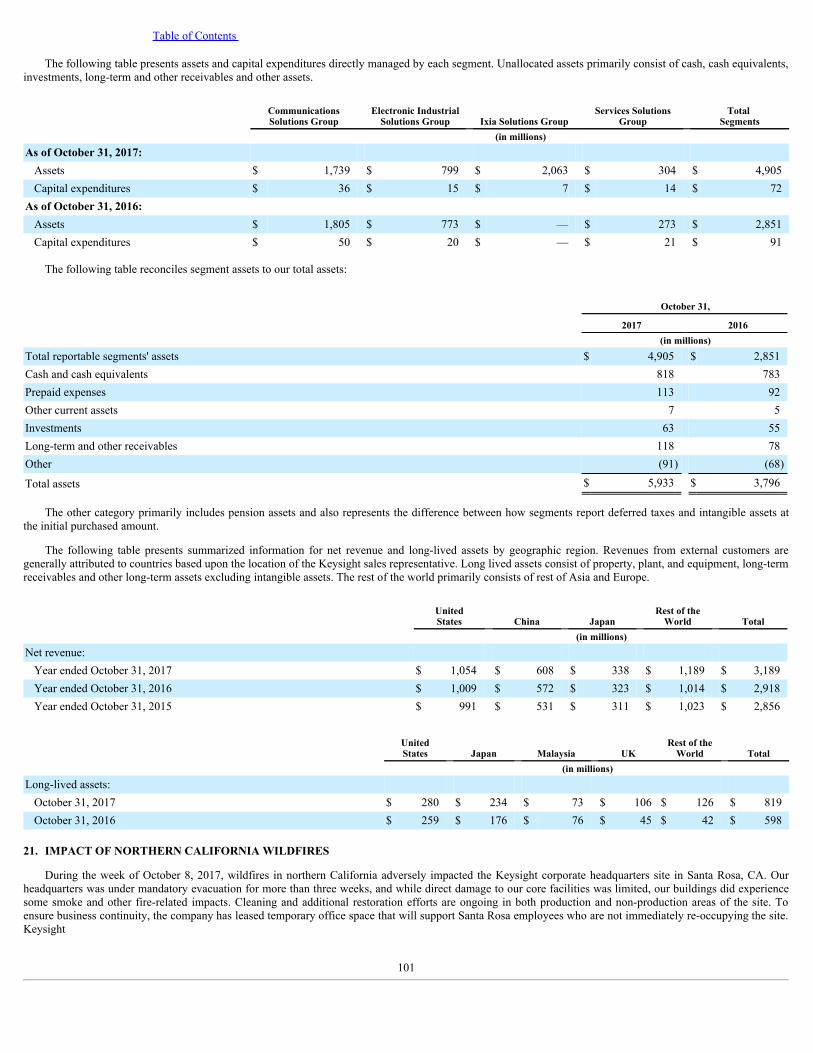
Table of Contents
The following table presents assets and capital expenditures directly managed by each segment. Unallocated assets primarily consist of cash, cash equivalents,investments, long-term and other receivables and other assets.
CommunicationsSolutions Group
Electronic IndustrialSolutions Group Ixia Solutions Group
Services SolutionsGroup
Total Segments
(in millions)As of October 31, 2017:
Assets $ 1,739 $ 799 $ 2,063 $ 304 $ 4,905Capital expenditures $ 36 $ 15 $ 7 $ 14 $ 72
As of October 31, 2016: Assets $ 1,805 $ 773 $ — $ 273 $ 2,851Capital expenditures $ 50 $ 20 $ — $ 21 $ 91
The following table reconciles segment assets to our total assets:
October 31,
2017 2016 (in millions)Total reportable segments' assets $ 4,905 $ 2,851Cash and cash equivalents 818 783Prepaid expenses 113 92Other current assets 7 5Investments 63 55Long-term and other receivables 118 78Other (91) (68)
Total assets $ 5,933 $ 3,796
The other category primarily includes pension assets and also represents the difference between how segments report deferred taxes and intangible assets atthe initial purchased amount.
The following table presents summarized information for net revenue and long-lived assets by geographic region. Revenues from external customers aregenerally attributed to countries based upon the location of the Keysight sales representative. Long lived assets consist of property, plant, and equipment, long-termreceivables and other long-term assets excluding intangible assets. The rest of the world primarily consists of rest of Asia and Europe.
UnitedStates China Japan
Rest of theWorld Total
(in millions)Net revenue:
Year ended October 31, 2017 $ 1,054 $ 608 $ 338 $ 1,189 $ 3,189Year ended October 31, 2016 $ 1,009 $ 572 $ 323 $ 1,014 $ 2,918Year ended October 31, 2015 $ 991 $ 531 $ 311 $ 1,023 $ 2,856
UnitedStates Japan Malaysia UK
Rest of theWorld Total
(in millions)Long-lived assets:
October 31, 2017 $ 280 $ 234 $ 73 $ 106 $ 126 $ 819October 31, 2016 $ 259 $ 176 $ 76 $ 45 $ 42 $ 598
21. IMPACT OF NORTHERN CALIFORNIA WILDFIRES
During the week of October 8, 2017, wildfires in northern California adversely impacted the Keysight corporate headquarters site in Santa Rosa, CA. Ourheadquarters was under mandatory evacuation for more than three weeks, and while direct damage to our core facilities was limited, our buildings did experiencesome smoke and other fire-related impacts. Cleaning and additional restoration efforts are ongoing in both production and non-production areas of the site. Toensure business continuity, the company has leased temporary office space that will support Santa Rosa employees who are not immediately re-occupying the site.Keysight
101

Table of Contents
is insured for the damage caused by the fire, including business interruption insurance, and though we do not expect the fire to have a net impact on our businessresults, the disruption will impact the seasonality of revenue in the first half of fiscal 2018.
For the three and twelve months ended October 31, 2017, we recognized costs of $16 million , net of $2 million of estimated insurance recovery, including thewrite-off of damaged fixed assets, unabsorbed overhead costs, cleaning and other direct costs related to the impact of this event.
A summary of the net charges in the consolidated statement of operations resulting from the impact of the fire is shown below:
Year Ended October 31, 2017 (in millions)Cost of products and services $ 5Research and development 1Selling, general and administrative 8Other operating expense (income), net 2
Total $ 16
As we are still in the investigation phase, we have only recognized an insurance receivable for known losses for which we believe insurance reimbursement isprobable in excess of our self-insured retention amount of $10 million . In many cases, our insurance coverage exceeds the amount of these covered losses, but nogain contingencies have been recognized as our ability to realize those gains remains uncertain for financial reporting purposes. We currently estimate that totallosses and expenses related to the fire will range from $80 million to $110 million , primarily including cleaning and recovery costs, and believe that the expenseswill be recoverable under our insurance policy. There may be a difference in timing of costs incurred and the related insurance reimbursement.
102

Table of Contents
QUARTERLY SUMMARY(Unaudited)
Three Months Ended
January 31, April 30, July 31, October 31, (in millions, except per share data)2017 Net revenue $ 726 $ 753 $ 832 $ 878Gross profit $ 404 $ 413 $ 411 $ 474Income (loss) from operations $ 162 $ 42 $ (4) $ 39Net income (loss) $ 109 $ 49 $ (18) $ (38)Net income (loss) per share:
Basic $ 0.64 $ 0.28 $ (0.10) $ (0.20)Diluted $ 0.63 $ 0.27 $ (0.10) $ (0.20)
Weighted average shares used in computing net income (loss) per share: Basic 171 177 186 186Diluted 173 179 186 186
Range of stock prices on NYSE 31.81 - 38.28 35.05 - 39.36 35.62 - 42.98 39.21 - 44.79
2016 Net revenue $ 721 $ 731 $ 715 $ 751Gross profit $ 392 $ 406 $ 406 $ 420Income from operations (a) $ 98 $ 95 $ 106 $ 107Net income $ 64 $ 88 $ 91 $ 92Net income per share:
Basic $ 0.37 $ 0.52 $ 0.54 $ 0.54Diluted $ 0.37 $ 0.51 $ 0.53 $ 0.53
Weighted average shares used in computing net income pershare:
Basic 171 170 170 170Diluted 172 172 172 172
Range of stock prices on NYSE 22.15 - 33.48 21.07 - 28.39 25.49 - 31.87 26.87 - 33.14
103

Table of Contents
Item 9. Changes in and Disagreements with Accountants on Accounting and Financial Disclosure
None.
Item 9A. Controls and Procedures
Evaluation of Disclosure Controls and Procedures
Our management has evaluated, under the supervision and with the participation of our Chief Executive Officer and Chief Financial Officer, the effectivenessof our disclosure controls and procedures as of October 31, 2016, pursuant to and as required by Rule 13a-15(b) under the Securities Exchange Act of 1934(“Exchange Act”). Based on that evaluation, our Chief Executive Officer and Chief Financial Officer have concluded that, as of October 31, 2017, the company'sdisclosure controls and procedures, as defined by Rule 13a-15(e) under the Exchange Act, were effective and designed to ensure that(i) information required to bedisclosed in the company's reports filed under the Exchange Act is recorded, processed, summarized and reported within the time periods specified in the SEC'srules and forms, and (ii) information is accumulated and communicated to management, including the Chief Executive Officer and Chief Financial Officer, asappropriate to allow timely decisions regarding required disclosures.
Management's Report on Internal Control over Financial Reporting
Our management is responsible for establishing and maintaining adequate internal control over financial reporting, as such term is defined in Exchange ActRule 13a-15(f). Under the supervision and with the participation of our management, including our Chief Executive Officer and Chief Financial Officer, weconducted an evaluation of the effectiveness of our internal control over financial reporting based on the framework in Internal Control - Integrated Framework(2013) issued by the Committee of Sponsoring Organizations of the Treadway Commission. Based on the results of this evaluation, our management concludedthat our internal control over financial reporting was effective as of October 31, 2017.
The SEC provides for exclusion of an acquired business's internal controls from management's annual assessment of the internal controls over financialreporting when it is not possible to conduct assessments for the acquired business in the period between the acquisition date and the date of management'sassessment. The company completed the acquisition of Ixia on April 18, 2017 and ScienLab on August 31, 2017. Management excluded Ixia and ScienLab from itsassessment of the effectiveness of the company’s internal control over financial reporting as of October 31, 2017. Ixia constituted approximately 6% of total assetsand approximately 6% total revenues, while ScienLab constituted less than 1% of total assets and total revenues for the year ended October 31, 2017.
The effectiveness of our internal control over financial reporting as of October 31, 2017 has been audited by PricewaterhouseCoopers LLP, an independentregistered public accounting firm, as stated in their report which appears in Item 8 of this Annual Report on Form 10-K.
Changes in Internal Control Over Financial Reporting
There were no changes in our internal control over financial reporting that occurred during our last fiscal quarter that has materially affected, or is reasonablylikely to materially affect, our internal control over financial reporting.
Item 9B. Other Information
None.
PART III
Item 10. Directors, Executive Officers and Corporate Governance
Information regarding our directors will appear under “Proposal No. 1 - Election of Directors” in our Proxy Statement for the Annual Meeting of Stockholders(“Proxy Statement”). That portion of the Proxy Statement is incorporated by reference into this report. Information regarding our executive officers appears inItem 1 of this report under “Executive Officers of the Registrant.” Information regarding our Audit and Finance Committee and our Audit and FinanceCommittee's financial expert appears under “Audit and Finance Committee Report” and “Board Structure and Compensation” in our Proxy Statement. That portionof the Proxy Statement is incorporated by reference into this report.
There were no material changes to the procedures by which security holders may recommend nominees to our Board of Directors. Information regarding ourcode of ethics (the company's Standards of Business Conduct) applicable to our principal executive officer, our principal financial officer, our controller and othersenior financial officers appears in Item 1 of this report
104

Table of Contents
under “Investor Information.” We will post amendments to or waivers from a provision of the Standards of Business Conduct with respect to those persons on ourwebsite at www.investor.keysight.com.
In order for a stockholder proposal to be considered for inclusion in Keysight’s proxy statement for the 2018 annual meeting of stockholders, the writtenproposal must be received by Keysight no later than December 17, 2017 and should contain such information as is required under Keysight’s Bylaws. Suchproposals will need to comply with the SEC’s regulations regarding the inclusion of stockholder proposals in Keysight sponsored proxy materials.
Compliance with Section 16(a) of the Exchange Act
Information about compliance with Section 16(a) of the Exchange Act appears under “Section 16(a) Beneficial Ownership Reporting Compliance” in theProxy Statement. That portion of the Proxy Statement is incorporated by reference into this report.
Item 11. Executive Compensation
Information about compensation of our named executive officers appears under “Executive Compensation,” “Compensation Committee Interlocks and InsiderParticipation” in the Proxy Statement. Information about compensation of our directors appears under “Director Compensation” and “Compensation CommitteeReport” and “Stock Ownership Guidelines” in the Proxy Statement. Those portions of the Proxy Statement are incorporated by reference into this report.
Item 12. Security Ownership of Certain Beneficial Owners and Management and Related Stockholder Matters
Information about security ownership of certain beneficial owners and management appears under "Common Stock Ownership of Certain Beneficial Ownersand Management" in the Proxy Statement. That portion of the Proxy Statement is incorporated by reference into this report.
EQUITY COMPENSATION PLAN INFORMATION
The following table summarizes information about our equity compensation plans as of October 31, 2017. All outstanding awards relate to our common stock.
Plan Category
Number of Securities to beIssued upon Exercise ofOutstanding Options,Warrants and Rights
Weighted-average Exercise Priceof Outstanding Options, Warrants
and Rights
Number of SecuritiesRemaining Available for
Future Issuance under EquityCompensation Plans
(Excluding Securities Reflectedin Column (a))
(a) (b) (c)
Equity compensation plans approved by security holders(1)(2)(3) 5,994,017 $ 27 27,432,458Equity compensation plans not approved by securityholders — $ — —Total 5,994,017 $ 27 27,432,458
(1) The number of securities remaining available for future issuance in column (c) includes 22,187,218 shares of common stock authorized and available forissuance under the Keysight Technologies, Inc. Employee Stock Purchase Plan ("423(b) Plan"). The number of shares authorized for issuance under the 423(b)Plan is subject to an automatic annual increase of the lesser of one percent of the outstanding common stock of Keysight or an amount determined by theCompensation Committee of our Board of Directors. Under the terms of the 423(b) Plan, in no event shall the aggregate number of shares issued under thePlan exceed 75 million shares. The number of securities remaining available for future issuance in column (c) is before the issuance of shares of commonstock to participants in consideration of the aggregate participant contribution under 423(b) plan totaling $17 million as of October 31, 2017.
(2) We issue securities under our equity compensation plans in forms other than options, warrants or rights. Those are issued under the 2014 Equity and IncentiveCompensation Plan which was originally adopted by the Board on July 16, 2014, subsequently amended and restated by the Board on September 29, 2014 andJanuary 22, 2015 and became effective as of November 1, 2014 (the “Effective Date”). The 2014 Plan provides for the grant of awards in the form of stockoptions, stock
105

appreciation rights, restricted stock, restricted stock units, performance shares and performance units with performance-based conditions to vesting orexercisability, and cash awards. The 2014 Plan has a term of ten years.
(3) We issue securities under our equity compensation plans in forms which do not require a payment by the recipient to us at the time of exercise or vesting,including restricted stock, restricted stock units and performance units. Accordingly, the weighted-average exercise price in column (b) does not take theseawards into account.
Item 13. Certain Relationships and Related Transactions, and Director Independence
Information about certain relationships and related transactions appears under "Related Person Transaction Policy and Procedures" in the Proxy Statement.Information about director independence appears under the heading "Board Structure and Compensation — Director Independence" in the Proxy Statement. Eachof those portions of the Proxy Statement is incorporated by reference into this report.
Item 14. Principal Accounting Fees and Services
Information about principal accountant fees and services as well as related pre-approval policies appears under "Fees Paid to PricewaterhouseCoopers" and"Policy on Audit and Finance Committee Preapproval of Audit and Permissible Non-Audit Services of Independent Registered Auditors" in the Proxy Statement.Those portions of the Proxy Statement are incorporated by reference into this report.
PART IV
Item 15. Exhibits and Financial Statement Schedules
(a) The following documents are filed as part of this report:
1. Financial Statements.See Index to Consolidated Financial Statements under Item 8 of this report.
2. Financial Statement Schedule.The following additional financial statement schedule should be considered in conjunction with our consolidated financial statements. All other
schedules have been omitted because the required information is either not applicable or not sufficiently material to require submission of the schedule.
SCHEDULE II
VALUATION AND QUALIFYING ACCOUNTS
Description
Balance at Beginning of Period
Additions Charged to Expenses or
Other Accounts*
Deductions Credited toExpenses or Other
Accounts**
Balance at End of Period
(in millions)2017 Tax valuation allowance $ 38 $ 31 $ (6) $ 632016 Tax valuation allowance $ 46 $ 4 $ (12) $ 382015 Tax valuation allowance $ 39 $ 43 $ (36) $ 46
* Additions include current year additions charged to expenses and current year build due to increases in net deferred tax assets, return to provision true-ups,other adjustments and Other Comprehensive Income ("OCI") impact to deferred taxes.
** Deductions include current year releases credited to expenses and current year reductions due to decreases in net deferred tax assets, return to provisiontrue-ups, other adjustments and OCI impact to deferred taxes.
106

Table of Contents
3. Exhibits.
Exhibits are incorporated herein by reference or are filed with this report as indicated below (numbered in accordance with Item 601 of Regulation S-K):
Incorporation by ReferenceExhibitNumber Description Form Date
ExhibitNumber
FiledHerewith
2.1
Separation and Distribution Agreement, dated August 1, 2014, by andbetween Agilent Technologies, Inc. and Keysight Technologies, Inc.**
10-12B/A
8/13/2014
2.1
2.2
Rule 2.7 Announcement, Recommended Cash Acquisition of Anite Plc byKeysight Technologies B.V. dated June 17, 2015
8-K
6/17/2015
2.1
3.1
Amended and Restated Certificate of Incorporation of KeysightTechnologies, Inc.
8-K
11/3/2014
3.1
3.2 Amended and Restated Bylaws of Keysight Technologies, Inc. 8-K 11/3/2014 3.2 4.1
Indenture, dated as of October 15, 2014, between Keysight Technologies,Inc. and U.S. Bank National Association, as Trustee
8-K
10/17/2014
4.1
4.2
First Supplemental Indenture, dated as of October 15, 2014, to theIndenture dated as of October 15, 2014, between Keysight Technologies,Inc. and U.S. Bank National Association, as Trustee
8-K
10/17/2014
4.2
4.3
Guarantee, dated as of October 15, 2014, by Agilent Technologies, Inc. infavor of U.S. Bank National Association as Trustee for the Holders ofNotes specified therein of Keysight Technologies, Inc.
8-K
10/17/2014
4.3
4.4
Registration Rights Agreement, dated as of October 15, 2014, by andamong Keysight Technologies, Inc., Agilent Technologies, Inc., andCitigroup Global Markets Inc., Goldman, Sachs & Co., and Merrill Lynch,Pierce, Fenner & Smith Incorporated as representatives of the InitialPurchasers
8-K
10/17/2014
4.4
10.1
Services Agreement, dated August 1, 2014, by and between AgilentTechnologies, Inc. and Keysight Technologies, Inc.
10-12B/A
8/13/2014
10.1
10.2
Tax Matters Agreement, dated August 1, 2014, by and between AgilentTechnologies, Inc. and Keysight Technologies, Inc.
10-12B/A
8/13/2014
10.2
10.3
Employee Matters Agreement, dated August 1, 2014, by and betweenAgilent Technologies, Inc. and Keysight Technologies, Inc.
10-12B/A
8/13/2014
10.3
10.4
Intellectual Property Matters Agreement, dated August 1, 2014, by andbetween Agilent Technologies, Inc. and Keysight Technologies, Inc.
10-12B/A
8/13/2014
10.4
10.5
Trademark License Agreement, dated August 1, 2014, by and betweenAgilent Technologies, Inc. and Keysight Technologies, Inc.
10-12B/A
8/13/2014
10.5
10.6
Real Estate Matters Agreement, dated August 1, 2014, by and betweenAgilent Technologies, Inc. and Keysight Technologies, Inc.
10-12B/A
8/13/2014
10.6
10.7 Form of Indemnification Agreement 10-12B/A 7/18/2014 10.7 10.8 Keysight Technologies, Inc. Employee Stock Purchase Plan* 10-12B/A 7/18/2014 10.8 10.9
Keysight Technologies, Inc. 2014 Equity and Incentive Compensation Plan(As Amended and Restated on September 29, 2014)*
S-8
10/21/2014
4.3
107

Table of Contents
10.10
Form of Keysight Technologies, Inc. Global Stock Award Agreement (withdeferral alternative)*
8-K
11/3/2014
10.2
10.11
Form of Keysight Technologies, Inc. Global Performance AwardAgreement*
10-12B/A
7/18/2014
10.11
10.12
Form of Keysight Technologies, Inc. Global Stock Option AwardAgreement*
10-12B/A
7/18/2014
10.12
10.13
Form of Keysight Technologies, Inc. Non-Employee Director Stock OptionAward Agreement*
10-12B/A
7/18/2014
10.13
10.14
Form of Keysight Technologies, Inc. Non-Employee Director Stock AwardAgreement*
10-12B/A
7/18/2014
10.14
10.15 Form of Keysight Technologies, Inc. 2014 Deferred Compensation Plan* 10-12B/A 7/18/2014 10.15 10.16
Form of Keysight Technologies, Inc. 2014 Frozen Deferred CompensationPlan*
10-12B/A
7/18/2014
10.16
10.17 Form of Keysight Technologies, Inc. Excess Benefit Retirement Plan* 10-12B/A 7/18/2014 10.17 10.18
Form of Keysight Technologies, Inc. Supplemental Benefit RetirementPlan*
10-12B/A
7/18/2014
10.18
10.19 Agilent Technologies, Inc. France Pension Plan* 10-12B/A 8/13/2014 10.19 10.20 Form of Change of Control Severance Agreement* 8-K 11/3/2014 10.1 10.21
Credit Agreement, dated September 15, 2014, between KeysightTechnologies, Inc., Agilent Technologies, Inc. and the Lenders PartyThereto*
10-12B/A
9/22/2014
10.21
10.22
Form of Keysight Technologies, Inc. Deferral Election for Stock Award* 8-K
11/3/2014
10.3
10.23
Keysight Technologies, Inc. Officer and Executive Severance Plan(Established Effective March18, 2015)*
8-K
3/24/2015
10.1
10.24
Keysight Technologies, Inc. 2014 Equity and Incentive Compensation Plan(As Amended and Restated on January 22, 2015)*
DEF 14A
2/6/2015
APPENDIX A
10.25
Letter Agreement, dated July 21, 2015, by and among KeysightTechnologies, Inc., the Lenders party thereto and Citibank, N.A., asAdministrative Agent
8-K
7/21/2015
10.2
10.26
Keysight Technologies, Inc. 2015 Performance-based Compensation Planfor covered employees (As Adopted on September 29, 2014)*
DEF 14A
2/6/2015
APPENDIX B
10.27 Keysight Technologies, Inc. 401(k) Plan (Effective as of August 1, 2014)* 10-K 12/21/2015 10.27 10.28
Keysight Technologies, Inc. Deferred Profit-Sharing Plan (Effective as ofAugust 1, 2014)*
10-K
12/21/2015
10.28
10.29
Keysight Technologies, Inc. Retirement Plan (Effective as of August 1,2014)*
10-K
12/21/2015
10.29
10.30
First Amendment to the Keysight Technologies, Inc. 401(k) Plan (Effectiveas of August 1, 2015)*
10-K
12/21/2015
10.30
10.31
First Amendment to the Keysight Technologies, Inc. Retirement Plan(Effective as of August 1, 2015)*
10-K
12/21/2015
10.31
10.32
Form of Keysight Technologies, Inc. Global Stock Award Agreement asAmended on November 15, 2016*
10-K
12/19/2016
10.32
11.1
See Note 6, “Net Income Per Share,” to our Consolidated FinancialStatements.
X
14.1
See Investor Information in Item 1: Business of this Annual Report onForm 10-K.
X
21.1 Subsidiaries of Keysight Technologies, Inc. X23.1 Consent of Independent Registered Public Accounting Firm. X
108

Table of Contents
24.1
Powers of Attorney. Contained in the signature page of this Annual Reporton Form 10-K.
X
31.1
Certification of Chief Executive Officer pursuant to Section 302 of theSarbanes‑Oxley Act of 2002.
X
31.2
Certification of Chief Financial Officer pursuant to Section 302 of theSarbanes‑Oxley Act of 2002.
X
32.1
Certification of Chief Executive Officer pursuant to Section 906 of theSarbanes‑Oxley Act of 2002.
X
32.2
Certification of Chief Financial Officer pursuant to Section 906 of theSarbanes‑Oxley Act of 2002.
X
101.INS XBRL Instance Document X101.SCH XBRL Schema Document X101.CAL XBRL Calculation Linkbase Document X101.LAB XBRL Labels Linkbase Document X101.PRE XBRL Presentation Linkbase Document X101.DEF XBRL Definition Linkbase Document X
99.1
Information Statement of Keysight Technologies, Inc., dated October 8,2014.
8-K
11/3/2014
99.1
99.2 Press release relating to the Offer to Anite Plc. 8-K 6/17/2015 2.1
* Indicates management contract or compensatory plan, contract or arrangement.
** Certain schedules and exhibits have been omitted pursuant to Item 601(b)(2) of Regulation S-K. Keysight will furnish supplemental copies of any suchschedules or exhibits to the U.S. Securities and Exchange Commission upon request.
109

Table of Contents
SIGNATURES
Pursuant to the requirements of Section 13 or 15(d) of the Securities Exchange Act of 1934, the registrant has duly caused this report to be signed on its behalfby the undersigned, thereunto duly authorized.
KEYSIGHT TECHNOLOGIES, INC. BY /s/ Neil Dougherty Neil Dougherty Senior Vice President and Chief Financial Officer
Date: December 20, 2017
POWER OF ATTORNEY
KNOW ALL PERSONS BY THESE PRESENTS, that each person whose signature appears below constitutes and appoints Stephen D. Williams and JeffreyLi, or any of them, his or her attorneys-in-fact, for such person in any and all capacities, to sign any amendments to this report and to file the same, with exhibitsthereto, and other documents in connection therewith, with the Securities and Exchange Commission, hereby ratifying and confirming all that any of saidattorneys-in-fact, or substitute or substitutes, may do or cause to be done by virtue hereof. Pursuant to the requirements of the Securities Exchange Act of 1934, thisreport has been signed below by the following persons on behalf of the registrant and in the capacities and on the dates indicated.
Signature Title Date
/s/ RONALD S. NERSESIAN Director, President and Chief Executive Officer December 20, 2017
Ronald S. Nersesian (Principal Executive Officer)
/s/ NEIL DOUGHERTY Senior Vice President and Chief Financial Officer December 20, 2017
Neil Dougherty (Principal Financial Officer)
/s/ JOHN C. SKINNER Vice President and Corporate Controller December 20, 2017
John C. Skinner (Principal Accounting Officer)
/s/ PAUL N. CLARK Chairman of the Board December 20, 2017
Paul N. Clark
/s/ JAMES G. CULLEN Director December 20, 2017
James G. Cullen
/s/ CHARLES J. DOCKENDORFF Director December 20, 2017
Charles J. Dockendorff
/s/ JEAN M. HALLORAN Director December 20, 2017
Jean M. Halloran
/s/ RICHARD HAMADA Director December 20, 2017
Richard Hamada
/s/ ROBERT A. RANGO Director December 20, 2017
Robert A. Rango
/s/ MARK B. TEMPLETON Director December 20, 2017
Mark B. Templeton
110

Exhibit 21.1LIST OF SIGNIFICANT SUBSIDIARIES
Name of subsidiary Organized Under the Laws of
Keysight Technologies Netherlands B.V. The NetherlandsKeysight Technologies Luxembourg Sarl LuxembourgKeysight Technologies Japan G.K. JapanKeysight Technologies Singapore (Holdings) Pte. Ltd. SingaporeKeysight Technologies Singapore (International) Pte. Ltd. SingaporeKeysight Technologies Singapore (Sales) Pte. Ltd. SingaporeKeysight Technologies World Trade, Inc. DelawareKeysight Technologies Malaysia Sdn Bhd. MalaysiaKeysight Technologies UK Limited United KingdomAnite Limited United KingdomIxia CaliforniaIxia Technologies International Limited Ireland

Exhibit 23.1 CONSENT OF INDEPENDENT REGISTERED PUBLIC ACCOUNTING FIRM
We hereby consent to the incorporation by reference in the Registration Statement on Form S-8 (333-199507) of Keysight Technologies, Inc. of our report
dated December 20, 2017, relating to the consolidated financial statements, financial statement schedule, and the effectiveness of internal control over financialreporting, which appears in this Form 10-K.
/s/ PRICEWATERHOUSECOOPERS LLP
San Jose, CaliforniaDecember 20, 2017

Exhibit 31.1
CERTIFICATION PURSUANT TO SECTION 302 OF THE SARBANES-OXLEY ACT OF 2002
I, Ronald S. Nersesian, certify that:
1. I have reviewed this Form 10-K of Keysight Technologies, Inc. ("the Registrant");
2. Based on my knowledge, this report does not contain any untrue statement of a material fact or omit to state a material fact necessary to make the statements made, in lightof the circumstances under which such statements were made, not misleading with respect to the period covered by this report;
3. Based on my knowledge, the financial statements, and other financial information included in this report, fairly present in all material respects the financial condition,results of operations and cash flows of the Registrant as of, and for, the periods presented in this report;
4. The Registrant's other certifying officer(s) and I are responsible for establishing and maintaining disclosure controls and procedures (as defined in Exchange Act Rules13a-15(e) and 15d-15(e)) and internal control over financial reporting (as defined in Exchange Act Rules 13a-15(f) and 15d-15(f)) for the Registrant and have:
(a) Designed such disclosure controls and procedures, or caused such disclosure controls and procedures to be designed under our supervision, to ensure that materialinformation relating to the Registrant, including its consolidated subsidiaries, is made known to us by others within those entities, particularly during the period inwhich this report is being prepared;
(b) Designed such internal control over financial reporting, or caused such internal control over financial reporting to be designed under our supervision, to providereasonable assurance regarding the reliability of financial reporting and the preparation of financial statements for external purposes in accordance with generallyaccepted accounting principles;
(c) Evaluated the effectiveness of the Registrant's disclosure controls and procedures and presented in this report our conclusions about the effectiveness of the disclosurecontrols and procedures, as of the end of the period covered by this report based on such evaluation; and
(d) Disclosed in this report any change in the Registrant's internal control over financial reporting that occurred during the Registrant's most recent fiscal quarter (theRegistrant's fourth fiscal quarter in the case of an annual report) that has materially affected, or is reasonably likely to materially affect, the Registrant's internal controlover financial reporting; and
5. The Registrant's other certifying officer(s) and I have disclosed, based on our most recent evaluation of internal control over financial reporting, to the Registrant's auditorsand the audit committee of the Registrant's board of directors (or persons performing the equivalent functions):
(a) All significant deficiencies and material weaknesses in the design or operation of internal control over financial reporting which are reasonably likely to adverselyaffect the Registrant's ability to record, process, summarize and report financial information; and
(b) Any fraud, whether or not material, that involves management or other employees who have a significant role in the Registrant's internal control over financialreporting.
Date: December 20, 2017 /s/ Ronald S. Nersesian
Ronald S. Nersesian
President and Chief Executive Officer

Exhibit 31.2
CERTIFICATION PURSUANT TO SECTION 302 OF THE SARBANES-OXLEY ACT OF 2002
I, Neil Dougherty, certify that:
1. I have reviewed this Form 10-K of Keysight Technologies, Inc. ("the Registrant");
2. Based on my knowledge, this report does not contain any untrue statement of a material fact or omit to state a material fact necessary to make the statements made, in lightof the circumstances under which such statements were made, not misleading with respect to the period covered by this report;
3. Based on my knowledge, the financial statements, and other financial information included in this report, fairly present in all material respects the financial condition,results of operations and cash flows of the Registrant as of, and for, the periods presented in this report;
4. The Registrant's other certifying officer(s) and I are responsible for establishing and maintaining disclosure controls and procedures (as defined in Exchange Act Rules13a-15(e) and 15d-15(e)) and internal control over financial reporting (as defined in Exchange Act Rules 13a-15(f) and 15d-15(f)) for the Registrant and have:
(a) Designed such disclosure controls and procedures, or caused such disclosure controls and procedures to be designed under our supervision, to ensure that materialinformation relating to the Registrant, including its consolidated subsidiaries, is made known to us by others within those entities, particularly during the period inwhich this report is being prepared;
(b) Designed such internal control over financial reporting, or caused such internal control over financial reporting to be designed under our supervision, to providereasonable assurance regarding the reliability of financial reporting and the preparation of financial statements for external purposes in accordance with generallyaccepted accounting principles;
(c) Evaluated the effectiveness of the Registrant's disclosure controls and procedures and presented in this report our conclusions about the effectiveness of the disclosurecontrols and procedures, as of the end of the period covered by this report based on such evaluation; and
(d) Disclosed in this report any change in the Registrant's internal control over financial reporting that occurred during the Registrant's most recent fiscal quarter (theRegistrant's fourth fiscal quarter in the case of an annual report) that has materially affected, or is reasonably likely to materially affect, the Registrant's internal controlover financial reporting; and
5. The Registrant's other certifying officer(s) and I have disclosed, based on our most recent evaluation of internal control over financial reporting, to the Registrant's auditorsand the audit committee of the Registrant's board of directors (or persons performing the equivalent functions):
(a) All significant deficiencies and material weaknesses in the design or operation of internal control over financial reporting which are reasonably likely to adverselyaffect the Registrant's ability to record, process, summarize and report financial information; and
(b) Any fraud, whether or not material, that involves management or other employees who have a significant role in the Registrant's internal control over financialreporting.
Date: December 20, 2017 /s/ Neil Dougherty
Neil Dougherty
Senior Vice President and Chief Financial Officer

Exhibit 32.1
CERTIFICATION PURSUANT TO 18 U.S.C. SECTION 1350, AS ADOPTED PURSUANT TO SECTION 906 OF THE SARBANES-OXLEY ACT OF 2002
In connection with the Annual Report of Keysight Technologies, Inc. (the "Company"), on Form 10-K for the period ended October 31, 2017, as filed with the Securitiesand Exchange Commission on the date hereof (the "Report"), I, Ronald S. Nersesian, Chief Executive Officer of the Company, certify, pursuant to 18 U.S.C. Section 1350, asadopted pursuant to Section 906 of the Sarbanes-Oxley Act of 2002, that:
(1) The Report fully complies with the requirements of Section 13(a) or 15(d) of the Securities Exchange Act of 1934; and
(2) The information contained in the Report fairly presents, in all material respects, the financial condition and results of operations of the Company.
A signed original of this written statement required by Section 906 has been provided to the Company and will be retained by the Company and furnished to the Securitiesand Exchange Commission or its staff upon request.
Date: December 20, 2017 /s/ Ronald S. Nersesian
Ronald S. Nersesian
President and Chief Executive Officer

Exhibit 32.2
CERTIFICATION PURSUANT TO 18 U.S.C. SECTION 1350, AS ADOPTED PURSUANT TO SECTION 906 OF THE SARBANES-OXLEY ACT OF 2002
In connection with the Annual Report of Keysight Technologies, Inc. (the "Company"), on Form 10-K for the period ended October 31, 2017, as filed with the Securitiesand Exchange Commission on the date hereof (the "Report"), I, Neil Dougherty, Chief Financial Officer of the Company, certify, pursuant to 18 U.S.C. Section 1350, as adoptedpursuant to Section 906 of the Sarbanes-Oxley Act of 2002, that:
(1) The Report fully complies with the requirements of Section 13(a) or 15(d) of the Securities Exchange Act of 1934; and
(2) The information contained in the Report fairly presents, in all material respects, the financial condition and results of operations of the Company.
A signed original of this written statement required by Section 906 has been provided to the Company and will be retained by the Company and furnished to the Securitiesand Exchange Commission or its staff upon request.
Date: December 20, 2017 /s/ Neil Dougherty
Neil Dougherty
Senior Vice President and Chief Financial Officer