Embed Size (px)
Citation preview
2003
ATL
AS
RENAULT13-15, quai Le Gallo
92513 BOULOGNE-BILLANCOURT CedexFrance
Tel.: 33 (0)1 41 04 50 50www.renault.com
www.renault.media.com
CORPORATE COMMUNICATIONS DEPARTMENT
Photos credits (front cover):Anthony Bernier
Getty Images / photographer: Ross Anania
desi
gn:D
RE
AM
ON
/ Bla
ncha
rd P
rintin
g
2003 ATLAS
4939
213
475
GB
Contents Renault-Nissan Alliance
2003 Atlas Renault
Renault-Nissan Alliance 1
Renault-Nissan Alliance
Structure of the Alliance 01Worldwide sales and production sites 02Collaborative ventures 04RNPO-RNIS 06World ranking of car manufacturers 07
Structure of the Renault Group
Renault organization chart 08Dacia organization chart 10Renault Samsung Motors organization chart 11
The Group
Financial information 12Workforce 17Competitive strength 18Purchasing 20Dacia 22Renault Samsung Motors 24Vehicle range 26Engine and gearbox range 28
Production and Sales
Worldwide production 30Worldwide automobile market 37Renault group sales worldwide 38Renault group sales outside Europe 40European automobile market 45Renault sales in Europe 50French automobile market 58Renault sales in France 60Distribution network 62Spare parts and accessories 63
Financial Activities
Renault group finance and service companies 64RCI Banque 65
Industrial Companies
Renault Agriculture 66SNR Roulements 66
Motor Sport and Leisure
Formula 1 67Renault Sport Technologies 67
Notes 68
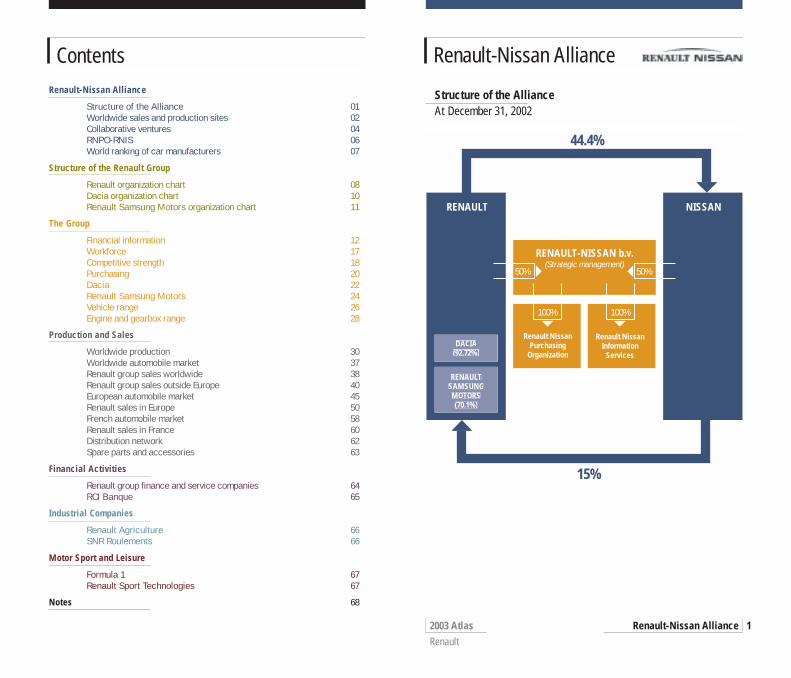
Structure of the AllianceAt December 31, 2002
RENAULT
RENAULT-NISSAN b.v.(Strategic management)
Renault NissanPurchasing
Organization
Renault NissanInformation
Services
NISSAN
15%
100% 100%
50%
DACIA(92.72%)
RENAULTSAMSUNGMOTORS(70.1%)
50%
44.4%
Korea
Romania
2003 Atlas Renault
Renault-Nissan Alliance 3
Renault-Nissan
2003 Atlas Renault
Renault-Nissan Alliance2
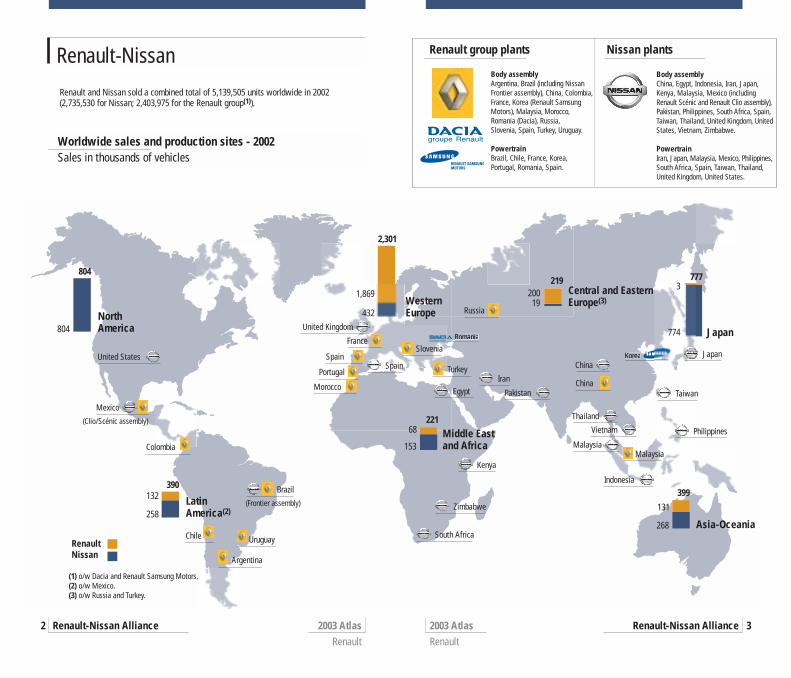
Worldwide sales and production sites - 2002Sales in thousands of vehicles
Renault and Nissan sold a combined total of 5,139,505 units worldwide in 2002 (2,735,530 for Nissan; 2,403,975 for the Renault group(1)).
Body assemblyChina, Egypt, Indonesia, Iran, Japan,Kenya, Malaysia, Mexico (includingRenault Scénic and Renault Clio assembly),Pakistan, Philippines, South Africa, Spain,Taiwan, Thailand, United Kingdom, UnitedStates, Vietnam, Zimbabwe.
PowertrainIran, Japan, Malaysia, Mexico, Philippines,South Africa, Spain, Taiwan, Thailand,United Kingdom, United States.
Body assemblyArgentina, Brazil (including NissanFrontier assembly), China, Colombia,France, Korea (Renault SamsungMotors), Malaysia, Morocco,Romania (Dacia), Russia, Slovenia, Spain, Turkey, Uruguay.
PowertrainBrazil, Chile, France, Korea,Portugal, Romania, Spain.
Renault group plants Nissan plants
(1) o/w Dacia and Renault Samsung Motors.(2) o/w Mexico.(3) o/w Russia and Turkey.
United States
Mexico
(Clio/Scénic assembly)
Colombia
Chile Uruguay
Argentina
Morocco
France
Russia
China
Malaysia
Turkey
Slovenia
South Africa
Zimbabwe
Kenya
Indonesia
Malaysia
Vietnam
Thailand
Taiwan
Philippines
JapanChina
IranEgypt Pakistan
Spain
Middle East and Africa
North America Japan
WesternEurope
Asia-Oceania
Central and EasternEurope(3)
United Kingdom
Spain
Portugal
Latin America(2)
Brazil
(Frontier assembly)
RenaultNissan
2,301
1,869
432
153
68221
774
3777219
20019
399
131
268
804
804
390132
258
2003 Atlas Renault
Renault-Nissan Alliance 5
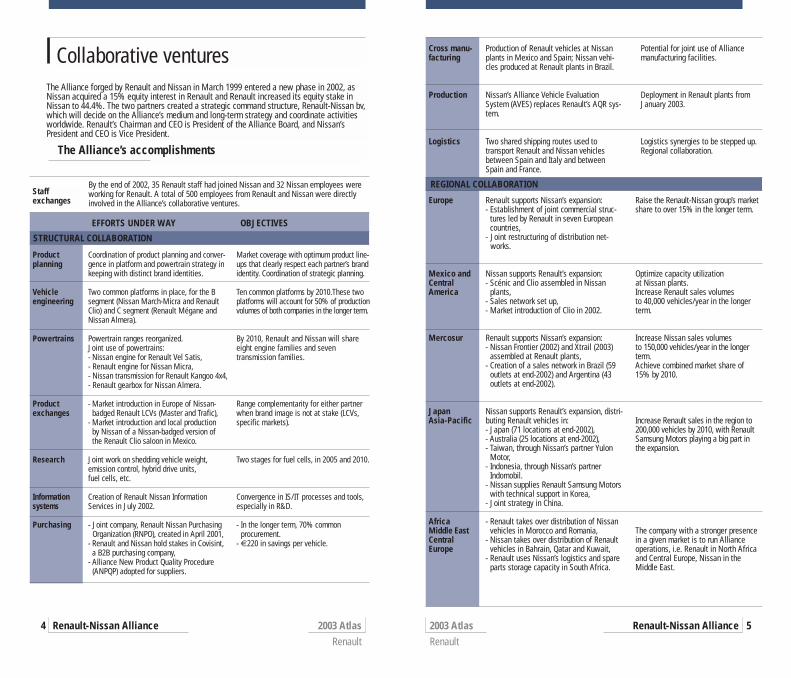
Collaborative ventures
2003 Atlas Renault
Renault-Nissan Alliance4
The Alliance’s accomplishments
Market coverage with optimum product line-ups that clearly respect each partner’s brandidentity. Coordination of strategic planning.
Ten common platforms by 2010.These twoplatforms will account for 50% of productionvolumes of both companies in the longer term.
By 2010, Renault and Nissan will shareeight engine families and seven transmission families.
Range complementarity for either partnerwhen brand image is not at stake (LCVs,specific markets).
Two stages for fuel cells, in 2005 and 2010.
Convergence in IS/IT processes and tools,especially in R&D.
- In the longer term, 70% common procurement.
- €220 in savings per vehicle.
The Alliance forged by Renault and Nissan in March 1999 entered a new phase in 2002, asNissan acquired a 15% equity interest in Renault and Renault increased its equity stake inNissan to 44.4%. The two partners created a strategic command structure, Renault-Nissan bv,which will decide on the Alliance’s medium and long-term strategy and coordinate activitiesworldwide. Renault’s Chairman and CEO is President of the Alliance Board, and Nissan’sPresident and CEO is Vice President.
Productplanning
Vehicleengineering
Powertrains
Productexchanges
Research
Informationsystems
Purchasing
By the end of 2002, 35 Renault staff had joined Nissan and 32 Nissan employees wereworking for Renault. A total of 500 employees from Renault and Nissan were directlyinvolved in the Alliance’s collaborative ventures.
EFFORTS UNDER WAY
Potential for joint use of Alliance manufacturing facilities.
Deployment in Renault plants fromJanuary 2003.
Logistics synergies to be stepped up.Regional collaboration.
Cross manu-facturing
Production
Logistics
Coordination of product planning and conver-gence in platform and powertrain strategy inkeeping with distinct brand identities.
Two common platforms in place, for the Bsegment (Nissan March-Micra and RenaultClio) and C segment (Renault Mégane andNissan Almera).
Powertrain ranges reorganized. Joint use of powertrains: - Nissan engine for Renault Vel Satis,- Renault engine for Nissan Micra,- Nissan transmission for Renault Kangoo 4x4,- Renault gearbox for Nissan Almera.
- Market introduction in Europe of Nissan-badged Renault LCVs (Master and Trafic),
- Market introduction and local production by Nissan of a Nissan-badged version of the Renault Clio saloon in Mexico.
Joint work on shedding vehicle weight, emission control, hybrid drive units, fuel cells, etc.
Creation of Renault Nissan InformationServices in July 2002.
- Joint company, Renault Nissan PurchasingOrganization (RNPO), created in April 2001,
- Renault and Nissan hold stakes in Covisint,a B2B purchasing company,
- Alliance New Product Quality Procedure(ANPQP) adopted for suppliers.
Production of Renault vehicles at Nissanplants in Mexico and Spain; Nissan vehi-cles produced at Renault plants in Brazil.
Nissan’s Alliance Vehicle EvaluationSystem (AVES) replaces Renault’s AQR sys-tem.
Two shared shipping routes used totransport Renault and Nissan vehicles between Spain and Italy and betweenSpain and France.
STRUCTURAL COLLABORATION
Staffexchanges Europe
Mexico andCentralAmerica
Mercosur
JapanAsia-Pacific
Africa Middle East CentralEurope
Renault supports Nissan’s expansion:- Establishment of joint commercial struc-
tures led by Renault in seven Europeancountries,
- Joint restructuring of distribution net-works.
Nissan supports Renault’s expansion:- Scénic and Clio assembled in Nissan
plants,- Sales network set up,- Market introduction of Clio in 2002.
Renault supports Nissan’s expansion:- Nissan Frontier (2002) and Xtrail (2003)
assembled at Renault plants,- Creation of a sales network in Brazil (59
outlets at end-2002) and Argentina (43outlets at end-2002).
Nissan supports Renault’s expansion, distri-buting Renault vehicles in:- Japan (71 locations at end-2002),- Australia (25 locations at end-2002),- Taiwan, through Nissan’s partner Yulon
Motor,- Indonesia, through Nissan’s partner
Indomobil.- Nissan supplies Renault Samsung Motors
with technical support in Korea,- Joint strategy in China.
- Renault takes over distribution of Nissanvehicles in Morocco and Romania,
- Nissan takes over distribution of Renaultvehicles in Bahrain, Qatar and Kuwait,
- Renault uses Nissan’s logistics and spareparts storage capacity in South Africa.
Raise the Renault-Nissan group’s marketshare to over 15% in the longer term.
Optimize capacity utilization at Nissan plants.Increase Renault sales volumesto 40,000 vehicles/year in the longerterm.
Increase Nissan sales volumesto 150,000 vehicles/year in the longerterm.Achieve combined market share of15% by 2010.
Increase Renault sales in the region to200,000 vehicles by 2010, with RenaultSamsung Motors playing a big part inthe expansion.
The company with a stronger presencein a given market is to run Allianceoperations, i.e. Renault in North Africaand Central Europe, Nissan in theMiddle East.
REGIONAL COLLABORATION
OBJECTIVES
Renault Nissan Purchasing Organization
2003 Atlas Renault
Renault-Nissan Alliance6 2003 Atlas Renault
Renault-Nissan Alliance 7
Speaking with a single voice to suppliers worldwideApril 2001 saw Renault and Nissan establish a joint purchasing organization, RNPO. Byend-2002, the new entity was handling 43% of all purchases by the two companies,amounting to €21.5 billion. Renault and Nissan are currently in the process of modifyingRNPO’s scope.
Total RNPO purchasing (Renault only)€ billion
Powertrain components 3.3
Vehicle parts 4.4 Materials (paint) 0.1
Services 0.8
Organization type: Société par Actions Simplifiée (s.a.s.)Head office: ParisOffices: Japan, USA and EuropeCapital: €50,000Shareholder: Wholly owned by Renault - Nissan bv
Renault Nissan Information Services
Common IS/IT organization for Renault and NissanIn July 2002, Renault and Nissan created RNIS, a new joint information services/informationtechnology company. RNIS is entrusted with planning, functional and technical architecture,performance measurement, project office, network and telecommunications, and the SAPcompetency centre. It is also steering an IS convergence programme, as well as the AllianceIS Master Plan, which covers all strategies, policies, plans, roadmaps and joint projects bet-ween Renault and Nissan for the next three years, thereby providing a framework of refe-rence for the Alliance’s IS upgrades. Furthermore, RNIS is measuring joint performanceindicators for Renault and Nissan, notably the IS/IT cost/revenues ratio. The Alliance Boardhas set the target for this ratio at 1.5% by 2004 for Renault and Nissan as a whole. RNISworks closely with the IT/IS organizations of Renault (DTSI) and Nissan (Global IS), and withRNPO for supplier relations.
Organization type: Yugen Kaisha (similar to a limited-liability company)Head office: TokyoOffices: Tokyo, ParisCapital: JPY50,000Shareholders: 50% Renault - 50% Nissan
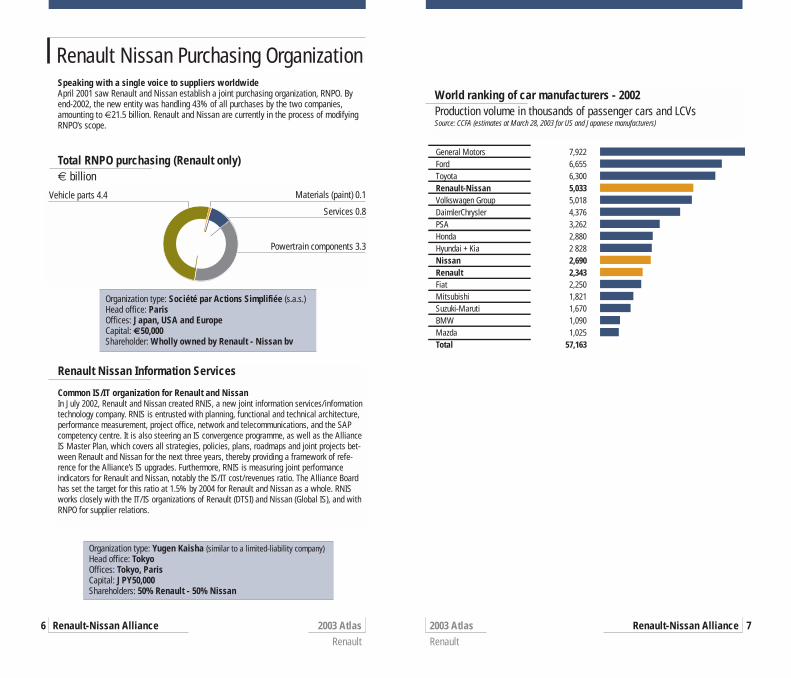
World ranking of car manufacturers - 2002Production volume in thousands of passenger cars and LCVsSource: CCFA (estimates at March 28, 2003 for US and Japanese manufacturers)
General Motors 7,922Ford 6,655Toyota 6,300Renault-Nissan 5,033Volkswagen Group 5,018DaimlerChrysler 4,376PSA 3,262Honda 2,880Hyundai + Kia 2 828Nissan 2,690Renault 2,343Fiat 2,250Mitsubishi 1,821Suzuki-Maruti 1,670BMW 1,090Mazda 1,025Total 57,163
2003 Atlas Renault
Structure of the Renault Group 9
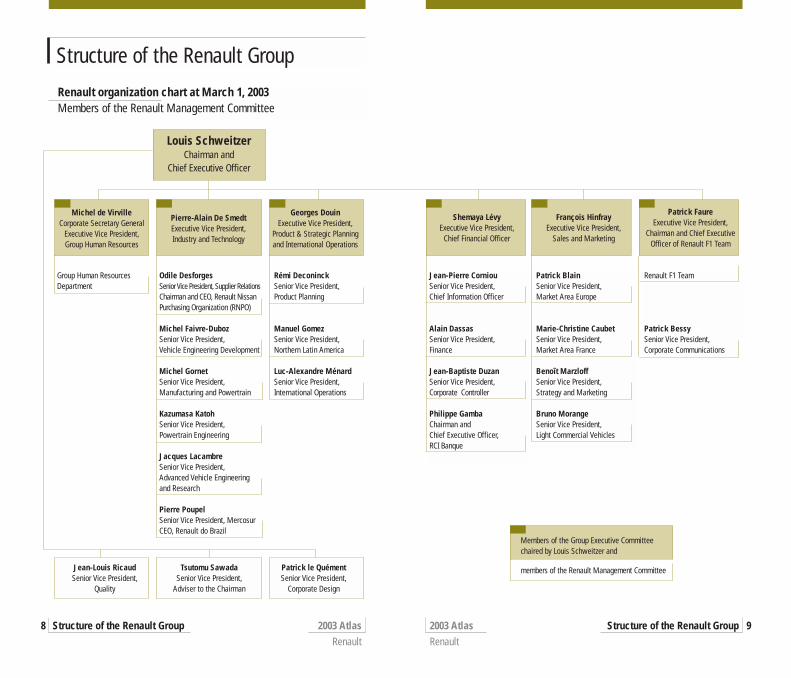
Structure of the Renault Group
2003 Atlas Renault
Structure of the Renault Group8
Renault organization chart at March 1, 2003Members of the Renault Management Committee
Group Human ResourcesDepartment
Jean-Pierre CorniouSenior Vice President,Chief Information Officer
Alain DassasSenior Vice President,Finance
Jean-Baptiste DuzanSenior Vice President,Corporate Controller
Philippe GambaChairman and Chief Executive Officer, RCI Banque
Michel de VirvilleCorporate Secretary General
Executive Vice President,Group Human Resources
Pierre-Alain De SmedtExecutive Vice President,Industry and Technology
Georges DouinExecutive Vice President,
Product & Strategic Planningand International Operations
Shemaya LévyExecutive Vice President,
Chief Financial Officer
François HinfrayExecutive Vice President,
Sales and Marketing
Patrick FaureExecutive Vice President,
Chairman and Chief ExecutiveOfficer of Renault F1 Team
Jean-Louis RicaudSenior Vice President,
Quality
Tsutomu SawadaSenior Vice President,
Adviser to the Chairman
Patrick le QuémentSenior Vice President,
Corporate Design
Odile DesforgesSenior Vice President, Supplier RelationsChairman and CEO, Renault NissanPurchasing Organization (RNPO)
Michel Faivre-DubozSenior Vice President,Vehicle Engineering Development
Michel GornetSenior Vice President,Manufacturing and Powertrain
Kazumasa KatohSenior Vice President, Powertrain Engineering
Jacques LacambreSenior Vice President,Advanced Vehicle Engineeringand Research
Pierre PoupelSenior Vice President, MercosurCEO, Renault do Brazil
Rémi DeconinckSenior Vice President,Product Planning
Manuel GomezSenior Vice President,Northern Latin America
Luc-Alexandre MénardSenior Vice President,International Operations
Patrick BlainSenior Vice President,Market Area Europe
Marie-Christine CaubetSenior Vice President,Market Area France
Benoît MarzloffSenior Vice President,Strategy and Marketing
Bruno MorangeSenior Vice President,Light Commercial Vehicles
Renault F1 Team
Patrick BessySenior Vice President,Corporate Communications
Louis SchweitzerChairman and
Chief Executive Officer
Members of the Group Executive Committee chaired by Louis Schweitzer and
members of the Renault Management Committee
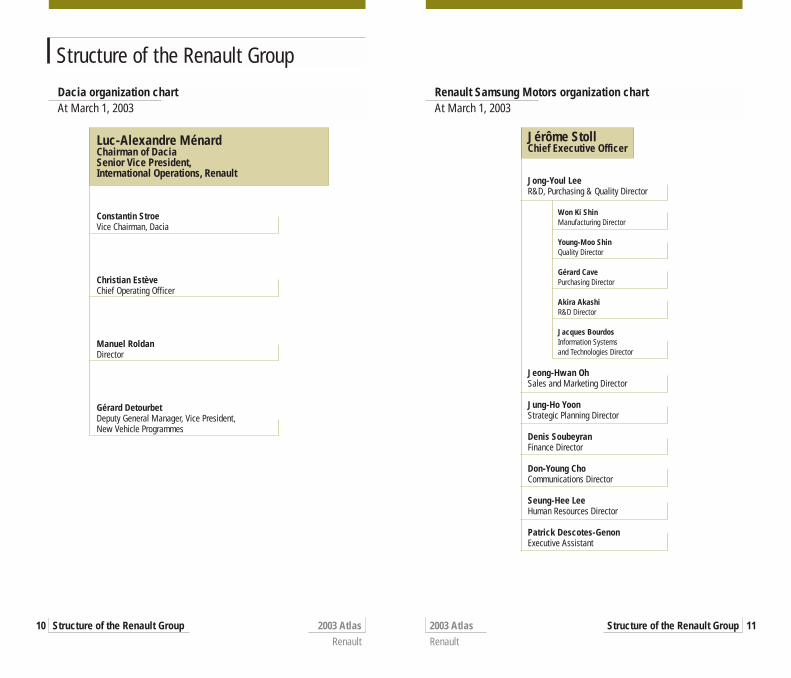
Luc-Alexandre MénardChairman of Dacia Senior Vice President, International Operations, Renault
Constantin Stroe Vice Chairman, Dacia
Christian Estève Chief Operating Officer
Manuel Roldan Director
Gérard Detourbet Deputy General Manager, Vice President, New Vehicle Programmes
2003 Atlas Renault
Structure of the Renault Group 11
Structure of the Renault Group
2003 Atlas Renault
Structure of the Renault Group10
Renault Samsung Motors organization chartAt March 1, 2003
Dacia organization chartAt March 1, 2003
Jérôme Stoll Chief Executive Officer
Jong-Youl Lee R&D, Purchasing & Quality Director
Won Ki ShinManufacturing Director
Young-Moo ShinQuality Director
Gérard Cave Purchasing Director
Akira AkashiR&D Director
Jacques BourdosInformation Systems and Technologies Director
Jeong-Hwan OhSales and Marketing Director
Jung-Ho YoonStrategic Planning Director
Denis SoubeyranFinance Director
Don-Young ChoCommunications Director
Seung-Hee LeeHuman Resources Director
Patrick Descotes-GenonExecutive Assistant
2003 Atlas Renault
The Group 13
Financial information
2003 Atlas Renault
The Group12
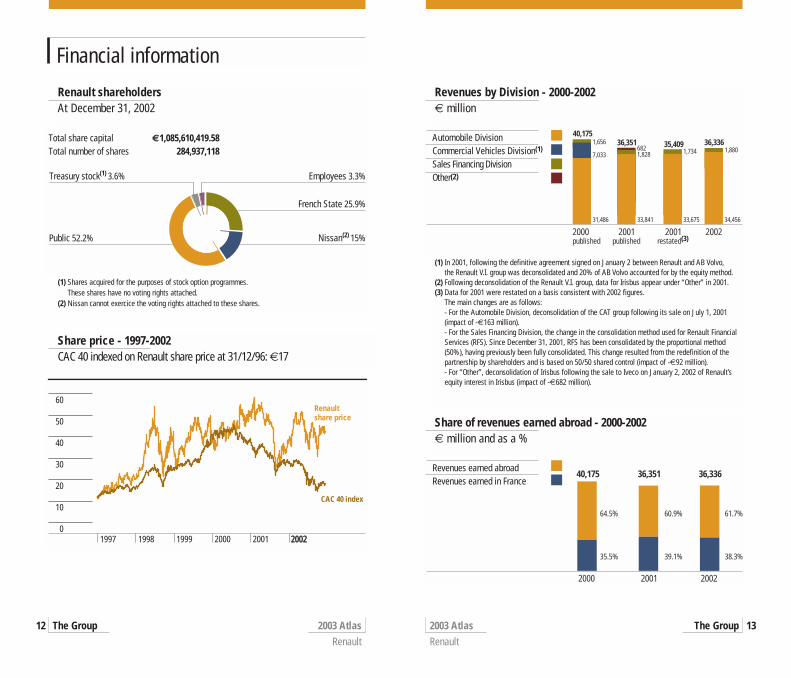
Renault shareholdersAt December 31, 2002
French State 25.9%
Nissan(2) 15%Public 52.2%
Employees 3.3%
Total share capital €1,085,610,419.58Total number of shares 284,937,118 Treasury stock(1) 3.6%
Share price - 1997-2002CAC 40 indexed on Renault share price at 31/12/96: €17
10
20
01997 1998 1999 2000 2001 20022002
30
40
50
60Renault share price
CAC 40 index
(1) Shares acquired for the purposes of stock option programmes. These shares have no voting rights attached.
(2) Nissan cannot exercice the voting rights attached to these shares.
Revenues by Division - 2000-2002€ million
(1) In 2001, following the definitive agreement signed on January 2 between Renault and AB Volvo, the Renault V.I. group was deconsolidated and 20% of AB Volvo accounted for by the equity method.
(2) Following deconsolidation of the Renault V.I. group, data for Irisbus appear under “Other” in 2001. (3) Data for 2001 were restated on a basis consistent with 2002 figures.
The main changes are as follows:- For the Automobile Division, deconsolidation of the CAT group following its sale on July 1, 2001(impact of -€163 million).- For the Sales Financing Division, the change in the consolidation method used for Renault FinancialServices (RFS). Since December 31, 2001, RFS has been consolidated by the proportional method(50%), having previously been fully consolidated. This change resulted from the redefinition of thepartnership by shareholders and is based on 50/50 shared control (impact of -€92 million).- For “Other”, deconsolidation of Irisbus following the sale to Iveco on January 2, 2002 of Renault’sequity interest in Irisbus (impact of -€682 million).
2000 2001 2001 2002 published published restated(3)
Automobile DivisionCommercial Vehicles Division(1)
Sales Financing DivisionOther(2)
40,175
31,486 33,841
1,828682 1,734
33,675 34,456
1,8807,033
1,656 35,40936,351 36,336
Share of revenues earned abroad - 2000-2002€ million and as a %
2000 2001 2002
Revenues earned abroadRevenues earned in France
64.5% 60.9% 61.7%
35.5% 39.1% 38.3%
40,175 36,351 36,336
Financial information, 2000-2002
2003 Atlas Renault
The Group14 2003 Atlas Renault
The Group 15
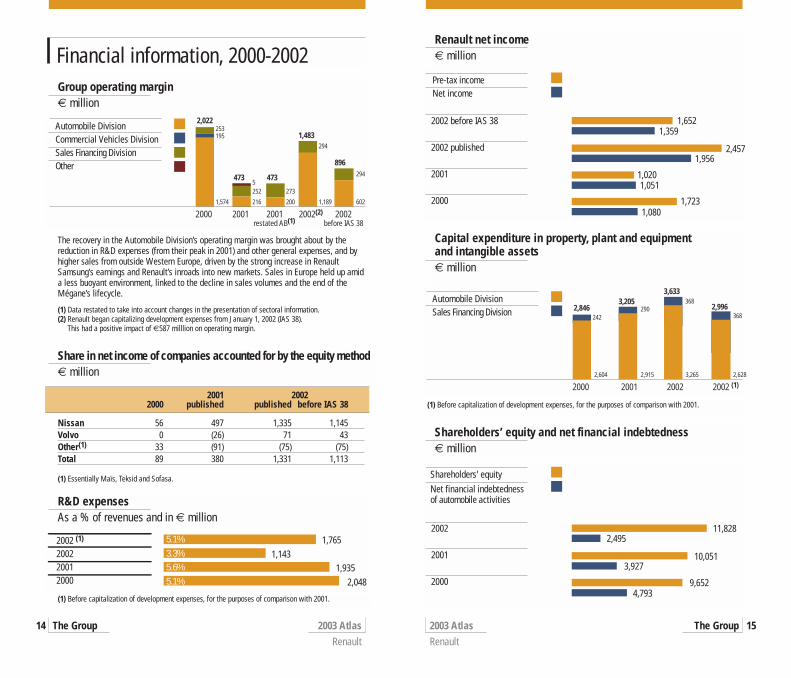
The recovery in the Automobile Division’s operating margin was brought about by thereduction in R&D expenses (from their peak in 2001) and other general expenses, and byhigher sales from outside Western Europe, driven by the strong increase in RenaultSamsung’s earnings and Renault’s inroads into new markets. Sales in Europe held up amida less buoyant environment, linked to the decline in sales volumes and the end of theMégane’s lifecycle.
(1) Data restated to take into account changes in the presentation of sectoral information.(2) Renault began capitalizing development expenses from January 1, 2002 (IAS 38).
This had a positive impact of €587 milllion on operating margin.
Group operating margin€ million
2000 2001 2001 2002(2) 2002 restated AB(1) before IAS 38
Automobile DivisionCommercial Vehicles DivisionSales Financing DivisionOther
2,022
1,574 216
2525
273
200 1,189
294
602
294
195253
473473
1,483
896
(1) Before capitalization of development expenses, for the purposes of comparison with 2001.
Share in net income of companies accounted for by the equity method€ million
Renault net income€ million
Pre-tax incomeNet income
2002 before IAS 38
2002 published
2001
2000
1,6521,359
2,4571,956
1,0201,051
1,7231,080
2001 20022000 published published before IAS 38
Nissan 56 497 1,335 1,145Volvo 0 (26) 71 43Other(1) 33 (91) (75) (75)Total 89 380 1,331 1,113
(1) Essentially Maïs, Teksid and Sofasa.
R&D expensesAs a % of revenues and in € million
2002 (1)
200220012000 5.1%
5.6%3.3%5.1% 1,765
1,1431,935
2,048
Capital expenditure in property, plant and equipment and intangible assets€ million
2000 2001 2002 2002 (1)
Automobile DivisionSales Financing Division 2,846
2,604
290
2,915 3,265
368
2,628
368242
3,2053,633
2,996
(1) Before capitalization of development expenses, for the purposes of comparison with 2001.
Shareholders’ equity and net financial indebtedness€ million
2002
2001
2000
11,8282,495
10,0513,927
9,6524,793
Shareholders' equity
Net financial indebtedness of automobile activities
Financial information (cont.)
2003 Atlas Renault
The Group16
Workforce
2003 Atlas Renault
The Group 17
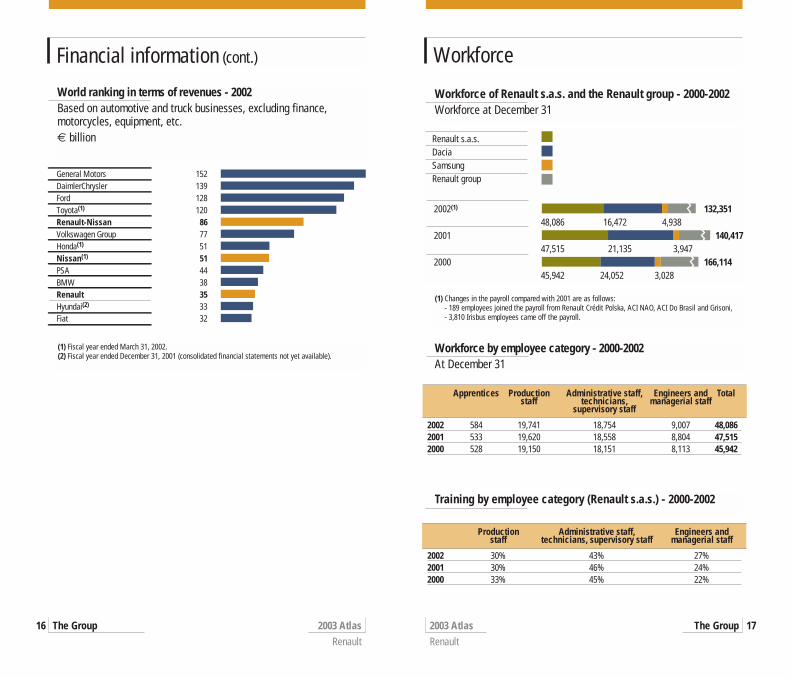
(1) Changes in the payroll compared with 2001 are as follows:- 189 employees joined the payroll from Renault Crédit Polska, ACI NAO, ACI Do Brasil and Grisoni,- 3,810 Irisbus employees came off the payroll.
Workforce of Renault s.a.s. and the Renault group - 2000-2002Workforce at December 31
2002(1) 132,351 48,086 16,472 4,9382001 140,417 47,515 21,135 3,9472000 166,114 45,942 24,052 3,028
Renault s.a.s.DaciaSamsungRenault group
Workforce by employee category - 2000-2002At December 31
Apprentices Production Administrative staff, Engineers and Totalstaff technicians, managerial staff
supervisory staff
2002 584 19,741 18,754 9,007 48,0862001 533 19,620 18,558 8,804 47,5152000 528 19,150 18,151 8,113 45,942
Training by employee category (Renault s.a.s.) - 2000-2002
Production Administrative staff, Engineers andstaff technicians, supervisory staff managerial staff
2002 30% 43% 27%2001 30% 46% 24%2000 33% 45% 22%
World ranking in terms of revenues - 2002Based on automotive and truck businesses, excluding finance, motorcycles, equipment, etc.€ billion
General Motors 152DaimlerChrysler 139Ford 128Toyota(1) 120Renault-Nissan 86Volkswagen Group 77Honda(1) 51Nissan(1) 51PSA 44BMW 38Renault 35Hyundai(2) 33Fiat 32
(1) Fiscal year ended March 31, 2002.(2) Fiscal year ended December 31, 2001 (consolidated financial statements not yet available).
Competitive strength
2003 Atlas Renault
The Group18 2003 Atlas Renault
The Group 19
Cutting development times
Renault has broken new ground with Mégane II. With design and production times shorte-ned, the Hatch and Sport Hatch models were developed in just 29 months, compared with46 months for the previous generation. Decisive in achieving these results was the vehicleproject strategy devised at the Technocentre. This saw the design and engineering teamslocated at the same site, making it possible to optimize development times and quality.
Industrial performanceStreamlining the manufacturing system
By assigning a single vehicle segment to each plant, Renault has started to streamline andsimplify its production facilities. The Sandouville site, for example, is entirely dedicated tothe high-end product range, with four bodies — Laguna II Hatchback and Sport Tourer, VelSatis and Espace IV — assembled on the same platform. Efficiency has also been impro-ved by locating industrial supplier parks as close to assembly sites as possible.
Renault Production Way
Launched in 1998, the Renault Production Way (SPR) is aimed at enhancing the group’sindustrial performance in terms of quality, costs, delivery times and human resources. Asystem for managing continuous improvement at workstations, SPR acts as a motivatingand unifying force for all those involved in the manufacturing system, from manufacturers,buyers and suppliers to logistics providers and product/process designers. The implemen-tation of a single production system for all plants worldwide is a fundamental step inensuring Renault’s competitiveness on the world stage.
IMVP index / Average assembly time (in hours)
The International Motor Vehicle Program (IMVP) index is an indicator developed by theMassachusetts Institute of Technology. It measures (in hours) the average time taken toassemble a vehicle based on a defined number of tasks.
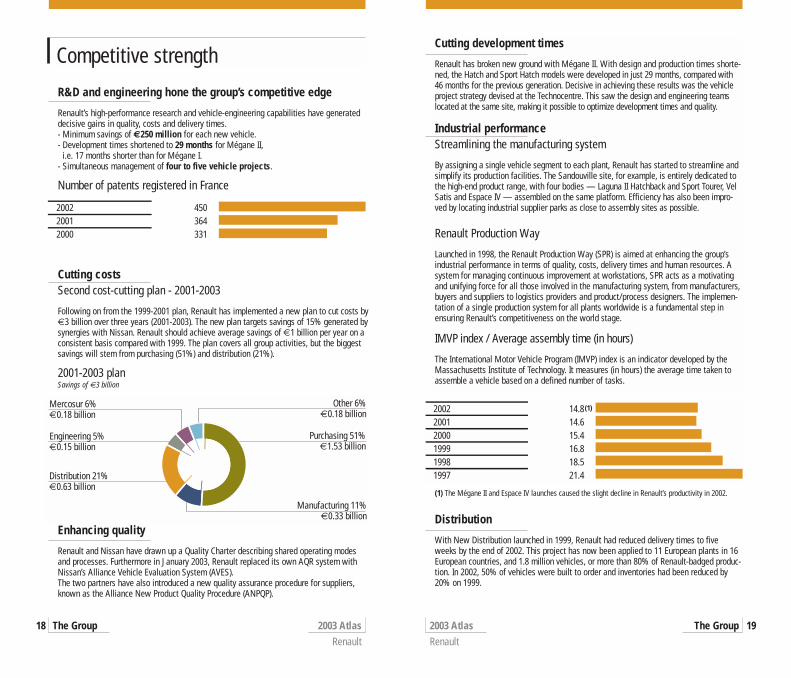
R&D and engineering hone the group’s competitive edge
Renault’s high-performance research and vehicle-engineering capabilities have generateddecisive gains in quality, costs and delivery times.- Minimum savings of €250 million for each new vehicle.- Development times shortened to 29 months for Mégane II,
i.e. 17 months shorter than for Mégane I.- Simultaneous management of four to five vehicle projects.
Number of patents registered in France
2002 4502001 3642000 331
Cutting costsSecond cost-cutting plan - 2001-2003
Following on from the 1999-2001 plan, Renault has implemented a new plan to cut costs by€3 billion over three years (2001-2003). The new plan targets savings of 15% generated bysynergies with Nissan. Renault should achieve average savings of €1 billion per year on aconsistent basis compared with 1999. The plan covers all group activities, but the biggestsavings will stem from purchasing (51%) and distribution (21%).
2001-2003 planSavings of €3 billion
Other 6%€0.18 billion
Purchasing 51%€1.53 billion
Manufacturing 11%€0.33 billion
Distribution 21%€0.63 billion
Engineering 5%€0.15 billion
Mercosur 6%€0.18 billion 2002 14.8
2001 14.62000 15.41999 16.81998 18.51997 21.4
(1)
Distribution
With New Distribution launched in 1999, Renault had reduced delivery times to fiveweeks by the end of 2002. This project has now been applied to 11 European plants in 16European countries, and 1.8 million vehicles, or more than 80% of Renault-badged produc-tion. In 2002, 50% of vehicles were built to order and inventories had been reduced by20% on 1999.
(1) The Mégane II and Espace IV launches caused the slight decline in Renault’s productivity in 2002.
Enhancing quality
Renault and Nissan have drawn up a Quality Charter describing shared operating modesand processes. Furthermore in January 2003, Renault replaced its own AQR system withNissan’s Alliance Vehicle Evaluation System (AVES).The two partners have also introduced a new quality assurance procedure for suppliers,known as the Alliance New Product Quality Procedure (ANPQP).
Purchasing
2003 Atlas Renault
The Group20 2003 Atlas Renault
The Group 21
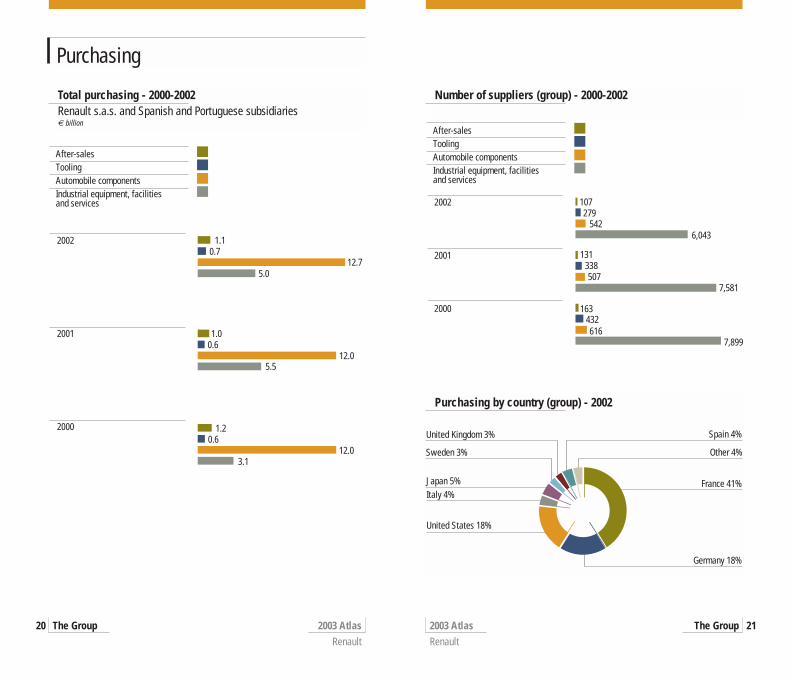
Total purchasing - 2000-2002Renault s.a.s. and Spanish and Portuguese subsidiaries€ billion
2002
2001
2000
After-salesToolingAutomobile componentsIndustrial equipment, facilities and services
1.10.7
12.75.0
1.00.6
12.05.5
1.20.6
12.03.1
Number of suppliers (group) - 2000-2002
2002
2001
2000
After-salesToolingAutomobile componentsIndustrial equipment, facilities and services
107279
5426,043
131338507
7,581
163432616
7,899
Purchasing by country (group) - 2002
France 41%
Germany 18%
United States 18%
Italy 4%Japan 5%
Sweden 3%
United Kingdom 3% Spain 4%
Other 4%
Dacia
2003 Atlas Renault
The Group22 2003 Atlas Renault
The Group 23
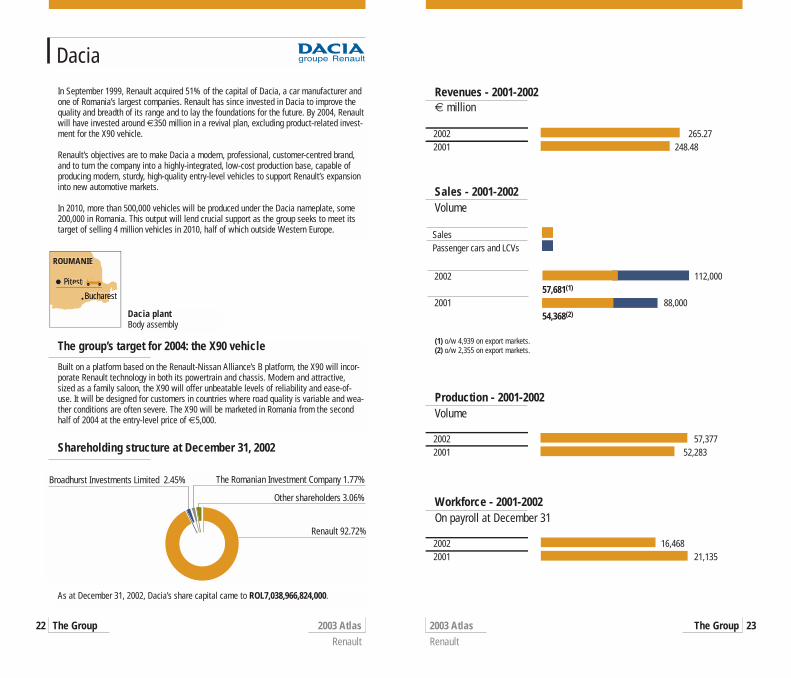
In September 1999, Renault acquired 51% of the capital of Dacia, a car manufacturer andone of Romania’s largest companies. Renault has since invested in Dacia to improve thequality and breadth of its range and to lay the foundations for the future. By 2004, Renaultwill have invested around €350 million in a revival plan, excluding product-related invest-ment for the X90 vehicle.
Renault’s objectives are to make Dacia a modern, professional, customer-centred brand,and to turn the company into a highly-integrated, low-cost production base, capable ofproducing modern, sturdy, high-quality entry-level vehicles to support Renault’s expansioninto new automotive markets.
In 2010, more than 500,000 vehicles will be produced under the Dacia nameplate, some200,000 in Romania. This output will lend crucial support as the group seeks to meet itstarget of selling 4 million vehicles in 2010, half of which outside Western Europe.
The group’s target for 2004: the X90 vehicle
Built on a platform based on the Renault-Nissan Alliance’s B platform, the X90 will incor-porate Renault technology in both its powertrain and chassis. Modern and attractive,sized as a family saloon, the X90 will offer unbeatable levels of reliability and ease-of-use. It will be designed for customers in countries where road quality is variable and wea-ther conditions are often severe. The X90 will be marketed in Romania from the secondhalf of 2004 at the entry-level price of €5,000.
Shareholding structure at December 31, 2002
Renault 92.72%
Broadhurst Investments Limited 2.45% The Romanian Investment Company 1.77%
Other shareholders 3.06%
Revenues - 2001-2002€ million
2002 265.27 2001 248.48
Sales - 2001-2002Volume
SalesPassenger cars and LCVs
2002 112,000 57,681(1) 2001 88,000 54,368(2)
Production - 2001-2002Volume
2002 57,377 2001 52,283
Workforce - 2001-2002On payroll at December 31
2002 16,468 2001 21,135
(1) o/w 4,939 on export markets.(2) o/w 2,355 on export markets.
As at December 31, 2002, Dacia’s share capital came to ROL7,038,966,824,000.
estBuchare
ROUMANIE
Pitesti
Dacia plantBody assembly
Renault Samsung Motors
2003 Atlas Renault
The Group24 2003 Atlas Renault
The Group 25
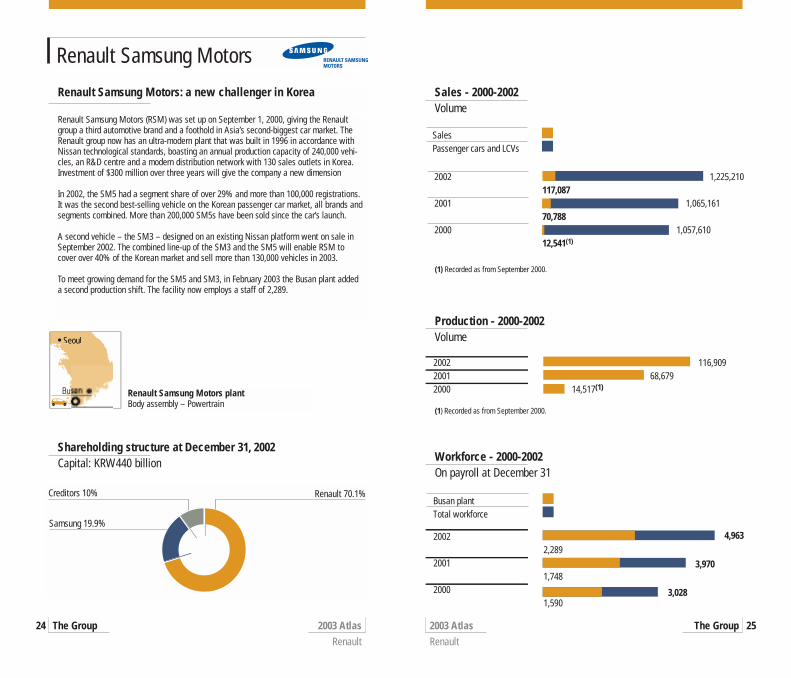
Renault Samsung Motors (RSM) was set up on September 1, 2000, giving the Renaultgroup a third automotive brand and a foothold in Asia’s second-biggest car market. TheRenault group now has an ultra-modern plant that was built in 1996 in accordance withNissan technological standards, boasting an annual production capacity of 240,000 vehi-cles, an R&D centre and a modern distribution network with 130 sales outlets in Korea.Investment of $300 million over three years will give the company a new dimension
In 2002, the SM5 had a segment share of over 29% and more than 100,000 registrations.It was the second best-selling vehicle on the Korean passenger car market, all brands andsegments combined. More than 200,000 SM5s have been sold since the car’s launch.
A second vehicle – the SM3 – designed on an existing Nissan platform went on sale inSeptember 2002. The combined line-up of the SM3 and the SM5 will enable RSM tocover over 40% of the Korean market and sell more than 130,000 vehicles in 2003.
To meet growing demand for the SM5 and SM3, in February 2003 the Busan plant addeda second production shift. The facility now employs a staff of 2,289.
Renault Samsung Motors: a new challenger in Korea
Renault 70.1%
Samsung 19.9%
Creditors 10%
SalesPassenger cars and LCVs
2002 1,225,210 117,087 2001 1,065,161 70,788 2000 1,057,610 12,541(1)
Production - 2000-2002Volume
2002 116,9092001 68,6792000 14,517(1)
(1) Recorded as from September 2000.
Seoul
Renault Samsung Motors plantBody assembly – Powertrain
Shareholding structure at December 31, 2002Capital: KRW440 billion
Sales - 2000-2002 Volume
(1) Recorded as from September 2000.
Workforce - 2000-2002On payroll at December 31
2002 2,2892001 1,7482000 1,590
Busan plantTotal workforce
4,963
3,970
3,028
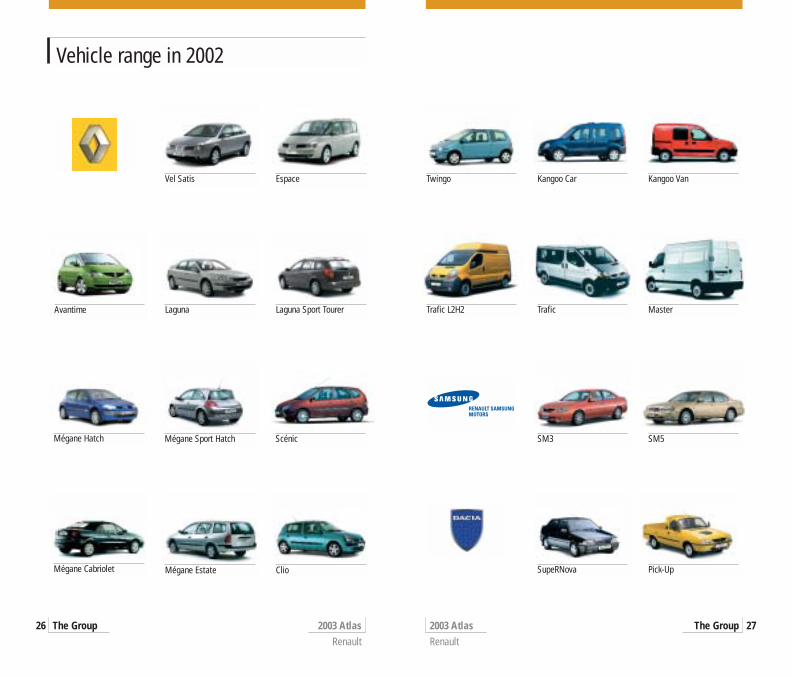
Vehicle range in 2002
2003 Atlas Renault
The Group26 2003 Atlas Renault
The Group 27
Vel Satis Espace
Avantime Laguna Laguna Sport Tourer
Mégane Hatch Mégane Sport Hatch Scénic
Mégane Cabriolet Mégane Estate Clio
Twingo Kangoo Car Kangoo Van
Trafic L2H2 Trafic Master
SM3 SM5
SupeRNova Pick-Up
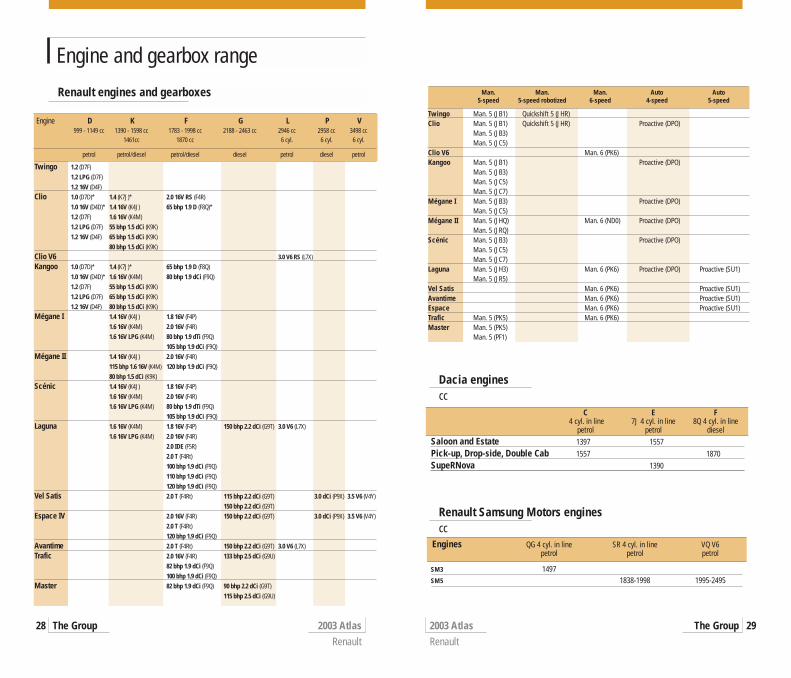
Engine and gearbox range
2003 Atlas Renault
The Group28 2003 Atlas Renault
The Group 29
Engine D K F G L P V999 - 1149 cc 1390 - 1598 cc 1783 - 1998 cc 2188 - 2463 cc 2946 cc 2958 cc 3498 cc
1461cc 1870 cc 6 cyl. 6 cyl. 6 cyl.
petrol petrol/diesel petrol/diesel diesel petrol diesel petrol
Renault engines and gearboxes
Twingo 1.2 (D7F)1.2 LPG (D7F)1.2 16V (D4F)
Clio 1.0 (D7D)* 1.4 (K7J)* 2.0 16V RS (F4R)1.0 16V (D4D)* 1.4 16V (K4J) 65 bhp 1.9 D (F8Q)*1.2 (D7F) 1.6 16V (K4M)1.2 LPG (D7F) 55 bhp 1.5 dCi (K9K)1.2 16V (D4F) 65 bhp 1.5 dCi (K9K)
80 bhp 1.5 dCi (K9K)Clio V6 3.0 V6 RS (L7X)
Kangoo 1.0 (D7D)* 1.4 (K7J)* 65 bhp 1.9 D (F8Q)1.0 16V (D4D)* 1.6 16V (K4M) 80 bhp 1.9 dCi (F9Q)1.2 (D7F) 55 bhp 1.5 dCi (K9K)1.2 LPG (D7F) 65 bhp 1.5 dCi (K9K)1.2 16V (D4F) 80 bhp 1.5 dCi (K9K)
Mégane I 1.4 16V (K4J) 1.8 16V (F4P)1.6 16V (K4M) 2.0 16V (F4R)1.6 16V LPG (K4M) 80 bhp 1.9 dTi (F9Q)
105 bhp 1.9 dCi (F9Q)Mégane II 1.4 16V (K4J) 2.0 16V (F4R)
115 bhp 1.6 16V (K4M) 120 bhp 1.9 dCi (F9Q)80 bhp 1.5 dCi (K9K)
Scénic 1.4 16V (K4J) 1.8 16V (F4P)1.6 16V (K4M) 2.0 16V (F4R)1.6 16V LPG (K4M) 80 bhp 1.9 dTi (F9Q)
105 bhp 1.9 dCi (F9Q)Laguna 1.6 16V (K4M) 1.8 16V (F4P) 150 bhp 2.2 dCi (G9T) 3.0 V6 (L7X)
1.6 16V LPG (K4M) 2.0 16V (F4R)2.0 IDE (F5R)2.0 T (F4Rt)100 bhp 1.9 dCi (F9Q)110 bhp 1.9 dCi (F9Q)120 bhp 1.9 dCi (F9Q)
Vel Satis 2.0 T (F4Rt) 115 bhp 2.2 dCi (G9T) 3.0 dCi (P9X) 3.5 V6 (V4Y)150 bhp 2.2 dCi (G9T)
Espace IV 2.0 16V (F4R) 150 bhp 2.2 dCi (G9T) 3.0 dCi (P9X) 3.5 V6 (V4Y)2.0 T (F4Rt)120 bhp 1.9 dCi (F9Q)
Avantime 2.0 T (F4Rt) 150 bhp 2.2 dCi (G9T) 3.0 V6 (L7X)Trafic 2.0 16V (F4R) 133 bhp 2.5 dCi (G9U)
82 bhp 1.9 dCi (F9Q)100 bhp 1.9 dCi (F9Q)
Master 82 bhp 1.9 dCi (F9Q) 90 bhp 2.2 dCi (G9T)115 bhp 2.5 dCi (G9U)
Engines QG 4 cyl. in line SR 4 cyl. in line VQ V6petrol petrol petrol
SM3 1497SM5 1838-1998 1995-2495
Dacia enginescc
C E F4 cyl. in line 7J 4 cyl. in line 8Q 4 cyl. in line
petrol petrol dieselSaloon and Estate 1397 1557Pick-up, Drop-side, Double Cab 1557 1870SupeRNova 1390
Renault Samsung Motors enginescc
Man. Man. Man. Auto Auto5-speed 5-speed robotized 6-speed 4-speed 5-speed
Twingo Man. 5 (JB1) Quickshift 5 (JHR)Clio Man. 5 (JB1) Quickshift 5 (JHR) Proactive (DPO)
Man. 5 (JB3)Man. 5 (JC5)
Clio V6 Man. 6 (PK6)Kangoo Man. 5 (JB1) Proactive (DPO)
Man. 5 (JB3)Man. 5 (JC5)Man. 5 (JC7)
Mégane I Man. 5 (JB3) Proactive (DPO)Man. 5 (JC5)
Mégane II Man. 5 (JHQ) Man. 6 (ND0) Proactive (DPO)Man. 5 (JRQ)
Scénic Man. 5 (JB3) Proactive (DPO)Man. 5 (JC5)Man. 5 (JC7)
Laguna Man. 5 (JH3) Man. 6 (PK6) Proactive (DPO) Proactive (SU1)Man. 5 (JR5)
Vel Satis Man. 6 (PK6) Proactive (SU1)Avantime Man. 6 (PK6) Proactive (SU1)Espace Man. 6 (PK6) Proactive (SU1)Trafic Man. 5 (PK5) Man. 6 (PK6)Master Man. 5 (PK5)
Man. 5 (PF1)
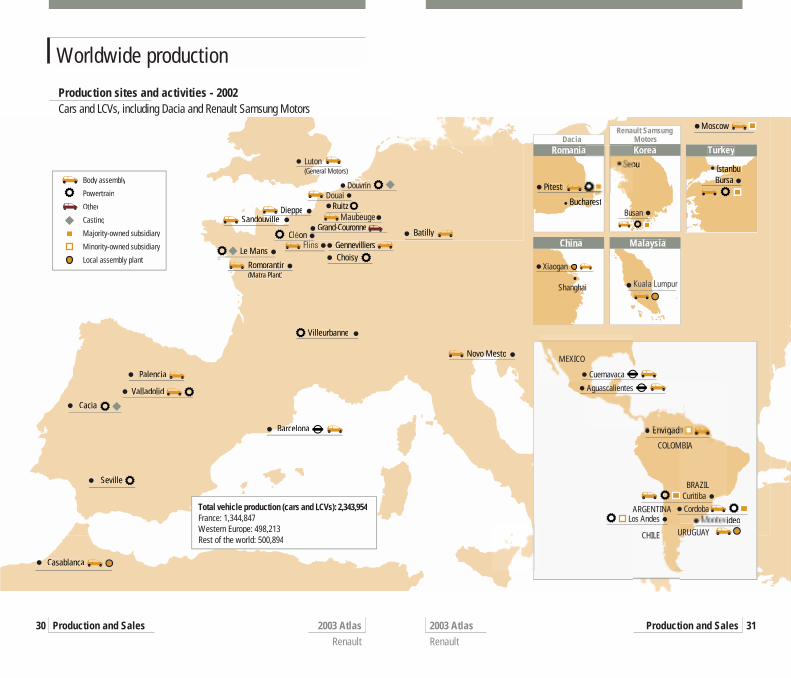
Worldwide production
2003 Atlas Renault
Production and Sales30 2003 Atlas Renault
Production and Sales 31
Romorantin(Matra Plant)
Villeurbanne
o MesNovo Mesto
Palencia
Valladolid
Cacia
Barcelona Barc
Seville
Casablanca
Moscow
Envigad
ideo
Malaysia
Pitesti
ucharestBuchare
Romaniaoul
Korea
BuBursaIstanbulIsstanbul
Turkey
China
Total vehicle production (cars and LCVs): 2,343,954France: 1,344,847Western Europe: 498,213Rest of the world: 500,894
DaciaRenault Samsung
Motors
Body assembly
Powertrain
Other
Casting
Majority-owned subsidiary
Minority-owned subsidiary
Local assembly plantLe Mans
Grand-Couronne
RuitzDieppeppSandouville andouvil
BatillyCl onGennevilliersChoisy
Maubeuge
Production sites and activities - 2002Cars and LCVs, including Dacia and Renault Samsung Motors
Luton(General Motors)
Douvrin
Cuernavaca
Aguascalientes
MEXICO
COLOMBIA
BRAZIL
CHILE URUGUAY
ARGENTINA Cordoba
Busan
Xiaogan
Shanghai
Curitiba
Los Andes
Douai
Body assemblyPowertrain
CastingOther
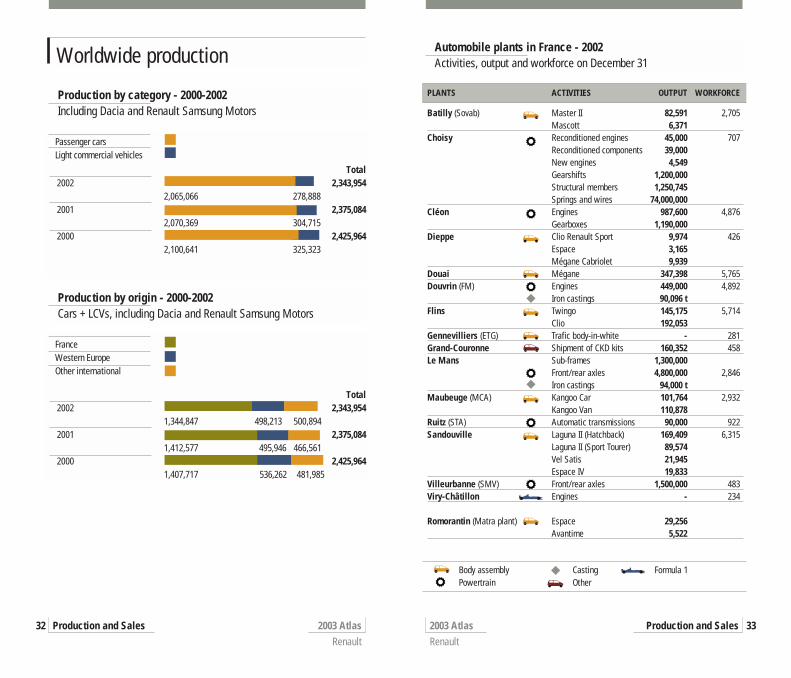
Worldwide production
2003 Atlas Renault
Production and Sales32 2003 Atlas Renault
Production and Sales 33
Production by category - 2000-2002Including Dacia and Renault Samsung Motors
Total2002 2,343,954 2,065,066 278,8882001 2,375,084 2,070,369 304,7152000 2,425,964 2,100,641 325,323
Passenger carsLight commercial vehicles
Automobile plants in France - 2002Activities, output and workforce on December 31
PLANTS ACTIVITIES OUTPUT WORKFORCE
Batilly (Sovab) Master II 82,591 2,705Mascott 6,371
Choisy Reconditioned engines 45,000 707 Reconditioned components 39,000New engines 4,549Gearshifts 1,200,000Structural members 1,250,745Springs and wires 74,000,000
Cléon Engines 987,600 4,876 Gearboxes 1,190,000
Dieppe Clio Renault Sport 9,974 426Espace 3,165Mégane Cabriolet 9,939
Douai Mégane 347,398 5,765Douvrin (FM) Engines 449,000 4,892
Iron castings 90,096 tFlins Twingo 145,175 5,714
Clio 192,053Gennevilliers (ETG) Trafic body-in-white - 281Grand-Couronne Shipment of CKD kits 160,352 458Le Mans Sub-frames 1,300,000
Front/rear axles 4,800,000 2,846Iron castings 94,000 t
Maubeuge (MCA) Kangoo Car 101,764 2,932Kangoo Van 110,878
Ruitz (STA) Automatic transmissions 90,000 922Sandouville Laguna II (Hatchback) 169,409 6,315
Laguna II (Sport Tourer) 89,574Vel Satis 21,945Espace IV 19,833
Villeurbanne (SMV) Front/rear axles 1,500,000 483Viry-Châtillon Engines - 234
Romorantin (Matra plant) Espace 29,256Avantime 5,522
Production by origin - 2000-2002Cars + LCVs, including Dacia and Renault Samsung Motors
Total2002 2,343,954 1,344,847 498,213 500,8942001 2,375,084 1,412,577 495,946 466,5612000 2,425,964 1,407,717 536,262 481,985
FranceWestern EuropeOther international
Formula 1
Worldwide production
2003 Atlas Renault
Production and Sales34 2003 Atlas Renault
Production and Sales 35
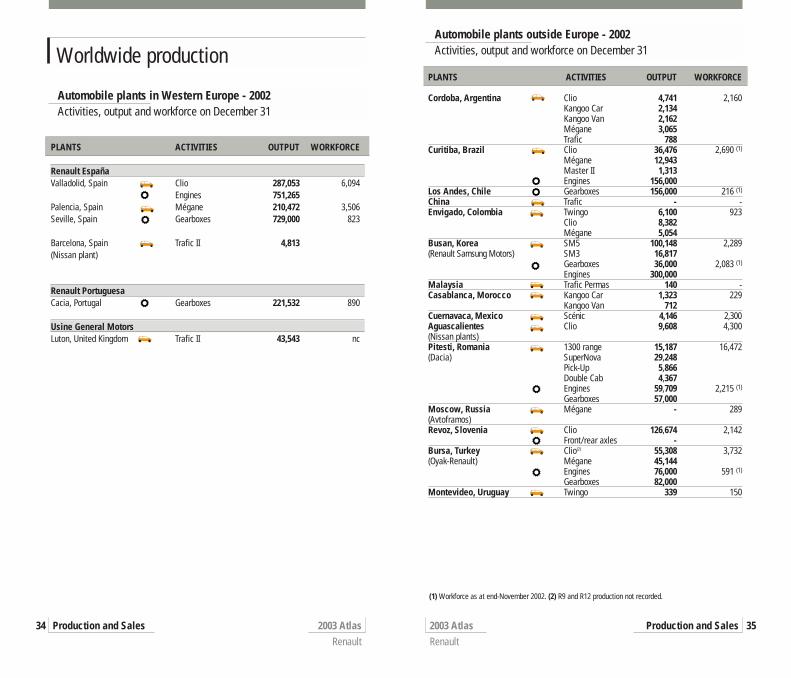
Automobile plants in Western Europe - 2002Activities, output and workforce on December 31
PLANTS ACTIVITIES OUTPUT WORKFORCE
Renault España Valladolid, Spain Clio 287,053 6,094
Engines 751,265Palencia, Spain Mégane 210,472 3,506Seville, Spain Gearboxes 729,000 823
Barcelona, Spain Trafic II 4,813(Nissan plant)
Renault PortuguesaCacia, Portugal Gearboxes 221,532 890
Usine General MotorsLuton, United Kingdom Trafic II 43,543 nc
Automobile plants outside Europe - 2002Activities, output and workforce on December 31
PLANTS ACTIVITIES OUTPUT WORKFORCE
Cordoba, Argentina Clio 4,741 2,160Kangoo Car 2,134Kangoo Van 2,162Mégane 3,065Trafic 788
Curitiba, Brazil Clio 36,476 2,690 (1)
Mégane 12,943Master II 1,313Engines 156,000
Los Andes, Chile Gearboxes 156,000 216 (1)
China Trafic - -Envigado, Colombia Twingo 6,100 923
Clio 8,382Mégane 5,054
Busan, Korea SM5 100,148 2,289(Renault Samsung Motors) SM3 16,817
Gearboxes 36,000 2,083 (1)
Engines 300,000Malaysia Trafic Permas 140 -Casablanca, Morocco Kangoo Car 1,323 229
Kangoo Van 712Cuernavaca, Mexico Scénic 4,146 2,300Aguascalientes Clio 9,608 4,300(Nissan plants)Pitesti, Romania 1300 range 15,187 16,472(Dacia) SuperNova 29,248
Pick-Up 5,866Double Cab 4,367Engines 59,709 2,215 (1)
Gearboxes 57,000Moscow, Russia Mégane - 289(Avtoframos)Revoz, Slovenia Clio 126,674 2,142
Front/rear axles -Bursa, Turkey Clio(2) 55,308 3,732(Oyak-Renault) Mégane 45,144
Engines 76,000 591 (1)
Gearboxes 82,000Montevideo, Uruguay Twingo 339 150
(1) Workforce as at end-November 2002. (2) R9 and R12 production not recorded.
Worldwide production
2003 Atlas Renault
Production and Sales36
Worldwide automobile market
2003 Atlas Renault
Production and Sales 37
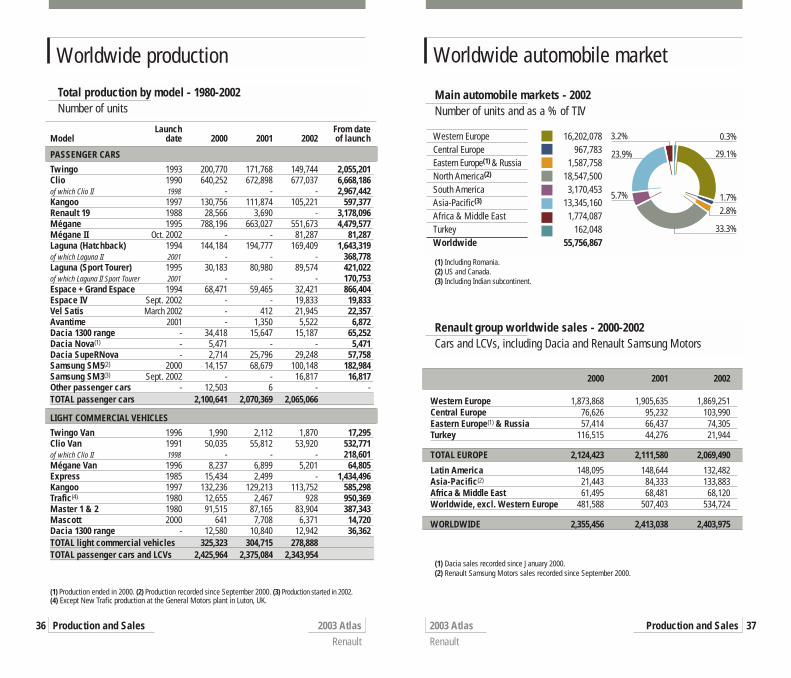
Total production by model - 1980-2002Number of units
PASSENGER CARS
Twingo 1993 200,770 171,768 149,744 2,055,201Clio 1990 640,252 672,898 677,037 6,668,186of which Clio II 1998 - - - 2,967,442Kangoo 1997 130,756 111,874 105,221 597,377Renault 19 1988 28,566 3,690 - 3,178,096Mégane 1995 788,196 663,027 551,673 4,479,577Mégane II Oct. 2002 - - 81,287 81,287Laguna (Hatchback) 1994 144,184 194,777 169,409 1,643,319of which Laguna II 2001 - - - 368,778Laguna (Sport Tourer) 1995 30,183 80,980 89,574 421,022of which Laguna II Sport Tourer 2001 - - - 170,753Espace + Grand Espace 1994 68,471 59,465 32,421 866,404Espace IV Sept. 2002 - - 19,833 19,833Vel Satis March 2002 - 412 21,945 22,357Avantime 2001 - 1,350 5,522 6,872Dacia 1300 range - 34,418 15,647 15,187 65,252Dacia Nova(1) - 5,471 - - 5,471Dacia SupeRNova - 2,714 25,796 29,248 57,758Samsung SM5(2) 2000 14,157 68,679 100,148 182,984Samsung SM3(3) Sept. 2002 - - 16,817 16,817Other passenger cars - 12,503 6 - -TOTAL passenger cars 2,100,641 2,070,369 2,065,066
LIGHT COMMERCIAL VEHICLES
Twingo Van 1996 1,990 2,112 1,870 17,295Clio Van 1991 50,035 55,812 53,920 532,771of which Clio II 1998 - - - 218,601Mégane Van 1996 8,237 6,899 5,201 64,805Express 1985 15,434 2,499 - 1,434,496Kangoo 1997 132,236 129,213 113,752 585,298Trafic(4) 1980 12,655 2,467 928 950,369Master 1 & 2 1980 91,515 87,165 83,904 387,343Mascott 2000 641 7,708 6,371 14,720Dacia 1300 range - 12,580 10,840 12,942 36,362TOTAL light commercial vehicles 325,323 304,715 278,888TOTAL passenger cars and LCVs 2,425,964 2,375,084 2,343,954
(1) Production ended in 2000. (2) Production recorded since September 2000. (3) Production started in 2002.(4) Except New Trafic production at the General Motors plant in Luton, UK.
Launch From date Model date 2000 2001 2002 of launch
Main automobile markets - 2002Number of units and as a % of TIV
Western Europe 16,202,078Central Europe 967,783Eastern Europe(1) & Russia 1,587,758North America(2) 18,547,500South America 3,170,453Asia-Pacific(3) 13,345,160Africa & Middle East 1,774,087Turkey 162,048Worldwide 55,756,867
29.1%
33.3%
5.7%
23.9%
3.2% 0.3%
1.7%2.8%
(1) Including Romania.(2) US and Canada.(3) Including Indian subcontinent.
Renault group worldwide sales - 2000-2002Cars and LCVs, including Dacia and Renault Samsung Motors
2000 2001 2002
Western Europe 1,873,868 1,905,635 1,869,251Central Europe 76,626 95,232 103,990Eastern Europe(1) & Russia 57,414 66,437 74,305Turkey 116,515 44,276 21,944
TOTAL EUROPE 2,124,423 2,111,580 2,069,490
Latin America 148,095 148,644 132,482Asia-Pacific(2) 21,443 84,333 133,883Africa & Middle East 61,495 68,481 68,120Worldwide, excl. Western Europe 481,588 507,403 534,724
WORLDWIDE 2,355,456 2,413,038 2,403,975
(1) Dacia sales recorded since January 2000.(2) Renault Samsung Motors sales recorded since September 2000.
Renault group sales worldwide
2003 Atlas Renault
Production and Sales38 2003 Atlas Renault
Production and Sales 39
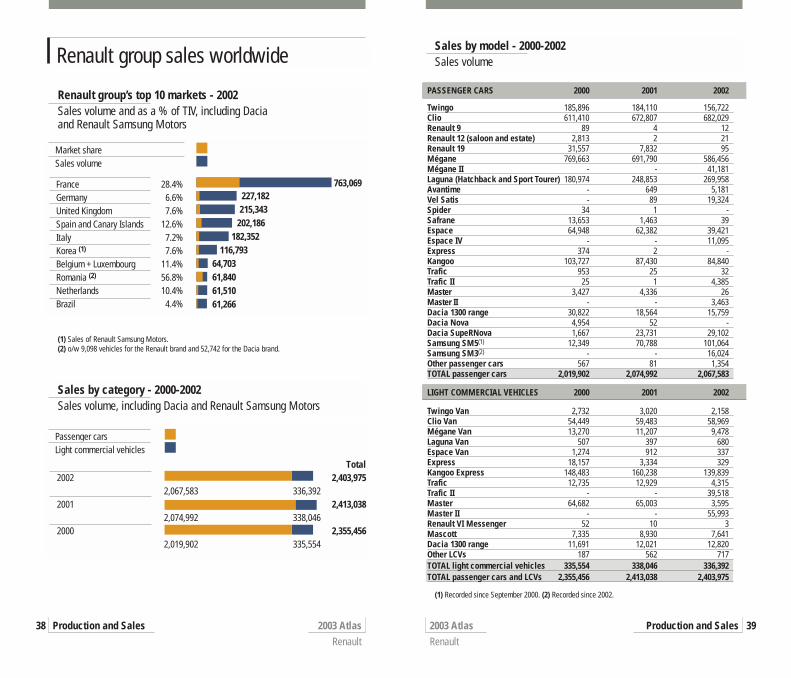
Renault group’s top 10 markets - 2002Sales volume and as a % of TIV, including Dacia and Renault Samsung Motors
France 28.4%Germany 6.6%United Kingdom 7.6%Spain and Canary Islands 12.6%Italy 7.2%Korea (1) 7.6%Belgium + Luxembourg 11.4%Romania (2) 56.8%Netherlands 10.4%Brazil 4.4%
Market shareSales volume
763,069227,182215,343
202,186182,352
116,79364,70361,84061,51061,266
(1) Sales of Renault Samsung Motors.(2) o/w 9,098 vehicles for the Renault brand and 52,742 for the Dacia brand.
Sales by category - 2000-2002Sales volume, including Dacia and Renault Samsung Motors
Total2002 2,403,975 2,067,583 336,3922001 2,413,038 2,074,992 338,0462000 2,355,456 2,019,902 335,554
Passenger carsLight commercial vehicles
Sales by model - 2000-2002Sales volume
(1) Recorded since September 2000. (2) Recorded since 2002.
PASSENGER CARS 2000 2001 2002
Twingo 185,896 184,110 156,722Clio 611,410 672,807 682,029Renault 9 89 4 12Renault 12 (saloon and estate) 2,813 2 21Renault 19 31,557 7,832 95Mégane 769,663 691,790 586,456Mégane II - - 41,181Laguna (Hatchback and Sport Tourer) 180,974 248,853 269,958Avantime - 649 5,181Vel Satis - 89 19,324Spider 34 1 -Safrane 13,653 1,463 39Espace 64,948 62,382 39,421Espace IV - - 11,095Express 374 2 -Kangoo 103,727 87,430 84,840Trafic 953 25 32Trafic II 25 1 4,385Master 3,427 4,336 26Master II - - 3,463Dacia 1300 range 30,822 18,564 15,759Dacia Nova 4,954 52 -Dacia SupeRNova 1,667 23,731 29,102Samsung SM5(1) 12,349 70,788 101,064Samsung SM3(2) - - 16,024Other passenger cars 567 81 1,354TOTAL passenger cars 2,019,902 2,074,992 2,067,583
LIGHT COMMERCIAL VEHICLES 2000 2001 2002
Twingo Van 2,732 3,020 2,158Clio Van 54,449 59,483 58,969Mégane Van 13,270 11,207 9,478Laguna Van 507 397 680Espace Van 1,274 912 337Express 18,157 3,334 329Kangoo Express 148,483 160,238 139,839Trafic 12,735 12,929 4,315Trafic II - - 39,518Master 64,682 65,003 3,595Master II - - 55,993Renault VI Messenger 52 10 3Mascott 7,335 8,930 7,641Dacia 1300 range 11,691 12,021 12,820Other LCVs 187 562 717TOTAL light commercial vehicles 335,554 338,046 336,392TOTAL passenger cars and LCVs 2,355,456 2,413,038 2,403,975
Renault group sales outside Europe
2003 Atlas Renault
Production and Sales40 2003 Atlas Renault
Production and Sales 41
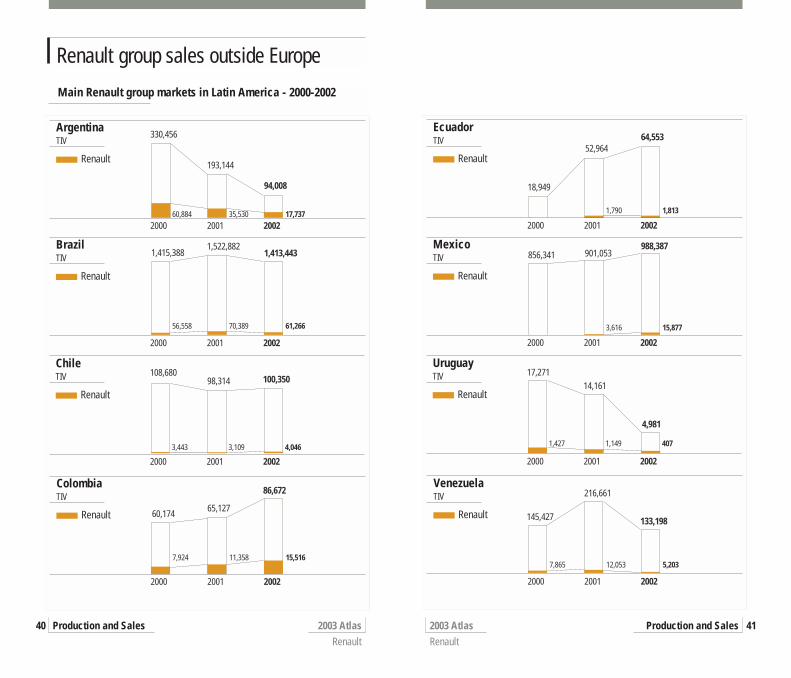
Main Renault group markets in Latin America - 2000-2002
Argentina
Renault
TIV330,456
2000 2001 200260,884 35,530 17,737
Brazil
Renault
TIV 1,522,882
2000 2001 2002
56,558 70,389 61,266
Chile
Renault
TIV 108,680
2000 2001 2002
3,443 3,109 4,046
Colombia
Renault
TIV86,672
2000 2001 2002
7,924 11,358 15,516
193,144
94,008
1,413,4431,415,388
98,314 100,350
60,174 65,127
Ecuador
Renault
TIV 64,553
2000 2001 2002
1,790 1,813
Mexico
Renault
TIV988,387
2000 2001 2002
3,616 15,877
Uruguay
Renault
TIV 17,271
2000 2001 2002
1,427 1,149 407
Venezuela
Renault
TIV 216,661
2000 2001 2002
7,865 12,053 5,203
18,949
52,964
856,341 901,053
4,981
14,161
145,427 133,198
2003 Atlas Renault
Production and Sales42 2003 Atlas Renault
Production and Sales 43
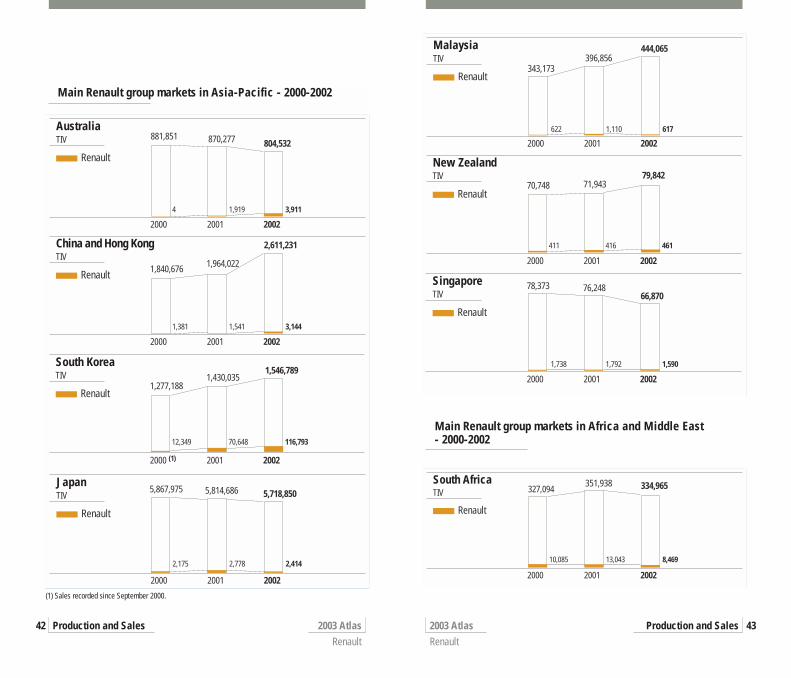
Main Renault group markets in Asia-Pacific - 2000-2002
Australia
Renault
TIV 804,532
2000 2001 2002
4 1,919 3,911
China and Hong Kong
Renault
TIV2,611,231
2000 2001 2002
1,381 1,541 3,144
South Korea
Renault
TIV1,277,188
2000 (1) 2001 2002
12,349 70,648 116,793
Japan
Renault
TIV 5,814,686
2000 2001 2002
2,175 2,778 2,414
881,851 870,277
1,840,676 1,964,022
1,546,7891,430,035
5,867,975 5,718,850
Malaysia
Renault
TIV444,065
2000 2001 2002
622 1,110 617
New Zealand
Renault
TIV70,748
2000 2001 2002
411 416 461
343,173396,856
79,84271,943
Singapore
Renault
TIV 66,870
2000 2001 2002
1,738 1,792 1,590
78,373 76,248
Main Renault group markets in Africa and Middle East - 2000-2002
South Africa
Renault
TIV 327,094
2000 2001 2002
10,085 13,043 8,469
334,965351,938
(1) Sales recorded since September 2000.
2003 Atlas Renault
Production and Sales44
European automobile market
2003 Atlas Renault
Production and Sales 45
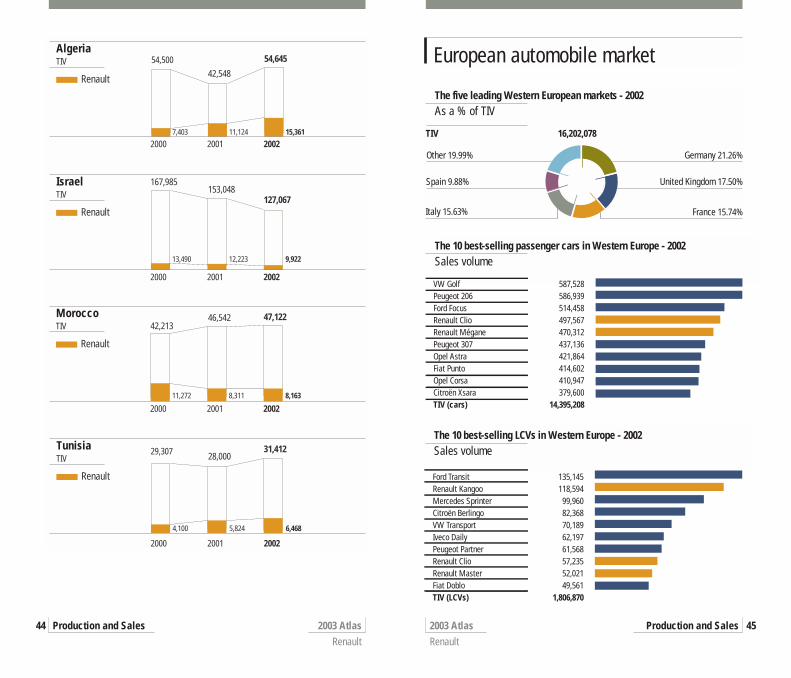
The five leading Western European markets - 2002 As a % of TIV
France 15.74%Italy 15.63%
Germany 21.26%
TIV 16,202,078
Other 19.99%
Spain 9.88% United Kingdom 17.50%
The 10 best-selling passenger cars in Western Europe - 2002 Sales volume
VW Golf 587,528Peugeot 206 586,939Ford Focus 514,458Renault Clio 497,567Renault Mégane 470,312Peugeot 307 437,136Opel Astra 421,864Fiat Punto 414,602Opel Corsa 410,947Citroën Xsara 379,600TIV (cars) 14,395,208
The 10 best-selling LCVs in Western Europe - 2002 Sales volume
Ford Transit 135,145Renault Kangoo 118,594Mercedes Sprinter 99,960Citroën Berlingo 82,368VW Transport 70,189Iveco Daily 62,197Peugeot Partner 61,568Renault Clio 57,235Renault Master 52,021Fiat Doblo 49,561TIV (LCVs) 1,806,870
Israel
Renault
TIV
2000 2001 2002
13,490 12,223 9,922
127,067
167,985153,048
Morocco
Renault
TIV
2000 2001 200211,272 8,311 8,163
47,12242,213
46,542
Algeria
Renault
TIV 54,500
2000 2001 20027,403 11,124 15,361
54,645
42,548
Tunisia
Renault
TIV29,307
2000 2001 2002
4,100 5,824 6,468
31,41228,000
European automobile market
2003 Atlas Renault
Production and Sales46 2003 Atlas Renault
Production and Sales 47
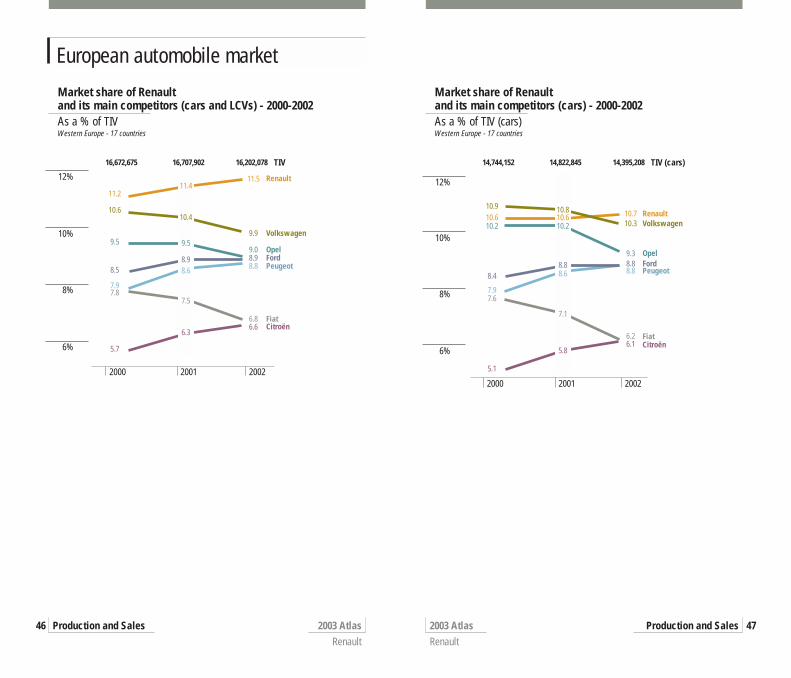
Market share of Renaultand its main competitors (cars and LCVs) - 2000-2002 As a % of TIVWestern Europe - 17 countries
2000 2001 2002
12%
8%
10%
6%
16,202,07816,672,675 16,707,902 TIV
Renault
FiatCitroën
Volkswagen
11.2
5.7
7.8
8.5
10.6
7.9
9.5
11.5
6.66.8
Ford8.9
9.9
Peugeot8.8
Opel9.0
11.4
7.5
6.3
8.98.6
10.4
9.5
Market share of Renaultand its main competitors (cars) - 2000-2002As a % of TIV (cars)Western Europe - 17 countries
2000 2001 2002
12%
8%
10%
6%
14,395,20814,744,152 14,822,845 TIV (cars)
Renault
FiatCitroën
Volkswagen
Opel
10.6
5.1
7.6
8.4
10.9
7.9
10.2
10.7
6.16.2
Ford8.8
10.3
Peugeot8.8
9.3
10.6
7.1
5.8
8.88.6
10.8
10.2
European automobile market
2003 Atlas Renault
Production and Sales48 2003 Atlas Renault
Production and Sales 49
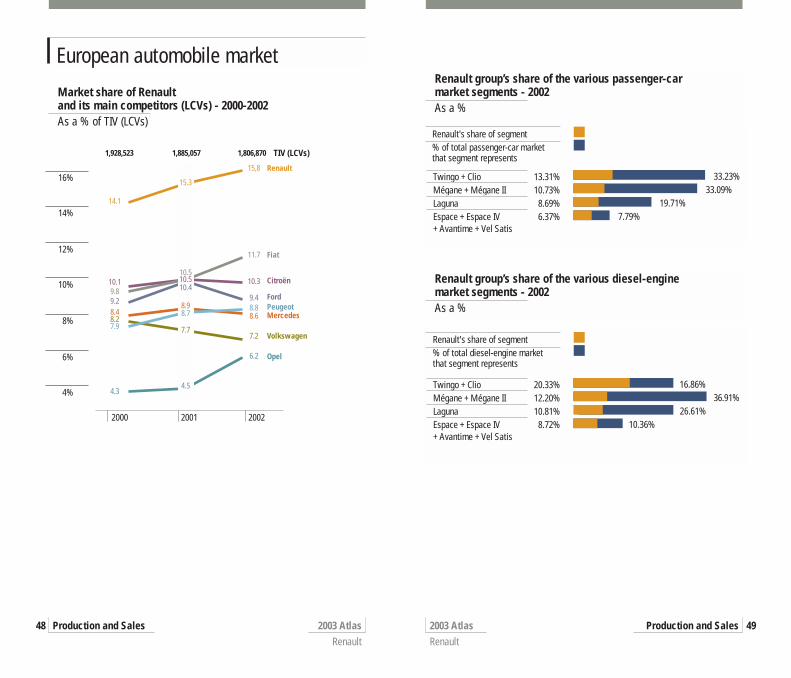
Renault group’s share of the various passenger-car market segments - 2002As a %
Twingo + Clio 13.31%Mégane + Mégane II 10.73%Laguna 8.69%Espace + Espace IV 6.37%+ Avantime + Vel Satis
Renault's share of segment% of total passenger-car marketthat segment represents
33.23%33.09%
19.71%7.79%
Renault group’s share of the various diesel-engine market segments - 2002 As a %
Twingo + Clio 20.33%Mégane + Mégane II 12.20%Laguna 10.81%Espace + Espace IV 8.72%+ Avantime + Vel Satis
16.86%36.91%
26.61%10.36%
Renault's share of segment% of total diesel-engine marketthat segment represents
Market share of Renaultand its main competitors (LCVs) - 2000-2002As a % of TIV (LCVs)
2000 2001 2002
16%
12%
14%
6%
8%
10%
4%
1,806,8701,928,523 1,885,057 TIV (LCVs)
Renault
Fiat
Citroën
FordPeugeotMercedes
Volkswagen
Opel
14.1
10.19.89.28.48.27.9
4.3
15,8
10.3
11.7
9.4
8.6
7.2
8.8
6.2
15.3
10.510.510.4
8.98.7
7.7
4.5
Renault sales in Europe
2003 Atlas Renault
Production and Sales50 2003 Atlas Renault
Production and Sales 51
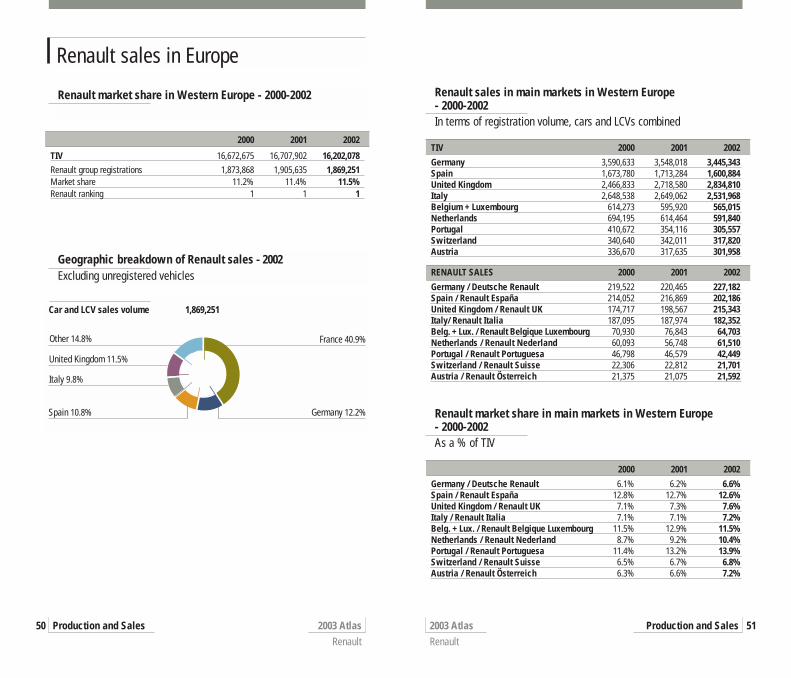
Renault market share in Western Europe - 2000-2002
2000 2001 2002
TIV 16,672,675 16,707,902 16,202,078Renault group registrations 1,873,868 1,905,635 1,869,251Market share 11.2% 11.4% 11.5%Renault ranking 1 1 1
Geographic breakdown of Renault sales - 2002Excluding unregistered vehicles
Germany 12.2%Spain 10.8%
France 40.9%
Car and LCV sales volume 1,869,251
Other 14.8%
Italy 9.8%
United Kingdom 11.5%
Renault sales in main markets in Western Europe - 2000-2002In terms of registration volume, cars and LCVs combined
TIV 2000 2001 2002
Germany 3,590,633 3,548,018 3,445,343Spain 1,673,780 1,713,284 1,600,884United Kingdom 2,466,833 2,718,580 2,834,810Italy 2,648,538 2,649,062 2,531,968Belgium + Luxembourg 614,273 595,920 565,015Netherlands 694,195 614,464 591,840Portugal 410,672 354,116 305,557Switzerland 340,640 342,011 317,820Austria 336,670 317,635 301,958
RENAULT SALES 2000 2001 2002
Germany / Deutsche Renault 219,522 220,465 227,182Spain / Renault España 214,052 216,869 202,186United Kingdom / Renault UK 174,717 198,567 215,343Italy/ Renault Italia 187,095 187,974 182,352Belg. + Lux. / Renault Belgique Luxembourg 70,930 76,843 64,703Netherlands / Renault Nederland 60,093 56,748 61,510Portugal / Renault Portuguesa 46,798 46,579 42,449Switzerland / Renault Suisse 22,306 22,812 21,701Austria / Renault Österreich 21,375 21,075 21,592
Renault market share in main markets in Western Europe - 2000-2002As a % of TIV
2000 2001 2002
Germany / Deutsche Renault 6.1% 6.2% 6.6%Spain / Renault España 12.8% 12.7% 12.6%United Kingdom / Renault UK 7.1% 7.3% 7.6%Italy / Renault Italia 7.1% 7.1% 7.2%Belg. + Lux. / Renault Belgique Luxembourg 11.5% 12.9% 11.5%Netherlands / Renault Nederland 8.7% 9.2% 10.4%Portugal / Renault Portuguesa 11.4% 13.2% 13.9%Switzerland / Renault Suisse 6.5% 6.7% 6.8%Austria / Renault Österreich 6.3% 6.6% 7.2%
Renault group sales in Greater Europe
2003 Atlas Renault
Production and Sales52 2003 Atlas Renault
Production and Sales 53
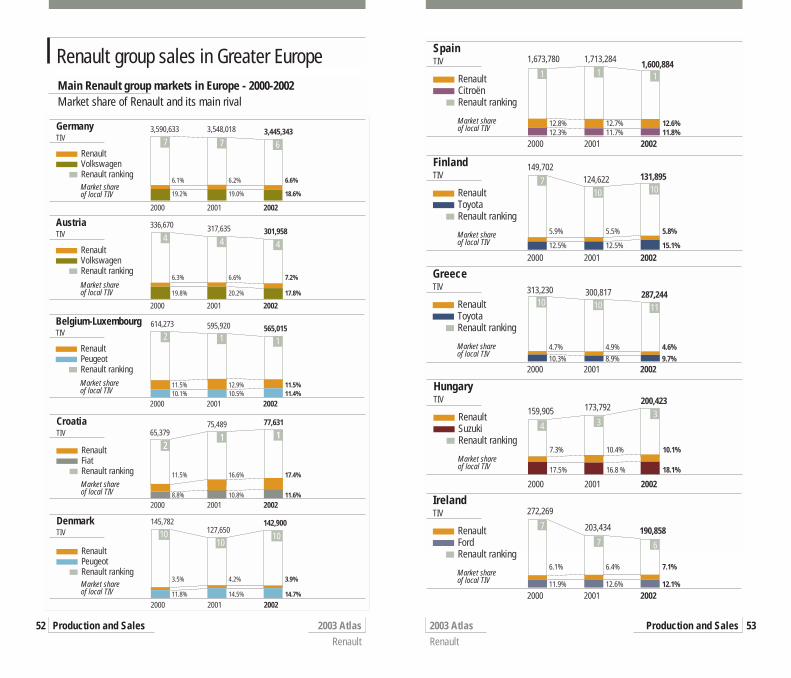
Main Renault group markets in Europe - 2000-2002Market share of Renault and its main rival
Market shareof local TIV
Germany
RenaultVolkswagenRenault ranking
TIV3,590,633 3,548,018
2000 2001 2002
77 7 6
6.1% 6.2% 6.6%
19.2% 19.0% 18.6%
Market shareof local TIV
Austria
RenaultVolkswagenRenault ranking
TIV336,670
2000 2001 2002
4 4 4
6.3% 6.6% 7.2%
19.8% 20.2% 17.8%
Market shareof local TIV
Belgium-Luxembourg
RenaultPeugeotRenault ranking
TIV614,273
2000 2001 2002
11.5% 12.9% 11.5%10.1% 10.5% 11.4%
Market shareof local TIV
Croatia
RenaultFiatRenault ranking
TIV75,489
2000 2001 2002
2211 11
11.5% 16.6% 17.4%
8.8% 10.8% 11.6%
Market shareof local TIV
Denmark
RenaultPeugeotRenault ranking
TIV145,782
2000 2001 2002
1010
10
3.5% 4.2% 3.9%
11.8% 14.5% 14.7%
3,445,343
317,635 301,958
2 1 1565,015595,920
65,37977,631
142,900127,650
Market shareof local TIV
Spain
RenaultCitroënRenault ranking
TIV 1,673,780 1,713,284
2000 2001 2002
1 1 1
12.8% 12.7% 12.6%12.3% 11.7% 11.8%
Market shareof local TIV
Finland
RenaultToyotaRenault ranking
TIV149,702
2000 2001 2002
7
5.9% 5.5% 5.8%
12.5% 12.5% 15.1%
Market shareof local TIV
Greece
RenaultToyotaRenault ranking
TIV 313,230
2000 2001 2002
10 10 11
4.7% 4.9% 4.6%10.3% 8.9% 9.7%
Market shareof local TIV
Hungary
RenaultSuzukiRenault ranking
TIV159,905
2000 2001 2002
4 33
7.3% 10.4% 10.1%
17.5% 16.8 % 18.1%
Market shareof local TIV
Ireland
RenaultFordRenault ranking
TIV 272,269
2000 2001 2002
6.1% 6.4% 7.1%
11.9% 12.6% 12.1%
7
7 6
10 10
1,600,884
124,622 131,895
300,817 287,244
200,423173,792
190,858203,434
2003 Atlas Renault
Production and Sales54 2003 Atlas Renault
Production and Sales 55
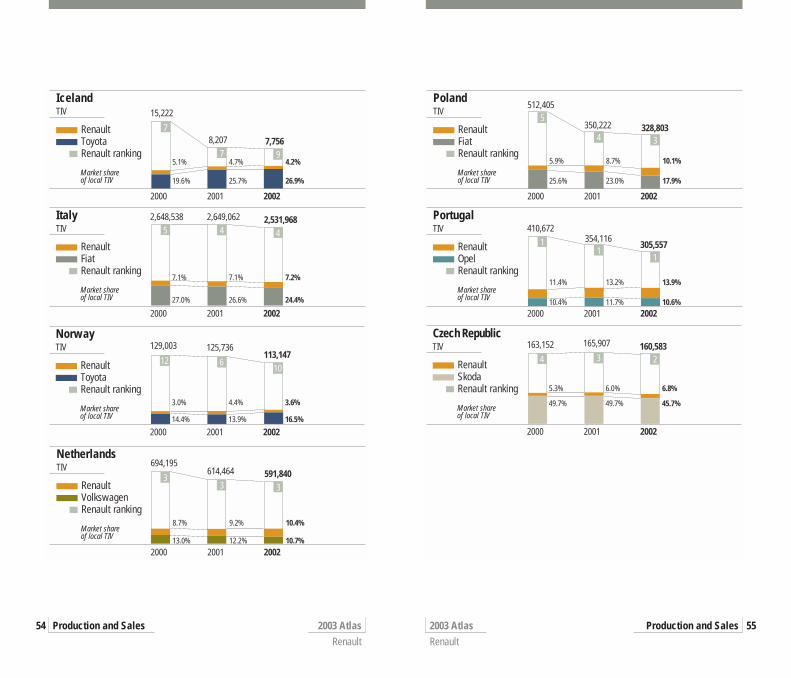
Market shareof local TIV
Iceland
RenaultToyotaRenault ranking
TIV 15,222
2000 2001 2002
7
7 95.1% 4.7% 4.2%
19.6% 25.7% 26.9%
Market shareof local TIV
Italy
RenaultFiatRenault ranking
TIV2,648,538 2,649,062
2000 2001 2002
5 4 4
7.1% 7.1% 7.2%
27.0% 26.6% 24.4%
Market shareof local TIV
Norway
RenaultToyotaRenault ranking
TIV 129,003
2000 2001 2002
12 610
3.0% 4.4% 3.6%
14.4% 13.9% 16.5%
Market shareof local TIV
Netherlands
RenaultVolkswagenRenault ranking
TIV 694,195
2000 2001 2002
33 3
8.7% 9.2% 10.4%
13.0% 12.2% 10.7%
8,207 7,756
2,531,968
125,736113,147
614,464 591,840
Market shareof local TIV
Poland
RenaultFiatRenault ranking
TIV512,405
2000 2001 2002
5.9% 8.7% 10.1%
25.6% 23.0% 17.9%
Market shareof local TIV
Portugal
RenaultOpelRenault ranking
TIV 410,672
2000 2001 2002
11.4% 13.2% 13.9%
10.4% 11.7% 10.6%
Market shareof local TIV
Czech Republic
RenaultSkodaRenault ranking
TIV 163,152
2000 2001 2002
5.3% 6.0% 6.8%
49.7% 49.7% 45.7%
4 3 2
11
1
4
5
3328,803350,222
354,116305,557
160,583165,907
2003 Atlas Renault
Production and Sales56 2003 Atlas Renault
Production and Sales 57
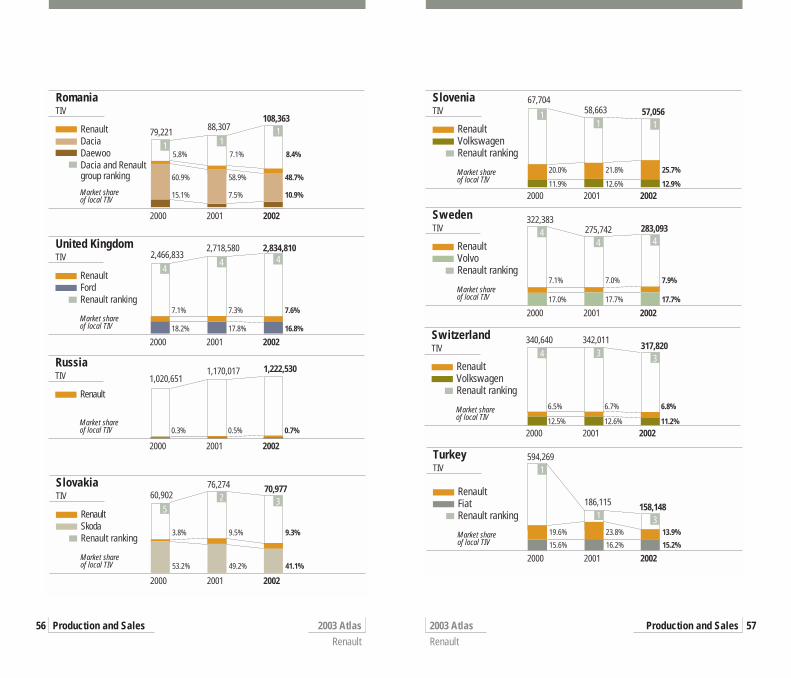
Market shareof local TIV
Romania
RenaultDaciaDaewooDacia and Renault group ranking
TIV
79,221
2000 2001 2002
1 11
60.9% 58.9% 48.7%
15.1% 7.5% 10.9%
Market shareof local TIV
United Kingdom
RenaultFordRenault ranking
TIV 2,718,580 2,834,810
2000 2001 2002
44 4
7.1% 7.3% 7.6%
18.2% 17.8% 16.8%
Market shareof local TIV
Russia
Renault
TIV 1,020,651
2000 2001 2002
0.3% 0.5% 0.7%
Market shareof local TIV
Slovakia
RenaultSkodaRenault ranking
TIV 60,902
2000 2001 2002
52 3
3.8% 9.5% 9.3%
53.2% 49.2% 41.1%
108,36388,307
2,466,833
1,170,017 1,222,530
70,97776,274
5.8% 7.1% 8.4%
Market shareof local TIV
Slovenia
RenaultVolkswagenRenault ranking
TIV67,704
2000 2001 2002
11 1
20.0% 21.8% 25.7%
11.9% 12.6% 12.9%
Market shareof local TIV
Sweden
RenaultVolvoRenault ranking
TIV322,383
2000 2001 2002
44 4
7.1% 7.0% 7.9%
17.0% 17.7% 17.7%
Market shareof local TIV
Turkey
RenaultFiatRenault ranking
TIV594,269
2000 2001 2002
1
1 319.6% 23.8% 13.9%
15.6% 16.2% 15.2%
Market shareof local TIV
Switzerland
RenaultVolkswagenRenault ranking
TIV340,640 342,011
2000 2001 2002
4 3 3
6.5% 6.7% 6.8%
12.5% 12.6% 11.2%
186,115 158,148
317,820
58,663 57,056
283,093275,742
2003 Atlas Renault
Production and Sales58 2003 Atlas Renault
Production and Sales 59
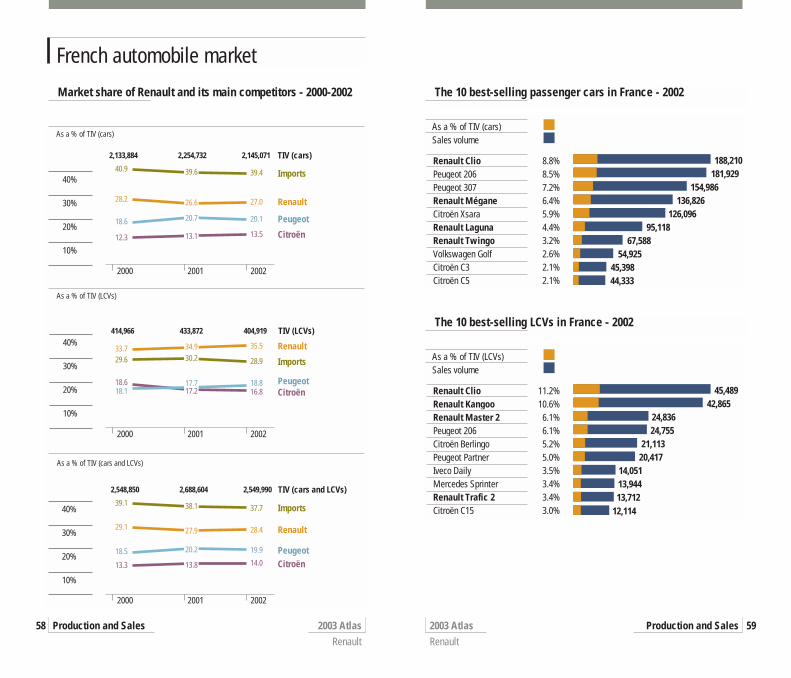
French automobile market
Market share of Renault and its main competitors - 2000-2002
As a % of TIV (cars)
2000 2001 2002
2000 2001 2002
2000 2001 2002
10%
20%
30%
40%
2,145,071
As a % of TIV (LCVs)
10%
20%
30%
40%
As a % of TIV (cars and LCVs)
10%
20%
30%
40%
39.4
28.9
37.7
27.0
35.5
28.4
20.1
18.8
19.9
13.5
16.8
14.0
40.9
29.6
39.1
28.2
33.7
29.1
18.6
18.1
18.5
12.3
18.6
13.3
39.6
30.2
38.1
26.6
34.9
27.9
20.7
17.7
20.2
13.1
17.2
13.8
Imports
Renault
Peugeot
Citroën
Imports
Renault
PeugeotCitroën
Imports
Renault
PeugeotCitroën
2,133,884 2,254,732 TIV (cars)
404,919414,966 433,872 TIV (LCVs)
2,549,9902,548,850 2,688,604 TIV (cars and LCVs)
The 10 best-selling passenger cars in France - 2002
Renault Clio 8.8%Peugeot 206 8.5%Peugeot 307 7.2%Renault Mégane 6.4%Citroën Xsara 5.9%Renault Laguna 4.4%Renault Twingo 3.2%Volkswagen Golf 2.6%Citroën C3 2.1%Citroën C5 2.1%
As a % of TIV (cars)Sales volume
188,210181,929
154,986136,826
126,09695,118
67,58854,925
45,39844,333
The 10 best-selling LCVs in France - 2002
Renault Clio 11.2%Renault Kangoo 10.6%Renault Master 2 6.1%Peugeot 206 6.1%Citroën Berlingo 5.2%Peugeot Partner 5.0%Iveco Daily 3.5%Mercedes Sprinter 3.4%Renault Trafic 2 3.4%Citroën C15 3.0%
As a % of TIV (LCVs)Sales volume
45,48942,865
24,83624,755
21,11320,417
14,05113,94413,712
12,114
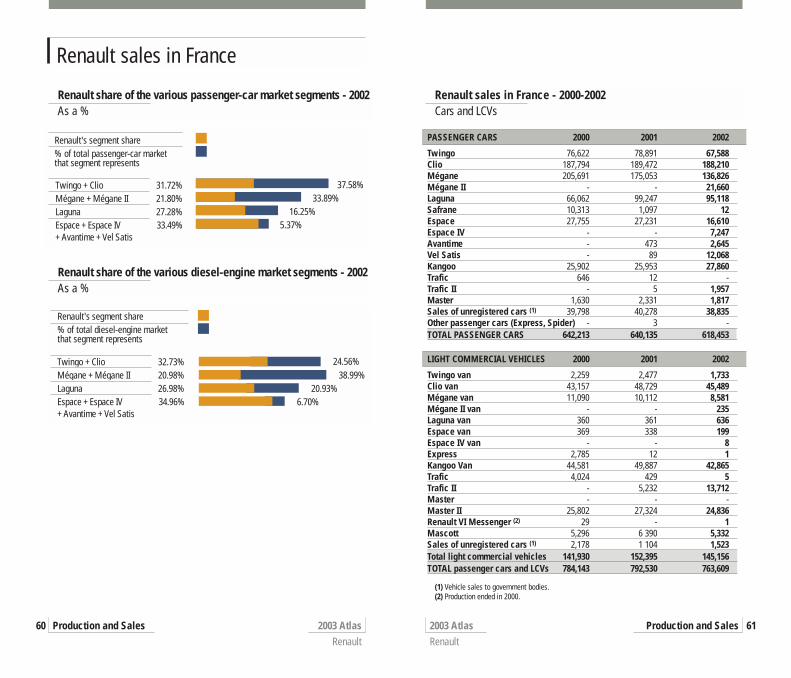
Renault sales in France
2003 Atlas Renault
Production and Sales60 2003 Atlas Renault
Production and Sales 61
Renault sales in France - 2000-2002Cars and LCVs
(1) Vehicle sales to government bodies. (2) Production ended in 2000.
PASSENGER CARS 2000 2001 2002
Twingo 76,622 78,891 67,588Clio 187,794 189,472 188,210Mégane 205,691 175,053 136,826Mégane II - - 21,660Laguna 66,062 99,247 95,118Safrane 10,313 1,097 12Espace 27,755 27,231 16,610Espace IV - - 7,247Avantime - 473 2,645Vel Satis - 89 12,068Kangoo 25,902 25,953 27,860Trafic 646 12 -Trafic II - 5 1,957Master 1,630 2,331 1,817Sales of unregistered cars (1) 39,798 40,278 38,835Other passenger cars (Express, Spider) - 3 -TOTAL PASSENGER CARS 642,213 640,135 618,453
LIGHT COMMERCIAL VEHICLES 2000 2001 2002
Twingo van 2,259 2,477 1,733Clio van 43,157 48,729 45,489Mégane van 11,090 10,112 8,581Mégane II van - - 235Laguna van 360 361 636Espace van 369 338 199Espace IV van - - 8Express 2,785 12 1Kangoo Van 44,581 49,887 42,865Trafic 4,024 429 5Trafic II - 5,232 13,712Master - - -Master II 25,802 27,324 24,836Renault VI Messenger (2) 29 - 1Mascott 5,296 6 390 5,332Sales of unregistered cars (1) 2,178 1 104 1,523Total light commercial vehicles 141,930 152,395 145,156TOTAL passenger cars and LCVs 784,143 792,530 763,609
Renault share of the various passenger-car market segments - 2002As a %
Twingo + Clio 31.72%Mégane + Mégane II 21.80%Laguna 27.28%Espace + Espace IV 33.49%+ Avantime + Vel Satis
Renault's segment share% of total passenger-car market that segment represents
37.58%33.89%
16.25%5.37%
Renault share of the various diesel-engine market segments - 2002As a %
Twingo + Clio 32.73%Mégane + Mégane II 20.98%Laguna 26.98%Espace + Espace IV 34.96%+ Avantime + Vel Satis
24.56%38.99%
20.93%6.70%
Renault's segment share% of total diesel-engine market that segment represents
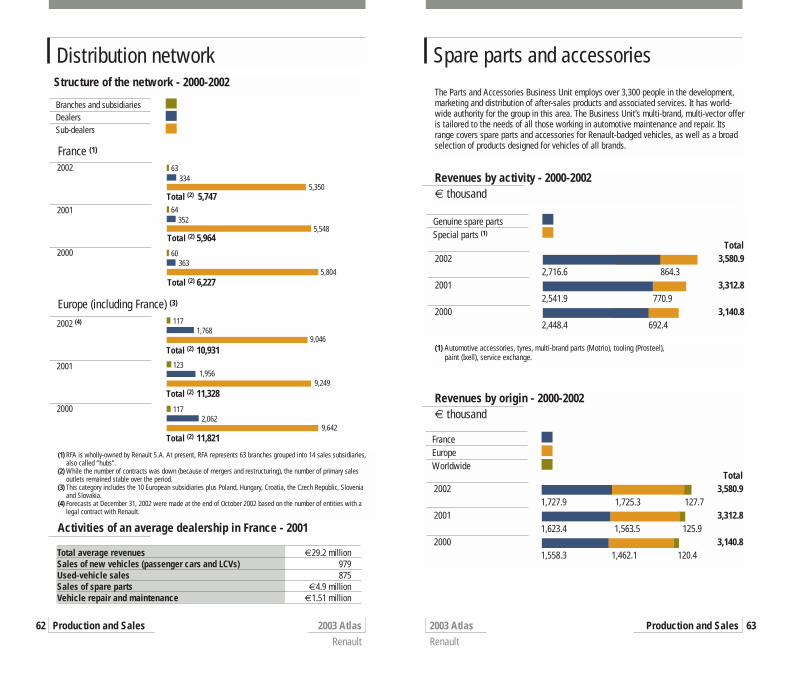
Distribution network
2003 Atlas Renault
Production and Sales62
Spare parts and accessories
2003 Atlas Renault
Production and Sales 63
Structure of the network - 2000-2002
2002
2001
2000
63
64
60
334
363
5,350
3525,548
5,804
Total (2) 5,747
Total (2) 5,964
Total (2) 6,227
Europe (including France) (3)
117
123
117
1,768
2,062
9,046
1,9569,249
9,642
2002 (4)
2001
2000
Total (2) 10,931
Total (2) 11,328
Total (2) 11,821
The Parts and Accessories Business Unit employs over 3,300 people in the development,marketing and distribution of after-sales products and associated services. It has world-wide authority for the group in this area. The Business Unit’s multi-brand, multi-vector offeris tailored to the needs of all those working in automotive maintenance and repair. Itsrange covers spare parts and accessories for Renault-badged vehicles, as well as a broadselection of products designed for vehicles of all brands.
(1) Automotive accessories, tyres, multi-brand parts (Motrio), tooling (Prosteel), paint (Ixell), service exchange.
Revenues by activity - 2000-2002€ thousand
Revenues by origin - 2000-2002€ thousand
Total2002 3,580.9 1,727.9 1,725.3 127.72001 3,312.8 1,623.4 1,563.5 125.92000 3,140.8 1,558.3 1,462.1 120.4
FranceEuropeWorldwide
(1) RFA is wholly-owned by Renault S.A. At present, RFA represents 63 branches grouped into 14 sales subsidiaries,also called “hubs”.
(2) While the number of contracts was down (because of mergers and restructuring), the number of primary sales outlets remained stable over the period.
(3) This category includes the 10 European subsidiaries plus Poland, Hungary, Croatia, the Czech Republic, Slovenia and Slovakia.
(4) Forecasts at December 31, 2002 were made at the end of October 2002 based on the number of entities with alegal contract with Renault.
Total average revenues €29.2 millionSales of new vehicles (passenger cars and LCVs) 979Used-vehicle sales 875Sales of spare parts €4.9 millionVehicle repair and maintenance €1.51 million
Total2002 3,580.9 2,716.6 864.32001 3,312.8 2,541.9 770.92000 3,140.8 2,448.4 692.4
Genuine spare partsSpecial parts (1)
Branches and subsidiariesDealersSub-dealers
France (1)
Activities of an average dealership in France - 2001
2003 Atlas Renault
Financial Activities64
RCI Banque
2003 Atlas Renault
Financial Activities 65
2001 2002 Net loans outstanding Net loans outstandingat end-2001 at end-2002
Austria 23.9% 34.3% 165 176Belgium 16.0% 22.9% 278 284France 28.0% 29.8% 5,541 5,894Germany 45.8% 49.0% 5,063 5,343Italy 40.1% 35.7% 1,795 1,885Netherlands 14.0% 14.2% 530 526Portugal 29.2% 29.7% 374 398Spain 31.7% 35.9% 2,330 2,529Switzerland 27.4% 31.2% 246 282United Kingdom 27.8% 30.4% 1,362 1,534Total Europe 31.5% 32.7% 17,748 18,891Rest of the world 267 232Total RCI Banque 18,015 19,123
RCI Banque finances almost one-third of Renault and Nissan sales. That makes it a leadingcar financing company, and a powerful instrument, enabling the Alliance to conquer newmarkets and build brand loyalty. RCI Banque also helps construct a strong, enduring net-work by working alongside the carmakers in the deployment of their distribution policy.
Fleet productsContact hire and fleet managementRCI Banque offers fleet customers a whole range of services, from contract hire to fleetmanagement.
Loans for individual buyers
Financing schemes for the general public with two aims:- to help customers to buy a new or used Renault or Nissan vehicle,- to facilitate ownership and replacement of vehicles, thanks to a range of products with
guaranteed buyback commitment.
New RCI Banque financing and loans outstanding - 2000-2002New and used Renault and Nissan vehicles€ million
2000 2001 2002
New financing 8,095 9,313 9,438Number of new loans 928,757 994,568 1,012,000Net loans outstanding at year-end 16,806 18,015 19,123
Market share and net loans outstanding by country - 2000 to 2002RCI Banque share of new Renault and Nissan vehicle sales in Europe€ million
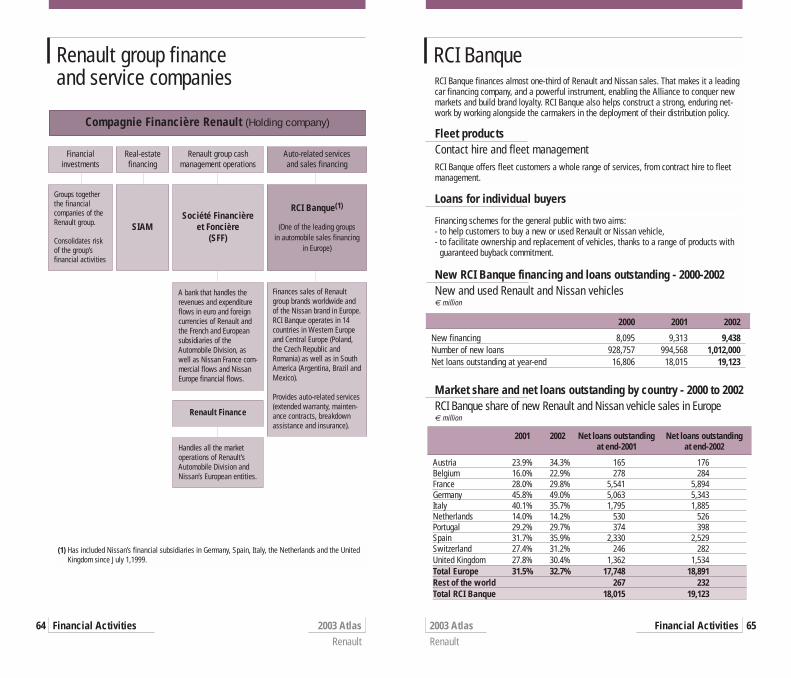
Renault group finance and service companies
Financial investments
Real-estatefinancing
Renault group cash management operations
Auto-related servicesand sales financing
Groups togetherthe financialcompanies of theRenault group.
Consolidates riskof the group’sfinancial activities
SIAMSociété Financière
et Foncière (SFF)
RCI Banque(1)
(One of the leading groups in automobile sales financing
in Europe)
A bank that handles therevenues and expenditureflows in euro and foreigncurrencies of Renault andthe French and Europeansubsidiaries of theAutomobile Division, aswell as Nissan France com-mercial flows and NissanEurope financial flows.
Finances sales of Renaultgroup brands worldwide andof the Nissan brand in Europe.RCI Banque operates in 14countries in Western Europeand Central Europe (Poland,the Czech Republic andRomania) as well as in SouthAmerica (Argentina, Brazil andMexico).
Provides auto-related services(extended warranty, mainten-ance contracts, breakdownassistance and insurance).
Renault Finance
Handles all the marketoperations of Renault’sAutomobile Division andNissan’s European entities.
(1) Has included Nissan’s financial subsidiaries in Germany, Spain, Italy, the Netherlands and the UnitedKingdom since July 1,1999.
Compagnie Financière Renault (Holding company)
Industrial Companies
2003 Atlas Renault
Industrial Companies66
Motor Sport and Leisure
2003 Atlas Renault
Motor Sport and Leisure 67
Renault Agriculture - 2002Design, manufacture and distribution of farm machinery
Consolidated revenues: €636.8 millionTotal number of tractors delivered in 2002: 9,343 units
Market share in France
2002 20012000
18.42%17.75%
18.85%
A network of subsidiaries (United Kingdom, Germany, Holland) and importers handlessales within the EU. The subsidiary RSI (Renault Agriculture & Sonalika Int.) is in chargeof sales outside the EU. Industrial and sales partners include International Tractors Ltd(India), JCB (UK), Agritalia (Italy), Massey Ferguson (GIMA, France) and John Deere(France).
SNR Roulements - 2002Design, manufacture and sale of bearings
Revenues: €455 million
Revenues outside France
2002 20012000 42%
45%43%
Five plants in France, one in Brazil.Holding in ICSA Italy.Sales subsidiaries in Europe, the Americas and Japan.Main markets: automobile, industry, aeronautics and railways.
Highlights in 2002: Creation of a new entity, SNR Mechatronics, to strengthen the company’s leadership inthe field of smart bearings and to develop innovative solutions for customers in the indus-trial, automobile and aeronautics sectors.Creation of an industrial facility in Romania producing standard gearbox bearings.
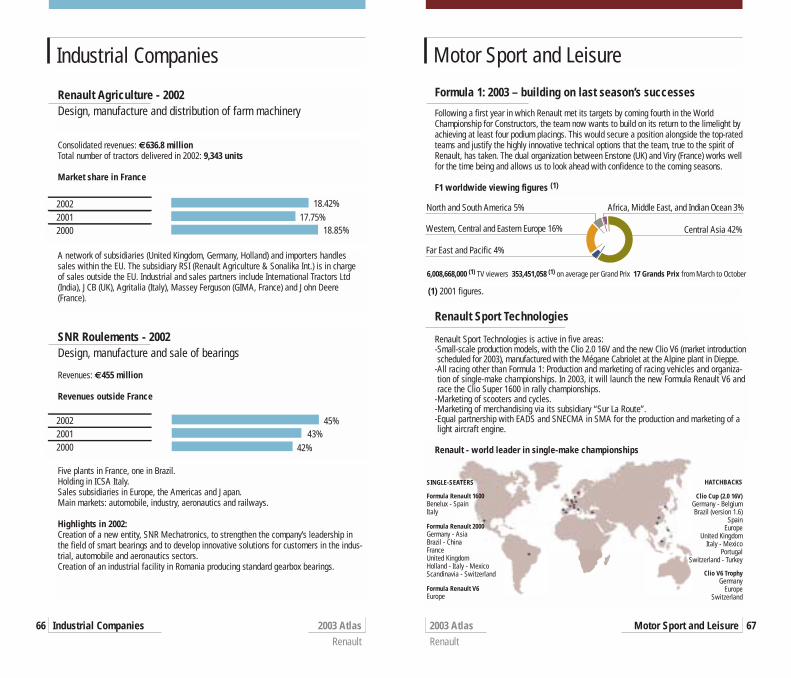
Renault Sport Technologies is active in five areas:-Small-scale production models, with the Clio 2.0 16V and the new Clio V6 (market introductionscheduled for 2003), manufactured with the Mégane Cabriolet at the Alpine plant in Dieppe.
-All racing other than Formula 1: Production and marketing of racing vehicles and organiza-tion of single-make championships. In 2003, it will launch the new Formula Renault V6 andrace the Clio Super 1600 in rally championships.
-Marketing of scooters and cycles.-Marketing of merchandising via its subsidiary “Sur La Route”.-Equal partnership with EADS and SNECMA in SMA for the production and marketing of alight aircraft engine.
Formula 1: 2003 – building on last season’s successes
Following a first year in which Renault met its targets by coming fourth in the WorldChampionship for Constructors, the team now wants to build on its return to the limelight byachieving at least four podium placings. This would secure a position alongside the top-ratedteams and justify the highly innovative technical options that the team, true to the spirit ofRenault, has taken. The dual organization between Enstone (UK) and Viry (France) works wellfor the time being and allows us to look ahead with confidence to the coming seasons.
F1 worldwide viewing figures (1)
Central Asia 42%
Far East and Pacific 4%
Western, Central and Eastern Europe 16%
Africa, Middle East, and Indian Ocean 3%North and South America 5%
6,008,668,000 (1) TV viewers 353,451,058 (1) on average per Grand Prix 17 Grands Prix from March to October
(1) 2001 figures.
Renault Sport Technologies
HATCHBACKS
Clio Cup (2.0 16V)Germany - BelgiumBrazil (version 1.6)
SpainEurope
United KingdomItaly - Mexico
Portugal Switzerland - Turkey
Clio V6 TrophyGermany
EuropeSwitzerland
SINGLE-SEATERS
Formula Renault 1600Benelux - Spain Italy
Formula Renault 2000Germany - AsiaBrazil - China France United Kingdom Holland - Italy - MexicoScandinavia - Switzerland
Formula Renault V6Europe
Renault - world leader in single-make championships