Embed Size (px)
Citation preview

http://dx.doi.org/10.4314/ajtcam.v9i3S.5
Lekhooaetal., Afr J Tradit Complement Altern Med. (2012) 9(3S):27-39
EVALUATION OF TRADITIONAL MEDICINES I: IDENTIFICATION OF PHELA USING DIFFERENT CHROMATOGRAPHIC TECHNIQUES
Makhotso Lekhooa*, Andrew Walubo*, Jan JB Du Plessis*, Motlalepula C. Matsabisa#1 and Duduzile Molefe1
*University of the Free State, Department of Pharmacology 1Medical Research Council -Indigenous Knowledge System Program Unit
P.O. Box19070, Tygerberg 7505, Francie van Ziyl DriveParow Valley, Cape Town, South Africa
# E-mail address: [email protected]
Abstract
PHELA is a herbal mixture of four African traditional medicinal plants that has been used for decades in wasting conditions and is now being developed by the Medical Research Council (MRC) as an immune booster for patients with compromised immune system. A chromatographic fingerprint of PHELA was needed for quality control purposes. Here, a comprehensive method for fingerprinting of PHELA using different chromatographic techniques is described. It involved extraction of the PHELA by either acidic or a simple ‘salting-out’ method, followed by Thin Layer Chromatography (TLC) analysis and/or preparative Column Chromatography (CC). The products were thereafter analyzed by High Performance Liquid Chromatography with UV-detector (HPLC-UV), HPLC with fluorescence-detector (HPLC-FL) and Gas-Chromatography with a Mass Selective Detector spectrometer (GC-MSD). The fingerprints were successfully used to differentiate PHELA from another common herbal product made from Hypericum perforatum (St. John’s Wort), thereby illustrating its high potential for use in fingerprinting of PHELA and in differentiating it from other herbal medicines. By validating the different chromatographic techniques on the standardized extraction methods, this approach will enable wide application in quality control of PHELA using acceptable procedures, thereby promoting effective monitoring of the finished product in all countries where it will be used.
Key words: PHELA, Traditional Herbal Medicine, chromatography, Fingerprinting, Quality Control.
Introduction
PHELA is a herbal mixture of four African traditional medicinal plants [Clerodendrum glabrum, Polianthes tuberosa, Rotheca myricoides and Senna occidentails] that has been used for decades in wasting conditions and for increasing energy in patients. Recently, PHELA was reported to benefit immune compromised individuals due to its immune stimulant effects. Evidence of its efficacy was obtained from anecdotal reports of patients and traditional healers, and these were supported by the subsequent findings in observational studies involving medical doctors in the Western Cape and Gauteng provinces. Therefore, the Indigenous Knowledge Systems (IKS) Lead Program of the Medical Research Council (MRC) and the Department of Health of South Africa embarked on investigating these claims in scientifically organized studies and/or controlled clinical trials. At the MRC laboratories, PHELA was prepared to mimic traditional preparation but under strict Good Manufacturing Practices (GMP). is the plant material was milled into a homogeneous powder and sterilized by irradiation before being filled into standardized 250 mg capsules. In the same perspective, a chromatographic fingerprint of PHELA was required for quality control purposes.
Unfortunately, despite the world-wide use of herbal medicines, quality evaluation of herbal medicines remains a challenge as there is still no reliable and acceptable strategy for their quality evaluation. Direct quantification of as many as possible components is impossible since most reference components are not commercially available, while the procedures for complete separation, identification and determination of their components are almost unattainable. Chromatographic fingerprinting was recommended by the WHO and other agencies as the most preferable technique to use in the quality control of herbal medicines (WHO, 2000). Specifically, it is used for, among other things, authentication of raw materials and final products, testing for stability, consistence in manufacturing and fighting against counterfeits and adulteration. It involves systemic characterization of some of the components under standardized chromatographic and extraction conditions which are used as biomarkers.
Unfortunately, recent advances in technology have rendered the so-called ‘reliable’ chromatographic fingerprinting methods beyond the reach of most deserving communities. Chromatographic fingerprinting has become expensive and more complicated due to the expensive equipment that require specialized expertise, as well as the methods used to transform the data (Liang, et sl, 2004 ; Ji, et al, 2005; Xu et al, 2006; Alaerts, et al, 2007; Hoai and et al, 2009). Regarding the latter, all the methods for retention time warping require expertise to perform (Malmquist and Danielsson, 1994; Nielsen, et al, 1998; Kassidas, et al, 1998; Eilers, 2004; Walczak, et al, 2005 and Pravdova, et al, 2002), and these methods and expertise are not available in most laboratories.
27

http://dx.doi.org/10.4314/ajtcam.v9i3S.5
Lekhooaetal., Afr J Tradit Complement Altern Med. (2012) 9(5S):27-39 It was also observed that most of the reports describe one chromatographic technique thereby denying many who don’t have such equipment from utilizing the technique. Fingerprinting methods should incorporate methods that are affordable to most laboratories, particularly laboratories in poor resource countries. It was envisaged that using multiple chromatographic methods for fingerprinting would offer users options to correlate the need for further testing versus increasing cost (cost-benefit analysis). Also it would lessen the need for intensive calculations that are coherent to single chromatographic techniques. In effect, expensive chromatographic fingerprinting should only be used where it deserves and according to cost-benefit analysis. Also, the use of different chromatographic techniques ensures identification of as many compounds as possible in the mixture which may not be possible with one technique. Lastly, if a particular method is adopted by many laboratories, it promotes international harmonization of quality control methods. Here, we describe a comprehensive method for fingerprinting of PHELA using a combination of different chromatographic techniques, i.e., Thin Layer Chromatography (TLC), Column Chromatography (CC), High Performance Liquid Chromatography with UV-detector (HPLC-UV), High Performance Liquid Chromatography with fluorescence-detector (HPLC-FL), High Performance Liquid Chromatography with a Photo Diode Array (HPLC-PDA) detector and Gas-Chromatography with a Mass Selective Detector (GC-MSD) spectrometry.
Materials and Methods Reagents
PHELA was manufactured and supplied by the Indigenous Knowledge Systems (IKS) Unit of the South African Medical Research Council, while Hypericum perforatum (St. John’s Wort; SJW) was a donation from Zauberkrant of South Africa. Extraction solvents: dichloromethane, hexane, methanol, acetonitrile, diethyl ether and toluene were obtained from Burdick and Jackson, U.S.A, while acetic acid, iso-propanol, ethyl acetate, n-butanol and ammonia were obtained from Merck, Germany. Sodium hydroxide and ammonium sulphate were purchased from Sigma Aldrich Chemical Co., USA. Deionised and distilled water were prepared by Millipore water system (Milli – QTm).
Sample Extraction ‘Salting-out’ method
PHELA (200 mg) in 3 ml of iso-propanol was treated with 1 g of ammonia sulphate, centrifuged at 2500 rpm (1251 g) at 4°C for 5 minutes. The supernatant was evaporated under nitrogen at 47 °C and the residue was reconstituted with 200 µl methanol. This method was used for samples analyzed by TLC, HPLC-FLD and GC-MSD.
Acidic extraction method
PHELA (200 mg) was extracted with 5 ml of hexane by shaking horizontally for 15 minutes at room temperature then acidified with 500 µl of 0.1 M HCl. The sample was shaken horizontally and left over night in the fridge (4 °C). The sample was then centrifuged at 2 500 rpm (1 251g) at 4 °C for 5 minutes. The organic layer was evaporated under nitrogen at 47°C, and the residue was reconstituted with 5 ml of mobile phase (70 % acetonitrile in water) which was filtered using PVDF 0.45 µm membrane. This method was used for samples analyzed by HPLCUV and GC-MSD.
Chromatographic methods
All the chromatographic methods were developed and validated department of Pharmacology laboratory, University of the Free State.
TLC analysis
An Alugram® SIL G/UV254 glass TLC plate, ethyl acetate: ammonia: methanol (17: 1: 2; v/v/v) as mobile phase were used. Samples were run for one hour. The bands were scraped off, reconstituted in 1 ml of 70% acetonitrile and kept for analysis by HPLC-UV or HPLC-FLD and GC-MSD.
Column Chromatography
Column chromatography setup consisted of a 25 ml glass pipette as the column, with a small glass wool at the tip and filled with 13 ml of silica gel 60. A methanolic solution of PHELA (200 ul) was loaded on the column and eluted under gravity with 20 ml of ethyl acetate: ammonia: methanol (17:1:2; v/v/v) mobile phase. Fractions were collected every minute in test tubes. 46 Fractions were collected and identified by the minute of elution preceded by CC-FR, e.g., fraction CC-FR-5 means fraction collected at 5 minutes. The fractions were evaporated under nitrogen at 47 °C and the residue was reconstituted into 70 % acetonitrile. Preliminary experiments indicated that only the first 12 fractions contained compounds with major peaks, and these 12 were further analyzed by HPLC-UV, HPLC-FL and GC-MSD. Based on these analyses, the best fraction/s was selected for fingerprinting.
HPLC analysis HPLC-UV and HPLC-PDA
For HPLC-UV analysis, the HPLC system was an HP (Hewelt-Parkard) 1100 series consisting of an
28

http://dx.doi.org/10.4314/ajtcam.v9i3S.5
Lekhooaetal., Afr J Tradit Complement Altern Med. (2012) 9(5S):27-39 isocratic pump, a UV detector set at 245 nm and computer with LC-ChemStation software. A reverse phase C18 column (250 mm x 4.6 mm x 5 µm) coupled to a C18 guard column was used. The mobile phase consisted of acetonitrile: deionised water (70: 30; v/v). Each run was 40 min duration at a flow rate of 0.5 ml/min. over The Injection volume was 50µl. Samples for HLPC-UV detection were prepared by the ‘acidic extraction method’. Because of limited access the HPLC-PDA instrument was only used to obtain the UV-absorption spectra of PHELA’s marker peaks under the same conditions as under HPLC-UV were used.
HPLC-FLD
For HPLC-FLD analysis, the HPLC-system and chromatographic conditions were the same as for HPLC-UV except a programmable fluorescent detector (HP-1046A; made in Germany) with Emission and Excitation wavelengths set at 210 nm and 290 nm, respectively was used instead of the UV detector. The Injection volume was 50µl. Samples for HLPC-FL detection were prepared by the ‘salting-out; method.
GC-MSD Analysis GC-MSD system and conditions
The GC-MSD model was of Agilent Technologies (made in China) equipped with a gas chromatography, a mass selective detector (MSD) and auto-injector of 6890, 5973 and 7883 Network series, respectively. The MSD was equipped with a library of known compounds by which the analytes were compared and, where applicable, identified. The carrier gas was helium and the column was an HP-5 MS cross-linked 5 % Phenyl methyl silicone (15 m x 0.249 mm) and ID 0.25 µm film thickness with the oven temperature set at 300 °C.
Sample preparation for GC-MSD analysis
The samples from TLC, CC and HPLC were evaporated under nitrogen at 47 °C and the residue reconstituted into 5 ml of water, followed by 0.5 ml of 20 % NaOH. The mixture was extracted with 5 ml diethyl ether by shaking gently for 5 minutes on a horizontal shaker. The supernatant was transferred into 5 ml ampoules and evaporated under nitrogen at room temperature. The residue was reconstituted into 100 µl toluene followed by vigorous vortexing, then transferred into a GC-Vial for GC-MSD analysis. The injected volume was 2 μl.
Experimental design
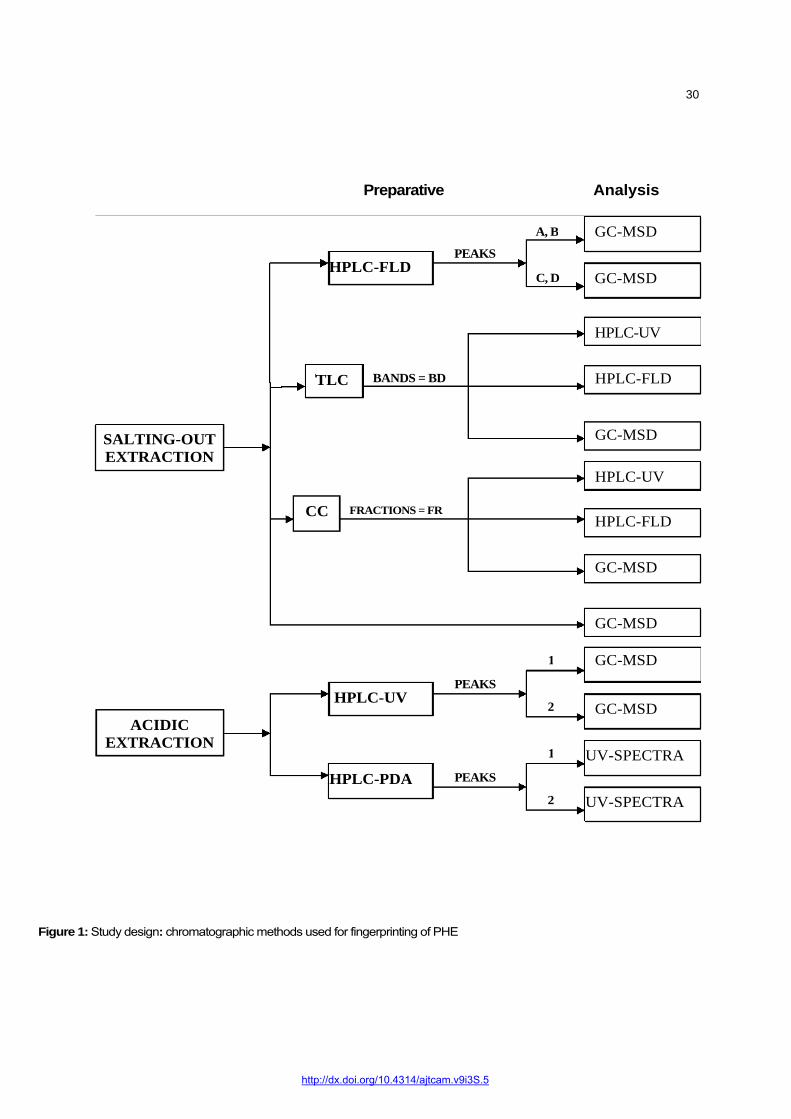
Figure 1 illustrates the study design, i.e., how the different chromatographic techniques were integrated. The TLC, HPLC-UV, HPLC-FLD and GC/MSD fingerprints of the crude PHELA were obtained by extracting PHELA powder either by ‘acidic extraction’ method (n = 5) for HPLC-UV analysis, or by the ‘salting-out’ method for HPLC-FLD and GC-MSD analysis as well as for TLC and CC processes (n = 5). The TLC-Bands were analyzed by HPLC-UV, HPLC-FLD and GC-MSD, and the marker peaks of the crude PHELA were collected and analyzed further. The different CC fractions were collected and analyzed by HPLC-UV, HPLC-FLD and GC-MSD. The most appropriate chromatograms of were selected as chemical fingerprints of the product. The most intense peaks above the baseline were selected as marker peaks.
Comparison of PHELA and a product from Hypericum Perforatum (SJW)
The fore-mentioned fingerprints were used to differentiate PHELA from a preparation of Hypericum perforatum (St John’s Wort; SJW), a traditional herbal medicine commonly used for depression and many other ailments. PHELA (200 mg) and Hypericum Perforatum (200 mg) were extracted and processed as described above. The retention times of major peaks in SJW chromatograms were compared with those of peaks in PHELA fingerprint chromatograms.
Results TLC plus HPLC-UV, HPLC-FLD & GCMSD analysis Analysis of Crude PHELA
Figure 2 shows the TLC, HPLC-UV, HPLC-FLD and GC-MSD fingerprints of crude PHELA. The representative TLC chromatogram exhibited three distinct bands with retention factors of 0.24 for band 1, 0.31 for band 2, 0.92 for band 3, which are within the standardized range of 0.23±0.01, 0.31±0.02, 0.91±0.02, respectively. Of note, bands 1 and 2 were brownish while band 3 was orange in color.
The HPLC-UV chromatogram had two marker peaks at 9.8 (peak 1) and 24 (peak 2) (Fig. 2b), and the established range for these peaks was 9.35±0.71 minutes for peak 1, and 24.5±0.71 for peak 2. In figure 2c, the HPLC-FLD chromatogram had four marker peaks at 12 (peak A), 22.81(peak B), 32.31(peak C) and 38.1 (peak D) minutes, and the standardized range for this fingerprint are 12.2±0.28, 22.3±1.18, 32.96±0.88, 38.32±0.98 minutes, respectively.
The GC-MSD chromatogram of the salted extract of crude PHELA had marker peaks at 2.26, 6.3, 6.74, 7.25, 7.78 and 7.93 minutes (Fig. 2d), and the standard retention times were set at 2.23±0.04, 6.25±0.05, 6.74±0.07, 7.24±0.02, 7.77±0.05 and 8.01±0.09 minutes.
29
http://dx.doi.org/10.4314/ajtcam.v9i3S.5
Preparative Analysis
GC-MSD
A, B
C, D
PEAKSHPLC-FLD
GC-MSD
GC-MSD
GC-MSD
GC-MSD
UV-SPECTRA
UV-SPECTRA 2
HPLC-PDA
1
HPLC-UV
1
2
PEAKS
PEAKS
CC FRACTIONS = FR
HPLC-UV
HPLC-FLD
GC-MSD
HPLC-UV
HPLC-FLD
GC-MSD
TLC
SALTING-OUT EXTRACTION
ACIDIC EXTRACTION
BANDS = BD
Figure 1: Study design: chromatographic methods used for fingerprinting of PHE
30

Band 3
Band 2
Band 1
2c%F
50
40
D
A 30
20
10
0
32.3
14
12.7
87
22.8
05
38.0
86
7.57
8 8.
985 4.
556
5.6
56
g5
9
6.25
5
0 5 10 15 20 25 30 35 mi
FLD1 A, Ex=210, Em=290 (210809A\003-0301.D)
B C
2a
2d
mAU
900
800
700
600
500
400
300
200
100
0
0 5 10 15 20 25
VWD1 A, Wavelength=245 nm (191109B\001-0101.D)
Peak 1
9.83
1
2b Peak 2
24.9
72
mi
Figure 2: (2a) = A TLC chromatogram of PHELA extract. Mobile phase was ethyl acetate: ammonia: methanol (17: 1: 2). Retention factors (RF) were: band 1 = 0.24, band 2 = 0.31 and band 3 = 0.92; (2b) = An HPLC-UV chromatogram of hexane extract of crude PHELA with marker peaks at 9.8 (Peak 1) and 24 (peak 2); (2c) = An HPLC-FLD chromatogram of salted extract of crude PHELA with marker peaks 12 (peak A), 22.81(peak B), 32.31(peak C) and 38.1 (peak D) minutes; (2d) = GC-MSD chromatogram of salted extract of crude PHELA with marker peaks at 6.3, 6.74, 7.25, 7.78 and 7.93 minutes
http://dx.doi.org/10.4314/ajtcam.v9i3S.5
31

http://dx.doi.org/10.4314/ajtcam.v9i3S.5
Figure 3: (3a) = HPLC-UV chromatograms of PHELA TLC-Band 2 with marker peaks at 4.27 and 9 minutes; (3b) = HPLC-FLD chromatograms of PHELA TLC-band 2 with a marker
peak at 6.02 minutes; (3c) = a GC/MSD chromatogram of PHELA TLC-band 2 with marker peaks at 2.26, 5.13, 5.89 and 8.01 minutes
%F
4
3.5
3
2.5
0 5 10 15 20 25 m
VWD1 A, Wavelength=245 nm (020909D\002-0201.D)
9.55
5
4.27
7
mAU
225
200
175
150
125
100
75
50
25
0
3aFLD1 A, Ex=210, Em=290 (070709A\008-0801.D)
2
1.5
0 5 10 15 20 25 30 35 m
6.60
2
3b
3c
32

http://dx.doi.org/10.4314/ajtcam.v9i3S.5
Figure 4: (4a) = HPLC-UV chromatograms of PHELA TLC-Band 3 with marker peaks at 8.462, 17.894 and 23.131 minutes. (4b) = HPLC-FLD chromatograms of PHELA TLC-band 3 with marker peaks at 8, 20, and 33 minutes. (4c) = a GC/MSD chromatogram of PHELA TLC-band 3 with the marker peaks at 2.26, 5.88 and 8.01 minutes
8.45
3
VWD1 A, Wavelength=245 nm (050709A\009-0901.D)
mAU
250
200
150
100
50
00 5 10 15 20 25
4a
17.8
94 21
.131
6.59
1
14.4
31
mi
FLD1 A, Ex=210, Em=290 (070709A\007-0701.D)
%F
6
5
4
3
2
1 0 5 10 15 20 25 30 35 m
4b
7.23
5 8
.33
8 8
.57
6
5.05
5
20.6
92
33.6
98
4c
33

http://dx.doi.org/10.4314/ajtcam.v9i3S.5
Figure 5: (5a and 5b) = the UV-absorption spectra of the two marker peaks (peak 1 and peak 2) in HPLC-UV chromatogram of crude PHELA fig. 1b; and (5c and 5d) = GC-MSD chromatograms of the two marker peaks (peak 1 and peak 2) in fig. 4b.
Peak 1: UV-spectrum 5a
Peak 1: GC/MSD 5c
5b
5dPeak 2: GC/MSD
Peak 1: UV-spectrum
34

35
http://dx.doi.org/10.4314/ajtcam.v9i3S.5
mAU
50
40
30
20
10
00 5 10 15 20 25
VWD1 A, Wavelength=245 nm (101209A\004-
4.30
6
9.75
8
18.6
53
25.0
27
6a
m
6b
6c
Figure 6: (6a) = Column-chromatography (CC) of PHELA colored fraction 17 (CC-FR 17) eluting from column. (6b) = HPLC-UV chromatograms of PHELA CC-FR 17 with marker peaks at 4.3, 9.8, 18.7 and 25 minutes; (6c) = HPLC-FLD chromatograms of PHELA CC-FR 17 with marker peaks at 10 and 20 minutes. (6d) = a GC/MSD chromatogram of
35

http://dx.doi.org/10.4314/ajtcam.v9i3S.5
Figure 7: (7a) = HPLC-UV chromatogram of the crude SJW extract; (7b) = GC/MSD chromatogram of the crude SJW extract; (7c) = HPLC-UV chromatogram of St John’s Wort TLC-band A with marker peaks at 3.874, 4.275, 8.326 and 13.693 minutes; (7d) = HPLC-UV chromatogram of St John’s Wort TLC-band B with marker peaks at 4.268 and 8.317 minutes; (7e) = HPLC-FLD chromatogram of St John’s Wort TLC-band B; (7f) = GC/MSD chromatogram of TLC-Band B of SJW.
mAU
17.5
15
12.5
10
7.5
5
2.5
0
m
4.66
1 4.
023
6.95
4
16.0
82
7.93
1
12.1
58
12.6
20
0 5 10 15 20 25
VWD1 A, Wavelength=245 nm (101209A\002-0201.D)
7b7a
VWD1 A, Wavelength=245 nm (020909D\006-VWD1 A, Wavelength=245 nm (020909D\005-0501.D)
mAU
50
40
30
20
10
0
3.87
4 4.
275mAU
17.5
7d7c
8.32
6
4.
00
4
4.
26
8
15
12.5
10
7.5
13.692
5
2.5
5.71
6 6.
429
8.31
7
0
m m
7e7f
0 5 10 15 20 25 0 5 10 15 20 25
36
Lekhooaetal., Afr J Tradit Complement Altern Med. (2012) 9(5S):27-39
http://dx.doi.org/10.4314/ajtcam.v9i3S.5
Further Analysis of TLC-Bands
Figure 3 shows the HPLC-UV, HPLC-FLD and GCMSD fingerprints of the TLC-band 2. The HPLC-UV chromatogram had two marker peaks at 4.27 and 9 minutes (Fig. 3a) versus the set limits of 4.28±0.02 and 9.55±0.03 minutes, while the HPLC-FLD chromatogram had one marker peak at 6.602 minutes (Fig. 3b), which is within the limit of 6.60±0.01.
In figure 3c, the GC-MSD had six marker peaks at 2.26, 5.13, 5.89 7.98, 8.03 and 8.20 minutes. The respective range for RT of marker peaks was set at 2.25±0.02, 5.13±0.02, 5.87±0.05, 7.90±0.09, 8.01±0.05 and 8.21±0.04 minutes.
Figure 4 shows the HPLC-UV, HPLC-FLD and GCMSD fingerprints for TLC-Band 3. The HPLC-UV chromatogram had four marker peaks at 8.46, 14.43, 17.89 and 23.13 minutes (Fig. 4a), which corresponds to the set range for RT of marker peaks of 8.45±0.04, 14.42±0.02, 17.87±0.08, 21.13±0.32 minutes. The HPLC-FLD chromatogram had three marker peaks at 8, 20, and 33 minutes (Fig. 4b), and the set range for RT of marker peaks was 8.58±0.07, 20.69±0.04, 33.69±0.04 minutes.
The GC-MSD marker peaks were eluted at 2.26, 5.88, 6.35, 7.43, 8.01 and 9.9 minutes (Fig 4c), and set limits were at 2.25±0.02, 5.88±0.03, 6.35±0.11, 7.45±0.13, 8.01±0.08 and 9.86±0.05 minutes. Of note, two of the peaks of band 2 were identified as compound X at 5.13 minutes and compound Y at 8.01 minutes, while for band 3, only one peak at 8.01 minutes was identified as Y. Also, band 2 had a much higher abundance of the compound at 5.88 than band 3 (abundance was 1,400,000 vs. 400,000), which in turn had very high abundance of the compound at 8.01(abundance was 2,800, 000) versus none for band 2.
Comparison of chemical profiles obtained from HPLC and GC
Figure 5 shows the UV-absorption spectra of the two fractions of crude PHELA (peak 1 and peak 2) from HPLC-UV analysis (Fig. 2b), and their respective GC-MSD chromatograms. The two fractions are definitely different in the two aspects. Regarding the GC-MSD, fraction 1 has peaks at 2.50, 5.80, 5.84, 6.26, 8.78 and 9.80 (Fig 5c); while fraction 2 has peaks at 2.50, 5.79, 5.84, 6.26, 7.92 and 9.80 minutes (Fig 5d). This implies that the two fractions differ at the 5th GC-MSD peak which is at 8.78 for fraction1, and at 7.92 for fraction two. The set limits for RT of marker peaks are: Fraction 1; 2.51±0.03, 5.81±0.04, 5.84±0.06, 6.26±0.14, 8.77±0.12 and 9.76±0.14 minutes; Fraction 2; 2.51±0.03, 5.77±0.04, 5.84±0.05, 6.26±0.09, 7.87±0.19 and 9.78±0.12 minutes. Furthermore, fraction 1 had a much higher abundance of the compound at 9.80 than fraction 2 (140,000 vs. 60,000)
The GC-MSD chromatograms of fractions of the four marker peaks of crude PHELA (A, B, C and D) collected from the HPLC-FLD chromatogram were also evaluated (Figures not shown). There were six marker peaks, whereby, except for fraction C that had extra peaks, all the six marker peaks in other fractions (A, B, & D) had similar RT. This was also observed in the standardized RT of marker peaks, i.e., Peak A; 2.51±0.05, 5.81±0.02, 5.84±0.04, 6.26±0.06, 8.76±0.06 and 9.77±0.06 minutes; Peak B; 2.51±0.02, 5.80±0.02, 5.85±0.05, 6.26±0.04, 8.78±0.02, 9.83±0.04 minutes; Peak C; 2.51±0.02, 5.81±0.01, 6.80±0.02, 8.62±0.02, 8.78±0.02, 9.80±0.01 minutes; and Peak D; 2.50±0.03, 5.79±0.01, 5.84±0.01, 6.27±0.01, 8.78±0.00, 9.80±0.01 minutes. Further analysis required inclusion of minor peaks and this lead to recognition of differences between the fractions. Fraction C had peaks at 7.34 and 8.60 minutes, which were not in the other three fractions. Most notable with minor peaks was that each fraction exhibited lack of at least three peaks that were detected in the other fractions (table not shown). Also, fraction C had the highest abundance of the compound at 9.80 minutes (1,800,000), while fraction B had highest abundance of the compound at 2.20 minutes (210,000).
Column-Chromatography plus HPLC-UV, HPLC-FLD & GCMSD analysis
Figure 6 shows PHELA’s colored fraction 17 (CC-FR 17) eluting from the column (Fig. 6a) and the respective HPLC-UV, HPLC-FLD & GCMSD fingerprints (Fig. 6b-d). Only CC-FR-17 was selected because of ease of collection since it was the only coloured fraction. On the HPLC-UV chromatogram, the marker peaks were at 4.3, 9.8, 18.7 and 25 minutes (Fig. 6b), and the standardized limits were 4.25±0.09, 9.78±0.02, 18.65±0.02 and 25.10±0.68 minutes. On the HPLC-FLD chromatogram, the marker peaks were at 4.60, 10.3 and 19.56 minutes and they are within the limits of 4.36±0.16, 9.73±0.38 and 19.34±0.25 minutes. The GC-MSD chromatogram of CC-FR had marker peaks at 2.14, 5.92, 6.63, 6.90, 7.95 and 8.86 minutes, and they are within the standardized range of 2.15±0.03, 5.88±0.02, 6.56±0.09, 6.96±0.12, 8.01±0.04 and 9.81±0.02 minutes.
Comparison of PHELA and SJW Extracts Direct Inspection of the crude products
Visible inspection of the powders of the original products of PHELA and SJW were different in preparation. PHELA was more finely ground than SJW and the two exhibited different color changes when treated with ammonia sulphate in iso-propanol (salting-out method). The solvent of PHELA extract was dark brown, while the SJW extract was light green.
Chromatographic fingerprints of the crude products
37

Lekhooaetal., Afr J Tradit Complement Altern Med. (2012) 9(5S):0-0
http://dx.doi.org/10.4314/ajtcam.v9i3S.5
On the TLC chromatograms the three bands 1, 2, and 3 of PHELA were clearly identified with RF of 0.23, 0.35 and 0.91, respectively, while SJW had two major bands A and B, with RF of 0.46 and 0.98. At the RF of 0.46, band A is out of the range of 0.31± 0.02 for PHELA’s band 2, while the 0.98 for band B is also out of the range for PHELA’s band 3 at 0.91± 0.02. This indicated that different compounds were present in the extracts of PHELA and SJW.
Figures 7a and 7b are the HPLC-UV and GC-MSD chromatograms for crude SJW. SJW has five marker peaks at 4.02, 4.66, 6.96, 12.62 and 16.08 minutes versus only two for PHELA (Fig. 2b). Furthermore, none of the SJW marker peaks coincided with those of PHELA at 9.35±0.71 and 24.5±0.71. On the GC-MSD chromatogram, SJW has six marker peaks at 5.67, 5.85, 6.05, 6.82, 9.33 and 10.04 minutes, and PHELA has six marker peaks at 2.23±0.04, 6.25± 0.05, 6.74±0.07, 7.24±0.02, 7.77± 0.05 and 8.01±0.09 minutes. Therefore, one of the SJW peaks at 6.82 minutes is likely to coincide with PHELA marker peak at 6.74±0.07 minutes. Of note, on the GC/MSD chromatogram, PHELA was characterized by a major peak at 7.93 minutes, while SJW was characterized by a major peak at 10.04.
Comparison of TLC-bands
Figures 7c and 7d illustrate the HPLC-UV chromatograms of TLC-band A and B from St John’s Wort. Here, SJW band A has four marker peaks at 3.87, 4.28, 8.33, and 13.69 minutes, while PHELA band 2 has two marker peaks at 4.28±0.02 and 9.55±0.03 minutes (Fig 3a). Therefore, one of SJW peak at 4.28 minutes is likely to coincide with the marker peak for PHELA band 2 at 4.28±0.02 minutes.
Figures 7e and 7f show the HPLC-FLD and GC-MSD chromatograms of band B of SJW. On the HPLC-FLD chromatogram, SJW band B has two marker peaks at 7.82 and 32 minutes, while PHELA band 3 has three marker peaks 8.58± 0.07, 20.69±0.04 and 33.69±0.04 minutes (Fig 4a). Since the SJW peak at 32 minutes is broad, it is likely to coincide with the marker peaks for PHELA band 3 at 33.69±0.04 minutes. On the GC-MSD chromatogram, SJW band B has six marker peaks at 3.62, 3.95, 4.34, 4.75, 5.80 and 6.26 minutes. PHELA too has six marker peaks at 2.25±0.02, 5.88±0.03, 6.35±0.11, 7.45±0.13, 8.01±0.08 and 9.86±0.05 minutes (Fig 4c). Therefore, only one SJW peak at 6.26 minutes is likely to coincide with one of PHELA marker peak at 6.35±0.11 minutes.
Impression
Table 1 summarizes the major differences between PHELA and SJW. There was no relationship at any point between the two products. The methods successfully differentiated PHELA from SJW’s product.
Discussion
A comprehensive method for identification of PHELA has been developed. It involved inspection and extraction of the product by simple salting-out and/or acidic extraction methods, followed by TLC analysis and preparative column chromatography that were supported by HPLC and GC analysis using UV, fluorescence and MSD detectors, respectively. The method was used successfully to differentiate PHELA from another herbal product made from SJW, thereby illustrating its high potential in fingerprinting of other herbal medicines. Since the SJW product was authentic, a fingerprint for SJW product was also made in the process.
By integrating the simple and high tech-chromatographic techniques, this approach caters for the poor and the rich without loss of quality. In fact, as it were in this study, where the differences between SJW and PHELA were evident with the early tests of inspection and TLC analysis, it is likely that most products can be distinguished by these qualitative tests thereby leaving only a few that deserve further testing to proceed to the more expensive tests. Also, it obviated the use of complex calculations, but this feature can be added by those who can afford because there was considerable shift in the retention times of the marker peaks. Furthermore, the validation of different chromatographic techniques on one standardized extraction process will enable effective monitoring of the finished product in all countries that will use it.
During optimization, an extract with fewer and well separated major peaks was preferred over those with many peaks. For instance, methanol and water extracts had many bands on the TLC such that they could not separate well, while on the HPLC, many peaks would complicate marker-peak evaluation. Interestingly, the ‘salting-out’ method enhanced TLC and fluorescence detection but not UV-detection. On the other hand, Column Chromatography was characterized by a colored band, which, fortunately, made fraction collection easy. The GC-MSD is essential for products that are closely related or with marker peaks of similar retention times. Nevertheless for definitive confirmation the said peaks are as marker peaks (compounds) it is necessary to identify their chemical structure.
In conclusion, a comprehensive method for fingerprinting of PHELA, traditional herbal medicine, has been developed, and this approach can be used to fingerprint other traditional herbal medicine products.
38
Lekhooaetal., Afr J Tradit Complement Altern Med. (2012) 9(5S):0-0 39
http://dx.doi.org/10.4314/ajtcam.v9i3S.5
References
1 Alaerts G, Matthijs N, Smeyers-Verbeke J, Vander Heyden Y, 2007. Chromatographic fingerprint development for herbal extracts: a screening and optimization methodology on monolithic columns. J. Chromatogr. A, 1172:1–8. 1. Eilers PHC, 2004. Parametric Time Warping, Analy. Chem., 76: 404-411. 2. Hoai NN, Dejaegher B, Tistaert C, Thi Hong VN, Rivière C, Chataigné G, Phan Van K, Chau Van M,
QuetinLeclerc J, and Vander Heyden Y., 2009. Development of HPLC fingerprints for Mallotus species extracts and evaluation of the peaks responsible for their antioxidant activity. J. Pharmaceut. Biomed. Analy., 50, 753–763
3. Ji B, Xu QS, Hu YZ, and Vander Heyden Y, 2005. Development, optimization and validation of a fingerprint of Ginkgo bioba extracts by high-performance liquid chromatography, J. Chromatogr. A, 1066: 97–104
4. Kassidas A, MacGregor JF and Taylor PA, 1998. Synchronization of batch trajectories using dynamic time warping. Amer. Instit. Chem. Eng. J., 44: 864–875
5. Liang YZ, Xie P and Chan K, 2004. Quality control of herbal medicines. J. Chromatogr. B, 812: 53–70. 6. Malmquist G, Danielsson R, 1994. Alignment of chromatographic profiles for principal component analysis: a
prerequisite for fingerprinting methods, J. Chromatogr A, 687: 71-88 7. Nielsen NVP, Carstensen JM, Smedsgaard J., 1998. Aligning of
single and multiple wavelength chromatographic profiles for chemometric data analysis using correlation optimised warping, J. Chromatogr A, 805: 17-35.
8. Pravdova V, Walczak B, Massart DL, 2002. A comparison of two algorithms for warping of analytical signals. Analy. Chimica Acta, 456, 77-83.
10. Walczak, B and Wu W, 2005. Fuzzy warping of chromatograms, Chemomtetr. Intell. Lab. Syst, 77, 173. 11. WHO, General Guidelines for Methodologies on Research and Evaluation of Traditional Medicines, Geneva, 2000, p. 1. 12. Xu CJ, Liang YZ, Chau FT and Vander Heyden Y, 2006. Pretreatments of chromatographic fingerprints for quality control of herbal medicines, J. Chromatogr A, 1134, 253–259


![Indigenous Knowledge Systems [Health] Medical Research Council – South Africa Dr Motlalepula G. Matsabisa Portfolio Committee of Science and Technology](https://img.dokumen.tips/doc/110x75/56649db65503460f94aa8942/indigenous-knowledge-systems-health-medical-research-council-south-africa.jpg)
![Dr Motlalepula G. Matsabisa Indigenous Knowledge Systems [Health] Medical Research Council – South Africa Portfolio Committee on Health April 11 th 2004](https://img.dokumen.tips/doc/110x75/56649db65503460f94aa88fb/dr-motlalepula-g-matsabisa-indigenous-knowledge-systems-health-medical-research.jpg)

![[XLS] · Web view45/03 SIPPEL ANDREAS RUDOLF LUDWIG 4604/03 SIRLON STEAKHOUSE & COFFEE BAR 478/96 504/04 SITHOLE MAITE AGNES 4427/01 SITHOLE SIPHO KENNETH & DUDUZILE FLORENCE 4485/03](https://img.dokumen.tips/doc/110x75/5b3485b47f8b9a6b548c3427/xls-web-view4503-sippel-andreas-rudolf-ludwig-460403-sirlon-steakhouse-.jpg)
![Dr Motlalepula G. Matsabisa Indigenous Knowledge Systems [Health]](https://img.dokumen.tips/doc/110x75/56814902550346895db63397/dr-motlalepula-g-matsabisa-indigenous-knowledge-systems-health.jpg)
