Embed Size (px)
Citation preview

71ERIAL ETHIOPIAN GOVairl,riE-UNI-117°D NATIONS SPECIAL FUND PROJZ-CT
PORT ON
UWE\,(' A H RIME '
GENERAL REPORT
UNITED NATIONS SPECIAL FUNDry* FOOD AND AGRICULTURE ORGANIZATION OF THE UNITED NATIONS
I FAOISF: 10IETH
REPORT ON
SURVEY OF THE AWASH RIVER BASIN
Volume I
GENERAL REPORT
FOOD AND AGRICULTURE ORGANIZATION OF THE UNITED NATIONS
UNITED NATIONS SPECIAL FUND ROME 1965

i
TABLE OF CONTENTS
Page
PREFACE 1
CHAPTER I INTRODUCTION AM HISTORICAL ACCOUNT 3
Purpose and Scope of the Project 3Terms of Reference 3Arrangements for Execution 4Kodification of Plan of Operation 6Summary of Field Work 6Follow-up Project 7Training and Fellowships 7Final Report 7
Acknowledgements 8Place Names 8
CHAPTER II SUMMARY OF MAIN CONCLUSIONS AND RECOMMENDATIONS 9
A. CONCLUSIONS 9
Description 9Existing Land Use 9Resources of Land 9Resources of Water 10
Prospective Land Use under Development 12
Water Control 13
Priorities in Planning Water Use 15
The Development of Irrigation 16Estimates of Capital Costs 16Economic Appraisals 19
B. RECOMMENDATIONS 20
Recommendations 20
Hydrology 20
River Control and Training 20
Soil Surveys 20
Agronomic Studies 20
Cropping Patterns and Rotations 21
Regulation of High-value Crops 21
Fertilisers 21
Irrigation Practices and Water Requirements 21
Irrigation Design and Layout 21
Water Control by Storage Reservoirs 22
Power 22
Methods of Operating Irrigation Schemes 22
Economic and Social Considerations and Priorities 22
Phases and Programs of Development 22
Master Plan 23
Reclamation of Swamps 23
Improvement of Grazing Lands and Range Pastures 23
Watershed Management 23
Health Studies 23
Awash Valley Authority 23
-
Page
CHAPTER III DESCRIPTION OF THE AWASH BASIN 24
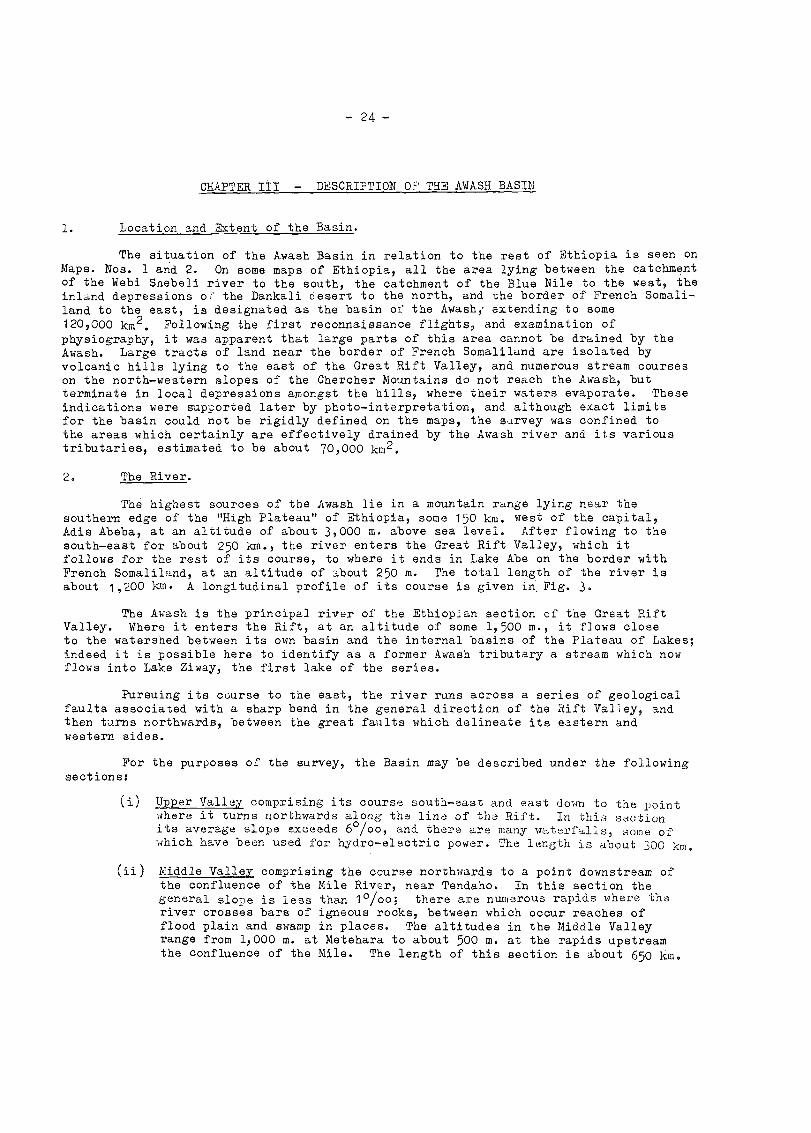
1. Location and Extent of the Basin 242. The River 243. Physical Features 274. Hydrology Factors 285. TraditiOnal Climatic Zones 286. Population 297. Lines of Communication 31
CHAPTER IV OUTLINES OF EXISTING LAND USE 33
1. Patterns of Vegetation 332. Agriculture - General 333. Crops 334. Agriculture in the highlands 365. Agriculture in the lowlands 366. Land tenure and farming units 377. Livestock breeding 378. Ranching methods 379. Value of grasslands 38
10. Living standards of nomadic tribes 3911. Production from the land 39
CHAPTER V SOIL SURVEY AND LAND CLASSIFICATION 40
1. Soil Survey - General 402. General Reconnaissance of Soils 403. Reconnaissance Soil Survey in the Potential
Development areas in the lowlands 424. Semi-detailed Soil Survey - Selection 435. Semi-detailed Soil Survey 446. Conclusions 49
CHAPTER VI PROSPECTIVE LAND USE UNDER DEVELOPMENT 50
1. General considerations 502. Management 503. Crops 514. Other factors 525. Rotations 536. Arboriculture 537. Improvement of grazing lands 568. Irrigation Water Requirements and Water Quality 569. Fertilisers 57
CHAPTER VII CLIMATOLOGY AND HYDROLOGY 58
1. Arrangements 582. Climatology 583. Regional climates in the Awash Basin 624. Hydrology - General 655. Analysis of Normal Annual Flows 656. Comments on Hydrological Factors 687. Flood Characteristics 698. Erosion and Sediment Load 69
In the lowlandsIn the High plateau
114114
Page
CHAPTER VIII WATER CONTROL FOR IRRIGATION AND POWER 74
Need for Development of Water Resources 74Storage Dams - General 74Kesem Dam 75Kebena Dam 80Tendaho Dam 81
Meki Diversion Scheme 86Management of Available Water Resources 89
, 8. Compensation Dam 909. Hydro power Potential of the Upper Basin 92
CHAPTER IX PRIORITIES IN PLANNING WATER USE 93
Areas possible 93Areas possible with various combinations ofwater control schemes 93Factors affecting Relative Priorities ofIrrigation Development 95Stages of Development Proposed 96Master Plan 96
CHAPTER X DEVELOPMENT OF IRRIGATION 98
Present Development 98Principles affecting the Fxtension ofAgricultural Development 96Individual Irrigation Schemes - Upper Valley 99Individual Irrigation Schemes - Middle Valley 99Individual Irrigation Schemes - Lower Plains 100
Stages of Development 101
Comments on Suggested Developments 104
CHAPTER XI ESTIMATES OF COSTS AND ECONOMIC APPRAISALS 105
Estimates of Costs 105
Economic Appraisal 109Comments on the Economic Feasibility Report 110
Incidence of Settlement 112
Planning of Development 112
Master Plan 112Awash Valley Authority 113
CHAPTER XII ADDITIONAL REMARKS 114

APPENDICES
I - Plan of Operations - United Nations Special Fund Projectin Ethiopia - Survey ofm'the Awash River Basin
II - Topography and MappingIII - Feasibility Report on Development of Irrigated Agriculture
and Hydl'oelectric Power in the Awash River Basin, Ethiopia
BIBLIOGRAPHY
iv -
Page
116136
139
175

LIST OF MAPS AND FIGURES
LIST OF TABLES
Land Use in the AWalah River Basin 34Grazing Possibilities of the Grasslands 38General Soil Reconnaissance 42Reconnaissance Soil Survey-Suitability for Irrigation 43Summary Distribution of Soils on the Semi-Detailed soil surveySemi-Detailed Soil Survey - Land Classification for Irrigation 4'Irrigation Water Requirements
d. Some Temperatures Observed in 1962-64 F0Awash Basin - Average Annual Temperatures 61Normal Annual Evaporation Measured by Sunken Tank 62
10a. Normal Annual Evaporation from a Large Deep Reservoir 62Climatic Zones 63Analysis of Annual Runoff. in "Normal" Year 66Estimated Maximum Flood Discharge data for various Pointsalong the Awash 70Awash Basin Sediment Load and Specific Degradation 71
15, Kesem Dam Capacities 77Regulation of Kesem ReservoirKesem Dam - Principal CharacteristicsKebena Dam - Principal Characteristics 81Tendaho Dam - Alternative Capacities 82Tendaho Dam - Evaporation Losses 83Regulation of Tendaho Reservoir 84Tendaho Dam - Principal Characteristics 86Analysis of Awash Flow in Lower Period 90Compensation Reservoir - Capacities and Area IrrigableUpper Valley - Estimated Power Potential 4Maximum Areas which could have been irrigated in 1962/63with Various Schemes for Water Control 94Present and Proposed Stages of Development 96Proposed Development of Irrigation by Projects and Stages 102
Estimated Costs of Storage Dams 106Tentative Forecast of Cost of Kebena Dam 107
Estimate of Costs of Diversion of Meki River 107
Irrigation.Development- Particula.rs af lirks and Estima ts of Cost 108Comparison of Investment Required per Hectare 110Benefit/Cost Ratios for General and High-Value Crops 111
1.
2.
3.
4.
General lilap of Ethiopia
Relief Map of th Awash BasinLongitudinal Profile of the Awash BasinPopulation in the Awash Basin
Page
525-)-,-)
305. Lines of Comunication and Logistic Layout 326. General Map of Soil Survey in the Awash Basin 417. Irrigability Map - Middle Valley (in the folder)8. Irrigability Map - Lower Plains (in the folder)9. Suggested Crop Rotation Schemes - Middle Valley 54
10. Sug,.;ested Crop Rotation Schemes - Lower Plains 5511. Climatological and Hydrological Map of the Awash Basin (in the folder)12. Monthly Flows Recorded at various Gauging Stations 6413. Normal yearly Distribution of Runoff in the Awash Basin 6714. Location of works for Water Control 7615. Sketch Map showing potential Diversion of Meki River 8716. Asayita Delta suggested Layout and typical Distribution
System (in the folder)17. Schematic Irrigation Layouts - Middle Valley (in the folder)18. Schematic Irrigation Layouts - Lower Plains (in the folder)19. Proposed Stages of Development 103

( cubic hectometre
( g gramme(
kg = 1,000g kilogramme
= 100kg quintal
( t = 1,000kg metric tOn
ETHIOPIAN MEASURES
one gasha = 40 ha
one massa = 1/40 ha = 250 m2
one kunna of sorghum, noog = 3.0 kgbarley = 4.0 kgbeans = 5.5 kgwheat, maize,lentils, linseed 6.0 kg
peas, guaya, teffor any otherproduct = 5.0 kg
- vi -
GLOSSARY
UNITS OF MEASURE
METRIC SYSTEM SYMBOLS
one dawula = 20 kunna one Ethiopian Dollar (ES) - 0.40 US Dollar
( A4. = 10-3mm micron ( s; sec second( (
( mm = l03m millimetre ( min minute
( (
( cm = 10-2m centimetre h, hr hour
m'
metre ( d day
( Km = 1,000m kilometre ( °C degree centigrade(
( cm2 = square centimetre ( cal small calorie(
m2 square metre ( mA miliampere
ha = 10,000m2 hectare kV kilovolt
(
km2 = 100 ha square kilometre ( kVA kilovolt-ampere(
( 1 litre ( kW kilowatt( (
m3 = 1,000 1 cubic metre ( GWh =
(
1,000,000 kWhgigawatthour
( hm3 = 1,000,000 m3

PREFACE
The Report on the Survey of the Awash River Basin comprises the followingvolumes:
Volume I General Report
Volume II Soils and Agronomy
Volume III Climatology and Hydrology
Volume IV Water Storage and Power Development
Volume V Irrigation and Water Planning
These volumes are all issued on the authority of the Special Fund of theUnited Nations and the Food and Agriculture Organisation.
Volume I is a comprehensive Report covering concisely all aspects of theSurvey, and setting out the conclusions reached and the recommendations made. It
is wholly prepared by FAO. It embraces and is based on the contents of the othervolumes.
The other volumes were all drafted by the SubContractors, S.O.G.R.E.A.H. ofGrenoble, France, who carried out the main work of the Project. They have sub-sequently been edited by FAO. Each of these volumes in its more specialised fieldprovides and analyses the relevant data, discusses the results, and sets out theconclusions to which they point. The discussions in one volume of course in variousrespects have-reference to and depend upon the discussions in other volumes.
The scope of Volume I, as will be seen from the Table of Contents, coversthe following:
Chapter I Introduction and Historical Account
Chapter II Summary of Main Conclusions and Recommendations
Chapter III Description of the Awash Basin
Chapter IV Outlines of Existing Land Use
Chapter V Soil Survey and Land Classification
Chapter VI Prospective Land Use under Development
Chapter VII Climatology and Hydrology
Gnapter VIII Water Control for Irrigation and Power
Chapter IX Priorities in Planning Water Use
Chapter X Development of Irrigation
Chapter XI Estimates of Costs and Economic Appraisals
Chapter XII' Additional Remarks

2
It will be realised that Volume I covers the whole work of the Survey, andby itself provides a oomprehensive and coordinated statement of what it has achieved.The other volumes are essentially technical volumes, to which reference may be madefor more detailed information on any particular aspect of the work.
3
CHAPTER I INTRODUCTION AND HISTORICAL ACCOUNT
Purpose and Scope of the Project
The Awash River is the only largo stream in Ethiopia which flows towards theeast and north. These which flow towards the west and north-west, including the Baro,the Blue Nile, and the Setit, have larger annual flows, but their courses in Ethiopialie largely in deep valleys and canyons, which are much less accessible, and thus donot present immediate possibilities of developing extensive areas of irrigation,commensurate with their flows. The Awash basin, in contrast, is in many partsrelatively open. It has, over much of its extent, rainfalls which are limited inamount, and are confined to one part of the year. Its lands include considerableareas of fertile soils, which at present are used only to a very limited extent. Manyof the people living within its limits at present have a quite low standard of liveli-hood. The needs for development are obvious, and potentialities clearly exist. It
is not surprising, therefore, that for a number of years considerable interest hasbeen shown in the possibilities of developing both irrigation and hydro-electricpower. In 1960 the Imperial Ethiopian Government asked for the help of the UnitedNations Special FUnd in appraising the resources of the basin in land and water, andtheir potential development for these purposes. The Food and Agriculture Organisationwas designated as Executing Agency. The Plan of'Operation was signed by the threeparties on February 7, 1961, and authorisation to begin operations was given onFebruary 21, 1961.
The Awash Basin in relation to the rest of Ethiopia is shown on Fig. 1 -
General Map.
Terms of Reference
The Project was specified to include the following:
(i) Survey of water resources, based on hydrological and meteorologicalobservations.
(ii) Studies of possibilities of water control by storage and otherwise, andpreparation of a water management plan, taking into account the require-ments of irrigation and hydro-electric power.
(iii) Soil surveys and land classification according to suitability forirrigation:
On reconnaissance standard over about 500,000 ha of agriculturalland and about 200,000 ha of grazing land.
On semi-detailed standard over selected areas totalling some 100,000ha and on detailed standard over areas totalling some 20,000 ha, for
pilot schemes.
(iv) Geological and engineering studies of potential dam sites, with outline
designs and estimates.
(v) Survey of erosion and sedimentations
(vi) Agronomic studies of land use, present and future.
(vii) Aerial photography over some 30,000 km2', and contour mapping, particularly
of potential reservoir areas.
(viii) Training of Ethiopian counterpart staff.
Neither economic nor sociological investigations were included in the original
Terms of Reference. However, preliminary eponomic appraisals of potential developments
were ultimately made, and are briefly described in this Report.
The Plan of Operation, and the subsequent amendments thereof, are attached as
Appendix No. 1 to this Volume.
4
3. Arrangements for Execution
The Plan of Operation specified that the project .7ihou1d be executed by sub-
contract. The following contracts were let:
On February 23, 1961 to Hunting Surveys Ltd., London, for the aerialphotography required.
On July 13, 1961 to SOGREAE (Societ6 Grenobloise d'Etudes et eApplicationsHydrauliques), Grenoble, for the provision of specialist staff and theexecation of the main work of the survey.
On September 13, 1962 to Ing. Giovanni Rodio S.A. Milano for test boringson the sites of prospective dams.
The Project M.inager, Mr. M. Reklewski, was appointed on August 10, 1961 andarrived at Adis Abeba, his duty station, on August 13. 1961. The following stafffrom FAO served as Administrativo Officers:
Mr. Ch. de Beck Lambly December 3, 1961 - June 30, 1963Mr. K. Danillowicz July 1, 1963 - Juno 30, 1964Mr. G. Abolafio July 1, 1964 - December 31, 1964
Field Operations for aerial surveys were supervised by Mr. H. Williams, chiefof Hunting Surveys office in Nairobi. Processing and preparation of mosaics weredone in Hunting Survey's office in Great Britain.
The main part of the general work of the survey was done by SOGREAH in thefield and at their headquarters ih Grenoble, under the direction of Mr. P.M. Lafont,Water Planning and Irrigation Engineer. The names and services of the specialistsprovided by SOGREAH are shown on page 5.
The interpretal.ion of the results of the test borings made by G. Rodio S.A.was the responsibility of specialists of SOGTIFAH.
In September-December 1964, Special Fund sent two consultants to-ascertainin close collaboration with the Project Manager the economic feasibility of thedevelopment schemes recommended as the result of the technical studies. These were:
Dr. L.G. AllbaughMr. R.M. Arbuckle
Government Counterpart staff, provided through the Awash Valley Authority,were under the control of the Co-Managers, as follows
H.E. Dr. Haile Georghis August 1961 - April 1962April 1962 - December 1964Ato Getachew Wolde Emmanuel
Other counterpart staff included:
4 Soils and agricultural technicians.5 Hydrological technicians.1 Surveyor and 3 assistant surveyors.1 Draftsman.
12 Assistant hydrometriets and computers.109 Observers for hydrological and meteorological stations.8 Clerical staff.1 Mechanic and 14 Drivers.6 Watchmen.
1111111=1 Lil
El1111111111111111INUMMININ.......mommmonliellEINIMICE1 crararamilralran2 rt laran cc cc
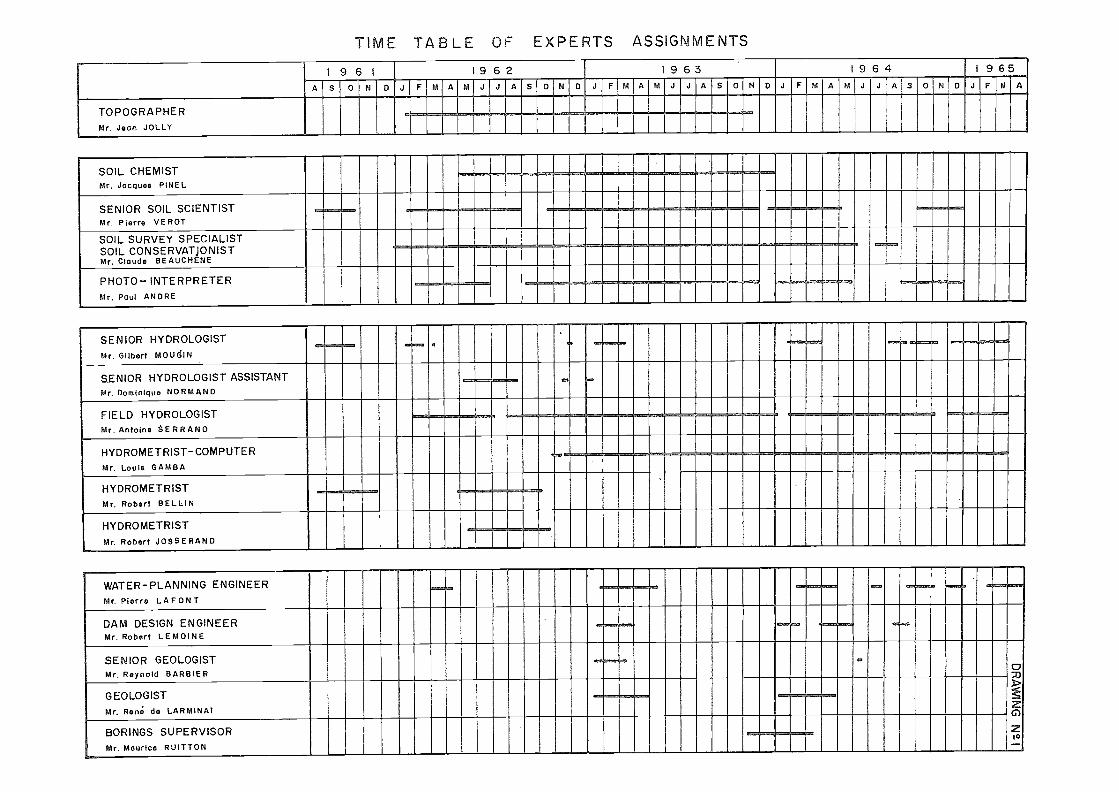
SOIL CHEMISTMr. Jacques PINEL
SENIOR SOIL SCIENTISTMr, Pierro VEROT
SOIL SURVEY SPECIALISTSOIL CONSERVATJONISTMr. Claude BEAUCHENE
PHOTO- INTERPRETERMr. Paul ANDRE
ill Ili iIgm. 61 inpmmum gummiliiimilI
1111111111111111111ffainCalkiliimill
11ILail111111111111NOMUNINIIIIIIIIIIIIIMI
SENIOR HYDROLOGISTMr. Gilbert MOUdIN
SENIOR HYDROLOGIST ASSISTANTMr. Dominique NORMAND
FIELD HYDROLOGISTMr, Antoin SERRANO
HYDROMETRIST-COMPUTERMr. Louie GAMBA
HYDROMETRISTMr. Robert BELLIN
HYDROMETRISTMr. Robert JOSSERAND
WATER-PLANNING ENGINEERMr. Pierre LAFONT
DAM DESIGN ENGINEERMr. Robert LEMOINE
SENIOR GEOLOGISTMr. Reynold BARBIER
GEOLOGISTMr. Rene de LARMINAT
BORINGS SUPERVISORMr. Maurice RUITTON
TIME TABLE OF EXPERTS ASSIGNMENTS
o33
196 I 1962 I963 1964 965
IOU o 111 D 111111013011111110 o El ° CHEMICIONCIU 0111 D FAUCIDEMMIII 0 DD I CITOPOGRAPHERM r. Jean JOLLY
Erian _railiwIn

Modification of Plan of Operation
After preliminary reconnaissances in August and September 1961, and subsequentdiscussions beteen Government, FAO, and Special Fund, it was agreed that to coverincreases required in aerial photography and in the number of river gauging stations,the provision of access tracks to remote sites, the making of exploratory 'borings,to investigate foundation conditions at potential dam sites, etc., the contributionof the Special Fund should be increased by US 3 90,000, and that of Government byUS $ 50,000. The necessary amendment to the Plan of Operation was signed inSeptember 1962.
Subsequently it was agreed that prospective savings on counterpart staff couldbe used to meet increased expenditure on the running and maintenance of vehicles, andcertain other local costs.
Summary of Field Work. The following facts and figures indicate the natureand scope of the work done in the field:
(0 Access and Communications. 240 Km. of tracks and 2 bridges were built,and 2 ferry boats installed. 5 airstrips were prepared and 2 existingstrips were repaired. 4 radio telephone sets were installed.
Installations. Headquarters for the project, with store and workshopwas arranged. 2 field bases with offices and living quarters were setup, and 6 field shelters. A soil and water laboratory was installed atthe Forestry Institute of the Haile Selassie I University. 30 rivergauging stations, 8 meteorological stations, and 95 raingauges wereinstalled and put into use.
Transport. 1,760,000 Km. in all were run by 19 vehicles under the project,at an average cost of US 3 0.07 per Km. 272 hours were flown by hiredaircraft, planes and helicopters.
Aerial Photography. This was completed in two periods, in May andNovember 1961. Mosaics were made available by May 1962.
Soil Survey. When modification of the Plan of Operation was underdiscussion in March 1962, it was agreed that in place of the 20,000 haof detailed soil survey specified therein, an additional 50,000 ha shouldbe surveyed on semidetailed standard, to bring the total to 150,000 ha.Field work on soils was completed by July 1963, and two interim reports,on the areas suitable for irrigation in the Middle Valley and in theLower Plains, were submitted in September 1963.
(v Hydrology and (Climatology. About 2,500 flow measurements were made,about 2,200 water samples were tested for silt content. The great partof the hydrometric and climatological network was made operational in6-ty64ecourse of 1962. Regular observations were made during 1962/63 and 193hydrological cycles and lasted till October 31st 1964. A programme forcontinuation of recording was prepared and submitted to Awash ValleyAuthority.
(vii) Appraisal of river hydraulics in the Delta area. Because of very highcost of establishing gauging stations in the deltaic section of the riverand as detailed topographical works would have been needed for anymeaningful hydrological studies in these regions, it was decided inMarch 1962 to exclude the unstable river section from the programme ofsystematic flow measurements. At the P-ame time it was decided to proceed

to an expert appraisal of river's behaviour in the Delta area.The appraisal was carried out in March 1963 and the relevantreport submitted to the Government in September 1963.
Test BorinFs. These were made at the prospective sites for Kesem andTendaho Dams between November 1963 and March 1964, in accordance with therecommendations of the geologist.
Health Conditions. These, with special regard to bilharziasis, wereinvestigated in 1964.by specialists from W.H.O. and by Dr. Aklilu-Lemma,parasitologist in the Haile Solaseis I University.
Field operations ended on October 31, 1964, and the Project Manager leftEthiopia on December 15, 1964 to take part with the sub-contractors in the preparationof the Final Report at Grenoble and F.A.O. headquarters in Rome.
Follow-up Project.
In April 1964, the Government approached Special Fund about a possible follow-up project, for the preparation of irrigation layouts and dam designs in the AwashBasin. Government also asked for an appraisal of the economic feasibility of schemesproposed as a result of the survey. To this the Special Fund agreed, and the appraisalwas made in September-December 1964; it should be noted that for this incompletefigures of estimated costs had to be used, which later in some cases had to be revised.The formal request for a follow-up project was submitted by Government to Special Fundin November 1964.
Subsequently it was agreed between the Government and the Special Fund, thatthe reinforcement of the Authority responsible for development of the Awash RiverBasin was necessary before the initiation of a second phase of surveys. In 1965an Interim Project aimed at Assistance in the strengthening of the Awash ValleyAuthority was approved.
Training and Fellowships.
Although no specific provisions for fellowships had been made in the Plan of
Operation, it was found possible, with the help of SOGREAH, to arrange for 6
scholarships of 6 months each, under the bilateral cooperation scheme of the French
Government. 6 technicians, 3 ir soils and 3 in hydrology, received training at
Grenoble.
An important part of the Project was in-service training for Government counter-
part staff, in soil survey, and laboratory work, hydrology and climatology, topographi-
cal srvey and photo-interpretation. It was not in all cases possible to recruit
:imitable qualified trainees in sufficient numbers.
Final Report.
The Final Report as now presented by F.A.O. consists of the following volumes:
Volume IVolume IIVolume IIIVolume IVVolume V
7
General RenortSoils and AgronomyHydrology and ClimatologyWater Storage and Power DevelopmentIrrigation and Water Planning.

- 8 -
Acknowledgements.
Grateful acknowledgement is made of the help and cooperation received frommany branches and officials of the Government and other authorities, as well as from
firms and private individuals. In particular, collaboration from the followingDepartments and Institutes was appreciated:
Ministry of Agriculture, particularly the Statistic Department,Animal Husbandry Department (Mission Vétérinaire Frangaise), andResearch Department.
Ministry of Public Works and Communications, particularlyWater Resources Department.
Imperial Highways AuthorityImperial Ethiopian Mapping and Geography InstituteEthiopian Electric Light and Power AuthorityCentral Statistical OfficeHalle Selassie I dniversity (Forestry Institute)Institut Pasteur d'EthiopieCivil Aviation Department (National Meteorological Department)Ethiopian AirlinesChemin de Fer FrancoEthiopienProvincial Governors and officers 5 Police etc.
Place Names.
The spelling of place names used in this Report follows wherever possible thatintroduced recently by the Imperial Institute of Mapping and Geography. This in somecases may differ from the spelling hitherto commonly used, but no difficulties should
arise, because the differences are not large.

Class IClass IIClass IIIClass IV
Class V
Class VI
See Fig. No. 6.
9
CHAPTER II - SUMMARY OF MAIN CONCLUSIONS AND RECOMMENDATIONS
A. CONCLUSIONS
Description.
Seo Figs Nos. 1, 2, 5, 6, 8, 14, and Chapter III. The Awash Basin, in area some701000 km2, lies between the latitudes of 80 N and 12° N, on the southern and easternsides of the central plateau of Ethiopia. The greater part of the Basin lies geolo-gically within the Great Rift Valley. In elevation the Basin ranges from 3,000 mto 250 m above sea level. Its lower parts open out to the North and East, towardsthe Red Sea, but the river does not reach'the sea, ending in the large depressionof Lake Abe, where its remaining waters are lost by evaporation and seepage.
The Basin may conveniently be described as consisting of the followingparts
The Upper Basin from the headwaters down to Koka dam.The Upper Valley, from the Koka dam to Metehara,The Middle Valley, from Metehara to Tendaho,The Lower Plains, from Tendaho to Lake Abe.
The Basin includes the capital of Ethiopia) Adis Abeba, with a populationof about 4501000, and several other towns, all relatively much smaller. On theplateau and in the Upper Valley the people are mostly Christian; outside the townsthey are largely agricultural, with a proportion engaged in commerce and, recently,in industry. The rest of the Basin, including all the lower lands, is relativelythinly populated, mostly by Moslem tribes, largely nomadic and pastoralists.
There pass through or across the Basin, the railway between Adis Abeba andthe port of Djibouti and, further north, the main road from Adis Abeba to the portof Aseb and Asmera. A new main road from Mis Abeba to Aseb is projected, and thiswould probably be aligned down the right bank.of the Awash, at least beyond Awashstation on the railway; if so, it would pass near to potential areas of irrigationin the Basin, and would greatly facilitate their development. (See Figs 1 and 5).
Existing Land Use.
On the plateau lands and in the Upper Valley, large tracks of lands of goodquality are already cultivated with rain-grown crops. In the Upper Valley are alsocomo areas under irrigation, notably the plantation of 6,000 ha at Wenji, growingsugarcane. In the Middle Valley are irrigated areas totalling some 1500 hal and inthe Lower Plains, cotton plantations totalling some 4,500 ha at Dubti and Dit Bahriare under irrigation, with several thousand ha in Asayita delta used to growcrops afternatural flooding. (See also Figs 14).
Resources of Land.
The Upper Valley offers relatively little additional land for development,beyond that now cultivated. Elsewhere in the Basin, as the result of reconnaissancesoil survey over some 2 million ha, followed by a semi-detailed soil survey onselected area totalling some 502,000 ha, the lands were classified according to theirsuitability for irrigation, in the following classes
Good irrigable land.Moderately good irrigable land.Marginal irrigable land.Land unsuitable for irrigation, :except under specialconditions.Land of which the suitability for irrigation isundetermined.Land permanently unsuitable for irrigation.

Upper Basin -Middle Valley -Middle Valley -Lower Plains --
0f the 502,000 ha covered by the semi-detailed survey, the classification-was as follows
Land Classification
Thus there are 183,600 ha of lands in Classes II and III; in addition, somelands mainly in the Lower Plains placed in Class IV because of liability to floodingare also worthy of development, if effective control of the flooding is provided.It is safe to 'say that some 200,000 ha of suitable land can be made available forirrigation. (See Figs 7 and 8 - in folder).
4. Resources of Water.
i) Climate. See Chapter VII.
(a) Rainfall. This is shown on Map No. 11 in thE, olr. Typical normalannual totals aro as follows
Millimetres
above Koka Dam 1000Koka to Hertale 850Hertale to Tendaho 610Tendaho to Lake Abe 215
There are two rainy seasons in the year, the lesser rains from March toMay, and the main rains from July to September, which provide naarly 90% ofthe total annual run-off in the streams. The rainfall minimum in the twoseasons, in June, is more pronounced in the drier northern part of the Basin.From October to February, hardly any rain falls.
Rainfalls vary widely from year to year in total amount; in general theymay range from 505 to 1505 of the mean figure. Individual rainstorms areusually fairly brief, and do not cover very large areas.
Middle Lower Totals (-4-Class Valley Plains
(ha) (ha) (ha)
I - -
II 56,600 30,000 36,600 17
III 58,000 39,000 97,000 19
iv 40,100 33,000 73,100 15
IT 9,900 15,000 24,900 5
vz 97,400 123,000 220,400 44
262,000 240,000 502,000 loo

(b) Temperatures. Some ranges of temperatures which may occur are indicatedby the following figures, observed during 1962-64
oCentigrade
Temperatures vary with the season, and also with altitude and aridity.In certain parts of the Basin, sheltered from South Nest winds,"Foehn" effects may raise the tomerature locally.
(c) Winds. During the dry season from October to February, the prevailingwinds are "anticyclone" winds, mainly from the North East. At other times of tthe,year, winds.are variable in direction and strength, but in general theupper rain-bearing air currents come from the South West.
ii) Hydrology. See Chapter VII and Map No. 13.
Except for a few fairly long records, such as that for the gauge atAwash railway station, observations of river flows are available onlyfor 1962-64. It has been possible to extend the period for some stationsby correlation with longer records of rainfalls. In this way have beenprepared estimates of flows at various points in the Basin, for a "normal"year. These estimates must however be taken as tentative and approximate,and subject to adjustment in the future, as more data of actual observationsbecome availi.,ble.
Flows from the Upper Valley, are already regulated by the operation ofKoka Reservoir (Lake Gelilea), so far primarily in order to generatehydro-electric power most effectively. Only since this reservoir came intooperation- in 1961 has the flow of the Awash become permanent throughoutthe year; previously it dried up in its lower course in the dry season.Subject to this regulation at Koka, the following are the resulting presentestimated annual total flows at various points :
hm3
Inflow to Lake Gelilea 1895less losses from reservoir (evaporation
and leakage) 695
Outflow from Lake Gelilea 1200Flow at Awash Station 2460Flow at Hertale 2840Flow at Dubti 3490
Some maximum rates of flood flows with probabilities of occurrenceestimated to be less than once in 1000 years are expected to be asfollows :
Maxima Minima
Adis Abeba 28 6Koka 34 7Metehara 39 7Gewani 42 8Tendaho 46 6
12
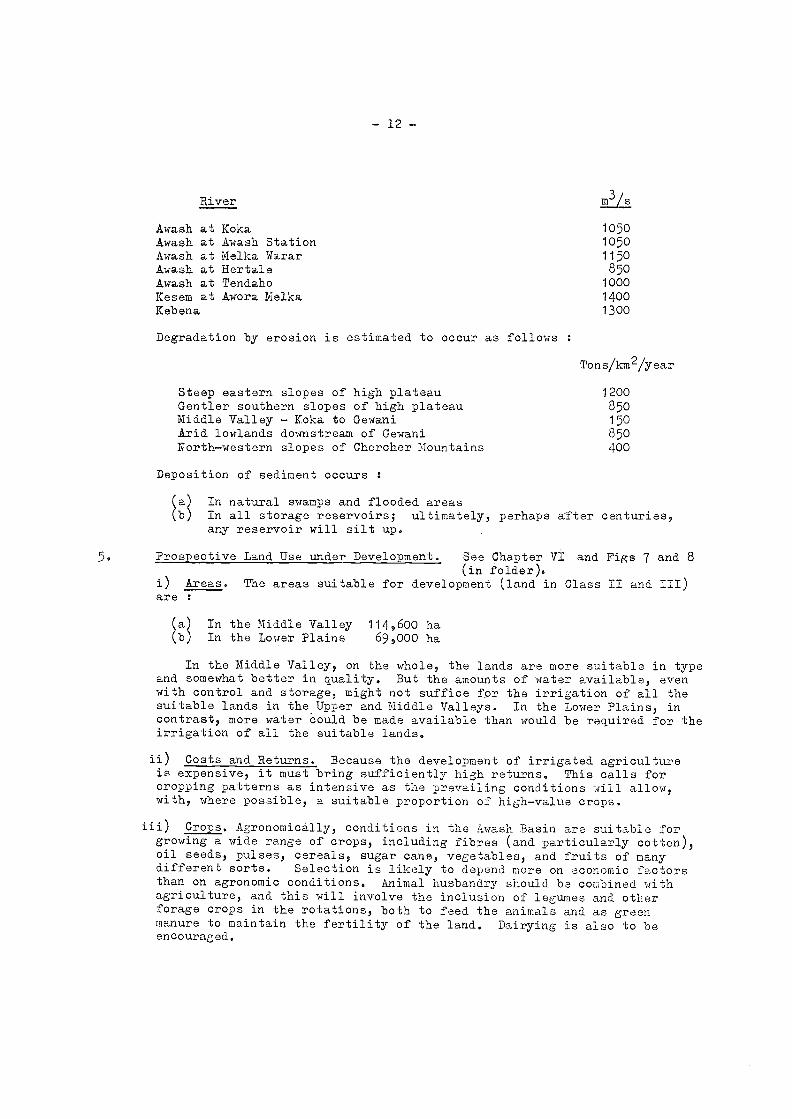
River m3/s
Awash at Koka 1050Awash at Awash Station 1050Awash at Melka Warar 1150Awash at Hertale 850Awash at Tendaho 1000Kesem at Awora Melka 1400Kebena 1300
Degradation by erosion is estimated to occur as follows
Tons/km2/year
Steep eastern slopes of high plateau 1200Gentler southern slopes of high plateau 850Middle Valley Koka to Gewani 150Arid lowlands downstream of Gewani 850Northwestern slopes of Chercher Mountains 400
Deposition of sediment occurs
In natural swamps and flooded areasb In all storage reservoirs; ultimately, perhaps after centuries,
any reservoir will silt up.
5. Prospective Land Use under Development. See Chapter VI and Figs 7 and 8(in folder).
Areas. The areas suitable for development (land in Class II and III)are
,a.) In the Middle Valley 114,600 hab) In the Lower Plains 69,000 ha
In the Middle Valley, on the whole, the lands are more suitable in typeand somewhat better in quality. But the amounts of water available, evenwith control and storage, might not suffice for the irrigation of all thesuitable lands in the Upper and Middle Valleys. In the Lower Plains, incontrast, more water *could be nade available than would be required for theirrigation of all the suitable lands.
Costs and Returns. Because the development of irrigated agricultureis expensive, it must bring sufficiently high returns. This calls forcropping patterns as intensive as the prevailing conditions will allow,with, where possible, a suitable proportion of highvalue crops.
Crops. Agronomically, conditions in the Awash Basin are suitable forgrowing a wide range of crops, including fibres (and particularly cotton),oil seeds, pulses, cereals, sugar cane, vegetables, and fruits of manydifferent sorts. Selection is likely to depend more on economic factorsthan on agronomic conditions. Animal husbandry should be combined withagriculture, and this will involve the inclusion of legumes and otherforage crops in the rotations, both to feed the animals and as greenmanure to maintain the fertility of the land. Dairying is also to beencouraEed.
- 13 -
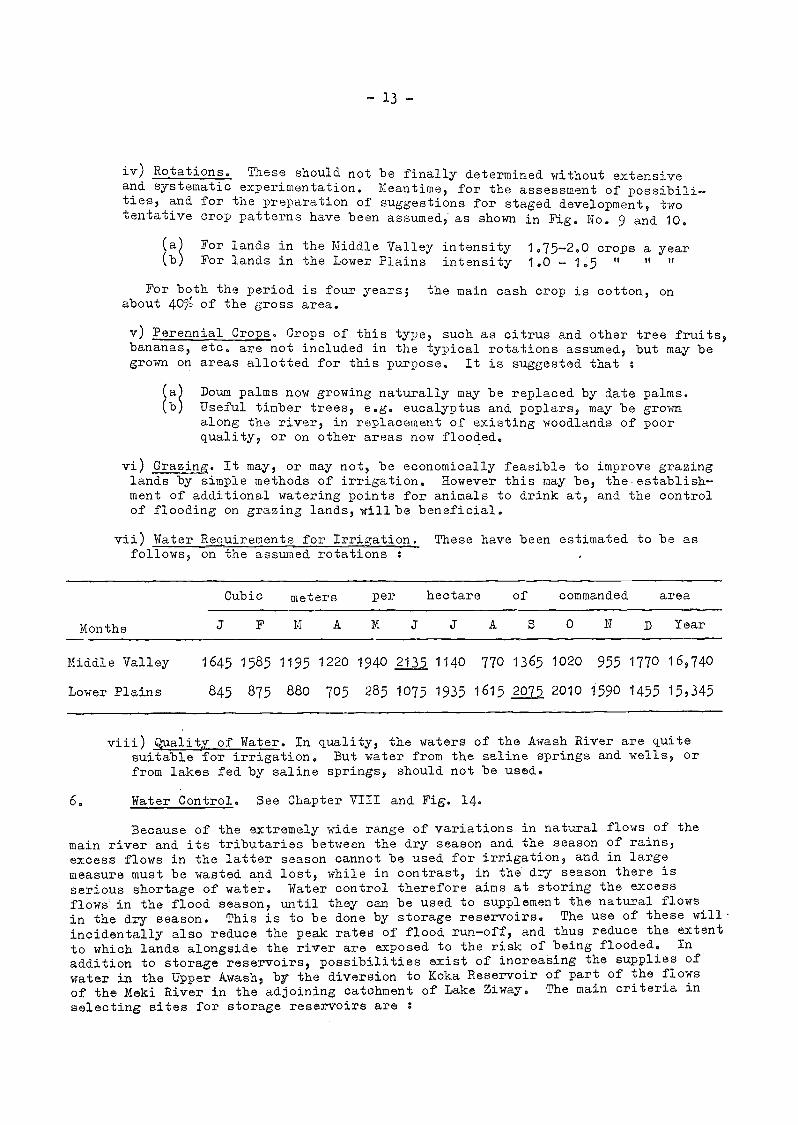
Rotations. These should not be finally determined without extensiveand systematic experimentation. Meantime, for the assessment of possibili-ties, and for the preparation of suggestions for staged development, twotentative crop patterns have been assumed, as shown in Fig. No. 9 and 10.
For lands in the Middle Valley intensity 1.75-2.0 crops a yearb For lands in the Lower Plains intensity 1.0 - 1.5 " "
For both the period is four years; the main cash crop is cotton, onabout 40% of the dross area.
Perennial Crops. Crops of this type, such as citrus and other tree fruits,bananas, etc. are not included in the typical rotations assumed, but may begrown on areas allotted for this purpose. It is suggested that
Doum palms now growing naturally may be replaced by date palms.b Useful timber trees, e.g. eucalyptus and poplars, may be grown
along the river, in replacement of existing woodlands of poorquality, or on other areas now flooded.
Grazing. It may/ or may not, be economically feasible to improve grazinglands by simple methods of irrigation. However this may be, the establish-ment of additional watering points for animals to drink at, and the controlof flooding on grazing lands, will be beneficial.
Water Requirements for Irrigation. These have been estimated to be asfollows, on the assumed rotations
Quality of Water. In quality, the waters of the Awash River are quitesuitable for irrigation. But water from the saline springs and wells, orfrom lakes fed by saline springs, should not be used.
6. Water Control. See Chapter VIII and Fig. 14.
Because of the extremely wide range of variations in natural flows of themain river and its tributaries between the dry season and the season of rains,excess flows in the latter season cannot be used for irrigation, and in large
measure must be wasted and lost, while in contrast, in the dry season there is
serious shortage of water. Water control therefore aims at storing the excessflows in the flood season, until they can be used to supplement the natural flows
in the dry season. This is to be done by storage reservoirs. The use of these will.
incidentally also reduce the peak rates of flood run-off; and thus reduce the extent
to which lands alongside the river are axposed to the risk of being flooded. In
addition to storage reservoirs, possibilities exist of increasing the supplies of
water in the Upper Awash; by the diversion to Koka Reservoir of part of the flows
of the Meki River in the adjoining catchment of Lake Ziway. The main criteria in
selecting sites for storage reservoirs are
Middle Valley 1645 1585 1195 1220 1940 2135, 1140 770 1365 1020 955 1770 16,740
Lower Plains 845 875 880 705 285 1075 1935 1615 2075 2010 1590 1455 15,345
Cubic meters per hectare of commanded area
Months A M J J A S 0 N D Year

- 14-
(a) The prime purpose of storage is the supply and regulation of water forirrigation, with the generation of power as an important but secondarypurposeStorage of water should submerge cultivated lands as little as possible:
c Reservoirs should be reasonably near to the lands irrigable from them.
The projects for the supply and control of water on the Awash, existing ornow proposed, may be summarized as follows
Koka Reservoir - in use since 1961. Net available capacity 1,660 hm3,Height of concrete dam 42 m. Primary purpose is the generation of power.Maximum rate of outflow through turbines 3.6 hm3/day. Normal annual outflowabout 1200 hm3. Losses by evaporation about 315 hm3/year, and by percolationabout 380 hm3/year. The last is serious, and calls for investigation to finda remedy. (See Fig. 14).
Meki River Diversion. Proposed, found feasible, to. supply some200 hm3 annually via the Dubeta River into Lake Gelilea. This, if used onlyfor irrigation, might suffice for about 40,000 ha. Further technical andeconomic investigation i.e necessary, including the effects of diversion onthe catchment of the Lake Ziway. (See Fig. 15).
Compensation Reservoir. If the Meki Diversion is not feasible, the out-flows from Lake Gelilea, suited to power production, can be regulated so asto suit the requirements of irrigation, month by montb, by a compensationreservoir, of capacity tentatively estimated at 50 hm3. A site near AwashStation may be suitable to provide this, by a dato some 40 m in height.Investigationr of this and other sites will be required.
If it can be arranged,after construction of hydro power plants on otherrivers,that the releases of water from Lake Gelilea can be adjusted to suitirrigation requirements more nearly, it may not be necessary to construct acompensation reservoir. (See Fig. 14).
Kesem Reservoir. Proposed to have a gross capacity of 370 hml with adepth of water of 69 m. This would provide a usable amount sufficient toirrigate some 22,000 ha, and to generate about 52 GWh of power annually.Loss of water by evaporation would be about 35 hm3 per year. Some testdrilling of the foundation was done, and it appears that the site is suita-ble for a rockfill dam. Grouting to reduce losses by percolation would benecessary. (See Fig. 14)
Tendaho Reservoir. Proposed to have a gross capacity of 970 hm3 witha depth of water of 32 m. This would provide a usable amount of watersufficient to irrigate some 70,000 ha, and to generate about 91 Mill of powerannually. Loss of water by evaporation would be heavy, about 294 hm3annually. Some test drilling of the foundation was done, arad, it appearsthat here also a rockfill dam would be a suitable type. Grouting to reducepercolation losses would be necessary. (See Fig. 14)
Power Stations. At Koka Dam, Awash I power station generates about110 GWh annually. Further downstream, Awash II and Awash III stations arenow under construction; they also will use the flows released from LakeGelilea, and are expected to generate together some 364 Wheach year.Still further down, but still in the Upper Valley, Awash IV, of capacitysimilar to that of Awash II or Awash III, is in prospect. The ultimate pos-sibilities of power generation may total some 950 GWh annually. (See Fig.14
See also Fig. 19.
- 15 -
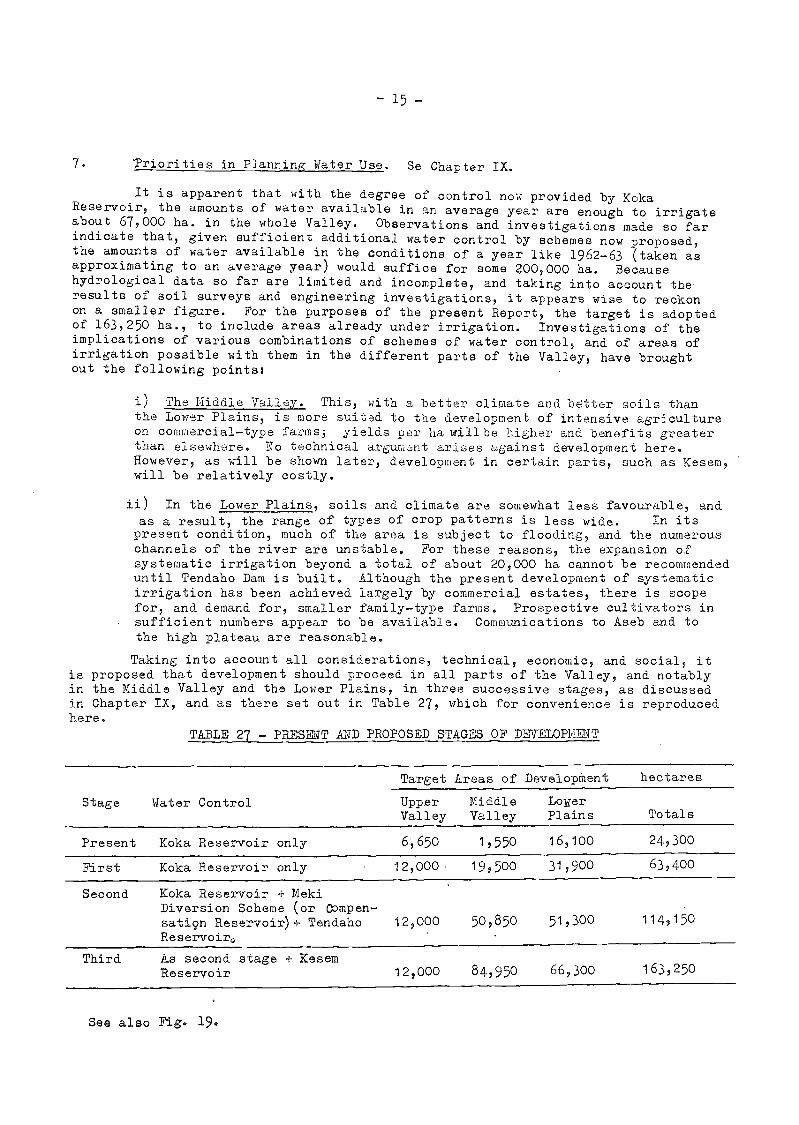
7 Priorities in Planning Water Use. Se Chapter IX.
It is apparent that with the degree of control now provided by KokaReservoir, the amounts of water available in an average year are enough to irrigateabout 67,000 ha. in the whole Valley. Observations and investigations made so farindicate that, given sufficient additional water control by schemes now proposed,the amounts of water available in the conditions of a year like 1962-63 (taken asapproximating to an average year) would suffice for some 200,000 ha. Becausehydrological data so far are limited and incomplete, and taking into account theresults of soil surveys and engineering investigations, it appears wise to reckonon a smaller figure. For the purposes of the present Report, the target is adoptedof 163,250 ha., to include areas already under irrigation. Investigations of theimplications of various combinations of schemes of water control, and of areas ofirrigation possible with them in the different parts of the Valley, have broughtout the following points:
The Niddie Valley. This, with a better climate and better soils thanthe Lower Plains, is more suited to the development of intensive agricultureon commercial-type farms; yields per ha willbe higher and benefits greaterthan elsewhere. No technical argument arises against development here.However, as will be shown later, development in certain parts, such as Kesem,will be relatively costly.
In the Lower Plains, soils and climate are somewhat less favourable, andas a result, the range of types of crop patterns is less wide. In itspresent condition, much of the area is subject to flooding, and the numerouschannels of the river are unstable, For these reasons, the expansion ofsystematic irrigation beyond a total of about 20,000 ha cannot be recommendeduntil Tendaho Dam is built. Although the present development of systematicirrigation has been achieved largely by commercial estates, there is scopefor, and demand for, smaller family-type farms. Prospective cultivators insufficient numbers appear to be available. Communications to Aseb and tothe high plateau are reasonable.
Taking into account all considerations, technical, economic, and social, itis proposed that development should proceed in all parts of the Valley, and notablyin the Middle Valley and the Lower Plains, in three successive stages, as discussedin Chapter IX, and as there set out in Table 27, which for convenience is reproducedhere.
TABLE 2/ - PRESENT AND PROPOSED STAGES OF DEVELOPMENT
Stage Water Control
Target Areas of Development hectares
UpperValley
MiddleValley
LoverPlains Totals
Present Koka Reservoir only 6,650 1,550 16,100 24,300
First Koka Reservoir only 12,000 19,500 31,900 63,400
Second Koka Reservoir + MekiDiversion Scheme (or mpen-satip Reservoir)+ TendahoReservoiro
12,000 50,850 51,300 114,150
Third As second stage + KesemReservoir 12,000 84,950 66,300 163,250

- 16 -
It will be seen that Stage I, up to a total of some 63,000 ha, can be achievedwith the water control now provided by Koka Reservoir. Stage II will involve theconstruction of either the Meki Diversion Scheme or the Compensation Reservoir,and of Tendaho Dam; it will then be possible to extend irrigation to a total ofsome 114,150 ha, of which about 51,000 ha would be in the Middle Valley and aboutthe same amount in the Lower Plains. Stage III would involve the construction ofthe Kesem Dam; it would then be possible to extend the total to about 163,250 ha.
To ensure the orderly and effective progress of this development, the wholeof it from the start should be carried through in accordance with a "master plan"which, flexible in application and in design of details, should ensure that nothingdone in the earlier stages will be inconsistent with the most effective developmentof the later stages. This plan should be adjusted as soon as the necessary furthersurveys and investigations can be made.
The Development of Irrigation. See Chapter X.
In order to make the most advantageous use of the available water, thedevelopment of new areas should be planned to use the best available and mostaccessible lands, and on them to ensure the optimum combination of economy, ef-fectiveness, and reliability in watering and in cultivation. Gravity irrigationis preferable wherever possible, though pumping may be more suitable in certainareas. In general, unlined canals are proposed, except where evidence indicatesthat percolation losses would be too heavy. Standardized layouts are proposedfor canalisation and field plots. Drainage systems are proposed, expected to besufficient to ensure that no area remains submerged by storms for more than 24 hoursmore often than once in two years. Where necessary, protection against floodingfrom the river or tributaries is to be given by dykes.
Particulars of the various individual schemes proposed to be included inthe different stages of the programme are given in Chapter X. The areas of schemes,stage by stage, are summarized in Table 28 which, for convenience of reference, isrepeated in page 14 of this Chapter. (See Fig. 19).
Estimates of Capital Costs. See Chapter XI.
The figures there given come under two main categories; (a) those for worksof control and supply of water; and (b) those for works of irrigation development.The particulars are given in Chapter XI inTables 29 to 32. These show clearly whatclasses of works are included in the estimates, and what are not. It should benoted that all estimates of capital costs include margins for contingencies, and forthe costs of designing and supervision of construction. The figures for the mainitems may be summarized as follows :

TABLE ,28 - PROPOSED DET2LOPMENT OF IRRIGATION BY PROJECTS AND STAGES
* Total of 20,000 ha covers water rights granted to Tendaho Plantations Share Co. and outgrowers.
- 17 -
Projects
Present
-- - ---First Stage Second Stage Third Stage
Area
Additional Total A1ditional Total Additional Total
UPPER VALLEY
Wonji, Genet and others 6,600 0 6,600 0 6,600 0 6,600
Nuri, Eva 50 5,350 5,400 0 5,400 0 5,400
Total Upper Valley 6,650 5,350 12,000 0 12,000 0 12,000
MIDDLE VALLEY
Abadir - ll:etehara 850 9,650 10,500 0 10,500 0 10,500
Kesem - Kebena 650 1,350 2,000 0 2,000 15,550 17,550
Melki Sedi 0 6,000 6,000 2,550 0,550 0 8,550
Amibara - Angelele 50 950 1,000 15,650 16,650 0 16,650
Bolhamc; 0 0 . 0 2,500 2,500 6,400 8,900
i,:iaro Gala 0 0 0 10,650 10,650 12,150 22,800
Total Middle Valley 1,550 17,950 19,500 31,350 50,850 34,100 84,950
LUNER PLAINS
DUbti 4,000 5,050 9,050* 0 9,050 0 9,050Small riverside areas 0 0 0 0 0 3,700 3,700Dit Bahri 500 10,450 10,950* 5,400 16,350 0 16,350
Asayita Delta etc. 11,600 300 11,900 14,000 25,900 0 25,900
Old Awash 0 0 0 0 0 11,300 11,300
Total Lower Plains 16,100 15,800 31,900 19,400 51,300 15,000 66,300
GRAND TOTALS 24,300 39,100 63,400 50,750 114,150 49,100 163,250

18
(a ) iorks for Control and Supply of Water
(b) Works for Irrigation, Drainage and Flood Protection
(1) See para 7 above.
It is not yet possible to give estimates of the total investment,regardlesswhether from public or private sources,required in each of the three proPosed stagesof development. But very tentatively, the following figures may indicate their orderof magnitude exclusive of roads, farmsteads and farm machinery.
Millions of E 3Stage I 66Stage II 116Stage III _105Total for additional 139,000 ha
as per table 28 287
Scheme Hectares Cost E 3 E 3/ha Remarks
Middle ValleyAbadirNetehara (10,500) 17,000,000 1702 Extrapolated figureKesemKebena 17,550 32,240,000 1837MelkaSedi 8,550 15,382,000 1799AmibaraAngelele 16,650 30,376,000 1824Bolhamo 8,900 18,784,000 2110MaroGala 22,800 29,908,000 1312
84,9501 143690,000 1702
Lower PlainsDit Bahri 16,350 28,272,000 1729Dubti 9,050 14,161,000 1564 6500 ha by gravity
Rem. by pumpingAsayita Delta 25,900 30,185,000 1165 By pumpingOld Awash 11,300 12,951,000 1146 By pumping
Small Areas 3,700 4,310,000 1165 By pumping66,300 89,879,000 1356
ern
Attributable AttributableTotalsto Irrigation to Power
E $ E 3
Meki River Diversion 10,527,000 10,527,000
Compensation Dam (alter- (10,000,000) (10,000,000native to Meki Div.) (1)
Kesem Dam 29,932,000 6,322,000 36,2-)4,000Tendaho Dam 22,233,000 12,806,000 35,039,000
Total 62,692,000 19,128,000 81,820,000Protection and River
Training works inthe Lower Plains 5,400,000 5,400,000
Remarks
Very tentativoand subject torevision.Yo estimate yetpossible.

- 19 -
10. Economic Appraisals. See Chapter XI.
These appraisals were made by two consultants appointed by Special Fund,and their conclusions, based on interim data available at the time of their ap-praisal, may be briefly summarized as follows
The proposed further development of irrigation, assumed to be some150,000 ha additional to that now in hand, could have a benefit/cost ratioof 1.951, at an interest rate of 6,1/0.
In addition some 115 million Kwh of electric power could be generated,at 1/4 to 1/3 of the cost from the best alternative source.
Control of floods would increas'e net incomes by about E.S. 100,000annually.
The gross value of the annual agriculture product of the project willbe about E$ 181 million, with an increase of about ES 60 millions over thepres'ent annual net gain.
The investment required both for initial investment and associated costswas expected to be in the order of E$ 430 million. Using the costfigures of the finally revised estimates, the total investment requiredfor the overall project remains at the same magnitude, although some dif-ferencies appear in the estimates for the individual project areas.
The projects are expected to provide 10,000 - 15,000 family fa s,
and employment for 25/000 - 30,000 workers.
The survey and the economie appraisals are preliminary. Furtherdetail soil and other surveys, and pre-investment studies and investigationswill be necessary. Even so, it is believed that appraisals now made give areasonably approximate assessments of the costs of developing the agri-cultural economy of the Awash Basin, that the estimates of costs are suf-ficient and that the estimates of annual yields are conservative. Thisconclusion is supported by comparison of interim and revised overall costsper hectare.
While the Government of Ethiopia favours development of irrigation bylarge scale mechanised enterprises, socially there is a case for allotmentof a proportion of the lands made available to small farmers, trained inirrigation by experience on the larger schemes.
Economically the Awash basin is well situated, between Adis Abeba and.the Red Sea ports, with good communications to be still further improvedby the new main road to Aseb down the right bank of the river.
In the circumstances of the basin, a short term "crash" programme wouldnot be appropriate. Programmes of carefully planned and selected projects,economically sound, spread over 10 to 25 years are what are wanted.
These conclusions and suggestions of the economic appraisal can be endorsed.
Points to be noted, however, include the following

Studies should be made of methods of reducing losses in swamps and floodedareas, and of stabilizing river channels in the Lower Plains, and early actionshould be taken accordingly. In particular, efforts should be made to preventobstruction of the river channels in the Delta of the Awash, which might lead tothe diversion of much or all of the flow from the areas under cultivation. Theclosing off of the head of the Isa branch of the river, and the cuttingoff of the"neck" of the meander at that.point, is recommended as a provisional measure, tobe executed, however, under expert supervision. See pages 73 and 95.
Soil Surveys
Detailed soil marveys should be made for every irrigation project proposed,preferably on a continuing program, and certainly in each individual case before thefinal layout of canalisation and drainage is prepared- See pages 104 and 109.
Agronomic Studies
Experimental Stations for applied agricultural research should be set up inthe Middle Valley and the Lower Plains. The work in these stations should cover alltypes of farm crops, Vegetables, fruit trees and date palms, and timber plantations.Types of crops, cultural methods, prospective yields, and prices and marketingproblems should all be studied. See page 50.
20
To achieve satisfactorily high rates of benefitcost ratio, it isimportant to include in the cropping plan of each project a reasonableproportion of highvalue crops, according to local conditions, in eachcase.
In considering how schemes of irrigated agriculture should be operated,the implications of different methods and arrangements have to be takeninto account. The financial benefit of commercial farms in most caseswill exceed those of family farms. But the social advantages of thelatter may be outweigh their financial inferiority.
The revenues from developing high yielding areas at an early stage, maybe used to create a "revolving fund" available for the subsequent deve-lopment of less profitable areas. But care is necessary to avoid"skimming the cream".
B. RECOMMENDATIONS
The paragraphs which follow set out the Main Recommendations now made as aresult of the Survey.
Hydrology
The recording and interpretation of data from weather stations, and of flows,water levels, and sediment loads at river gauging stations, should be continuedwithout interruption, and extended to new stations wherever required. See page 65.
River Control and Training
- 21 -
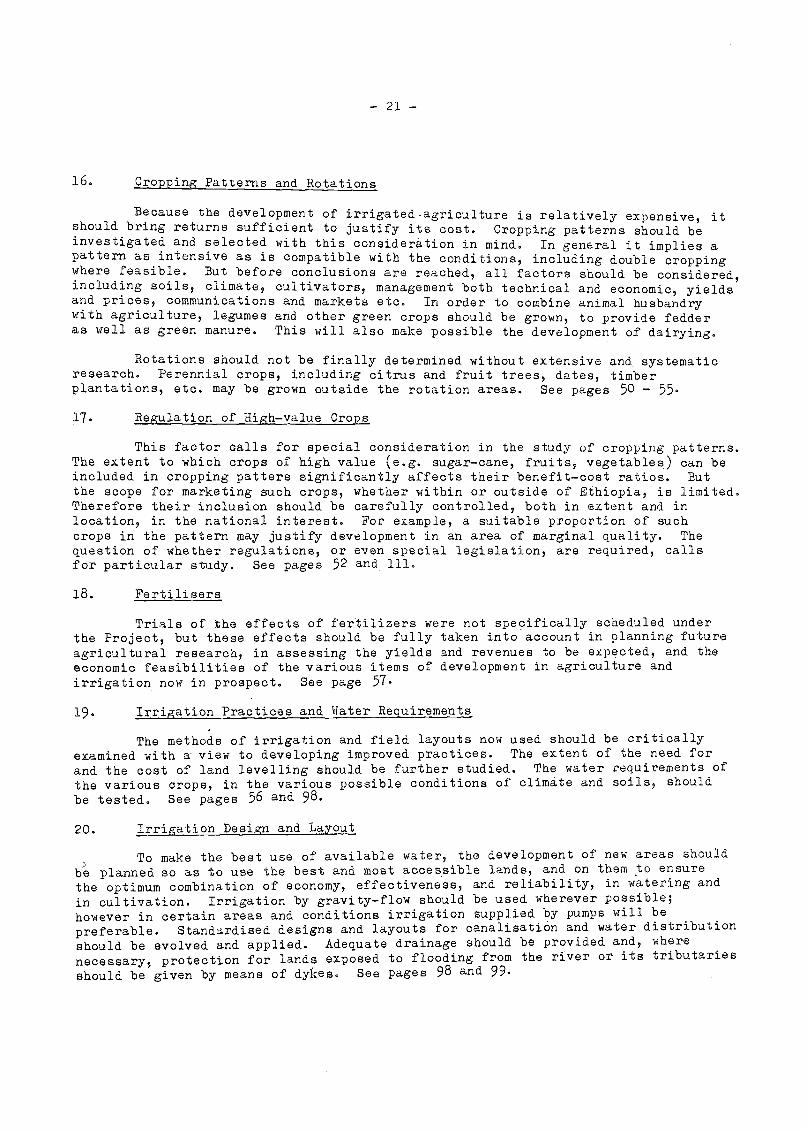
Cropping Patterns and Rotations
Because the development of irrigated-agriculture is relatively expensive, itshould bring returns sufficient to justify its cost. Cropping patterns should beinvestigated and selected with this ccnsideration in mind. In general it implies apattern as intensive as is compatible with the conditions, including double croppingwhere feasible. But before conclusions are reached, all factors should be considered,including soils, climate, cultivators, management both technical and economic, yieldsand prices, communications and markets etc. In order to combine animal husbandrywith agriculture, legumes and other green crops should be grown, to provide fedderas well as green manure. This will also make possible the development of dairying.
Rotations should not be finally determined without extensive and systematicresearch. Perennial crops, including citrus and fruit trees, dates, timberplantations, etc. may be grown outside the rotation areas. See pages 50 - 55.
Regulation of High-value Crops
This factor calls for special consideration in the study of cropping patterns.The extent to which crops of high value (e.g. sugar-cane, fruits, vegetables) can beincluded in cropping patters significantly affects their benefit-cost ratios. Butthe scope for marketing such crops, whether within or outside of Ethiopia, is limited.Therefore their inclusion should be carefully controlled, both in extent and inlocation, in the national interest. For example, a suitable proportion of suchcrops in the pattern may justify development in an area of marginal quality. Thequestion of whether regulations, or even special legislation, are required, callsfor particular study. See pages 52 and 111.
Fertilisers
Trials of the effects of fertilizers were not specifically scheduled underthe Project, but these effects should be fully taken into account in planning futureagricultural research, in assessing the yields and revenues to be expected, and theeconomic feasibilities of the various items of development in agriculture andirrigation now in prospect. See page 57
Irrigation Practices and Water Requirements
The methods of irrigation and field layouts now used should be criticallyexamined with a view to developing improved practices. The extent of the need for
and the cost of land levelling should be further studied. The water requirements ofthe various crops, in the various possible conditions of climate and soils, should
be tested. See pages 56 and 98.
Irrigation Design and Layout
To make the best use of available water, the development of new areas should?
be planned so as to use the best and most accessible lands, and on them to ensure
the optimum combination of economy, effectiveness, and reliability, in Watering and
in cultivation. Irrigation by gravity-flow should be used wherever possible;however in certain areas and conditions irrigation supplied by pumps will be
preferable. Standardised designs and layouts for canalisation and water distribution
should be evolved and applied. Adequate drainage should be provided and, where
necessary, protection for lands exposed to flooding from the river or its tributaries
should be given by means of dykes. See pages 98 and 99.
22
21, Water Control by Storage Reservóirs.
Detailed studies of technical and economic feasibility should be made for thevarious schemes of water control proposed. In the first place the Meki DiversionScheme should be studied, including its effects on the Lake Ziway catchment, and onall aspects of control at Koka Reservoir, including power development, losses byevaporation, losses by percolation etc. At the mamo time, the scheme for TendahoStorage Reservoir should be further investigated. If the Meki Diversion Scheme isnot in all respects feasible and desirable, the possibility of constructing insteada Compensation Reservoir on the Awash River upstream of Awash Station, to adjust theflows resulting from control for power production so as to suit the requirements ofirrigation, should be investigated. Later, the scheme for the Kesem Storage Reservoirshould be further investigated. In all cases, every relevant aspect of the conditioneshould be thoroughly studied, particularly the question of foundations, by thoroughgeological examinations, inCluding drilled borings and test pits as necessary.See pages 74 - 92.
Power.
The potentialities of generating power, at all points from the Upper Valleydown to Tendaho, should be further investigated, and their technical and economicfeasibilities assessed. The use and marketing of power should also be studied,including its allocation for pump irrigation where required and feasible, and itssale for other purposes, with the costs, charges, revenues, and economic assessmentsinvolved. See pages 80, 86 and 92.
Methods of Operating Irrigation Schemes
While the Government of Ethiopia in general favours the development of largemechanised agricultural enterprises, there is a case for the allotment of a proportionof the lands made available, to small farmers, trained in irrigation by experience onthe larger schemes. The tecnnical, economic, and other aspects of the various possiblealternative arrangements should be stucied. It is vitally necessary to ensure thatevery scheme will operate under an effective organisation of the direction of allthe activities involved, technical, economic, and social. See pagos 109 and 112.
Economic and Social Considerations and Priorities
While the preliminary estimates and economic appraisals made under the Projectindicate clearly favourable prospects for development, further and more detailed soiland other surveys, proinvestment studies, and economic appraisals should be made, forall potential schemes now recommended, as soon as possible, and in any case before anyitem of development id finally planned for execution. The results of these furtherstudies and appraisals will make possible adequate comparisons of the relativepriorities of the various alternatives. See pages 93 and 109.
Phases and Programs of Development
On present information, it is recommended that development in all parts of theBasin should proceed steadily and simultaneously, in three successive phases, as setout in Table 27, which is reproduced on pdge 15. Priorities are important and shouldbe carefully considered. A snortterm program would not be appropriate; a programcovering from 10 to 25 years, of carefully planned and selected schemes, economicallysound, is what is required. The revenues from highyielding areas developed at anearly stage may be used later to finance the development of less profitable areas,by the use of a "revolving fund". But care must be taken not to "skim the cream"from the most promising areas first, without-making suitable allocations of theresulting revenues. See pages 110 and 112.
- 23 -
Master Plan
To ensure orderly, effective, and economical progress in development, itshould from the start be carried through in accordance with a "Master Plan" which,embracing the three phases mentioned above, should be laid down as soon as thefurther investigations of all kinds, recommended above, have made sufficient progress.This "Master Plan" should be flexible in application, and in design of details; itshould be periodically reviewed and whenever necessary revised, in the light offurther knowledge and experience. See pages 96 and 112.
Reclamation of Swamps
In conjunction with the studies of irrigation problems, the reclamation ofswamps, for either grazing or agriculture, should be investigated, particularly theswamps in the Lower Plains and in the upper valley of the Borkena River. See page 114.
Improvement of Grazing Lands and Range Pastures
Investigations should be made of the extent to which surplus water can bespread on grazing lands and range pastures, with assessments of economic feasibility.The'provision of drinking water supplies and watering points in all such lands, byall practicable means, should be similarly studied. . In particular, the sinking oftest wells in the Aleydegi Plain is recommended. See page 114.
Watershed Management
All problems of soil conservation in the upper parts of the Basin should befully investigated, with a view to the application of adequate measures of control.Re-forestation should be actively promoted on sloping lands, particularly in thecatchments of reservoirs for water control,,with a view to reducing sediment loadsbrought down, and thus increasing the effective lives of these rezervoirs. Seepages 67, 114 and 115.
Health Studies
In view of the incidence of bilharziasis in the Awash Basin, particular careshould be given to the studies of health problems and precautions against diseases,especially in the areas where the development of irrigation is proposed. See page 98.
Awash Valley Authority
To plan, direct, and control the manifold activities involved in thedevelopment of the Basin of the Awash the Imperial Government has set up the AwashValley Authority. This, however, does not yet possess powers or resources, staffsor finances, commensurate with the magnitude and variety of the tasks with which it
will have to deal, as summarised above. It is of urgent importance that immediateaction be taken, by legislation, by staffing, by equipping, and by budgetaryallocation, to remedy this situation. Otherwise, it is not possible to see how thepotential benefits of the developments recommended in this Report, can be realised.
The Authority may suitably be made responsible for carrying out all the varied
surveys, studies, and appraisals recommended; for preparing on them as a basis the
"Master Plan" to be approved by the Imperial Government; for directing and supervis-
ing the implementation of this Plan, and in part at least, its actual execution;
and finally for supervising the operation cf schemes of development, to ensure
their technical and economic effectiveness in the exploitation of lands and water,
which are national assets. See page 113.
- 24 -
CHAPTER III - DESCRIPTION OF THE AWASH BASIN
Location and Extent of the Basin.
The situation of the Awash Basin in relation to the rest of Ethiopia is seen onMaps. Nos. 1 and 2. On some maps of Ethiopia, all the area lying between the catchmentof the Webi Shebeli river to the south, the catchment of the Blue Nile to the west, theinland depressions oC the Dankali oesert to the north, and the border of French Somali-land to the east, is designated as the basin of the Awash, extending to some120,000 km2. Following the first reconnaissance flights, and examination ofphysiography, it was apparent that large parts of this area cannot be drained by theAwash. Large tracts of land near the border of French Somaliland are isolated byvolcanic hills lying to the east of the Great Rift Valley, and numerous stream courseson the north-western slopes of the Chercher Mountains do not reach the Awash, butterminate in local depressions amongst the hills, where their waters evaporate. Theseindications were supported later by photo-interpretation, and although exact limitsfor the basin could not be rigidly defined on the maps, the sarvey was confined tothe areas which certainly are effectively drained by the Awash river and its varioustributarios, estimated to be about 70,000 km2.
The River.
The highest sources of the Awash lie in a mountain range lying near thesouthern edge of the "High Plateau" of Ethiopia, some 150 km. west of the capital,Adis Abeba, at an altitude of about 3,000 m. above sea level. After flowing to thesouth-east for about 250 km., the river enters the Great Rift Valley, which itfollows for the rest of its course, to where it ends in Lake Abe on the border withFrench Somaliland, at an altitude of about 250 m. The total length of the river isabout 1,200 km. A longitudinal profile of its course is given in Fig. 3.
The Awash is the principal river of the Ethiopian section of the Great RiftValley. Where it enters the Rift, at an altitude of some 1,500 m., it flows closeto the watershed between its own basin and the internal basins of the Plateau of Lakes;indeed it is possible here to identify as a former Awash tributary a stream which nowflows into Lake Ziway, the first lake of the series.
Pursuing its course to the east, the river runs across a series of geologicalfaults associated with a sharp bend in the general direction of the Rift VaLey, andthen turns northwards, between the great faults which delineate its eastern andwestern sides.
For the purposes of the survey, the Basin may be described under the followingsections;
Upper Valley comprising its course south-east and east down to the pointwhere it turns northwards along the line of the Rift. In this sectionits average slope exc(!eds 67oo, and there are many waterfalls, some ofwhich have been used for hydro-electric power. The length is about 300 km.
Middle Valley comprising the course northwards to a point downstream ofthe confluence of the Mile River, near Tendaho. In this section thegeneral slope is less than 10/00; there are numerous rapids where theriver crosses bars of igneous rocks, between which occur reaches offlood plain and swamp in places. The altitudes in the Middle Valleyrange from 1,000 m. at Metehara to about 500 m. at the rapids upstreamthe confluence of the Mile. The length of this section is about 650 km.

FROM I: 500,000 USAF PRELIMINARY BASE

2300
2000
1500
1000
500
100
Ginchi Bridge
elka Kentare
Koko Dom
enji Bridge
Sode
Era Fa I
200 300 400
elk° Bokara Foil
eteharo Diversion Dam
Gotu F
Awash Bridge
Melca Wara
Awadi
LONGITUDINAL PROFILE
OF THE AWASH RIVER
Hertale
Lake Gedebaso
500 600 700 800
atoburiBorkena
Chaleka
Tendoho
Dubti
DRAWING N3
ice Bario
Lo ice
Abe
Km.900 10 0 1100 1200
Ledi Asayita
Lake GamariMile

27
Lower Plains. A short distance south of Tendaho occur a series of faultsaligned gendrally northwest to southeast, 4hich have caused the riverto turn southeast wards across the alluvial plains. Its slope in thissection is only about 0.39oo its course is meandering, deltaic, andunstable; extensive areas are flooded, and changes of course often occur.Several lakes exist, of which the largest is Lake Abe, which receives theremaining flows. The length of this part of the course, to the entranceof Lake Abe, is about 250 km.
3. Physical Features
The section of the Great Rift Valley which comprises the Middle Valley and theLower Plains resembles a wide open "V" facing the Red Sea. The arms of the "V" areon one side the eastern edge of the Ethiopian High Plateau, and on the other thenorthern edge of the Calla Platau, marked by high peaks such as Abuya Meda, WotyeMeghezez, Yerer, Zikwala, Gurage, Gugu, and others. From both plateaux, the landsfall in series of steps, in many places high cliffs, on the lines of extensivo faults.The basaltic rocks of the High Plateau have been deeply cut by numerous rivers,forming canyons. Along the main faults, more recent volcanic activity has coveredwaterborne deposits with new volcanic formations which, in turn, have again beeneroded to form extensive cones and fans of debris below the slopes and cliffs.Numerous volcanic cones, distributed along the main faults, bear witness to thisactivity. Extensive areas have been covered with lavas, pumices, and tuffs.
In the lo-,er parts of the Rift Valley, other recent volcanic activities haveresulted in a number of hills, more or less isolated, of which some are perfectlyshaped cones and others are heavily eroded. Their distribution,-associated with thesecondary faults, is generally westeast, i.e. more or less at right angles to themain faults. The resulting bars of volcanic formations have been cut through by theriver, to form rapids, while in the hollows between them the river has depositedsediments. Large aluvial plains in the Middle Valley probably originated in thisway. Further down, below Dabita Ale mountain, in another trough not yet completelyfilled up, are the extensive sgamps of Gewani. Still further north the alluvialvalley becomes narrow, less than 4 km. wide, and continues.for about 100 km as anarrow marsh covered with trees and vegetation.
Near Tendaho village, the river has cut a gorge through a volcanic range,probably associated with a series of faults parallel with the main faults, i.e. north-south. Beyond this gorge begin the Lower Plains, which in this part were probablyonce covered by large lakes, which dried up after the river had cut for itself afinal outlet through another recent volcanic range in the region of Asayita, towardsits final outlet to lake Abe.
The most outstandingphysical features of the basin are steep cliffs and
slopes in a succession of steps from the heights of the plateaux tv the plains, andthe recent volcanic activities, still evidenced by a geyser and several mudvolcanoesin the Lower P1ains. The alluvial soils likely to be suitable for irrigation areconfined to separated regions; in respect of soils, as well as climate and hydrology,development can be considered in clearly defined units. The alluvial plains arereasonably largo; in contrast to other Ethiopian rivers, they are not confined narrowstrips along the course of the river, but extend to considerable widths, up to 20 km.
or even more. Further, the trough of the river in general is only moderately deep,so that irrigation of the plains involves only relatively low diversion dams andfeeder canals of moderate length to convey water to the irrigable areas. The Awash
basin appears to be one of the few in Ethiopia where conditions are favourable for
the development of irrigated agriculture at reasonable cost.

28
4. Hydrology Factors
On the maps and sketches made by early explorers, the Awash, in the middleand lower parts of its course, is described as an intermittent river. Carrying largeflows in the rainy season, it used to dry up in the low season; this was due notonly to the irregular incidence of rainfall, but also to the heavy losses caused byspill and evaporation in flood plains, swamps and lakes, and by seepage in permeableground and, perhaps, faults.
Since the construction of the reservoir and hydroelectric station at Koka inthe Upper Basin, the flows at that point have been largely controlled. On the average,the power plant can discharge about 40 m3/seo. As a result, further downstream theareas flooded are reduced, and the losses by evaporation correspondingly diminished.It is thought that the large swamps of Gewani and Buri in the Middle Valley aresteadily shrinking, or at least are flooded for shorter periods. It may also be,though it aeems leas probable, that the extent of flooding in the Lower Plains andparticularly in the Delta is somewhat reduced. However this may be, it is olearthat the Koka reservoir has significantly modified the hydrological regime of theriver at that point. But this does not affect the flows of the tributaries whichjoin further downstream. These, particularly the torrential left bank tributariesof the Middle Valley, are still liable to flood extensive areas, and refill likesand swamps. The resulting losses are large, and call for special measures to reducethe waste. The lowlying alluvial lands are still exposed to inundation; floodingwhich occurred on the Lower Plains in August 1964 would have resulted in heavydamages had these lands been then fully developed for irrigation.
Further, as already mentioned, flood flows in the Lower Plains causeshifting of the course of the river; to prevent this, river training appearsnecessary. This may be difficult to achieve successfully, unless the flood flowsfrom the tributaries are controlled by storage reservoirs, either on the tributariesthemselves, or on the main river below their confluence with it.
Another natural factor of importance is the heavy erosion which occurs on thehighlands in the upper reaches of the main river and the tributaries. According tothe nature of the ground, this may be either sheet erosion, or rill and gully erosion,which latter may develop into its most spectacular form of deep ravines and canyons.klmost all the main tributaries of the Awash, particularly those descending from theeastern edge of the High Plateau, cross lands which are subject to severe erosion;their total area is estimated at over 20% of the total catchment. As the inevitableconsequence of this erosion, the flood flows of the Awash carry heavy loads ofsediment, which of course are deposited wnerever the velocities of the flows arechecked, in artificial reservoirs no less than in swamps and lakes. The implicationsof this factor are taken into account in the discussions of later chapters, particu-larly Chapters VI to IX.
On the High PlateaU, ground water appears to be generally available, probablydue to the occurrence of basaltic traps, and the generally horizontal formations ofthe geological beds. In the upper reaches of streams, there are many springs,rivulets flow throughout the year, and many shallow wells are found. Deep tube wellsnow being sunk on the gently sloping lands in the Upper Basin in most cases strikeunderground aquifers providing supplies which, though not abundant, seem sufficientfor the domestic requirements of men and beasts.
5- Traditional Climatic Zones.
One of the major factors determining climatic conditions in the Awash Basin,as elsewhere in Ethiopia, is altitude. Ethiopian tradition identifies four majornatural zones according to altitude, climate, and to some extent, natural vegetation.

- 29 -
These are described below.
DEGA. This is the name given to tropical highlands above 2,500 m., witha cool and wet climate. Extensively cultivated, this zone was heavilydeforested, and now carries very few trees, except a few remnants offormer forests, and planted eucalyptus. A variety of crops are grown,including barley, wheat, flax, horsebeans and chickpeas, but the soilsshow signs of deficiencies in calcium and nitrogen. V, of the Awashcatchment lies in this zone.
WOINA DEGA. This name is given to the tropical to sub-tropical plateauxat altitudes from 2,500 m. down to 1,800 m. The natural conditions inthis zone are well suited to rain-grown agriculture. In the Awash Basin,this zone is at present the richest agriculturally, growing a wide rangeof crops, and producing surpluses for sale on local and export markets.130 of the Awash catchment lies in this zone.
KOLLA. This covers the agric;ultural lands lying between 1,800 m. and1,500 m. in altitude. There are significant differences in rainfallsbetween the deep mountainous valleys which receive abundant rains, andthe more open lands on gentler slopes at similar altitudes. It istherefore convenient to divide the KOLLA into humid and dry tracts. Inthe humid valleys two crops each year can be raised on the very fertileblack soils. In the dry tracts the agricultural settlement is less dense,and the rainfalls maffice for one crop only. Both food and cash cropsare grown. 22'A of the Awash basin lies in the KOLLA, of which 6 isin the humid valleys.
BEREHA. This name is given to semi-arid and sub-desert lowland.s ataltitudes below 1,500 m. It includes extensivo grasslands and steppes,large tracts of rocky and hilly lands, and also alluvial plains withgood deep soils, of which some are saline in varying degrees. Becausethe rainfall is too scanty, agriculture is not possible without irrigation.One of the particular objects of the Awash Basin survey was to assess thepossibilities of developing the low lands. 58"/"; of the Awash basin lies
in this zone.
6. Population
The ethnic divisions and densities of population in the various parts of theAwash Basin are shown on Map No. 4. In general terms, the highlands are calledChristian lands by the Muslim peoples who live at lower altitudes. They are settledby Amhara and Galla people who follow the Christian faith. The Upper Basin of theAwash is theborderlandbetween these two most important ethnical groups. South-eastof Adis Abeba the rural populations seem to be mainly of Calla origin, while thosesouth-west of the city are from Guragi tribes. The Amhara people have settledmostly in the cities and towns. The industrial development of the Adis Abeba region .
has attracted many immigrants from the regions of Jima and Arusi to the S.W., and
Tigre to the North. In the western highlands as far north as Debre Sine, Amharapeople form the largest element in the population. Further north, the highlands andthe mountainous valleys seem to be settled mostly by Galias, and in the region of Dese
by Wollo people. These descriptions can only be very approximate, since in factthere is considerable mingling of people of different ethnic origins.

TEN DAHO
DEBRE SINA
DEBRE B1RHAN
CHACHA
SH ENO
ç.
r*
Azelo
L.H RrAL.
\\\O"\co`a\\ELIGIE
\AERELAZO..\\:\\\\\-miEsoeAsebol
DES EN E
Fen al
AF OEM
SOURCESDENSITY OF POPULATION-ETHOPIAN GEOGRAPHICALJOURNAL ,VOL Tr/1 , 1964DISTRIBUTION OF THE TRIBES-PROF. S.CHOJNACKI, CURATOROF THE HISTORICAL ANDETHNOGRAPHICAL MUSEUM
BOUNDARY OF. .ADAL TRISES
BLUE NILE
BASIN
pE OAF
AB
CH EFA
E8RZEYT
NAZRET
LENCHIT
DUST! ASAYI TA
101-150
71-100
SI-70
31-50
6-30
O-5
\\LGAHARI\\\\\L.A.F44180
People per sq. km
TRIBES AND DENSITY OF POPULATION
WELD TA(
SCALE20 40 60
oeA
DeS.1.
80 100 km
DRAWING N24

- 31 -
On the right bank in the southern part of the valley, Arusi people form a largeelement among both cultivators and shepherds; on the highlands population densitiesare fairly high, and some signs of overpopulation are evident. East of the Nazretregion, the sedentary Galla cultivators are replaced by Galla pastoralists of theKereyu tribes. These are the first of the nomads to be encountered in the lowlandsof the Awash; beyond them are the Danakil, and further east, the Isa tribes. TheDanakil, or Adal in the Amharic language, call themselves Afar; they occupy thelargest part of the potential areas of irrigation development, and therefore theymerit a short account of their way of life, the more so since they are still relativelylittle known to the ethnologists.
These nomadic peoples, of Semitic origin, are amongst the less developed tribesin Ethiopia. Their household utensils are primitive; pottery is almost unknown, andwicker baskets lined with clay and soot are used for milking and storage. Goatskinsserve for churning butter and carrying water. Iron is used only for making spearheadsand swords; iron tools are unknown. Houses are dome-shaped huts made of mattingspread over bent sticks. Fires are little used, and most food is eaten uncooked. Allwork at home and with the animals is done by women, while the men, formerly onlyfighters, spend their time scouting for water and pastures. Their status as warriorsis enhanced by the possession of rifles, for which they will pay high prices.
The social pattern and customary law of the Danakil are not yet well known,but in general the basic social unit appears to be a small group of kinsfolk livingtogether. In the Middle Valley no one indigenous authority is generally recognised,except perhaps some kind of tribal leaders' council. In the Lower Plains, thesuccessor of the former Sultan of the Aussa is regarded as the spiritual leader. In
both areas, the authority of the central Government appears to be unchallenged.
Strong feelings often arise between tribal groups, usually over grazing andwater rights. Bloody battles between the Danakil and the Issa or the Kereyu are notuncommon.
In contrast with these primitive peoples of the lowlands, the agriculturistsof Amhara or Galla origin, settled on the high plateau, are highly civilised peoplewith a social organisation fairly well developed round the parish church and thelocal administration. Agricultural techniques are relatively advanced, in spite ofthe use of somewhat primitive implements. The Ethiopian peasant is hard-working andsturdy, and it is these people of the plateau, possibly from the over-populated areasin Tigre province, who offer one of the main fields for recruitment of settlers forthe prospective areas of irrigation development. In contrast, the prospects ofrecruitment from the lowland tribes would appear to be limited, at least in the nearfuturo, particularly in view of the low densities of population and absence of landhunger. However, the introduction and settlement in lowland regions of "stranger"peoples of tribal origin and faith very different from the local nomads will raisesocial and economic problems, which will not be easily solved without much carefulthinking in advance, and wise and patient administration.
The absolute and relative figures of population in the Uppér Valley are hardlyrelevant to the present survey, since there is little scope there for furtherdevelopment. Elsewhere in the Awash Basin, only approximate estimates of the nomadir;populations are as yet possible. It is thought that they may total anytning from50,000 to 100,000 people, which perhaps some 25,000 to 30,000 are in the LowerPlains with Asayita delta as their centre, and the rest are in the Middle Valley.
7. Lines of communication
Principal lines of communication linking the capital to the sea ports runacross the Awash Basin (see Map No. 5). With the new highway to be constructedshortly and Which will follow approximately the right bank of the river, the maindevelopment areas will be provided with good communications both with Adis Abebaand the Red Sea ports.
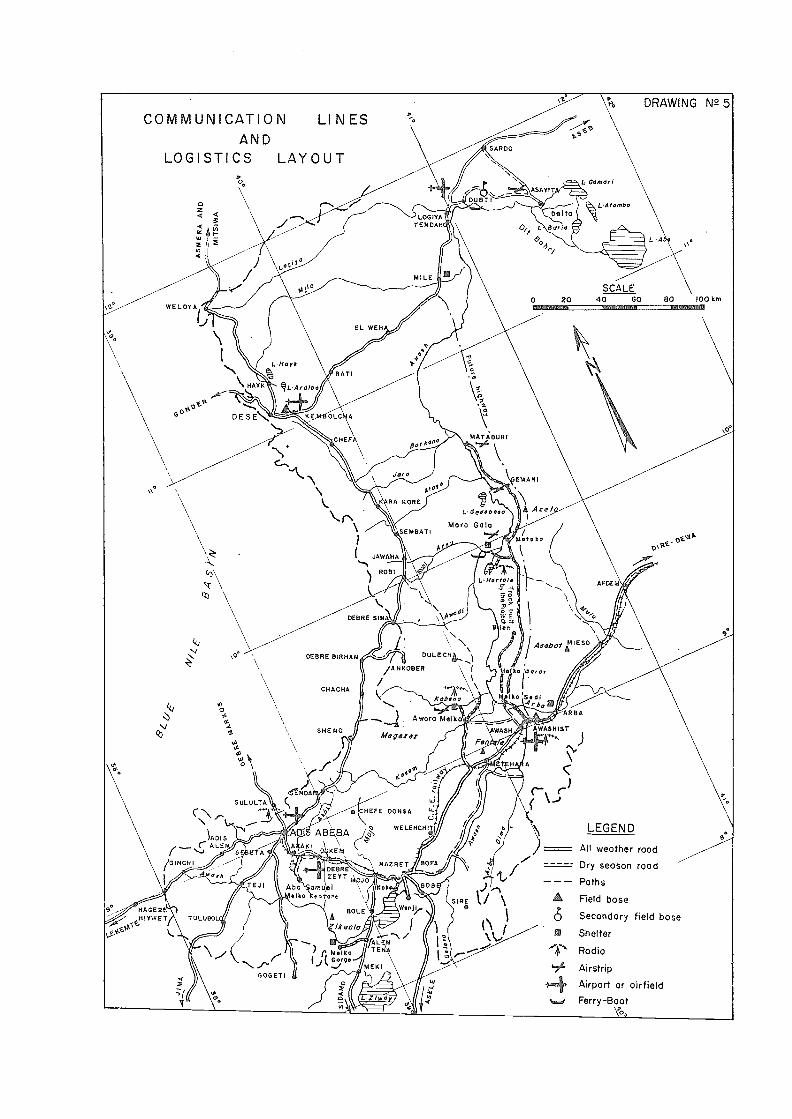
COMMUNICATION LINESAND
LOGISTICS LAYOUT
TULUBO
CHEFA
001
RA ROBE
Abo amu 1
roko entare
SE klBATI
LGeIDosoMoro Gala
`"7(
Aurora Ale! k
Alegez
HI YWE T
WE L DYA
SULULTA
oAGER
DEBRE BIRHAN
CHACHA
SHE NO
DEBRE SI
LOG I YATENSAR
DUBT I
LIAT /:BUR I
L Herlolo
SARDO
(ILAfonlboDelta
0/.8L. Bario
Moto Re
L. amorlASAYIT
I ko So di4, h.
SCALE20 40 60 BO 100 km
DRAWING N2 5
1==1M111111111
LEGEND
All weather rood
Dry season road
Paths
Field base
Secondary field base
Shelter
Radio
'74 Airstrip
Airport or oirfieldFerry-Boat

- 33 -
CHAPTER IV - OUTLINES OF EXISTING LAND USE
Patterns of Vegetation
A general map of land use was prepared on the basis of aerial photographsand then carefully checked during numerous field trips both by car and aircraft.The classification of natural vegetation adopted for this map follows as closely aspossible that recommended by the Scientific Council for Africa South of the Sahara,and proposed for Ethiopia by Huffnagel in his book "Agriculture of Ethiopia".Table No. 1 shows the areas of the main types of land use in the Awash River Basin.
The large proportion of cropland, which may appear high when compared withthe figures usually given for the country as a whole, is due to the fact that landsunder long duration fallows, as well as actually cropped lands, are classified underthis heading.
The delineation between different types of vegetation is not easy on smallscale maps and its accuracy is necessarily approximate, particularly since thevarious types are in some cases closely intermingled and it is not uncommon to finda small patch of wooded savanna or open forest in the midst of a sub-desert steppe.Also the distinction between "shrub savanna" and"tree and shrub steppe" is unclearand is based mainly on the density of vegetation associated with the various typesof soils. The common feature of all the lands covered by the natural vegetation,regardless of how thin and poor it might be, is that they are all used by thenomads as grazing lands wherever watering points are available at a reasonabledistance one from another.
On the waste lands a very scanty vegetation may be just sufficient fornomadic herds when crossing the desert on treks between better grazing lands. Butneither desert nor bad lands can peleuanently support even the most sparse settlementand its beasts.
Agriculture - General
There are pronounced differences between agriculture on the flat or gentlyrolling lands of the plateau, and that on the steep mountainous slopes. The formerdoes not require skill and labour-consuming efforts for terrace building, contourbunding and other soil conservation measures: animal-drawn implements can easilybe used for ploughing and cultivation. Also the yields on the level or gentlyrolling lands are believed to be appreciably higher than on sloping grounds, as thesoils there are generally deeper. But there is no marked difference in the typesof soils, and the cropping pattern depends more on the climatic conditions than onthe configuration of the ground and the quality of the soils.
Crops.
The chief agricultural crops in the Awash catchment area are food orsubsistence crops and very few industrial or cash crops are currently grown.
Cereals
Teff (Eragrostis Abyssinica) is one of the most important cereals grown
in the surveyed area. It provides a staple food and is economically attractivebecause its price on the local markets is noticeably higher than that of other
cereals. This is why the Ethiopian peasant gives his teff special treatment, plants
it on his best land, carefully prepares the seed bed and weeds the crop. ,Yields
may be over 10 quintals per hectare, and on the black soils in the Borkena Valley
yields at over 20 odha have been recorded.
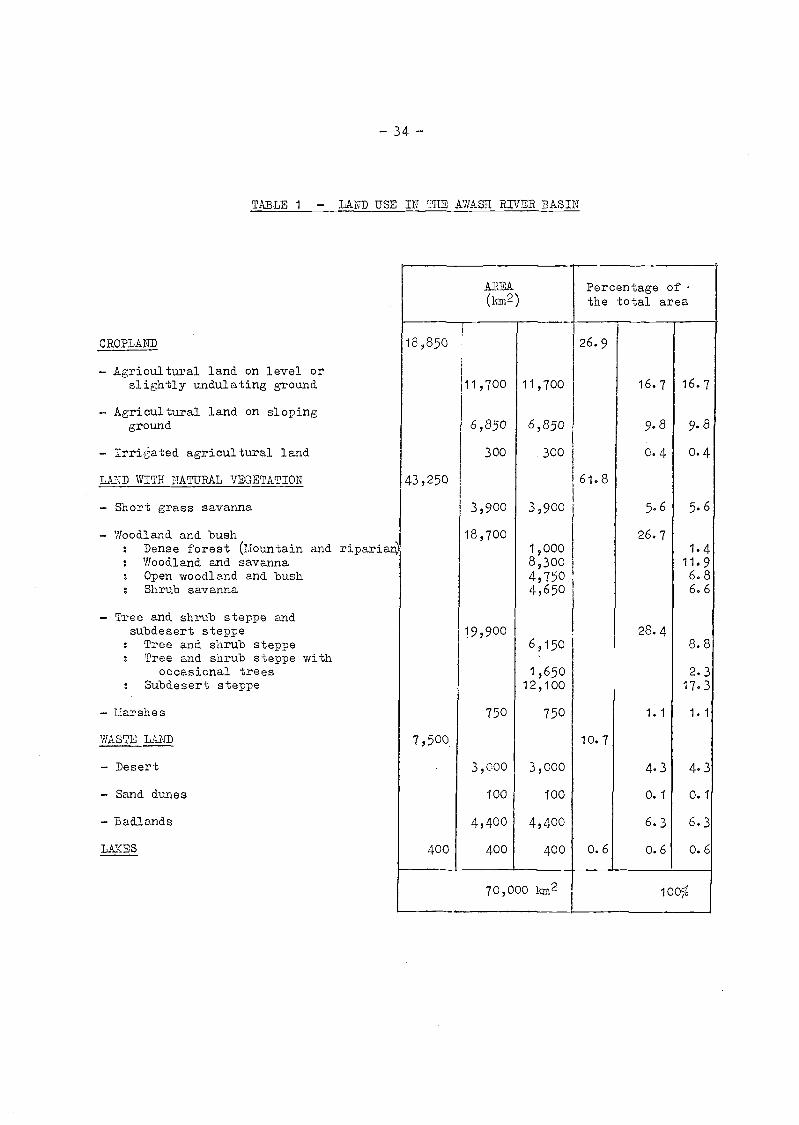
CROPLAND
Agricultural land on level orslightly undulating ground
Agricultural land on slopingground
Irrigated agricultural land
LAND WITH NATURAL VEGETATION
Short grass savanna
Woodland and bush: Dense forest (Mountain and riparia: Woodland and savanna: Open woodland and bush: Shrub savanna
Tree and shrub steppe andsubdesert steppe
: Tree and shrub steppe: Tree and shrub steppe with
occasional trees: Subdesert steppe
Earshes
WASTE LAND
Desert
Sand dunes
Badlands
LAXES
- 34 -
TALLE 1 - LAND USE IN THE AWASH RIVER BASIN
AREA(km2)
Percentage ofthe total area
18,850 26.9
11,700 11,700 16.7 16.7
6,850 6,850 9.8 9.8
300 300 0.4 0.4
43,250 61.8
3,900 3,900 5.6 5.6
18,700 26.71,000 1.48,300 11.94,750 6.84,650 6.6
19,900 28.46,150 8.8
1,650 2.32,100 17.3
750 750 1.1 1.1
7,500 10.7
3,000 3,000 4.3 4.3
100 100 0.1 0.1
4,400 4,400 6.3 6.3
400 400 400 0.6 0.6 0.6
70,000 km2 100%

35
Barley comes next to Teff as the most important crop in the Awash RiverBasin. It is sturdy enough to be planted at high altitudes, up to 3000 m and more,and although it is not exactly brewery barley, it serves nevertheleco to make alocal beer "Tala." The yields may be as high as 15 q/ha.
Wheat grows at altitudes intermediary between those of Te,L1 .141d Barley.The district of Debre Zeyt, which has a suitable altitude and climate is a bigproducer of Wheat, the yield ranging between 11 and 13 qlha. The majority ofindustries which are engaged in the processing of wheat flour and its products arelocated in this neighbourhood.
Maize is grown in the Awash basin both as a rainfed and as an irrigated cropat lower altitudes, well below 2,100 metres. It is grown on a large scale in theNazret plain,the Borkena valley and Asayita delta, as well as on a smaller scale onthe rolling terrains of Bofa, Bati, Dese and the upper Mile. The yield ranges from8-9 q/ha. Maize is used for making local beverage, and also eaten cooked or roasted.
Sorghum is grown very widely as a rainfed or irrigated crop throughout theagricultural regions of the Woina Dega, Kolla and Berehal up to the altitudes of2,500 metres. The best sorghum, however, is'grown on lands of altitude around1,800 metres. The Robi Chefa Kembolcha area, the rolling lands of Bati, upperMile) Welenchiti, AsebotMieso, and the Asayita delta are well known for the pro-duction of sorghum, the yield being usually between 8 & 10 q/ha.
Pulses are widelS1- grown in the surveyed areas, sometimes as catch crops.Horsebeans and Guaya (vicia Sp) can withstand the highest altitudes; broad beansand chickpeas are often consumed green as vegetables; reas and lentils are grownon lower altitudes.
Oilseeds harvested in the Awash basin are often grown for food. Edibleoil is obtained from the following
Noog called Niger in India (Guixotia Abyssinica Can.) is the most importantoil crop, grown at altitudes between 1,800 and 2,500 metres, generally on poor wetsoils. The average yield is very low, ranging from 4 to 5 q/ha. It has an oilcontent of more than 40% when properly pressed. Noog is grown in the Debre Zeyt,Teji and Sire areas of the Awash basin.
Sesame is an oil crop which is grown on a small scale in the Awash basinwith irrigation, especially in the Bereha lowlands.
Linseed is grown at the higher altitudes of the Dega region as an oil crop,but not as a fibre crop. Linseed is mostly used for therapeutical purposes, forlinseed oil meal or cake.
Only a few Industrial Crops may be grown at altitudes where rainfedagriculture is still feasible. There are various spices currentl,y used as localcondiments, some of them being exportable, e.g. red pepper and onions. Fibre cropsare ensote (Ensete Eduli), and cotton grown as a perennial shrub, but as the latteryields only 80-100 kg/ha of lint cotton, it is used mostly for home weaving. Underirrigation numerous gardens produce vegetables, fruits and sugar cane for homeconsumption, while marketable products come from large and medium scale irrigatedfarms, located at the lower altitudes (e.g. Wenji, Metehara, AworaMelka, Dubti).

Weeding and hoeing are done byby hand or by trampling with animals.rodents and insects are estimated at 2suspended off the ground, earthen jarssmall grains.
- 36 -
Agriculture in the highlands
Tillage is usually done with the local plough drawn by two bullocks or withthe hoe by hand digging. Hand digging is practised where the land is too steep touse animal drawn ploughs or where holdings are too small.
When a careful preparation of land is needed, deep ploughing is also done bya hoe-like tool which has a handle with two points at the end, and a pair of conical-shaped sleeves attached to the points. This is mostly used to break virgin soilsand is followed by ordinary ploughing, especially for ensete a d eucalyptus planting.
hand, harvesting by sickle, threshing eitherStorage presentsdifficulties and losses from
og. Mud plastered wicker work store binsor animal skins are mostly used to store
Irrigation is a necessity below 1500 m , whereas in the highlands only fruitsand vegetables need artificial watering. In some rare cases, irrigation is practisedto raise two crops yearly.
Soil burning - "denshering" - is popular with the Dega farmers on the highaltitudes. Rotations adapted to the soil and climate conditions are generallypractised. The rotations provide for fallowing which may be of various durations.Along with the short duration fallows of one or two years, the land may be left idleand grazed only for many yeare until the soil is believed to be regenerated.
Terracing, contour bunding and general soil conservation practices are widelydeveloped only on the steep slopes, and in certain regions, e.g. in the northernparts of the river basin, appear to be highly efficient. Construction and maintenancework is carefully carried out, but the drainage facilities often appear insufficient.The agriculturists till not only the artificially levelled land, but any flat or evensloping plain land available, regardless of how inaccessible it may be. Thus, inmany cases a handful of farms or even completely isolated fields are cultivated ontable-shaped summits surrounded by ravines several hundred metres deep. Obviously"such isolated farming is merely subsistence agriculture and it will always be back-ward. It is extremely difficult, indeed, to modernize and improve farming practicesof the peasants living in such isolation. Even the administration of the countryis seriously hampered by lack of access roads.
Agriculture in the lowlands
Irrigated agriculture has been developed mostly at altitudes below about1000 m Several modern irrigation schemes are operational in the lowlands. Aswell as a very modern and thriving sugar cane plantation at Wenji (which is locatedat more than 1500 m), the plantations at Metehara and Awora Melka bear witness tothe potentialities of the Middle Valley. Several new projects have recently beenstarted with good prospects that they will be developed in the near future. However,this development, although encouraging in its spontaneity, is characterized by ahaphazard approach, and before it becomes too advanced, it is essential to plan forthe best overall use of land and limited water resources.
In the Lower Plains Dubti,Dit Bahri,and Barga are developing into big cottonproduction centres. Besides the large scale concessionary plantation, there areincreasing numbers family-size agricultural undertakings in the delta area ofAsayita. Agriculture in this region is an old venture, probably several centuriesold, developed by the once autonomous sultanato. Although probably some 10 to 15,000ha are cultivated in the Asayita region, the farming practices are fairly primitive

- 37 -
and the irrigation methods consist only of natural flooding; when the floods recede,the land is planted. In fact, water supply to the agriculturists in the delta areadepends only on the hazards of floods from several branches of the Awash river,floods which are irregular and uncontrolled.
Land tenure and farming units
Figures collected from several sample surveys and from direct inquiriessuggest that from 50 to 707/0 of the agricultural lands are farmed by tenants, onvarious forms of agreement with the landlords. Holdings are generally small on thebetter lands located in the valleys and at lower altitudes, the average area beingbetween 0.8 and 2.0 ha. They are larger, up to 6-8 ha, at higher altitudes and onpoorer lands. Yields are generally low and well reflect the rather obsolete farmingmethods. The value of agricultural implements used on the farms is estimated atabout 9 E$ per holding. Agricultural revenues are also low, ranging from 130 to250 E$ per holding, which works out a per capita revenue of 35 to 60 E$, as againstan average Gross National Product at about 100 E$ (US$ 40).
Livestock population on the holdings is fairly important: Most peasantskeep about 6 head of cattle, and a few goats and sheep. The animals graze mostlyon the fallowing lands, but there is evidence of communal grazing lands in themountains. Near the escarpment, it is said, peasants may use some of the adjacentslopes and ravines, where their livestock sometimes meet that of the nomadicpastoralists.
Livestock breeding
Livestock breeding is the main occupation of the lowlanders, where theclimatic conditions, particularly the scarcity of rainfall, are too severe foragriculture. On the gentle slopes of the southern portion of the river basin thereis no clear-cut boundary between the settler and the nomadic populations. Pasto-ralists are found in the vicinity of Lake Gelilea and in the open woodlands in theupper parts of the Great Rift Valley. But, rainfall being sufficient, and thetemperature at the altitudes between 1500 and 1000 m still relatively cool, farmingmay also be found in that region. A noticeable extension of cultivated landstowards the lowlands as far down as Metehara has been observed in recent years.Glades are cleared in the open forest, woody savanna and the bush, and new farmsstart on the land which till now was merely grazed by the nomadic herds. This recenttrend is probably related to the steady growth of settled population and may be
regarded as the first symptoms of demographic pressure in this part of the country.
In contrast, on the eastern escarpment of the central plateau, where theslopes are very steep, agriculture stops abruptly at the limit of the
higher rainfalls, and the pastoralists may graze their herds at the foot of the
very hills on which the farmers are tilling their land.
Ranching methods
Livestock breeding on these more or less waterless lowlands is limited to
the tracts within 20 to 25 km from watering points. These are principally permanent
water courses, which are rather scarce, and several lakes apparently fed either by
hot springs or by underground infiltrations from the Awash river. There are very
few wells and water holes, but artificial podds which store rainwater for a couple
of weeks may be occasionally found where natural conditions are suitable.
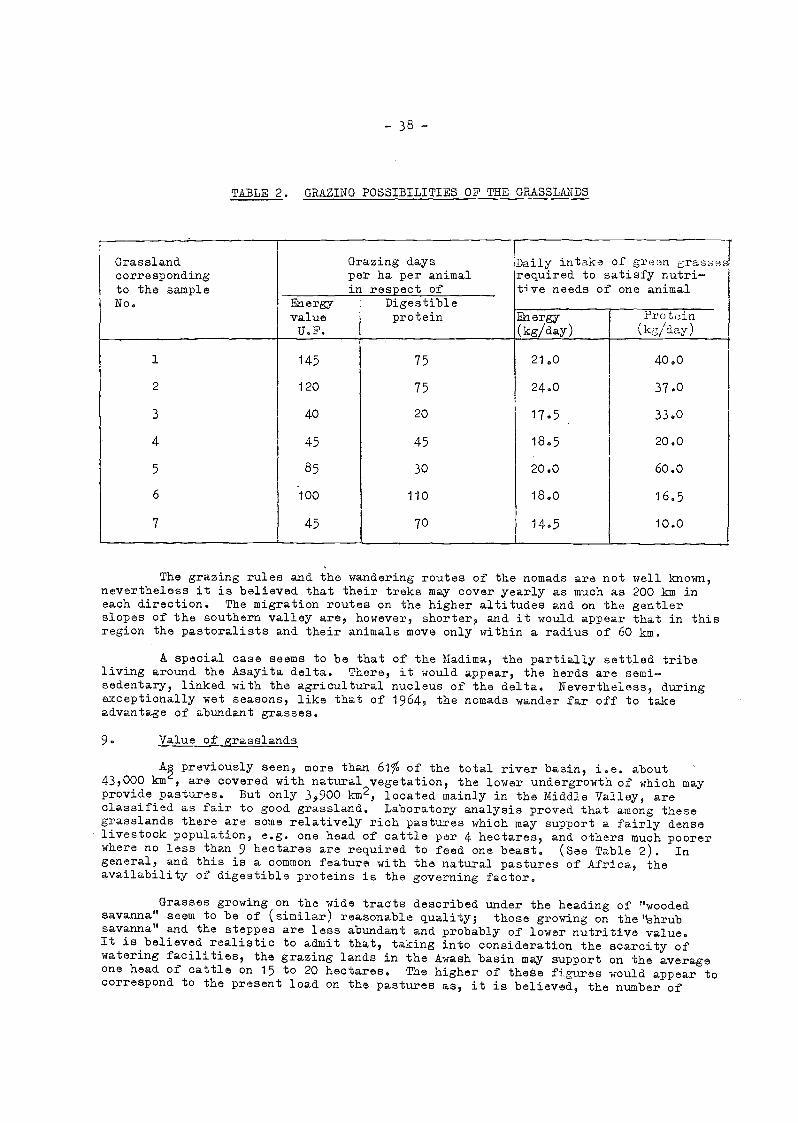
38
TABLE 2. GRAZING POSSIBILITIES OF THE GRASSLANDS
The grazing rules and the wandering routes of the nomads are not well known,nevertheless it is believed that their treks may cover yearly as much as 200 km ineach direction. The migration routes on the higher altitudes and on the gentlerslopes of the southern valley are, however, shorter, and it would appear that in thisregion the pastoralists and their animals move only within a radius of 60 km.
A special case seems to be that of the Madima, the partially settled tribeliving around the Asayita delta. There, it would appear, the herds are semi-sedentary, linked with the agricultural nucleus of the delta. Nevertheless, duringexceptionally wet seasons, like that of 1964, the nomads wander far off to takeadvantage of abundant grasses.
9. Value of grasslands
AA previously seen, more than 61% of the total river basin, i.e. about43,000 km`, are covered with natural vegetation, the lower undergrowth of which mayprovide pastures. But only 3,900 km2, located mainly in the Middle Valley, areclassified as fair to good grassland. Laboratory analysis proved that among thesegrasslands there are some relatively rich pastures which may support a fairly denselivestock population, e.g. one head of cattle per 4 hectares, and others much poorerwhere no less than 9 hectares are required to feed one beast. (See Table 2). Ingeneral, and this is a common feature with the natural pastures of Africa, theavailability of digestible proteins is the governing factor.
Grasses growing on the wide traots described under the heading of "woodedsavanna" seem to be of (similar) reasonable quality; those growing on the"shrubsavanna" and the steppes are less abundant and probably of lower nutritive value.It is believed realistic to admit that, taking into consideration the scarcity ofwatering facilities, the grazing lands in the Awash basin may support on the averageone head of cattle on 15 to 20 hectares. The higher of these figures would appear tocorrespond to the present load on the pastures as, it is believed, the number of
Grasslandcorrespondingto the sample
Grazing daysper ha per animalin respect of
1%Daily intake of gre,Jn L;rastsirequired to satisfy nutri-tive needs of one animal
No. Energy Digestiblevalue protein -Ehergy ProtinU.F. (kg/day) (kg/day)
145 75 21.0 40.0
2 120 75 24.0 37.0
3 40 20 17.5 33.0
4 45 45 18.5 20.0
5 85 30 20.0 60.0
6 100 110 18.0 16.5
7 45 70 14.5 10.0

- 39 -
cattle grazing on in the Middle Valley and Lower Plains may be around 200,000animals. It should be noted, that this number might probably be increased if moreevenly distributed watering facilities were available. Also the livestock populationmay be substantially increased if along with improvement of drinking water supply,supplementary fodder resources from irrigated pastures are made available.
Living standards of nomadic tribes
No systematic investigation was carried out to assess the revenue of thepastoralists. In general it would appear that they are living outside the marketeconomy and that their living standards are rather low. Their monetary revenuecomes mainly from the selling of hides, and pays for purchases of clothing and afew cereals. Animals are very seldom sold. Milk and milk products are consumed bythe shepherds and their families.
Production from the land
The foregoing brief discussion of problems related to land use and livingstandards in the Awash river basin leads to the conclusion that revenues from theland are low both in the high lands and the lowlands.
Extension of agricultural production is governed by the climatic conditions.The variety of crops grown on the highlands is limited by the altitude and practi-cally no exportable and only few cash crops may be grown on a large scale, unlessunder irrigation and at lower altitudes. The contribution of livestock breeding inthe Awash Valley to the national economy is almost non existent at present. There-fore, the development of agriculture and animal husbandry in the surveyed areaappears likely to be primarily dependent on the development of land and water inthe middle and lower reaches of the basin.
40
CHAPTER V SOIL SURVEY AND LAND CLASSIFICATION
1, Soil Survey General
The soil survey was carried out to achieve an inventory of developmentpossibilities in the lowlands and, with relation to land use studies, to ascertainthe production potentialities in the highlands. Fig. 6 shows the areas surveyed.
It was carried out in three successive phases
General reconnaissance of the lands of the whole river basin.The results of this were mapped on a general map to the scaleof 1:1,000,000 included in Vol. 2.
Reconnaissance soil survey of the lowlands to select potentialityirrigable areas on maps to the scale of 1:250,000 included in Vol. 2.
Semidetailed soil survey within the limits of potentiality irrigableareas to ascertain the irrigation suitability classification. The soiland irrigation suitability classification was mapped on the scale of1:100,000. See Maps Nos 7 and 8.
The comprehensive report on the soil survey and the attached relevant mapsare presented in Volume 2. Only a very brief summary is given below.
2. General Reconnaissance of Soils
In order to ascertain general information on the soils in the river basin,a general reconnaissance of lands carried out covering the whole catchment area.Table No. 3 gives the percentage results classified by soil groups.
It will be seen from the table that large tracts of the river basin are notcultivable. In the highlands mostly Vertisols and relatively small areas ofRegosols are used for agriculture. There are no alluvial soils in the highlands,and only limited areas of alluvial soils are cultivated under irrigation in theMiddle Valley and in the Delta area.

GENERAL AP OF SOIL SURVEYS INTHE AWASH BASIN
LEGEND
GENERAL SOIL SURVEY(working 'cale I :1000 000) covering thewhole of the catchment oreo
RECONNAISSANCE SOIL SURVE Y
' (working scale II 250000)l
SEMI-rDETAILED
SOIL SURVEY \DEÈRE ((
(wo king scale I : 100000) SiNAsr:z.e"
MI -DETAILED I--Termeber pass); .1-,---\--, \,...
SE SOL SURVEY oil:::.:.::gi1worhing scale i : 50 00(1) ; miEso
-: L. . 6'7'1 E R8ii'AE
.,,,..,,,,Y tf..... OULECH
\ /-,,,,,,_,.,,fi \ ,A NNCEER
C) i anl:_\ (Aseibot
/I °
CO C HA CHA
\\ \ Awora
0 t;25czersk----A'_ \ VX' si-4Etra LI
,..4 1. j,,,1
G.
'N I E T A
,% \ 7 , r '''' ,
I\ ' , )i \
...., ...\`... SENCÌA, A --, ---
N ZNET
SCALE20 40 60 80k
6 e o k):4 e
G:a.
(IMO!! L
mbc L
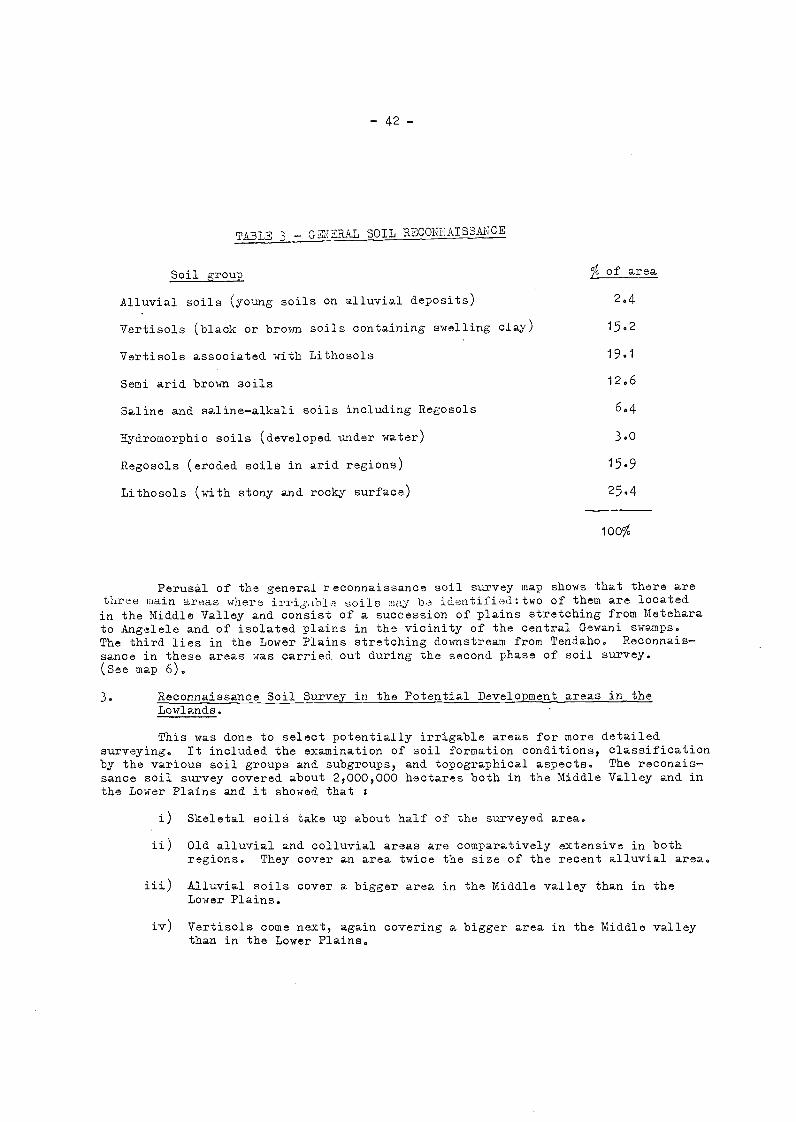
42
TABLE 3 - GEYERAL SOIL RECONY.AISSANCE
Soil group /c of area
Alluvial soils (young soils on alluvial deposits) 2.4
Vertisols (black or brown soils containing swelling clay) 15.2
Vertisols associated with Lithosols 19.1
Semi arid brown soils 12.6
Saline and salinealkali soils including Regosols 6.4
Rydromorphic soils (developed under water) 3.0
Regosols (eroded soils in arid regions) 15.9
Lithosols (with stony and rocky surface) 25.4
Perusal of the general reconnaissance soil survey map shows that there arethree main areas where irrisbla soils may be identified:two of them are locatedin the Middle Valley and consist of a succession of plains stretching from Meteharato Angelele and of isolated plains in the vicinity of the central Gewani swamps.The third lies in the Lower Plains stretching downstream from Tendaho. Reconnais-sance in these areas was carried out during the second phase of soil survey.(See map 6).
3. Reconnaissance Soil Survey in the Potential Development areas in theLowlands.
This was done to select potentially irrigable areas for more detailedsurveying. It included the examination of soil formation conditions, classificationby the various soil groups and subgroups, and topographical aspects. The reconais-sance soil survey covered about 2,000,000 hectares both in the Middle Valley and inthe Lower Plains and it showed that
Skeletal soils take up about half of the surveyed area.
Old alluvial and colluvial areas are comparatively extensive in bothregions. They cover an area twice the size of the recent alluvial area.
Alluvial soils cover a bigger area in the Middle valley than in theLower Plains.
Vertisols come next, again covering a bigger area in the Middle valleythan in the Lower Plains.

- 43 -
Appreciable quantities of hydromorphic soils are observed along theAwash in the Middle Valley.
A comparatively large area is taken up by marshlands in theLower Plains.
Predominant among soils on old alluvia and colluvia are semi-aridbrown soils, vertisols and regosols in the Middle Valley and mainlysaline and semi-arid brown soils in the Lower Plains.
Recent alluvial land most suitable for irrigation is thus limited in extentcompared to with that of the old alluvial areas.
The reconnaissance soil survey was followed by an initial classificationin respect to irrigation suitability. These land classes are in terms of presentsuitability for development under irrigation/ as follows
Class A : land suitable for development under irrigation.
Class B : arable land non-irrigable in its present state except undercertain special conditions.
Class C : non-arable, non-irrigable land, i.e., rock, very stony ground,dunes, swamps, very saline land and "badlands".
Table No. 4 gives the summary on land suitability for irrigation.
Table SUIT.BILITY FOR IRRIGATIO"RECO1AIS3CE SOIL SURT,I,
4. Semi-Detailed Soil lúrvey - Selection.
On the basis of the reconnaissance soil survey and of the preliminary landclassification, it was found that the Middle Valley and Lower Plains of the Awashbasin contain fairly large areas of recent alluvium which could be irrigated undergravity. Irrigation could also be extended to some of the older alluvia andcolluvia not so saline as to require excessive leaching water applications. Thefollowing areas were selected for subsequent semi-detailed soil survey :
1iddle Valley Lower Plains Total area
ha (re ha
Class A 125,000 10.9 75,000 6.6 200,000 17.5Class B 601,000 52.7 125,000 10.9 726,000 63.6Class C 20,000 1.8 195,000 17.1 215,000 18.9
Total alluvial andcolluvial area 746,000 65.4 395,000 34.6 1,141,000 100.0
Lithosols 375,000 46.0 441,000 54.0 616,000 100.0
Total mapped area 1, 121,000 836,000 1,957,000
- 44 -
In tha Middle Valley
The Metehara, Melka Sedi, Amibara, Kesem-Kebena and Bolhamo irrigationarea, cover an overall grosa area of about 100,000 hectares. These aremainly Class A land.
Decisive elements considered in making this choice were land quality,irrigability under gravity, and access into and from the area concerned.Thus, for instance, the large Aleydegi plain, where soils on old alluviaand colluvia may be considered partly as suitable for irrigation, wasexcluded from further investigations, because it lies about 70 m higher thanthe river and would require uneconomic pumping.
In the Lower Plains
The choice was more difficult for this region because of its pooraccessibility and vulnerability to flooding by the Awash at high water.Furthermore, an appreciable amount of this land is so saline as to requirethe application of above-average quantities of water for its development.Alkalinity in the low-lying parts of the area ("bottom-lands") is alsorather a problem. Seome of these various adverse features affect each of theareas selected.
The Dubti area was selected among others because of its recentlyintroduced cotton growing activities.
The Dit Bahri area offers a larger expanse of level land which wouldappear to lend itself well to irrigation under gravity.
Finally, crops are already being raised in the Asayita delta as thefloods recede and the presence of farmers there and the possibility ofextending irrigation to the north of this area were considered to warrantits selection for a semi-detailed soil survey.
5. Semi-Detailed Soil Survey -
i) Soil Classification within Class A Land - Soil ypes and Areas
This was carried out on sketch maps drawn from 1:40,000 aerial photographs,eventually reduced to the scale of 1:50,000. The final mapping was done toa scale of 1:100,000.
The purpose of the survey was to enable soil series and phases (whereapplicable) to be defined and the corresponding units to be mapped with theaccuracy required to give at least a clear definition of patches of land of25-30 hectares. About one profile for every 200 or 300 hectares of land wasanalysed in the Middle Valley, and one for every 300 hectares in the LowerPlains, except in the Dubti area where one profile was analysed for every150 hectares, because of the occurrence of closely intermingled saline soils.
Besides the analysis, soil samples were tested in respect of salinityhazards for base exchange capacity, available moisture, infiltration ratesand structural stability. Several samples were subject to X-ray examinationin order to determine the nature of clay components in the soils.
Table No. 5 gives a summary of the distribution of soils as identifiedby the semi-detailed survey. (See page 41).

- 45 -
Soil
TABLE 5 - sunaRY DISTRIBUMON OF SOILS ON THE SEMI-DETAILED SOIL SURVEY
TotalGroups Middle ValleyArea (ha) %
(Total), Lower PlainsArea (ha) (ha)
i. Soils on recent alluvia 86 4 0 33.0 00 3*. 182,140 36.4Alluv al soils 43,530 16.6 52,000 21.7 95,530 19.1Vertisols 37,810 14.4 16,000 6.7 53,810 10.8Hydromorphic soils 2,250 0.9 6,&_0 2,5 8,250 1.7Rydromorphic soils on
alkaline materials 2,850 1.1 900 0.3 3,750 0.7
ii.Organic soils
Soils on old alluvia and
20,800 8.7 20,800 4.1
colluvia 98,890 38.0 76,000 31.7 174,890 34.8Vertisols 25,800 9.9 - - 25,800 5.1Semi-arid brown soils 40,570 15.5 _ _ 40,570 8.1Regosols 24,420 9.3 24,420 4.9Sandy regosols on dunes - 7/300 3.0 7,300 1.4Regosols and salino soils 1,300 0.5 - 1,300 0.2Saline soils 4,550 1.9 34,000 14.2 38,550 7.7Salino alkali soils 2,250 0.9 34,700 14.5 36,950 7.4
Lithosols and skeletalsoils 76,670 29.0 68,300 28.4 144,970 28.8
TOTAL 262,000 100.0 240,000 100.0 502,000 100.0

-46-
The soils on recent alluvia are deep to very deep, those overlying theold alluvia and colluvia reasonably deep, but sometimes their depth islimited by gravel beds and calcareous crusts in the Middle Valley, or bysaline marls and old stony alluvium in the Lower Plains.
There is no apparent difference in the soil texture between the twoconsidered regions Middle Valley and Lower Plains : the clay content ismedium to moderately high. Fine textures are found mainly in the depressions.The lime content of the Middle Valley soils is low, particularly in thealluvial soils, whereas in the Lower Plains soils are more calcareous.
The organic matter content varies considerably in the two surveyed regions.Almost 60% of samples tested show organic matter content less than 1% for theLower Plains, against Tg, only of samples from the Middle Valley. However,the Middle Valley soils are not particularly rich in organic matter; about65% of samples tested show its content ranging from 1 to 2%.
Infiltration rates vary between 1 and 2 cm/h in the alluvial soils, andare less than 1 cm/h in Vertisols. Natural drainage conditions are ingeneral better in the Middle Valley than in the Lower Plains. A commonfeature of most of the surveyed soils is a rather low rate of availablemoisture. In 85% of samples tested, the available moisture rates rangedfrom 6 to 13% which is fairly low.
Saline and salinealkali soils are found mostly in the Lower Plains,where they amount to more than 280 of the surveyed areas and arelocated mainly on the old alluvia and colluvia. In the Middle Valleysaline soils .occur in patches mostly in relation to hot and salinesprings. The results of the leaching tests carried out on certainmedium saline soils in the Lower Plains appear to suggest that amodest proportion could be improved by leaching.
The fertility of the soils belonging to the groups listed as recentalluvial and Vertisols is satisfactory, although phosphorus content is notvery high. Nitrogen rates are adequate, except in the alluvial soils atDubti and Dit Bahri and in the Vertisols on the left bank in the Lower Plains.
ii) Land Classification for Irrigation
On the basis of the semidetailed soil maps the classification of landaccording to its suitability for irrigation was carried out. Some of theprincipal soil characteristics defining the land suitability for irrigationhave already been reviewed in the foregoing discussion. Other features hadalso to be taken into consideration.
Certain areas in the irrigable plains are subject to prolonged flooding,e.g. substantial portions of the alluvial soils in the Lower Plains. In theMiddle Valley, the extent of temporary flooding has recently been limitedby the control exercised by the Koka Dam; it thus now offers a relativelyminor problem. But runoffs from surrounding rocky hills cause, temporaryfloodings of the Vertisols in the valley bottoms, and on the colluvial andalluvial soils at the foot of these hills. This is the case in the Meteharaarea and in a portion of Melka Sedi.
In connection with flooding and runoff, local erosion is often observedin the Middle Valley, mainly on the hillsides. Generally there are nodefinable slopes but soils over the old deposits, shaped in cones ofalluvia and colluvia from the torrential tributaries may have a slope of upto 2 or 3%.

- 47 -
Vertisols and hydromorphic soils affected by temporary flooding develop anetwork of deep channels and surface holes due to the excessive desiccationof swelling clay. ("gilgai" effect).
These features have been additionally taken into consideration whenprocessinE land classifications. The criteria used correspond to theinternational standards as proposed in the U.S. Bureau of Reclamationljanual. Soil classes are defined as follows
Class I - Good irrigable land
Class II - Moderately good irrigable land
Class III- Marginal irrigable land
Class IV - Not irrigable, except under special conditions.
Class V - Undetermined suitability for irrigation
Class VI - Permanently non-irrigable land
Table No. 6 gives the summary on land classification for irrigation purposes;and appended 1:100,000 scale maps No. 7 and 8 show the distribution and location ofland classes.
1/ Good irrigable land which cannot be classified as Class I only because of lowmoisture availability.
TABLE 6 - SEEI-DETAILED SOIL SURVEY - LAND OLAS3IFICATIOU FOR IRRIGATION
1/Class II am
MeteharaRest of
Middle Valley Lower P ains Total area
ha ha ha"'go
ha
- - 24,700 7.0 - - 24,700 7.-Class II 4,200 1.2 27,700 7.7 30,000 8.4 61,900 17.3Class III 7,300 2.0 50,700 14.2 39,000 10.9 97,000 27.1Class IV 11/100 3.1 29,000 8.1 33,000 9.3 73,100 20.5Class V 5,600 1.6 4.300 1.2 15,000 4.2 24,900 7.0Class VI withoutlithosols andskeletal soils
2,500 0.7 18,300 5.1 54,700 15.3 75,500 21.1
TOTAL ALLUVIALAND COLLUVIAL 30,700 8.6 154,700 43.3 171,700 48.1 357,100 100.0
Lithosols andskeletal soils 7,300 69,300 68,300 144,900
TOTAL MAPPEDAREA 38,000 224,000 240,000 502,000

-45-
None of the land in the areas considered is found to be up to the standardsof Class I. Soils along the right bank of the Awash in the Middle Valley might havebeen included in this class, but their water-holding capacity is so low that theywould require frequent applications of small quantities of water. Although theycannot be included in Class I, they nevertheless still represent the best soils inClass II, and have been given the map reference II am. They appear to be potentiallythe most proddctive in the entire valley, with reasonably low farming costs. Withirrigation methods adapted to the low available water in the soil and suitable cropsfor the local climate, they should be able to produce high yields.
In the Class II range, about 17.3% of alluvial and colluvial lands weresurveyed in the Awash river lowlands. The factors limiting the development of thisland may be in the Middle Valley s
i) On the left bank
Mainly slight salinity and microrelief problems, or temporary flooding.
On the right bank
Drainage problems due to the presence of fine-textured soils or vertisols,temporary flooding, microrelief, and possibly also salinity (near Debu).
Drainage is also the limiting factor in the fine-textured vertisols ofMetehara area.
Short duration flooding, moderate drainage, high Na/T ratio, high value of pHand low organic matter content are to be reckoned with in the Class II alluvial areaslocated in the Lower Plains.
Class II land in the Middle Valley is potentially more productive than inthe Lower Plains, because it is less alkaline, contains more organic matter, and isaffected by few or no salinity problems.
In the Class III lands Were included the deep Vertisols and hydromorphicsoils at the Kesem-Awash confluence and in the Angelele area as well as mediumsalinity soils occurring in patches in Kesem-Ktbena plain, because of certaindrainage problems, microrelief and of need for a stricter salinity control.
The risk of flooding and the existence of basalt gravel beds in the soilsare the limiting factors in the Class III lands in the alluvial and colluvial areasof Metehara.
In the Lower Plains Class III land occupies the low-lying areas most oftenaffected by flooding, which contain slightly saline, fine to moderately fine-textured soils in the deeper horizon. In Asayita and Dit Bahri the water table mayrise fairly rapidly and increase the salinity of the soil.
Class IV land is more difficult to develop under irrigation and it willrequire special treatment. Thus, in the Middle Valley it occurs at higher elevations,not readily commanded from the river, or when located in the alluvial areas, lacksadequate drainage and is subject to severe flooding. Where land is too saline or tooalkaline to be economically leached, or too shallow, like in Metehara region, it isincluded in Class IV.

- 49 -
Most of the Class IV land in the Lower Plain is flooded whenever the Awashis in spate and features numerous channels and depressions. Some of this land maybe reclaimed if efficient flood control is achieved, but its development will call forconsiderable levelling and establishment of a fairly close drainage system. Certainareas of Class IV in the Lower Plains will be more difficult to reclaim because oftheir salinity and alkalinity, e.g. bottom lands in the Dit Bahri area.
Lands affected with excessive salinity and/or alkalinity, too shallow, orwith a serious levelling problem were included in Class V.
Class VI lands are considered as permanently unfit for irrigation, and theyaccount for 21.1% of the surveyed alluvial and colluvial area.
6. Conclusions
By way of conclusion it may be pointed out that the soil survey operationsrevealed a considerable scope for the development of irrigated agriculture: morethan 180,000 ha of suitable lands are ideatified as Class.II and III. Moreover someportions of floodible Class IV land in the Lower Plains may also be developed providedthat efficient flood control is achieved by adequate damming. Storage reservoirswill be also essential to increase the water resources, as those currently availableare insufficient for the development of all irrigable lands. The estimates of waterresources indispensable for this purpose will have to be made in relation to thepotential crop pattern which can be reasonably suggested for the development areason lands identified as in Class IIam, II, III and to some extent in Class IV.

50
CHAPTER VI - PROSPECTIVE LAND USE UNDER DEVELOPMENT
General considerations
Scrutiny of the soil maps, as well as those of irrigation suitability, willindicate that large tracts of good soils are located in the Middle Awash Valley.Moreover, certain lands located on both river banks upstream of Metehara may alsoprove to be of similar good quality. These were not selected for the semi-detailedsoil survey, because in the early stages of the Project operations it was alreadyrealized that the currently available water supply in the upper reaches of the.Middle Valley would certainly not be sufficient for all the irrigable lands availablein this region.
In the Lower Plains the situation is different, as here, in order to use thewater contributed by the large tributaries draining the lower part of the catchmentarea, notably the Borkena and Mile rivers, relatively poorer soils had to be selected.The fact that commercial development in the region had already started, along withthe existence of indigenous agriculture in the Asayita delta, had also to be takeninto consideration.
Thus, the agricultural value of the two development regions would appearto be unequal and therefore the prospective patterns of land utilization will bedifferent for the Middle Valley and the Lower Plains. The range of the crops whichcan be grown in both regions being probably similar the main problem is to selectan adequate intensity of cropping pattern for the respective regions.
Management
If high expenditure is called for the development of irrigated agriculture,it should bring high returns. This demands a cropping pattern as intensive as iscompatible with the natural conditions; whenever possible, double cropping. Normallynatural climatic conditions are no impediment for the development of double cropping;serious difficulties may however arise from the management point of view.
In the first place there is a need for assessment of agronomical implications,such as selection of most suitable growing period, the necessity for maintenanceand/or improvement of soil fertility, and the development of appropriate irrigationpractices. Assessment of these, as well as selection of types and rates of appli-cation of most suitable fertilizers, is related to extensive experimental and appliedresearch work which will have to be carried out in the development areas. However,experimentation being a long and difficult process, it will be impracticable topostpone the actual development until such time as all the results of experimentationare known.
It is essential, too, that the knowledge acquired from experimental work beapplied on the farms without delay. Efficient extension services will be indis-pensable to guide and help the farmers in their task of developing intensive irrigatedagriculture. The difficulties inherent in the operation and management of irrigatedsettlement schemes, in spite of an effective and highly organized extension service,are well known and should not be underestimated. On the other hand, it is thegeneral experience that capital-intensive commercial farms, usually staffed by wellqualified technicians, are better adapted to deal with delicate development problemsin the areas as yet uncultivated.
- 51 -
In fact) it would appear that less risk is involved in starting doublecropping, highly intensive irrigation projectson commercial type farms. Naturalconditions for the development of intensive irrigation farming would appear morefavourable in the Middle Valley rather than in the Lower Plains. The operationaldifficulties of an intensive irrigation project may be more easily overcome on thecommercial than on the family farms. Inasmuch as high productivity on agriculturalinvestment is regarded as the development target, it would appear that commercialfarms will have to be given prioritylat least provisionally, in the Middle Valley.Since less extensive irrigation seems more suitable for the settlement schemes, thepromotion of family sise farming would appear advisable in the Lower Plains.
3. Crops
Most types of crops grown under irrigation would seem suitable for theAwash valley. Generally speaking, the selection of crops and rotations will besubject to economic rather than agronomic conditions.
Fibre crops will probably be given preference in view of the shortage ofsupply and the steadi1y growing market for home fibres. Cotton is alreadysuccessfully grown in the area, but careful experimentation is needed inorder to select most suitable varieties and the appropriate growing season.In fact, varieties currently planted have a relatively long vegetation cycleand the interval between the picking and planting time for a second crop inthe same year is rather short.
Kenaf (Hibiscus Canabinus) is also a fibre crop which finds a readymarket and may probably be grown with success.
In view of great demand for coarse fibre needed in the bag manufacturingindustry, sisal may be introduced in the irrigation cropping pattern. Thisplant, however, being successfully grown without irrigation, irrigated sisalplantation should be allowed only where it will not impede the developmentof more economic crops.
Oil seeds for industrial processing will probably have a large share inthe crop plans of irrigated farms, as vegetable fats are in high demand onworld markets. Ground nuts would appear of special interest provided thatthe most suitable varieties are determined and developed. Soya beans, sun-flower, safflower and small grain oilseeds will have to be tested, butprospects for their imalusion in the crop plans appear reasonable. Sesameand castor beans are grown on a small scale and with low yields; again
research into suitable varieties is essential.
Pulses are an important export product of Ethiopia and further developmentof the market seems possible. Therefore lentils, peas and particularlyharicot beans, which have a short vegetation period, may be successfullyinvolved in the rotation as catch crops.
Cereals will probably be of little interest to the large scale irrigatedfarms, as food is in ample supply in Ethiopia and export possibilities -for the time being - are rather slim.
Maize and sorghum however will certainly be grown by the settler on the
delta and already sizeable areas are planted with these cereals in the Asayita
delta. There will be need of experimental work in order to introduce short
vegetation period and more productive, perhaps hybrid, varieties.
Development of vegetables, fruit and sugar cane production is related to
the establishment of plants and to the home and foreign market situation.
The areas under these crops while initially limited, have reasonable prospects
of subsequently increasing.

52
4. Other Factors
Regulation of High Value CropsAs the above are high value crops and their inclusion in the crop
pattern weighs considerably in maximisation of benefits it may appearadvisable that regulations covering the growing of such type of crops be
enacted. While a'good development policy may consist in giving all theinvestors the opportunity to have a fair share in the benefits of high valuecrops, inclusion of high value crops may provide encouragement and justi-fication for development in the areaswhere more investment will be needed.
Animal Husbandry and Forage CropsIntegration of animal husbandry in the irrigated farming pattern shouldbe given particular attention. This may provide a helpful means to thepromotion of living standards of the pastoralists and prove to be a realisticand efficient approach to the settlement policy with respect to the nomadicpopulations.
Implementation of rational forage crops is essential for agronomicalreasons in order to maintain the fertility status of the soils and build uptheir organic matter content, which anyhow is only moderate in the irrigableplains. It will not be easy to achieve unless forage is consumed on thefarms, the pastoralists being usually reluctant to purchase fodder for theirlivestock. In fact there is little chance that the nomads will be willingto purchase hay or silage produced on the irrigable farms. It would appearmore realistic, therefore, that the farmers endeavour to start buying cattlewhen the dry season is advanced, and nomadic stock has to be kept close tothe watering points in the river or in the canals. The purchased cattle maythen be intensively fed on the irrigated pastures with the help of harvestedfodder. Not only irrigated forage crops, but also other sources of animalfood will be available in the irrigated farms, such as byproducts ofprocessing plants. Thus all stages of the fattening business may be carriedon in the irrigated areas. Market for meat cattle may be easily found asEthiopia is at present striving to export its meat and several relatedprojects are already operational (e.g. the Shashemene abattoirs).
DairyingProgressive development of dairying may also be contemplated since manydairy products are currently imported to Ethiopia, and their consumption isbound to increase with the growing living standards.
Green ManuringUntil the proportion of animal husbandry in the irrigated agriculturebusiness is large enough to allow irrigated forage crops to be sufficientlyextended to take caro of the maintenance of fertility status and organicmatter rates, green manuring should be strongly recommended. Species likesweet clo,ver (Melilotus sp.) or Sesbania which are excellent green manuresand, at the same time, provide reasonably good grazing lands may be consideredas double purpose (green manure and fodder) crops and their introductionappears advisable. At any rate inclusion of soil improving crops in therotational system should be vigorously promoted, and fallowing practicesstrongly discouraged. An appropriate water rates policy may prove veryusefUl in this respect.
-53 -
5. Rotations
Selection of the rotational pattern and respective proportions of differentcrops cannot be suggested without extensive and systematic experimentation. Nor canthe starting date of the agricultural cycle yet be determined because of the lack ofadequate agronomical information. The examples of rather intensive rotations givenon Charts Nos. 9 and 10 herewith should be regarded merely as suggestions for experi-mental work.
They include a cash crop, fibre crops or oilseeds, every year and pulsesand/or cereals as alternative catch crops; legumes, like pulses or ground nutsoccur often, and forage crops or irrigated pastures are introduced in the rotationin order to maintain soil fertility. It is emphasized however that suggested typesof rotations cannot be implemented without an extensive and eystematic use of ferti-lizers. The selection of types of fertilizers, methods and rates of application,etc, will depend on the result of field trials.
The rotational pattern for the Middle Valley differs from that suggestedfor the Lower Plains mainly in the cropping intensity. The former ranges from acropping intensity of 1.75:1 to 2:1. The latter, because of the less favourablenatural conditions and of larger proportion of less mechanized family size farms,provide for 1 to 1.5crops yearly. The proportion of cotton in the rotations ishigh, generally about 4070 of the land would be earmarked for this crop.
Perennial crops, like orchards, citrus and banana plantation, sugar canessisal, etc. are not shown on the rotation charts included. Usually they stay inthe field for more than four years, which is the period of the longest Guggestedrotations. Obviously, care must be given to maintain a high fertility status ofthe soils either by periodic green manuring or by interrow cultivation of legumes.
6, Arboriculture
Several hot springs of appreciable discharge are located in the Middle Valleyand some of them result in marshy areas with a brackish or slightly saline watertable. A thick.growth of gild palms may be observed on the outskirts of suchmarshes. It is very probable that highly productive date palm trees (Phoenixdactylifera), which are known for their tolerance to saline water, may replace theunproductive ones. The same experiment should be made on the Lower,Plains, wheredate palm trees of a poor variety are grown on the spoil heaps along the channelbanks in the Asayita delta area. Only relatively small expenditure and a simplelayout will be required to start the planting of date palm trees which may contribute
considerably to the welfare of the local people.
A riparian forest grows on marshy areas on both banks of the Awash river,which will be difficult to reclaim for irrigation purposes. The largest such
riparian forest is located in a long narrow strip downstream of the Gewani swamps.The existing vegetation consists of valueless trees and shrubs which may be advan-
tageously replaced by productive varieties. Eucalyptus and poplars are reputed
quick growing and useful species for the production of paper pulp and for the packingindustry respectively, and both grow well with a high groundwater level.
Other species may be selected and suggested by the forestry specialists.
In any case experiments in introducing productive trees in the marshy areas which
will not be put under irrigation appear to be highly advisable at an early date.

SUGGESTED CROP ROTATION SCHEMESMIDDLE VALLEY
For the water requirement computations, the agricultural year has been positioned as shown on the above calendarSlight irrigation
I Land occupationNormal irrigation
< <00rf=11-1
1>
'co*-2
Io
(c)
1st agricultural year 2nd agricultural year 3rd agricultural year 4th agricultural year
CCTTeN oREREA_S
PU SES CLOT OJI
EELS
COTTON PULSES
PA T RES
coîîorG-0
UNDS
CAOR
TORRED
B
P
APFER
S
CR
GRMANU
FODiER
EE
qcyr Or P LS S RED P PPER CRASG,REEN9R1------PASTUR
NA UFES _
1
COTTONG
NUTSOLND LsEEDS
C REA S P LES C T ON 01 SEEDSL. L ammmummomIA M J J ASONDJF MA M JJASONDJF M A M J J ASONDJF MA M JJASONDF

CiDT TON
A o N A J JA
SUG G ESTE D CROP ROTATION SCHEMES
LOWER PLA I NS
st agricultural year 2nd agricultural year 3rd agricultural year 4th agricultural year 5th agricuttural year
MAIZE
ETON OR PULSES PASTU
G RO Uk1D NUTS CO TDNqo TON C ER OR PU'LS ED PEPPER PAS U ES
MA ZECO TON OF U_S=S ROUND NLTS
COT TCN
SO N J FM A MJJ
0 LSE E D
A O N
MiCUND NIUTSOR PULSEE
D J A
C TTOCAST R
A 0 N
For the water requirement computations , the agricultural year has been positioned as shown on the above calendarNormal irrigation Slight irrigation
Land occupation r
AM AS 0 N D A
NO6E4 NE MAN RE _E

56 -
Improvement of grazing lands
Simultaneously with the development of irrigated agriculture, action shouldbe initiated for the improvement of grazing lands. Before a long range programme ofbasic improvement of the pastures is devised, through introduction of new speciesand regeneration of existing productive grasses, it will be necessary to preventlocal overgrazing and establish new watering points. A programme of sinking shallowwells in the beds of intermittent water courses is suggested in an Appendix toVolume II. The building of reservoirs and ponds to collect runoff during the rainyseason, and of small dams on seasonal watercourses, may considerably improve theproductiveness of the pastures. Farmers and irrigation authorities may perhapshelp the nomads to initiate the establishment of new watering points, and occasion-ally use their heavy equipment for construction of the reservoirs.
Spreading flood waters from intermittent streams over range pasturestopographically best suited to flooding is another way of increasing the productive-ness of some grasslands. Very simple structures consisting of small barrages acrossintermittent streams and a network of drainage ditches will help to spread floodwaters at little cost. Again, the heavy equipment from irrigated farms may be advan-tageously used for such works.
The establishment of irrigation systems in the Middle Valley and the LowerPlains of the Awash basin will, by consuming the water at present draining into them,contribute substantially to a partial reclamation of the marshlands such as thoseat Gewani, Boyale, Dit Bahri, and in the Asayita Delta.
The pastures on the reclaimed marshes may be fairly productive as the fullscale control of flows makes it possible to regulate the amount of water enteringthe marshlands. Thus, water levels can be regulated and desirable rates of moisturemaintained in the soils all through the year.
Irrigation Water Requ rements and Water quality
As usual in preliminary surveys, no adequate data on the consumptive useof irrigation water in the main development area were available. The estimates ofwater requirements had therefore to be made on the basis of formulae abstractedfrom climatological data : Turc's formula was given preference. Evapotranspirationdata obtained were subsequently applied to the suggested crop pattern and the finalfigures of water requirement.s were computed in relation to the potentially commandedarea. Allowance was made for an irrigation efficiency coefficient of 70f, in theMiddle Valley areas and of 60c/40 for the areas located in the Lower Plains.
For purpose of estimation, it has been assumed that the suggested croppatterns will comprise the rotation discussed in the section of this chapter inequal proportions, so that the final water requirements for the crop pattern may beconsidered as an arithmetic mean of the specific water requirements for eachsuggested rotation.
The following table No. 7 shows the average monthly and yearly figuresof computed water quantities needed in the development areas of the Awash Valley.
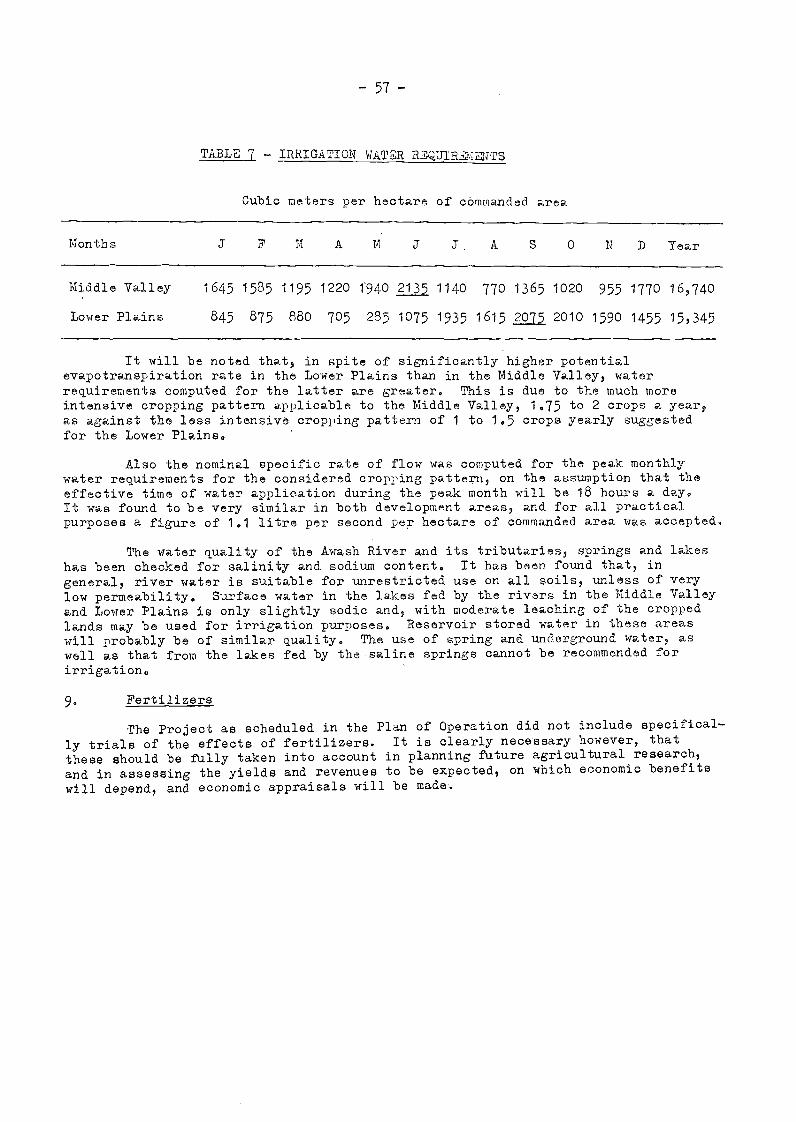
- 57 -
TABLv, 7 - IRRIGATION WATER REQUIREMENTS
Cubic meters per hectare of cOmmanded area
It will be noted that, in spite of significantly higher potentialevapotranspiration rate in the Lower Plains than in thé Middle Valley, waterrequirements computed for the latter are greater. This is due to the much moreintensive cropping patterr applicable to the Middle Valley, 1.75 to 2 crops a, year,
as against the less intensive cropping pattern of 1 to 1.5 crops yearly suggestedfor the Lower Plains.
Also the nominal specific rate of flow was computed for the peak monthlywater requirements for the considered cropping pattern, on the assumption that theeffective time of water application during the peak month will be 18 hours a day.It was found to be very similar in both development areas, and for all practicalpurposes a figure of 1.1 litre per second per hectare of commanded area was accepted.
The water quality of the Awash River and its tributaries, springs and lakeshas been checked for salinity and sodium content. It has been found that, ingeneral, river water is suitable for unrestricted use on all soils, unless of verylow permeability. Surface water in the lakes fed by the rivers in the Middle Valleyand Lower Plains is only slightly sodic and, with moderate leaching of the croppedlands may be used for irrigation purposes. Reservoir stored water in these areaswill probably be of similar quality. The use of spring and underground water, aswell as that from the lakes fed by the saline springs cannot be recommended forirrigation.
9- Fertilizers
The Project as scheduled in the Plan of Operation did not include specifical-
ly trials of the effects of fertilizers. It is clearly necessary however, thatthese should be fully taken into account in planning future agricultural research,
and in assessing the yields and revenues to be expected, on which economic benefits
will depend, and economic appraisals will be made.
Months A M J J A S 0 N D Year
Middle Valley
Lower Plains
1645
845
1585
875
1195
880
1220
705
1940
285
2135 1140
1935
770
1615
1365
2075
1020
2010
955
1590
1770
1455
16,740
15,3451075

._ 58-
CHAPTER VII - CLIMATOLOGY AND HYDROLOGY
Arrangements
With the purpose of correlating actually measured flows at a number ofpoints on the main river and its tributaries, with the rainfalls observed on therespective catchment areas, a network of rainfall and river gauging stations wasestablished. Observations from 120 rain gauges, out of which 95 were installed bythe Project team, were used to compute rainfall maps. Seven climatological stationsrecorded data on temperature, relative humidity, solar radiation, insolation, evapo-ration, wind velocity and direction. Thirty river gauging station% were established,out of which three had cable ways and eight had light cable ways,24 gauging stationswere equipped with automatic water level recorders. Systematic measurements ofsediment load were also carried out at each gauging station.
The hydrometric and climatological network was installed in the course of1962. Observations and measurements lasted for three rainy seasons. The purposeof the first seasonls measurements was mainly to adjust the stations and to completethe installations in the light °fin-service experience. Results from two otherseasons' measurements were processed and, a series of normal values, usable for theProject, were estimated both in respect of the climatological and the hydrologicaldata. On the basis of these normal values, a hydrological balance for the AwashRiver Basin was drafted. For budgetary reasons, the systematic hydrometric surveydid not include the deltaic region downstream from Dubti. The relevant component ofthe hydrological balance is therefore a tentative estimate.
The results of climatological and hydrological studies are fully discussedin Vol.III of this Report. Only a brief summary of the principal findings is givenbelow.
Climatology
i) Rainfall
Rainfall conditions in Ethiopia are governed by seasonal movements of theInter-Tropical Front. These movements are mainly due to the cyclic variationof the stints position, and are modified by somewhat irregular behaviour ofthe Egyptian high. One characteristic feature of rainfall conditione inEthiopia is the relative constancy of their seasonal timing, which theyderive from the movements of the Inter-Tropical Front.
The very pronounced overall relief features of the Awash basin (which ispart of the Great African Rift extending from Lake Nyasa to the Dead Sea)impart a westerly direction to the moist air stream supplying the majorrainfall to the basin. During a well-established rainy season, this airstream comes in from the south-west and proceeds north-eastward down theAwash Valley, gradually exhausting its potential rainfall on the way. Themarked changes in the relief of the Awash basin and the exposures of thevalley hillsides decisively affect the rainfall experienced during a normalyear. The effect of these major factors is the same throughout a givenregion, in which rainfall during the year is found to vary linearly withaltitude. The gradient of this relationship typifies the region.
The month-by-month distribution of rainfall during a normal year can beused to give a picture of rainfall conditions. By expressing the rainfallfor each month in relation to annual rainfall, it was found that the pro-portional rainfall distribution over the various months of the year ispractically the same at several gauging stations. This justifies the
- 59 -
subdivision of the Awash basin into a number of different climate areas, eachwith its characteristic month-by-month rainfall distribution. (See Map No. 11).
A characteristic feature of rainfall conditions in the Awash basin isthat there are two rainy seasons in the year, one a period of minor rainsfrom March to May/ with the other - the main rainy season - beginning inJuly and lasting till September. The secondary rainfall minimum, in June,is more pronounced in the arid northern part of the basin. It is hardlyappreciable in the upper basin in the south, where the rains are practicallycontinuous from March to September.
The following are a few significant normal rainfall figures
During ihe seven-month period from March to September including bothrainy seasons, the Upper Awash basin receives over 90% of its total annualrainfall) while the Middle Valley and Lower Plains only receive about 85%of their respective annual amount. Rainfall during the dry season is thusproportionately more appreciable in the arid zone than in the humid sub-tropical part of the basin.
Rainfall in the basin almost always occurs in distinct individual heavydownpours affecting areas a few ten square kilometres in extent. Thesedownpours often start as comparatively moderate showers which then graduallyincrease in intensity. At its climax, the downpour suddenly ceases. In thearid zone, the day's rainfall - and frequently also the month's - occurs as asingle downpour not lasting for more than four or five hours. Hillsides witha humid sub-tropical climate may receive repeated showers during the sameday - three at most at the same place - the total duration of which may beanything up to 12 or 15 hours, though with none of theta individually lastingmore than eight or nine hours.
The very irregular discontinuous rainfall distribution in the form oflocal downpours shows the effect of relief features on rainfall conditionsin the Awash basin; this results in irregular daily inflows from thetributaries of the Awash during the rainy season.
As a general rule, the daily intensity of rainfall is not particularlyhigh in the Awash basin; the highest, recorded, 140 mm in a day, occurred inthe Lake Abe region, and its probability is estimated as about once in 500years. An even lower probability can be assumed for a rainfall of 120-130mm/day in the high valleys; though this figure was actually recorded, thiswas at the beginning of the rainy season so that it should be viewed with
some caution. The computation shows that during a well-estimated rain rainyseason, rainfall amounts of 120 ram/day in the wettest part of the basinwould on an average only be experienced once a hundred years. In the mostabundantly supplied part of the Awash basin, above an altitude of 1,400 mydaily rainfall values in fact more frequently fluctuate between only 30 mm
and 40 mm.
Upper Basin upstream from Koka dam 0 1/000 mmMiddle Valley between Koka and Hertale 850 mmLower Valley between Hertale and Dubti ..................... 610 mmLower Reaches between Dubti and Lake Abe 215 mm
The average normal annual rainfall figurethus works out at about 710 mm.
for the whole of the Awash basin
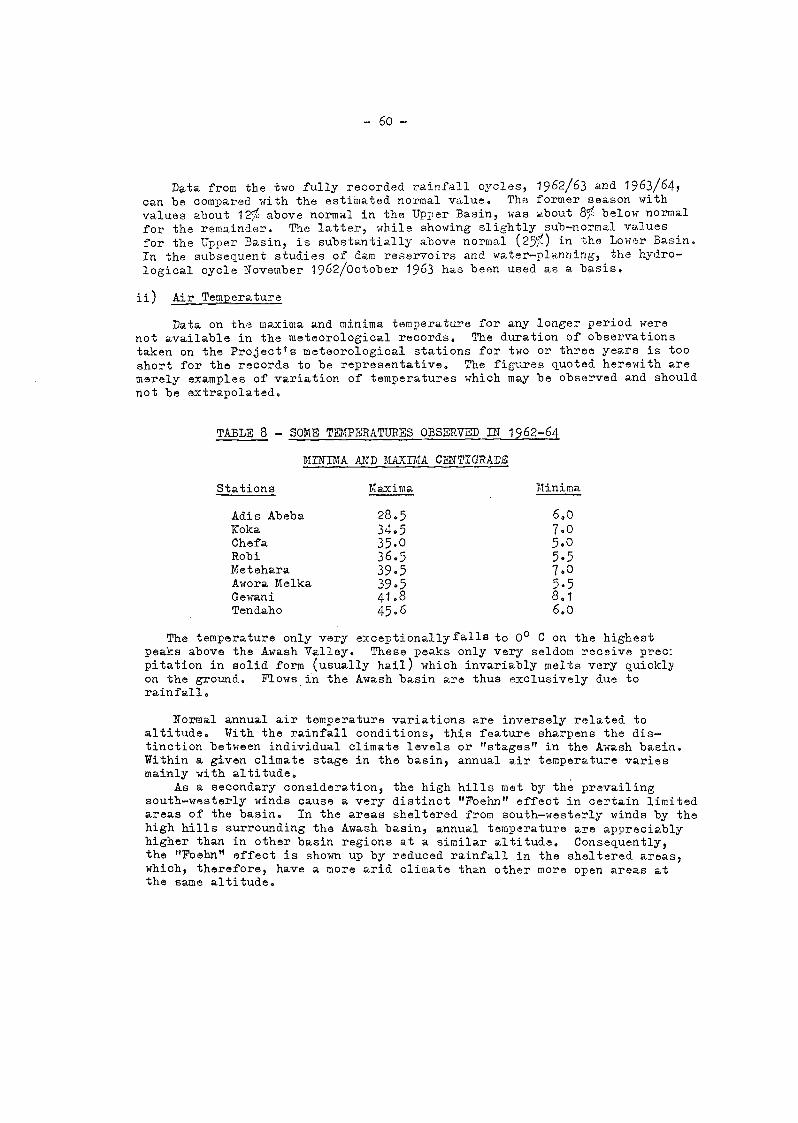
-6o-
Data from the two fully recorded rainfall cycles, 1962/63 and 1963/64,can be compared with the estimated normal value. The former season withvalues about 127 above normal in the Upper Basin, was about 807. below normal
for the remainder. The latter, while showing slightly sub-normal valuesfor the Upper Basin, is substantially above normal (25) in the Lower Basin.In the subsequent studies of dam reservoirs and water-planning, the hydro-logical cycle November 1962/October 1963 has been used as a basis.
ii) Air Temperature
Data on the maxima and minima temperature for any longer period werenot available in the meteorological records. The duration of observationstaken on the Projectrs meteorological stations for two or three years is tooshort for the records to be representative. The figures quoted herewith aremerely examples of variation of temperatures which may be observed and shouldnot be extrapolated.
TABLE 8 - SOME TEMPERATURES OBSERVED IN 1962-64
MINIMA AND MAXIMA CENTIGRADE
Stations Maxima Minima
The temperature only very exceptionallyfalls to 00 C on the highestpeaks above the Awash Valley. These peaks only very seldom receive prec:pitation in solid form (usually hail) which invariably melts very quicklyon the ground. Flows in the Awash basin are thus exclusively due torainfall.
Normal annual air temperature variations are inversely related toaltitude. With the rainfall conditions, this feature sharpens the dis-tinction between individual climate levels or "stages" in the Awash basin.Within a given climate stage in the basin, annual air temperature variesmainly with altitude.
As a secondary consideration, the high hills met by the prevailingsouth-westerly winds cause a very distinct "Foehn" effect in certain limitedareas of the basin. In the areas sheltered from south-westerly winds by thehigh hills surrounding the Awash basin, annual temperature are appreciablyhigher than in other basin regions at a similar altitude. Consequently,the "Foehn" effect is shown up by reduced rainfall in the sheltered areas,which, therefore, have a more arid climate than other more open areas atthe same altitude.
Adis Ababa 28.5 6.0
Koka 34.5 7.0Chefa 35.0 5.0Robi 36.5 5.5Metehara 39.5 7.0Awora Melka 39.5 5.5Gewani 41.8 8.1Tendaho 45.6 6.0

The following are a few significant normal annual air temperature figuresfor the basin
TABLE 9 - AWASH BASIN - AVERAGE ANNUAL TEMPERATURES
Regions exposed to prevailingsouth-westerly winds
High tableland (plateaux),average altitude 10,000 ft.
Upper Awash Basin, around5,500 ft. altitude, betweenDebre Zeyt and Koka.
Upper Valley around4,000-ft. altitude, betweenKoka and Awash Station.
Middle Awash Valley, around3,000 ft. altitude, betweenAwash Station and Awora Melka
Lower reaches of the Awash,around 1,500 ft. altitude,near Tendaho
T°C
- 61 -
Areas sheltered from southwesterly winds ("Foehn" effect) T°C
No "Foehn" effect, as there are13.5 no high hiils above this region
Upper Awash Valley and thesecondary rift north of Debre
19.5 Sina, averaging about 5,500 ft.
in altitude
Chercher piedmont area towardsDire Dewa, average altitude
23.5 4,000 ft.
26.2No "Foehn" effect, as no highhills dominate this region
29.0
21.0
23.9
By considering monthly to annual air temperature ratios, temperatureconditions were defined in comparable terms for various points in the basin.
Associated with rainfall conditions, temperature conditions typify regional
climates, and show up the appreciable difference between them.
As a general rule, monthly air temperatures are at a minimum in December
and January, then gradually rising to a maximum value at a time of the year
depending on the aridity of the locaa climate in each region. Thus, in the
most arid reEions of the Awash basin (Middle Valley and'Lower Plains) peak
monthly temperatures (155 to 205 above annual average) invariably occur in
June, between the two rainy seasons. In the less arid regions, the highestmonthly temperatures occur during the two months of.the "secondary" rainy
season from March to May; they are only about 105 above the annual mean.
Monthly air temperatures decrease sharply with the onset of the main
rainy season and reach a secondary minimum throughout the basin near the
end of the rains.
in) Evaporation
(a) The results of evaporation measurements with a tank sunk into the ground
at a few points in the Awash Basin have enabled normal evaporation rates to
be estimated from the surface of a small and very shallow free surface of
water.Normal annual evaporation rates measured in this way were found to
depend closely on altitude, thus confirming the important effect of altitude
in the division of the Awash Basin into several distinct climate regions.
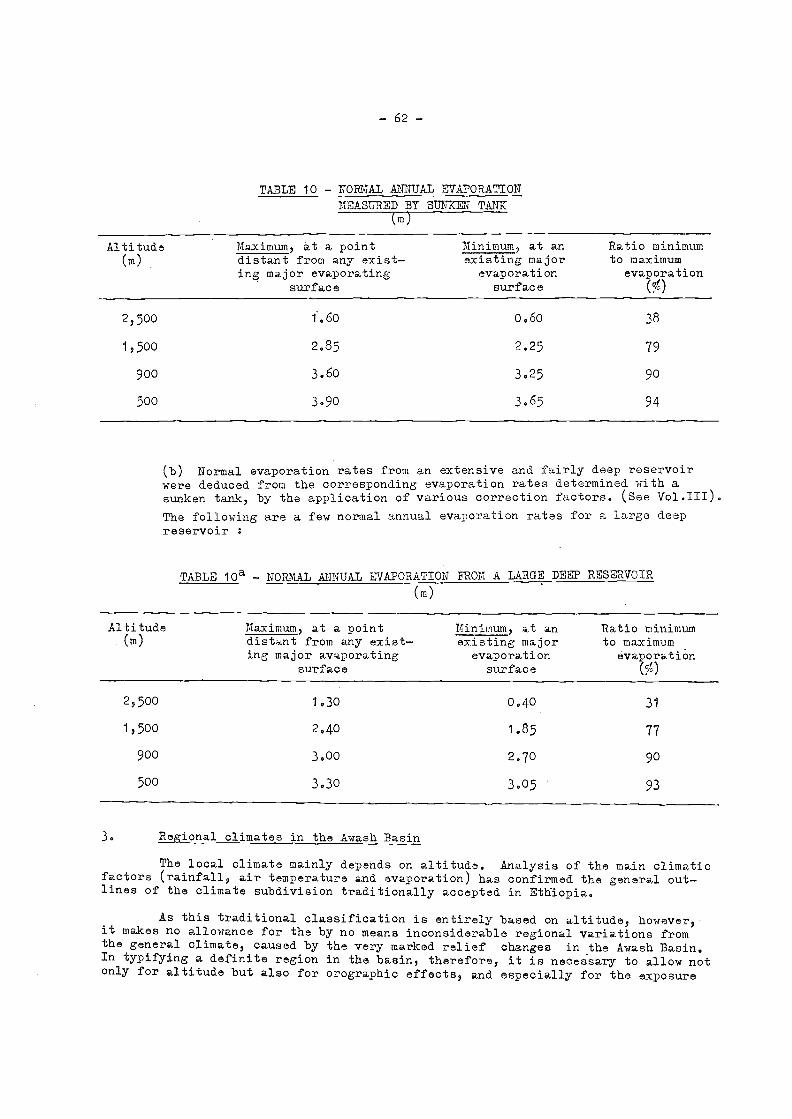
Altitude(m)
- 62-
TABLE 10 - NORMAL ANNUAL EVAPORATIONMEASURED BY SUNKEN TANK
(m)
Maximum, at a pointdistnt from any exist-ing major avaporating
surface
(b) Normal evaporation rates from an extensive and fairly deep reservoirwere deduced from the corresponding evaporation rates determined with asunken tank, by the application of various correction factors. (See Vol.III).
The following are a few normal annual evaporation rates for a large deepreservoir
TABLE 10a - NORMAL ANNUAL EVAPORATION FROM A LARGE DEEP RESERVOIR
(m)
Minimum, at anexisting major
evaporationsurface
Ratio minimumto maximum
evarration5)
3. Regional climates in the Awash Basin
The local climate mainly depends on altitude. Analysis of the main climaticfactors (rainfall, air temperature and evaporation) has confirmed the general out-lines of the climate subdivision traditionally accepted in Ethlopia.
As this traditional classification is entirely based on altitude, however,it makes no allowance for the by no means inconsiderable regional variations fromthe general climate, caused by the very marked relief changes in the Awash Basin.In typifying a definite region in the basin, therefore, it is necessary to allow notonly for altitude but also for orographic effects, and especially for the exposure
Altitude Maximum, at a point Minimum, at an Ratio minimum
(m) distant from any exist- existing major to maximuming major evaporating evaporation evaporation
surface surface (5)
2,500 1.60 0.60 38
1,500 2.85 2.25 79
900 3,60 8.25 90
500 3.90 3.65 94
2,500 1.30 0.40 31
1,500 2.40 1.85 77
goo 3.00 2.70 go
500 3.30 3.05 93

KOLLAdry or humid
WOINA DEGA
- 63 -
of the valley hillsides to the prevailing south-westerly winds.
The traditionally accepted Ethiopian classification for climate regions inthe Awash Basin is set out in detail in the following table 11.
TABLE 11 - CLIMATIC ZONES
BEREHAsemi-arid Semi-arid between 600-700 m Temperature gradient -
and 1100-1200 m -0.84°C/100 Rainfalla) as for an arid region
throughout
Sub-tropical between 1100-1200 m Hillside exposure governsand 1700-1800 m climate dryness or humi-
dity. Possible "Foehn"effect.
Sub-tropical between 1700-1800 m Temperature gradienthumid and 2400-2500 m without "Foehn". -0.445
-0.445°C/100 m Possible"Foehn" effect.
below 600-700 m Temperature gradient --0.34°C/100 m
) temperature gradientssubjects to change by"Foehn"
No "Foehn" effect.Changing temperaturegradient
No "Foehn" effect.Temperature gradientprobably not varyingappreciably about-0.445°C/100 m
Ethiopian General type Altitude Rainfall and temperatureClassification climate area range features
BEREHA
sub-de sert Arid
DEGA Sub-tropical- above 2400-2500 mhumid and cold

DRAWING N2 12
Monthly inflows ( hm 31I i ii
1 1
1
i 1
i I
1 1
1
i i
I I
II 1
\
I
I i
AWASH INFLOWS RECORDED AT VARIOUS1
1
\ GAUGING STATIONSI
1
1
1
1
\
I
I
I'
\1
I
I
lij
i
1
1
I 1
1
I
I
I
1
1
Ì
I
.I
1
i
1
\
11\
ii\lit 1\ I
1
I
I
I
I
1
/ \I
\111
1
I
1
I II \ I
\11 II
,
\
I
ll /
k I
11 ,/'\ II I
1
/ 1;\
\
i\
I
A\
i\
\\ //\
iAWASH ,. \ /.
Station 11
I\ . "11
1_/1-..
1I
I
i ) 1
1 I
\ -
KOKA Vf'
1
(throughturbines)
I
DUB1_:-----r ---\\
1 \JMELKA GORGE / \I
/ V
HERTALE 4:2.--C-311A1616S210INID 663 '
JIFiMA[M111JIJIAISIOIN D Fi 9641A11411,1 0.11AIS/0
580 57! .A92 589 685
- 65 -
Hydrology - General.
The hydrology of the Awash Basin, as at present known, is fully discussed inVolume III. In the present chapter is given a brief outline of the main relevantfigures, with comments, in order to provide to the reader a general picture of thewater resources available, and thus enable him to appreciate the validity and signifi-cance of the proposals for development discussed in later chapters.
From the data observed at the various river gauging stations for the hydro-logical years 1962/63 and 1963/64, annual flow balances for these years were computed.The results were then studied with reference to the relevant records of rainfall atstations in the Basin, some of which covered considerable periods of years¡ themaximum reliable period being the record of rainfall at Adis Abeba from 1946 to 1964.After statistical analysis of all available climatological data, appropriate corree.lations were established. Using these, it was found possible to estimate reasonablefigures for the "normal" total annual flows at various points. Information is as yetinsufficient to break down these into "normal" monthly flows. However, Fig. No. 12,showing flows at various points observed in 1962-1964, gives some indication of thevery wide variations which occur in the flows at different times of the year.Already, however, the flows from the Upper Valley are regulated and modified by theaction of the Koka reservoir, the effects of which can be traced right down thecourse of the river to the Lower Plains, though gradually diminishing in absoluteand in relative magnitude. It will be realised that records of measured flows in,at most, 3 years, and rainfall records at stations which are few in number comparedwith the vast extent, some 70,000 km2, of the whole Basin, are not sufficient toprovide more than a tentative and approximate estimate of "normal" flows. Further,it is the extreme conditions, and notably the extremely low conditions, which mayoccur, that cause the real difficulties. Systematic and comprehensive observationsof both river flows and rainfalls, over a good number of years, will be necessary tomake possible really satisfactory assessments of flows, losses, and so on. It isimportant that these observations at all requisite stations, by reliable observersunder trained supervision, should be continued without any break or interruption.Additional stations should be equipped and put into use as required. Further, the
analysis of observations by skilled staff, year after year, must be continuedregularly, if essential data of flows are to be available as the basis for soundplanning of development.
Analysis of Normal Annual Flows
The estimated amounts of inflows, losses, and outflows, in a normal year,for various reaches of the river, are shown on Map No, 13. In what follows, the samefigures are set out in tabular form, with the object of giving a reasonably repre-sentative picture of the hydrology of the Basin as a whole.

66
Passed through turbines to river dowstream of dam
Upper Valley : Koka dam to Awash Station. Catchment 7,320 km2Inflow from catchment 1,400add Awash flow from (i) 1,200
2,600less water used and evaporation lossesless percolation losses
Flow at Awash Station
Middle Valley: Awash Station to Hertale. Catchment 15,310 km2Inflow from catchment 1,595add springs 10add Awash flow from (ii) 2,460
4,065less losses by spill, evaporation,percolation anduseflow at Hertale
Middle valley: Hertale to Dubti. Catchment 29,990 km2Inflow from catchment 1,915add springs 70add Awash flow from (iii) 2,840
4,825less losses by spill, evaporation, percolationand useFlow at Dubti
v) Lower Plains : Dubti to Lake Abe.Catchment 7,250 km2Data are not yet available for a proper estimate ofthe flow balance. But a tentative breakdown of thefuture normal balance (without Tendaho dam or furtherdevelopment) may be approximately as followsInflow from catchmentadd Awash inflow from (iv)
losses in swamps, flood plain and lakes, useafor irrigationEvaporation from Lake Abe
10
3,490
3,500
1,4402,060
3,500
1,200
1,3353,490===..
TABLE 12 r- ANALYSIS OF ANNUAL RUNOFF IN "NORt,IAL" YEAR
i) Upper basin to Koka Dam. Catchment 11.250 km2 hm3
Inflow to reservoir 1,750add rainfall on the reservoir 145
1,895less evaporation estimated at 315less losses by percolation 380
695
12515
1402,460
1,2252,840

- 68 -
6. Comments on Hydrological Factors.
Thl. losses by percolation from Lake Gelilea, estimated to be about380 hmi, are a serious diminution of the available flow. In the interestsboth of irrigation and of power, every effort should be made to find outthe causes, and to apply remedial measures so far as possible. If theftiversion of water from the River Meki is possible (as discussed in ChapterVIII), this will result in higher levels of water in the Lake. If, asappears probable, the rate of percolation loss is related to the water level,this would mean that part of the water diverted from the Meki, at consider-able trouble and expense, would merely go to increase the losses. Everyeffort should be made to avoid this. It appears that part of the amountlost, up to perhaps one quarter, may come back to the river between Kokaand Wenji, as "return flow". But even so, it will be most desirable toreduce the losses by percolation from the Lake.
As already mentioned in paragraph 4 above, Koka Reservoir alreadyexercises a marked regulating effect on the flows of the Awash downstreamóf the dam. This is illustrated by the following figures, recorded atAwash Station, 150 km further down.
1953-58
no reservoir
1960-64
reservoir in use
m3/s
20-2423-30
200-250325
Upper Valley - Koka to Awash Station
In this region the factor of run-off is appreciably higher than in theUpper Basin above Koka, due in some measure to the steep hillsides and theconsiderable rainfalls in the Chercher area. The river here flows in a valleyrelatively free of silt, with outcrops of porous formations and/or faultswhich encourage leakage.
Middle Valley - Awash Station to Hertale
Vegetation in this region is sparser than in the region from Koka toAwash Station, and has less effect in modifying inflows. There are indi-cations that the soils have a somewhat lower capacity for water retention.Losses in the flood plains and marshes downstream from Melka Sedi are)onsiderable.
-) Middle Valley - Hertale to Dubti
The hydrological conditions of this reach are similar to those of the.each upstream of it, though with even heavier losses by spill etc;, and alower capacity for water retention. Substantial inflows come from springs,notably in the region of Gewani, and to a lesser extent downstream. Largolosses by percolation do not appear likely to occur, since in this reachsedimentation is considerable.
m3/s
Absolute minimum flow 0.1Minimum flow - 1st decile 0.2Maximum flow - 9th decile 380Absoluto Maximum 1000
-69
vi) Lower Plains Dubti to Lake Abe.
In this region, because of the complex nature of the natural channelsof the river, and the variability of its flows from one year to another,measurement of discharges WR.Q not attempted during the Survey. Below Dubti,no appreciable runoff from local rainfall reaches the river, except veryoccasional and intermittent flows from wadis into Lake Abe, which are unlikelyever to contribute more than perhaps 10 1mm3 to the annual flow. The levelsin Lake Abe will rise and fall according to the balance between the inflowsreaching it, and the evaporation losses corresponding to the levels at anytime; approximately, the levels may range from about 245 to 253 m abovesea. level.
7. Flood Characteristics.
Flood spates in the Awash and its major tributaries may occur in frequentsuccession, according to the incidence of rainfalls. The fact that individual rainstorms are limited both in duration and in extent has a moderating effect on theresulting flood peaks. During spates, the spilling of water on to the considerablearea of flood plains below Awash Station also moderatesthe peaks in the MiddleValley and the Lower Plains. From physical evidence of past very high floods atvarious points in the Awaah Valley, combined with the observations of flows made in1962-1964, it has been found possible to estimate the peak rates which have actuallyoccurred in the past. Statistical analysis indicates that the probability of suchflood rates must be considerably less than once in 1000 years.
Already, of course, the existence of the Koka reservoir modifies all floodpeaks. It has been possible to recalculate the maximum flood rates to be expected,allowing for this. These are shown in Table 13.
It is both prudent and reasonable to allow for an exceptional maximum flooddischarge when designing any hydraulic development project. In the present case, thefigure for each site along the Awash downriver from Koka should be between thelimits given by the morphological flood discharge and its reduced value. For riversites not affected by the Koka dam, the maximum flood should be assumed equal to themorphological flood.
Proposed maximum flood discharge assumptions for various points in the basinare tabulated above the recurrence frequency of all these floods is well in excessof 1,000 yers.
8, Erosion and Sediment Load
i) Field Erosion
Problems related to erosion in the cultivated lands are discussed in Vol. II.It has been found that slope, runoff evacuation and marked dryness of ground during
long periods are the main factors of erosion in the farmland. It is accelerated by
lack of protective vegetation cover, deforestation, overgrazing on the harvestedfields and inadequate tilling at the end of the dry period. Unprotected fields are
severely ravaged by rills and gullies during the heavy showers at the beginning of
the rainy season. Besides, on the relatively gentle slopes no control measures, suchas terracing, bunding or contour ploughing are applied, as frequently happens on
steeper slopes.
Suggestions for erosion control methods indicate the need for improvement of
cultivation practices, drainage, reduction of velocity in the fl9w in gullies and,
first of all) the necessity for planting protective bands of trees across the slope.

TABLE 13 - ESTIMATED MAXIMUM FLOOD DISCHARGE DATA FOR VARIOUS POINTS ALONG THE AWASH
(Average probability - onoe in 1.000 years)
- 70 -
Position in
Before Koka Dam Koka Dam in Service
Basin area M9rphological flood Basin area Maximum flood reduced Maximum flood
hydrographic from sourcE downstream by influence of Koka discharge
network ( 2) proposed forfrom Koka
(1/s/ ) (m3/s) (km2) (1/s/km2) (m3/s)spil],ways
(m-Vs)
ivers not affected 12y_ Lukeelilea Koka Reservoij
MaLI to MEKI Village 2,430 124 300 300KESEM to AWORA MELKA 3,135 450 1,400 1,400KEBENA Gauging Station 1,245 1,040 1,300 1,300AWASH to KOKA Dam
vers affected b Lake Gel* e
11,250 92 1,050 1,050
AWASH to METEHARA 15,450 72 1,100 4,200 210 880 i,u00AWASH to AWASH Station 18,570 60 1,100 7,300 130 970 1,050AWASH to MELKA SEDI 20,750 55 1,150 9,500 110 1,030 1,100AWASH to MELKA WARAR 26,150 44 1,150 14,900 70 1,050 1,150AWASH to HERTALE 33,880 26 900 22,650 36 800 850AWASH to TENDAHO 59,500 18 1,070 48,280 21 1,000 1,000AWASH to DUBTI 63,870 17 1,100 52,650 19 1,000 1,000

However, erosion being a national problem, the measures suggested should fitinto the national programme for erosion control.
Implementation of such a programme implies
the establishment of a national organization for water and soilconservation;the subdivision of the country into regions, each covering one bigwatershed;the training and placement of technical staff specializing in educatingfarmers on cultivation practices and capable of directing operations forthe control of waterways;appropriate legislation effectively enacted.
ii) Specific Degradation of a Whole Watershed
It appeared useful to complete studies of field erosion by studying thefinal effect of erosion in a whole watershed, in the form of sediment transportationby rivers.
This reflects the capacity of a watershed, considtred as a whole, forlosing or retaining eroded materials.
On the basis of sediment load measurements at the g;tuging stations, it waspossible to determine thm concept of "specific degradation", i.e. ratio between thenet exportation of sediments to the area of individual subbasins.
The following Table No. 14 shows thm normal vgaues of "specific degradation"
TABLE 14 AWASH BASIN SEDIMENT LOAD AND SPECIFIC DEGRADATION
Rainfall
stations Limits Area(km 2)
Gefersa
71
Catchment area Normal Sedimen load
(106 Specific egradationtons) (t/kmVyear)
Awash at Melka Kentare 4,440 3.752 845Hagere Hiywet
Adis AbebaAkaki Akaki at Akaki Village 982 0.295 300Debre Zeyt Mojo at Mojo Village 1,205 2.110 1.750
Awash between MelkaKentare
Siltu and Melka Gorge 3,283 2.948 900Koka Awash at Melka Gorge '7,723 6.700 870Nazret Meki at Meki Village 2,432 0.365 150Wenjii

Regions
Eastern slopes of the Central Plateau
Southern gentle slopes of the Central Plateau
Arid Lowlands downstream of Gewani Swamps
North Western slopes of Chercher Moutains
Middle Valley between Koka Dam and Gewani Swamps
- 72 -
TABLE 1 4 - SEDZKENT LOAD AND SP'CI C DEGRADA ON (Cont'd)
Are (106 Specific(km) ) tons) degradation'
t/km2/y ear
Data collected were processed in relation to physical relief and rainfallfactors; on the basis of this analysis, the Awash basin has been subdivided, fromthe specific degradation point of view, into five main regions
Normal Specific Degradation
about 1,200t/km2/year
about 850t/km2/year
about 850-900t/year
about 400t/km2/year
about 150t/km2/year
The main factors of the specific degradation are physical relief and especiallylack of vegetation cover; climatic factors, in particular rainfall intensity,appear to be of secondary importance. This may be seen when comparing the mostheavily eroded, extensively cultivated Mojo basin with the adjacent southern slopesof the Plateau, bearing more abundant natural vegetation. The same is true of thewell-covered sloping hillsides of Chercher mountains where specific degradation is
Rainfall Catchment area Normal sediment load
Sire Geleta (Gauging station)Awash between Koka and
Gelemso MeteharaAwash between Metehara
Awash-Station and Awash - StationAwash between Koka andAwash Station
Sheno Upper Kesem (GaugingStation)
Megozes Kesem at Awora MelkaAnkober Kebena (Gauging Station)Chacha Awash between Awash St
StationDebre Birhan and HertaleSela Dingay Awash between Koka
and FertaleDebre Sina Jawaha (Gauging StationChefa Jara (Gauging StationKembol cha Borkena (Swamps InletDese Borkena (Swamp OutletFayk Mile (Gauging StationWeldya Awash between FertaleWichale and bubtiBati Awash at Dubti'
745 0.210 280
4,240 0.870 205
3,050 1.250 400
7,290 2.120 290
40 0.052 1,300
3.570 1,1401,245 1.520 1,220
15,339 3.070 200
22,629 5.190 230565 1.96o 3,480193 0.054 280388 0.570 1,460
1,735 o o4,350 3.66o 840
29,988 27.600 92052,617 32.790 620
stations Limits
-73-
much lower than in other mountainous regions with similar rainfall.
iii) 3ediment Load in the Rivers
Soil particles worn away from agricultural lands are conveyed by the flowof streams and rivers. Before they deposit in lakes) storage reservoirs or swamps,the sediment load of the rivers is usually responsible for the instability of riverbeds.
An attempt has been made to delineate the main deposition areas in theAwash basin. Water discharged from the Koka power plant is almost clear; thesediment load conveyed from the upper reaches of Awash River is therefore depositedin the Gelilea Lake. Fortunately the bulk of Koka catchment area is subject torelatively slight erosion.
The catchment area of the Middle Valley includes the severely eroded easternslopes of the High Plateau, but in general the specific degradation of this area isthe lowest in the Awash basin. Extensive swaMps and floodable areas act as effectivesilt-traps; they appear to be rather more efficient in the Middle Valley, upstreamof Hertale gauging station, tIlan downstream of this point.. A possible explanationis the relatively well developed hydroEraphic network of natural channels in thelarge Gewani swamps. Flow velocity in these channels is high enough to convey outof the swampy area large part of sediment load, which do not deposit in the area.Besides a considerable part of the sediments conveyed by the torrential tributaries,which usually do not reach the main river, is probably deposited on the alluvialplains, especially on the left bank. This explains the relatively low sediment loadmeasured at the Hertale gauging station.
Also, in the extensive swamps stretching from Gewani to the confluence withthe Borkena river depositing of sediments is probably active. However) the sedimentload increases considerably in the river during its course through the severelyeroded region downstream of Gewani swamps. This is certainly in relation withextensive tracts of vegetationless "badlands" located close to the rilrerbed on
both banks.
The Lower Plains are natural deposition areas. This results in the veryflat ground slope which communicates an extreme instability to the riverbed and itsnumerous shifting meanders. There is little hope of stabilising the riverbed inthe Lower Plains unless floods are brought under effective control. The observations
of the 1964 floods, however) may suggest that the removal of fallen trees and débriswhich often obstruct the riverbed, may to some degree provisionally reduce the extentof the inundations) prevent the building up of new channels, and the diverting intothese new channels of a substantial part of the flow.
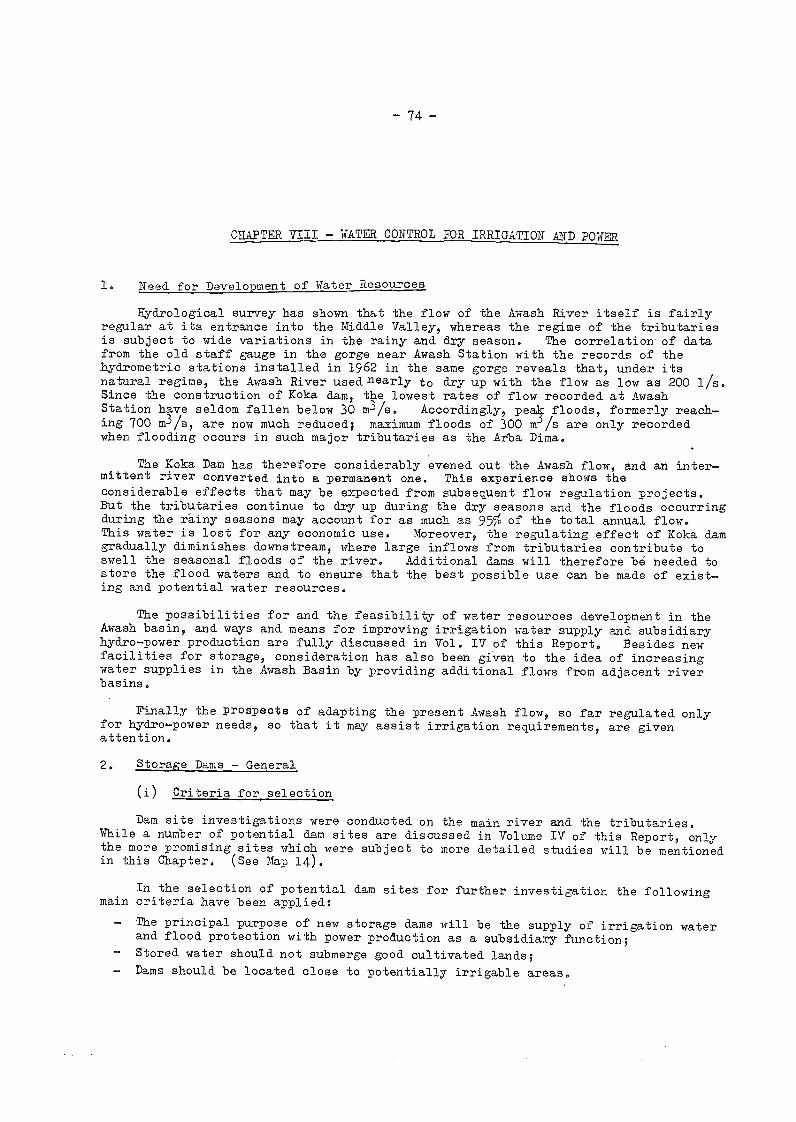
74
CHAPTER VIII - WATER CONTROL FOR IRRIGATION AND POWER
Need for Development of Water Resources
Hydrological survey has shown that the flow of the Awash River itself is fairlyregular at its entrance into the Middle Valley, whereas the regime of the tributariesis subject to wide variations in the rainy and dry season. The correlation of datafrom the old staff gauge in the gorge near Awash Station with the records of thehydrometric stations installed in 1962 in the same gorge reveals that, under itsnatural regime, the Awash River used nearly to dry up with the flow as low as 200 l/s.Since the construction of Koka dam, the lowest rates of flow recorded at AwashStation have seldom fallen below 30 m3/s. Accordingly, pealf floods, formerly reach-ing 700 m3/s, are now much reduced; maximum floods of 300 mJ/s are only recordedwhen flooding occurs in such major tributaries as the Arba Dima.
The Koka Dam has therefore considerably evened out the Awash flow, and an inter-mittent river converted into a permanent one. This experience shows theconsiderable effects that may be expected from subsequent flow regulation projects.But the tributaries continue to dry up during the dry seasons and the floods occurringduring the rainy seasons may account for as much as 955 of the total annual flow.This water is lost for any economic use. Moreover, the regulating effect of Koka damgradually diminishes downstream, where large inflows from tributaries contribute toswell the seasonal floods of the river. Additional dams will therefore bé needed tostore the flood waters and to ensure that the best possible use can be made of exist-ing and potential water resources.
The possibilities for and the feasibility of water resources development in theAwash basin, and ways and means for improving irrigation water supply and subsidiaryhydro-power production are fully discussed in Vol. IV of this Report. Besides newfacilities for storage, consideration has also been given to the idea of increasingwater supplies in the Awash Basin by providing additional flows from adjacent riverbasins.
Finally the prospects of adapting the present Awash flow, so far regulated onlyfor hydrcp-power needs, so that it may assist irrigation requirements, are givenattention.
Storage Dams - General
(i) Criteria for selection
Dam site investigations were conducted on the main river and the tributaries.While a number of potential dam sites are discussed in Volume IV of this Report, onlythe more promising sites which were subject to more detailed studies will be mentionedin this Chapter. (See Map 14).
In the selection of potential dam sites for further investigation the followingmain criteria have been applied:
The principal purpose of new storage dams will be the supply of irrigation waterand flood protection with power production as a subsidiary function;Stored water should not submerge good cultivated lands;
Dams should be located close to potentially irrigable areas.

75
In relation to these criteria several potential dam sites identified under theProject's operations have been discarded. Some possible dam sites in the gorges ofthe Middle Valley appear more suitable for power production than for irrigationpurposes. A dam site on the Awadi River would have too small a storage capacity.One on the Borkena River would result in drowning excellent cultivated lands. Thoseon the lower Awash at the confluence with Ledi or on the Mile River, are too far fromthe potential irrigable areas.
Some of these, and perhaps other dam sites identified by the Project's team canperhaps be developed in the future when high returns from irrigated agricultural willwarrant suffloient repayment rates, but their construction can hardly be justified inthe present stage of the country's economic development.
(ii) Scope of technical investigations for selected dam sites
Three potential storage dam sites have been selected for more detailed investig-ations. They are located on the left bank tributaries Kesem and Kebena, and on theAwash itself at Tendaho.
In order to calculate storage capacity, contour maps of the reservoir areas weredrawn to a scale of 1:20,000. Detailed surveys of the dam sites were subsequentlycarried out to the scale of 1:1,000 and served for geological and civil engineeringinvestigations.
The very special features of the geological structure of the Awash basin calledfor a particularly careful geolOgical survey. This was carried out not only for thefoundation studies, but also in respect of possible leakage problems. After athorough surface survey, relevant programmes of test borings for the purpose of deepreconnaissance and permeability assessments were prepared and executed at the Kesemand Tendaho dam sites.
1Vdraulic and civil engineering investigations, necessary to establish therelevant water balance, included analyses of inflows, both natural and those resulting
from irrigation development upstream, reservoir evaporation, irrigation water require-
ments and potential hydro-power output. The hydrological year 1962/63 has been taken
as the reference year, because its hydrological conditions have been found to be close
to those in a "normal" year.
A set of preliminary design documents and costings were prepared and are appended
to Volume IV.
3, Kesem Dam
(i) Topography and Capacity
Kesem storage dam site is in a gorge cut by the Kasen river, a large left bank
tributary, to a depth of about 70 m, and abozipt 200 m wide at the mouth. Its location
is shovn on Map 14. The following table gives the main characteristics of the
potential reservoir.
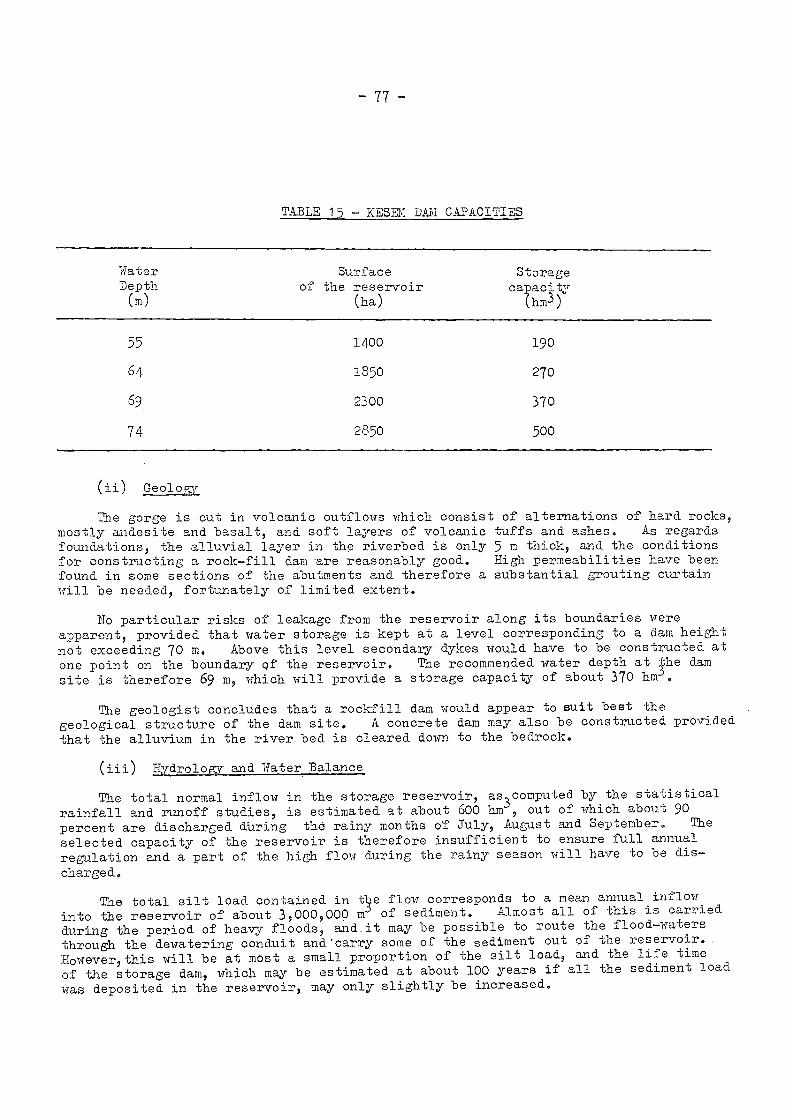
- 77 -
TABLE 15 - KESEM DAN CAPACITIES
Water Surface StorageDepth of the reservoir capacity(m) (ha) (hm3)
Geology
The gorge is cut in volcanic outflows which consist of alternations of hard rocks,mostly andesite and basalt, and soft layers of volcanic tuffs and ashes. As regardsfoundations, the alluvial layer in the riverbed is only 5 m thick, and the conditionsfor constructing a rock-fill dam are reasonably good. High permeabilities have beenfound in some sections of the abutments and therefore a substantial grouting curtainwill be needed, fortunately of limited extent.
No particular risks of leakage from the reservoir along its boundaries wereapparent, provided that water storage is kept at a level corresponding to a dam heightnot exceeding 70 m. Above this level secondary dykes would have to be constructed atone point on the boundary cf the reservoir. The recommended water depth at .he dam
site is therefore 69 m, which will provide a storage capacity of about 370 hm
The geologist concludes that a rockfill dam would appear to suit best thegeological structure of the dam site. A concrete dam may also be constructed providedthat the alluvium in the river bed is cleared down to the bedrock.
Hydrology and Water Balance
The total normal inflow in the storage reservoir, as computed by the statisticalrainfall and runoff studies, is estimated at about 600 hm, out of which about 90
percent are discharged dUring thé rainy months of July, August and September. The
selected capacity of the reservoir is therefore insufficient to ensure full annual
regulation and a part of the hish flow during the rainy season will have to be dis-
charged.
The total silt load contained in te flow corresponds to a mean annual inflow
into the reservoir of about 3,000,000 m of sediment. Almost all of this is carried
during the period of heavy floods, and.it may be possible to route the flood-waters
through the dewatering conduit and'carry some of the sediment out of the reservoir.,
Howeverlthis will be at most a small proportion of the silt load, and the life time
of the storage dam, which may be estimated at about 100 years if all the sediment load
was deposited in the reservoir, may only slightly be increased.
55 1400 190
64 1850 270
69. 2300 370
74 2850 500

- 78 -
The probabilities of peak floods have been estimated as follows:
A flood of at least 840 m3/s may probably occur once in 10 years
A flood of at least 1100 m3/s may probably occur once in 50 years
A flood of at least 1180 m3/s may probably occur once in 100 years
A flood of 1400 m3/s is considered as the maximum possible
The spillway may be designed for a maximum discharge of 1500 m3/s. However,except in emergency, the rate of spilling should not exceed 500 m3/s, because of therisk of flooding in the irrigable area.
Net losses by evaporation from the water surface a e estimated/following thefindings of the meteorological survey,a4 about 20,000 m /ha per annum.which works outto a total annual loss of about 35.5 hm for the average surface of the reservoir(1770 ha).
Water Use and Yanagement
Estimates of rrigation water requirements suggest that a minimum storagecapacity of 300 hm in the reservoir will help to irrigate about 22,500 ha of land,approximately 5,000 ha more than is available in the Ksem-Kebena Plain. Thisirrigation water can also be used for power generation as the tail race head stillcommands the irrigation areas by gravity.
Water planning studies have shown that a supply of irrigation water to a .slightlysmaller area of 22,000 ha would allow a monthly hydro-power production of about 3,5 MTh.In order to achieve this minimum firm power produotion, the power plant would dischargeover 4 months more water tha can be taken up in irrigation; the total annual excessoutflow would be about 16 hm
This excess outflow has been provided for in the following water managementschedule for the dam:, which provides for a continuous intensive irrigation of 22,000ha and for a power plant output of 3.5 GWh per month, (Table 17) overleaf.
Civil engineering
The following alternativos were considered: a concrete hollow dam or a rockfillone, the latter is cheaper and was given preference.
For construction purposes a diversion gallery 400 m long will blave to be built onthe left bank. The gallery with discharge capacity of about 500 vis will eventuallybe used as an outlet conduit. The power plant will be installed also on the leftbank at the foot of the Jam. The spillway, equipped with two sector gates, islocated on the right bank.
A grout curtain, needed to prevent leakage, will be injected into both banks.Its total surface is estimated at 100,000 m2.
I'able 16 shows the principal characteristics of the scheme.
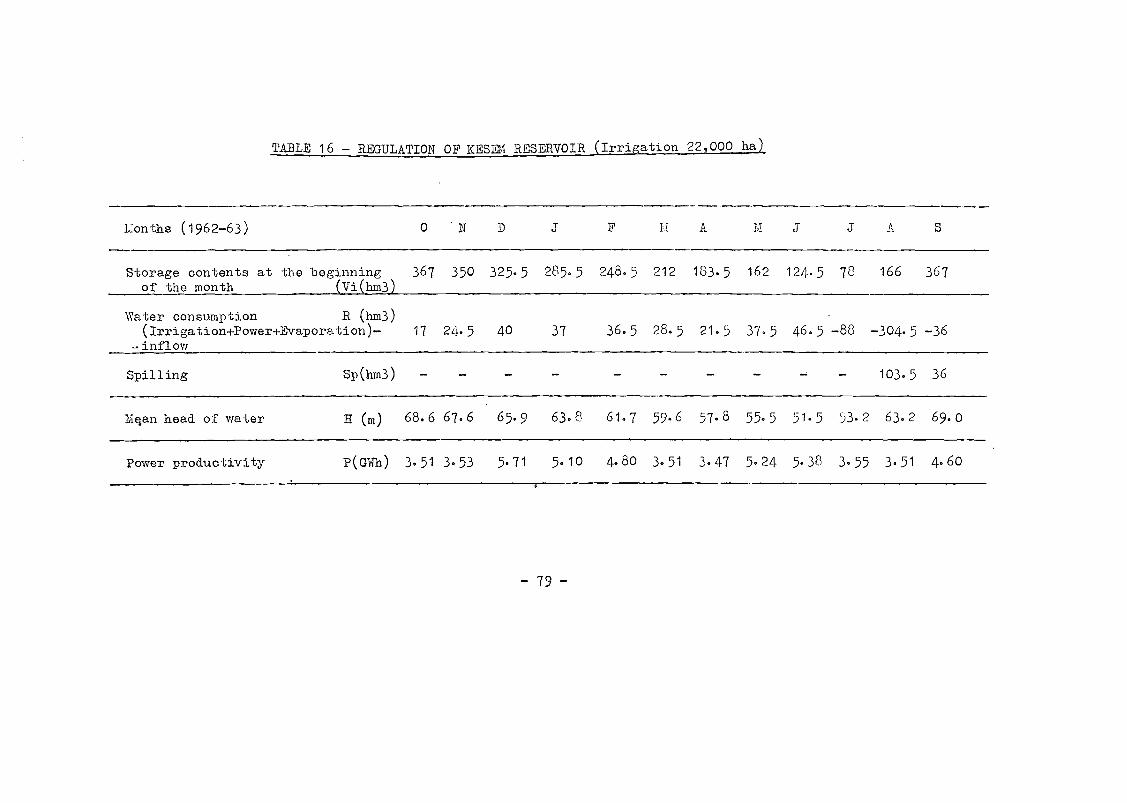
TABLE 16 - REGULATION OF KESEM RESERVOIR (Irrigation 22,000 ha)
1,:onths (1962-63) 0 N D J F E A M J J A S
- 79 -
Storage contents at the beginningof the month Vi(hm3)
367 350 325.5 285.5 248.5 212 103.5 162 124.5 78 166 367
Water consumption R (hm3)(Irrigation+Power+Evaporation)-
-inflow17 24.5 40 37 36.5 28.5 21.5 37.5 46.5 -88 -304.5 -36
Spilling Sp(hm3) 103.5 36
Mqan head of water E (m) 68.6 67.6 65.9 63.8 61.7 59.6 57.8 55.5 51.5 53.2 63.2 69.0
Power productivity P(013.) 3.51 3.53 5.71 5.10 4.80 3.51 3.47 5.24 5.38 3.55 3.51 4.60

RESERVOIR
4. Kebena Dam
Kebena River, an important tributary of the Awash, runs across the alluvial plainparallel to the Kesem at a distance of about 15 km.
It commands the same development area as the Kesem river, and no other areas towhich Kebena water may be more easily conveyed have been identified. Thus dammingof the Kebena would only be justified if the cost were significantly less than thatof the Kesem dan. Topographical examination and surface survey of the geologicalstructure of the site showed at an early stage that construction costs of the damwould be relatively higher than those expected for the Kesem dam.
It was therefore decided not to implement the programme of test borings suggestedby the geologist. The view that the Kebena dam will be relatively expensive has beenconfirmed by subsequent hydraulic and civil engineering studies, as may be seen in thesection dealing with estimates in Chapter XI.
- 8o-
TABLE 17 - KESEM DAN - PRINCIPAL CHARACTERISTICS
Height of crest above river level
Length at the crest
Width at the crest
Volume of rookfill dam
Spillway capacity
Freeboard above exceptional maximum water level
Installed power
T.W.L. above river
Normal maximum capacity
Corresponding surface
Total inflow of silt per annum
Net evaporation from the reservoir per annum
74 m
220 m
10 m
900,000 m3
1,500 m3/s
2m
12,000 KW
69 m
370 lim3
2,300 ha
3 hm3
35 hm3
The principal characteristicsRiver are shown in Table 18.
of a po.tential concrete gravity dam on the Kebena
Irrigation possibilities 22,000 ha
Firm power productivity per annum 42.5 GWh
PERFORY CDamping of floods to a limit of 500 m3/s
DAM AND
POWER PLANT

RESERVOIR
5. Tendaho Dam
(i) Topography and Capacity
The dam site is located in a narrow section of the river between two volcanichills,"which rise about 50 m above the river bed; the crosssection widens graduallyupwards from about 200 m at the base of the hills. A saddle on the left bank hill,through which runs the highway to Aseb, is only 30 m above the river level.
The reservoir area appears to be long and rather narrow, with a gentle side slopein its upstream part. An extensive part of the lake would therefore be covered by ashallow sheet of water if its.surface were not limited.
The storage capacity and surface area of the potential reservoir in relation tothe height of the dan are given in Table 19.
- 81 -
TABLE 18 KEBENA DAM PRINCIPAL CHARACTERISTICS
Normal maximum capacity
Corresponding surface
Evaporation from the reservoir per annum
( Total inflow of silt per annum
50 hm3
220 ha
4,5 hm3
1,0 hm3
PERFORMANCE( Irrigation possibilities 5,000 ha
Firm power productivity per annum 12 GWh
Heisht above river level 65 m
DAM ANDLength on the crest 125 m
POWER PLANTVolume of concrete dam 135,000 m3
Spillway capacity 1,200 m3/s
Installed power 3,800 KW
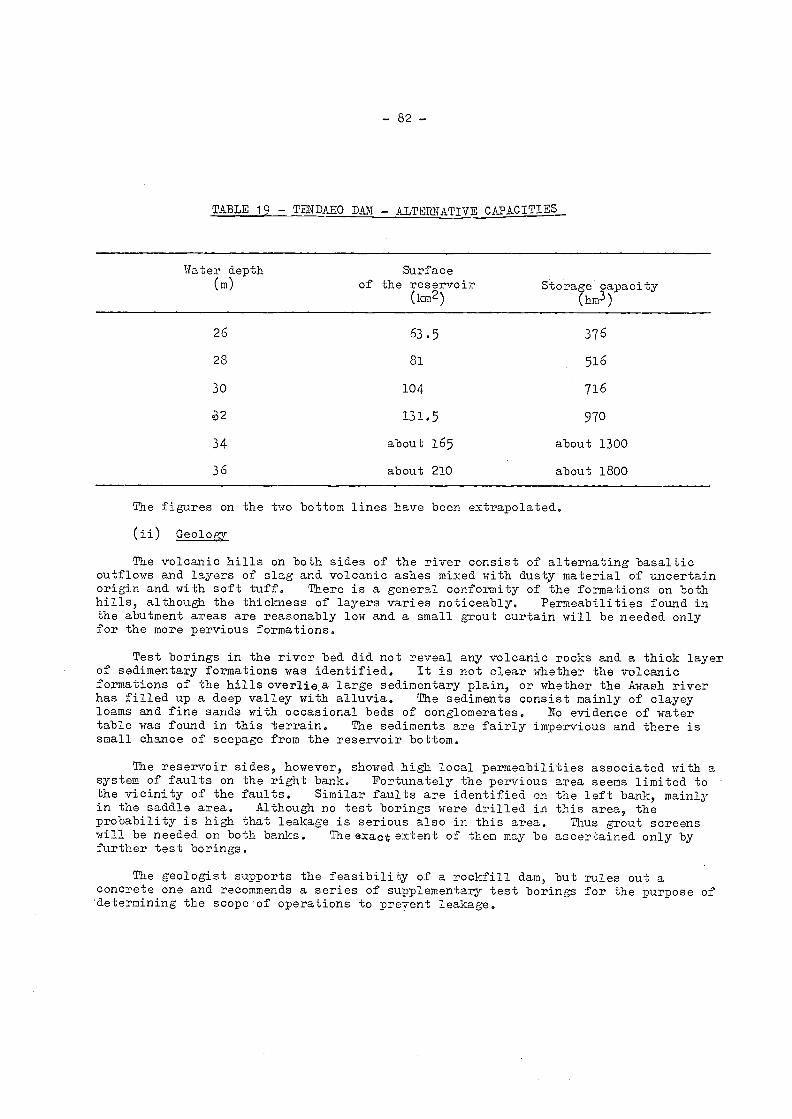
- 82 -
TABLE 1 TENDAHO DAM ALTRiTATIVE CkPACITIES
The figures on the two bottom lines have been extrapolated.
(ii) Geology
The volcanic hills on both sides of the river consist of alternating basalticoutflows and layers of slag and volcanic ashes mixed with dusty material of uncertainorigin and with soft tuff. There is a general conformity of the formations on bothhills, although the thickness of layers varies noticeably. Permeabilities found inthe abutment areas are reasonably low and a small grout curtain will be needed onlyfor the more pervious formations.
Test borings in the river bed did not reveal any volcanic rocks and a thick layerof sedimentary formations was identified. It is not clear whether the volcanicformations of the hills overlie.a large sedimentary plain, or whether the Awash riverhas filled up a deep valley with alluvia. The sediments consist mainly of clayeyloams and fine sands with occasional beds of conglomerates. No evidence of watertable was found in this terrain. The sediments are fairly impervious and there issmall chance of seepage from the reservoir bottom.
The reservoir sides, however, showed high local permeabilities associated with asystem of faults on the right bank. Fortunately the pervious area seems limited tothe vicinity of the faults. Similar faults are identified on the left bank, mainlyin the saddle area. Although no test borings were drilled in this area, theprobability is high that leakage is serious also in this area. Thus grout screenswill be needed on both banks. Theexact extent of them may be ascertained only byfurther test borings.
The geologist supports the feasibility of a rockfill dam, but rules out aconcrete one and recommends a series of supplementary test borings for the purpose of'determining the scopeof operations to prevent leakage.
Water depth(m)
Surfaceof the reservoir
(km2)Store e capacity
hm3)'
26 63.5 376
28 81 516
30 104 716
ò'2 131.5 970
34 about 165 about 1300
36 about 210 about 1800
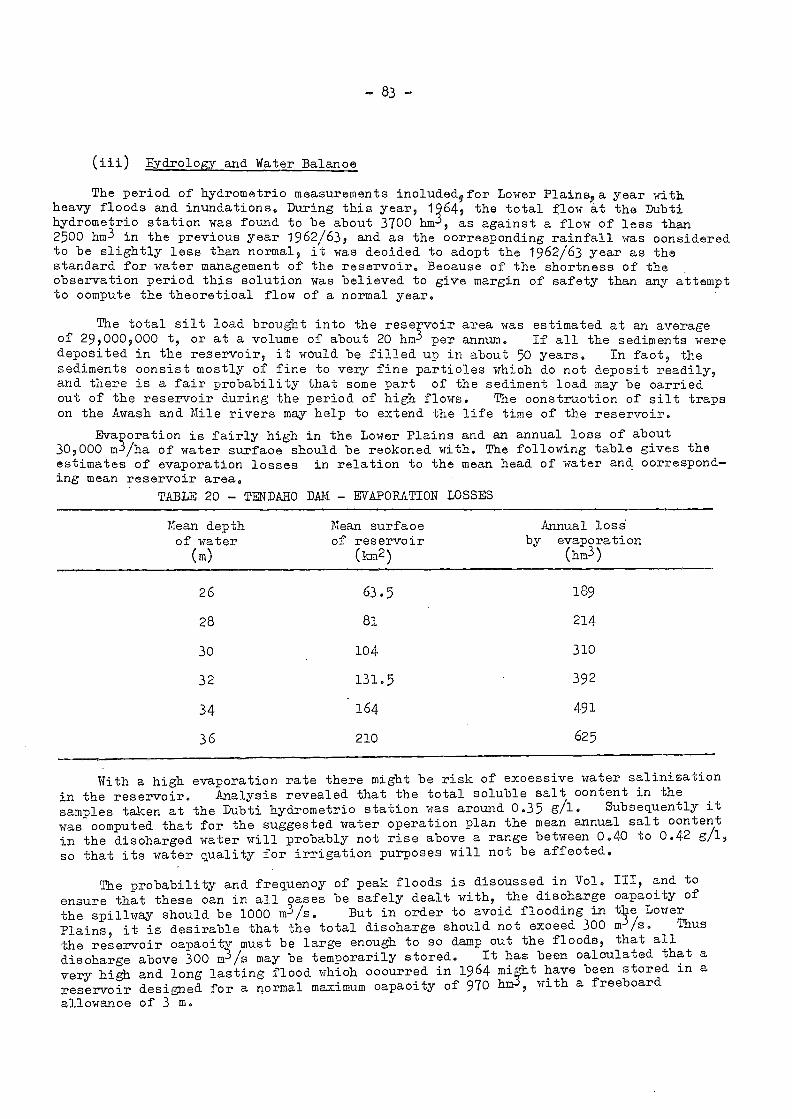
- 83 -
(iii)drol_tsy.o- and Water Balance
The period of hydrometric measurements includedffor Lower Plains,a year withheavy floods and inundations. During this year, 1964, the total flow at the Dubtihydrometric station was found to be about 3700 hmi, as against a flow of less than2500 hm3 in the previous year 1962/63, and as the corresponding rainfall was consideredto be slightly less than normal, it was decided to adopt the 1962/63 year as thestandard for water management of the reservoir. Because of the shortness of theobservation period this solution was believed to give margin of safety than any attemptto compute the theoretical flow of a normal year.
The total silt load brought into the reservoir area was estimated at an averageof 29,000,000 t, or at a volume of about 20 hm3 per annum. If all the sediments weredeposited in the reservoir, it would be filled up in about 50 years. In fact, thesediments consist mostly of fine to very fine particles which do not aeposit readily,and there is a fair probability that some part of the sediment load may be carriedout of the reservoir during the period of high flows. The construction of silt trapson the Awash and Mile rivers may help to extend the life time of the reservoir.
Evaporation is fairly high in the Lower Plains and an annual loss of about30,000 mi/ha of water surface should be reckoned with. The following table gives theestimates of evaporation losses in relation to the mean head of water and correspond-ing mean reservoir area.
With a high evaporation rate there might be risk of excessive water salinization
in the reservoir. Analysis revealed that the total soluble salt content in thesamples taken at the Dubti hydrometric station was around 0.35 g/i. Subsequently it
was computed that for the suggested water operation plan the mean annual salt contentin the discharged water will probably not rise aboyé a range between 0.40 to 0.42 el,so that its water quality for irrigation purposes will not be affected.
The probability and frequency of peak floods is discussed in Vol. III, and to
ensure that these can in all cases be safely dealt with, the discharge capacity of
the spillway should be 1000 m3/s. But in order to avoid flooding in t4e Lower
Plains, it is desirable that the total discharge should not exceed 300 m-Vs. Thusthe reservoir capacity must be large enough to so damp out the floods, that all
discharge above 300 m-/s may be temporarily stored. It has been calculated that a
very high and long lasting flood which occurred in 1964 might have been stored in a
reservoir designed for a normal maximum capacity of 970 hin, with a freeboard
allowance of 3 m.
TABLE 20 TENDAHO DAM EVAPORATION LOSSES
Mean depthof water
(m)
Mean surface Annual loss.of reservoir by evaporation
(km2) (hm3)
26 63.5 189
28 81 214
30 104 310
32 131.5 392
34 164 491
36 210 625
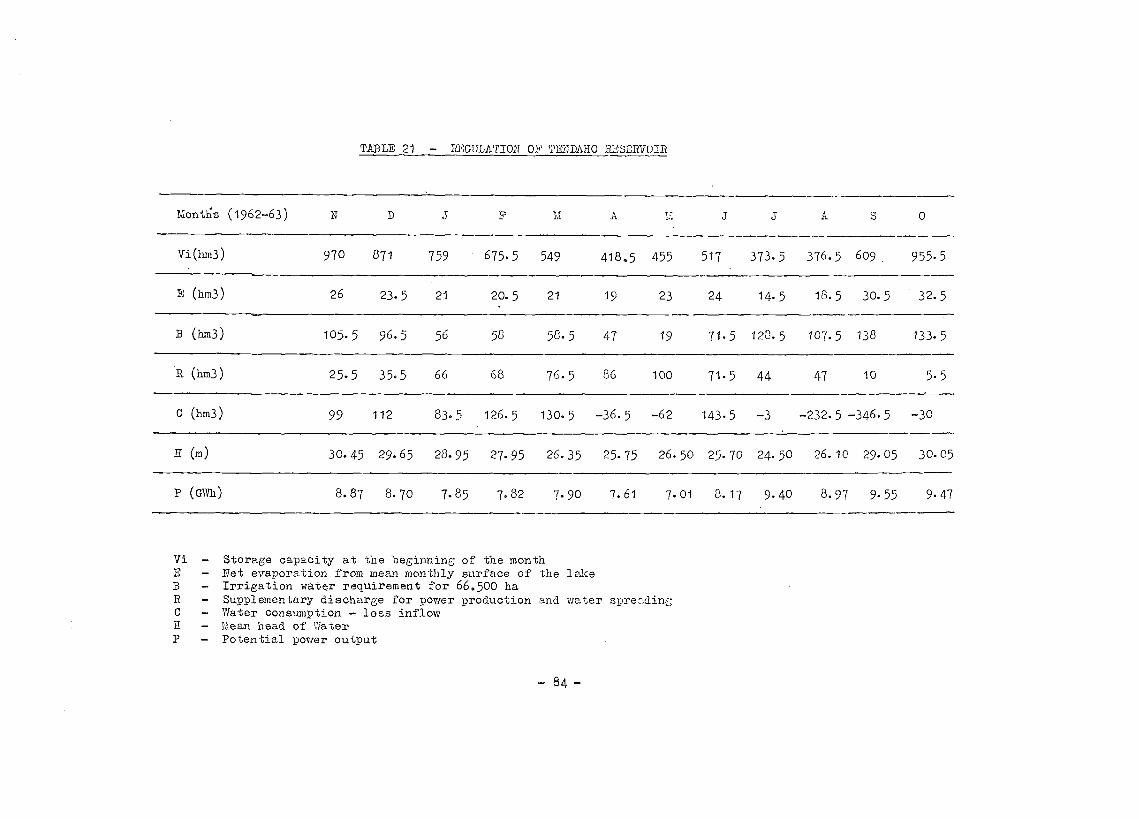
Vi - Storage capacity at the beginning of the month- Net evaporation from mean monthly surface of the lake- Irrigation water requirement for 66.500 ha
R - Supplementary discharge for power production and water spre3dinC - Water consumption - less inflow
- Mean head of Water- Potential power output
- 84 -
TABLE 21 - REGULATION OF TENDAHO RESERVOIR
MontSs (1962-63) N D J F M A M J J A S 0
Vi(hm3) 970 871 759 675.5 549 418.5 455 517 373.5 376.5 609 955.5
E (hm3) 26 23.5 21 20.5 21 19 23 24 14.5 18.5 30.5 32.5
B (l=3) 105.5 96.5 56 58 58.5 47 19 71.5 128.5 107.5 138 133.5
R (hm3) 25.5 35.5 66 68 76.5 86 100 71.5 44 47 10 5.5
C (hm3) 99 112 83.5 126.5 130.5 -36.5 -62 143.5 -3 -232.5 -346.5 -30
H (m) 30.45 29.65 28.95 27.95 26.35 25.75 26.50 25.70 24.50 26.10 29.05 30.05
P (GWh) 8.87 8.70 7.85 7.82 7.90 7.61 7.01 3.17 9.40 8.97 9.55 9.47

- 85 -
Water Use and Management
A water management plan for the reservoir is fully discussed in Vol. IV.Noticeable modifications of inflow rates into the reservoir are bound to occur as aresult of irriEation development and relevant flow regulation in the upstream areas.Three assumptions, each corresponding to a specific case of possible development inthe Middle Valley, were successively analyzed and water management plans establishedfor each of these. For the second case, the assumption was made that nocomplementary water resources will be developed in the Basin, e.g. from Meki River,but that the flow of the main river is modulated in accordance to the expectedirrigation requirements of about 50,000 ha.
As the Tendaho dam is likely to be operational at this intermediary stage ofdevelopment, main features of the relevant water management schedule are given inTable 21. The maximum normal water depth at the dam site, i.e. 32 m, has been takeninto consideration in both regulation and power production requirements. The totalarea of irrigable lands commanded by the dam and available for development withoutreclamation is estimated, in accordance with soil-survey findings and irrigation lay-out, at 66,300 ha. Supply of irrigation water for this area of land is provided forin each alternative water management schedule. Significant variations, however,result in power production potential, as this is bound to decrease with higher waterconsumption in upper reaches.
The lowest potential power output figures found in the three water managementplans have been selected for dimensioning the power plant (21,000 KN) and estimates
for the firm potential power output (91 Gun per annum). The latter includes power
earmarked for pumping irrigation water (22 GWh) on an area amounting to approximately
45,000 ha. (See Map 18).
Civil engineering
The dam consists of two parts: a rockfill dam across the river and a concrete
structure on the left bank.
Power plant offtakes and dewatering gate are installed on the concrete section of
the dam. The spillway, equipped with two sector gates, is established on the left
bank.
The area of grout curtain needed to prevent leakage is estimatéd at about
80,000 m2.
Table 22 shows the principal features of the dam.

DAM AND
PONER PLANT
RESERVOIR
6. Meki Diversion Scheme
(i) Topography
The idea of supplementing the Awash water resources by diverting a part of theflow from adjacent basins has been mentioned in the reports of various previousreconnaissance missions. With the establishment of the Koka dam and power plants,the possibility of constructing a relatively short canal to lead the waters of LakeZiway into Lake Gelilea with a minimum difference of elevation of about 45 m, appearedsufficiently attractive to justify preliminary investigations. These were initiatedby the Project team, although not included in the plan of operations.
A series of interconnected marshy depressions was located between a small Awashright bank tributary, the Dubeta, amd the Meki River which flows into Lake Ziway fromthe North West. Preliminary observations revealed that the depressions probablymark the alignment of an old channel connecting the two rivers. (See Map 15).
- 86 -
TABLE 22 - TENDAHO DAM - PRINCIPAL CHARACTERISTICS
Height above river bed
Length at the crest
Width of the crest
Volume of rockfill dam
Spillway capacity
Freeboard above normal maximum water level
Installed power plant
( T.W.L. above riverNormal maximum capacity
Corresponding surface
Total inflow of sediments per annun
Evaporation from the reservoir per annum
35 m
280 m
7m
300,000 m3
1,000 M3/s
3m
21,000 KW
32 m
970 hm3
131.5 km2
20 hm3
274 hm3
Irrigated areas 66,500 ha
PERFORMANCE Total annual potential power output 91 GWh
PoWer earmarked for pumping of irrigation water 22 GWh
Damping of floods to a limit of 300 m3/s

- 88 -
Subsequent topographic operations have shown that for some distance the ground
slopes towards the Meki river, which may be due to an orogenic movement. The canal
would have to be about 18 km long, and would cross elevated rround before reaching
the Dubeta river. Consequently, relatively substantial excavation would be necessary;a short section of the canal would be about 22 m deep.
On the other hand the slope of the Dubeta is significantly steeper than that ofthe Meki, so that control of current velocity in the canal would be needed.
Hydrology and Water Control
From observations made at a hydrometric station installed in 1963 specially forthis purpose, the total flow of the Meki river from November 1963 to October 1964inclusive was found to be 230 hm-. 95 percent of he recorded flow occurred in 5months of the year.
It appeared reasonable to contemplate eventually the diversion of some 200 hm3annually into Lake Gelilea above,Koka Dam, achieved by stages over several years.Such an amount would raise the water level in Lake Gelilea by about 1.0 m, whichappears safe with present freeboard at Koka Dam of 2.5 m above Top Uater Level. Inpoint of fact at the highest water level yet attained in the Lake, the freeboard was3.0 m.
Additional amounts so stored in_ the Lake could be used either to increase theflow passed through the turbines for power, or specifically for irrigation.
In the former case, the prodUction of power plants dependent on the Koka Damwould increase by about 15 percent, i.e. by 16 GWh at the existing station (Awash I),and by 74 GWh when the two stations now under construction (Awash II.and Awash III)come into operation, provided the leakage from the reservoir continues in the sameproportion as at present. The supplementary flows would make possible the irrigationof some 10,000 ha additional in the Middle Valley.
In the latter case, the supplementary water would all be released from KokaReservoir during the months of low flow. This, it is estimated, would make possiblethe irrigation of some 40,000 ha of additional land. Some increase in the output offirm power could be expected, but its amount cannot yet be estimated.
Civil enp;ineerinp;
Civil engineering works would involve mainly the excavation of the initial canalwhich is expected to take progressively its final section and stable slope by erosion.In order to prevent too active a regressive erosion, however, a series of sills willbe needed in the channel of the Dubeta rivers.
The off-take structure may be provided with two roller gates and. the Meki riverdammed with a Submersible weir formed of gabions.
The total volume of excavation is tentatiVely estimated at 7,200,000 m.
The project seems attractive, but no detailed engineering studies should beinitiated until a few important problems are first elucidated.

- 89 -
(iv) Further investigations required
The catchment area of Meki river is about 2,400 km2 and accounts for 1/3 of thetotal catchment area to Ziway Lake, which usually discharges its water into thebrackish lake of Hora-Abyita. Diversion of a part or all of the Meki flow willresult in lowering of the Ziway Lake water level and, consequently, in a reductionof its discharge. A hydrological survey of the Plateau of Lakes will be needed inorder to appreciate the effects of diversion of the Meki flow on the hydrologicalbalance of the Lakes.
The permeability of terrain across which,the diversion canal is to run must becarefully investigated. The surface soils consist of very light volcanic ashes andextensive gully erosion has occurred. It is possible however that the alluviallayers deposited in the old river bed are deep enough to ensure reasonably lowpermeabilities in the future channel. A series of test boringn will be needed toascertain the permeability of deep layers.
Although the capacity of the Lake Gelilea is sufficient to store the additionalvolume of water, with the level of the lake rising by about lm, there remains theneed for a thorough study of the possible effect of higher water levels in thereservoir on the present considerable leakage losses.. This is discussed below.
7. Management of Available Water Resources
In relation to the possible improvement of water management in the Kokareservoir, two major problems should be considered:
Siltation control
- Water loss prevention
(i) Siltation control
An efficient control of the rate of siltation is of paramount importancebecause of the reduction of reservoir capacity following deposition of sediments atthe bottom of the lake. Long before the reservoir is completely silted up, thereduction of its capacity will result in a progressive reduction of powerproductibility and the supply of water for irrigation.
Data recorded at the Projectts hydrometric station s ggest that the total volumeof sediment load brought into the reservoir is about G hm per annum. As this volumeamounts to about 0.33 percent of the capacity, it suggests that the reservoir wouldbe completely filled with sediments in about 300 years. It should be pointed out,however, that this estimate is based on only a ver short period of observations.The forecast of the life-time of the reservoir must be confirmed by systematicsurveys by depth sounder, which will help to establish the reservoir capacity,up todate,to locate the main areas of deposition, and to check the progress of sedimentdeposit.
To a limited degree siltation control may be improved by diverting a part of thesediment-laden inflows into the marshy fringe areas of the ru:ervoir. These marshesmay be progressively reclaimed by isolating them from the main body of the reservoirby d;ykes and warping with sediment-laden kater.
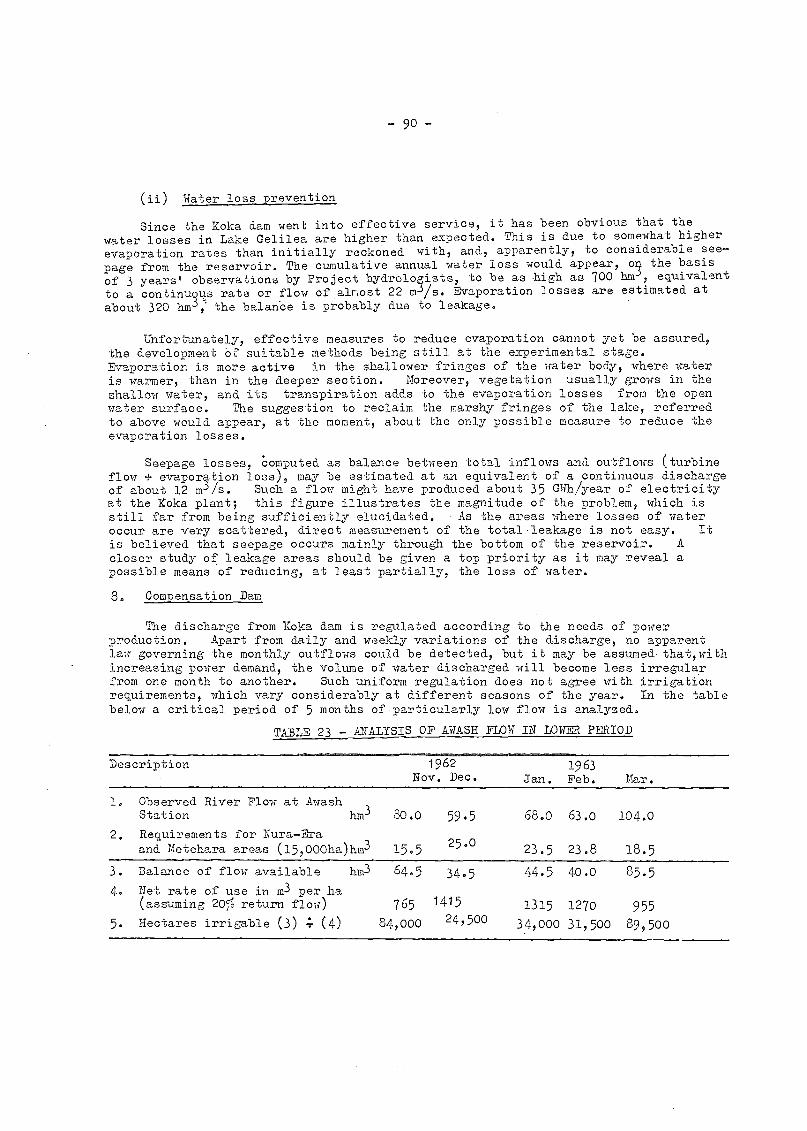
- 90 -
(ii) Water loss prevention
Since the Koka dam went into effective service, it has been obvious that the
water losses in Lake Gelilea are higher than expected. This is due to somewhat higher
evaporation rates than initially reckoned with, and, apparently, to considerable see-
page from the reservoir. The cumulative annual water loss would appear, on the basisof 3 years' observations by Project hydrologists, to be as high as 700 hm', equivalent
to a continuous rate or flow of almost 22 mi/s. Evaporation losses are estimated at
about 320 hm", the balance is probably due to leakage.
Unfortunately, effective measures to reduce evaporation cannot yet be assured,the development Of suitable methods being still at the experimental stage.Evaporation is more active in the shallower fringes of the water body, where wateris warmer, than in the deeper section. Moreover, vegetation usually grows in theshallow water, and its transpiration adds to the evaporation losses from the openwater surface. The suggestion to reclaim the marshy fringes of the lake, referredto above would appear, at the moment, about the only possible measure to reduce theevaporation losses.
Seepage losses, Computed as balance between total inflows and outflows (turbineflow + evaporation loss), may be estimated at an equivalent of a continuous dischargeof about 12 m.)/s. Such a flow might have produced about 35 GITh/Year of eleetricityat the Koka plant; this figure illustrates the magnitude of the problem, which isstill far from being sufficiently elucidated. As the areas where losses of wateroccur are very scattered, direct measurement of the total-leakage is not easy. Itis believed that seepage occurs mainly through the bottom of the reservoir. Acloser study of leakage areas should be given a top priority as it may reveal apossible means of reducing, at least partially, the loss of water.
8. Compensation Dam
The discharge from Koka dam is regulated according to the needs of powerproduction. Apart from daily and weekly variations of the discharge, no apparentlaw governing the monthly outflows could be detected, but it may be assumed-that,withincreasing power demand, the volume of water discharged will become less irregularfrom one month to another. Such uniform regulation does not agree with irrigationrequirements, which vary considerably at different seasons of the year. In the tablebelow a critical period of 5 months of.particularly low flow is analyzed.
TABLE 23 ANALYSIS OF AWASH FLOW IN LOWER PERIOD
Observed River Flow at AwashStationhm3 80.0 59.5 68.0 63.0 104.0
Requirements for NuraEraand Metehara areas (15,000ha)hm3 15.5
25.023.5 23.8 18.5
Balance of flow available hm3 64.5 34.5 44.5 40.0 85.5
Net rate of use in m3 per ha(assuming 205 return flow) 765 1415 1315 1270 955
Hectares irrigable (3) ; (4) 84,000 24,500 34,000 31,500 89,500
Description 1962 1963Nov. Dec. Jan. Feb. Mar.
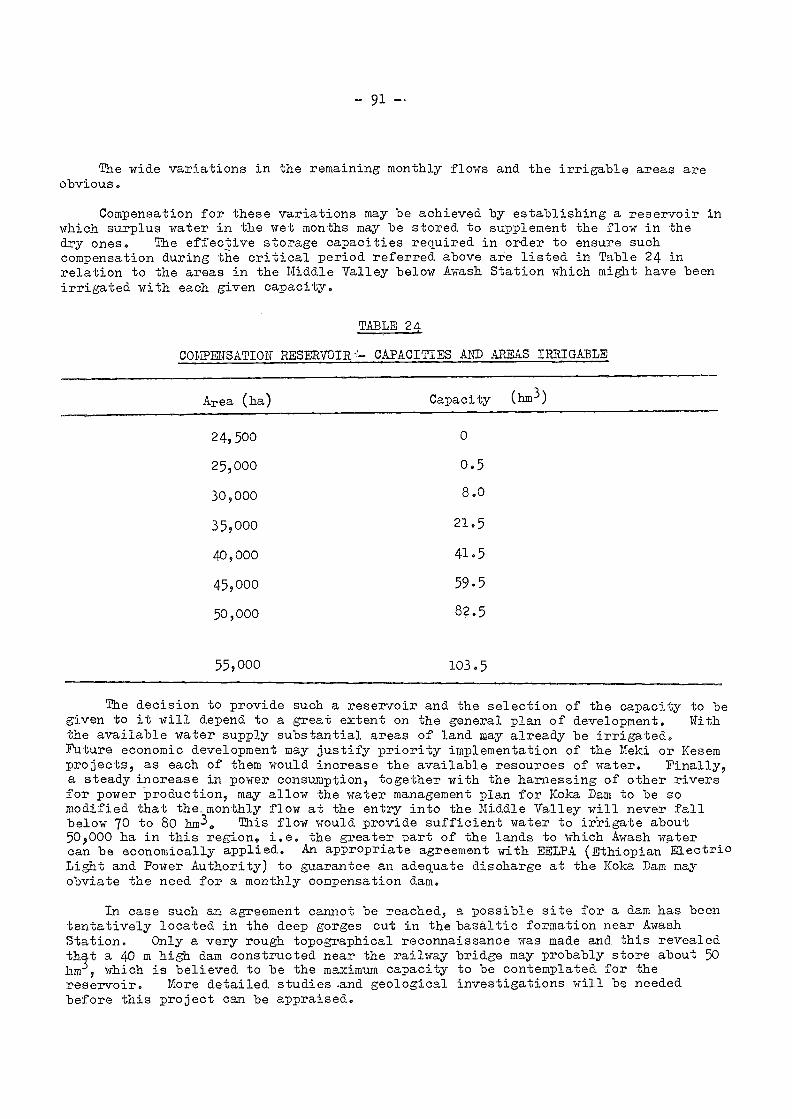
91
The wide variations in the remaining monthly flows and the irrigable areas areobvious.
Compensation for these variations may be achieved by establishing a reservoir inwhich surplus water in the wet months may be stored to supplement the flow in thedry ones. The effective storage capacities required in order to ensure suchcompensation during the critical period referred above are listed in Table 24 inrelation to the areas in the Middle Valley below Awash Station which might have beenirrigated with each given capacity.
TABLE 24
COMPENSATION RESERVOIR CAPACITIES AND AREAS IRRIGABLE
Area (ha) Capacity (hm3)
24,500
25,000
30,000
35,000
40,000
45,000
50,000
55,000
o
0.5
8.0
21.5
41.5
59.5
82.5
103.5
The decision to provide such a reservoir and the selection of the capacity to begiven to it will depend to a great extent on the general plan of development. Withthe available water supply substantial areas of land may already be irrigated.Future economic development may justify priority implementation of the Meki or Kesemprojects, as each of them would increase the available resources of water. Finally,a steady increase in power consumption, together with the harnessing of other riversfor power Production, may allow the water management plan for Koka Dam to be somodified that the_monthly flow at the entry into the Middle Valley will never fallbelow 70 to 80 hm3. This flow would provide sufficient water to irrigate about50,000 ha in this region, i.e. the greater part of the lands to which Awash watercan be economically applied. An appropriate agreement with EELPA (Ethiopian ElectricLight and Power Authority) to guarantee an adequate discharge at the Koka Dam mayobviate the need for a monthly compensation dam.
In case such an agreement cannot be reached, a possible site for a dam has beententatively located in the deep gorges cut in the basaltic formation near AwashStation. Only a very rough topographical reconnaissance was made and this revealedthq.t a 40 m high dam constructed near the railway bridge may probably store about 50hm, which is believed to be the maximum capacity to be contemplated for thereservoir. More detailed studies and geological investigations will be neededbefore this project can be appraised.

- 92 -
9. Zidro-Power Potential of the TILiDer Basin
Three falls and several rapids between Awash III power plant now underconstruction and Awash Station, have been inspected by the Project team. The
'cumulative head at these falls and rapids is estimated to be about 158 m. It wouldappear possible to construdt a series of power plants using the flow regulated by theKoka dam. The following Eives a rough estimate of the total power potential availablein the Upper Valley of Awash River4
TABLE 25 - TJPP1R VALLEY - ESTIMATED POWER POTENTIAL
Power site Average head
(m)
AnnualProductivity
(GUh)
Koka plant.(Awash I) - in service 36 110
Awash II and III - under construction 119 360
Awash IV - at design stage 58 180
Three downstream sites - first priority 50 150
Rapids - second priority 50 150
Totals 313 950

- 93 -
CHAPTER IX - PRIORITIES IN PLANNING WATER USE
Areas possible
It is apparent that the amounts of water available with the present degree ofwater control, i.e. that provided by the Koka Reservoir,are sufficient for the irri-gation of some 66,000-67,000 ha in the whole Valley. The hydrological studies madeso far indicate that had sufficient additional water control been achieved by asuitable selection of the projects discussed in chapter VIII, with programmes ofwater management strictly adapted to irrigation requirements, in the conditions ofthe year 1962/63, the irrigation of some 200,000 ha might have been possible. It isbelieved that the conditions of 1962/63 approximated to those of an average year.But in view of the very limited period for.which records of flows are available,at present it appears wise to assume a smaller figure for the total area irrigablein the Basin. Further, on the basis of soil survey and preliminary engineeringinvestigations a total of 163,250 ha is adopted as the target,to include those landsof good quality to which water can most easily be conveyed, as well as all the areasnor irrigated.
Areas possible with various combinations of water control schemes.
Numerous computations were made by SOGREATT to determine the maximum areairrigable in the Upper Middle Valleys, and the Lower Plains, respectively, withvarious combinations of schemes of water control. The results are shown in Table 26.For ease of comparison of the various alternatives there are set out in two groups,those without Tendaho Dam and those with it. In some cases, the figures of area aredetermined by considerations of soils and accessibility to irrigation and not merelyby amounts of water likely to be available: these are made clear by notes attachedto the Table. Rates of costs per ha of area are based on the estimates of capitalcosts given in chapter XI 5 theyoover the costs of schemes of water control only.
The main points revealed by study of the Table May be summarized as follows
In respect bOth of areas irrigable, and of cost per ha, one of the mostadvantageous projects of water control is the Meki Diversion Scheme, providedit is techniCally and economically feasible, which is still uncertain. It
appears highly desirable to initiate as soon as possible the furtherinvestigations required to determine this. (See Figs. 14 and 15)
If the Meki Diversion Scheme is feasible, the decision as to whether itsbenefit in water should be used primarily for power (P) or primarily forirrigation (I) is a matter for Government to decide, on comparison of therespective economic and social advantages of these two alternatives. For
the further purposes of this Report, it has been assumed that the decisionis in favour of irrigation.
If the Meki Diversion Scheme proves not to be feasible, the CompensationHeservoir will provide a useful, but much less beneficial, alternative.
Tendaho Dam is essential to make possible the maximum development of the
Lower Plains, at reasonable rates of cost.
Kesem Dam can contribute to the increase of area in the Lower Plains,
and alone will make possible the irrigation of certain areas in the Kesem-
Kebena area of the Middle Valley which are not accessible to irrigation from
the Awash itself. The cost per ha. of development irrigated from Kesem Dam
will be relatively higher than with other schemes of water control.
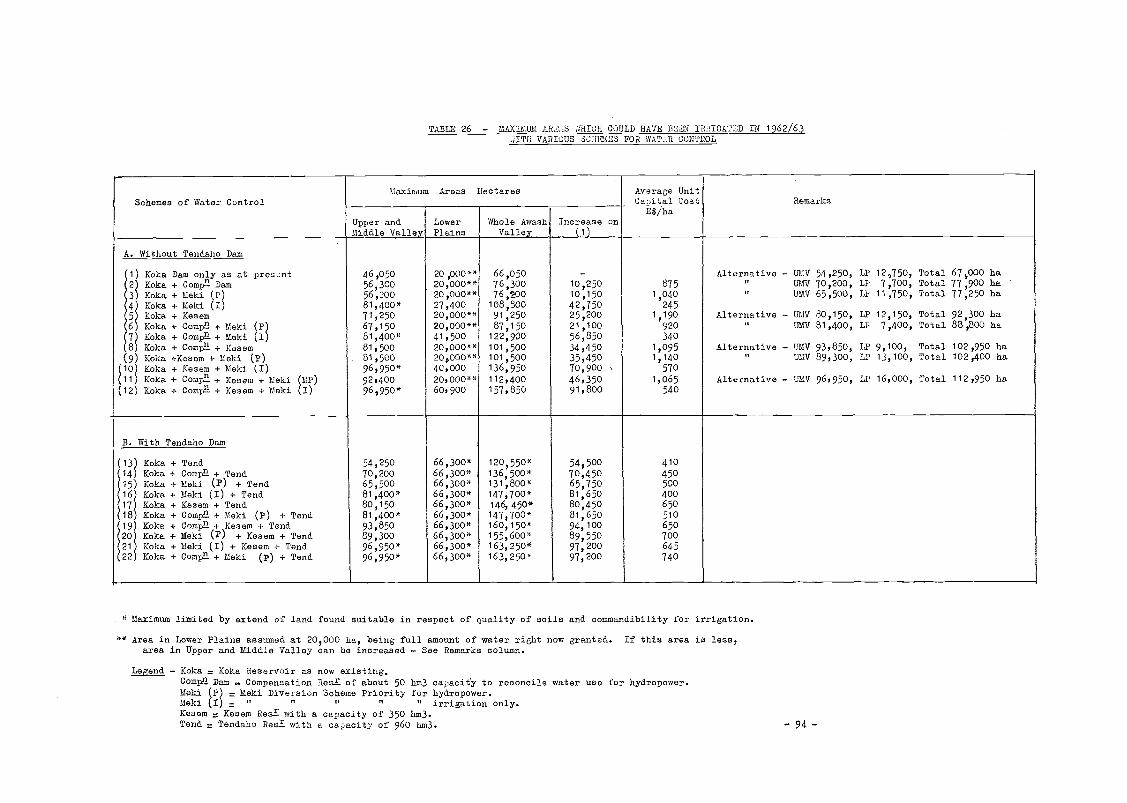
TABLE 26 - MAXIMUM AR2,S afICH C..-)ULD HAVE BE2N IRBICA020 IN 1962/63ITH VARIOUS 302h1423 FOB WATER CONTROL
* Maximum limited by extend of land found suitable in respect of quality of soils and commandibility for irrigation.
** Area in Lower Plains assumed at 20,000 ha, being full amount of water right now granted. If this area ie less,area in Upper and Middle Valley can be increased - See Remarks column.
Legend - Moka Moka Reservoir as now existing.CompE Dam . Compensation 2eaE of about 50 hm3 capacit'y to reconcile water use for hydropower.Maki Maki Diversion Scheme Priority for hydropower.Maki I - " " irrigation only.Kesem K;sem ResE with a capacity of 350 hm3.Tend Tendaho Res E with a capacity of 960 hm3. - 94 -
Maximum Areas Hectares Average Unit
Schemes of Water Control Canital Cost RemarksF.'S/ha
Upper and Lower Whole Awash Increase onMiddle Valley Plains Valley (1)
A. Without Tendaho Dam
46,050 20,0004* 66,050 Alternative - :J./ 54,250, LP 12,750, Total 67,000 ha1) Moka Dam ony as at pres,nt2) Moka + Compl- Dam 56,300 20,000** 76,300 10,250 875 UMV 70,200, LP 7,700, Total 77,900 ha
Moka + Keki (P) 56,200 20,000** 76,200 10,150 1 040 e 011V 65,500, LF 11,150, Total 11,250 ha
4 Moka + Maki (I) 81,400* 27,400 108,300 42,750 '245
5 Moka + Kesem 71,250 20,000*. 91,250 25,200 1,190 Alternative - UMV 80,150, LP 12,150, Total 92,300 ha(6) Moka + CompE + Maki 1:1 67,150 20,000.* 87,150 21,100 920 e UMV 81,400, LP 1,400, Total 88,800 ha
(7) Moka + CompE + Kaki I) 81,400* 41,500 122,900 56,850 340(8) Moka + CompE + Kesem 81,500 20,000.* 101,500 34,450 1,095 Alternative - UMV 93,850, LP 9,100, Total 102,950 ha(9) Moka +Kesem + Kaki (P) 81,500 20000** 101,500 35,450 1,140 o UMV 89,300, LP 13,100, Total 102,400 ha
(10) Moka + Kesem + Maki (I)(11) Moka + Compa + Kesem + Maki
96,950*
92,400
40,00020000**
136,950
112,400
70,900 ,
46,350
570
1,065 Alternative - 1111V 96,950, LP 16,000, Total 112,950 harP)(12) Moka + CompE + Kesem + Maki I) 96,950* 60,900 157,850 91,800 540
1 B. With Tendaho Dam
(13) Moka + Tend 54,250 66,300* 120,550* 54,500 410(14) Moka + CompE + Tend 70,200 66,300* 136,500* 70,450 45015) Koka + Maki (P) + Tend 65,500 66,300* 131,800* 65,750 500
16 Moka + Maki (I) + Tend 81,400* 66,300* 147,700* 81,650 40017 Moka + Kesem + Tend 80,150 66,300* 146,450* 80,450 65018 Moka + CompE + Kaki (P) + Tend 81,400* 66,300* 147,700* 81,650 510
19 Moka + CompE + Kesem + Tend 93,850 66,300* 160,150* 94,100 650
20 Moka + Meki (P) + Kesem + Tend 89,300 66,300* 155,600* 89,550 700
21 !Coke. + Meki (I) + Keeem + Tend 96,950* 66,300* 163,250* 97,200 64522 Moka + CompE + Maki (p) + Tend 96,950. 66,300* 163,2504 97,200 740
- 95 -
It should be noted that only Tendaho and Kesem Dams were investigated by theSurvey in sufficient detail to establish provisionally their feasibility. The MekiDiversion Project and the Compensation Dam were the subject of preliminary reconnais-sance and examination only.
3. Factors affecting Relative Priorities of Irrigation Development.
The chief problem affecting the timing and magnitude of the various futurestages of irrigation development is whether the Middle Valley should have priorityover the Lower Plains, or vice versa, or whether both should be developed at thesame time.
The Middle Valley has a better climate, being at a greater altitude andbetter soils and appears to be more suited to the development of intensive irrigatedagriculture or commercial type farms. Yields will be higher, and agriculturalbenefits greater. The abstraction of irrigation water here has the advantage ofdecreasing the flows further downstream, and thus of diminishing the amounts spiltinto swamps and flood areas with consequent loss.
Communications, though needing improvement, are not bad; many of theirrigable areas are not unduly far from the railway. No reason appears so far toindicate difficulties in finding sufficient cultivations for development in theMiddle Valley.
In the Lower Plains the soils are definitely less fertile, and the climateis less favourable; as a result, the potential crop patterns are appreciably lessintensive, and the yields to be expected are somewhat less. A very important factoris the instability of the river channels in this region, which are liable to changetheir sectiOn or even their course completely, or break out*in new branch channels;many areas are subject to serious damage by flooding. However, these dangers anddifficulties can be obviated by the watei control to be provided by the Tendaho Dam;it can be said that the construction of this Dam is a pro-requisite to considerabledevelopment of irrigation in the Lower Plains) certainly beyond the 20,000 ha ofcommercial farming and "outgrowers" for which water rights have already been grantedand the 10,000 - 15,000 ha of "flood" cultivation in the Asayita delta by small-holders. No reason has appeared so far to indicate difficulties in finding culti-vators for development here, any more than in the Middle Valley. Cosmmunications
with the rest of Ethiopia and other countries are provided by the Adis Abeba-Dese-
Aseb road; another main road from Adis Abeba to Aseb is to be built shortly.Socially and politically, development in the Lower Plains appears to be highlydesirable, and offers in the long run the prospect of establishing family sizefarms, which should be supported by sound services for agricultural extension andcredit.
Un grounds purely of technical and economic benefit to Ethiopia as a whole,the balance of advantage appears definitely to lie with the early development ofareas in the Upper and Middle Valley to the maximum possible without Kesem Dam(which, necessary for full ultimate development in these 14gions, involves relativelyhigh expenditure and may be contemplated at a later stage). But the extent andtiming of such development in the Upper and Middle Valley cannot be definitely planneduntil it can be determined whether the Meki Diversion Scheme in some form or other ispossible, or whether only the compensation reservoir must be assumed and if so,where and of what capacity. The need for surveys and investigations to determinethese questions will operate to defer to some extent the rate of development in theUpper and Middle Valley.

- 96 -
In the Lower Plains, Government is already committed to water rights forabout 20,000 ha at Dubti and Dit Bahri, plus existing small-holders cultivation inthe Asayita area, say some 11,000 ha. These developments are at present subjectto the risks of flooding, instability of channels, etc. To some extent it might bepossible to control these by local river training works etc. But the efficacy ofsuch works could never be certain and their cost would be considerable. Further, ,the construction of the Tendaho Dam would control these risks much more effectively.It would also make possible the ultimate extension of irrigation to a total of atleast 66,300 ha and possibly 70,000 ha in the Lower Plains. Clearly, then,on technical and economic grounds alone the construction of Tendaho Dam at a fairlyearly stage of development would be fully justified.
The construction of Kesem Dam can be deferred until it becomes apparentthat it is essential for the full ultimate development of irrigation.
4. Stages of Development Proposed
Taking into account all the considerations discussed above, three successivestages ofdevelopment are proposed, on the general lines set out in Table 27.
TABLE 27 - PRESENT AND PROPOSED STAGES OF DEVELOPMENT
Target Areas of Development hectares
Stage Water Control Upper Middle Lower TotalsValley Valley Plains
Technical considerations affecting the implementation of development inthese stages, including particulars of individual areas and schemes, and the worksand costs involved, are discussed in chapter X - Development of Irrigation.
5, Master Plan
Once the necessary further surveys and investigations have resolved thepresent remaining uncertainties affecting water control and irrigation development,it will be possible to prepare a "Master Plan",at least in its main outlines, forthe whole Awash Valley, in such a form as to fit into the national developmentplan for Ethiopia, and make the optimum possible contribution to the country'seconomy. In this of course, the financing of development will have to be takeninto account, with a realistic schedule of investment.
Present Koka Reservoironly
6,650 1,550 16,100 24,300
FirstKoka Reservoir
only 12,000 19,500 31,900 63,400
Second
Koka Reservoir, + MekiDiversion Scheme (orcompensation Reser-voir) + TendahoReservoir
12,000 50,850 51,300 114,150
ThirdAs second stage +Kesem Reservoir 12,000 84,950 66,300 163,250

- 97 -
Within the framework of the master plan, the timing of the successive stages canbe fleXible, to be suited to circumstances.
-98-
CHAPTER X - DEVELOPMaTT OF IRRIGATION
Present Development.
As yet relatively little use has been made of the water resources in theAwash Basin for irrigation. In the Upper Valley, the 6,000 hectares plantation atWenji for sugar cane has been very successful from all aspects. Other schemes ofmodest size include those at Genet*and Nura-Era. In the Middle Valley, 850 hectaresat Abadi-Metehara, and 650 hectares at Kesem-Kebena, with a small area a,t melkaWarar, are developed. In the Lower Plains the Tendaho Plantation Share Co. hasdeveloped 4,000 ha at Dubti, and 500 ha at Dit Bahri; in addition some 11,600 hain the Asayita and old Awash areas are under cultivation by small holders withcrude means and only moderate yields: in the Lower Plains the main cash crop iscotton. The total present area under irrigation from the Awash is about 24,300 ha.Under the present relatively liberal regulations for the use of land and water, muchof this development has so far proceeded with little planning and preparation andtechnical or administrative coordination. The Awash Valley Authority was recentlyset up as a controlling body, responsible for planning the hydraulic and agri-cultural development of the basin as a follow-un to the investirt;ations of thepresent Survey. Until this planning materializes in action, it is to be expectedthat for several years at least, developmtnt will continue on the lines followedso far.
Principles affecting the Extension of Agricultural Development.
It is clearly very desirable that the development of all new areas shouldbenefit from the latest technical means and knowledge, so as to ensure the bestcombination of economy, effectiveness and reliability. Only the lands of suitablequality (in this case Class II and III), and those most easily provided with waterand cultivated, should be considered for development.
Methods of Supply. In general, supply schemes operating by gravity arerecommended; these involve canal headworks with, or without, a diversionweir or barrage across the river. Pumping is recommended in some cases,for instance for the modernization of the irrigation in the Asayita delta;with small units drawing water from existing channels, and supplying eachfrom 150 to 200 ha of land. Large pumping units are advisable in caseswhere gravity irrigation would involve long and costly feeder canals, e.g.the cases of the Bolhamo area in the Middle Valley and the Old Awash areain the Lower Plains.
Canalisation. To reduce costs, in most cases earth canals are proposed,as the ground through which they will pass appears to be sufficientlyimpervious. A fairly high average velocity of flow (0.75 m/s) is proposed,to reduce as much as possible the risks of sedimentation, and as a pre-caution against bilharziasis. Structures on canals should provide for thebest available techniques of water control and distribution, in order tosimplify operation and reduce losses.
In the layout of canal systems, each area has been divided into unitsof, at most, 40 ha ( = 1 gasa) each. It is proposed that these shouldwhere possible be rectangular, with standard dimensions of 400 m x 1000 mwhich are suitable for either furrow or strip irrigation where slopes aregentle. Figure No. 16 (in the folder) shows a typical layout with smallpumping unit, as proposea for the Asayita delta.
* TETSETE GENET in the TIBILA PLAIN

iii) Drainage. Systems of drains are proposed, to ensure the collection anddisposal of natural runoff and surplus irrigation water within the irrigableareas. The specific rate of 2.5 litres/sec/ha is proposed, which shouldensure that no area of land remains submerged for more than 24 hours, moreoften that once in 2 years. Runoffs from catchment lying above irrigableareas should be passed through them to discharge freely downstream.
iv) Flood Protection. Where necessary,irrigable areas from flooding by spillflows of natural runoff.The application of these principles toVol.V.
- 99 -
d,ykes should be provided to protectfrom rivers and streams, or to divert
individual schemes is described in
Individual Irri ation Schemes - Upper Valley.
The chief development possible here will be the extension of the Nura-Erascheme to an ultimate area of 5400 ha. No more irrigation development in this regionwould appear advisable, unless the Meki river diversion for irrigation project isimplemented. The Upper Valley is a marginal region for rainfed agriculture, andfurther development of irrigation here should only be authorized after water isprovided for arid and semi-arid regions.
Individual Irr ion Schemes - Middle Valle .
Schemes on the principles outlined above have been evolved for five areas inthe Middle Valley, with preliminary estimates of cost to make possible tentativeeconomic appraisals. They are shown in schematic form on Map Yo. 17 (in the folder).Notes on these five schemes follow
Kesem-Kebena. When the Kesem dam is built, this area, ultimately ofabout 17,550 ha could be irrigated from headworks at the present water intakeat Awora Kelka, supplying a canal system fanning out towards the Awash.These subsidiary areas would require dykes to protect them against floodingfrom these rivers; joining up with the system of dykes along the Awash.
Melka Sedi. The area here some 8;550 ha, could draw water from theAwash by a weir and headworks on the right bank at the outlet of the gorgebelow Awash Station. These works would raise the water level at low stageby some 3 m 7 and would supply a main canal aligned along the foot of thehills above the Aleydegi plain. Because the banks of the Awash here havebuilt themselves up by spill, a branch canal along the higher ground besidethe river will be necessary. Dykes will be needed to give protection fromflooding by the Kesem and Kebena rivers, and if necessary from the raisedwater level resulting from a diversion work at Melka Warrar see iii) below).
Amibara-Angele. This area, ultimately some 16,650 ha, lies on the rightbank immediately downstream (ii). It could be supplied either
a by an extension of the Melka Sedi canal system.b by a barrage with gates on the rock hill at Melka Warrar, below
Mount Dofan.
Investigation indicates that the latter would be the more economical
solution, and it would still avoid undesirable interf'erence with the
drainage of areas upstream. Here, as in (ii),,a branch canal along the
raised ground beside the Awash would be necessary. Extensive dykes
would be needed to protect the lower parts of this area against
flooding.

- 100-
Bolhamo. This area of 8,900 ha, on the left bank opposite Amibara
is delineated by an amphitheatre of the hills through which no permanent
river runs. Water for this area will have to come from the Awash at the
Melka Warar barrage, via the Amibara riverside canal, to a pipe on the
bridge across the Awash.
Maro-Gala. This area lies further north than (i) to (iv), along thewestern edge of the Gewani swamp. Its ultimate area is some 23,000 ha, andit is compact in shape. It could readily be supplied with water from aheadworks on the Awash at the lower end of the gorge bear Mount Dabita Ale.Four fifths of the area could be irrigated by gravity, and the rest, on itsupstream side, by pumping. Arrangements for drainage and protection againstflooding could probably be simple and relatively inexpensive.
Comments. Because these schemes in the Middle Valley can almost entirelybe supplied with water by gravity, they are in general fairly inexpensive.The Melka Sedi and Amibara areas further are favourably located, and there-fore merit priority development. The Bolhamo and Kesem Kebena areas havelower priorities, the former because of its higher initial and operatingcosts, and the latter because of its dependance on the large and somewhatexpensive Kesem Dam.Metehara-Abadir areas covering some 10,500 ha in the Middle Valley have beensurveyed in detail by Israeli and Dutch experts. No schematic irrigationlayout was prepared for this region by the Project team in view of theexpectation that the Metehara project would be developed on a concessionbasis.
5. Individual Irrivation Schemes - Lower Plains.
As already indicated the Lower Plains are deltaic, with a complex andunstable network of channels. Every year during the high water period the riversoverflow and the lands are flooded. This, it is true, results in beneficialdeposits of sediment, but it also conduces to modifications of the branch channels,and even to the formation of new channels, with consequent changes in the patternof irrigable lands. Something of this sort probably happened in the northern partof the Asayita delta, as a result of which a considerable area of arable land hadto be abandoned. The Boyale branch is now gradually forming a new channel foritself.
Apart from uncertainties due to flooding and unstable river channels,irrigated crops in the Lower Plains are affected because *adequate supplies in theriver are only available during the relatively short period of high flows. Theprimary purpose of building a dam at Tendaho is to regulate the flows in the Awashso as TO be able to satisfy the irrigation requirements of the maximum possible areaof land and at any time of the year. This dam, however, will also control the floodpeaks, and thus remove the main factors causing instability of the channels. Thiswill also result in the partial reclamation of extensive marshes, which may becomegrazing lands. The retention in the reservoir of much of the sediment load of the .
Awash will affect the regime of the channels downstream which are likely to be eroded.However it should be possible to counter this by suitable works for river trainingand stabilisation, and by the use of flow distributorsat channel bifurcations, e.g.at the heads of the Bogale and Issa branches, Such water spreading should improvethe grazing on lands between the irrigable areas, to replace those taken into thelatter.
The layouts of Individual Schemes are shown in schematic form on Map No. 18.(see folder). Notes on them are as follows :

101
Dubti. This area, now under development by the Tendaho PlantationsShare Co. under a concession for 6,000 ha, has a canal system fed partly bygravity intake, and partly by pumps. The area could be extended to some91.050 acres, and could also supply water to private cultivations outside,as far as the Boyale branch and swamp.
Dit Bahri. The development of this has just begun, also by the T.P.S. Co, undeia concession for 6,000 ha. No diversion weir across the river appears necessary,but the headworks, in view of.its vulnerability and importance, should be suitablyprotected.
Minor riverside areas between Dubti and Dit Bahri will have to beirrigated by small pumping units.
Asayita delta Here lands are cultivated by small holders as the floodsrecede, in somewhat primitive fashion, with shortterm crops. The areacomprises a whole network of meandering natural channels. To make the bestuse of the area these should be realigned and intermediate channels should beopened. But this cannot well achieve the best possible results until theTendaho reservoir controls the flows, and reduces flooding and instability.It will then be possible to use small pumping units drawing from the networkof channels, and supplying tertiary irrigation units of say 150 to 200 ha,thus providing an adaptable means of modernising cultivation and improvingyields in this area. The ultimate area is forecast at some 26,000 ha .
Old Awash Area. This is surrounded by a former channel of the Awash,from which it was still being irrigated a few decades ago. The restorationof this area to effective agriculture will involve the diversion of watersupplies to fill this old channel, or better, the excavation of a new canalalong the same route. A single pumping station of some 900 kW at its headis proposed to boost the water level in the system, which in present conditionsseems likely to be inadequate. The ultimate area may be about 11,300 ha .
Comments. Power for all pumping required is expected to be available
from the Tendaho Dam. It is clear that development of the Lower Plains canonly be done on a relatively limited scale, until this Dam is constructed.After its construction; reclamation of marshes may add not only grazing lands,
but perhaps even irrigable lands, which being at present flooding have been
either classified as Class IV land or not surveyed.
6. Stafees of Development. Table 28 and Map 19 show summary particulars of thedevelopment of the various individual projects or groups of projects, in the variousparts of the Basin, as now existing and as sugeested for the three stages ofDevelopment discussed in Chapter IX para 4.
The First Stage, possible with the degree of water control already provided
by the Koka Reservoir, would increase the total area to over 63,000 ha, more than
2Y2 times its present figure. This may be expected to take a number of years, which
will give time for the necessary further investigations required (see para 7 below),
and their results considered. In the Lower Plains, before the promoters 9f Irri-
gation can fully achieve their present nominal entitlement, much less expand further,
it will be essential to construct the Tendaho Dam: the decision to build it should
therefore be taken in the First Stage.
Before the Second Stage begins, it will be very desirable, and should have
been possible, to prepare the master plan for the ultimate development of the whole
Basin. The implementation of the stage will call for further water control to make
more water available for use in the Middle Valley; this will preferably be the

TABLE 28 - PROPOSED DEVELOPMENT OF IRRIGATION BY PROJECTS AND STAGES
* Total of 20,000 ha covers water rights granted to Tendaho Plantations Share Co. and outgrowers.
,
PresentFirst Stage Second Stage Third Stage
Projects AreaAdditional Total Additional Total Additional Total
UPPER VALLEY
Wonji, Genet and others 6,600 0 6,600 0 ' 6,600 0 6,600Nuri, Eva 50 5,350 5,400 0 5,400 0 5,400
Total Upper Valley 6,650 5,350 12,000 0 12,000 0 12,000
MIDDLE VALLEY
Abadir - Metehara 850 9,650 10,500 0 10,500 0 10,500Kesem - Kebena 650 1,350 2,000 0 2,000 15,550 17,550Melki Sedi 0 6,000 6,000 2,550 8,550 0 8,550Amibara - Augelele 50 950 1,000 15,650 16,650 0 16,650Bolhamo 0 0 0 2,500 2,500 6,400 8,900Maro Gala 0 0 0 10,650 10,650 12,150 22,800
Total Middle Valley 1,550 17,950 19,500 31,350 50,850 34,100 84,950
LOWER PLAINS
Dubti 4,000 5,050 9,050* 0 9,050 0 9,050Small riverside areas 0 0 0 0 0 3,700 3,700Dit Bahri 500 10,450 10,950* 5,400 16,350 0 16,350Asayita Delta etc. 11,600 300 11,900 14,000 25,900 0 25,900Old Awash 0 0 0 0 0 11,300 11,300
Total Lower Plains 16,100 15,800 31,900 19,400 51,300 15,000 66,300
GRAND TOTALS 24,300 39,100 63,400 50,750 114,150 49,100 163,250
104
Meki Diversion Scheme, if found feasible, or alternatively a compensation reservoiron the Awash below Koka Reservoir and tha power sites further downstream. Unlessthe Meki Diversion is possible, no further irrigation development is recommended inthe Upper Valley; this is a marginal area for rain-watered agriculture and furtheragriculture development would involve the cleaning of extensive areas of woodlands,and also would tend to reduce the power potential of the Awash flows.
The third Stage would achieve the full development of irrigation in theAwash Basin, up to a total of some 163,000 ha For this, further water controlwould be needed in the construction of the Kesem Dam.
The costs of development, both of water control works and of irrigationschemes, are estimated and discuesed in Chapter XI.
7 Commente on Suggested Developments. The layouts and designs suggested forthe varioue projects in the three stages of development outlined above are entirelypreliminary. Knowledge of the topography of the areas to be developed is not yetsufficient for the preparation of more definite layouts. In the Middle Valley, areasfor development are well defined by natural features such as foothills etc., andthey occur in more or less separate units of moderate size. In the Lower Plains,on the other hand, natural boundaries are less well defined. Land classification,following the soil survey, provided the first criteria for delineating tentativeschemes of irrigation development. Except in email areas, littLe is known of thetopogx.aphy of this area, and the Map No. 18 should be regarded as providing merelya schematic concept of a possible layout.
It is olear the.t before a comprehensive plan for the development ofirrigated agriculture can be prepared, further extensive surveys and engineeringstudiee must be undertaken. This is primarily the responeibility of Government,or at least of a Government sponsored authority. Detailed layouts and designe forthe execution of individual projecte may be prepared either by Government authority,or by concessionaries or owners of the lands) as may be found most appropriate ineach particular case.
The development of irrigable lande in the Middle Valley appears; to betechnically relatively simple. Even where areae are adjacent, separate layoutsfor irrigation can be prepared without difficulty, provided due allowance is madefor the neede of other areao, e.g. for feeder canals, drainage, etc. In the LowerPlains in contraet, development ehould be regrded as technically more difficult;,it will be deeirable to outline a comprehensive scheme for the whole region beforeattempting to prepare definite layouts for individual projects. The technicaletudies involved will be more complexe and will need more time than thoee for theMiddle Valley.

105
CHAPTER XI ESTInATES OF COSTS AND ECONOMIC APPRAISALS
1. Estimates of Costs
Estimates have been prepared of the costs involved in the development of theprincipal projects discussed in this report. The basis on which these estimateshave been framed are set out Vol. IV and V.
Since the engineering inveo.tigabions made so far have been of a preliminarynature and detailed designs have not yet been made, the costing is necessarilyapproximate. In projects where no geologicei or soil mechanics investigations werecarried out, it has been assumed th.::.t no particular foundation problems will beencountered. For the Kebena dan, it was assumed that similar precautions to thoseforeseen on the Kesem dam site would be necessary. For the Meki River Diversion,the assumption was made that the permeability and erodibility of the bed of thediversion canal will be sufficiently low to make lining unecessary.
No provision was made for changes in the basic rates of cost of materials, plantand equipment, labour, taxes, customs, etc. Ilachinery prices were taken at thoseprevailing in the world market at the end of 1964. Data of unit prir,es for civilengineerinE works as quoted by contractors in Ethiopia were systematically collectedand kept up to date during the field operations of the Project.
Irrigation schemes costestimates incluae all engineering and land preparingworks which are a responsibility of ei,her the Public Authority or Government, or thelandwners or farmers. Investment in the field distribution systems, i.e. farm canalsand drainage ditches, and in land levelling, is usually the responsibility oflandwners or farmers; this ezounts to about 1/3 of the total estimated investmentcost. .
The allotment to individual projects of the cost of shred civil engineeringworks such as protection dykes or large drainage canals is often a difficult operation.
A tentative allotment has been made for Hiddle Valley development afeas, with
resulting uneven distribution of this burden. Other cost allotment patterns might
also be applied. For Lower Plains development areas, the engineering works commonto all subareas are to be allotted to all irrigable land and evenly distributed.
The cost of roads and power transmission lines is not included in the irrigation
development estimates. Expenditure for road building is to be added for purposee of
economic analysis. The nosts of trangmission lines and that part of dam costsattributable to the generation of.energy may be omitted if :ne power price for
pumping includes delivery cost.
Annual charges must also be computed for economic analysis.
Since neither the date and period of constructing the works, nor the method by
which they would be financed, nor the rate of interest is known, no allowance is
included for interest on capital during the period of construction.
To the totals of costed major items, which include general expenses, there has
been added 30'/, which should cover the cost of design, supervision of work, and an
allowance for engineering contingencies.
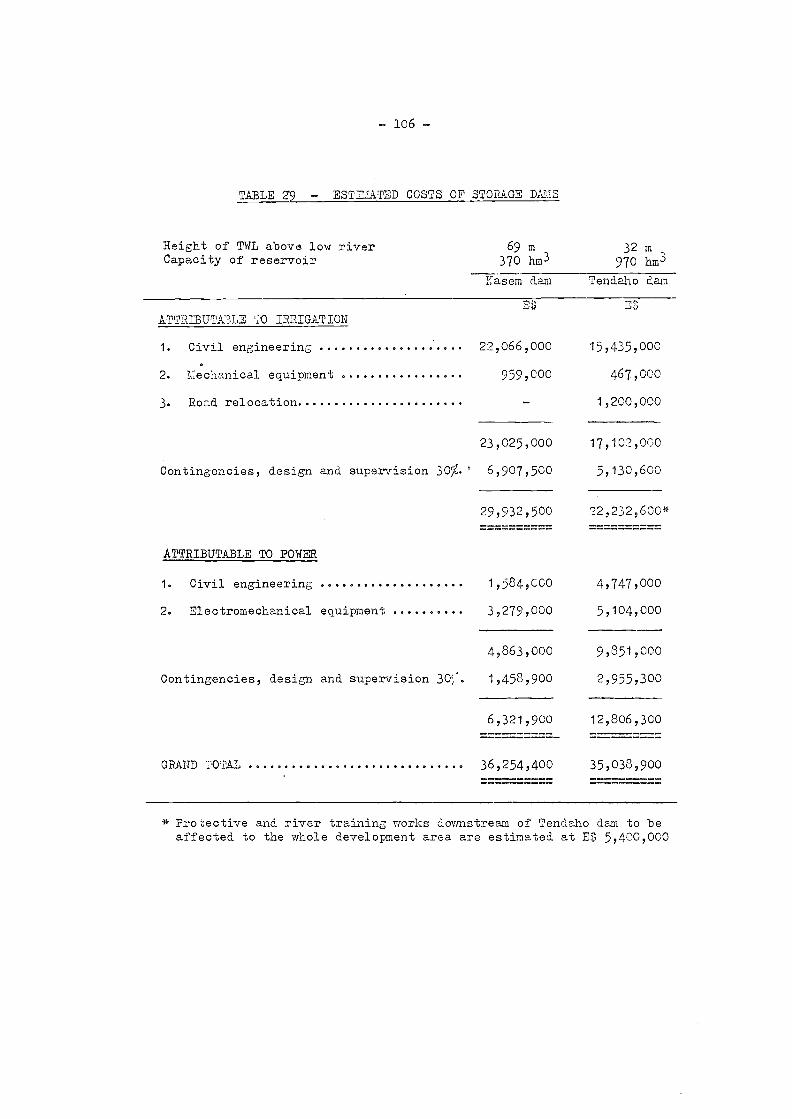
106
TABLE 29 ESTMATED COSTS OF STORAGE D.AL' S
Height of TWL above low river 69 m 32 mCapacity of reservoir 370 hm3 970 hm3
Kasem dam Tendaho Eam
FA;
ATTRIBUTA= CO IRRIGATION
Civil engineerin,:. 22,066,000 15,435,000
Mechanical equipment 959,000 467,000
Road relocation 1,200,000
23,025,000 17,102,000
Contingencies, design and supervision 30%. 6,907,500 5,130,600
29,932,500 22,232,600*
ATTRIBUTABLE TO POWER
Civil engineering 1,584,000 4,747,000
Electromechanical equipment 3,279,000 5,104,000
4,863,000 9,851,000
Contingencies, design and supervision 30. 1,458,900 2,955,300
6,321,900 12,806,300
GRAND TOTAL 36,254,400 35,033,900
* Protective and river training works downstream of Tendaho dam to beaffected to the whole development area are estimated at E!; 5,400,000

- 107 -
TABLE 30 TENTATIVE FOXI'CAST OF COST OF KEBENA DAM
E$
Civil engineering ......... .............. 16,200,000
Electro,andor mechanical equipment ...... 2,237,000
Contingencies, design and supervision 300
18,437,000
5,533,000
23,970,000
TABLE 31 ESTMATE OF COSTS OF DIVERSION OF MEKI RIVER
E$
Civil engineering ....... 7,896,400
Electro andor mechanical equipment 201,600
8,098,000
Contingencies, design and supervision 30';': 2,429,000
10,527,000

TABLE 32 - IRRIGATION DEVELOPMENT - PARTICULARS F WORKS AND ESTILATES OF COST
Notes : Figures do not include cost of river training and protection works (eee table 29)2 Estimates of volume of works and of coot are related to the Middle Valley without Abadir Metahare (84,950 - 10,500 = 74,450 ha)41 Coät per heätare assumed to be El 1,71:6 as fär glIBabl5) " " . . . " ES 1,165 " " Asayita Delta
At June 1965, 2.5 ES were equivalent to 1.0 OS.
- 108-
Items
Middle Valley Lower Plains (1)
Abadir- Kesem Melka Amibara- Bolhamo Maro-Gala Totals Dit Asayta ,ad Small Totals
Metehara Kebena Sedi AnE;elele (2) Bahri Delta Awash Gravity Pumping ' Areas
Areas - hectares 10,500 17,550 8,550 16,650 8,900 22,800 84,950 16,350 25,900 11,300 6,500 2 550 3 700 66 300
PARTICULARS OF V RES
Main and Secondary Canals - KmMain and Secondary Drains - Km
8561
45119
57119
54,
39
100
65341
2847456
9462
4345
__
__
_ __
Protection Dykes - Kin 35 69 69 29 33 216 15 - - -
Excavation - Thous m3 1,850 4,300 4,300 2,350 1,650 10,150 2,150 1,800 750 - - -
ESTIMTES OF COST
Headworks or Pumping Stations - Thous. ES 1,400 618 1,686 1,305 1,700 6,709 380 4,592 1,520 _ _
Canal Systems, Main secondaryand tertiaryu 11
IIField Channels m0
8,2562,035
5,579992
10,1041,931
6,5831,032
9,5792,644
40,4018,634
8,3851,896
4,4323,094
3,6381,311
_-
_ _-
Protection DykesLand ClearingLand Levelling
,ma-,.0mo
5,6102,071
5,428
1,349702
2,592
3,3301,0805,235
1,923698
2t 908
2,171912
5,700
14,3335,463
21,863
1,0232,2207,344
02,3868,805
0668
2,825
-
__
-__
__
Totals oc
24,800 11,832 23,366 14,449 23,006 97,453 21,748 23,219 9,962 _ _
Design, superv sion andcounting 30/, u 7,440 3,550 7,010 4,335 6,902 29,237 6,524 6,966 2,989 - - - -
(3) (4) (5)
GRAND TOTALS 32,240 15,382 30,376 18,784 29,908 126,690 28,272 30,185 12,951 11,239 2,922 4,310 89,879
(3) (4) (5)
COST PER HECTARE ES 1,837 1,799 1,824 2,110 1,312 1,702 1,729 1,165 1,146 1,729 1,146 1,165 1,356

109
2. Economic Aypraisal.
An appraisal of the economic feasibility of the various developments proposedby the Survey was made by two consultants appointed by Special Fund, Dr. L.G.Allbaugh,Economic Production Economist, and Mr. R.M. Arbuckle, Agronomist. An abridged version:-of their report, submitted to Special Fund in January 1965, is attached to thisvolume as Appendix No. 3. Their main economic conclusion on the projects proposedmay be summarized as follows
Assuming the additional area to be developed for irrigation on the Awashas 150,000 ha, the overall benefit/cost ratio would be about 1.95:1, atinterest:
In addition, some 115 million kilowatthours of electric power could beproduced annually, at 1/4 to 1/3 of the cost from the best alternativesource:
Control of floods would increase net incomes by about E$ 100,000 annually:
The gross value of the annual agricultural product of the whole projectis expected te be E$ 181 million with an annual net gain over presentproduction .of about E$ 60 million:
(i)The investment required for these results is expected to be:
Initial Dams, irrigation works, roads etc.
Associated Costs by farmers (including E$ 62millions for land levelling and quaternarycanals).
Total 430.3
The projects are expected to provide some 10,000 to 15,000 family farms,and employment for some 25,000 to 30,000 workers:
Secondary benefits, not as yet estimated, will arise from services,transport, and processing industries:
The data of the survey, and the economic evaluations made in this appraisal,
are entirely preliminary, and further detailed soil surveys and pre-
investment studies and investigations are necessary. Nevertheless, it is
believed that the findings of the economic report give a reasonably accurate
assessment of the possibilities of developing the agricultural economy of
the Awash region, that the estimates of costs are sufficiently liberal, and
that the estimates of yields used are conservative,:
e. \\ix) While the Government of Ethiopia favours development of irrigated lands by
large scale mechanised enterprses, under skilled management, from a
social point of view it also appears desirable to allot a próportion of the
available lands to small farmers, already trained and experienced in the
practice of irrigation on the larger schemes:
(1) See comments in para. 3 below
E$ Million
250.6
179.7
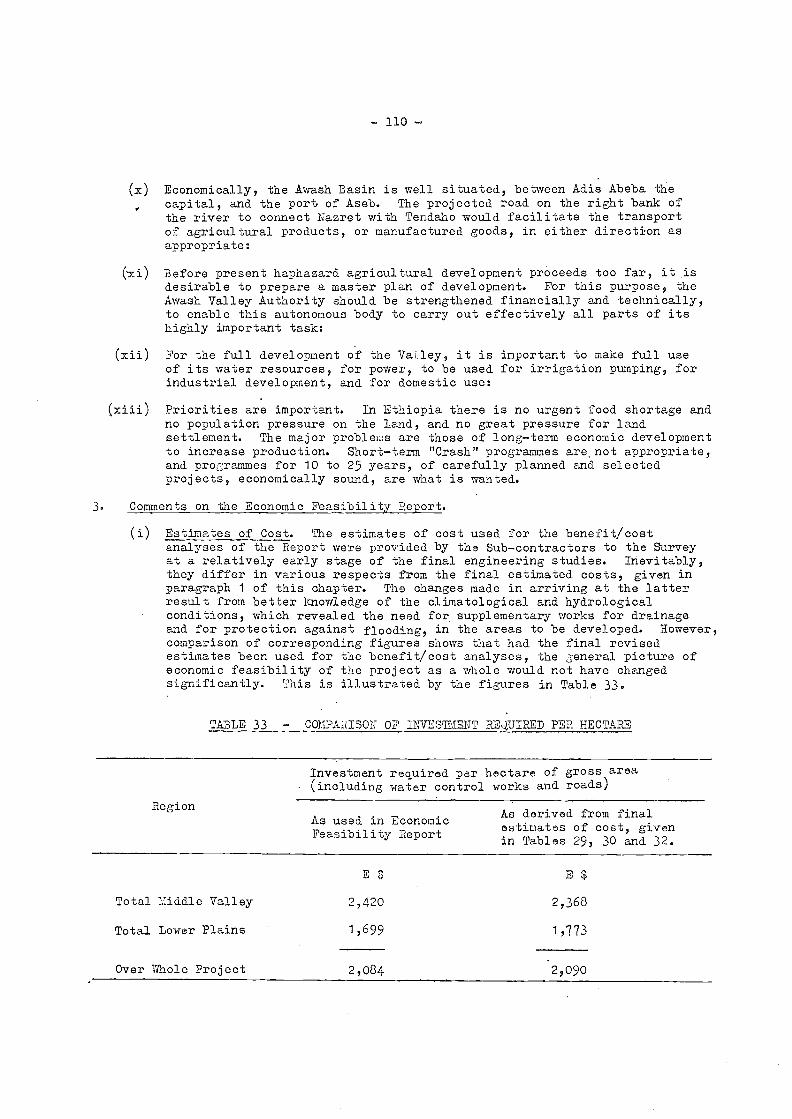
Region
Total Eiddle Valley
Total Lower Plains
Over Whole Project
- 110-
(x) Economically, the Awash Basin is well situated, between Adis Abeba thecapital, and the por t of Aseb. The projected road on the right bank ofthe river to connect Nazret with Tendaho would facilitate the transportof agricultural products, or manufactured goods, in either direction asappropriate:
Before present haphazard agricultural development proceeds too far, it isdesirable to prepare a master plan of development. For this purpose, theAwash Valley Authority should be strengthened financially and technically,to enable this autonomous body to carry out effectively all parts of itshighly important task:
For the full development of the Valley, it is important to make full useof its water resources, for power, to be used for irrigation pumping, forindustrial development, and for domestic use:
Priorities are important. In Ethiopia there is no urgent food shortage andno population pressure on the land, and no great pressure for landsettlement. The major probleLls are those of long-term economic development
. to increase production. Short-term "Crash" programmes are.not appropriate,and programmes for 10 to 25 years, of carefully planned and selectedprojects, economically sound, are what is wanted.
3. Comments on the Economic Feasibility Report.
(i) Estimates of Cost. The estimates of cost used for the benefit/costanalyses of the Report were provided by the Sub-contractors to the Surveyat a relatively early stage of the final engineering studies. Inevitably,they differ in various respects from the final estimated costs, given inparagraph 1 of this chapter. The changes made in arriving at the latterresult from better knowledge of the climatological and hydrologicalconditions, which revealed the need for supplementary works for drainageand for protection against flooding, in the areas to be developed. However,comparison of corresponding figures shows that had the final revisedestimates been used for the benefit/cost analyses, the general picture ofeconomic feasibility of the project as a whole would not have changedsignificantly. This is illustrated by the figures in Table 33.
TABLE 33 COMPAitISON OF INVESTMENT REUIRED PER HECTARE
Investment required per hectare of gross area(including water control works and roads)
As used in EconomicFeasibility Report
As derived from finalestimates of cost, givenin Tables 29, 30 and 32.
E$ E $
2,420 2,368
1,699 1/773
2,084 2,090
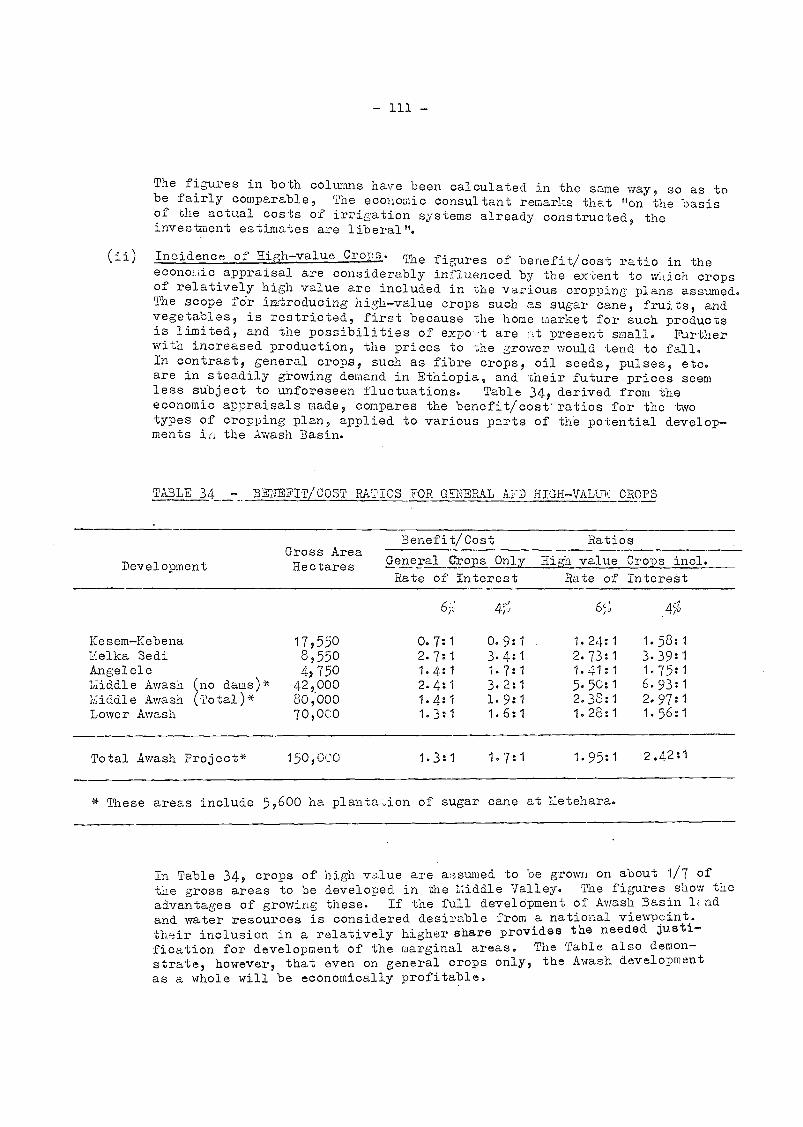
The figures in both columns have been calculated in the same way, so as tobe fairly comparable, The economic consultant remarks that "on the basisof the actual costs of irrigation systems already constructed, theinvestment estimates are liberal".
(ii) Incidence of High-value Crops. The figures of benefit/cost ratio in theeconoLiic appraisal are considerably influenced by the extent to w;lich cropsof relatively high value are included in the various cropping plans assumed.The scope 176r introducing high-value crops such as sugar cane, fruits, andvegetables, is restricted, first because the home market for such productsis limited, and the possibilities of expo-t are nt present small. Furtherwith increased production, the prices to the grower would tend to fall.In contrast, general crops, such as fibre crops, oil seeds, pulses, etc.are in steadily growing demand in Ethiopia, and their future prices seemless subject to unforeseen fluctuations. Table 34, derived from theeconomic appraisals made, compares the benefit/cost'ratios for the twotypes of cropping plan, applied to various parts of the potential develop-ments ia the Awash Basin.
TABLE 34 - BE1TEFIT/C0ST RATIOS FOR =BEAL ATD HIGH-VALn CROPS
Benefit/Cost Ratios
General Crops Only High value Crops incl.
Rate of Interest Rate of Interest
* These areas include 5,600 ha plantaion of sugar cane at Metehara.
In Table 34, crops of high value are acsumed to be grown on about 1/7 ofthe gross areas to be developed in the Middle Valley. The figures show the
advantages of growing these. If the full development of Awash Basin lJndand water resources is considered desirable from a national viewPoint.their inclusion in a relatively higher share provides the needed justi-
fication for development of the marginal areas. The Table also demon-strate, however, that even on general crops only, the Awash development
as a whole will be economically profitable.
Kesem-Kebena 17,550 0.7:1 0.9:1 1.24:1 1.58:1Yelka Sedi 0,550 2.7:1 3.4:1 2.73:1 3.39:1Angel ele 4) 750 1.4:1 1.7:1 1.41:1 1.75:1Middle Awash ric) dams * 42,000 2.4:1 3.2:1 5.50:1 6.93:1Middle Awash Total 80;000 1.4:1 1.9:1 2.38:1 2.97:1Lower Awash 70,000 1.3:1 1.6:1 1.23:1 1.56:1
Total Awash Project* 150,000 1.3:1 1.7:1 1.95:1 2.421
Gross AreaDevelopment Hectares

112
Incidence of Settlement.
Another problem affecting economic appraisals is the difference in the benefitsto be exr,ected from lar7escale commercial schemes, as compared with those from familyfarms. Settlement is always relatively costly. The difficulties inherent in theoperation of irriEation schemes with numerous smallholders will be increased by thefact that as yet irrigated agriculture is practised only on restricted areas inEthiopia. Prospective settlers will in most cases be inexperienced, and will'haveto be taught almost everything about the art of irrig7ating. For this reason, inappraising the benefits of family farms, lower yields have been assumed, and longertime lags before.full production is attained. As a result, returns from familyfarming are less than those from commercial farming, and the inclusion in a projectof a high proportion of family farms will lower its overall benefit/cost ratio. Forexample, in the development of the Lower Plains, the benefit/cost ratio of 1.3 at 67,interest, given in Table 34 above, would have been 1.6 if the allotted to settlementhad been taken as only 14,000 ha, instead of 5C,C00 ha as actually assumed.
PlanninF of Development.
Priorities of development cannot be determined solely on grounds of intrinsicphysical and economic feasibility. Considerations of national economy, and socialand political factors, also have to be taken into account. 2or e:-.Lam:)1e, the promotionof settlement schemes may be important for the longterm econo.rdc and social develop-ment of the country, even if the development of commercial schemes instead wouldinitially produce larger revenues and more foreign currency.
The complex nature of the problems involved in determining priorities in theAwash Basin calls for very careful planning and coordination of development policy.For example, the revenues from highyielding areas developed at an early stage mayperliaps be used later to finance the development of less profitable areas; in thisway, a kind of "revolving fund" may be formed, which may help to complete the develop-ment of the Basin as a whole.
A danger to be guarded against is that of "skimming the cream" from the mostpromi3ing areas first, without .suitable allocation of the resulting revenues. Thiswould make The returns on later developments appear to be relatively even lessattractive. An appropriate policy of differential rates of water charges may offera convenient and effective means of adjusting, as between the various types ofprojects, the otherwise uneven burden of investment costs. In fixing rates, it willbe necessary to cover the costs of providing services and infrastructure, e.g. dams,headworks, and main canals, and to provide revenue for continued development, all withdue regard to the benefits obtainable in each particular case.
Master Plan.
If the Imperial Government wishes to develop to the full the potential resourcesof the Awash Valley in the most effective and beneficial manner possible, two thingsare particularly essential. In the first place, it will be necessary to prepare aaMastor Plan" of development, in contrast to the somewhat haphazard methods ofdevelopment which have been applied hitherto. This plan will ensure that each itemof development is designed so as to fit in properly with others in the coordinatedwhole, giving the most efficient use of the resources involved and the.funds invested,which are national assets of the country as a whole. Further, it will make sure thatthe development of any item in the earlier stages will not in any way cause diffi-culties in the subsequent development of other items at later stages.

113
7. Awash Valley Authority.
In the second place, it will be equally necessary to ensure the effectiveimplementation of the Master Plan, and the subsequent operation of the variousschemes of development, in accordance with the stipulated conditions, so as toproduce the benefits expected, for Ethiopia as a whole, and for the people engagedin these schemes in particular. With these objects in view, the Imperial Governmenthas set up the Awash Valley Authority. But the Authority does not yet possesspowers and resources, in staff, in equipment, in funds, in organisationland incontrol, commensurate with the great magnitude of the tasks and responsibilitieswhich it is called upon to face. It is of urgent importance that action to thisend be taken as soon as may be possible. Otherwise, it is not possible to see howthe potential benefits in prospect can be fully realised.
It is recommended that the Authority may suitably be made responsible forcarrying out the varied surveys, studies,and appraisals, proposed in this Report;for preparing on them as a basis the Master Plan, to be approved by the ImperialGovernment; for supervising the implementation of this Plan and, in part at least,its actual execution, and finally for supervising the operation of the varioussobemos of development, to ensure their technical and economic effectiveness. Theplanning of the organisation of the Authority is itself a matter of great importance.

- 114-
CHAPTER XII ADDITIONAL REMARKS
This report deals mainly with the development possibilities in the lowlandsof the Middle and Lower reaches of the basin and is concerned particularly with theland and water potential for irrigation.
However several important actions which should be undertaken with the aim ofimproving the agricultural and livestock production in the Basin are not overlooked.
In the lowlands
There is considerable scope for stepping up the standard of livestockproduction by improving grazing lands and providing supplementary watering points.
Measures recommended by water planning provide for the reclamation of severalswamps and marshes. In the first place extensive swamps in the deltaic region maybe partially reclaimed after the Tendaho dam is constructed. The water managementplan for the Tendaho dam and irrigated areas provides for water to be spread on thereclaimed grazing lands. Detailed plans for watering of the pasture lands cannot bedrafted before the series of recommended studies in the Lower Plains can produce thenecessary basic information.
Extensive grazing lands in the Awash Valley lack necessary drinking waterresources. A tentative scheme for underground water investigation in the Aleydegiplain was prepared under the project, and its implementation is strongly recommended.
In the h' h plateau
Although most of the arable lands are already under cultivation an appreciablepotential for agricultural development, however, exiSts also in the upper reaches ofthe basin. One of the most attractive projects appears to be that of the reclamationof Borkena Swamps. About 10,000 ha of marshland could be cultivated after the swampis drained. On the basis of observations made on the cultivated land on the shoresof the swamp, it is believed that the reclaimed soils would be fertile. Suitableclimatic conditions with a fairly high and well distributed rainfall, good communi-cations and easy access should enable prosperous agriculture to be established inthis area.
According to a preliminary survey a reduction of the water level in the swampmay be achieved by deepening the river bed at the outlet for a length of about 400meters.
There is also wide soope for improvement of agricultural production in theupper reaches of the basin. It can be achieved by improvement of existing farmingpractices, modernizing of implements, use of fertilizers of improved seeds, and alsoby applying appropriate soil conservation measures. A programme of such measuresshould be drafted on a national level its implementation calling for appropriatelegal and administrative measures.
Soil conservation measures are closely related with those which should betaken in order to arrest the deforestation of the basin. The lifetime of hydraulicstructures, both for hydropower production and for irrigation, depends on actionbeing taken to reduce land degradation in the basin. The necessity for replantingtree species, in particular in the vicinity of the capital city calls for immediateconsideration.

115
Reforestation, soil conservation, swamp reclamation, improvement of farmingpractices on cultivated lands, underground water investigations and improvements ongrazing lands, are activities which will increase the economic effects of irrigatedagriculture development in the Awash River Basin.
Improvement of farming practices may be the greatest factor on raising theliving standards of the great majority of the population. This, however) will bedifficult to achieve unless experienced and well equipped extension servicesencourage and help the peasants in the transition from traditional subsistenceagriculture to the modern, marketoriented farming.
There is little doubt also that enacting of appropriate agrarian legislationproviding for greater security and larger share in benefits for the tenant farmerswill be an important incentive for improvement of land and farming practices.

116
APPalIX I
PLAN OF OPERATION
UNITED NATIONS SPECIAL FUND PROJECT IN ETHIOPIA
SURVEY OF THE AWASH RIVER BASIN
Special Fund Allocation: US$ 930,100
Government Counterpart Contribution (equivalent of): US3 327,000*
Durations 3 years
Executing Agency: The Food and Agriculture Organizationof the United Nations
Cooperating Government Agency: Awash Valley Authority
For the purpose of the survey of the Awash River Basin to be undertaken bythe Food and Agriculture Organization of the United Nations acting as ExecutingAgency for the United Nations Special Fund, this P:tan of Operation shall be the
Plan of Operation referred to in Article I, paragraph 2, of the Agreement signedon 13 July 1960 by the Government of Ethiopia and the United Nations Special Fund.
I. PURPOSE AND DESCRIPTION OF THE PROJECT
A. The Putpose of the Project
1. To obtain data on the water potential of the Awash River and its tributariesfor irrigation and hydropower, and to establish the suitability of soils within thearea commanded by the river and its tributaries for irrigation farming. Such basicinformation is required for the judicious utilization of land and water resources ofthe basin and for safeguarding national interests when granting water rights to waterusers.
B. Background
2. In recent years great interest has been shown by private companies, foreignas well as Ethiopian, and by the Government itself, in large scale irrigation farmingand power schemes in the Awash River Basin.
3- As the amount of water available in the Awash for irrigation purposes islimited, the Government is anxious to establish, at the earliest possible date, thefull development potential of tne river before granting water and land rights.
4. At the same time the Government also wants to know the extent and locationof soils within the basin suited for irrigation farming.
5- Coordination between utilization of water for the generation of power andfor irrigation purposes is also an important requirement for which a good knowledgeof hydrological and soils conditions is indispensable.
* Government contribution towards local facilities (in cash) are not included in thisfigure.

- 117-
The Awash River originates in the highlands south and west of Addis Abeba atan elevation of about 2,500 meters. For a distance of approximately 800 kms the riverflows in an easterly and north-easterly direction to end in a chain of lakes situatedon the desert lowlands of Dankalia. The main Awash is joined along its course byseveral tributaries, all of which experience high floods during the rainy season andcritically low flow during the rest of the year. The Awash is characterized by severalwater-falls, especially in its upper and middle course. Previous reconnaissancesurveys have shown that there are potential power sites and new irrigable areas onseveral sections of the river valley. On one of those sites, situated at Koka, theGovernment has recently completed a storage dam and hydroelectric power station. Someirrigated agriculture already exists in the Upper Awash, which will be affected by theKoka Dam and reservoir. The dam impounds a reservoir of about 260 square kms ofsurface area and has an estimated storage capacity of 1,600,000,000 cubic meters. Thetotal generator installation is of 43,200 kilowatt.
The present irrigated areas in the valley consist both of estate plantationdevoted mainiy to sugar cane, rice, cotton, groundnuts and fruit crops, and smallpeasant cultivation, mainly in the lower reaches devoted to growing a variety ofcrops, mainly cereals.
C. The Project
The project consists of:
(1) The survey of the water resources of the Awash river and its maintributaries, including studies of possible improvement of the water-regime by flood storage. Survey of the water potential will include:
the establishment of a network of river gauging stations;
carrying out of observations at these stations during the entireduration of the project;
strenthening of the meteorological network and correlation ofmeteorological data with hydrological data.
(2) Preparation of a water management plan based on the results of thehydrological study mentioned in item 1. This water management planhas to be worked out by taking account of the water requirements forirrigation, the operational requirements and economics of hydroelectricpower plants. The utilization of groundwater as a supplementary sourceof supply should be taken into account to the extent to which data aremade available by the Government.
(3) Soil Survey. This part of the project consists of a reconnaissancesurvey of the potentially irrigable areas commanded by the main river
and its tributaries. The total area to be investigated first by areconnaissance type of marvey is estimated to be about 500,000 hectares-
This first survey will eliminate areas not suited for irrigation farming
and will then be a continued as a semi-detailed survey to cover an area
which is estimated to be about 100,000 hectares. A detailed soil survey
of pilot areas of about 20,000 hectares will be carried out in the final
stages of the soil survey. As a result of this survey land classificationmaps will be prepared which will include not only irrigable soils, but
also areas suitable as pasture land. A reconnaissance soil survey of
the potential grassland areas, some 200,000 hectares, is also included
in the project.

118
The study of the dam sites suitable for storage as well as for generationof power. This investigation will include engineering studies as wellas geological'investigations for dam foundtions and reservoir conditions.It will also include preliminary type of design and preliminary costestimates for dams and prn,er stations. More detailed investigations areenvisaged for one or two selected sites.
Sedimentation studies in the headwaters area. Sedimentation.studies willcover the basin of the Upper Awash upstream the Koka dam and will beconducted in cooperation with the Government Forestry Service which isalready making studies of the upper watershed. The main objective ofthis sediment and erosion survey is to establish the lifetime of thereservoir under prevailing conditions and establish the possibilitiesof a reduction of the silt and bed load in the river by introducingimproved conditions in the watershed.
Land use studies will ccnsist partly in studies of the land use problemsof tne upper reaches, but will also extend over.the lower Awash Basin.Here they will deal mainly with land use on irrigated land and withwater requirements.
Aerial photoL-raphy and mapping: this will include the preparation ofaerial photography covering the part of the Awash basin which has notyet been photographed. Contour mapping will cover mainly potentialreservoir areas. The total area to be photographed is about 30,000sq. km. A key map snowing the area is attached to the Plan of Operationsin Annex III.
Training of Ethiopian personnel and utilization of Ethiopian personnelin the program to the maximum extent possible consistent with theirabilities, are major objectives of the Programme.
II. WORK PLAN
A. Participation of the Executing Agency
9. Personnel Services Total manmonths: 367
(i) Water development planning engineer (project manager)
(ii) Hydrological Survey1 Hydrologist2 Hydrometrists1 Computer
(iii) Water Management Planning1 Waterplanning Engineer
(iv) Soil Survey1 Senior Soil Scientist1 Soil Survey Specialist1 Soil Survey Photo Interpr.1 Soil Chemist
(v) Power Damsites, Reservoir Studies1 Power Dam Design Engineer1 Engineering Geologist

Total US$ 784,700
119
(v Erosion Studies in Headwaters1 Soil Conserv. Specialist1 Sediment Hydrologist
Land Use StudiesI Land Use Studies Expert
Administrative Officer
Shortterm consultants
Subcontractor personnel, giving supporting services on water managementplans, designs, computing and costing.
Aerial Photography
Aerial photography of about 30,000 sq. kms. on 1/20,000 scale.
Contour mdps of potential redervoirs 800-1000 sq. kms. 1/10,000 or1/20,000 scale.
Equipment and Supplies
Hydrometric equipmentTopographic equipmentField and laboratory equipment for soil marveyTransport vehicles 4 wheel drive: 15Boats for sediment measurements etc.Preparation and printing of report.
11.a. Miscellaneous
Secretarial assistanceTravel within the countryCable and postage charges.
United Nations Special Fund Contribution (in cash):
The Special Fund participation in the project shall be in the amount of theequivalent of US$ 930,100. Of this amount, the eTaivalent of US3 6,000 is forpreliminary investigations, US,1; 79,400 is for agency costs (prorated), and US3 60,000is for personnel services supplied by the Executing Agency through direct employment.The balance of US$ 784,700 shall be deposited by the Special Fund on the baeis ofthe Plan of Expenditure, Appendix I, in United Nations Special Fund accounts to beopened as required by the project, as follows:
Equivalent of US3 425.010 on signature of the Plan of Operationfl 'I 215,877 on or before 1 January 1962
" " 143,813 on or before 1 January 1963

- 120-
13. Subcontracts
The Executing Agency shall carry out the sarvey through subcontracts withconsulting firms acceptable to the Government. The aerial photography shall beentnAsted by the Executing Agency either to the same consuiting firm or to a firmspecialized in such work, acceptable to the Government. The subcontractor(s) may berequested by the Executing Agency to supply part of the equipment needed for theproject; in this case he will prepare detailed lists which will need prior writtenapproval by the Executing Agency before placing purchase orders. The sub-contractorwill assume the same obligations as the Executing Agency under article 8, paragraph 8.
14. The Government shall issue entry visas to the personnel of sub-contractorsemployed on the project and shall grant duty-free import of equipment and materialrequired for the execution of the survey. The Government shall also grant re-exportof such equipment after completion of the contracts. The above facilities shall begranted by the Government to the sub-contractors on certification of the ExecutingAgency.
15. (a) The Government shall ex'empt from any taxes, duties. fees or levies which maybe imposed on the sub-contractors, or their personnel in respect of:
the salaries or wag.es earned by such personnel in the execution of theproject with the exce;)tion of locally employed personnel;
any profits earned by the subcontractors in the execution of the project;
(i any equipment, materials and supplies, brought into the country by thesub-contractors for the completion of this Plan of Operation or which,after having been brought into the country may be subsequently withdrawntherefrom.
(b) Any property, brought by the firm or Qrganisation or its personnel for theirpersonal use or consumption may be subsequently withdrawn therefrom afterdeparture cf such personnel.
B. Contribution of the Government
Counterpart participation
16. Technical personnel - Total man-months: 408
HydrometristsMeteorologistsEngineersTechniciansDraftsmenSoil Surveyors or soil survey assistantsSoil Laboratory techniciansAssistant GeologistSoil Conservationist
17. Administrative Personnel
1 Administrative Assistant1 Accountant Clerk2 Labour Supervisors1 Stock Keeper1 Typist Secretary

18. Service Personnel
14 Gauge Observers15 Drivers and boat operators1 FitterLabour for Survey Teams,building temporary roads, sheds.
19. Equipment and Supplies
Construction of river gauging stations
2 sets loose contact prints anda' set photo mosaics for the area forwhich aerial photography is already available - 1:20,000 scale for theaerial marvey by Huntings and 1:50,000 for the area in the part of theAwash basin bordering the Blue Nile.
Miscellaneous materials: small tools, local supplies and stationery.
20. Services
Offices, rooms for field laboratory, storage space for equipment andmaterials, laboratory facilities for soil and water analysis at asuitable location(s).
Field accomodation for Ethiopian personnel and labour.
(ii ) Operation and 1.:aintenance of vehicles and boats (including insurance)and equipment.
Transportation, within Ethiopian territory, of Ethiopian personnel.
Transportation, insurance, handling and storage of project equipmentand materials within Ethiopian territory.
21. Government Counterpart Participation
(i) The above-mentioned Government counterpart participation in the projectshall be in cash in the amount of the equivalent of US$ 327,000 and shallbe deposited by the Government in the United Nations Special FundAccount (Account Number U-35) at the State Bank of Ethiopia and will bemade available as follows:
- 121-
Equivalent of US$ 118,000 on signature of the Plan of Operation
(ii) The Government, when they furnish a contribution in kind, whenever
feasible, concerning the abovementioned personnel, equipment, supplies
and services, shall be refunded in cash from the abovementioned account.
it 11 107,000 on or before 1 January 1962" " 102,000 on or before 1 January 1963

122
22. Government contribution towards local facilities (in cash)
(0 In accordance with Article V, paragraph 1 (a to d), of the Agreementbetween the Special Fund and the Government, the Government willcontribute the equivalent of US3 82,650 towards local facilities.
This amount represents 15: of the total cost to the Executing Agency offoreign personnel, including subcontractor's personnel.
The amount mentioned above shall be deposited by the Government into theUnited Nations Special Fund account U-35 at the State Bank of Ethiopia,
and will be made available as follows:
Equivalent of US,-; 28,200 on signature of Plan of Operation
32,750 on or before 1 January 1962tt " 21,700 on or before 1 January 1963
Total USs 82,650
The above payments shall be made on or before the dates specified aboveas a prerequisite to operations. Payments made by the Government inEthiopian dollars shall be mate at the most favourable legal rate ofexchange.
C. Organization
Overall responsibility for the organization and execution of the project restswith the Executing Ageney who shall plan and direct operations.
The Government Agency responsible for Government participation in the projectshall be the Awash Valley Authority, who shall also ensure coordination of the workof the various Government organisations participating in the project.
The Executing Agency shall appoint a Project Manager acceptable to theGovernment. Under the general supervision of the Executing Agency, the ProjectManager shall be responsible for the detailed planning, administration and executionof the project, as well as for the supervision of the work of the subcontractor(s).
The Government shall appoint a CoManager acceptable to the Executing Agency,who will cooperate with the Project Manager in the execution of the project. He willbe responsible for setting up preliminary arrangements agreed for the project and forthe administration matters related to the project personnel furnished by the Governmentfor the execution of the project. He shall be fully informed of all matters relatingto the execution of the project.
The project shall be entrusted by the Executing Agency to subcontractor(s).However, the responsibility for the execution of all parts of the project will restwith the Executing Agency.
Under the supervision of and in close cooperation with the Executing Agency,th, subcontractor(s) shall prepare detailed work plans, carry out surveys, establishand operate river gauging and meteorological stations, prepare reports, maps andcharts. The project report shall be submitted to the Special Fund and the Governmentby the Executing Agency.
Headquarters for the project shall be at Addis Abeba.
- 123 -
D. Sequence of Operations
The Executing Agency shall commence operation of the Project upon writtenauthorization to do so from the Managing Director of the United Nations Special Fund.
Immediately after signature of the Plan of Operation by the Government, theExecuting Agency and the Special Fund, the Executing Agency shall apoint the ProjectManager and shall enter into negotiations with sub-contractor(s) for participation inthe project. Upon conclusion of these negotiations, the Executing Agency shall signa contract with the sub-contractor(s), Prior to the signature of the contract, theExecuting Agency shall send the draft text of the contract to the Government forinformation.
At the same time, the Government shall appoint the Co-Manager.
Upon arrival of the Project i,..anager the Government shull suply him with twocomplete setS of loose contact prints and one set of mosaics mentioned in paragraph19 (ii).
A general plan of survey operations shall be drawn up by the sub-contractor(s)under supervision of and in cooperation with the Project Manager and in consultationwith tne Co-Manager not later than six weeks from the signing of the contract with thesub-contractor(s). For this purpose the Project Mana-ger, the team members concerned,and the Co-Manager, should undertake reconnaissance flights over the river basin.Areas suited for development shall then be selected by tne project team for moredetailed investigations. In this plan staffing, equipment, transport, labour require-ments of the various groups (hydrography, irrigation, engineering, topography, soils,geology and agronomy) shall be given in sufficient detail to ensure timely supply ofmaterials, equipment, transport and lodging.
3). ' The subcontractor(s) shall prepare at the earliest possible date a detailedlist of equipment, materials, etc. required for the project. The list of foreignequipment and material shall be sent to the Headquarters of the Executing AEency forreview and approval. Orders for the above eq,ipment shall be placed by the sub-contractor(s) or the Executing Agency as agreed upon between them and set out in thecontract.
The various parts of the survey have to be carried out in a coordinated way.The hydrological survey should start immediately upon arrival of the subcontractorteam in order to obtain a sufficiently long period of observations. The river gaugingstations should be established during thearst 4 months of the project. Gaugeobservations and flow measurements should be continued until the end of the project.Watershed management planning should be done in the third year of the project whensufficient hydrological data are available.
Soil survey should start at ihe beginning of the first year and should becompleted in a two-year period. This will make it possible to assess the extent anddistribution of irrigable land and facilitate the working out of a water managementpian as far as irrigation water is concerned.
Power damsite and reservoir studies should start in the second Year whensufficient preliminary information on water discharges on the various sections of the
main river and its tributaries will become available.
Erosion studies in the headwaters should be Garried out during the first two
years.
A
Land use studies should start at the second part of the first year and belinked with the soil survey and the water plannin. They should be carried throughin the second and third year.
The local authorities shall be kept informed in time through Government aboutthe movement of the teams and their requirements in accommodation, guides, localtransport and materials.
. BUDGET
In accordance with Article 1, para 3 of the Agreement between the UnitedNations Special Fund and the Government of Ethiopia, the total sum .to be made availa-ble by the Special Fund through the Executing Agency to assist in the execution ofthis project in U63 844,700.
In addition to the above, the United Nations Special Fund shall make availablean amount of US$ 85,400 to the Executing Agency to defray the Agency ccsts. Thisincludes USS 6,000 for preliminary investigations.
The total cost of the project to be borne by the Government is estimated at(equivalent of) USS 327,000 as being the counterpart contribution and the equivalentof US,:: 82,650 as a cash contribution towards local operating costs of the project asmentioned in Appendix II. These amounts are to be deposited in the United NationsSpecial Fund account in the State Bank of Ethiopia in accordance with paragraphs 21 (i)and 22 (iii).
Unless otherwise agreed at any time by the Government, the Executing Agencyand tne United Nations Special Fund, these sums shall be disbursed under the mainobjects of expenditure in amounts and at times as scheduled in the Budget and Plan ofExpenditure. The Budget and Plan of Expenditure are set out in Annex I and IIattached.
All funds drawn on the accounts referred to in Articles 12, 21 and 22 hereofshall be by joint authorization of the two co-managers.
IV. REL"ORTS
Progress Reports
The Executing Agency will submit to the Managing Director of the UnitedNations Special Fund and to the Government the following reports on the project:
(i) an inception Report to be supplied three months from the date of receiptof authorization froM the Managing Director to commence operations.
) an end-of-year Report to reach the Managing Director by not later than1 March eaca year covering the period from 1 July to 31 December of theprevious calendar year;
A mid-year Report to reach the Managing Director by 1 September each yearcovering the work up to 30 June of that year.
Reports will include achievements of the period under review as well asthe work plan for the next 6 months period.

52. Thehanded overutilization
The Executing Agency will submit to the Managing Director of the United NationsSpecial Fund and to the Government, after conclusion of the project, a Final Report.
Financial Reports
The Executing Agency will submit financial reports to the Managing Director ina manner and at times to be agreed upon between the Managing Director and the ExecutingAgency.
The Government shall submit to the Executing Agency and the Executing Agencyshall submit to the Government financial statements in a manner and at times to beagreed upon between the Executing Agency and the Government.
Audit Reports
The Executing Agency shall submit to the Managing Director audited annualstatements of accounts. Accounts for a completed project will be submitted, as soonas practicable after the completion of a project, together with the External Auditor'sReport Thereon.
V. CONCLUSIONS
Two months before completion of the project, a report will be submitted by theGovernment through the Executing Agency to the United Nations Special Fund on thebenefits derived from the project and the activities planned by the Government tofurther the purpose of the project.
Imperial EthiopianGovernment
Yilma Deressa,Minister of Pinance
- 125-
48. Final Report
United NationsSpecial Fund
Paul G. HoffmanManaging Director
technical material obtained during the course of the project will beby the Executing Agency to the Government of Ethiopia for appropriateas agreed with the United Nations Special Fund.
Food and AgricultureOrganization of theUnited Nations
Robert WatsonCountry Representative
Agreed on behalf of the parties, by the Undersigned:
Date February 7 1961 Data February 7 1961 date February 7 1961
by Signature by Signature by Signature

- 126-
Explanatory Note to Amendment No. 1
PLAN OF OPERATION
UNIFED NATIONS S:ECIAL FUND PROJECT IN ETHIOPIA
SURVEY OP' nio AWASH RIVER BASIN
The exDerience gained in the past six months of project oper:.:.tion hasindicated that the working conditions necessitate adjustment in the existing budgetallocation, as well as allotment of additional funds both by the Special Fund and theGovernment to meet the technical requirements for successful implementation of theproject in accordance with the established objectives in the Plan of Operation.
Details for the additional funds required are as follows:
The difficult access to the Survey area and particularly to the rivergaiging stations. This difficulty necessitates a larger number ofvehicles against the number originally requested and a larger quantityof spare parts dae to heavier wear on the vehicles.
The increase in the number of river gauging stations required for technicalreasons.
The extremely high construction cost of these stations; and
The need for exploratory drilling at some of the potential damsites.
.Tne Government nas agreed to increase their contribution by the equivalentof US3 50,000 and adjust their budgetary allocation as follows:
Survey Personnel reduced by US3 7,000Equipment increased by US$ 53,000Service increased by US3 4,000
The Government considers that the reduction in man-month services of technicalpersonnel is possible due to the shorter period of field work in soil science and lessemployment time of engineers, and also the actual wages-paid to the local employees areless than originally budgeted.
As regards equipment and services the Government has agreed to increase theirshare of contributions by US3 57,000 towards the additional requirement of funds fort.he additional work mentioned above.
The Government agreed to award the above mentioned additional funds subjectto the Special Fund's approval to an additional allocation of funds of US3 90,000towards the following items:
Hydrometric and other technical equipmentTransport vehiclesSpares for vehiclesTest drilling equipm::nt or drilling contract
US 18,00016,00024,00012,000
US3 90,000

127
Necessary modifications in the Flan of Operation, including the Plans ofExpenditure, are made as per tne attached Amendment No. 1 to be signed by the threeparties concerned. The Plan of Expenditure in Amendment No. I supersede the revisedPlan of Expenditure for tne Special Fund Allocution signed by the E,Xecuting Agancy,the Special Yund and the Government on 26 February, 12 Karch and 13 ;_arch 1962,respectively, and the Flan of Expenditure for the Government Counterpurt Contributionattacned to the original Plan of Operation. Various items of expenditure included inthe Government's Counterpart Contribution have been reclassified in connexion with theamendment of the Plan of Operation.
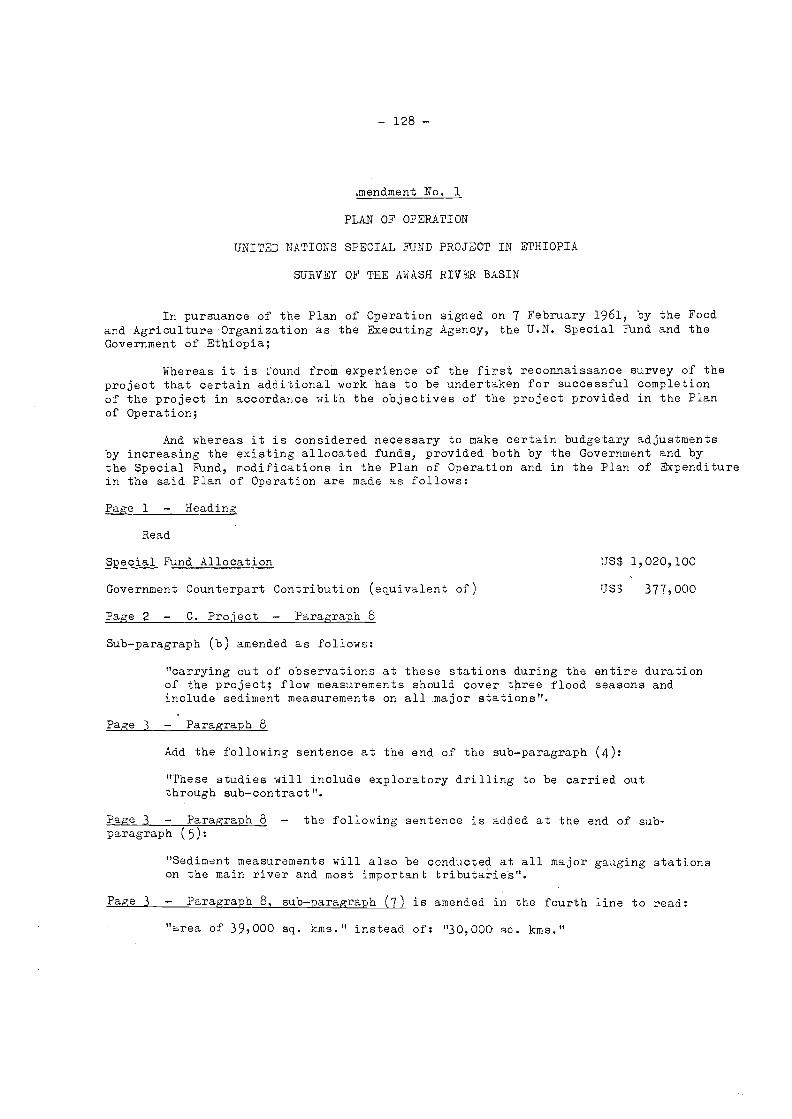
- 128-
aendment No. 1
PLAN OF OPERATION
UNITED NATIONS SPECIAL FUND PROJECT IN ETHIOPIA
SURVEY OF THE AWASH RIVER BASIN
In pursuance of the Plan of Operation signed on 7 February 1961, by the Foodard Agriculture.Organization as the Executing Agency, the U.N. Special 17und and theGovernment of Ethiopia;
Whereas it is L'ound from experience of the first reconnaissance survey of theproject that certain additional work has to be undertaken for successful completionof the project in accordance with the objectives of the project provided in the Planof Operation;
And whereas it is considered necessary to make certain budgetary adjustmentsby increasing the existing allocated funds, provided both by the Government and bythe Special Fund, modifications in the Plan of Operation and in the Plan of Expenditurein the said Plan of Operation are made as follows:
Page 1 - Heading
Read
Special Fund Allocation
Government Counterpart Contribution (equivalent of)
Page 2 - C. Project - Paragraph 8
Sub-paragraph (b) amended as follows:
US$ 1,020,100
USS 377,000
"carrying out of observations at these stations during the entire durationof the project; flow measurements should cover three flood seasons andinclude sediment measurements on all major stations".
Page 3 Paragraph 8
Add the following sentence at the end of the sub-paragraph (4):
"These studies will include exploratory drilling to be carried outthrough sub-contract".
Page 3 Paragraph 8 - the following sentence is added at the end of sub-paragraph (5):
"Sediment measurements will also be conducted at all major gauging stationson the main river and most important tributanieS".
Page 3 Paragraph 8, sub-paragraph (7) is amended in the fourth line to read:
"area of 39,000 sq. kms." instead of: "30,000 sa. kms."

- 129-
Page 4 - Paragraph 10 - Aerial Photography is amended as follows:
"Aerial photography of about 39000 sq. kms. on 1:40,000 scale".
"Contour haas of potential reservoirs 800-1000 sq. kms. 1:10,000 or 1:20,000scale (scale to be decided at a later stage)".
Page 4 - Add a new paragraph 10(a) as follows:
10(a) Exploratory Drilling
"Exploratory drilling at two damsites (contract)".
Page 4 - Paragraph 11 - Equipment and Supplies, is amended as follows:
Hydrometric equipment;Topographic equipment;Field and laboratory equipment for soil survey;20 transport vehicles (4 wheel drive) and spare parts including winches;Supply or hire of aircraft;Preparation and printing of reports and maps.
Pago 4 - Paragraph 13 - Subcontracts add the following in the second sentence(second line) after photography
"and the expioratory drilling".
Page 5 - Paragraph 16 read 350 instead of 408, against "Total man-months".
Page 5 - Paragraph 18 - Service Personnel, is amended as follows:
14 Gauge observers20 Drivers1 FitterLabour for survey teams, building of temporary roads, sheds.
Page 5 - Paragraph 19 - Equipment and Supplies is amended as follows:
(0 Construction of 20 automatic river gauging stations and 6 plain gaugingstations including cableways and shelters;
construction of meteorological stations;
2 sets loose contact prints and 1 set photo mosaics for the area forwhich aerial photography is already available - 1:40,000 scale for theaerial survey by Huntings and 1:50,000 for the area in the part of theAwash lOasin bordering the Blue Nile;
Miscellaneous materials: small tools, local supplies and stationery;
Hire of bulldozers, graders, oil, lubricants for these machines andcontingencies.
Page 6 - Paragraph 20 - Services. Add the following as an additional item
"(vi) Hire of insurable aircraft for reconnaissance flights".

Page 6 - Paragraph 21 (i) in the third line read:
"US',; 377,000" instead of: "US 327,000".
and
at the end of sub-paragraph 21 (i) add:
"Equivalent of 50,000 on or before 1st January
Page 9 - Section ILI - Budget
Paragraph 42 In the fourth line road:
"US$ 934,700" instead of: "US3 844,700".
Paragraph 44 In'the second line read:
"US3 377,000" instead of: "US3 327,000".
Aprendices
Appendices I, II and III are amended to reflect the chances as indicated aboveand are attached.
This agreement amending the original Plan of Operation seen and agreed:
For the Imperial Ethiopian Government For the United Nations Special Fund
Mulatu Debebe Edgar Marland
- 130 -.
Assistant MinisterAwash Valley Authority
Assistant TAB Resident Representativeand Assistant Director of Special FundProgrammes in Ethiopia
Date; 12 September 1962 Date: 12 September 1962
For the Food and Agriculture Organizationof the United Nations
Oris V. Wells
Assistant Director-General(Program and Budget)
Date: 3 September 1962

UNITED NATIONS SPECIAL FUND PROJECT
EITIOPIA: SURVEY 0? THE AWASH RIVER BASIN
Revised Plan of Ekpenditure
United Nations Special FUnd Allocation
Period TotalMan- ProjectMos. Costs 1961
Estimated Cash Disbursement
1962 1963 1964
APPENDIX I
1. Personal Services
3 $ $ 3
(i) Water Development PlanningEngineer (P.M.) 36 70,200 10,800 20,950 22,000 16,450
(ii) Administrative Officer 36 38,200 1,700 13,810 12,690 10,000(iii) Consultants 4 8,000 6,000 2,000
76 116,400 12,500 40,760 36,690 26,450
2. Equipment and Supplies
20 Transport vehicles includingBpare parts and winches 85,000)
Bydrometric equipmentField and laboratory equipmend 104,000)
23,300. 185,700 5,000 10,000Ripply or hire of aircraft 15,000)Irinting of reports and maps 20,000)
224,000 23,300 185,700 5,000 10,000
3. Sub-Contracts
Personal Services 437,000 39,700 180,000 147,300 70,000Aerial photography and contour mapping 97,600 10,000 87,600Exploratory Drilling 32,000 32,000
566,600 49,700 299,600 147,300 70,000
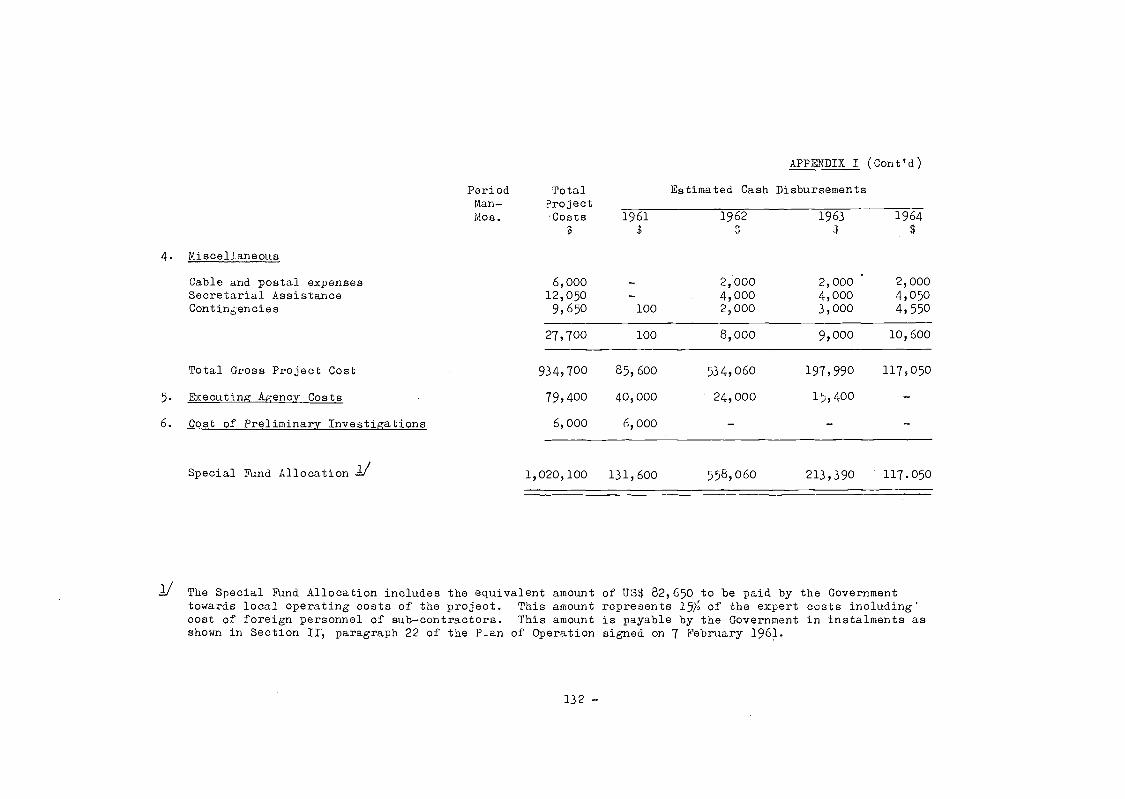
132 -
The Special Fund Allocation includes the equivalent amount of US$ 82,650 to be paid by the Governmenttowards local operating costs of the project. This amount represents 15- of the expert costs including'cost of foreign personnel of sub-contractors. This amount is payable by the Government in instalments asshown in Section II, paragraph 22 of the Plan of Operation signed on 7 February 1961.
4.
5.
6.
Miscellaneous
PeriodMan-Mos.
TotalProject.Costs
.Lo
6,00012,0509,650
Estimated Cash
APPENDIX I (Cont'd)
Disbursements
19613
--100
1962
2,0004,0002,000
19633
2,0004,0003,000
'
1964
2,0004,0504,550
Cable and postal expensesSecretarial AssistanceContin6encies
Total Gross Project Cost
Executing Agency Costs
27,700 100 8,000 9,000 10,600
934,700
79,400
6,000
85,600
40,000
6,000
534,060
' 24,000
_
197,990
15,400
117,050
Cost of Preliminary Investigations
Special Fund Allocation 1/ 1,020,100 131,600 558,060 213,390 117.050
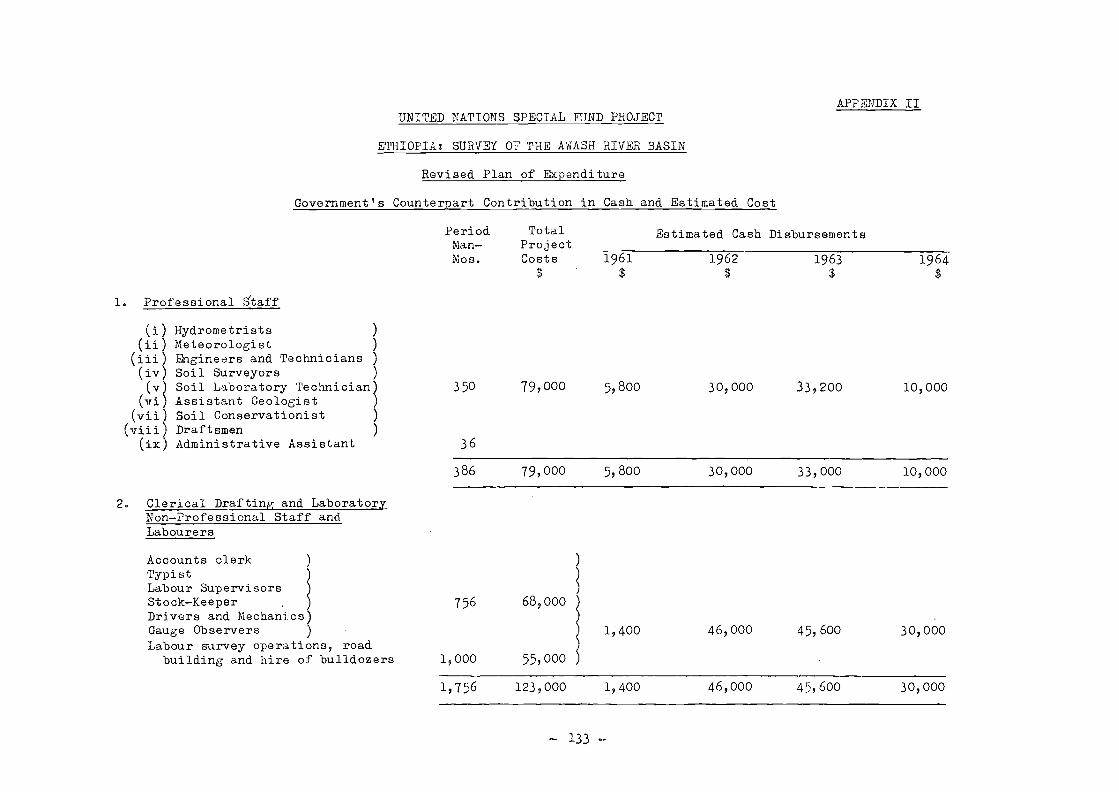
133
APPENDIX IIUNITED NATIONS SPECIAL FJND PROJECT
ETHIOPIA: SURVEY 07 THE AWASH RIVER BASIN
Revised Plan of &penditure
Government's Counterpart Contribution in Cash and Estimated Cost
1. Professional Staff
PeriodMan-Nos.
350
36
TotalProjectCosts
$
79,000
Estimated Cash Disbursements
1961
5,800
1962
30,000
1963
33,200
1964
10,000
(i) Hydrometrists )
ii) Meteorologist )
(iil Engineers and Technicians )
(iv Soil Surveyors )
(v) Soil Laboratory Technician)(vi) Assistant GeoloEist )
(vii) Soil Conservationist )
(viii) Draftsmen )
(ix) Administrative Assistant
386 79,000 5,800 30,000 33,000 10,000
2. Clerical Drafting and LaboratoryNon-Professional Staff andLabourers
Accounts clerkTypistLabour SupervisorsStock-Keeper 756 68,000Drivers and Mechanics)Gauge Observers ) 1,400 46,000 45,600 30,000Labour survey operations, road
building and hire of bulldozers 1,000 55,000
1,756 123,000 1,400 46,000 45,600 30,000

Equipment and Supplies
scellaneous tools equipment, etc.Meteorological equipmentOperation and Maintenance of vehicles
Sub-Contractors
Construction of gaugesHire of aircraftAerial photography
Miscellaneous
Offices, laboratory facilities, store roomsField accommodationTranspolqation and storage of equipment
17,0013,00054,000) 5,500
-134
30,000
APPENDIX II (Cont'd)
Period Total Estimated Cash DisbursementsMan- CostMos. 1961 1962 1963 1964
3
26,500 12,000
21,000 10,500 6,000 4,500
Total estimated cost of counterpartcontribution in cash expressed inJIS dollar equivalent 377,000 22,700 176,500 118,300 59,500
74,000 5,500 30,000 26,500 12,000
55,00020,000.10,000 60,000 7,000 3,0005,000
80,000 10,000 60,000 7,000 3,000
5,000 2,000 2,000 1,0006,000 2,500 2,000 1,50010,000 6,000 2,000 2,000

- 135 -
APPENDIX IIIUNITED NATIONS SPECIAL FUND PROJCT
ETHIOPIA: SURVEY OF THE AWASH RIVRa BASIN
Total Government Contribution
These amounts have been calaulated at the prevailing United Nations operating rate of exchange ofone US dollar = 2.484 Ethiopian Dollars
21 These amounts are Payable in local currency at the United Nations operating rate of exchange (which isbased on the most favourable legal exchange available to the Special FUnd), which at the present timeis one US dollar = 2.484 Ethiopian Dollars.
Total Equivalent in US3
1961 1962 1963 1964
Counterpart contribution in cash 1/(Appendix II) 377,000 118,000 107,000 102,000 50,000
Payment in cash for local operating-)osts 2/ (Appendix I - see footnote) 82,650 28,200 32,750 21,700
459,650 146,200 139,750 123,700 50,000
136
APPENDIX II
TOPOGRAPHY AND NAPPING
General Maps
Stretching from the 8th to the 12th degree of north latitude and between the38th and 42nd degree of eastern longitude, the Awash rZiver Basin occupies the easternpart of central Ethiopia. In spite of its strategic situation and relativeaccessibility, the region was little explored until recent years, and no detailedmaps and topographical information other than those covering the whole country, wereavailable to the Project, when it began its work.
The basic maps belong to the series of world aeronautic charts drafted follow-ing the world aerial survey of 1944, edited by the Aeronautical Chart Service at thescale of 1:1,000,000 and subsequently revised. The 1954 edition was used for Projectpurposes, as well as the enlargement of this on a scale of 1:500,000, published bythe British War Office in 1947.
The contour lines are drawn at intervals of 1,000 feet on the basis ofbarometric measurements nade at several control points. The accuracy of these maps
is relative.
More recent and more accurate 1:500,000 scale maps compiled by the USAF in1954 and which exist only in draft form, were also used by the Project.
The Upper reacnes of the Awash basin were air-surveyed for the purpose ofthe Blue Nile River Basin Survey in 1956 at the theoretical scale of 1:50,000.Contact prints of the relevant photographs were made available by the Government.The Middle Valley and the Lower Plain were covered by aerial photographs at a scaleof 1:40,000, made by Messrs. Hunting Surveys Ltd., under a contract with the Project.Air photographs at the scale of 1:20,000 for limited areas were available from theImperial Highways Authority.
No general triangulation data were available during the Project's fieldoperation, as the Jevelling data from the Geodesic survey of the Blue Nile River Basinwere published only in 1964.
Thus aerial photographs contact prints and uncontrolled mosaics served as abaeis for the work of the Project in topography, engineering, and land survey.
Topographical Work
Topographical work for the Project was undertaken with the object of facilitat-ing the carrying out of surveys in other fields namely, agrology, pedology, hydrology,dam studies and irrigation works. No overall topographicalsurvey was mad'e, but merelyspecific surveys for particular needs.
For lack of reference points, particularly as regards altitudes, many of thesesurveys could neither be collated from the standpoint of altimetry, nor controlledin planimetry. The work done included mapping, surveying, photogrammetry and levell-ing.

137
Mapping
Since there were no recent maps on scales suitable for the Project it wasnecessary to compile maps with the help of aerial photographs. These were made onthe following scales:
1:2 0 000 This planimetric map covered the entire Awash watershed70,000 km2) and showed its natural boundaries.
The distance covered being 450 km, from north to south, thedistortion of distances was significant. The map was compiled byinterpretation of aerial photographs, using east of the 40th meridiana cover made specially for the Project, and west of the 40th meridianthe mosaics of the Imperial Highways Authority (in preference to thoseof the Water Resources Department which did not fit into the geodeticgrid).
Two areas in the western and northwestern part of the Basin notcovered by these mosaics, were corrected by means of a template, withthe help of the Institute of Mapping and Geography.
This compilation, although somewhat heterogeneous and not completelycontrolled (it involved some distortion in the reading of distances andareas) was used as a basis for studies of land use, erosion and hydrology.
This map, reduced to a scale of 1:1,000,000 was used for the finalreport.
1:100,000 These planimetric maps were obtained by reducing the basemaps obtained directly from mosaics on the following scales:
1:42,000 for the Lower Plains1:41,000 for the Middle Valley
They coVered about 12,000 km2 in each of these two regions. Forinclusion in the report they were reduced to a scale of 1:250,000.
1:50,000 Three planimetric maps on this scale covered areas of whichmore detailed studies were nado, namely:
Dubti (200 km2)
Dit Bahri (500 km2)
The first of these was corrected by means of a template.
These maps were included in various notes and interim reportsdistributed during the execution of the Project.
Special Surveys
Regular surveys were made of the sites of the major dams at Kesem and Tendaho,
on a scale of 1:1,000 and for the Kebena at 1:2,000. The subcontractors usingphotogrammetry plotted out topography of the reservoir basinsof these dams.
138
The corresponding maps were drawn on the scale of 1:20,000; the total areathus covered carne to approximately 200 km2.
Land Levelling and Miscellaneous Work
For the preliminary layouts of irrigation canals from the sites of thefuture water diversion works, and to define areas which they wouldcommand, level.surveys were made in the following area of the MiddleValley:
Melka Sedi Amibara Angelele, KesemKebema, Bolhano, Maro Gala.Previously a croissection levelled in the plain of Aleydegi had shownthat gravity irrigation frOm the Awash was practically impossible. Thelevelling totalled about 150 km.
Other levelling operutions were carried out between the lakes of Ziwayand Geiilea, and more detailed operations between the Meki river, anaffluent to Lake Ziway, and the Dubeta river, an affluent of the Awash.
The purpose of t-us work was to determine the feasibility ofdiversion of the Meki river into Lake Gelilea.
Preliminary topographical reconnaissance gave a rough idea of where adam could be sited in the gorge near Awash Station, to form a compensationreservoir, for regulation of the plows released from the hydroelectricplant at Koka Dam.
Similarly the bed of the upper Dorkena, downstream of the marshes, wassurveyed quickly to determine the feasibility of draining the marshesby lowering the rocky sill.
At the request of the Ethiopian Government a track 165 km long was laidout between Awashist and Gewani.
It should be pointed out, that the spelling of geographical names in thisreport and on the appended maps may sometimes differ from the spelling currently usedin Ethiopia. The Imperial Ethiopian Mapping and Geography Institute provided, at therequest of the Project, a nearly complete list of geographical names with the newlyintroduced spelling.

Introduction
A survey of the resources of the Awash River Basin has been carried out overthe past three years by the United Nations Special Fund with the Food and ricultureOrganization as Executing Agent. The French Firm of SOGREAH (Sociét6 Grenobloised'Etudes d'Applications Hydrauliques) in contract with FAO provided the personnelfor the study in conjunction with technicians and counterpart trainees from theImperial GoVernment of Ethiopia. The survey covered aerial photography, topography,soil classification and analysis, present land use, river hydrology, meteorology,dam sites, water storage facilities and irrigation engineering.
The survey indicated that the Awash River Basin had definite developmentpotentialities and UNSF/FAO decided that a preliminary economic feasibility studywas desirable. Two Consultants, Dr. L.G. Allbaugh, Economic Production Economist,and Mr. R.M. Arbuckle, Agronomist, were appointed in September 1964 to undertakethis study and to present their findings to the Special Fund in January 1965. Theexperts proceeded to Ethiopia and in collaboration with Mr. M. Reklewski, ProjectManager of the Awash River Basin Survey, assembled the available economic andagronomic data to enable them to produce the following Report. Terms ofreference of the above experts are appended.
Appreciation is recorded by the Experts of the valuable and kind assistancerendered by Ministers and Officers of the Imperial Government of Ethiopia and by thefarmers and other pioneers throughout the Awash Valley.
Summary
Preliminary estimates for the Total Awash Project of 150,000 hectaresindicate that the annual net gains are almost double the annual costs, with abenefit-cost ratio of 1.95 to 1.00 at 6 per cent interest for the irrigation phaseof the project. In addition, the power phase will produce 115 million kwhr forone-fourth to one-third of its cost if obtained from the best alternative source,at an annual saving of about E.$ 8 million. The flood control phase will alsoincrease net incomes by an estimated average of E.S. 100,000 annually.
The irrigated cultivated land in the project area will be increased 14 times;the annual gross product value 27 times; and the annual net gains 50 times. Theirrigable area will be more than double the maximum irrigable area of 63,000hectares without dams. After completion, the project is expected to produceE.$ 181 million gross value agricultural Troducts annually, with an annual netgain over present production of E.$6.7 million. The importance of these figuresis significant when compared with a national budget of E.S. 306 million, totalexports of E.S. 220 million and total imports of E.$. 276 million in 1963. Theseincome figures are also significant when compared with the Total Estimated InitialInvestments of E.S. 250.6 million for dams, irrogation works and roads, and theTotal Associated Costs (Investments) of E.S. 179.7 million of farmers, making aG.and Total Investemt of E.S. 430.3 million. However, the project is expected toprovide employment to 25-30,000 persons and farms for 10-15,000 farm families.
Secondary benefits were not computed but there will be important additionsto the regional and national economy through increased income to thousands ofworkers and farmers, either presently under-employed or with meagre incomes.
- 139-
APPENDIX III
FEASIBILITY REPORT ON DEVELOPMENT OF IRRIGATED AGRICULTUREAND HYDROELECTRIC POWER IN THE AWASH RIVER BASIN, ETHIOPIA
By L.G. Allbauch and R.M. Arbuckle

- 740
In this type of development programme, the concomitant servicing (private and govern-mental), transportation and processing industries must develop, and'will provide afurther impetus to the economy of the area and the nation.'
While the Awash Basin Survey data and these evaluations are entirely prelimi-nary and further detailed soil and pre-investment studies are necessary, it is be-lieved that the findings of this report provide a reasonably accurate assessment ofthe possibilities in developing the agricultural economy of this important region ofEthiopia. On the basis of actual costs of irrigation systems already constructed,the investment estimates are liberal. On the other hand, conservative estimates ofcrop yields and prices have been used. Total production has been kept within esti-mated market demands. A brief summary of the general economy of the country will helpin understanding the findings of this report.
Ethiopia has 22 million people with an average annual per capita income ofabout E.S. 95 (USS 38). This low income is reflected in their housing, clothing andeducation, but not in nutrition. Of this population, 90 per cent are engaged inagriculture, generally at a subsistence level. They cultivate only 8 per cent of the120 million hectare total land area. Agriculture produces three-fours of the GrossNational Product and 90 per cent of the foreign currency trade. Coffee, oilseeds,pulses and livestock products are the major exports. The largest area of cultivatedland is devoted to cereals and pulses, mainly grown on the rain-fed mountain plateaus.
Although there is d. trend towards industrialization, agricultural products must
provide most of the raw materials for industry, as well as the foreign exchange requiredto purchase the necessary machinery and equipment. But most of the public creditsobtained by the Imperial Ethiopian Government recently have been devoted to improvementof the infrastructure, highways and telecommunications, with only 23 per cent for theaugmentation of production directly. This is resulting in a serious debt servicingproblem which will require either increased exports, decreased imports or both.
Within a decade the development of 6,600 hectares of land along the AwashRiver has made the country self-sufficient in sugar and reduced the foreign currencydrain by E.S. 6 million annually. There are other commodities to which this patternof development might be applied, i.e. cotton to replace a large share of the E.S. 40million annual imports of cotton textiles. Likewise, sisal and kenaf can be grown toreplace the E.S. 2 million of gunnybags imported annually. Similar products includefresh and canned fruits and vegetables, butter, cheese, soap and other oil-basedproducts.
On the basic of these facts and with the knowledge that selected areas inthe Awash Valley have suitable climates, soils and water for growing a wide varietyof crops under irrigation, the agronomist developed crop plans which would yield thehighest net returns to the farmer and add most to the national economy by reducing foodand fibre imports and/or increasing exports to earn additional foreign exchange. Thisis in sharp contrast to the millions of acres of Awash Valley grazing land, thinlypopulated by nomadic tribes who are dependent on seasonal rains to provide water andpasture for their cattle, sheep, goats and camels. However, some agricultural develop-ment totalling 10,500 hectares has already started in the project area under Govern-ment auspices and by private emterprise.
The Imperial Government of Ethiopia favours development of irrigated lands bylare scale mechanized farming enterprises, particularly by concessionaries who investcapital and provide technical knowledge, experience and clnageuent skills to producecrops for industry and export. For rapid development of virgin lands such enterpriseswill produce most income. From a social point of view it seems desirable to have aproportion of the available land allotted to small farmers already trained in irri-gation practices on the large holdings, backed by an effective extension service tosupervise the use of credits and to provide technical assistance.

141
Such a policy would allow the indigenous population'to play an important role in tnedevelopment of their own lands and resources, and to contribute significantly in thegrowing national economy.
From an economic point of view, the Awash River Basin is strategicallysituated, having its axis running from the capital towards the Red Sea. A road, nowprojected on the right bank of the river, connecting Nazareth with Tendaho, wouldprovide marketing outlets for agricultural produce or manufactured goods, either tothe capital, Adis Abeba, or to the port of Assab.
Before current haphazard agricultural development becomes too far advanced,it is desirable to set up a master development plan, based on the findings of theUNSF/FAO'Survey of the Awash River Valley and on further investigations. For thispurpose the Awash River Valley Authority ought to be strengthened, both financiallyand technically, so that this autonomous body will be in a position to carry out itstask of administering and supervising the development of natural resources under itsjurisdiction. Expertise is necessary to devise and levy water rates, to establisha competent technical and operational service able to deal with the complex problemsof water apportionment and its controlled distribution; and to plan and supervisethe construction of an efficient and co-ordinated irrigation system as well as itsmaintenance and operation after completion.
For the full development of the Valley, fuller use of it water resourcesfor hydro power is important. With 88 per cent of the electric power in the nationproduced by public utilities and the remainder generated by thermal power units inindustrial plants for their own use, hydro power production is primarily a govern-mental function. At present 40 per cent of the 176 million kwhr produced inEthiopia is generated by the waters of the Awash. An this is less than one thirdof its hydro power possibilities. To date, all of this power is used in Adis Abebaand contiguous area, with nono available to the Middle and Lower Awash areas.Consequently, the production of 115 million kwhr from the power stations in thetwo proposed dams can assist greatly in the development of the region. About onefifth of this power would be utilized for irrigation pumping. The remainder canplay an important role in industry location and development and improved livinglevels of the people.
Since regional development involves a complex of problems, prioritiesand procedures must be determined, both in the region and in the larger govern-mental administratives areas. The urgency of the problems usually help in decidingupon the priorities, means and procedures for their solution. In Ethiopia there is
no urgent food shortage; no population pressure on the land; and no great social
pressure for land reform and land settlement schemes. The major problem is toselect long time economic development projects which will place greater emphasis ondirect production activities. Consequently, a "Crash Programme" of 5 to 10 years
seems out of place. This suggestion is further confirmed by the shortage of well-trained administrativo and technical personnel for the jobs required. Thus, a
longer time 10 to 25 year programme employing long time planning and carefulselection of projects on an economic basis would seem more applicable.
While the preliminary analysis of the Total Awash Project indicates that it
is economically sound, there are wide differences between selected project areas and
these must be carefully analyzed and compared. This study suggests that the Middle
Awash Project can make the largest economic contribution within the region to assist
with the national debt servicing problem and to develop agriculturally based
industry. While the Lower Awash Project might contribute to the national economytoa lesser degree, there are local social and political problems which require
solution and might justify its being carried out concurrently with the more favour-
able economic projects of the Middle Awash.

- 142 -
A decision as to the relativo importance of projects which have largereconomic benefits when compared with projects having larger social benefits requirescareful consideration by the Government at high levels. An there are other problemsrequiring major policy decisi.ons and, in some cases, legislation. Water rates orwater charges is such a problem in Ethiopia, requiring a solution at both the policyand legislative levels. After legislation is enacted the problem remains as to the bbasis of levying such water charges, whether by volume of water, by type of crop orby area. Other problems involve the determination of the total funds to be collected,the method of collection and the final use to be made of such funds.
An important policy involves the land use pattern in irrigated areas inorder to obtain the highest net gains for farmers and for the national economy withthe limited water resources available. Should water charges on the lower investmentcost areas be used to assist in the development of the higher cost areas.
Each of these and other problems require well-trained and dedicated ad-ministrativo and technical personnel - competent to analyze, plan, organize andimplement the programme to be carried out. The selection and training of suchpersonnel has top priority. Upon them rests the responsibility for the success ofeach project to be undertaken. But with competent responsibility these must begiven authority and the necessary funds, or the means to acquire them; funds withwhich to implement the programme. The Awash Valley Authority is limited in each ofthese areas. No capital funds have been provided to construct irrigation works,even small diversion dams. No source of revenue has been devised other than a verylimited category in the National Budget for river gauge readings and general ad-ministration, and a recent hastily-devised water use charge for certain users.
If the Awash Valley Authority is to function as the charter intended, thereis need for some high level consideration by the Board of Director or even theCouncil of Ministers, of the problems facing the organization. Unless these mattersare settled soon the "piecemeal" development of former years will continue and limitthe land and water to the choice areas only and for such crops as the farmer maychoose. This procedure is not apt to be in the best long run interests of thenation as a whole.
General Economy
Ethiopia has 120 million hectares of land area and 22 million people, 90per cent of whom are engaged in agriculture. Agriculture produces three fourthsof the Gross National Product and 90 per cent of the foreign currency trade. Yet,the National Budget allocates directly to the Ministry of Agriculture less than2 per cent of its total budget (see Appendix III, Table 1). Agriculture, ingeneral, is on a subsidence level. The per capita income per annum of E.$. 95(USS 38 1/ is the lowest of all countries for which country estimates have beenmade by the United States Department of Agriculture. Nevertheless because of itsclimate, reasonably fertile soils and predominance of rural population, nutritionand health conditions are by no means the lowest in the world.
1/ One US dollar 2.50 Ethiopian dollars.

- 143 -
Under the leadership of His Imperial Majesty, Haile Selassie, Ethiopia isdetermined to modernize its economy, through increased trade with the outside worldand by greater industrial development within the country. With mineral resourcesyet unexplored and undeveloped, Ethiopia must depend primarily upon the raw materialsof agriculture for its industries and for obtaining the necessary foreign exchangeto purchase machinery and equipment for industrialization. Gold ore production hasaveraged only E.$. 2.5 million during the past nine years. Recent discoveriesof potash near the Red Sea lend encouragement to another source of foreign exchange.
The trend towards industrialization is indicated by the increase in fixedassets of manufacturing. Since 1955 these assets have been doubled, mostly inthe larger enterprises of E.$. 5 million and over. Textile and electric powerproduction have tripled since 1955. Employment and gross value of manufacturedproducts have doubled since 1958. Annual capital expenditure in manufacturinghas tripled since 1958, half of this total being in the textile industry. Whilethe base for these rapid increases is rather small, they do reflect an early stagein industrial development, and the trends are indicative of confidence and willing-ness of local and foreign capitalists to invest in the future of tle country.
The low income per capita and its concomitant living levels are reflectedin housing, cloting and education, as revealed by recent census data for the capitalAdis Abeba. Of the 460,000 population, 33 per cent are listed as literate. Averagesize of a household is 3.5 persons with one to three as most common. Of the house-holds) 95 per cent have piped water supplies, while 10 per cent are dependent on astream or other source. Forty per cent of the households are without electricity.About 70 per cent of the living quarters are rented. Only 5 per cent of the houseshave stone wallsy metal or concrete roofs, and foundations, while 10 per cent haveChica (mud and wood) walls and thatched roofs but no foundations. The remaining
85 per cent are made of chica with metal roofs but almost equally divided as to
"with" or "without" foundations. In rural districts, illiteracy is greater, andstreams and ponds are the only source of water, in many cases at considerabledistance from the houses. Electricity is available only in the larger towns and
municipalities. Fel,i stone or brick houses are found outside the large towns andmost houses are made of chica with thatched roofs.
While statistics are not available, there is little or no evidence of serious
malnutrition. With a high proportion of the population engaged in agriculture,
food shortage is unlikely, The large expanse of fertile soils, under loose owner-ship and a favourable climate, makes food production a possibility for those willing
to expend a minimum of effort.
The clothing situation is reflected by a per capita consumption of cotton
annually of less than one kilogram, as compared with two to three kilograms in
many low-income countries and a world average of four to five kilograms. Yet, the
variable night and day temperature throughout Ethiopia, in the mountains and in the
deserts, warrants more clothing than the latitude might suggest. Lack of sufficient
clothing and shoes is evident in town and country. The lack of shoes is in sharp
contrast with the estimated 25 million head of cattle, more than one per capita of
the population, and with the export of hides and skins to the value of E.$. 15
million annually.
Of 120 million hectares of land, 40 per cent is in pasture, 25 per cent
forest and 25 per cent waste land according to rough estimates of the Ministry of
Agriculture. Less than 10 per cent of the total area is in crop land (9.4 million
hectares) of which two thirds is sown to cereals. Half of the cereal hectarage
is devoted to "teff" (Eragrostis abyssinica) the seed of which is used by Ethiopians
for the preparation of their staple unleavened bread or "enjera". Industrial crops
occupy 1.25 million hectares, one half being in oil seeds. Pulses and vegetable
144
crop's (ratio 2:1) make up another 1.06 million hectares. Coffee plantations cover43,000 hectares and produce the largest gross income of any crop. Coffee is themost important export, providing more than E.S. 100 million of foreign exchangeannually (see Appendix III, Table 2). In fact, Ethiopia might be characterized ashaving a "cereal-cattle-coffee" economy which provides food, wealth status and asource of foreign funds (see Appendix III, Table 3). With tremendous resources ofland and livestock, abundant wild life and a varied climate, hunger can only resultfrom lack of initiative.
Under the aegis of the Emperor, Ethiopia is awakening to the possibilitiesof modernizing its economy. Better contact between the various sections of thenation and with the outside world is under way through increased expenditures forroads, transport (air and highway) and telecommunications.
Until 1958, Ethiopia had a long history of exporting annually more goods thanwere imported. Except for 1952, the total export of goods and services exceededthe total imports, thus providing a very favourable balance of trade during thedecade 1948-57.
In the recent trend towards industrialization, the Imperial Government hasobtained public loans and credits totalling E.$. 314.4 million 11 of which 23 percent only were earmarked for projects which would increase production directly. Theremaining 77 per cent were concerned with indirect improvement, i.e. for infras-structure. Of the infrastructure allocation 98 per cent were for improving transportand communication facilities which should help directly in the production sectorsof the economy, especially in agriculture with its relatively low value, bulkyproducts. This is particularly true in a mountainous country like Ethiopia, withgreat distances between population centres, limited railroads and long tortuous roadsfrom the capital and the main agricultural production areas to the sea ports. Bothimport and export commodities, as well as internal trade have been burdened with hightransport charges.
In the short run, the wide gap in the ratio of loans for direct productionand infrastructure projects may limit certain types of product for export and con-sequently may hinder Ethiopia from meeting her short-run obligations. Although sucha gap is normal in an emerging economy, the need for developing and increasingproduction of all types of export commodities while redUcing imports of agriculturaland food products which can be produced economically within the country cannot beover-emphasized.
Since 1953, the nation's total burden of debt servicing has increased from1.8 per cent to 14.4 per cent of the gross receipts on current account in 1962. 1/To assist in meeting this debt servicing ability in a new industrializing nation,the agricultural sector requires greater intensification and diversification in itsover-all production and increased emphasis on the higher gross value crops.
To improve the debt service situation, such crops as can be produced econo-mically should be grown which will reduce the imports of similar raw products andprocessed goods manufactured from them, e.g. cotton and cotton textiles, fruits andvegetables, cereals, pulses, flour, butter, cheese, soap, tobacco, paper and cardboard.
1/ Ethiopian Economic Review, No. 8, April 1964.
- 145-
During the past five years these commodities required over E.S. 54 million in foreignexchange annually and no single group averaged less than E.S. 1.3 annually. Rawcotton and cotton goods have accounted for about E.S. 40 million of imports annuallysince 1949 (see Appendix III, Table 5). In that year these two items amounted toalmost one half of total imports but declined to 37 per cent for 1950-54, 23 per centfor 1955-61, and 15 per cent for the past two years. This decline in percentage hasresulted primarily from larger increases in imports, such as industrial and agri-cultural machines, vehicles, etc. but actual imports of cotton and cotton goods havefallen by only 20 per cent in the period referred to. Prior to 1958 sugar importsused up considerable foreign exchange but in the last two years, Ethiopia has beenable to export small surpluses of refined sugar.
Beside reducing imports, another means of solving the debt service problemis by increasing production of those crops, or their processed products, which willearn foreign exchange by their export on world markets. The proceeds can be usedto service the debt and/or to purchase machinery, processing equipment and otheritems in an industrialization programme. 'In addition, a proportion of this increasedproduction may be used internally to improve living levels which will provide incen-tive for all types of workers and producers.
To illustrate these economic possibilities, it is interesting to note thatprior to 1962, sugar was not produced in Ethiopia. By laying out the Wonjii SugarEstates on the Awash River and the formation of the "H.V.A. Ethiopia" company withits factories at Wonji and at Shoa, Some 60,000 tons of refined sugar are now pro-duced annually which satisfies the current internal demand and leaves a small surplusfor export. For the period 1948-54, sugar imports averaged E.S. 5,400,000 annually.
By 1963, a decade later, sugar imports had dwindled to E.$. 64,000 1/ and net exportsof sugar on world markets provided E.S. 3,800,000 of foreign exchange, but suchexports are liable to vary greatly because of violently fluctuating world sugar prices.
fnside the country, the per capita consumption of sugar has doubled in thepast ten years. Thus, the E.S. 9.2 million improvement in Ethiopia's sugar tradebalance has been made possible by an important change in land use; the utilizationof available resources - fertile land and plentiful labour; and the importation ofcapital, management and technical skills, each of which is increasingly obtainedfrom local sources.
Cotton is another crop which might repeat the sugar story in its effect onreducing foreign axchange drain. Due to mill requirements for varying types andgrades of raw cotton, and the time required for developing land and training farmers
to produce new crops, the period required for replacing cotton and cotton textile
imports will be longer. The natural resources of the Awash Valley can play an
important role in the cotton economy. Importation of management, technical skills
and capital have already started. (See Appendix IV).
Since 1960 cotton production from newly irrigated lands in the Awash River
Basin has increased from 400 metric tons of seed cotton from 560 hectares to 6,550metric tons from 7,100 hectares in 1963. The crop for 1964 is estimated at 8,800metric tons from 10,000 hectares. Preliminary production goals for 1967 are
reported as 30,000 metric tons of seed cotton from 28,000 hectares (see Appendix III,
Table 4). Even this production of 30,000 metric tons of seed cotton, equivalent to
approximately 10,000 metric tons raw (lint) cotton, would not meet the annual con-
Ethiopian Statistical Abstract, 1964, P. 77, Table 66.

- 146-
sumption requirements of 12,824 metric tons for the local textile mills. Their
estimated capacity in 1963 was 18,000 metric tons of raw cotton, or 180 per cent of
the production goals set for 1967 by current cotton producers. Attempts at large
scale commercial production on irrigated lands in other regions of Ethiopia such
as Eritrea, have not succeeded or expanded. The only other production of major
importance is an estimated 4,000 metric tons of seed cotton (1,330 metric tons raw)
produced by small farmers on rainfed lands. Of this production about one half(700 metric tons raw) finds its way to the textile mills while the remainder isused in the oottae industry.
In two recent studies by FAO cotton experts in Ethiopia, demand for rawcotton by 1967 has been estimated at between 18,000 and 24,000 metric tons. Even thelatter figure with population expansion would provide only one kilogramme of cotton
per person annually. The experts have estimated that the per capita consumptionwill double during the next decade, requiring approximately 35,000 metric tons ofraw cotton for an increased number of textile mills. Even the long term targetsthe present producers of irrigated cotton in the Awash Valley indicate only 15,000to 20,000 metric tons of raw cotton? or 45,000 to 60,000 metric tons of seed cottonannually (see Appendix III, Table 4).
From 1960 to 1963 the total annual consumption of cotton and cotton textileson a raw cotton (lint) equivalent basis has varied from 14,217 to 16,462 metric tons
with an average of 15,780 metric tons annually, according to recent revised estimates(see Appendix III, Table 5). For the previous five years, the average annual con-sumption was 20 per cent less. About one half of the current consumption, on a rawcotton equivalent basis, consists of imported cotton textiles valued at E.$. 34.7million compared with E.S. 37.3 million in 1954 to 1957, -when imported textiles
represented about three fourths of milled cotton consumption. These figures showa reduction of E.. 2.6 million in foreign exchange, although the total consumption
of cotton and cotton textiles increased in recent years (see Appendix III, Table 5).
Selected portions of the Awash River Valley have suitable climate, soils andirrigation water available for production of fruits and vegetables, especially highvalue crops such as citrus, bananas, papaya, grapes, etc. Because of the .proximityof the Valley to the capital, and to the developing seaport of Assab, both internaland external market outlets will be available for these semi-perishable products.Fruits and veget ble imports have averaged E.$. 1.9 million annually for the past twotwo years. Yet, with ideal climatic conditions and the irrigation water resources inthe Awash Valley, together with the cooler plateau areas having adequate rainfall,Ethiopia should be able to produce any type of fruit and vegetable desired by localdemand throughout the year, and have sufficient for export either as fresh or cannedproducts.
Imports of gunny bags have averaged B.S. 1.1 million for the past six yearsand reached a peak of E.'S. 2.1 million in 1963. Considering that coffee is one ofthe main exports and sugar production is a newly emerged industry, there is a basisfor a national fibre industry. It is expected that increased agricultural productionof cotton, pulses, oilseeds, sugar, etc. will lead also to further demands for fibrecrops suitable for production of sacks and similar containers. One proposed develop-ment plan by private enterprise in the Awash Valley includes sisal on irrigated landto assist meeting local demand. Kenaf has also been included in proposed rotationsfor other irrigated lands, but care must be exercised since this crop acts as a hostfor insects harmful to cotton production.
Oilseeds can also be produced under irrigation in the Awash Valley withsatisfactory estimated net returns. In addition to increasing exports, now valuedat S.S. 15 million annually, further production in concentrated areas might Providethe necessary impetus to develop an oil processing industry. Soap imports have

- 147-
averaged E.$. 3.5 million annually for the past four years, reaching a high ofE.$. 4.8 million in 1963, three fourths of which was for common soap. This highimport suggests a ready market being available for oil processing and soap manu-facturing industry. Cotton seed is being exported duo to lack of a processingplant. It is estimated that a minimum of 25,000 metric tons of oil seeds arenecessary annually to justify the operation of an oil mill. Other oil seeds underconsideration for large scale production include castor and groundnuts. Sesame isalso a possibility but the evaluation of net returns did not warrant inclusion inproposed rotations, although with better varieties and lower production costs, sesamemay well be worthy of consideration. Castor, groundnuts and sesame are presentlyexported in fairly large quantities.
Legumes, other than ground nuts, might be grown for improved land use, moreintensive labour use and to provide additional cash income. These would includeharicot beans, horse beans, lentils and chick peas. Exports of these four commo-dities have averaged E.$. 16 million annually over the past four years, whichindicates that oversea market outlets have already been established. Haricot beanshave been included as a possible rotation on irrigated land, as quality white beansproduce a relative high return compared with the other pulses.
Much of the 150,000 hectares of irrigable land is now utilized as grazingareas by nomadic herdsmen for cattle, sheep and goats, but the net return per hectarefor the national economy is very low. Fodder crops can be raised on irrigated landwith consequent increases in quantity and quality of meat and hides. Provision forponds or wells in adjoining plains, together with disease control and modernizationof production will enable the livestock industry, already one of the largest inAfrica, to expand greatly over the next two decades.
While largor yields per hectare of cereal crops can be grown under irrigation,there are considerable areas on the high plateaus which are peculiarly suited tocereal production because of elevation, climate and soil. About two thirds of the9.4 million hectares in cultivation in Ethiopia are devoted to cereals, but withlow average yields estimated at 800 to 900 kilogrammes per hectares of wheat barleyand maize. Yields can be increased on these lands by planting improved varieties,using lime and fertilizers and by better cultural methods. Consequently, it isbelieved that the limited water resources of the Awash Valley should be reservedfor higher gross value crops adapted to the conditions obtaining'in the valley.Limited areas of cereals could be grown for home consumption, livestock, or eventu-ally for export if demand warranted such production.
To summarize the foregoing, Ethiopia, and the Awash River Basin in particular,is fortunate in having excellent and varied climates, extensivo areas of fertilesoils, and a plentiful supply of labour. With capital investment, management andtechnical skills, including judicious application of available water, productioncan be greatly increased to improve nutrition, raise living levels and even providesurpluses to assist in meeting the world gap in food, fibre and vegetable oil.Production from the Awash Valley can broaden the base of both agriculture and itsrelated industries, thus making available tdditional foreign currency, paying theway to a more rapid industrialization and a balanced economy.
The Awash River Basin Economy
The Awash River whose headwaters rise near the capital, Adis Abeba, flowssouth and then northeastwards towards the Red Sea, but on reaching the DanakilPlains the river bends te the east, divides into three main branches, and ends ina series of lakes (seo Appendix I). This internal river basin forms a strategicaxis between the Read Sea ports and the capital. Its climate is varied, the landfertile, grazing extensive, but water resources limited. The basin includes
- 148 -
7,000,000 hectares or 70,000 square kilometers, which is about 6 per cent ofEthiopials land area. Except for the portion above Nazareth, the valley is
sparsely populated. Roving nomads seek seasonal grazing and water for their herds.It is estimated that there are 240,000 cattle, and 60,000 head of sheep, goats and
camels between Awash Station and Lake Abbe.
A few farmers raise rainfed subsistence crops in scattered areas betweenNazareth and Awash Station, and most of these farmers or their descendants will con-tinue to do so, even after portions of the valley are developed for irrigation.It is thought that existing production in these areas will be affected little by
new irrigation projects. However, these projects will utilize more fully thesemi-desert grazing savannah lands now of extremely low gross productivity. Withforage production on irrigated land, it is expected to increase over-all meatproduction even though the total grazing area is somewhat reduced by new croppingareas. In this preliminary study, no attempt has been made to assess presentproduction, except on areas now actually irrigated.
Until 1952, only the upper reaches of the Valley around the capital producedcash crops for the nearby market. They were rain fed crops or crops on lands pre-
irrigated by summer floods. Prior to the above date, only two organizations hadpioneered the lands further downstream, Montanari Estate (Awora Melka) locatednorthwest of Awash Station on the Kebena River (a tributary), and the MeteharaPlantation on the Awash River west of Awash station. These estates made use ofirrigation water to produce bananas, citrus, papaya, grapes, vegetables, cotton,rice, sugar, oilseeds etc., but transportation facilities to markets were inadequate.Just over a decade ago, planned irrigated areas below the present Koka Dam totalledless than 1,200 hectares. The Wonji Sugar Estates obtained a concession on AwashRiver near Nazareth for 5,000 hectares (later increased to 6,600 hectares) on whichto produce sugar cane by irrigation.
In 1958 Mitchell Cotts Company obtained a concession for growing cotton on18,000 hectares along the Awash River; 12,000 hectares were selected in the LowerAwash between Tendaho and Asayita; the location of the remaining 6,000 hectares wasto be decided upon later. This year, 1964, Mitchell Cotts have a total of 7,100hectares under irrigation in the Lower Awash with active plans to complete a 12,000hectare development by 1967. Reconnaissance has been made to start developing thethird tract of 6,000 hectares near Melka Sedi in the Middle Awash. The agricultural
company formed by Mitchell Cotts in the Lower Awash, known as the Tendaho PlantationShare Corporation, is also assisting local irrigation farmers by providing seeds,spray materials, ginning facilities and technical supervision over 4,000 hectaresof cotton on small farms in the Asayíta area. (See Appendix III, Table 6).
These developments, along with the preliminary results of the UNSF/FAO AwashRiver Basin Survey, have encouraged other enterprises to plan future schemes, andto start pilot projects with the following targets: Abadir - 500 hectares; Nura Era-5,400 hectares; Haile Selassie Welfare Trust - 1,500 hectares; and Tebila - 200hectares (see Appendix IV). Before this somewhat hap-hazard development becomestoo far advanced, it is essential to plan for the best over-all use of land andlimited water resources, and it is suggested that every technical and administrativeassistance should be given to the Awash Valley Authority, the autonomous Governmentbody charged with the task of developing one of Ethiopia's main agricultural assets.
Present Land Use
As mentioned previously, some development is already taking place in theAwash River basin (see Appendix IV), mostly on a fairly large scale. A few rainfed plots of maize, cotton and teff are raised by railway employees near Melka Jilo,Metehara and Awash Station, but yields are low and sporadic. The whole region issparsely populated and there has been no attempt at settled agriculture. Some years
- 149-
ago Metehara Plantation tried to encourage land settlement but only 40 familieswere induced to remain, cultivating some 20 hectares. Workers on the plantationsare almost entirely from other regions, often coming as seasonal labour only. Theydo not take roots and avoid contact with the local pastoralists. Vast tracts ofland are utilized by a relatively small number of nomadic graziers who move accordingto the availability of grass and water.
Only in the Lower Plains, around Asayita, has there been an attempt toutilize the waters of the Awash for irrigation, and settlement by the Muslim popu-lation there has been in evidence for centuries. Irrigation is mainly by inundationof flood water and crops are planted as the water recedes. Because of the siltingdeltaic channels, certain land formerly commanded by flood waters is no longercultivable. Livestock in this region is an integral part of the farming patternand are grazed on the flood areas not in cultivation and also on stubbles afterharvest. Ploughing is done by bullocks culled from grazing herds.
The recent establishment of the concessionary Tendaho Plantation ShareCompany has encouraged new settlers from the highlands at the edge of the Rift Valley,In the past, there seems to have been a migratory type of farmer who would come downfrom the hills, plant a cotton crop, and after harvesting would return to his high-land home. This type of farmer now tends to remain in the lowlands, and thereappears to be some integration of races taking place around the Asayita district.
Development of Irrigated Agriculture
It is estimated that when the targets set up by concessionaires and relatedschemes are achieved some 464000 hectares, gross area, will be operational (exclusiveof Wonjii Sugar Estates). The present water supply regulated by Koka Dam plus tri-butaries of the Awash River will be sufficient to irrigate 63,000 hectares. Thus,
without further works or contribution only 17,000 hectares beyond existing goalscan be brought into cultivation. Another eight to ten years may elapse before thevarious schemes are fully operational, but if development of irrigated agriculturein the Awash Basin is not to be hampered by lack of water, action must be initiatednow to increase the Irnter resources in order to keep pace with future agriculturalplanning.
Several schemes to increase water resources can be contemplated and some ofthem have been investigated in some detail by the UNSF/FAO Survey.
Tendaho Dam
A reservoir dam might be created on the Lower Awash near the village of
Tendaho. This would be a multi-purpose project for irrigation, flood protection and
power production. Irrigation water would supply an additional 49,000 hectares andprovide necessary flood control to an area of 70,000 hectares downstream of the dam.
A power plant could be included in the project with a production capability
of about 80 million kwhr, some of which might be used for pump irrigation. If
Tendaho Dam is erected, 12 Kms of the Adis Abeba-Assab road will need to be re-
located.
Kesem Dam
A potential dam site has been investigated on the Kesem River, a left bank
tributary of the Awash. Water storage by construction of this dam would permit
irrigation of a supplementary 18,000 hectares. Power production capability is
estimated at 35 million kwhr.

150-
Meki River Diversion
The Meki River is located about 100 km, south of Adis Abeba and presentlyflows into Lake Ziway. Aerial photography suggests that at one time the Meki was
a tributary of the Awash River. It would be feasible to excavate a canal along theold river bed and thus divert water into Koka Reservoir. An additional 15,000hectares could be irrigated and production capability of all power plants dependenton Koka Dam would be increased by at least 10 per cent.
Awash Station Compensation Dam
With diversion of Meki River, the discharge flow from Koka could be regulatedmore precisely to irrigation requirements downstream with the further constructionof a Compensation dam in a gorge near Awash Station. This would allow another5,000 hectares to be irrigated.
The impact of the above project's for the development of the Awash River Basincan be summarized as follows
TkBLE A
IRRIGABLE AND FLOOD CONTROL AREAS AND POWER PRODUCTION AFTER
STRUCTURAL DEVELOPMENT
+ Production of Koka I power plant only
++ Increase in production of Koka power plant only.
Sequence of development will be discussed elsewhere, but it is necessaryfirst to consider the economic aspects of these various irrigation, power productionand flood control proposals, - investments required, estimates of costs and benefits,and their economic justification.
Benefit-Cost Analysis
The benefit-cost analysis of.the irrigation phase of these projects is basedupon (1) the physical feasibility analyses and estimate of hydrologists, geologists,soil and water chemists, dam engineers, irrigation engineers, soil surveyors and
Project Additional Total Flood Power
Current water resources -with Koka Dam
Tendaho Reservoir Dam
Kesem Reservoir Dam
Awash StationCompensation Dan
Meki River Diversion
Areas Areas Protection ProductionIrrigable Irrigable
70,000
Capability(ha)
49,000
18,000
5,000
15,000
(ha)
63,000
112,000
130,000
135,000
150,000
Mill. kwhr)
110 +
80
35
12 ++

- 151 -
agronomists; (2) the cost estimates of engineers; (3) the production cost and yieldestimates of agronomists; and (4) the estimates of future market needs and productprices by production and marketing ec-onomists. The benefit-cost analysis of thehydroelectric and flood control phases are also a part of the over-all study butwill be treated later under separate headings. Only that part of the dams andnecessary road relocation chargeable to irrigation will be included in this firstphase of the benefit-cost analysis. (See Appendix III, Table 25).
Since more than 10,000 hectares of the proposed project area are alreadyunder irrigation, it is felt that this experience and acquired information on landpreparation, crop production, crop yields and costs of production has provided amore accurate basis for estimates than usually occurs.
Based on the preliminary feasibility studies of the UNSF/FAO Survey team ithas been determined that the quantity and quality of water that can be made availabledownstream from the Wonji Sugar Estates is sufficient to irrigate 150,000 hectaresof land in the Awash Valley, provided certain suggested reservoir storage facilitiesare constructed. It is estimated that 80,000 hectares of land suitable for irrigationlie in the Middle Awash (Wonji to Gewani Swamps) and 70,000 hectares in the LowerAwash (downstream of Tendaho).
The agronomist has selected crops (see Appendix III, Tables 7 to 18 inclusive)whose soil, water and temperature requirements conform to the Valley's climaticconditions and the land and water resources available. Selection was influenced bygross and net values, crops being chosen to provide the highest net return to thefa-ewer and to add most to the national economy by reducing food and fibre importsand/or increasing exports to earn additional foreign exchange. (See Appendix III,Table 19 to 24).
Priority has been given to cotton production in order to stimulate industrybased on local agricultural products. Emphasis has also been placed on oilseedsand pulses as oversea markets have already been established for those commoditiesand soils, climate and growing periods are favourable. Some cereals will berequired for an increased local population as well as other staple foodstuffs.Pasture and forage crops have been included, not only,for soil improvement but asa means of-integrating livestock production with irrigated agriculture. Returnsin this connection have been calculated on the basis of liveweight gains, but thereare possibilities for additional production of milk, butter and cheese. High valuecrops such as sugar cane, kenaf, sisal, citrus, bananas and vegetables were decidedupon for limited areas, in accordance with estimated demand and for como exports.These high value crops have a considerable influence on the estimated benefit costratios. (See Appendix III, Tables 19, 20, 23).
Crop plans were designed with a view to obtaining the most favourable gainsin different farm systems. High cropping intensities and high value crops wereallocated to the sophisticated concessionaire type of agricultural enterprise, whilesimpler rotations were applied to the small farms (settlement farms). (See Appendix
III, Tables 22 and 23).
While the Imperial Government favours initial development primarily by largoscale commercial farming, there is also a desire on its part to promote establishment
of small co-operative farms and settlement schemes. On the deltaic plains of theLower Awash, a number of small farms under irrigation have been operating for
centuries and an extension of this type of farming on an organized basis seems to be
desirable in suitable areas throughout the Valley.

- 152 -
Estimates of yields (see Appendix III, Table 19) for the various crops wereobtained from all available sources and statistics were analysed and extrapolatedto provide reasonably accurate figures of crop production on large mechanized farmsand on small farms. Similarly, production costs were obtained from existingoperators and in cases where no costs were obtainable, e.g. bananas, citrus andvegetables, 60 per cent of the gross value was taken as cost of production.Government departments, banks, farmers, commercial enterprises and agriculturalofficers were consulted to obtain accurate commodity prices. From these estimatedgross values and production costs, net gains were calculated for each crop. (SeeAppendix III, Table 19). Crop plans using certain rotations were then evolved, atthe same time showing total production and net gains per hectare. (See Appendix III,Table 20).
By applying combinations of these crop plans to specific areas it has beenpossible to estimate total production for each area and when full development isachieved, for a net area of 135,000 hectares. (See Appendix III, Table 23).
In making the economic appraisal of the irriEation phaSe of the project,the value of land has not been included as a project cost, since most of it isdesert grazing land at present. Instead, the value of production from the presentlycultivated land has been deducted from the total production benefits derived fromthe project. The remaining costs and benefits have been summarized in economicterms, according to recognized procedures. 1/
In accordance with this procedure, the initial investment estimates for allrequired dams and diversion dams as well as the necessary headworks, canals,drainage ditches, land clearing and land levelling for 117,950 hectares of landhave been made by the UNSF/FAO Survey team, and used as a basis for the over-allproject estimates or 150,000 hectares. (See Appendix III, Tables 25, 27).
Comparison of these Survey team cost estimates for irrigation works andland preparation with the cost of work done by a half dozen concessionaires orlarge farmers in the project area indicates that they are reasonable. To the costestimates of the survey, team, the cost of E.S. 1.2 million for road relocationfor 12 kilometers of highway affected by the Tendaho Dam has been added to thecost of that dam. 2/ Similarly, the cost of external highways to the project areasand additional internal roads totalling E.$. 5.5 million have been included.(See Appendix lU, Table 26).
Since the Survey team did not make a soil survey and cost estimate for allof the proposed project area, extrapolation for the additional 3,700 hectares in
"Benefit Cost EValuations as applied ta AID-financed Water and Related LandUse Projects, Supplement No. 1 to Feasibility Studies, Economic and TechnicalSoundness, Analysis, Capital Projects" prepared by the Agency for InternationalDevelopment, Department of State, Office of Rngineering, U.S.A.
2/ Estimated by a representative of De Leuw Cather of Canada and confirmed bythe Imperial Highway Authority.

- 153 -
the Lower Awash and 28,350 hectares in the Middle Awash were made. (See Appendix III,Tables 25 and 27). Estimates of the average investment per gross hectare by theSurvey team for nearby and/or similar land areas were used in making these extra-polations, i.e. E.$. 1,205 per gross hectare in the Lower Awash and E.S. 1,732 (perhectare) in the Middle Awash. (See Appendix V for a more detailed explanation).Both the surveyed areas and the extrapolated areas were traVersed and availableinformation analyzed by one or more of the review panel - most of the areas by allthree members.
Based on the Survey team estimates of E.S. 84.1 million for a diversion canal,a comllensation dam and two major dams with accompanying dikes, etc., the extra-polated figure of E.$. 223.0 million for headworks and structures, canals, ditches,diversion dams, land clearing and levelling and farm canals and drainage ditches,and including the E.S. 5.5 million for additional roads, the total estimated invest-ment for these irrigation related works is E.$. 312.5 million. This investment,which amounts to E.S. 2,084 per gross hectare (E.$. 2,315 per net or crop hectare)for the 150,000 hectares for which water supplies are estimated to be available,is a responsibility of both the public or government and the landowners or farmers.The initial investments, totalling E.S. 250.6 million for the major items, suchas dams, canals, ditches, land clearing, diversion dams, roads, bridges and culvertsare primarily a public responsibility. The investments of E.S. 62.0 million in landlevelling, farm canals and farm drainag.e ditches in the distribution system areusually a responsibility of the landowners or farmers and are included in the"associated costs", along with the cost of houses for farmers and labourers, ware-houses, office buildings for supervising and administrative personnel, totallingE.S. 55.3 million, as well as machinery and farm power investment of B.S. 62.4million. This brings the estimates of "associated costs" investment to E.$. 179.7million, and the "Grand Total Investment" to E.S. 430.3 million.
On the basis of these investments, annual costs of maintenance and operationof dams, canals, headworks and replacement of pumps have been computed at 2 per centannually for a cost of E.$. 5.0 million. Amortization of investment costs over a50-year period have been computed at both 6 per cent (0.06344) and 4 per cent
(0.04655) for comparative purposes. The rate of 6 per cent, which was used at thesuggestion of the Ethiopian Development Bank representative as a fair rate for thiskind of project in Ethiopia, shows an annual charge of E.$. 15.9 million. The rate
of 4 per cent was used as a possible rate for some international bank financing and
gives an annual charge of E.S. 11.7 million. This latter rate might be especiallyapplicable to the investment funds required for the two major dams. In this project
an additional annual charge of E.S. 1.0 million or E.$. 16.50 per gross hectare ofland operated by small farmers has been included for extension workers (or farm credit
supervisors) to assist in the supervision of the development of small farms. Normally
extension service costs are a part of the regular governmental functions and are in-
cluded in the budget of the Minister of Agriculture. However, the more intensivesupervision envisioned for this project requires additional personnel and separate
financing.
The Associated Annual Costs of E.S. 14.0 million, to be paid by landowners
includes a 2 per cent charge for maintenance and operation, distribution and drainage
ditches, plus computed amortization charges for 50 years at 6 per cent (0.06344) and
4 per cent (0.04655) for the associated costs of land levelling, and distribution
and drainage ditch investments. Amortization charges for 20 years on E.$. 55.3million invested in farm and labourer houses) warehouses and office buildings for
both small farm settlements and large farm developments at 6 per cent, (0.08718) and
an interest charge only of 6 per cent on E.$. 62.4 million for farm machinery and
equipment has been computed. Since depreciation charges on farm machinery and
equipment have been included in the cost of producing the crops, no amortization
- 154-
charge has been made for this item. Pumping charges have been included whereapplicable in the Middle and Lower Awash areas. In the Lower Awash, pumping chargesof E.$. 0.03 per kwhr for an estimated 20 million kwhr were made. According toBELFA 1/ officials, this would be the applicable rato for large industrial users.(s.s. 0.05 less 40 per cent discount or E.S. 0.03 per kwhr). In the Middle Awash,the estimated 15,000 hectares of land requiring pumping were computed at E.S. 40 perhectare or about E.S. 0.11 per kwhr, which is consistent with diesel-electric powercosts. Construction of the Kesem dam and hydroelectric power unit would reducethis pumping charge to about one-third the present figure.
With the Annual Investment Costs of E.S. 21.9 million and Associated AnnualCoste of E.S. 14.0 million including annual amortization, maintenance and operationand special charges determined, estimates of the Primary Benefits which will cometo landowners were made. This required an estimate of present production as wellas the future production of the completed project. In this instance estimates ofthe production of 10,500 hectares of land already under irrigation, the gross cropvalue and farm production costs indicated a "net yield at present" of C.S. 1.7million. Since "Present Associated Investments"of E.S. 7 million have been madealready by the farmers, annual amortization at 6 per cent (0.06344) is an additionalcurrent charge of E.S. 0.4 million which would reduce the present net yield toB.S. 1.3 million.
Estimates of the production, gross crop value, farm input costs and netgain of a completed project in full production several years hence is a difficulttask. But the procedure for this was discussed in detail earlier and reference madeto data in Appendix III, Tables 19 to 24. However, these data require further analy-sis and refinement to make them more useful in the economic feasibility study.Orchards, fruits, sugar, sisal, bananas and other products which require considerabletime to get into full production must be discounted for the time lag (1 to 7 yearshave been used in these estimates). Even general crops which will be produced bybeginner farmers or former nomads require time to reach full production. In thisinstance it has been estimated that it will take 10 years for small farmers to reachfull production; thus, a 5-year time lag has been used. For large farmers a 2-yearhas been used - except in the Lower Awash where only a I-year lag has been calculatedbecause one-third of the land area for large farms is already under cultivation.Within a 3-year period it is estimated that two-thirds of the large farm area willbe in full production." Consequently, even this 1-year lag for large farms may notbe required in the Lower Awash. Nevertheless this realistic allowance for time lagin the development of the project has reduced the estimated "Gain in Net AnnualProduction" from E.S. 69.9 million to E.S. 56.9 million or about 19 per cent.
From the computed "Total Adjusted Gains" of E.S. 56.9 million obtained fromcrop production but reduced on account of time lag, the "Total Annual AssociatedCosts (TAAC)" of E.S. 14.0 million are deducted, leaving the "Net Annual PrimaryBenefits" of E.S. 42.9 million. A comparison of these "Net Annual Primary'Benefits"with the "Annual Costs" of E.S. 21.9 million shows a Benefit Cost Ratio of 1.95to 1.00 at 6 per cent, which.is indicativo of the relative profitability of theproject. The benefit-Cost Ratio at 4 per cent interest is 2.42 to 1.00.
In summary, the preliminary data and analysis indicate that the annual netgains for agricultural production are almost double the annual costs for theirrigation phase of the Total Awash Project. After completion, the project is
1/ Ethiopian Electric Light and Power Authority

- 155 -
expected to produce E.$. 181 million gross agricultural products annually, withan annual net gain over present production of about E.$. 60 million.
Secondary benefits were not computed but there will be important additionsto the regional and national economy through increased income to thousands ofworkers and farwers, either presently under-employed or with meagre incomes. Inthis type of development programme, the concomitant servicing (private and govern-mental), transportation and processing industries must develop and will provide afurther impetus to the economy of the area and the nation.
In order to show how the Primary Benefit-Cost Ratio was determined, theprocedure and data for the Total Awash Project are presented in brief form inTable E below. The detailed data for the Total Awash Project and for separatesegments or areas are presented in Appendix III, Tables 32 to 40. On each of thearea tables, the Benefit-Cost Ratio which is most likely to obtain if the wholeAwash Valley Project is carried out, with proper over-all government planningand supervision, has been underlined. This preliminary analysis, which shows eacharea as being economically feasible, is predicated upon the idea that the Govern-ment will accept its responsibility to develop policies to encourage proper landand water use for the whole Awash Valley.
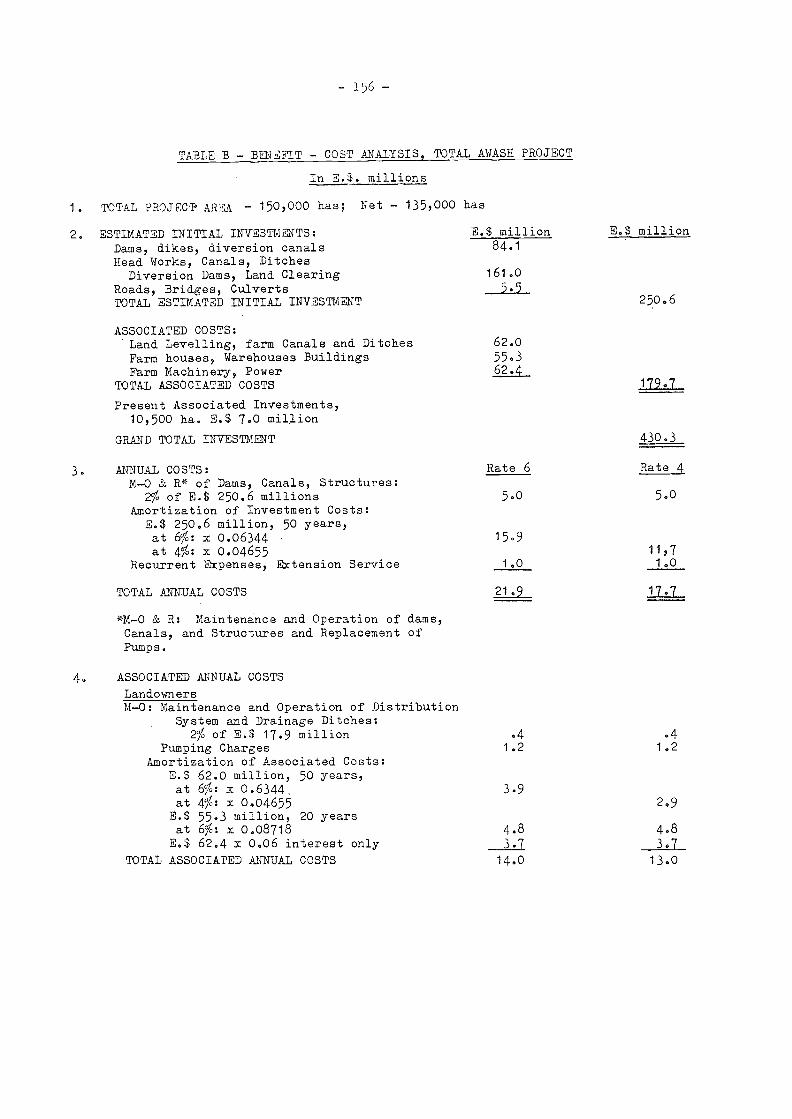
2. ESTIMATED INITIAL INVESTMENTS:Dams, dikes, diversion canalsHead Works, Canals, Ditches
Diversion Dams, Land ClearingRoads, Bridges, CulvertsTOTAL ESTIMATED INITIAL INVESTMENT
ASSOCIATED COSTS:'Land Levelling, farm Canals and DitchesFarm houses, Warehouses BuildingsFarm Machinery, Power
TOTAL ASSOCIATED COSTS
Present Associated Investments,10,500 ha. E.$ 7.0 million
GRAND TOTAL INVESTMENT
3, ANNUAL COSTS:M-0 & R* of Dams, Canals, Structures:
eo of E.$ 250.6 millionsAmortization of Investment Costs:
E.$ 250.6 million, 50 years,at 6%: x 0.06344at 410: x 0.04655
Recurrent Expenses, Extension Service
TOTAL ANNUAL COSTS
- 156-
TABLE B - BENEFIT - COST ANALYSIS, TOTAL AWASH PROJECT
In E.$. millions
1. TOTAL PROJECT AREA - 150,000 has; Net - 135,000 has
*M-0 & R: Maintenance and Operation of dams,Canals, and Structures and Replacement ofPumps.
E.$ million84.1
161.05.5
62.055.362.4
Rate 6
5.0
15.9
1.0
21.9
E.S million
250.6
179.7
430.3
Rate 4
5.0
11,71.0
4, ASSOCIATED ANNUAL COSTS
LandownersM-0: Maintenance and Operation of Distribution
System and Drainage Ditches:Vo of E.3 17.9 million .4 .4
Pumping Charges 1.2 1.2Amortization of Associated Costs:
E.3 62.0 million, 50 years,at 65: x 0.6344,at 4c/0: x 0.04655
3.92.9
E.S 55.3 million, 20 yearsat 0: x 0.08718 4.8 4.8
E.$ 62.4 x 0.06 interest only 3.7 3.7TOTAL ASSOCIATED ANNUAL COSTS 14.0 13.0

Production at present
Gross Agricultural yieldLess farm input costsLess Amort. 50 yrs. Present
InvestmentNet yield at present
- 157 -
TAB LE B: BENEFIT - COST ANALYSIS TOTAL AWASH PROJECT
In E.$ millions
5. PRIMARY BENEFITS TO LANDOWNERS:
Reduced Gain on account of Lag:Short-cut method at 6%(For details see Appendix II,
Table 32, pages 3 and 4).Total Adjusted Gain - With Lag
Less Total Associated Annual Costs (Item 4)
NET ANNUAL PRIMARY BENE1,iTS - WITH LAG
6, BENEFIT-COST RATIOS: Rate 6%
Annual Benefit - With Lag 42.9Annual Costs (Item 3) 21.9
Ratio: With Lag 1.95 to 1.00
SECONDARY BENEFITS - None computed and none used above.
INVESTMENT PER HECTARE: in E.S. only Gross Area
Irrigation works, dams and roads E.$ 2,084
.41.3
Estimated Production after completion
Gross at full development 181.5Less farm input costs 110.3
GAIN IN NET ANNUAL PRODUCTION 69.9
Net Area
E.$ 2,315
56.914.0
42.9
Rato k%
42.917.7
2.42 to 1.00
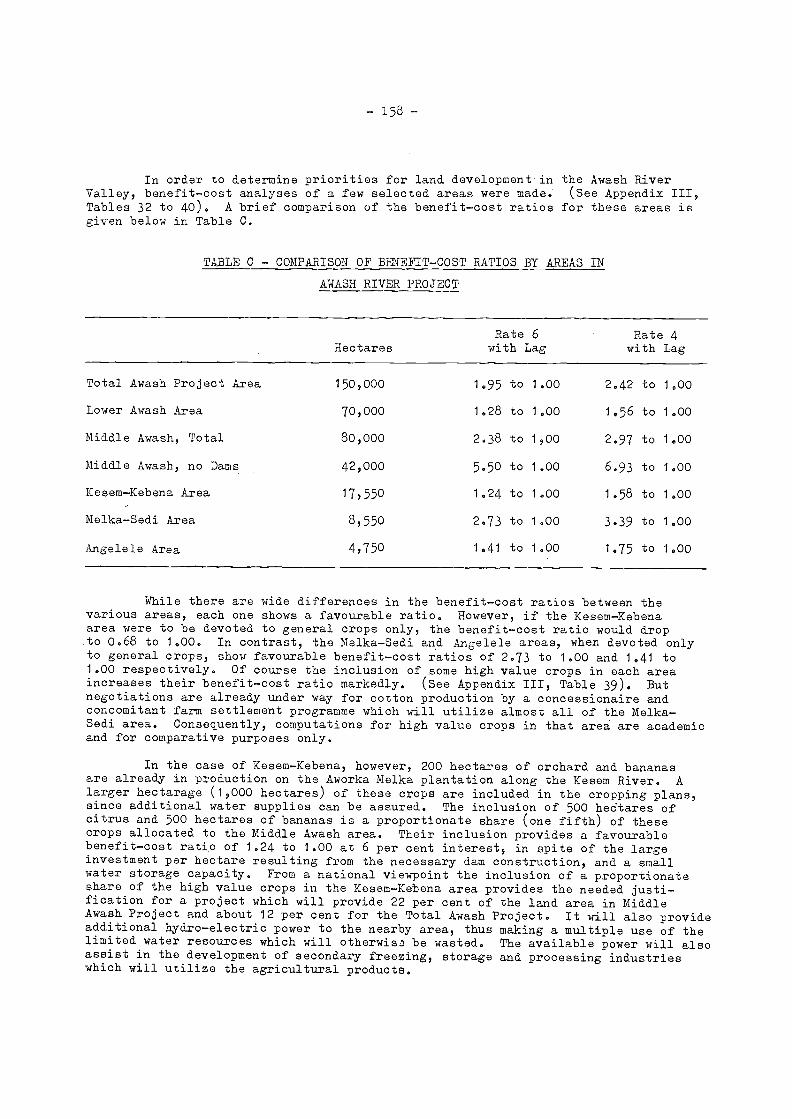
- 158 -
In order to determine priorities for land development in the Awash RiverValley, benefit-cost analyses of a few selected areas were made. (See Appendix III,Tables 32 to 40). A brief comparison of the benefit-cost ratios for these areas isgiven below in Table C.
TABLE C - COMPARISON OF BENEFIT-COST RATIOS BY AREAS IN
AWASH RIVER PROJECT
While there are wide differences in the benefit-cost ratios between thevarious areas, each one shows a favourable ratio. However, if the Kesem-Kebenaarea were to be devoted to general crops only, the benefit-cost ratio would dropto 0.68 to 1.00. In contrast, the Melka-Sedi arO Angelele areas, when devoted onlyto general crops, show favourable benefit-cost ratios of 2.73 to 1.00 and 1.41 to1.00 respectively. Of course the inclusion of some high value crops in each areaincreases their benefit-cost ratio markedly. (See Appendix III, Table 39). Butnegotiations are already under way for cotton production by a concessionaire andconcomitant farm settlement programme which will utilize almost all of the Melka-Sedi area. Consequently, computations for high value crops in that area are academicand for comparative purposes only.
In the case of Kesem-Kebena, however, 200 hectares of orchard and bananasare already in production on the Aworka Melka plantation along the Kesem River. Alargor hectarage (1,000 hectares) of these crops are included in the cropping plans,since additional water supplies can be assured. The inclusion of 500 heCtares ofcitrus and 500 hectares of bananas is a proportionate share (one fifth) of thesecrops allocated to the Middle Awash area. Their inclusion provides a favourablebenefit-cost ratio of 1.24 to 1.00 at 6 per cent interest, in spite of the largeinvestment per hectare resulting from the necessary dam construction, and a smallwater storage capacity. From a national viewpoint the inclusion of a proportionateshare of the high value crops in the Kesem-Kebena area provides the needed justi-fication for a project which will provide 22 per cent of the land area in MiddleAwash Project and about 12 per cent for the Total Awash Project. It will also provideadditional hydro-electric power to the nearby area, thus making a multiple use of thelimited water resources which will otherwis:) be wasted. The available power will alsoassist in the development of secondary freezing, storage and processing industrieswhich will utilize the agricultural products.
HectaresRate 6with Lag
Rate 4with Lag
Total Awash Project Area 150,000 1.95 to 1.00 2.42 to 1.00
Lower Awash Area 70,000 1.28 to 1.00 1.56 to 1.00
Middle Awash, Total 80,000 2.8 to 1,00 2.97 to 1.00
Middle Awash, no Dams 42,000 5.50 to 1.00 6.93 to 1.00
Kesem-Kebena Area 17,550 1.24 to 1.00 1.58 to 1.00
Melka-Sedi Area 8,550 2.73 to 1.00 3.39 to 1.00
Angelele Area 4,750 1.41 to 1.00 1.75 to 1.00
- 159 -
Where soils are quite similar and climate and water are equally suitable fora wide variety of crops, it becomes a problem of how to assign the cropping plansto each area. In some instances transportation facilities or market outlets assistin the decision. But it should be recognized that the benefit-cost ratio will varyas the acreages of the more labour intensive, high value crops such as sugar cane,bananas, citrus, etc. are shifted from one area to another. For this reason thedata for these Special or High Value Crops (HVC) which are included in Crop Plans9, 10) 11 and 12 have been listed as a group at the top of Table 23, Appendix III.Thus, they are available for assignment to any area where soil, water, climate,market outlet, transportation and concessionaire or producer interest indicate thatthey might be groyn economically. They are now included in the Total Project andboth Middle Awash estimates. Desired hectarages of any of these special crops can besubstituted for a similar hectarage of general crops in any area of the project, witha resulting improvement in the benefit-cost ratio for that area. Such was done forvery logical reasons in the Kesem-Kebena area as shown in Table 36, Appendix III andas explained above. It has been done also for the Melka-Sedi area for comparativepurposes only, unless the Government and the concessionaire for this land changetheir present agreement and plans.
In the case of sugar production, however, negotiations are already underway for the full quota to be assigned to the Metehara Plantation above Awash Station,because of railroad facilities and preliminary plans already made. Consequently,the production of sugar would not be available for any other area until the nationaldemand for sugar more than doubled. Similar problems would arise as the hectaragesof any special crop gave a production considerably in excess of local, nationaland/or export demand.
In order to show the effect of these high value crops in certain areas whencompared with general crops, benefit-cost ratios have been computed for specifiedareas in the Middle Awash and presented in Table 39, Appendix III. From this tableit is noted that a proportionate share of these high value crops such as sugar cane,citrus fruits and bananas were not included in the suggested cropping plans for theLower Awash, especially when compared with the more suitable soils of the MiddleAwash for these crops. If, however, limited areas in the Lower Awash are found forsuch high value crops, including vegetables, etc.; a shift in hectarage may be made,with a resulting increase in the benefit-cost ratio for the area and a loweredtransportation charge for any exportable commodity.
In order to provide more productive agricultural land for the nation andnearby hydro-electric power for the Middle Awash area through the utilization of alarger share of the area's limited water and irrigable land resources, the Govern-ment might consider giving preference to farmers who would develop the additional
800-1,000 hectares or more of land in bananas, citrus fruit and vegetables in the
Kesem-Kebena area.
The Government must also decide whether to let the irrigation development
of the Valley occur primarily in the areas of high benefit-cost ratios, such as the
"Middle Awash - no Dams" area of 42,000 hectares and thus limit the Middle Valleydevelopment and total national production, or take the longer run viewpoint of
developing as much as the total water resources of the Awash River would permit, est
estimated at 80,000 hectares for the Middle Awash, with engineering structures.
the latter policy is adopted, then shifts in cropping plans to utilize fully and
economically all the land and water resources would appear to be justified.

- 160-
Similarly, the Government must develop policies relativo to water ratesor water charges for use in agricultural production. To what extent should watercharges be used to finance investment amortization and/or administration and super-
vision of the irrigation project? Should water charges be used as a means ofobtaining funds from the land with crops giving higher net returns to assist infinancing and making more viable the present or prospective lower return areas?Should water charges be made on a hectarage basis, as now plasned, or upon thequantity of water used? More water is required per hectare of bananas or sugarcane than for beans, groundnuts or cotton. Should there be a minimum water chargeto encourage the production of higher value crops and fuller production of allcrops? Or should there be a ceiling water rate to encourage production of highvalue heavy water-using crops? Due to the concentration of rainfall in March-Apriland June to September, water rates might be reduced during this period to makefuller utilization of seasonal surplus water.
These and many other avenues for obtaining funds to assist in financing theproject must be carefully studied and reviewed by appropriate experts. An earlyconsideration of these and other problems require the attention of the Government,and especially of the General Manager and Board of Directors of the Awash ValleyAuthority. Their recommendations should then lead to-approval and necessarylegislation.
Project Financing
After determining that a project is economically feasible, a host of newproblems arise relative to financing. What phases of the project should be financedby government or government-backed loans? What investments should be financed bythe farmers and through what source of funds? What length of loan and what interestrates might be expected for each type of loan? There are wide differences in thesematters according to lending agencies, length of loan, source of funds and thepurpose for which the funds are used. The matter of past credit performance is alsoan important factor.
Since it is now a common practice for governments to consult with a financeexpert who knows the various sources of funds for different types of loans, thepanel gave little consideration to this matter. In order to point up the effectof shorter term loans than are provided for in the computation of the benefit-costratios, the Lower Awash Project was computed on a 25-year, 6 per cent loan amor-tization basis. (See Appendix III, Table 40). According to these calculationsinvolving E.$ 91,753,500 for dams, dikes, major canals, ditches and pumps on a25-year, 6 per cent (0.07823) amortization plan, but leaving all other costs at thesame rates as previously, the benefit-cost ratio is 1.10 to 1.00.

- 161 -
DEVELOPMENT OF HYDROELECTRIC POWER AND FLOOD CONTROL
Water power is the most important source of electric energy in Ethiopia, withhydroelectric plants furnishing 60 percent of the 176 million kwhr produced in 1963.But preliminary studies have indicated that 45 billion kwhr can be supplied annuallyfrom the 16 major watersheds of the nation. In Ethiopia the production of electricityin primarily a function of the Public Utilities, being supplemented (12 percent oftotal production) by small industry-owned thermal plants which supply the needs oftheir own industry. Utilization of the water power of the Awash River began in 1960,upon the completion of Koka Power Dam (Koka I) with an installed capacity of 54,000 kw(KVA), the largest power plant in Ethiopia to date. In 1963 this plant produced81 million kwhr which was 40 percent of the nation's total (including Eritrea). Itis the primary source of electricity in the capital and contiguous area, supplementedby a local thermal station. But 40 percent of the homes in Addis Abeba are stillwithout electricity, and power service to present'consumers is inadequate.
Because of the high cost of thermal power in Ethiopia (E.$ 0.09 to E. 0.15per kwhr), hydroelectric power can make an important contribution to industrialdevelopment and improved living levels. In this connection Ethiopian Electric Lightand Power Authority (LELPA) has firm plans for developing certain water powerresources, doubling the' current electric power generation to 355 million kwhr by1967. This means an annual increase of about 22 percent, which approximates thegrowth rate of the past decade.
To meet the demand in the capital area further use will be made of the AwashRiver by construction of Koka II (already in progress), Koka III and possibly Koka IVat selected sites downstream from Koka I. Water power development of the Blue NileRiver is also under way with the construction of the Tis Abbai System, which willhave an initial output of 15 million kwhr and a completion output of 57 million kwhr.Preliminary plans for Fincha Dam on a tributary of the Blue Nile with a capacity ofabout 80 million kw are also under consideration.
Approximately 21 million kwhr or one-third of the 66 million kwhr of thenation's thermal power is generated in industrial plants, usually due to a lack ofany other source. Owing to long distar.ce shipping and high overland transportationcosts for fuel, primarily fuel oil, thermal power plants are high cost producers,3 to 10 times the cost of hydropower.
Because of the rapidly growing consumer demand along with plans for industrialdevelopment in the areas to the east and north of the capital, the EELPA expressedan interest in any possible source of electric power which was economic. Theconstruction of dams which could supply hydroelectric energy from the lower reachesof the Awash River or its tributaries should receive favourable consideration.Electricity generated at the Tendaho Dam site could be used locally, and the surplusmade available either to Assab on the sea coast or to Kembolcha-Dese-Bati area, whereindustrial development is expected to take pluce. The power generated at the KesemDam would eventually be used in the expected development of the Middle Awash area.In the meantime, a connection with the transmission line from Addis Abeba to DireDawa and Harrar would help to meet the increasing demands in those areas.
In the over-all plans for Ethiopia, hydroelectric power from one of itsgreat natural resources is expected to play an important role in industrial develop-ment and improved living levels. It will greatly af'fect industry location and land
settlement schemes.

- 162 -
ECONOkIC FEASIBILITY OF THE HYDROELECTRIC POWER PROJECTS
A preliminary estimate of the economic feasibility of a hydroelectric powerproject in Ethiopia was suggested by a representative of the EELPA organization. In
brief it is obtained by the following formula:
"If Power Investment Cost is less than E.$ 0.24 per kwhr produced annually,the project is competitive with other hydroelectric sources of power in thecountry".
On this basis the Tendaho Dam power project with a total investment cost ofE.$ 17.2 million and a production of 80.million kwhr would show an investment perkwhr of E. 0.215, or below the above limit of E. 0.24 per kwhr.
On a similar basis the Kesem Dam power project shows a cost of E.3 0.231 perkwhr based on E.$ 8.1 million investment and an annual production of 35 million kwhr.This is also below the limit of E.3 0.24 per kwhr set forth above. If a sub-stationcosting E.$ 500,000 and transmission line for E.$ 800,000 are included, the investmentincreases to E. 0.269 per kwhr, but such items are usually considered a part of thecost of the distribution system.
A more detailed description and benefit cost analysis of each of the two powerprojects are presented below.
L0ER AWASH (TENDAHO) HYDROELECTRIC POWER PROJECT
The project includes a separate concrete power subsection of an earth and rockfill dam built primarily to store water for irrigation and flood control. The power-house will be located at the toe of this concrete section. A sub-station will provide20 million kwhr of electricity annually for pumping irrigation water and a limitedamount for local use. This will require an 80 kw transmission line of 60 kv capacityand necessary transformers for the Asayita area. A stop-up sub-station and a 160 to250 kw transmission line of 132 kv capacity on steeel towers will provide anadditional 60 million kwhr to either of two markets - Assab on the seacoast or theKembolcha-Dese (Dessie) area. Both are in need of power for development but 200-240kilometers of high voltage transmission linos and sub-stations will need to be built.
The cost of the dam itself is estimated at E. 25.4 million, while mechanicalAnd electric power equipment totals E.$ 13.6 million. The relocation of 12 km. ofroads will add another E.$ 1.2 million for a total cost of E.$ 40.2 million. Theshare of the cost of dam and other items charged to irrigation, flood control andpower is shown in Table D below.
TABLE D
COST ALLOCATION OF TENDAHO DAN
IrriEation 18.9
Exceptional flood control 1.9
Power 4.6
Civil Mechanical and/or RoadEngineering Electrical Equip. Relocation
1.0
12.6
1.2
Total
25.4 13.6 1.2 40.2
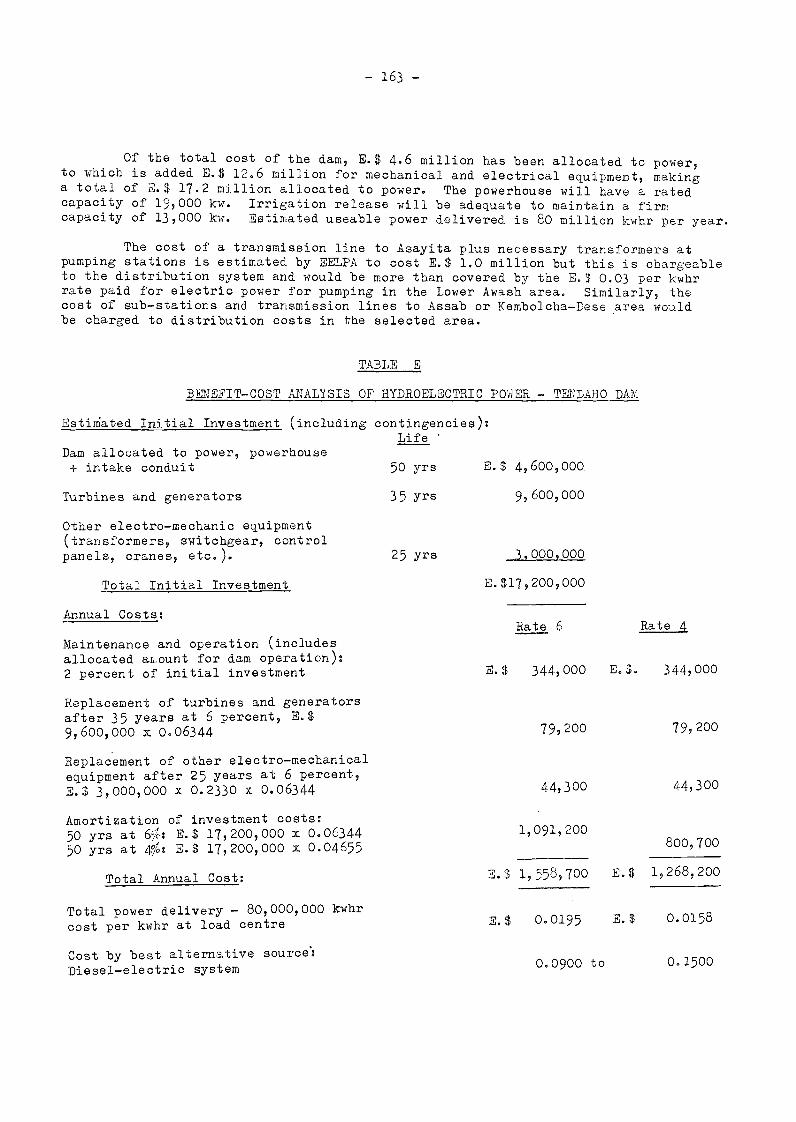
Annual Costs:
Maintenance and operation (includesallocated anount for dam operation):2 percent of initial investment
Replacement of turbines and generatorsafter 35 years at 6 percent, E.$9,600,000 x 0.06344
Replacement of other electro-mechanicalequipment after 25 years at 6 percent,E.$ 3,000,000 x 0.2330 x 0.06344
Amortization of investment costs:50 yrs at 6'./c: E.$ 17,200,000 x 0.0634450 yrs at 410: E.$ 17,200,000 x 0.04655
Total Annual Cost:
Total power delivery - 80,000,000 kwhrcost per kwhr at load centre
Cost by best alternative source':Diesel-electric system
- 163 -
Of the total cost of the dam, E.$ 4.6 million has been allocated tc power,to which is added E.$ 12.6 million for mechanical and electrical equipment, makinga total of E. 17.2 mjllion allocated to power. The powerhouse will have a ratedcapacity of 19,000 kw. Irrigation release will be adequate to maintain a firmcapacity of 13,000 kw. Estimated useable power delivered is 80 million kwhr per year.
The cost of a transmission line to Asayita plus necessary transformers atpumping stations is estimated by EELPA to cost E.$ 1.0 million but this is charEeableto the distribution system and would be more than covered by the E. 0.03 per kwhrrate paid for electric power for pumping in the Lower Awash area. Similarly, thecost of sub-stations and transmission lines to Assab or Kembolcha-Dese area wouldbe charged to distribution coste in the selected area.
TABLE E
BENEFIT-COST ANALYSIS OF HYDROELECTRIC POWER - TENDAHO DM:
Estiniated Initial Investment (including contingencies):Life
Dam allocated to power, powerhouse+ intake conduit 50 yrs E.$ 4,600,000,
Turbines and generators 35 yrs 9,600,000
Other electro-mechanic equipment(transformers, switchEear, controlpanels, cranes, etc.). 25 yrs 1,000,000
Total Initial Investment E.$17,200,000
E.$ 0.0195 E.$ 0.0158
0.0900 Lo 0.1500
Rate 6 Rate 4
E.$ 344,000 E.S. 344,000
79,200 79,200
44,300 44,300
1,091,200800,700
E.$ 1,558,700 E. 1,268,200
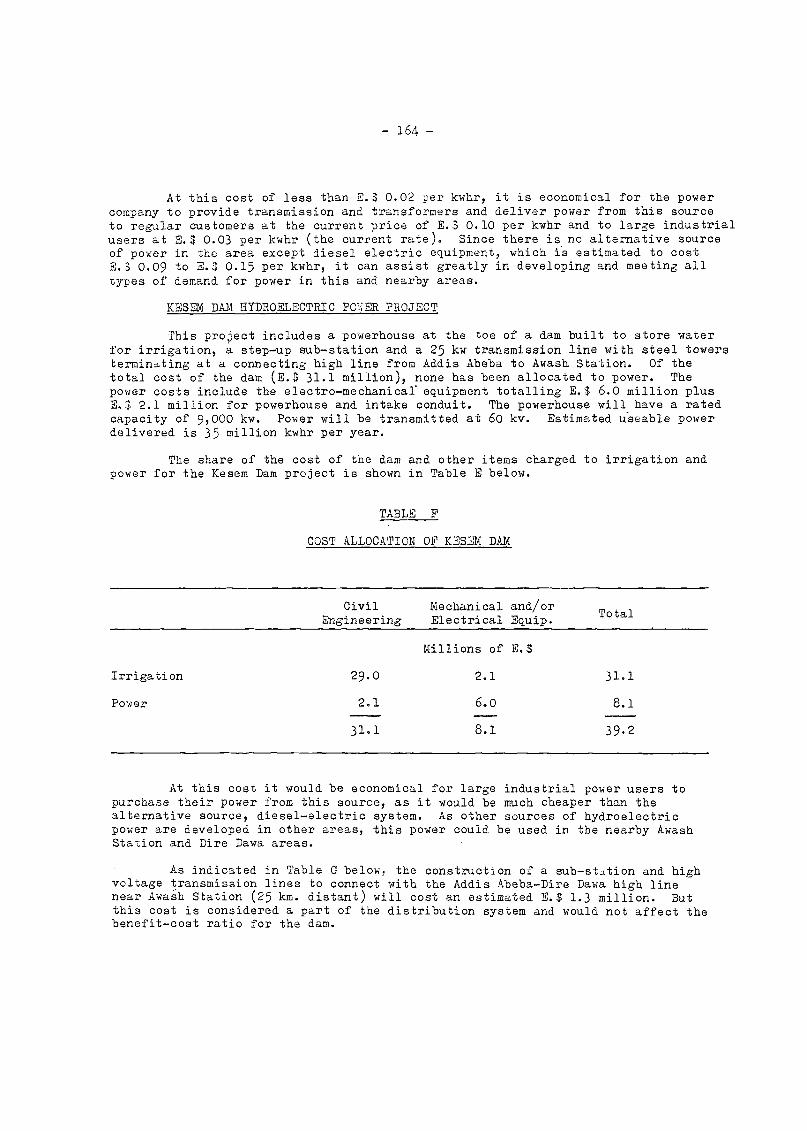
- 164-
At this cost of less than E.$ 0.02 per kwhr, it is economical for the powercompany to provide transmission and transformers and deliver power from this sourceto regular austomers at the current price of E.3 0.10 per kwhr and to large industrialusers at E.$ 0.03 per kwhr (the current rate). Since there is no alternative sourceof power in the area except diesel electric equipment, which iS estimated to costE.$ 0.09 to E.3 0.15 per kwhr, it can assist greatly in developing and meeting alltypes of demand for power in this and nearby areas.
KESEM DAM HYDROELECTRIC PCER PROJECT
This project includes a powerhouse at the toe of a dam built to store waterfor irrigation, a step-up sub-station and a 25 kw transmission line with steel towersterminating at a connecting high lino from Addis Abeba to Awash Station. Of thetotal cost of the dam (E.3 31.1 million), none has been allocated to power. Thepower costs include the electro-mechanical' equipment totalling E.$ 6.0 million plusE. 2.1 million for powerhouse and intake conduit. The powerhouse will have a ratedcapacity of 9,000 kw. Power will be transmitted at 60 kv. Estimated u-seable powerdelivered is 35 million kwhr per year.
The share of the cost of the dam and other items charged to irrigation andpower for the Kesem Dam project is shown in Table E below.
TABLE F
COST ALLOCATION OF KESEM DAM
Civil Mechanical and/orEngineering Electrical Equip.
Millions of E.
Irrigation 29.0 2.1 31.1
Power 2.1 6.0 8.1---- ___ ----31.1 8.1 39.2
Total
At this cost it would be economical for largo industrial power users topurchase their power from this source, as it would be much cheaper than thealternative source, diesel-electric system. As other sources of hydroelectricpower are developed in other areas, this power could be used in the nearby AwashStation and Dire Dawa areas.
As indicated in Table G below, the construction of a sub-stJ.tion and highvoltage transmission lines to connect with the Addis Abeba-Dire Dawa high linenear Awash Station (25 km, distant) will cost an estimated E.$ 1.3 million. Butthis cost is considered a part of the distribution system and would not affect thebenefit-cost ratio for the dam.

Power and intake conduit
Turbines and generators
Other electro-mechanical equipment
Total initial investment:
Annual Costs:
- 165 -
TABLE G
BENEFIT-COST ANALYSIS, HYDROTTr,ECTRIC POWER,
KESEM DAN
Estimated Initial Investment:(Including contingencies)
Life
50 yrs
35 yrs
25 yrs
E.$ 2,100,000
3,500,000
2,500,000
E.$ 8,100,000
Rate 6 Rate 4Maintenance and operation (includes
allocated amount for dam operation):2 percent of E.$ 8,100,000 E.$ 162,000 E.$ 162,000
Replacement of tJrbines, generators,35 years at 6 percent:E.$3,500,000 x 0.1301 x 0.06344 28,900 28,900
Replacement of sub-station equipment,25 years at 6 percent:E.3 2,500,000 x 0.2330 x 0.06344 37,000 37,000
Amortization of investment costs:E.$ 8,100,000, 50 yrsat 6 percent: x 0.06344 513,864at 4 percent: x 0.04655 377,055
Total Annual Cost: E.$ 741,764 E.$ 604,955
Total power delivery - 35,000,000 kwhr
Cost per kwhr at dam site: E.S 0.021 E.$ 0.017
Cost per kwhr with sub-station andtransmission lines costing E.$ 1.3million included: 0.024 E. 0.021
Cost per kwhr with best alternative Source:Diesel-electric system E. 0.090 to E.$ 0.100
- 166 -
FLOOD CONTROL
The Awash River has a few major left bank tributaries arising in the mountainsto'the north. Of these the Mile (Mille) River is the largest. It is this river whichwill make the water storage for irrigation possible - but it is also the river whichcauses the major flood damage by the Awash River below Tendaho. In August-September1964, flood waters from the Mile River caused extensive damage to irrigation worksand crops in the Dubti, Dit-Bahri and Asayita areas. The cost of replacing andrepairing irrigation canals and structures by one farm with 5,500 hectares ofcultivated land was E.$ 145,000. In addition, 500 hectares of prepared cotton landcould not be planted this year with an estimated reduction in net returns ofE.$ 175,000. A reduction in net return on an additional 2,000 hectares of E.$ 150,000is due to poor stands and late plantings. In addition to this estimated loss ofE.S 470,000, the indicated production of small farmers is reduced by 1,000 to 2,000M.T. of seed cotton with a reduced gross value of up to E.$ 1 million and reduced netincome of E.3 100,000 to E. 200,000. Thus, the total estimated loss during thissingle year amounted to an estimated E. 500,000 to E. 700,000, or about one-thirdof the E.$ 1.9 million cost of the dam allocated to flood control.
Since this type of flood is estimated to be a one-in-ten year type, thereis ample justification for an allocation of E. 1.9 million of the dam cost for floodcontrol.
FARM SYSTEMS AND SETTLEAENT
In developing agriculture in the Awash River Basin, consideration will haveto be given to the possible farm systems which can be used to achieve an increasein the economy. Will development be undertaken by Government directly, concession-aires, individual farmers or co-operative small holders? One difficulty arises fromthe fact that the Awash Basin contains few people and these are mostly nomadic, whodo not yet display an interest in cultivation and a settled existence. Only in theLower Awash around Asayita, is irrigated farming carried on by family units. Ingeneral, the Ethiopian farmer is a hill man and shuns the hot plains and valleys;such areas are left for the nomads and their livestock.
This lack of population would saggest that development should start withconcessionaires on large scale farms assisted by Government to become establishedin the Valley. A labour force would be attracted, as in the case of Wonji SugarEstates, which would gradually become acquainted with the practices of modern,mechanized irrigation farming and thus form the nucleus of future settlement schemes.In laying out concessional projects, consideration should be given to leaving parcelsor blocks of land free so that at a later date, indigenous farmers can be given theopportunity to participate in development programmes. These blocks could be used nowfor grazing in a system of integrated livestock production with irrigated farming.Some of the crop plans have been designed to include production of forage and pasturewith the object of fattening livestock raised on natural pastures and scrub land.
The Imperial Ethiopian Government seems to favour the principle of concession-aire farming and quoted below is an extract from the Second Five Year Plan (1962-1967):
"Commercial Farms
28. Although significant development of the peasant sector has been foreseen, itwill not be possible to realize the production targets in peasant agricultureexclusively. Important production targets will have to be realized on the big moderncommercial farms. This sector will have to produce large quantities of raw materialfor the domestic industry such as cotton and.other fibres, vegetables, fat cattle forthe meat packing and canning industry, etc. as well as to ingrease production and

167
improve the quality of products intended for export. The commercial farms will haveto produce better quality seeds and breeding cattle for the development of peasantagriculture. They will have to ensure the rational use of investment funds for thecultivation of wasteland in developing new regions, such as the Awash Valley, WabiShebelli Valley, etc.
There may be several types of such farl_s according to ownership: cooperativofarms, farms owned by Ethiopian citizens or companies, farms organized by foreignconcerns on the basis of concessions granted, mixed companies, public farms andothers. The development of various types of farms will be encouraged, organized orsupported by the Government.
The Government will help and stimulate, by all convenient, economic and othermeasures, the establishment and development of big private commercial farms. The
existing land tenure system should not be allowed to interfere with the organizationof large modern farms. Those who are interested will be granted Government land ona longterm lease at a low rent with the provision that they are obliged to startproduction at the latest within three years after obtaining the land and to cultivate
all the granted land at the latest within five years in the manner agreed upon. Larid
obtained in this manner must not be subleased. The person who organizes a commercialfarm on his own land should be exempted from taxes for five years. Special privilegesmay be granted to those who plant at least 40 percent of the land with cotton eachyear or who produce other fibres, particularly if they have to make larger investments
per hectare in order to reclaim the land for production. Measures have to be taken
so that the banks grant supervised credits at favourable terms for the promotion of
commercial farms.
Special attention will be devoted to the establishment of public and cooper-
ative largescale farms. The largest part of the production targets assigned to thelarge commercial farms, particularly in this beginning phase, should be carried out
by the public and cooperative farms. The very existence of these farms will be of
extreme importance bota for the introduction of more advanced farming methods on the
peasant holdings in the surrounding areas, and for inducing the entrepreneurs to
invest their capital in the 'large scale farm projects.
The following basic principles should guide the organization and operation
of the public and cooperative farms:
The farms will have to be built up as business organizations which will
fully respect the rules of rational and economically sound business management. The
workers should be paid according to the performance of their work. The organization
of work and the methods of remuneration should be such as to develop an interest in
the employees to increase labour productivity, utilize more efficiently the technical
means, protect the property of the farm, etc.
A possible degree of uptodate mechanization has to be introduced onthe farms; especially operations which ensure qualitative and timely agrotechniquesshould be mechanized. Yet, owing to the shortage of available capital on one hand,and ample resources of labour on the other, the labourintensive methods ofproduction s.-,ould be given priority whenever they prove economically justified.
Special attention has tc be devoted to the working out of procedureswhich will most facilitate the procurement of land for farm establishments. It
appears that in the practice of the Government, taking up land on a longterMconcession offers the best possibility for a speedy development of largescale co-operative and public farms. These policies should be favoured, particularly aspayments for the concessions are very small at present, and at the same time this
legal status of the occupancy of land would be very guitable to the business characterof the farms.
- 168 -
(4) In view of the need to provide for new settlements as well as forresettlements of the population on agricultural land, the programme has to be soworked out that it will meet the demand for labour which will increase in propertionto the establishment and expansion of large scale cooperative farms. The experiencealready gained has shown that there exists a high degree of mobility of labour thatis always ready to move to places wherever the opportunities for a gainful employmentare opened to them."
Throughout this appraisal report, reference has been made to concessionaireor large scale farms and small (settlement) farms. For rapid development of virginlands, there is no doubt that the large commercial enterprises initially will producethe most income, but from a social point of view it seems highly desirable to have aproportion of the available land allotted to small farmers backed by a sound extensionservice to supervise the use of credits and technical assistance either from Govern-ment or from established concessionaires. The Tendaho Plantation Share Companyassists small farmers (outgrowers) in the Lower Awash in the production of cottonby providing certain services such as land levelling, ditching, ploughing andspraying at cost rates. Ginning facilities are made available by the Company, whichbuys the cotton at contract prices. The Imperial Government encourages the principlesof community development, and settlement in the Awash Valley of groups of smallfarmers would be an ideal region to put these principles into practice. The AwashValley Authority is now working on a pilot scheme for the settlement of 50 farmersin Lower Awash, but similar projects should be considered in other areas. In thiseconomic assessment, due allowance has been made for the inclusion of small farmersto take part in the development programme.
Because of existing settlement by irrigation farmers and the current influxof new farmers (some of them recently nomads) attracted by the developing localcotton economy, five sevenths (5/7) of the irrigable hectarage have been allocatedto small farms in the Lower Awash computations. Owing to the sparse population inthe Middle Awash, calculations have been based on only one fifth (1/5) settlementby small farmers.
While Ethiopia as a whole has land tenure problems, it is ccnsidered thatbecause of the under population in the Awash Valley, settlement in the first placeby large scale commercial farm enterprises, the usual landlordtenant difficultieswill not arise. The tribal nomads enjoy certain grazing rights by occupation, butprovided they have access to water, their way of life can continue undisturbed.Assistance might be given them by providing watering points on the river, or fromcanal extensions, ponds or wells.
A new road is under study which would link Nazareth, Awash Station andGewani with Tendaho on the right bank of the Awash River. This road would openup the Valley and provide a desirable marketing outlet for agricultural produce.It may also have considerable influence on the sparse indigenous population whomight gradually enter the economy of-the Valley and adopt the hab'ts of modern society.
AWASH VALLEY AUTHORITY
The Awash Valley Authority was set up by Charter as an autonomous body underthe Imperial Ethiopian Government. It has the task of developing and administeringthe land and water resources throughout the Valley, but there is a conflict ofinterest in regard to water as the Ethiopian Electric Light and Power Authorityutilizes the Awash River for hydroelectric energy and draws the entire revenue fromsales of electricity.

-169
The Awash Valley Authority is dependent on a meagre Treasury budget and hasinsufficient finances to build up a competent technical staff with which to implementlargo scale development. Until the Authority provides services, e.g. provision ofdams, headworks and canals, it is difficult to set up water charges from which toderive sufficient revenue for continuing development. Recently, nominal water rateshave been negotiated with the concessionaires now operating and using irrigationwater from the Awash River, but fixed initial periods have been agreed when no chargeswill be made, in order to allow the farm enterprises to become established. Thus theAuthority still lacks necessary current funds; even future revenues will be inadequateto finance dams and irrigation layouts as envisaged in this feasibility study. Thus,it will be incumbent upon the Imperial Ethiopian Government to assist the Authoritynot only in its primary investments, possibly with financial aid from internationalsources, but also provide additional funds for administrative and technical personnelduring the first decade of development.
In addition to ldck of funds, the Awash Valley Authority is short of therequired professional personnel to carry out its functions. Expertise is necessaryto devise and levy adecuate water rates, to establish a competent technical andoperstional service able to deal with the complex problems of water apportioningand its controlled distribution; to plan and supervise the construction of anefficient and coordinated irrigation system and its maintenance and operation aftercompletion.
In order to carry out its responsibilities, the Authority must also providemarket analyses, domestic and foreign, of commodities which will give farmers thehighest net returns and add most to the national economy. To supplement this, theextension service programme should be expanded to assist the farmers, not only withtheir fertilizer and soil management problems, seed selection and cropping practices,but also with their credit dnd marketing problems.
Additional financial assistance to the kwash Valley Authority should bedependent on sufficient professional experts being made available, preferably withadministrative authority, to help fulfil the functions which this autonomous bodywas set up to do.
PRIORITIES OF DEVELOPMENT
While it is the responsibility of the Imperial Ethiopian Government to decideupon the order and rate of development, the folloing and other points are importantin determining the priorities of various projects. Eac4 point is relevant to eachphase of the overall project irrigation, hydroelectric power, and flood controlTheir coordination will provide the basis for a more logical final judgement.
What are the major problems, which each phase of the project and each areaproject will help to solve? Economic? Social?
Which problems are most urgent and how long will it take to solve them?0
Are the problems primarily social or economic? Local? Regional? National?
What is the financial (including credit) situation of the Government? Farmers?
What are the relative returns on these proposed investments when comparedwith alternative investment possibilities? To the Government? To the farmer?
In the shortrun and the longrun?

- 170-
Will the Total Awash Project add more to the long-run productive capacitY of
the nation than alternative projects? Which of the Area projects in theAwash Valley will add most to the productive capacity of the region and thenation?
Among various areas, which projects will produce the greatest gross value of
crops and show the largest return? To the farmer? To the national economy?
Which project will produce the greatest social gains? Affect the largest
number of people?
In which area can development be started most easily and give greatest results?
At the least cost? Give the highest ieturns per dollar invested?
The answers to these and oth,,r questions will assist in arriving at decisionsrelative to priorities among the various areas of this total project and between thisproject and other alternative uses of government funds, credit and personnel.Although there are many ways to develop the Awash Valley, they may be generalizedunder the following three approaches:
Allow the agricultural development to continue on a piecemeal basis withoutany over-all plan for future land or water use.
Make a major "Crash Programme" to develop the whole project in a very shortperiod of time, perhaps 5 to 10 years.
Develop a 10 to 25 years over-all plan but carry it out in stages to utilizethe land and water which will give the quickest and highest net returns -without damage to the land and with due regard to any social problem of thearea.
Until recently, the first "piecemeal" approach has characterized the methodof development followed in the Awash Valley. The building of Koka Dam and thesigning of agreements with Wonji Sugar ilstates and the Tendaho Plantation ShareCorporation put an end to this "no-planning" stage. However, the development of theremaining land in the valley has continued on a piecemeal basis without regard to
water rights, water usage or future water needs. Recent agricultural developmentshave pointed up the desirability and the necessity of an over-all plan for the useof the limited water resources of the Awash Valley in order to obtain the largestlong-run economic and social benefits for the region. It was for this reason thatthe Awash Valley Autaority was set up and the Awash Basin Survey conducted.
The pecond approach, involving a "Crash Programme", to develop the wholeregion through a 5 to 10 year programme, lacks reality. The basic factors ofurgency which Kould require this approach are lacking. First, there is no greatfood problem facing the nation. Second, there is no great population pressure uponthe land. Third, there is no great social pressure by the people for land reformand land settlement schemes. However, the major problem is one of long timeeconomic development projects which will place greater emphasis upon productiveprojects. Such projects would assist in meeting the balance of trade and debtservicing problems of the nation in the decades ahead.
While a crash programme might worsen the financial situation temporarilythe real obstacle is the lack of sufficient, trained and exFerienced personnel toplan, supervise and execute such a programme.
- 171 -
The third approach to development would seem to be the most logical, fromboth an economic and social viewpoint, for the Awash Valley. In this approach, thevarious areas of the Valley must be analyzed and compared. If the most urgent majorproblem toward which this project is directed is economic, i.e. helping to solve thedebt servicing problem, then the major criteria for priority in the selection of theindividual area projects should be the economic yardstick, i.e. the benefit-costratios. These ratios may be modified by some shift in cropping plans, but the over-all long run plan of agricultural production and crop rotations must be kept in mind.
The Government may be cognizant of urgent political and social prcblems inspecific areas which will modify the purely economic approach. A balance betweenthe two approaches may be most effective. The economic approach may fit one segmentof the Valley, the Middle Awash for instance, while more emphasis will need to begiven to the social approach in another segment, such as the Lower Awash.
The data compiled in this report indicates that the Middle Awash area willmake the greatest contribution to the national economy and thus should be given toppriority. Of this segment, the area above Awash Station and the Melka-Sedi projectsaow the highest benefit-cost ratios. In these areas the extra cost of makingirrigation water available, through small diversion dams, is lowest. The 'costs ofthe irrigation system land clearing and land levelling are also the least. Here,the market outlets are best and the transportation costs lowest.
Data on the Amibara project were not computed but irrigation investmentcosts and project location would probably give it second priority on an economicbasis. Bolhamo, Angelele and Kesem-Kebena would follow in that order. Additionaldata is needed before the Maro-Gallo area can be classified. Although the saiftingof high value crops to any of these areas could change the benefit-cost ratio, thelocation, topogr,Iphy, soils and total market outlet for these crops become limitingfactors.
In the Lower Awash, the large dam, dikes and pumps necessary for fulldevelopment, and the unsuitability of the soils for many of the highest value crops,caused the benefit-cost ratio (although favourable) to be much lower than the MiddleAwash. But here the social and political problems are much more important. Withthis in mind, the Government may consider them sufficiently important tc proceed withthis project concurrently with the first high priority projects in the Middle Awash.
This is especially true since the dam and dike construction will delay starting the
farming operations an additional year or two beyond that of the less costly projects
upstream.
But the highest priority should be given to the development of a small but
competent administrative and technical staff:
To develop a long-time land and water use plan far the Awash Vaney.
To assist farmers and government agencies in carrying out the plan by
providing guidance: in small farm irrigation systems, fitting crop plans to
soils, water requirements of various crops, cropping practices and market
outlook for major crops.
To develop a system of water us4. charges and other means of financing the
administrative, technical and supervisory personn41 required for the
maintenance and operation of the irrigation distribution system.
Relating each new agricultural development to the long-time land and water
use plan for the Valley.

172
In summary, this analysis of the preliminary Awash Basin Survey indicatesthat the Total Awash Project is economically soand and can make important contribu-tions towards the solution of economic and social Problems, regionally and nationally.The Middle Awash Project can make the largest economic contribution within the regionto assist the national debt servicing problem and to develop industry based onagricultural production; government policy should give priority in this area to theindividual projects and crops which can best serve the national economy. While theLower Awash Project might contribute towards the nation economy to a lesser degree,there are local social and political problems which may be solved by its earlydevelopment.

- 173 -
EXTRACT FROM APPENDIX IIITABLE 39
COMPARISON OF BENEFIT-COST RATIOS, SPECIFIED AREAS BY
CROPPING PROGRAMMES AT DIFFERENT INTEREST RAPES
Note I:
HVC: Citrus - 500 ha; Bananas - 500 ha; Sisal - 1,000 ha.LF: 4,700 ha; SF: 1,000 ha.EVO: Citrus - 300 ha; Bananas - 300 ha; Sisal - 500 ha. LF - 2,300 ha
SF - 900 ha.HVC: Citrus - 500 ha; Bananas - 500 ha. LF: 11,600 ha. SF: 3,200 ha.
HVC: Citrus - 2,500 ha; Bananas - 2,500 ha; Sisal - 2,000 ha;
Sugar cane - 5,600 ha; Vegetables - 100 ha.HVC: Sugar cane - 5,600 ha; Sisal - 2,000 ha.
Areas and General Crops orHectares in Crops HVC under Negotiation
Specified Areas inHigh Value Crops
1. Lower Awash 63,000 ha.
In Ratio to 1.0 In Ratio to 1.0
Rate 6 Rate 4 Rate 6 Rate 4
(1) LF* - 18,000 ha; SF* - 45,000 ha. 1.3 1.6(2) LF - 50,500 hal SF - 12,500 ha. 1.6 2.0
2. Melka-Sedi 7,700 ha. 2.7 3.4 6.5(a) 8.2(a)
3. Angelele 4,300 ha. 1.8 3.5(h) 4.2(b)
4. Kesem-Kebena 15.800 ha. 0.7 0.9 1.2(c) 1.6(c)
5. Middle Awash (No Dams) 38,000 ha. 2.4(e) 3.2(e) 5.5(d) 7.0(d)
6. Total Middle Awash(With Dams) 72,000 ha. 1.4(e) 1.9(e) 2.4(d) 3.0(d)
7, Total Awash 135,000 ha.
(1) LF - 65,800 ha; SF - 56,500 ha; HVC* - 12,700 ha. 2.0 2.4(d)2.1(2) LF - 97,800 ha; SF - 25,000 ha; HVC - 12,700 ha. 2.7(d)
(3) LF - 70,900 ha; SF - 56,500 ha; HVC - 7,600 ha. 1.3(e) 1.7(e)
(4) LF - 102,400 ha; SF - 25,000 ha; EVO - 7,600 ha. 1.5(e) 1.9(e0

Note II:
Area No.Area No.Area No.Area No.Area No.Area No.
Area No.
- 174-
TABLE 39 (Cont'd)
Lower Awash (General Crops)Melka Sedi (General Crops): LF - 6,000 ha; SF - 1,700 ha.Angelele (General Crops): LF - 3,400 ha; SF - 900 ha.Kesem-Kebeba (General Crops): LF - 12,600 ha; SF - 3,200 ha.Middle Awash, No Dams (General Crops): LF - 20,600 ha; SF - 4,700 ha
" With Dams (General Crops): LF - 53,000 ha;
SF - 11,400 ha.7(3) and 7(4) include only sugar cane and sisal on Metahara.
Ratios which are included in Table C are underlined.
* LF - Large Farms; SF - Small Farms; (General Crops): HVC - High Value Crops

GENERAL
C. Conti Rossini Etiopiapii genti d'EtiopiaFranchetti Nella DancaliaNesbitt Desert and forestW. Thesiger The Awash River and the Aussa SultanatoCecchi Da ZeilaBorelli Voyage dans les Galias du Sud et le pays de SydamaMapping and Geography Institute Awash River Basin geographical names
G'-'2N)LOGY
G. DainelliG. Stefanini
P.A. Mohr
P.A. MohrH.A. Quinn
SOILS AND VEGETATION
U.S. DeparIment of Agriculture Soil classification 7th approximationMurphy The fertility status of some soils in EthiopiaSOGREAH Soils in the Dubti, Dit Bahri and Melka Sedi areas
Three interim reportsPichi, Sermolli Una carta geobotanica dell'africa OrientaleJ.M. Rattray Tapis graminéens d'AfriqueC.C.T.A. Phytog6ographie
CLIMATE, HYDROLOGY
F. FournierM. VisentiniE.N. Meneely
AGRICULTURE
H.P. HuffnagelG.W. Uhlenbrock
D. and I. Lalevich
H.V.A. EthiopiaW.R.D. Israel
- 175 -
BIBLIOGRAPHY
Geologia dell'Africa OrientaleSaggio di una carta geologica dell'Eritrea, dellaSomalia e dell'Etiopia, alla scala di 1:2,000,000
Report on a geological excursion through southernEthiopia
The geology of EthiopiaThe mineral industry of Ethiopia in 1962, withnotes on some mineral deposits and special projects.
Climat et érosionNotizie idrografiche sull'Africa OrientaleUSOM Ethiopia Hydrology
Agriculture in EthiopiaBackground information on cotton in Ethiopia, with
respect to the Project 1955-1959 EC
Agricultural development possibilities of theAwash River Valley
Some facts about the Wonji and Shoa sugar estates
Metahara Project Master plan for the developmentand management of the estate

HYDRAULIC AND AGRICULTURAL DEVELOP1LENT
M. Bruni
K.B. AmundsenD. Jovanovic
.Reparations OfficeEELPAEELPASOGREAH
SOGREAH
L.G. Allbaugh, R.M. Arbuckle
- 176-
Progetto italiano per l'impianto di Coca sul flumeAuasc in Ethiopia
Koka kraftanleggReport for hydroelectric possibilities along theAwash Valley
Koku damElectricity in EthiopiaAwash hydroelectric ProjectExpert appraisal of river hydraulics phenomena
as they affect the delta area.Sur les possibilités de développement hydraulique
et agrioole dans la vall6e moyenne de l'aouache(Ethiopie)
Feasibility report on development of irrigatedagriculture and hydroelectric power of the AwashRiver *Basin (Ethiopia)
Litogralia TILLI - Pon..


