Embed Size (px)
Citation preview

OPEN SECTION PAGE CORP 7\1
OPEN SECTION PAGE CORP 7\1
Reports, recommendations and supporting documentation can be accessed via the Darwin City Council Website at www.darwin.nt.gov.au, at Council Public Libraries or contact Linda Elmer on (08) 89300 670.
DARWIN CITY COUNCIL
CORPORATE & ECONOMIC DEVELOPMENT COMMITTEE
TUESDAY 20 JULY 2010
MEMBERS: Member K M Moir (Chairman); The Right Worshipful, The Lord Mayor, Mr G R Sawyer; Member R Dee; Member G A Lambert; Member F P Marrone.
OFFICERS: Chief Executive Officer, Mr B P Dowd; General Manager Corporate Services, Mr F Crawley; Executive Manager, Mr M Blackburn; Manager Business Services, Mr L Carroll; Acting Manager Employee Relations , Mr G Raddatz; Manager Information Technology, Mr R Iap; Manager Finance, Ms K Stidworthy; Manager Corporate Information, Ms L Hempsall, Acting Manager Communications & Marketing, Ms M Dowley; Committee Administrator, Ms L Elmer.
Enquiries and/or Apologies: Linda Elmer E-mail [email protected] - PH: 89300 670 OR Phone Committee Room 1, for Late Apologies - PH: 89300 519
Committee's Responsibilities
* City Centre Management * Property Services * Financial Services * Records Management * Human Resources Management * Risk Management * Management Information Systems * Tourism
* * * I N D E X * * * PAGE
1 MEETING DECLARED OPEN......................................................................3
2 APOLOGIES AND LEAVE OF ABSENCE...................................................3
3 ELECTED MEMBERS CONFLICT OF INTEREST DECLARATION ...........3
1
1

OPEN SECTION PAGE CORP 7\2
OPEN SECTION PAGE CORP 7\2
Reports, recommendations and supporting documentation can be accessed via the Darwin City Council Website at www.darwin.nt.gov.au, at Council Public Libraries or contact Linda Elmer on (08) 89300 670.
4 CONFIDENTIAL ITEMS ...............................................................................3
5 WITHDRAWAL OF ITEMS FOR DISCUSSION ...........................................4
6 CONFIRMATION OF MINUTES PERTAINING TO THE PREVIOUS CORPORATE & ECONOMIC DEVELOPMENT COMMITTEE MEETING ...............................................................................4
7 BUSINESS ARISING FROM THE MINUTES PERTAINING TO THE PREVIOUS CORPORATE & ECONOMIC DEVELOPMENT
COMMITTEE MEETING
7.1 Business Arising ........................................................................................4
8 INFORMATION ITEMS.................................................................................5
9 ACTIONS ITEMS..........................................................................................5
10 OFFICERS REPORTS
10.1 Corporate Services Monthly Report -June 2010 ..........................................610.2 Listing of Cheques/EFT Payments, June 2010 ..........................................1910.3 Financial Report to Council - June 2010 ....................................................3410.4 Monthly On-Street and Off-Street Parking Statistics – June 2010 .............6410.5 Invitations Accepted or Declined by the Lord Mayor during June 2010 .....7110.6 Register of Elected Members Professional Development Activities and Lord Mayor Donations/ Grants from April to June 2010 ......................7510.7 Walkways Update.......................................................................................79
11 GENERAL BUSINESS ...............................................................................82
2
2

OPEN SECTION PAGE CORP 7\3
Corporate & Economic Development Committee Meeting – Tuesday, 20 July 2010
OPEN SECTION PAGE CORP 7\3
1 MEETING DECLARED OPEN
2 APOLOGIES AND LEAVE OF ABSENCE
2.1 Apologies
2.2 Leave of Absence Granted
Nil
3 ELECTED MEMBERS CONFLICT OF INTEREST DECLARATION
4 CONFIDENTIAL ITEMS
Nil
3
3

OPEN SECTION PAGE CORP 7\4
Corporate & Economic Development Committee Meeting – Tuesday, 20 July 2010
OPEN SECTION PAGE CORP 7\4
5 WITHDRAWAL OF ITEMS FOR DISCUSSION
COMMITTEE’S DECISION
THAT the Committee resolve under delegated authority that all Information Items and Officers Reports to the Corporate & Economic Development Committee Meeting held on Tuesday, 20 July 2010, be received and all recommendations contained therein be adopted by general consent with the exception of Item Number ......
DECISION NO.20\() (20/07/10)
6 CONFIRMATION OF MINUTES PERTAINING TO THE PREVIOUS CORPORATE & ECONOMIC DEVELOPMENT COMMITTEE MEETING
COMMITTEE’S DECISION
THAT the Committee resolve that the minutes of the previous Corporate & Economic Development Committee Meeting held on Tuesday, 22 June 2010, tabled by the Chairman, be confirmed as a true and correct record of the proceedings of that meeting.
DECISION NO.20\() (20/07/10)
7 BUSINESS ARISING FROM THE MINUTES PERTAINING TO THE PREVIOUS CORPORATE & ECONOMIC DEVELOPMENT COMMITTEE MEETING
7.1 Business Arising
4
4

OPEN SECTION PAGE CORP 7\5
Corporate & Economic Development Committee Meeting – Tuesday, 20 July 2010
OPEN SECTION PAGE CORP 7\5
8 INFORMATION ITEMS
Nil
9 ACTION ITEMS
Nil
5
5

ENCL: NO DARWIN CITY COUNCIL
DATE: 09/07/10 REPORT
TO: CORPORATE AND ECONOMIC DEVELOPMENT COMMITTEE / OPEN
APPROVED: FC
FROM: GENERAL MANAGER CORPORATE SERVICES
REPORT NO.:
10A0112
COMMON NO.:
339108
SUBJECT: CORPORATE SERVICES MONTHLY REPORT – JUNE 2010
ITEM NO: 10.1
SYNOPSIS:
This report provides Aldermen with an overview of Corporate Services Operations for June 2010.
GENERAL:
INFORMATION TECHNOLOGY
In June the Information Technology Section continued working on the Server and Storage and Network infrastructure projects. These projects are to upgrade Council's current server, storage and networking hardware, including a new server pool, network storage and networking switches. This major project is still early in its implementation with completion date to be approximately October 2010.
The Information Technology Section also continued on its ongoing projects including the Information Technology Strategic Plan, the Information Security Framework, WiFi in The Mall, and Audit Committee projects.
RECORDS
The Corporate Information Section has received further feedback from the NTG concerning our Records Disposal Schedule. It is hoped to respond to the feedback and have the schedule approved mid-August.
6
6

PAGE: 2 REPORT NO: 10A0112 SUBJECT: CORPORATE SERVICES MONTHLY REPORT – JUNE 2010
FINANCE
During June Finance accomplished a number of objectives with the key ones being: � Adoption of the 2010-11 Budget � End of Financial Year Rollover � Production of Employee Payment Summaries
In addition, staff have been very busy getting ready for 30 June. At this time of year capital works projects are being finalised, invoices are being issued for the following financial year and budgets are being prepared to upload in the new year.
Employee Payment Summaries were available for staff to collect on 30 June despite the fact that the last pay run was processed on that day as well. This is a credit to the Payroll staff, Zoe and Deanna, who deliver an excellent payroll service to the organisation.
One of the Assistant Accountants left in June to take on a higher position at another organisation and advertising for this position had just closed as at 30 June.
7
7

PAGE: 3 REPORT NO: 10A0112 SUBJECT: CORPORATE SERVICES MONTHLY REPORT – JUNE 2010
WORKFORCE STATISTICS – June 2010
Gender Actual FTE % FTE Female 122 40% Male 180 60% Grand Total 302 100%
Employee Status Actual FTE % of FTE Contract 17 5.6% Ltd Tenure 15 4.8% Perm. Full/Time 246 81.6% Perm. Part/Time 17 5.6% Temp/Casual 1 0.3% Trainee 6 2.0% Grand Total 302 100.00%
0
20
40
60
80
100
120
140
160
180
No.
of S
taff
Employee Establishment by Department
Approved FTE 16 58 79 173
Actual FTE 13 56 75 158
CEO Corporate ServicesCommunity & Cultural
ServicesInfrastructure
8
8

PAGE: 4 REPORT NO: 10A0112 SUBJECT: CORPORATE SERVICES MONTHLY REPORT – JUNE 2010
0
20
40
60
80
100
120
140
No.
Of S
taff
Employee Gender by Department
Female 9 33 49 31
Male 4 23 26 127
CEO Corporate ServicesCommunity &
Cultural Services Infrastructure
0
50
100
150
200
250
No. o
f Sta
ff
Employee Population by Classification
Actual FTE 17 15 246 17 1 6
% FTE 5.6% 4.8% 81.6% 5.6% 0.3% 2.0%
Contract Ltd Tenure Perm. Full/Time
Perm. Part/Time
Temp/Casual Trainee
9
9

PAGE: 5 REPORT NO: 10A0112 SUBJECT: CORPORATE SERVICES MONTHLY REPORT – JUNE 2010
EMPLOYEE RELATIONS
Total Employee Turnover 2009/10
Total Employee Turnover by Percentage 2009/10
JUL AUG SEP OCT NOV DEC JAN FEB MAR APR MAY JUNE TOTALActual for month 5 2 5 0 3 7 4 1 3 6 1 2 39 Average 2008/09 4.5 4.5 4.5 4.5 4.5 4.5 4.5 4.5 4.5 4.5 4.5 4.5 54
JUL AUG SEP OCT NOV DEC JAN FEB MAR APR MAY JUNE TOTALActual for month 1.5 0.6 1.5 0 0.92 2.09 1.19 0.03 0.89 2.01 0.03 0.06 10.82 Average 2008/09 1.05 1.05 1.05 1.05 1.05 1.05 1.05 1.05 1.05 1.05 1.05 1.05 12.60
TOTAL EMPLOYEE TURNOVER(Permanent Full / Part Time)
0
2
4
6
8
10
12
JUL AUG SEP OCT NOV DEC JAN FEB MAR APR MAY JUN
Num
ber o
f Em
ploy
ees
2008/09 Average
TOTAL EMPLOYEE TURNOVER(Percentage of Workforce)
0
0.5
1
1.5
2
2.5
JUL AUG SEP OCT NOV DEC JAN FEB MAR APR MAY JUN
Perc
enta
ge o
f Wor
kfor
ce
National Average 2008/2009
10
10

PAGE: 6 REPORT NO: 10A0112 SUBJECT: CORPORATE SERVICES MONTHLY REPORT – JUNE 2010
Employee Turnover by Department – Year To Date
EMPLOYEE TURNOVER BY DEPARTMENT - YEAR TO DATE
0
2
4
6
8
10
12
14
Corporate Community Infrastructure ESU
No o
f Em
ploy
ees
% Employee Turnover by Department – Year to Date
PERCENTAGE EMPLOYEE TURNOVER BY DEPARTMENT - YTD
0
2
46
8
10
1214
16
18
Corporate Community Infrastructure ESU
Perc
enta
ge o
f Em
ploy
ees
Corporate 10
Community 14
Infrastructure 13
ESU 2
Corporate 16.9
Community 16.5
Infrastructure 7.42
ESU 12.5
11
11

PAGE: 7 REPORT NO: 10A0112 SUBJECT: CORPORATE SERVICES MONTHLY REPORT – JUNE 2010
TRAINING AND DEVELOPMENT
Training Cost per Employee 2009/10
Net Direct Training Cost Per Employee
NET DIRECT TRAINING COST PER EMPLOYEE 2009 - 2010
0
50
100
150
200
250
300
JUL AUG SEP OCT NOV DEC JAN FEB MAR APR MAY JUN
NET
CO
ST $
ACTUAL NET DIRECT COST
PERFORMANCE TARGET
AVERAGE TRAINING HOURS PER EMPLOYEE 2009 - 2010
00.5
11.5
22.5
33.5
44.5
5
JUL AUG SEP OCT NOV DEC JAN FEB MAR APR MAY JUN
HO
URS
ACTUAL TRAINING HOURS
NATIONAL AVERAGE (ABS)
12
12

PAGE: 8 REPORT NO: 10A0112 SUBJECT: CORPORATE SERVICES MONTHLY REPORT – JUNE 2010
Internal & External Training Comparison 2009/10
INTERNAL / EXTERNAL TRAINING COMPARISON 2009 - 2010
0
20
40
60
80
100
120
140
160
JUL AUG SEP OCT NOV DEC JAN FEB MAR APR MAY JUN
No.
OF
PAR
TIC
IPA
NTS EXTERNAL
INTERNAL
Training Activities by Category and Department 2009/10
TRAINING ACTIVITIES BY CATEGORY 2009/10 NUMBER OF EMPLOYEES CATEGORY JUL AUG SEP OCT NOV DEC JAN FEB MAR APR MAY JUN TOTAL
ONGOING HIGHER EDUCATION 13 13 13 14 15 15 15 17 19 19 18 18 189 ONGOING VET 10 12 11 19 9 9 10 12 14 15 12 14 147 LEADERSHIP DEVELOPMENT 18 1 0 0 0 0 0 0 0 0 0 0 19 OH&S 35 8 54 14 132 2 22 55 26 6 85 6 445 TECHNICAL 0 2 2 0 17 0 0 22 0 0 1 0 44 OPERATOR 0 0 0 0 12 29 0 0 0 0 1 0 42 INDUCTION 0 12 0 0 8 0 0 14 0 0 14 0 48 ADMINISTRATION 40 24 15 2 2 20 1 14 15 13 15 5 166 TRAINEES 5 4 4 4 5 5 5 5 5 5 6 6 59 TOTAL EMPLOYEES 121 76 99 53 200 80 53 139 79 58 152 49 1159
TRAINING ACTIVITIES BY DEPARTMENT 2009/10 NUMBER OF EMPLOYEES DEPARTMENT JUL AUG SEP OCT NOV DEC JAN FEB MAR APR MAY JUN TOTAL INFRASTRUCTURE 73 31 71 37 174 45 33 70 36 32 77 25 704 CORPORATE SERVICES 14 14 11 18 5 8 7 23 15 10 32 8 165 COMMUNITY & CULTURAL SERVICES 24 25 21 0 21 27 13 42 28 16 39 14 270 ESU 5 2 1 2 0 0 0 4 0 0 4 2 20 TOTAL EMPLOYEES 116 72 104 57 200 80 53 139 79 58 152 49 1159
13
13

PAGE: 9 REPORT NO: 10A0112 SUBJECT: CORPORATE SERVICES MONTHLY REPORT – JUNE 2010
RISK / OH&S
Workers CompensationNo new claims for reporting period.
ISR/Public LiabilityNo new claims for reporting period.
Vehicle Accident ClaimsNo vehicle accident claims for reporting period.
OHS Incidents1 x OHS incident for reporting period � Injury to forearm – Libraries – NLTI
Plant and Equipment Damages1 x plant damage for reporting period � Damage to polesaw
VandalismTotal cost of vandalism for June $4,810.55 Two areas over $500 in the reporting period: � $1,845.40 – Urban Bushland Maintenance � $590.53 – Water Gardens Maintenance
14
14

PAGE: 10 REPORT NO: 10A0112 SUBJECT: CORPORATE SERVICES MONTHLY REPORT – JUNE 2010
Year to Date Public Liability Claims Received / Paid 2009/10
YTD PUBLIC LIABILITY CLAIMS RECEIVED / PAID 2009-10
02468
101214161820
2009/10 2008/09 2007/08 2006/07 2005/06
Num
ber
Received
Paid
OH&S Incidents 2009/10
OHS INCIDENTS 2009/10
0
0.5
1
1.5
2
2.5
3
3.5
4
4.5
JUL
AUG
SEP
OCT
NOVDE
CJA
NFE
BMAR AP
RMAY JU
N
Num
ber
Reported
Average 2008/09
OHS Incidents JUL AUG SEP OCT NOV DEC JAN FEB MAR APR MAY JUN TOTALReported 1 1 4 2 3 0 1 1 0 1 2 1 17Average 2008/09 3 3 3 3 3 3 3 3 3 3 3 3 36
YTD Public Liability Claims Received / Paid 2009/10 2008/09 2007/08 2006/07 2005/06Received 18 11 15 19 16 Paid 6 3 4 7 7
15
15

PAGE: 11 REPORT NO: 10A0112 SUBJECT: CORPORATE SERVICES MONTHLY REPORT – JUNE 2010
Plant and Equipment Damage 2009/10
PLANT / EQUIPMENT DAMAGE INCIDENTS 2009/10
0123456789
1011121314
JUL
AUG
SEP
OCTNOV
DEC JAN
FEB
MAR
APR
MAYJU
N
Num
ber
Reported
Average 2008/09
Plant / Equipment Damage Incidents JUL AUG SEP OCT NOV DEC JAN FEB MAR APR MAY JUN TOTALReported 7 3 6 4 5 0 4 2 7 1 3 1 43Average 2008/09 5 5 5 5 5 5 5 5 5 5 5 5 60
Vandalism Incidents 2009/10
VANDALISM INCIDENTS 2009/10
0
5
10
JUL
AUGSEP OCT
NOV
DECJA
NFE
BMAR
APRMAY
JUN
Num
ber
ReportedAverage 2008/09
Vandalism Incidents JUL AUG SEP OCT NOV DEC JAN FEB MAR APR MAY JUN TOTALReported 8 7 2 4 2 3 5 2 2 1 2 2 40Average 2008/09 6 6 6 6 6 6 6 6 6 6 6 6 72
16
16

PAGE: 12 REPORT NO: 10A0112 SUBJECT: CORPORATE SERVICES MONTHLY REPORT – JUNE 2010
Vandalism Costs 2009/10
VANDALISM COSTS 2009/10
0
2000
4000
6000
8000
10000
12000
JUL AUG SEP OCT NOV DEC JAN FEB MAR APR MAY JUN
Dol
lars
Actual
Average 2008/09
Vandalism Costs JUL AUG SEP OCT NOV DEC JAN FEB MAR APR MAY JUN TOTALActual 9969 7383 3018 5827 1335 6229 6846 8399 5232 6122 1277 4811 66448Average 2008/09 5500 5500 5500 5500 5500 5500 5500 5500 5500 5500 5500 5500 66000
Workers Compensation Claims 2009/10
Workers Compensation Claims 2009/10
0
1
2
3
4
AUG
SEP
OCTNO
VDE
CJA
NFE
BMAR AP
RMAY JU
N
Num
ber
Actual
Lost Time Injuries 2007/08 AUG SEP OCT NOV DEC JAN FEB MAR APR MAY JUN TOTALTarget 0 0 0 0 0 0 0 0 0 0 0 0Actual 2 1 2 0 2 2 4 1 2 1 0 17
17
17

PAGE: 13 REPORT NO: 10A0112 SUBJECT: CORPORATE SERVICES MONTHLY REPORT – JUNE 2010
Motor Vehicle and ISR Claims 2009/10
JUL AUG SEP OCT NOV DEC JAN FEB MAR APR MAY JUN TOTAL
Motor Vehicle Received 1 0 1 0 0 0 0 0 0 0 0 0 2 Motor Vehicle Paid 0 0 1 0 1 0 0 0 0 0 0 0 2
ISR Received 0 0 0 0 0 0 0 0 0 0 0 0 0 ISR Paid 0 0 0 0 0 0 0 0 0 0 0 0 0
CONTRACTS JUNE 2010
Tenders Closed in June - Under Assessment2010/120 MY0800 Darwin City Revitalisation Project Upgrade Of The Mall And
Raintree Park
Tenders Advertised in June2010/045 Hire Of Elevated Work Platform
Tenders Awarded in June2010/018 Provision Of A Temporary Labour Service 2010/101 Replacement And Maintenance Of On-Street Parking Machines In
Darwin CBD
Contracts Extended in June2009/044 Supply And Delivery Of Tyres, Tubes And Associated Services
RECOMMENDATIONS:
THAT it be a recommendation to Council:-
THAT Report Number 10A0112 entitled, Corporate Services Monthly Report – June 2010, be received and noted.
FRANK CRAWLEY GENERAL MANAGER CORPORATE SERVICES
Any queries on this report may be directed to Frank Crawley on 8930 0539 or [email protected]
18
18

ENCL: YESDARWIN CITY COUNCIL
DATE: 09/07/10REPORT
TO: CORPORATE & ECONOMIC DEVELOPMENT COMMITTEE / OPEN
APPROVED: FC
FROM: GENERAL MANAGER CORPORATE SERVICES
APPROVED: KS
REPORT NO.:
10A0113
COMMON NO.:
339125
SUBJECT: LISTING OF CHEQUES / EFT PAYMENTS – JUNE 2010
ITEM NO.: 10.2
SYNOPSIS:
This report provides Council with a listing of all payments made during June 2010.
GENERAL:
The following amounts were paid during the month of June 2010:-
1. General Fund Payments
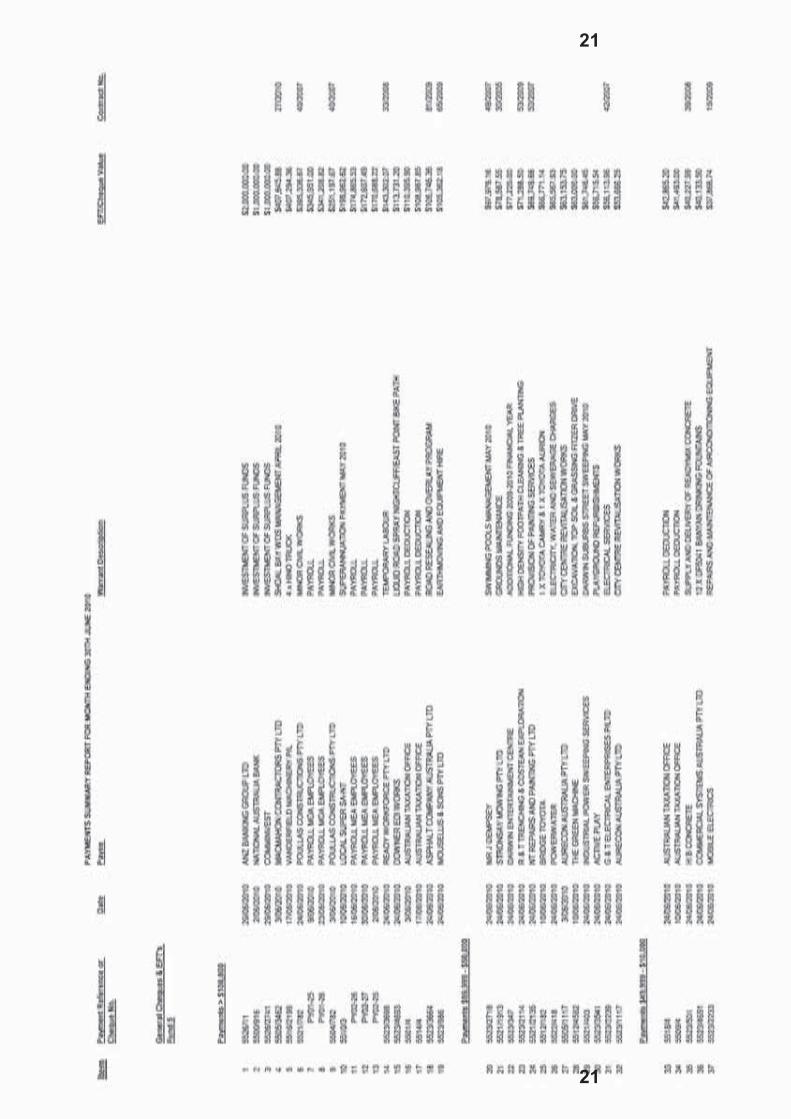
Cheque numbers 912519 to 912598 for the month of June 2010 totalling $113,955.52.
EFT / Payment Transactions Batch number 5500 to 5527 for the month of June 2010 totalling $10,429,031.64.
2. Trust Fund Cheque Payments
Cheque numbers 602796 to 602817 for the month of June 2010 totalling $3,718.00.
A detailed listing of payees and amounts supporting the total for cheques / EFT payments paid is tabled as Attachment A.
19
19

PAGE: 2 REPORT NO: 10A0113 SUBJECT: LISTING OF CHEQUES / EFT PAYMENTS – JUNE 2010
If Alderman wish to query a particular payment, a simple call to the Finance Department should be able to answer their query, otherwise the query could be taken on notice.
RECOMMENDATIONS
THAT it be a recommendation to Council -
THAT Report Number 10A0113, Listing of Cheques / EFT Payments – June 2010 be received and noted.
KELLY STIDWORTHY FRANK CRAWLEYFINANCE MANAGER GENERAL MANAGER CORPORATE SERVICES
Any queries on this report be directed to Vicki Nurton on extension 8930 0697 or [email protected]
20
20
21
21

22
22

23
23

24
24

25
25

26
26

27
27

28
28

29
29

30
30

31
31

32
32

33
33

ENCL: YESDARWIN CITY COUNCIL
DATE: 09/07/10REPORT
TO: CORPORATE & ECONOMIC DEVELOPMENT COMMITTEE / OPEN
APPROVED: FC
FROM: GENERAL MANAGER CORPORATE SERVICES
APPROVED: KS
REPORT NO.:
10A0114
COMMON NO.:
339122
SUBJECT: FINANCIAL REPORT TO COUNCIL – JUNE 2010
ITEM NO: 10.3
GENERAL:
This report provides a comparison of income and expenditure against budget for the month ended 30 June 2010.
Accrual Financial Statements
The report contains a set of accrual financial statements comparing YTD Budgets and YTD Actuals at each function level. The following statements are included –
� Income Statement - Council’s Operational Revenue & Expenses.
� Statement of Changes in Equity - Council’s transfers to and from Reserves and Accumulated Surplus.
� Balance Sheet - Council’s Assets, Liabilities and Equity.
Variance Report
Due to the timing of Committee meetings the variance report each month will be for the preceding month. The monthly variance report requires Managers to comment on any variations greater than 10% or $10,000. This variation amount is based on each programs Year to Date Budget compared to Year to Date Actual expenditure.
34
34

PAGE: 2DOCUMENT REF NO: 10A0114 SUBJECT: FINANCIAL REPORT TO COUNCIL – JUNE 2010
SYNOPSIS:
The Local Government (Accounting) Regulation 15 requires that a statement detailing all actual and forecast income and expenditure together with a statement detailing all cash held and investments is to be presented to Council each month.
GENERAL:
For the purpose of Part VI, Allocation of Moneys by Council, of the Local Government (Accounting) Regulations, expenditure is interpreted to include capital payments and income is interpreted to include capital receipts. A summary of income and expenditure as at 31 May 2010, is attached.
ACTION PLAN IMPLICATIONS:
3.2 Financial Management
Goal: To manage Council affairs based on a comprehensive financial strategy.
Strategies/Actions: Maintain effective period financial reporting systems for Management and the Council.
LEGAL IMPLICATIONS:
Regulation 15 states:-
1. The clerk shall cause to be prepared and laid before each ordinary meeting of the council a statement, in a form approved by the council, setting out –
(a) The actual income and expenditure of the council for the period from the commencement of the financial year to and including the end of the immediately preceding month;and
(b) The forecast income and expenditure for the whole of the financial year, so that the council can consider and compare both sets of figures.
35
35

PAGE: 3DOCUMENT REF NO: 10A0114 SUBJECT: FINANCIAL REPORT TO COUNCIL – JUNE 2010
The statement laid before the council must detail –
a) All cash and investments held by the Council (including its Trust Fund moneys);and
b) Such other information required by the Council.
Delegation of the task of considering the financial reports is consistent with the role and terms of reference of the Corporate & Economic Development Committee.
RECOMMENDATIONS:
THAT it be a recommendation to Council:-
THAT Report Number 10A0114 entitled, Financial Report to Council – June 2010, be received and noted.
KELLY STIDWORTHY FRANK CRAWLEYFINANCE MANAGER GENERAL MANAGER CORPORATE SERVICES
Any queries on this report should be directed to Kelly Stidworthy on 8930 0523 or [email protected]
36
36

OPERATING PERFORMANCE
30 June 2010
Operating RevenueOperating Revenue displays a positive 4% variance ($2.7M). Utility Rates & Charges has exceeded budget 15% ($1.1M) with the receipt of additional caprarking shortfall income. Fees & Charges have exceeded budget expectations 6% ($671k), largely due to Landfill Waste Receipts ($323k), Offstreet Parking ($125k), Onstreet Parking ($186k), Infringement Income ($129k), Subdivision Approvals ($73k) and Permit income ($56k). This is slightly offset by unrealisable Cable TV permit income ($67k) and below budgetresults for Recoverable Works income ($80k) and Animal Registrations ($99k).Other Income is displaying a 17% ($285k) positive variance contributed in part by Rental/Lease Income ($74k), Workers Compensationrecovery ($121) which is offset by corresponding expenditure and Walkway closure sale income ($50k). Interest Revenue has performed well exceeding budget by $523k.Note: These figures are not final and subject to changes with year end adjustments
YTD Operating & Capital Revenue
$0M $10M $20M $30M $40M $50M
Rates
Op. Grants
Other
Actual $48.70M $12.19M $5.18M $2.02M $2.45M $6.32M
YTD Budget $47.57M $11.52M $5.13M $1.50M $2.31M $9.49M
Rates Fees & Charges
Op.Grants Interest Other Cap.
Grants
Operating ExpenditureOverall operating expenditure is below target by 6% ($4.5M). Materials and Services are below budget 12% ($3.9M) and Other Expenses by 6% ($192k). Employee Costs are displaying a 2% variance ($450k).Note: These figures are not final and subject to changes with year end adjustments
Balance SheetCurrently Council's Cash at Bank and Investments total $45M, of which $25M is restricted in reserves.Community Equity for the period is $641 million and consists of -·$341 million Capital and Asset Revaluation Reserve·$25 million Reserves and ·$275 million SurplusCouncil has maintained its ability to meet all its current commitments with a working capital ratio of 8:1.
Debt repayments commenced in 2007/08 on the DEC and Animal Pound Loan. Payments totalling $454,848 comprising both principaland interest portions were made in the 2007/08 year and 2008/09 year. Final repayment for 2009/10 was transacted in May with total2009/10 payments comprising of principal repayments $143,271.39 and interest $311,575.81.
YTD Operating & Capital Revenue
Rates & Utility
Charges63.37%
Fees &Charges8%Interest
2.63%
Other3.18%
Grants & Subsidies
7%
YTD Operating & Capital Expenditure
Materials & Services
34%
CapitalExpenditure
18%
OtherExpenses
4%
Depreciation14%
EmployeeCosts27%
Operating Expenditure
$0M $5M $10M $15M $20M $25M $30M $35M
Employee Costs
Materials & Services
Depreciation
Other
Actual $21.89M $27.80M $13.35M $3.48M
YTD Budget $22.34M $31.66M $13.29M $3.67M
EmployeeCosts
Materials & Services Depreciation Other
37
37
ATTACHMENT A

Note: These figures are not final and subject to changes with year end adjustments
IT $0.89M $0.23M 25.84%
% SPENT COMMENTS
City Centre Revitalisation $7.02M $1.94M 27.64%Federal grant with approved completion date of September 2010
PROJECT BUDGET SPENT
94.81%
Footpath/Cyclepath $2.99M $2.13M 71.24%
Federal approval received, works commenced, expected completion date June 2010 in accordance with grant approval and conditions.
Black Spot $3.08M $2.92M
88.46%
Plant Replacement $1.74M $1.23M 70.69% Pro rata spending has occurred.
Reseal & Rehab $1.30M $1.15M
Council approved tender brief December 2010, on schedule with approved timetable.
Other Projects $9.81M $4.57M 46.59%Generally on track with projects to be completed in second half of 09/10.
Carparks $2.64M $0.04M 1.60%
Total Projects $29.47M $14.21M 48.23%
CAPITAL EXPENDITURE
30 June 2010
Council this period has spent $14.21 million of a $29.47 million capital budget with a further $2.7 committed on capital works.Council manages and maintains assets with a net value of $641 millionCurrently Council's capital sustainability ratio is 1.07:1.
Budget 2009/10 : YTD Capital Performance
-
5,000,000
10,000,000
15,000,000
20,000,000
25,000,000
30,000,000
$
Budget 09/10 10,105,193 29,469,322
YTD Actual 09/10 6,787,559 14,234,378
Total Capital Funding Total Capital Expenditure
YTD Capital Expenditure
Other Projects31%Carparks
0%
IT2%
Black Spot21%
Plant Replacement9%
Footpath/Cyclepath15%
City Centre Revitalisation14%
Reseal & Rehab8%
38
38

Key RatiosYTD
BudgetYTD
ActualTOTAL CASH (Total cash) $41.06M $45.42M
DEBT SERVICING RATIO(interest + principal/rate revenue) 1.13% 1.13%
REVENUE RATIO(rate revenue/total revenue) 59.46% 57.25%
DEPRECIATION FUNDING(Operating surplus before deprec/deprec) 1.49 1.78
OPERATING SURPLUS/(DEFICIT) %(operating surplus/total income) 9.72% 14.77%
LIQUIDITY RATIO(current assets/current liabs & reserves) 1.59 1.33
INTEREST COVERAGE(Operating Surplus+Borrowing Cost/Borrowing Costs) 22.03 34.44
SUSTAINABILITY RATIO(CAPEX/Depreciation) 2.22 1.07
RATES RATIO(Total Rates/Total Expenses) 67.03% 73.22%Measures Council's ability to cover its costs through its own tax revenue.Sustainability Benchmark - should be >40.00%
Sustainability Benchmark - any deficits should be <10.00%
The following Ratios were used in the ALGA National Sustainability Study of Local Government Report (2006) as measures of a Council's long term financial stability:
Interest coverage measures a Council's ability to pay interest on its outstanding debt.Sustainability Benchmark - should be >3.00
Identifies the ability to fund current liabilities and cash backed reservesSustainability Benchmark - should be >1.00
Identifies the proportion of income available to fund future works and maintain the existing assets.
Measures the net increase or decrease in Council's asset base.Sustainability Benchmark - should be >1.00
Identifies availability of cash to meet all commitments
Identifies the amount of rate revenue required to service all debts.
Identifies the dependency on rate revenue
Identifies the ability to fund depreciation
39
39

DARWIN CITY COUNCILIncome Statement30 June 2010
2009 2010 2010 2010 2010Est. Actual Budget YTD Budget YTD Actual YTD Variance
$ $ $ $ %
Revenue from ordinary activities
37,347,205 General Rates 40,081,575 40,081,575 40,113,264 0.08%6,405,803 Utility rates and charges 7,485,489 7,485,489 8,587,766 14.73%
43,753,008 47,567,064 47,567,064 48,701,030 2.38%
10,549,124 Fees and Charges 11,517,113 11,517,113 12,187,981 5.82%2,382,262 Interest 1,500,000 1,500,000 2,022,909 34.86%
12,730,504 Other 1,695,936 1,695,936 1,980,719 16.79%5,094,579 Government grants and subsidies 5,131,091 5,131,091 5,177,662 0.91%
74,509,477 Total Operating Revenues 67,411,204 67,411,204 70,070,301 3.94%
Expenses from ordinary activities
20,903,884 Employee Costs 22,335,557 22,335,557 21,885,346 -2.02%29,677,348 Materials and Services 31,663,502 31,663,502 27,798,082 -12.21%14,014,037 Depreciation and Amortisation 13,293,000 13,293,000 13,347,998 0.41%
315,025 Borrowing costs 311,576 311,576 309,458 -0.68%3,212,790 Other 3,361,577 3,361,577 3,169,815 -5.70%
68,123,084 Total Operating Expenses 70,965,212 70,965,212 66,510,699 -6.28%
6,386,393 Operating Surplus/(Deficit) before capital items (3,554,008) (3,554,008) 3,559,602 -200.16%
Other Capital Amounts
3,333,425 Capital Grants, Contributions and Donations 9,494,539 9,494,539 6,322,552 -33.41%373,901 Other capital income and (losses) 610,654 610,654 465,006 -23.85%
10,093,719 Net Operating Surplus/(Deficit) 6,551,185 6,551,185 10,347,161 57.94%
ExplanationIncome StatementThis Statement outlines:- all sources of Council's YTD income (revenue).- all YTD operating expenses incurred. These expenses relate to operations and do not include capital expenditure.However the depreciation of assets is included.The Net Operating Surplus/(Deficit) for the reporting period is a good measure of council's financial performance.This figure is determined by deducting total expenses from total revenue.
40
40

DARWIN CITY COUNCILBalance Sheet30 June 2010
2009 2010 2010 2010Est. Actual Budget YTD Budget YTD Actual
$ $ $ $Current Assets
37,896,013 Cash assets & Investments 41,058,653 41,058,653 45,424,0862,933,890 Receivables 3,673,000 3,673,000 4,300,814
138,514 Inventories 123,000 123,000 115,79940,968,417 44,854,653 44,854,653 49,840,700
Non-Current Assets604,862,595 Property, plant and equipment 541,986,509 541,986,509 594,125,164
2,871,981 Capital works in progress - - 14,169,387607,734,576 541,986,509 541,986,509 608,294,551648,702,993 TOTAL ASSETS 586,841,162 586,841,162 658,135,251
Current Liabilities8,039,211 Payables and Borrowings 5,083,000 5,083,000 6,954,8054,254,505 Provisions 4,226,000 4,226,000 4,719,652
- Interest bearing liabilities 143,000 143,000 152,91312,293,716 9,452,000 9,452,000 11,827,370
Non-Current Liabilities4,597,632 Interest bearing liabilities 4,430,000 4,430,000 4,444,719
646,293 Provisions 558,000 558,000 633,4975,243,925 4,988,000 4,988,000 5,078,216
17,537,641 TOTAL LIABILITIES 14,440,000 14,440,000 16,905,586
631,165,352 NET COMMUNITY ASSETS 572,401,162 572,401,162 641,229,665
Community Equity341,131,656 Capital and Capital Reserves 267,816,000 267,816,000 341,131,656
28,210,977 Other reserves 18,702,317 18,702,317 25,681,395261,822,719 Retained surplus 285,882,845 285,882,845 274,416,613
631,165,352 TOTAL COMMUNITY EQUITY 572,401,162 572,401,162 641,229,665
ExplanationBalance SheetThe Balance Sheet outlines what Council owns (its assets) and what it owes (liabilities) at a point in time.Council's net worth is determined by deducting total liabilities from total assets - the largerthe net equity, the stronger the financial position.
41
41

DARWIN CITY COUNCILStatement of Changes in Equity30 June 2010
2009 2010 2010 2010Est. Actual Budget YTD Budget YTD Actual
$ $ $ $
ACCUMULATED SURPLUS257,367,949 Balance at beginning of the year 269,823,000 269,823,000 261,822,719
10,093,719 Change in Net Assets recognised in the Income Statement 6,551,185 6,551,185 10,347,161
(32,742,183) Recurrent Reserve Transfers (to)/from Reserves (5,723,710) (5,723,710) (8,925,609)27,103,234 Capital Reserve Transfers (to)/from Reserves 15,232,370 15,232,370 11,172,343
261,822,719 Balance at end of the year 285,882,845 285,882,845 274,416,614
ASSET REVALUATION RESERVE267,815,763 Balance at beginning of the year 267,816,000 267,816,000 341,131,656
73,315,893 Transfers to Asset Revaluation Reserve - -Transfers from Asset Revaluation Reserve - - -
341,131,656 Balance at end of the year 267,816,000 267,816,000 341,131,656
OTHER RESERVES - CASH BACKED23,747,692 Balance at beginning of the year 16,157,000 16,157,000 28,210,97731,566,519 Recurrent Reserve Transfers to/(from) Reserves 8,925,609
(27,103,234) Capital Reserve Transfers to/(from) Reserves 2,545,317 2,545,317 (11,455,191)28,210,977 Balance at end of the year 18,702,317 18,702,317 25,681,395
631,165,352 TOTAL COMMUNITY EQUITY 572,401,162 572,401,162 641,229,665
ExplanationStatement of Changes in EquityThis summarises the change in a Council's real worth throughout the financial year.Council's net worth can change as a result of:
- a surplus or deficit as recorded in the Income Statement- an increase or decrease in the value of non-current assets resulting from a revaluation of those assets.
42
42

Program Summary
Operational Expenditure and Revenue including Capital Income 1 July 2009 to 31 May 2010
Income/Expenditure Annual Full Year Budget YTD Budget YTD Actual Commitments% Var. > 10% &
$10,000 or $100,000
$ Variance
01 - Income - - - - N/A N/A02 - Expenditure 715,804 663,101 682,420 4,950 N/A N/AGrand Total 715,804 663,101 682,420 4,950
Variance Comments:
Chief Executive Office
Income/Expenditure Annual Full Year Budget YTD Budget YTD Actual Commitments% Var. > 10% &
$10,000 or $100,000
$ Variance
01 - Income - - -3,334 - N/A N/A02 - Expenditure 1,052,355 991,734 859,791 4,249 15% 131,943 Grand Total 1,052,355 991,734 856,457 4,249
Variance Comments:Expenditure is below budget for Allowances, Air Travel ($35k), Accommodation ($35k) and Course/Workshop/Training Registration ($32k). This is partially offset by overspending in Internal Plant Hire Recharge (-$47k).
Governance
Income/Expenditure Annual Full Year Budget YTD Budget YTD Actual Commitments
% Var. > 10% & $10,000 or $100,000
$ Variance
01 - Income - - - - N/A N/A02 - Expenditure 1,086,530 994,291 1,057,845 64,653 N/A N/AGrand Total 1,086,530 994,291 1,057,845 64,653
Variance Comments:
Communications & Marketing
43
43

Program Summary
Operational Expenditure and Revenue including Capital Income 1 July 2009 to 31 May 2010
Income/Expenditure Annual Full Year Budget YTD Budget YTD Actual Commitments
% Var. > 10% & $10,000 or $100,000
$ Variance
01 - Income -43,062 -40,079 -31,130 - N/A N/A02 - Expenditure 269,430 238,827 234,124 - N/A N/AGrand Total 226,368 198,748 202,995 -
Variance Comments:
Strategic Services
Income/Expenditure Annual Full Year Budget YTD Budget YTD Actual Commitments
% Var. > 10% & $10,000 or $100,000
$ Variance
02 - Expenditure 370,570 337,232 223,494 47,939 51% 113,738 Grand Total 370,570 337,232 223,494 47,939
Variance Comments:Variance is due to unspent budget for the Environmental Management Operational Projects namely : Climate Change Response Program (+$70k); Waterway Program (+$8k); Biodiversity Program ($10k) and Air Quality Program ($2k). Also underspending in Salaries and Wages (+$10k), Advertising (+$8k); Telephone and Communication (+$2k) and Internal Plant Hire Recharge (+$1k).
Climate Change & Environment
44
44

Program Summary
Operational Expenditure and Revenue including Capital Income 1 July 2009 to 31 May 2010
Income/Expenditure Annual Full Year Budget YTD Budget YTD Actual Commitments
% Var. > 10% & $10,000 or $100,000
$ Variance
01 - Income -32,500 -32,500 -32,895 - N/A N/A02 - Expenditure 657,488 581,730 521,044 - 12% 60,686 Grand Total 624,988 549,230 488,149 -
Variance Comments:Variance is due to timing of General Manager Projects.
GM Community & Cultural Services
Income/Expenditure Annual Full Year Budget YTD Budget YTD Actual Commitments % Var. > 10% & $10,000 or $100,000 $ Variance
01 - Income -380,000 -240,000 -240,000 - N/A N/A02 - Expenditure 1,150,678 1,110,313 838,152 - 32% 272,161 Grand Total 770,678 870,313 598,152 -
Variance Comments:Constitutional review approx $50,000 yet to be paid. Additional one off 09/10 DCC operational funding $50,000 and local hirers funding $10,000 have been processed for payment in June.
Darwin Entertainment Centre
Income/Expenditure Annual Full Year Budget YTD Budget YTD Actual Commitments
% Var. > 10% & $10,000 or $100,000
$ Variance
01 - Income -2,092 -1,914 -11,284 - N/A N/A02 - Expenditure 1,350,155 1,256,448 884,202 32,871 42% 372,246 Grand Total 1,348,063 1,254,534 872,918 32,871
Variance Comments:Variance relates to timing of Recycled Art Program, Civic Centre Art Exhibition Program and Community Projects such as Youth Energy Precinct, Lakeside Community Garden Consultation and Update of Fun Bus design. Recommendations submitted to June council Meetings for cash sponsorship of $5,000 and in-kind sponsorship of $1,000 for Top End NAIDOC 2010 and $10,000 to Larrakia Nation Aboriginal Corporation. Recruitment for officer position Community Development - Liveability currently being undertaken.
Community Services
45
45

Program Summary
Operational Expenditure and Revenue including Capital Income 1 July 2009 to 31 May 2010
Income/Expenditure Annual Full Year Budget YTD Budget YTD Actual Commitments
% Var. > 10% & $10,000 or $100,000
$ Variance
01 - Income -119,763 -114,638 -125,931 - N/A N/A02 - Expenditure 365,968 326,031 335,955 9,231 N/A N/AGrand Total 246,205 211,393 210,024 9,231
Variance Comments:
Family & Childrens Services
Income/Expenditure Annual Full Year Budget YTD Budget YTD Actual Commitments
% Var. > 10% & $10,000 or $100,000
$ Variance
01 - Income -493,179 -452,089 -484,492 - N/A N/A02 - Expenditure 1,330,938 1,223,811 1,254,636 101,752 N/A N/AGrand Total 837,759 771,722 770,145 101,752
Variance Comments:
Community & Cultural Services
Income/Expenditure Annual Full Year Budget YTD Budget YTD Actual Commitments
% Var. > 10% & $10,000 or $100,000
$ Variance
01 - Income -3,364 -3,364 -3,464 - N/A N/A02 - Expenditure 144,441 104,002 84,087 3,926 24% 19,915 Grand Total 141,077 100,638 80,623 3,926
Variance Comments:Underspending due to proposed delegations which have not yet taken place as well as timing of Sister Cities Fundraiser event scheduled for 5 July 2010.
Sister Cities
46
46

Program Summary
Operational Expenditure and Revenue including Capital Income 1 July 2009 to 31 May 2010
Income/Expenditure Annual Full Year Budget YTD Budget YTD Actual Commitments
% Var. > 10% & $10,000 or $100,000
$ Variance
01 - Income -1,367,501 -1,362,760 -1,377,068 - N/A N/A02 - Expenditure 2,925,028 2,686,685 2,555,584 45,872 5% 131,101 Grand Total 1,557,527 1,323,925 1,178,516 45,872
Variance Comments:Variance is due to underspending in materials budget.
Libraries
Income/Expenditure Annual Full Year Budget YTD Budget YTD Actual Commitments
% Var. > 10% & $10,000 or $100,000
$ Variance
01 - Income -600,389 -589,675 -584,210 - N/A N/A02 - Expenditure 1,207,094 1,120,559 1,281,644 6,781 -13% -161,085 Grand Total 606,705 530,884 697,435 6,781
Variance Comments:Variance is due to a reallocation of the budget for employment costs in first quarter to cater for staffing arrangements across animal control and infringements that has since been changed. Overall employment costs with both areas are within budget.
Control of Domestic Animals
Income/Expenditure Annual Full Year Budget YTD Budget YTD Actual Commitments
% Var. > 10% & $10,000 or $100,000
$ Variance
01 - Income -1,036,787 -948,501 -1,008,629 - N/A N/A02 - Expenditure 1,684,049 1,551,547 1,548,571 9,994 N/A N/AGrand Total 647,262 603,046 539,942 9,994
Variance Comments:
Regulatory Services
47
47

Program Summary
Operational Expenditure and Revenue including Capital Income 1 July 2009 to 31 May 2010
Income/Expenditure Annual Full Year Budget YTD Budget YTD Actual Commitments
% Var. > 10% & $10,000 or $100,000
$ Variance
01 - Income - - - - N/A N/A02 - Expenditure 500,125 460,304 513,228 2,868 -10% -52,924 Grand Total 500,125 460,304 513,228 2,868
Variance Comments:Variance due to higher actual in; Salaries and Wages (-$51k), Stationery and Office Consumables (-$9k), Course/Workshop/Training & Registration (-$8k) and Overtime (-$4k). These are partially offset by lower actual in Internal Plant Hire Recharge (+$10k), Air Travel (+$4k), Non-Contract Services (+$4k) and Materials (+$1k).
GM Infrastructure
Income/Expenditure Annual Full Year Budget YTD Budget YTD Actual Commitments
% Var. > 10% & $10,000 or $100,000
$ Variance
01 - Income -8,800 -5,866 -8,800 - 100% 2,934 02 - Expenditure 467,220 394,449 405,357 24,658 N/A N/AGrand Total 458,420 388,583 396,557 24,658
Variance Comments:Income pertaining to invoice issued to Department of Construction & Infrastructure for their 50% share in the cost of the Building Condition Audit of the Darwin Entertainment Centre - variance will be eliminated in June with the final budget allocation.
Asset Management
Income/Expenditure Annual Full Year Budget YTD Budget YTD Actual Commitments
% Var. > 10% & $10,000 or $100,000
$ Variance
02 - Expenditure 473,910 436,088 344,480 432 27% 91,608 Grand Total 473,910 436,088 344,480 432
Variance Comments:Variance is due to underspending in salaries and wages (+$77k), overtime (+$10k) and non-contract services (+$3k). These are partially offset by unbudgeted expenditure on temp staff (-$6k) relating to personal assistant while the permanent PA is on leave.
Infrastructure Projects
48
48

Program Summary
Operational Expenditure and Revenue including Capital Income 1 July 2009 to 31 May 2010
Income/Expenditure Annual Full Year Budget YTD Budget YTD Actual Commitments
% Var. > 10% & $10,000 or $100,000
$ Variance
01 - Income - - - - N/A N/A02 - Expenditure 370,594 358,946 342,406 17,873 N/A N/AGrand Total 370,594 358,946 342,406 17,873
Variance Comments:
Planning
Income/Expenditure Annual Full Year Budget YTD Budget YTD Actual Commitments
% Var. > 10% & $10,000 or $100,000
$ Variance
01 - Income - - - - N/A N/A02 - Expenditure 515,760 463,435 365,745 45,445 27% 97,690 Grand Total 515,760 463,435 365,745 45,445
Variance Comments:Variance due to underspending on Consultancy (+$52k), Salaries & Wages (+$21k) and Temp Staff (+$29k). This is partially offset byhigher actual in Internal Plant Hire Recharge (-$4k) and Telephone & Communication (-$1k).
Design
Income/Expenditure Annual Full Year Budget YTD Budget YTD Actual Commitments
% Var. > 10% & $10,000 or $100,000
$ Variance
01 - Income -3,850,000 -3,100,000 -2,760,000 - 100% -340,000 Grand Total -3,850,000 -3,100,000 -2,760,000 -
Variance Comments:
Urban Enhancement
Variance is due to the timing of cashflow for the MY0800 funding ($3.8M) for this financial year. Actual relates to the grant funds already received from Regional and Local Community Infrastructure Program ($1.26M) and from Northern Territory Government contribution of ($1.5M). Also contributing to the variance is Stormwater Management Income of ($50k) which has not yet been received.
49
49

Program Summary
Operational Expenditure and Revenue including Capital Income 1 July 2009 to 31 May 2010
Income/Expenditure Annual Full Year Budget YTD Budget YTD Actual Commitments
% Var. > 10% & $10,000 or $100,000
$ Variance
01 - Income -5,580,797 -5,375,342 -3,065,441 - 75% -2,309,901Grand Total -5,580,797 -5,375,342 -3,065,441 -
Variance Comments:Income variance is mainly due to timing of budgeted cashflow of grant funds for the following projects; - Roads to Recovery YTD budget (-$2.5M), amount received to date is (-$668k) variance of (-$1.8M) - Cyclepath Strategy YTD budget (-$963k) amount invoiced to date is (-$475k) variance of (-488k)
Road Construction & Traffic Management
Income/Expenditure Annual Full Year Budget YTD Budget YTD Actual Commitments% Var. > 10% &
$10,000 or $100,000
$ Variance
01 - Income -1,693,882 -1,691,382 -1,669,100 - N/A N/A02 - Expenditure 4,746,626 4,362,424 3,549,115 557,409 23% 813,309 Grand Total 3,052,744 2,671,042 1,880,014 557,409
Variance Comments:Expenditure variance can be accounted as already partly committed (+$557k) relating to contracted materials for: linemarking of CBD and arterial roads, road repairs from the wet season (overlaying of intersections), shoulder maintenance and signage. Works for traffic signals, crack resealing on various roads, Westralia St walkway construction are all to be committed in June (+$170k). Also contributing to the variance is under spending in electricity due to savings in streetlighting (+$144k), lower internal plant hire recharge (+$34k), salaries & wages due to one vacancy in Cleaning Services (+$21k). These are partially offset by higher actual in temp staff (-$83k), non-contract services (-$17k) and overtime (-$13k).
Roads & Maintenance
Income/Expenditure Annual Full Year Budget YTD Budget YTD Actual Commitments
% Var. > 10% & $10,000 or $100,000
$ Variance
01 - Income - - - - N/A N/A02 - Expenditure 447,561 413,781 465,817 263 -11% -52,036 Grand Total 447,561 413,781 465,817 263
Variance Comments:Expenditure variance is mainly driven by the expense incurred for Disaster Recovery undertaken during the December 12, 2009 storm clean-up operations (-$95k) and overspending in Emergency Services (-$7k). These are partially offset by underspending in internal plant hire recharge (+$21k), temp staff (+$14k) and salaries and wages (+$15k).
Operations
50
50

Program Summary
Operational Expenditure and Revenue including Capital Income 1 July 2009 to 31 May 2010
Income/Expenditure Annual Full Year Budget YTD Budget YTD Actual Commitments
% Var. > 10% & $10,000 or $100,000
$ Variance
01 - Income - - - - N/A N/A02 - Expenditure 634,624 578,479 583,999 66,674 N/A N/AGrand Total 634,624 578,479 583,999 66,674
Variance Comments:
Pathways
Income/Expenditure Annual Full Year Budget YTD Budget YTD Actual Commitments
% Var. > 10% & $10,000 or $100,000
$ Variance
02 - Expenditure 2,332,016 2,113,498 1,855,044 197,905 14% 258,454 Grand Total 2,332,016 2,113,498 1,855,044 197,905
Variance Comments:YTD variance is due to timing of works to be undertaken after the wet season, these are; cleaning of CBD and public toilets, street sweeping, litter patrol and rubbish removal. Most of which has been committed and will be billed as works are performed.
Street Cleaning
Income/Expenditure Annual Full Year Budget YTD Budget YTD Actual Commitments
% Var. > 10% & $10,000 or $100,000
$ Variance
01 - Income -23,470 -23,470 -158,090 - -85% 134,620 02 - Expenditure 3,535,503 3,245,279 2,720,465 375,693 19% 524,814 Grand Total 3,512,033 3,221,809 2,562,375 375,693
Variance Comments:Income variance is due to grant funds received for Regional and Local Community Infrastructure Program namely : Upgrade of MeetingSpace at Casuarina Library (+$46k); Upgrade at the Nightcliff Pool - Demolition & Replacement of Pool Pump House (+$46k) and Upgrade of Shade Structure at Casuarina Library (+$17k). A 4th quarter variation has been submitted to recognise this income within budgets. Expenditure variance can be accounted as already partly committed in the amount of (+$341). The remaining variance is due to underspending in salaries ($129k) due to temporary vacancy of Graffiti Officer and limited tenure carpenter was not extended, underspending in insurance ($16k) and internal plant hire (+$5k).
Building Services
51
51

Program Summary
Operational Expenditure and Revenue including Capital Income 1 July 2009 to 31 May 2010
Income/Expenditure Annual Full Year Budget YTD Budget YTD Actual Commitments
% Var. > 10% & $10,000 or $100,000
$ Variance
02 - Expenditure 678,019 621,143 598,388 40,293 N/A N/AGrand Total 678,019 621,143 598,388 40,293
Variance Comments:
Stormwater Drainage Maintenance
Income/Expenditure Annual Full Year Budget YTD Budget YTD Actual Commitments
% Var. > 10% & $10,000 or $100,000
$ Variance
01 - Income -202,704 -202,704 -194,559 - N/A N/A02 - Expenditure 184,701 169,289 175,866 5,581 N/A N/AGrand Total -18,003 -33,415 -18,692 5,581
Variance Comments:
Mosquito Control
Income/Expenditure Annual Full Year Budget YTD Budget YTD Actual Commitments
% Var. > 10% & $10,000 or $100,000
$ Variance
01 - Income -141,872 -121,872 -168,125 - -28% 46,253 02 - Expenditure 7,484,300 6,849,559 6,414,877 320,691 7% 434,682 Grand Total 7,342,428 6,727,687 6,246,752 320,691
Variance Comments:Income variance relates to the NT Government subsidy for maintenance of the Fannie Bay greenbelt area ($13k), unbudgeted park hire income for both major and minor parks ($32k) as well as unbudgeted Caring for our NT NRM community grant funding for Rapid CreekRiparian Zone Project (+$5k). Expenditure variance can be accounted as already partly committed for seasonal tree pruning and tree watering (+$202k), underspending in salaries & wages (+$141k), water (+$113k), internal plant hire recharge (+$55k) and overtime (+$2k). These arepartially offset by temp staff (-$33k), internal recharge (-$31k), electricity (-$9k) and sewerage (-$6k).
Parks & Reserves
52
52
Program Summary
Operational Expenditure and Revenue including Capital Income 1 July 2009 to 31 May 2010
Income/Expenditure Annual Full Year Budget YTD Budget YTD Actual Commitments
% Var. > 10% & $10,000 or $100,000
$ Variance
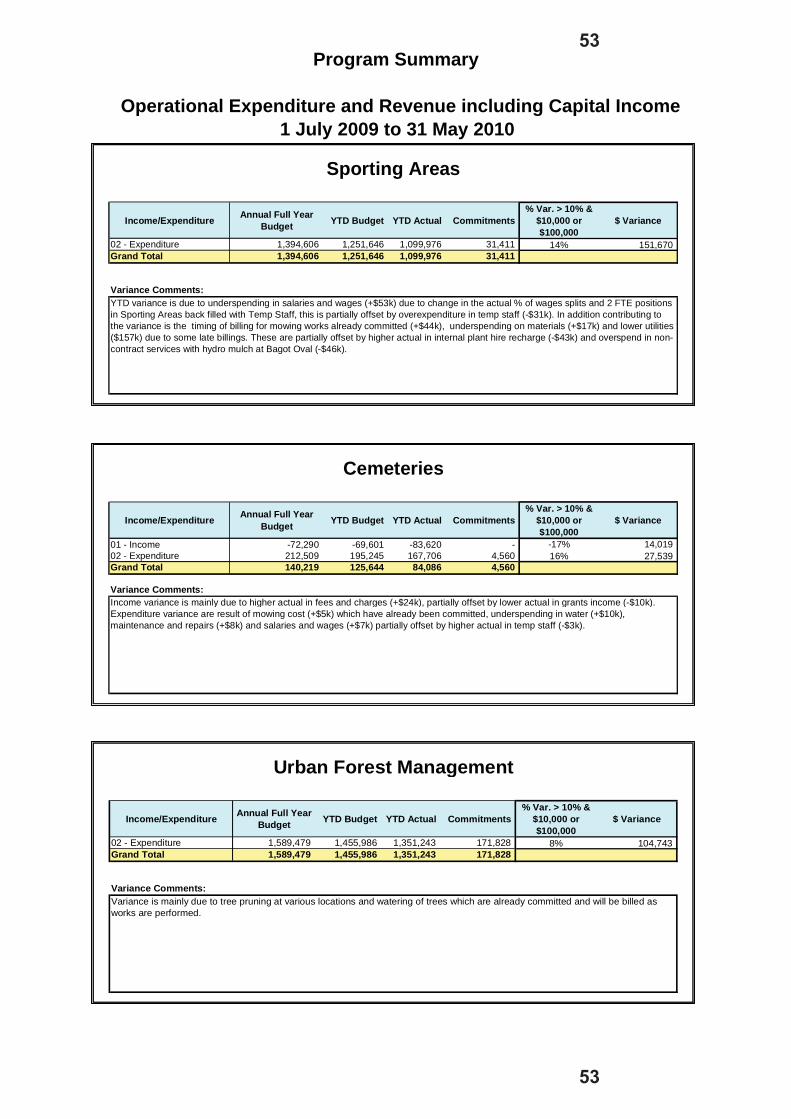
02 - Expenditure 1,394,606 1,251,646 1,099,976 31,411 14% 151,670 Grand Total 1,394,606 1,251,646 1,099,976 31,411
Variance Comments:YTD variance is due to underspending in salaries and wages (+$53k) due to change in the actual % of wages splits and 2 FTE positions in Sporting Areas back filled with Temp Staff, this is partially offset by overexpenditure in temp staff (-$31k). In addition contributing to the variance is the timing of billing for mowing works already committed (+$44k), underspending on materials (+$17k) and lower utilities ($157k) due to some late billings. These are partially offset by higher actual in internal plant hire recharge (-$43k) and overspend in non-contract services with hydro mulch at Bagot Oval (-$46k).
Sporting Areas
Income/Expenditure Annual Full Year Budget YTD Budget YTD Actual Commitments
% Var. > 10% & $10,000 or $100,000
$ Variance
01 - Income -72,290 -69,601 -83,620 - -17% 14,019 02 - Expenditure 212,509 195,245 167,706 4,560 16% 27,539 Grand Total 140,219 125,644 84,086 4,560
Variance Comments:Income variance is mainly due to higher actual in fees and charges (+$24k), partially offset by lower actual in grants income (-$10k). Expenditure variance are result of mowing cost (+$5k) which have already been committed, underspending in water (+$10k), maintenance and repairs (+$8k) and salaries and wages (+$7k) partially offset by higher actual in temp staff (-$3k).
Cemeteries
Income/Expenditure Annual Full Year Budget YTD Budget YTD Actual Commitments
% Var. > 10% & $10,000 or $100,000
$ Variance
02 - Expenditure 1,589,479 1,455,986 1,351,243 171,828 8% 104,743 Grand Total 1,589,479 1,455,986 1,351,243 171,828
Variance Comments:Variance is mainly due to tree pruning at various locations and watering of trees which are already committed and will be billed as works are performed.
Urban Forest Management
53
53

Program Summary
Operational Expenditure and Revenue including Capital Income 1 July 2009 to 31 May 2010
Income/Expenditure Annual Full Year Budget YTD Budget YTD Actual Commitments
% Var. > 10% & $10,000 or $100,000
$ Variance
01 - Income -10,418,931 -9,946,680 -10,106,197 - -2% 159,51702 - Expenditure 9,954,271 9,143,189 8,871,723 1,862,132 3% 271,466Grand Total -464,660 -803,491 -1,234,474 1,862,132
Variance Comments:Income variance is due to higher actual on commercial wastes and contaminated and special wastes going into the Weighbridge (+$269k). Domestic garbage collection is higher for both kerbside and manual collection by +$32k and +$14k respectively. Partially offset by lower actual in LMS gas (-$22k), DCC Internal Recharge (-$11k) and interest on reserves (-$123k) which will form part of the end of year adjustments. Expenditure variance relates to timing of billing for Cleanaway (+$373k) and Macmahon (+$117k) and underspending in internal plant hire recharge (+$3k). These are partially offset by higher actual in the following : other contracted materials and services (-$22k); temp staff (-$62k); salaries and wages (-$55k); legal expenses (-$31k); non-contract services (-$19k) and electricity (-$5k). Also contributing to the variance is unbudgeted expense for consultancy of (-$28k).
Waste Management
Income/Expenditure Annual Full Year Budget YTD Budget YTD Actual Commitments
% Var. > 10% & $10,000 or $100,000
$ Variance
01 - Income -238,844 -220,194 -360,264 - -39% 140,070 02 - Expenditure 404,036 370,150 253,489 47,415 46% 116,661 Grand Total 165,192 149,956 -106,775 47,415
Variance Comments:
Development
Income variance is due to unbudgeted income for subdivision plan approval and development fees of Lyons (+71k), invoice for compensation for easement on lot 5722 (+$40k), unbudgeted stormwater-developer contribution from Gwelo Dev't Pty Ltd. (+$9k) andunbudgeted developer contribution income (+$32k). Also contributing to the variance is higher permit and road reserve income (+$51k) and higher license and permit fees (+$6k) . These are partially offset by lower recoverable works income from reinstatement of road works (-$71k). Expenditure variance is due to lower actual in contracted materials and services ($103k) of which +$47k is committed . Also underspending in temp staff (+$16k) and overtime (+$5k), which are partially offset by higher actual in Internal plant hire recharge (-$8k).
54
54

Program Summary
Operational Expenditure and Revenue including Capital Income 1 July 2009 to 31 May 2010
Income/Expenditure Annual Full Year Budget YTD Budget YTD Actual Commitments
% Var. > 10% & $10,000 or $100,000
$ Variance
01 - Income -1,113,000 -1,020,250 -1,828,884 - -44% 808,634 02 - Expenditure 325,365 315,051 295,028 3,336 N/A N/AGrand Total -787,635 -705,199 -1,533,856 3,336
Variance Comments:Income variance is due to interest on investments. A portion of the interest will be reallocated to reserves as part of end of year processes reducing the variance.
GM Corporate Services
Income/Expenditure Annual Full Year Budget YTD Budget YTD Actual Commitments
% Var. > 10% & $10,000 or $100,000
$ Variance
01 - Income -1,709,555 -1,708,223 -1,701,574 - N/A N/A02 - Expenditure 1,527,869 1,407,117 1,015,182 5,376 39% 391,935 Grand Total -181,686 -301,106 -686,392 5,376
Variance Comments:Variance is a result of Employee Overheads which are variable based on timing of Annual Leave and Sick Leave taken.
Financial & Management Accounting Services
Income/Expenditure Annual Full Year Budget YTD Budget YTD Actual Commitments
% Var. > 10% & $10,000 or $100,000
$ Variance
01 - Income -43,449,635 -43,353,614 -43,212,839 - 0% -140,775 02 - Expenditure 831,246 775,681 837,388 10,815 N/A N/AGrand Total -42,618,389 -42,577,933 -42,375,451 10,815
Variance Comments:Variance relates to Interest on Carparking Shortfall Reserve ($107k) and Carparking Reserve ($85k) which will be realigned with end of year adjustments. Also contributing to the variance is Waterfront Income ($60k) and timing of Revenue Collection & Legal Fee Recovery ($43k).
Revenue Services
55
55

Program Summary
Operational Expenditure and Revenue including Capital Income 1 July 2009 to 31 May 2010
Income/Expenditure Annual Full Year Budget YTD Budget YTD Actual Commitments% Var. > 10% &
$10,000 or $100,000
$ Variance
01 - Income - - - - N/A N/A02 - Expenditure 1,385,652 1,316,835 1,285,346 23,870 N/A N/AGrand Total 1,385,652 1,316,835 1,285,346 23,870
Variance Comments:
Information Technology
Income/Expenditure Annual Full Year Budget YTD Budget YTD Actual Commitments
% Var. > 10% & $10,000 or $100,000
$ Variance
01 - Income - - -934 - N/A N/A02 - Expenditure 703,959 645,850 596,296 1,139 N/A N/AGrand Total 703,959 645,850 595,362 1,139
Variance Comments:
Records & Information Management
Income/Expenditure Annual Full Year Budget YTD Budget YTD Actual Commitments
% Var. > 10% & $10,000 or $100,000
$ Variance
01 - Income - - -125,379 - -100% 125,379 02 - Expenditure 1,234,781 1,125,227 1,287,915 28,499 -13% -162,688 Grand Total 1,234,781 1,125,227 1,162,536 28,499
Variance Comments:Income variance is due to Workers Compensation Claims ($121k) which cannot be budgeted for. This is offset by Workers Compensation Salaries and Wages expenditure ($152k). Balance of expenditure variance is due to overspending in Legal Expenses ($33k).
Employee Relations
56
56

Program Summary
Operational Expenditure and Revenue including Capital Income 1 July 2009 to 31 May 2010
Income/Expenditure Annual Full Year Budget YTD Budget YTD Actual Commitments
% Var. > 10% & $10,000 or $100,000
$ Variance
01 - Income - - -364 - N/A N/A02 - Expenditure 197,121 189,941 191,225 196 N/A N/AGrand Total 197,121 189,941 190,861 196
Variance Comments:
Business Services
Income/Expenditure Annual Full Year Budget YTD Budget YTD Actual Commitments
% Var. > 10% & $10,000 or $100,000
$ Variance
01 - Income - - - - N/A N/A02 - Expenditure 209,282 181,567 225,923 - -20% -44,356 Grand Total 209,282 181,567 225,923 -
Variance Comments:Variance due to under budgeting for salaries and wages and a review of schedule of rates contract document by Cridlands MB.
Contracts Administration
Income/Expenditure Annual Full Year Budget YTD Budget YTD Actual Commitments% Var. > 10% &
$10,000 or $100,000
$ Variance
01 - Income -1,033,458 -951,339 -1,085,802 - -12% 134,463 02 - Expenditure 245,740 174,190 225,703 6,182 -23% -51,513 Grand Total -787,718 -777,149 -860,099 6,182
Variance Comments:The negative variance in walkway expenditure is offset by the positive variance in revenue received from the NTG. Rental properties have performed better than planned.
Property Management
57
57

Program Summary
Operational Expenditure and Revenue including Capital Income 1 July 2009 to 31 May 2010
Income/Expenditure Annual Full Year Budget YTD Budget YTD Actual Commitments
% Var. > 10% & $10,000 or $100,000
$ Variance
01 - Income -39,581 -36,291 -56,234 - -35% 19,943 02 - Expenditure 465,482 422,597 403,300 18,548 N/A N/AGrand Total 425,901 386,306 347,066 18,548
Variance Comments:Income greater due to increase of use of banner sites and street light banner income due to dry season events.
Customer Services
Income/Expenditure Annual Full Year Budget YTD Budget YTD Actual Commitments
% Var. > 10% & $10,000 or $100,000
$ Variance
01 - Income -1,629,616 -1,516,307 -1,658,451 - -9% 142,144 02 - Expenditure 1,254,947 1,161,640 953,677 38,547 22% 207,963 Grand Total -374,669 -354,667 -704,774 38,547
Variance Comments:Income variance is due to higher than budgeted income for Management & Policing of Carparks (+$60k), McLachlan St (+$3k), NicholsPlace (+$2k), McMinn St (+11k), Darwin Oval (+13k), Stott Lane (+$3k), 96 Mitchell St (+$4k) and the large increase in reserved parking in Chinatown (+$77k). This was partially offset by the under budget income for Mitchell/Daly (-$12k), Westlane (-$15K) and Cavenagh St (-$4k). Expenditure variance is due to underspending in CBD Parking Policy & Strategy Project (-$100k), Internal Plant Hire Recharge (-$41k), Materials (-$33k), Non Contracted Services (-$27K), Operational Leases (-$24k), Temp Staff (-$2k) and Photocopy Charges (-$2K). This was partially offset by overspending in Salaries & Wages (+$12k), Contracted Materials and Services (+$10K) and Bad/Doubtful debts & other write offs (+$9k).
Off Street Parking
Income/Expenditure Annual Full Year Budget YTD Budget YTD Actual Commitments
% Var. > 10% & $10,000 or $100,000
$ Variance
01 - Income -1,596,920 -1,463,847 -1,607,930 - -9% 144,083 02 - Expenditure 294,509 267,826 312,660 12,941 -14% -44,834 Grand Total -1,302,411 -1,196,021 -1,295,269 12,941
Variance Comments:
On Street Parking
Income variance is due to higher than budgeted income for On Street Parking Fees: Zone A (+$30k), Zone B (+$73k) and Zone C (+$41k). Expenditure variance is due to overspending in Contract Material & Services (-$45K) and Non Contracted Services (-$9K). This is partially offset by underspending in Materials (+$6k) and Advertising (+$3K).
58
58

Program Summary
Operational Expenditure and Revenue including Capital Income 1 July 2009 to 31 May 2010
Income/Expenditure Annual Full Year Budget YTD Budget YTD Actual Commitments
% Var. > 10% & $10,000 or $100,000
$ Variance
01 - Income -635,165 -481,965 -311,092 - 55% -170,873 02 - Expenditure -1,239,369 -1,135,784 -1,372,920 50,191 -17% 237,136 Grand Total -1,874,534 -1,617,749 -1,684,012 50,191
Variance Comments:Traded plant income is below budget due to timing of trade ins - waiting on new vehicle deliveries which are expected in July for trade in transactions to occur. Fleet operational expenditure is below budget due to lower fuel usage, Repairs & Maintenance, materials and salaries & wages which have not achieved expected budget. This has been reflected with lower internal recharge recouped from plant usage.
Fleet Management
59
59

30/06/2010CREDITRATING COUNTERPARTY INV TYPE AMOUNT INTEREST
RATE MATURITY DATE DAYS TO MATURITY
WEIGHTEDAVERAGE RATE
INSTITUTION TOTALS
% P/FOLIO PER COUNTER
PARTYStandard
and PoorsLT - ST
49.88% $ 21,229,258.44 of portfolio
AA-A1+ ANZ TD 1,000,000.00$ 5.46% September 22, 2010 84 0.001282819AA-A1+ ANZ TD 1,000,000.00$ 5.46% September 22, 2010 84 0.001282819AA-A1+ ANZ TD 1,025,297.54$ 5.50% November 3, 2010 126 0.001324906AA-A1+ ANZ TD 1,025,297.54$ 5.50% November 3, 2010 126 0.001324906 4,050,595.08$ 9.52%AA-A1+ National Bank TD 1,015,479.46$ 6.08% July 14, 2010 14 0.001450599AA-A1+ National Bank TD 1,000,000.00$ 6.25% July 28, 2010 28 0.001468428AA-A1+ National Bank TD 1,000,000.00$ 6.09% August 4, 2010 35 0.001430836AA-A1+ National Bank TD 1,028,334.91$ 5.35% August 25, 2010 56 0.001292591AA-A1+ National Bank TD 1,023,669.59$ 5.77% November 10, 2010 133 0.001387740AA-A1+ National Bank TD 1,059,992.10$ 5.75% December 1, 2010 154 0.001432000AA-A1+ National Bank TD 1,000,000.00$ 6.10% March 30, 2011 273 0.001433186 7,127,476.06$ 16.75%AA-A1+ Comminvest-FIIG TD 1,000,000.00$ 5.80% August 11, 2010 42 0.001362701AA-A1+ Comminvest-FIIG TD 1,000,000.00$ 5.80% August 11, 2010 42 0.001362701AA-A1+ Comminvest-Secure TD 1,051,187.30$ 5.75% October 27, 2010 119 0.001420105AA-A1+ Comminvest-Secure TD 1,000,000.00$ 5.80% December 29, 2010 182 0.001362701 4,051,187.30$ 9.52%AA-A1+ Westpac TD 1,000,000.00$ 6.20% October 13, 2010 105 0.001456681AA-A1+ Westpac TD 1,000,000.00$ 6.20% October 20, 2010 112 0.001456681AA-A1+ Westpac TD 1,000,000.00$ 6.20% October 20, 2010 112 0.001456681AA-A1+ Westpac TD 1,000,000.00$ 6.20% November 10, 2010 133 0.001456681AA-A1+ Westpac TD 1,000,000.00$ 6.20% November 17, 2010 140 0.001456681AA-A1+ Westpac TD 1,000,000.00$ 6.20% November 17, 2010 140 0.001456681 6,000,000.00$ 14.10%
33.40% $ 14,215,104.47 of portfolio
AA-A1+ Bankwest TD 1,000,000.00$ 4.60% July 21, 2010 21 0.001080763AA-A1+ Bankwest TD 1,014,671.23$ 6.00% October 6, 2010 98 0.001430373AA-A1+ Bankwest TD 1,000,000.00$ 5.90% October 27, 2010 119 0.001386196AA-A1+ Bankwest TD 1,014,326.03$ 6.10% March 30, 2011 273 0.001453718 4,028,997.26$ 9.47%A-A2 Bendigo & Adelaide Bank Ltd TD 1,000,000.00$ 5.90% August 4, 2010 35 0.001386196 1,000,000.00$ 2.35%A-A1- Citibank TD 1,000,000.00$ 5.50% July 21, 2010 21 0.001292217A-A1- Citibank TD 1,027,583.61$ 5.52% September 1, 2010 63 0.001332689A-A1- Citibank TD 1,031,453.29$ 5.62% September 29, 2010 91 0.001361942 3,059,036.90$ 7.19%A-A1- Suncorp-Metway Limited TD 861,429.20$ 6.31% December 15, 2010 168 0.001277090A-A1- Suncorp-Metway Limited TD 1,015,850.68$ 5.75% August 18, 2010 49 0.001372367A-A1- Suncorp-Metway Limited TD 1,015,850.68$ 5.75% August 18, 2010 49 0.001372367A-A1- Suncorp-Metway Limited TD 1,014,815.07$ 6.01% August 25, 2010 56 0.001432960A-A1- Suncorp-Metway Limited TD 1,000,000.00$ 5.26% September 8, 2010 70 0.001235829A-A1- Suncorp-Metway Limited TD 1,219,124.68$ 6.35% October 6, 2010 98 0.001818840 6,127,070.31$ 14.40%
7.08%3,013,412.60$ of portfolio
Not Rated* SALCU - FIIG TD 1,000,000.00$ 5.95% July 7, 2010 7 0.001397943Not Rated* SALCU - FIIG TD 1,000,000.00$ 5.95% July 7, 2010 7 0.001397943Not Rated* SALCU - FIIG TD 1,013,412.60$ 5.95% July 14, 2010 14 0.001416693 3,013,412.60$ 7.08%
9.64%4,104,749.18$ of portfolio
AA-A1** TIO TD 1,044,914.58$ 5.59% July 28, 2010 28 0.001372351AA-A1** TIO TD 1,022,966.21$ 5.82% September 1, 2010 63 0.001398804AA-A1** TIO TD 1,000,000.00$ 5.80% September 8, 2010 70 0.001362701AA-A1** TIO TD 1,036,868.39$ 5.25% October 13, 2010 105 0.001278956 4,104,749.18$ 9.64%
*APRA regulated**Moody's Rated
100.00% Average Days to Maturity 89.00 Weighted
Average 5.82% 100.00%
GENERAL BANK FUNDS
TOTAL ALL FUNDS
Amount % PortfolioTerm Deposit 42,562,524.69$ 94%Bank Bills -$ 0%Negotiable Certificate of Deposit -$ 0%CBA At Call 2,861,561.43$ 6%
45,424,086.12$ 100%
Total Budget Investment Earnings 1,500,000.00$
Year to Date Investment Earnings 2,022,908.82$
INVESTMENTS REPORT TO COUNCIL AS AT June 30 2010
Regional Banks Total @ Invested
Credit Societies Total @ Invested
Major Banks Total @ Invested
Type of Investment
2,861,561.43$
45,424,086.12$
NT Government Total @ Invested
TOTAL FUNDS INVESTED 42,562,524.69$
4.00%
5.00%
6.00%
7.00%
30 60 90 120 150 180 270 365
Australian Term Deposit Indices June 2010DCC Weighted Ave. Rate @ 30th June, 2010DCC Wted Ave. Rate (Per InvestmentTerms)
60
60

61
61
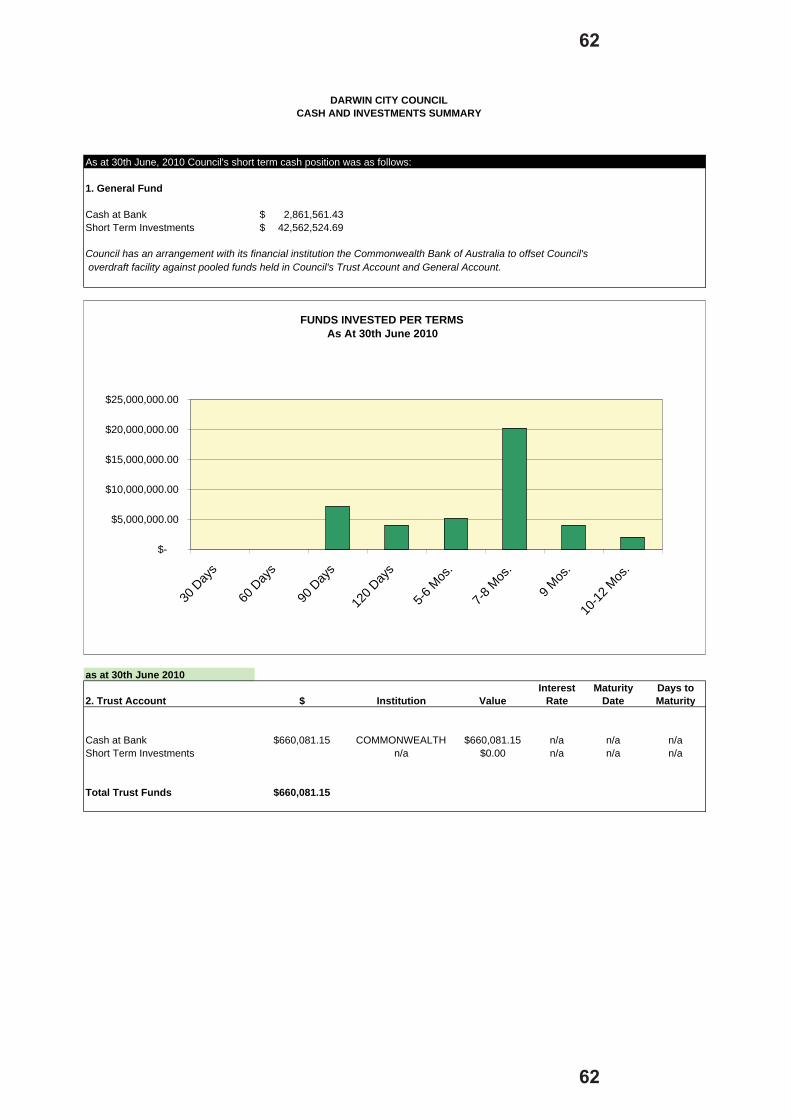
As at 30th June, 2010 Council's short term cash position was as follows:
1. General Fund
Cash at Bank 2,861,561.43$ Short Term Investments 42,562,524.69$
Council has an arrangement with its financial institution the Commonwealth Bank of Australia to offset Council's overdraft facility against pooled funds held in Council's Trust Account and General Account.
as at 30th June 2010
2. Trust Account $ Institution ValueInterest
RateMaturity
DateDays to Maturity
Cash at Bank $660,081.15 COMMONWEALTH $660,081.15 n/a n/a n/aShort Term Investments n/a $0.00 n/a n/a n/a
Total Trust Funds $660,081.15
DARWIN CITY COUNCILCASH AND INVESTMENTS SUMMARY
FUNDS INVESTED PER TERMS As At 30th June 2010
$-
$5,000,000.00
$10,000,000.00
$15,000,000.00
$20,000,000.00
$25,000,000.00
30Day
s
60Day
s
90Day
s
120 Day
s
5-6Mos
.
7-8Mos
.
9 Mos.
10-12
Mos.
62
62

FINANCE DEPARTMENTSERVICE LEVEL REPORT TO COUNCIL
FOR THE MONTH OF JUNE 2010
ACCOUNTS RECEIVABLE OUTSTANDING DEBTORS
$-
$200,000
$400,000
$600,000
$800,000
$1,000,000
$1,200,000
$1,400,000
April May June
Current30 Days60 Days90 Days+
RATE RECEIPTS BY PAYMENT TYPE LAST 12 MONTHS
Major Agents17.7%
Web Site8.4%
Direct Debits7.7%
Credit Card by Phone7.2%
B-Pay25.7%
Aust Post13.6%
Centrepay0.2%
Cheques7.3%
EFT1.5%
Credit Card6.7% Cash
4.0%
MONTHLY RATES RECOVERY TOTALS 2010
$0
$5,000,000
$10,000,000
$15,000,000
$20,000,000
$25,000,000
$30,000,000
$35,000,000
$40,000,000
$45,000,000
RatesLevied
August-09 October-09
December-09
February-10
April-10 June-100%
20%
40%
60%
80%
100%
$ Outstanding 2009/2010
$ Outstanding 2008/2009
% Recovery 2009/2010
% Recovery 2008/2009
3.18%
$1,448,964
$ Outstanding
% Outstanding
63
63

ENCL: YESDARWIN CITY COUNCIL
DATE: 09/07/10REPORT
TO: CORPORATE & ECONOMIC DEVELOPMENT COMMITTEE / OPEN
APPROVED: LC
FROM: GENERAL MANAGER CORPORATE SERVICES
APPROVED: FC
REPORT NO:
10A0115
COMMON NO:
376351
SUBJECT: MONTHLY ON-STREET AND OFF-STREET PARKING STATISTICS – JUNE 2010
ITEM NO: 10.4
SYNOPSIS:
This report provides statistical information for car parking in the Central Business District (CBD) for June 2010.
GENERAL:
ON-STREET PARKING METERS
Tabled below is the revenue collected from on-street car parking for the month of June 2010.
The total net amount collected for Zones A, B & C is $174,779.
Year to date the total net amount collected for all the zones is $1,737,724.
Total average occupancy is 52%.
Number of Bays Occupancy
Net Amount Collected for
June 2010
Net Amount Collected for
June 2009
Year to Date for 2009/10
Financial Year
Year to Date for 2008/09
Financial Year Zone A 672 59% $ 95,374 $ 90,086 $ 964,999 $ 889,384 Zone B 620 41% $ 41,187 $ 26,028 $ 389,429 $ 314,223 Zone C 545 58% $ 38,218 $ 29,235 $ 383,297 $ 333,679 Total 1837 52% $ 174,779 $ 145,349 $ 1,737,724 $ 1,537,287
64
64

PAGE: 2 REPORT NUMBER: 10A0115 SUBJECT: MONTHLY ON-STREET AND OFF-STREET PARKING STATISTICS -
JUNE 2010
OFF-STREET CAR PARKS
Tabled below is the revenue collected from the Off-Street car parking for the month of June 2010.
The total amount collected is $85,777.00.
Year to date the total net amount collected is $1,650,358.
The total occupancy of all car parks combined in June 2010 is an average of 92%.
Total Number of
Bays
Number of Short
Term Bays
Occupancy Net Amount Collected for
June 2010
Net Amount Collected for
June 2009
Year to Date for 2009/2010
Financial Year
Year to Date for 2008/2009
Financial Year
West Lane 440 179 95% $ 24,123 $ 21,474 $ 571,420 $ 601,281
Cavenagh St 393 305 108% $ 23,988 $ 21,943 $ 304,970 $ 301,587
McLachlan St 90 59 97% $ 3,659 $ 3,883 $ 67,008 $ 63,703
McMinn St 215 196 136% $ 10,894 $ 9,307 $ 125,741 $ 122,335
Mitchell/Daly 120 96 80% $ 2,890 $ 4,791 $ 49,118 $ 63,268
Nichols Place 162 119 95% $ 7,270 $ 7,381 $ 105,385 $ 107,816
Chinatown 497 226 67% $ 8,317 $ 11,544 $ 316,501 $ 244,066
Stott Lane 45 1 98% -$ 1,422 $ 957 $ 24,079 $ 26,418
Darwin Oval 76 56 99% $ 3,653 $ 3,972 $ 60,945 $ 56,752
Woods St 56 56 32% $ 725 $ 179 $ 3,651 $ 1,934
Mitchell St 39 39 108% $ 1,679 $ 343 $ 21,539 $ 21,046
Total 2133 1332 92% $ 85,777 $ 85,774 $1,650,358 $1,610,208
The circumstances that may have influenced the reduced income in West Lane Carpark and Mitchell/Daly Carpark are as follows:
West Lane Carpark � Monthly parking permits have ceased and this would reduce the income as
the customers can only pay for 6 or 12 month reserved parking. � 13 reserved bays were cancelled and released back to cash customers.
Mitchell/Daly Carpark � In the previous financial year some the money from the Woods/Daly carpark
and the 96 Mitchell Street Carpark were included in the Mitchell/Daly carpark income as they did not have their own General Ledger numbers. This issue has now been rectified by the creation of separate General Ledger numbers.
65
65

PAGE: 3 REPORT NUMBER: 10A0115 SUBJECT: MONTHLY ON-STREET AND OFF-STREET PARKING STATISTICS -
JUNE 2010
Occupancies of over 100% are possible due to the combination of turnover within any particular off-street facility during charging hours and the set parking fee within that facility.
The attached graphs display the On-Street Monthly Income and Occupancy and the Off-Street Monthly Income for 2008/09 vs 2009/10 (Attachment A).
FINANCIAL IMPLICATIONS:
As noted in the body of the report.
ACTION PLAN IMPLICATIONS:
The issues addressed in this Report are in accordance with the following Goals/Strategies of the Action Plan of the Darwin City Council 2004 - 2008:
4 INFRASTRUCTURE MANAGEMENT
4.4 Car Parking
Goal To provide adequate and appropriate parking facilities in a timely manner.
LEGAL IMPLICATIONS:
Nil
ENVIRONMENTAL IMPLICATIONS:
Nil
PUBLIC RELATIONS IMPLICATIONS:
Nil
COMMUNITY SAFETY IMPLICATIONS:
Nil
DELEGATION:
Nil
CONSULTATION:
Carparks Co-ordinator Australian Parking & Revenue Control
66
66

PAGE: 4 REPORT NUMBER: 10A0115 SUBJECT: MONTHLY ON-STREET AND OFF-STREET PARKING STATISTICS -
JUNE 2010
PROPOSED PUBLIC CONSULTATION PROCESS:
Nil
APPROPRIATE SIGNAGE:
Nil
RECOMMENDATIONS:
THAT it be a recommendation to Council:-
A. THAT Report Number 10A0115 entitled Monthly On-Street and Off-Street Parking Statistics – June 2010, be received and noted.
LIAM CARROLL FRANK CRAWLEYBUSINESS SERVICES MANAGER GENERAL MANAGER CORPORATE
SERVICES
Any queries on this report may be directed to Helen Whittington on 8930 0570 or [email protected]
67
67

68
68
ATTACHMENT A

69
69

70
70

ENCL: YESDARWIN CITY COUNCIL
DATE: 09/07/10REPORT
TO: CORPORATE AND ECONOMIC DEVELOPMENT COMMITTEE / OPEN
APPROVED: MB
FROM: CHIEF EXECUTIVE OFFICER APPROVED: BD
REPORT NO:
10TC0036 BD:fm
COMMON NO:
381402
SUBJECT: INVITATIONS ACCEPTED OR DECLINED BY THE LORD MAYOR DURING JUNE 2010
ITEM NO : 10.5
SYNOPSIS:
The Council has requested a monthly report providing details of invitations accepted or declined by the Lord Mayor or a representative.
GENERAL:
Attached (Attachment A) is a list of invitations/events that the Lord Mayor or representative accepted or declined during June 2010.
RECOMMENDATIONS:
THAT it be a recommendation to Council:-
THAT Report Number 10TC0036 entitled, Invitations Accepted or Declined by the Lord Mayor during June 2010, be received and noted.
MARK BLACKBURN BRENDAN DOWD EXECUTIVE MANAGER CHIEF EXECUTIVE OFFICER
Any queries on this report may be directed to Fiona Murphy on 8930 0517 or [email protected]
71
71

ATTA
CH
MEN
T A
INVI
TATI
ON
S A
TTEN
DED
BY
THE
LOR
D M
AYO
R O
R R
EPR
ESEN
TATI
VE F
OR
JU
NE
2010
Fu
nctio
n D
ate/
Tim
e In
vite
e/C
ompa
ny
Func
tion
Venu
e A
ttend
ee
02/0
6/10
5:
30 –
7:0
0 Th
e H
on T
om P
aulin
g AO
QC
St
Joh
n Am
bula
nce
Aust
ralia
NT
2010
Inve
stitu
re C
erem
ony
Gov
ernm
ent H
ouse
Lo
rd M
ayor
03/0
6/10
6:
00pm
Au
stra
lian
Hot
els
Asso
ciat
ion
2010
AH
A Ar
isto
crat
Tec
hnol
ogie
s Aw
ards
for E
xcel
lenc
e Th
e La
wns
Sky
City
Lo
rd M
ayor
04/0
6/10
6:
00pm
Po
wer
and
Wat
er C
orpo
ratio
n M
elal
euca
Aw
ards
G
eorg
e Br
own
Bota
nic
Gar
dens
D
eput
y Lo
rd M
ayor
Fr
ed M
arro
ne
05/0
6/10
10
:00a
m
The
Nur
sery
& G
arde
n In
dust
ry N
T
Trop
ical
Gar
dens
Spe
ctac
ular
& T
op
end
sust
aina
bilit
y Fe
stiv
al W
orld
En
viro
nmen
t Day
G
eorg
e Br
own
Bota
nic
Gar
dens
Lo
rd M
ayor
05/0
6/10
7:
30pm
Fi
st F
ull o
f Film
s Fe
stiv
al
Laun
ch th
e m
ain
nigh
t of f
inal
ist f
ilms
scre
enin
g
Civ
ic P
ark
Alde
rman
Rob
yn
Lesl
ey
06/0
6/10
10
:00a
m
The
Nur
sery
& G
arde
n In
dust
ry N
T Fu
ture
Vis
ion
2030
Pan
el a
t Tro
pica
l G
arde
n Sp
ecta
cula
r G
eorg
e Br
own
Bota
nic
Gar
dens
Lo
rd M
ayor
07/0
6/10
9:
00am
M
illne
r Prim
ary
Scho
ol
Stud
ent S
umm
it fo
r Sus
tain
abili
ty
Mill
ner P
rimar
y Sc
hool
Lo
rd M
ayor
09/0
6/10
6:
30pm
M
ark
Swee
t, Ar
ea G
ener
al
Man
ager
, Tel
stra
C
eleb
ratin
g 10
Yea
rs o
f Tel
stra
C
ount
ry W
ide
Cro
cosa
urus
Cov
e 58
Mitc
hell
Stre
et
Dar
win
Lo
rd M
ayor
10/0
6/10
11
:30
Alaw
a Pr
imar
y Sc
hool
Sta
ff an
d St
uden
ts
Laun
ch o
f Kitc
hen
Gar
den
Prog
ram
Al
awa
Prim
ary
Scho
ol
Dep
uty
Lord
May
or
Fred
Mar
rone
10/0
6/10
4:
00pm
D
irect
or D
arw
in M
ilita
ry
Mus
eum
, Dr T
om L
ewis
Ope
ning
of a
new
dis
play
mod
ellin
g Ja
pane
se C
arrie
r Atta
ck F
leet
of
1942
Dar
win
Mili
tary
M
useu
m
Alde
rman
Alla
n M
itche
ll
10/0
6/10
4:
30pm
Kare
n M
ay, E
xecu
tive
Offi
cer
Nat
ural
Res
ourc
e M
anag
emen
t Boa
rd (N
T)
NR
M C
orpo
rate
Eng
agem
ent
Info
rmat
ion
Sess
ion
Har
bour
Vie
w
Build
ing,
Dar
win
Lo
rd M
ayor
11/0
6/10
4:
00pm
St
Joh
n’s
Col
lege
50
th C
eleb
ratio
n of
Edu
catio
n St
Joh
n’s
Col
lege
Al
derm
an H
eath
er
Sjob
erg
11/0
6/10
6:
00pm
Sh
arel
le F
urne
r, Te
ache
r-In-
C
harg
e, J
ingi
li Pr
esch
ool
Jing
ili P
resc
hool
Ann
ual D
inne
r D
ance
Ji
ngili
Pre
scho
ol, 1
0 Ji
ngili
Ter
race
, Jin
gili
Alde
rman
Rob
yn
Lesl
ey
14/0
6/10
12
:30p
m
Mar
k Pe
ad, N
T Te
nnis
Sk
yCity
NT
Ope
n C
ham
pion
ship
s Sk
yCity
– G
arde
ns
Tenn
is C
ompl
ex
Alde
rman
Rod
ger
Dee
15/0
6/10
7:
30am
In
tern
atio
nal C
ounc
il of
Loc
al
Envi
ronm
ent I
nitia
tives
Lo
cal G
over
nmen
t for
Sus
tain
abili
ty
Brie
fing
Brea
kfas
t N
atio
nal C
onve
ntio
n C
entre
Can
berra
Lo
rd M
ayor
17/0
6/10
7:
00pm
St
Vin
cent
de
Paul
C
EO’s
Sle
ep-o
ut
Gar
dens
Ova
l D
eput
y Lo
rd M
ayor
Fr
ed M
arro
ne
72
72

ATTA
CH
MEN
T A
18/0
6/10
6:
00 –
8:0
0pm
Th
e C
hief
Min
iste
r Pau
l H
ende
rson
Trip
le C
row
n R
ound
8, 2
010-
V8
Supe
rcar
Cha
mpi
onsh
ip S
erie
s R
ecep
tion
Spea
kers
Gre
en
Parli
amen
t Hou
se
Dep
uty
Lord
May
or
Fred
Mar
rone
19/0
6/10
5:
00pm
Is
lam
ic S
ocie
ty o
f Dar
win
Inc
Foru
m o
n U
nder
stan
ding
the
Isla
mic
C
omm
unity
53
Van
derli
n D
rive
Wan
guri
Dep
uty
Lord
May
or
Fred
Mar
rone
19/0
6/10
5:
00pm
C
onoc
oPhi
llips
Sy
mph
ony
in th
e G
arde
ns
Bota
nic
Gar
dens
A
mph
ithea
tre
Alde
rman
Hea
ther
Sj
ober
g
20/0
6/10
Al
l day
eve
nt
Mac
Mah
ons
2010
V8
Supe
rcar
Cha
mpi
onsh
ip
Serie
s H
idde
n Va
lley
Rac
eway
Lo
rd M
ayor
20/0
6/10
Al
l day
eve
nt
The
Chi
ef M
inis
ter P
aul
Hen
ders
on
Chi
ef M
inis
ter’s
Cla
ssic
Mar
quee
H
idde
n Va
lley
Rac
eway
Lo
rd M
ayor
23/0
6/10
6:
00pm
C
hairm
an &
Com
mitt
ee, T
urf
Clu
b 20
10 C
arlto
n M
id D
arw
in C
up
Car
niva
l Lau
nch
Schw
eppe
s Pa
vilio
n D
arw
in T
urf C
lub
A/Lo
rd M
ayor
Fr
ed M
arro
ne
24/0
6/10
7:
00pm
M
anag
er C
limat
e C
hang
e &
Env
ironm
ent,
DC
C
Nat
iona
l Lan
d C
are
Awar
ds
Parli
amen
t Hou
se,
Can
berra
Lo
rd M
ayor
26/0
6/10
6:
00pm
D
r Raj
eev
Shar
ma,
Pre
side
nt,
Indi
an C
ultu
ral S
ocie
ty N
T In
dia@
Min
dil 2
010
Min
dil B
each
D
eput
y Lo
rd M
ayor
Fr
ed M
arro
ne
27/0
6/10
6:
00pm
C
apta
in D
avid
Sch
nell,
USS
Pe
leliu
R
ecep
tion
onbo
ard
USS
Pel
eliu
(L
HA
5)
Fort
Hill
Wha
rf (W
est)
Dep
uty
Lord
May
or
Fred
Mar
rone
27 J
une
– 2
Augu
st
Hig
h C
omm
issi
oner
of t
he
Rep
ublic
of S
inga
pore
, Alb
ert
Chu
a W
orld
Citi
es S
umm
it 20
10
Sing
apor
e In
tern
atio
nal
Exhi
bitio
n &
Con
vent
ion
Cen
tre
Lord
May
or
27/0
6/10
6:
00pm
C
apta
in D
avid
Sch
nell,
USS
Pe
leliu
(LH
A 5)
O
n-bo
ard
Rec
eptio
n U
SS P
elel
iu (L
HA
5)
A/Lo
rd M
ayor
Fr
ed M
arro
ne
73
73

ATTA
CH
MEN
T A
INVI
TATI
ON
S D
ECLI
NED
BY
THE
LOR
D M
AYO
R F
OR
JU
NE
2010
Fu
nctio
n D
ate/
Tim
e In
vite
e/C
ompa
ny
Func
tion
Venu
e A
ttend
ee
03/0
6/10
10
:00a
m
Dav
id T
olln
er M
LA
Foun
datio
ns o
f the
Fon
g Li
m
Elec
tora
te
Fong
Lim
Ele
ctor
ate
Offi
ce
Lord
May
or
04/0
6/10
6:
00pm
St
Joh
n Am
bula
nce
Aust
ralia
St
Joh
n Am
bula
nce
Volu
ntee
r Fu
nctio
n Pa
lmer
ston
Vol
unte
er
Cen
tre
Lord
May
or
06 –
08/
06/1
0 al
l day
eve
nt
Inte
rnat
iona
l Eco
nom
ic
Dev
elop
men
t Cou
ncil
How
You
Bui
ld It
201
0 C
onfe
renc
e C
onve
ntio
n C
entre
, O
klah
oma
City
USA
Lo
rd M
ayor
08 -
09/0
6/10
all
day
even
t AT
SIC
Hou
sing
& S
ervi
ce
Infra
stru
ctur
e Ba
lanc
ing
Com
mun
ity
Enga
gem
ent &
Tim
ely
Del
iver
y
Mer
cure
Hot
el
Bris
bane
Lo
rd M
ayor
11/0
6/10
12
:30p
m
Nat
iona
l Exc
elle
nce
in
Teac
hing
Aw
ards
AS
G N
atio
nal T
each
ing
Awar
ds
Hot
el W
inds
or,
Mel
bour
ne
Lord
May
or
11/0
6/10
5:
30pm
The
Dea
n, W
arde
ns &
Cou
ncil
Mem
bers
of C
hris
t Chu
rch
Cat
hedr
al
Chr
ist C
hurc
h C
athe
dral
R
esto
ratio
n an
d R
enov
atio
n Ap
peal
Chr
ist C
hurc
h C
athe
dral
, Sm
ith S
t D
arw
in
Lord
May
or
11/0
6/10
6:
45pm
Au
stra
lian
Inst
itute
of
Arch
itect
s N
T 20
10 N
T Ar
chite
ctur
e Aw
ards
D
arw
in C
onve
ntio
n C
entre
Lo
rd M
ayor
12/0
6/10
7p
m
Filip
ino
Aust
ralia
n As
soci
atio
n of
the
NT
Inc
112th
Ann
iver
sary
of P
hilip
pine
In
depe
nden
ce
Filip
ino
Com
mun
ity
Cen
tre M
arra
ra
Lord
May
or
13/0
6/10
7:
00pm
Sk
yCity
Cas
ino
SkyC
ity A
nnua
l Par
ty
SkyC
ity T
erm
inal
Lo
rd M
ayor
14
/06/
10
5:30
pm
Paul
Arn
old
Bush
Pho
tos
Exhi
bitio
n of
New
Loo
k G
alle
ry
Cro
cosa
urus
Cov
e Lo
rd M
ayor
19/0
6/10
3:
00pm
D
irect
or o
f Dep
t Im
mig
ratio
n &
Citi
zens
hip
NT
Citi
zens
hip
Cer
emon
y fo
r Wor
ld
Ref
ugee
Day
201
0 Ji
ngili
Wat
er G
arde
nsLo
rd M
ayor
23/0
6/10
5:
00pm
C
reat
ive
Arts
& H
uman
ities
C
DU
Cou
rse
Rev
iew
Pan
el m
eet &
gr
eet
Ora
nge
6.1,
CD
U
Indo
nesi
an G
arde
n Lo
rd M
ayor
25
/06/
10
5:30
pm
NT
Thun
der
Offi
cial
Tea
m P
hoto
TI
O S
tadi
um
Lord
May
or
26/0
6/10
6:
30pm
Au
stra
lian
Arm
y Ba
nd C
orps
R
euni
on D
inne
r R
ober
tson
Bar
rack
s Lo
rd M
ayor
/ D
eput
y Lo
rd M
ayor
28-3
0/06
/10
all d
ay e
vent
Au
stra
lasi
a-C
hina
Sis
ter C
ities
C
omm
ittee
Au
stra
lasi
a-C
hina
Sis
ter C
ities
Su
mm
it Pa
rliam
ent H
ouse
, Sy
dney
Lo
rd M
ayor
74
74

ENCL: YESDARWIN CITY COUNCIL
DATE: 09/07/10REPORT
TO: CORPORATE & ECONOMIC DEVELOPMENT COMMITTEE/OPEN
APPROVED: BD
FROM: CHIEF EXECUTIVE OFFICER
REPORT NO:
10TC0039 BD:fm
COMMON NO:
315321
SUBJECT: REGISTER OF ELECTED MEMBERS PROFESSIONAL DEVELOPMENT ACTIVITIES AND LORD MAYOR DONATIONS / GRANTS FROM APRIL TO JUNE 2010
ITEM NO: 10.6
SYNOPSIS:
Council resolved that registers for the expenditure incurred for Elected Members Professional Development and Lord Mayor Donations / Grants be maintained and presented to the Corporate and Economic Development Committee Meeting quarterly.
GENERAL:
Council Decision No. 19/3186 (11/7/06)
K. THAT registers be maintained of expenditure incurred in professional development, Lord Mayoral Grants and Donations and that the registers be the subject of a standing agenda item of the Corporate and Economic Development Committee each quarter.
Corporate and Economic Development Committee Decision No. 19\3217 (18/7/06)
A. THAT as per Resolution ‘K’ Council’s Decision 19\3186, the Director Corporate Services prepare draft Registers for the expenditure incurred in Professional Development, Lord Mayoral Donations/Grants, for presentation to the July 2010 Corporate and Economic Development Committee.
Attached (Attachment A) is a list of Elected Members Professional Development Activities and Lord Mayor Donations / Grants from April to June 2010.
75
75

PAGE: 2 REPORT NUMBER: 10TC0039 BD:fm SUBJECT: REGISTER OF ELECTED MEMBERS PROFESSIONAL DEVELOPMENT
ACTIVITIES AND LORD MAYOR DONATIONS / GRANTS FROM APRIL TO JUNE 2010
RECOMMENDATIONS:
THAT it be a recommendation to Council:-
THAT Report Number 10TC0039BDfm entitled, Register of Elected Members Professional Development Activities and Lord Mayor Donations / Grants from April to June 2010, be received and noted.
BRENDAN DOWD CHIEF EXECUTIVE OFFICER
Any queries on this report may be directed to Fiona Murphy on 8930 0517 or [email protected]
76
76

PAG
E:
3 R
EPO
RT
NU
MBE
R:
10TC
0039
BD
:fm
SU
BJEC
T:
REG
ISTE
R O
F EL
ECTE
D M
EM
BER
S PR
OFE
SSIO
NAL
DEV
ELO
PME
NT
ACTI
VIT
IES
AN
D L
OR
D M
AYO
R D
ON
ATIO
NS
/ GR
ANTS
FR
OM
AP
RIL
TO
JU
NE
2010
Elec
ted
Mem
bers
P
rofe
ssio
nal
Dev
elop
men
t 2
009
/ 10
Elec
ted
Mem
ber
From
To
Ac
tivity
/ C
onfe
renc
e D
estin
atio
n
Reg
istr
atio
n C
osts
A
ccom
. &
Foo
d Tr
avel
Tota
l for
09
/10
Fina
ncia
l Ye
ar
A
ld M
itche
ll W
3578
/907
137.
27
Ald
Lam
bert
W
1145
/907
355.
45
A
ld E
lix
W11
20/9
07
0.
00
Ald
Dee
W
3574
/907
0.00
Ald
Gal
ton
W35
75/9
07
2,
988.
11
16
/05/
10
06/0
6/20
10LG
MA
Nat
iona
l C
ongr
ess
Ade
laid
e 1,
522.
7364
0.00
$759
.38
2,92
2.11
A
ld S
angs
ter
W11
42/9
07
0.
00
ATTA
CH
MEN
T A
Each
Mem
bers
of t
he C
ounc
il may
acc
ess
up to
$3,
102.
00(a
s pe
r the
Loc
al G
over
nmen
t act
) to
atte
nd a
n ap
prop
riate
and
rele
vant
con
fere
nce
or
train
ing
cour
se. T
his
will
cove
r tra
vel,
conf
eren
ce fe
es, m
eals
and
acc
omm
odat
ion.
77
77

PAG
E:
4 R
EPO
RT
NU
MBE
R:
10TC
0039
BD
:fm
SU
BJEC
T:
REG
ISTE
R O
F EL
ECTE
D M
EM
BER
S PR
OFE
SSIO
NAL
DEV
ELO
PME
NT
ACTI
VIT
IES
AN
D L
OR
D M
AYO
R D
ON
ATIO
NS
/ GR
ANTS
FR
OM
AP
RIL
TO
JU
NE
2010
Ald
Bai
ley
W11
46/9
07
1,
026.
20
A
ld S
jobe
rg
W35
76/9
07
2,
196.
82
Ald
Moi
r W
1151
/907
650.
33
19/0
5/20
1019
/05/
2010
LGW
L Fo
rum
A
dela
ide
n/a
169.
00$4
81.3
365
0.33
A
ld L
esle
y W
1269
3/90
7
3,51
7.80
A
ld M
arro
ne
W12
694/
907
10
5.00
Lord
May
or
W77
17/9
07
77
.27
A
ld K
nox
W19
735/
907
0.
00
78
78

ENCL: YESDARWIN CITY COUNCIL
DATE: 09/07/10REPORT
TO: CORPORATE & ECONOMIC DEVELOPMENT / OPEN
APPROVED: FC
FROM: GENERAL MANAGER, CORPORATE SERVICES
APPROVED: LC
REPORT NO: 10A0117
COMMON NO: 1646030
SUBJECT: WALKWAYS UPDATE
ITEM NO: 10.7
SYNOPSIS:
This report provides information on feedback received from local residents since May 2010 when Council resolved to adopt its new walkway policy and close a number of walkways.
GENERAL:
On 14 December 2009 (Decision 20/2337) Council resolved to permanently close 12 walkways and open permanently 3 walkways. This report provides information received from local residents as a result of that decision.
Complaints about antisocial behaviour in and around walkways are now referred to the Executive Officer Community Services. That officer has received favourable feedback from residents that have been consulted with regards their issues.
A number of formal submissions have been received which have been attached for information (Attachment A). The submissions are summarised as follows:
Walkway closure requested 5 Walkway open permanently requested 5 Night closure requested 2 Request to purchase walkway 3 Report of anti social behaviour 4 TOTAL 19
All these issues have been responded to at the time of receipt by referring to Council’s policy and advising the proponents their correspondence will be referred to Council.
79
79

PAGE: 2 REPORT NO: 10A0117 SUBJECT: WALKWAYS UPDATE
Overall the number of requests and submissions received has not been significant given the six month period and the number of walkways which have been closed.
A review of the nine (9) walkways currently being closed at night is underway. These walkways are being assessed for upgrade with the potential of recommending that they be opened permanently.
STRATEGIC PLAN IMPLICATIONS:
The issues addressed in this Report are in accordance with the following Goals/Strategies of the Darwin City Council 2008 – 2012 as outlined in the ‘Evolving Darwin Strategic Directions: Towards 2020 and Beyond’:-
Goal 2 Enhance Darwin’s Active, Positive and Flexible Lifestyle Outcome 2.1 Improve urban enhancement around Darwin Key Strategies 2.1.5 Participate and partner in activities that contribute to a safer Darwin
ENVIRONMENTAL IMPLICATIONS:
Methodology is based on best practice Crime Prevention through Environmental Design (CPTED) principles.
PUBLIC RELATIONS IMPLICATIONS:
Much improved.
COMMUNITY SAFETY IMPLICATIONS:
Significant.
RECOMMENDATIONS:
THAT it be a recommendation to Council:-
THAT Report Number 10A0117 entitled Walkway Update, be received and noted.
LIAM CARROLL FRANK CRAWLEYBUSINESS SERVICES MANAGER GENERAL MANAGER CORPORATE
SERVICES
Any queries on this report may be directed to Liam Carroll on 8930 0559 or [email protected]
80
80

DA
RW
IN W
ALK
WA
YS
Sum
mar
y of
Fee
dbac
k R
ecei
ved
sinc
e A
pril
2010
WA
LK W
AY
NO
.SU
BU
RB
FR
OM
TO
Fe
edba
ck A
pril
to J
uly
2010
19
N
akar
a C
opel
and
Crs
El
leng
owan
Drv
R
eque
st fo
r gat
es to
be
rem
oved
54
Le
anye
r G
rass
land
s C
res
Dar
ter C
rt R
eque
st to
be
perm
anen
tly c
lose
d 80
W
agam
an
Trow
er R
d A
mst
erda
m C
irc
Req
uest
nig
ht c
losu
re
83
Wag
aman
Va
nder
lin D
rv
Am
ster
dam
Circ
R
eque
st w
alkw
ay to
rem
ain
open
85
W
agam
an
Mal
ay R
d Va
ndie
men
St
Rep
ort o
f ant
isoc
ial b
ehav
iour
87
W
agam
an
Tasm
an C
irc
Pare
r Drv
R
epor
t of a
ntis
ocia
l beh
avio
ur
102
Wul
agi
Ros
ella
Crs
Va
nder
lin D
rv
Petit
ion
(Dec
200
9) to
per
man
ently
clo
se
126
Jing
ili
Wac
kett
St
May
hew
Cre
s R
epor
t of a
ntis
ocia
l beh
avio
ur
142
Moi
l Le
e Po
int R
d G
reen
woo
d C
rs
Res
iden
t wan
ts to
pur
chas
e w
alkw
ay
R
esid
ent r
eque
sts
wal
kway
to re
mai
n op
en
166
Mal
ak
Mad
dock
Crt
Mal
ak P
ark
Res
iden
t wan
ts to
pur
chas
e w
alkw
ay
175
Mal
ak
Prow
se C
rt M
alak
Par
k R
eque
st w
alkw
ay to
be
re-o
pene
d
R
eque
st to
be
perm
anen
tly c
lose
d 17
7 M
alak
Ab
raha
ms
Crt
Hea
rne
Crt
Req
uest
to b
e pe
rman
ently
clo
sed
180
Mal
ak
Cha
mbe
rs C
rs
Faw
cett
Crt
Rep
ort a
djac
ent b
us s
top
caus
es p
robl
ems
183
Mal
ak
Cha
mbe
rs C
rs
Faw
cett
Crt
Req
uest
to b
e pe
rman
ently
clo
sed
192
Kara
ma
Dul
verto
n C
rt Ko
olam
a C
rt R
esid
ent w
ants
to p
urch
ase
wal
kway
19
7 Ka
ram
a Ky
bra
Crt
Dul
verto
n C
rt R
eque
st re
ques
ts w
alkw
ay to
rem
ain
open
19
8 Ka
ram
a Ka
ram
a C
rs
Kwin
ana
Crt
Req
uest
for n
ight
clo
sure
to c
ontin
ue
81
81
A
TT
AC
HM
EN
T A

OPEN SECTION PAGE CORP 20\6
Corporate & Economic Development Committee Meeting – Tuesday, 20 July 2010
OPEN SECTION PAGE CORP 20\6
11 GENERAL BUSINESS
82
82


![3852 Storage Networking[1]](https://img.dokumen.tips/doc/110x75/577d33a31a28ab3a6b8b4fd8/3852-storage-networking1.jpg)