Embed Size (px)
Citation preview

© 2006 McGraw-Hill Ryerson Limited. All rights reserved.
1
Chapter 9: Production and Cost Analysis IIPrepared by:Kevin Richter, Douglas CollegeCharlene Richter,British Columbia Institute of Technology

© 2006 McGraw-Hill Ryerson Limited. All rights reserved.
2
Chapter Objectives 1. Distinguish technical efficiency from
economic efficiency.
2a. State the envelope relationship between short run cost curves and long run cost curves.2b. Differentiate between increasing, decreasing, and constant returns to scale.2c. Explain how economies of scale and diseconomies of scale influence the shape of long run cost curves.

© 2006 McGraw-Hill Ryerson Limited. All rights reserved.
3
Chapter Objectives
3a. Explain the role of the entrepreneur in translating cost of production to supply.
3b. Discuss some of the problems of using cost analysis in the real world.

© 2006 McGraw-Hill Ryerson Limited. All rights reserved.
4
Technical Efficiency and Economic Efficiency Technical efficiency – as few inputs as
possible are used to produce a given output.
Technical efficiency is efficiency that does not consider cost of inputs.

© 2006 McGraw-Hill Ryerson Limited. All rights reserved.
5
Technical Efficiency and Economic Efficiency Economic efficiency – the method produces
a given level of output at the lowest possible cost.
It is the least-cost technically efficient process.

© 2006 McGraw-Hill Ryerson Limited. All rights reserved.
6
Economies of Scale
There are economies of scale in production when the long run average cost decreases as output increases.
Economies of scale (increasing returns to scale) are cost savings associated with larger scale of production.

© 2006 McGraw-Hill Ryerson Limited. All rights reserved.
7
Individual Setup Costs
An indivisible setup cost is the cost of an indivisible input for which a certain minimum amount of production must be undertaken before the input becomes economically feasible to use.

© 2006 McGraw-Hill Ryerson Limited. All rights reserved.
8
Economies of Scale
Economies of scale occur whenever inputs do not need to be increased in proportion to the increase in output.
As output increases, cost per unit falls in the long run, so this can also be seen as an increase in productivity.

© 2006 McGraw-Hill Ryerson Limited. All rights reserved.
9
Minimum Efficient Scale
The minimum efficient scale of production is the amount of production that spreads setup costs out sufficiently for firms to undertake production profitably.

© 2006 McGraw-Hill Ryerson Limited. All rights reserved.
10
Increasing Returns to Scale (IRTS) Increasing returns to scale is where long
run average total costs fall as output increases.
It is shown by the decreasing portion of the LRAC curve.

© 2006 McGraw-Hill Ryerson Limited. All rights reserved.
11
Constant Returns to Scale (CRTS) Constant returns to scale is where long run
average total costs do not change as output increases.
It is shown by the flat portion of the LRAC curve.
© 2006 McGraw-Hill Ryerson Limited. All rights reserved.
12
Decreasing Returns to Scale (DRTS) Decreasing returns to scale or
diseconomies of scale refer to decreases in productivity which occur when there are equal increases of all inputs.
Decreasing returns to scale occur where the long run average cost curve is upward sloping, meaning that average cost is increasing.
© 2006 McGraw-Hill Ryerson Limited. All rights reserved.
13
Monitoring Costs
As the size of the firm increases, monitoring costs generally increase.
Monitoring costs are those incurred by the organizer of production in seeing to it that the employees do what they are supposed to do.

© 2006 McGraw-Hill Ryerson Limited. All rights reserved.
14
Decreasing Returns to Scale
Diseconomies occur for a number of reasons as the firm increases its size Coordination of a large firm is more difficult Information costs and communication costs
increase as firm increases Monitoring costs increase Team spirit may decrease

© 2006 McGraw-Hill Ryerson Limited. All rights reserved.
15
Team spirit is the feelings of friendship and being part of a team that brings out people’s best effort.
Decreasing Returns to Scale

© 2006 McGraw-Hill Ryerson Limited. All rights reserved.
16
Summary of Returns to Scale
Returns to scale Doubling inputs results in:
Slope of the LRAC
Increasing returns to scale (IRTS; economies of scale)
Output more than doubles.
downward
Constant returns to scale (CRTS)
Output exactly doubles.
horizontal
Decreasing returns to scale (DRTS; diseconomies of scale)
Output less than doubles.
upward

© 2006 McGraw-Hill Ryerson Limited. All rights reserved.
17
Long run average total cost
$64 62 60 58 56 54 52 50 48
11 12 13 14 15 16 17 18 19 20 Quantity
Minimum efficient scale of production
Typical Long Run Average Total Cost Curve
Economiesof scale
Constant returns to scale
Diseconomiesof scale
Costs per unit

© 2006 McGraw-Hill Ryerson Limited. All rights reserved.
18
Envelope Relationship
In the long run all inputs are flexible, while in the short run some inputs are not flexible.
As a result, long run cost will always be less than or equal to short run cost.

© 2006 McGraw-Hill Ryerson Limited. All rights reserved.
19
Envelope Relationship
The envelope relationship explains that:
At the planned output level, short run average total cost equals long run average total cost.
At all other levels of output, short run average total cost is higher than long run average total cost.

© 2006 McGraw-Hill Ryerson Limited. All rights reserved.
20
Cos
ts p
er u
nit
0 Quantity
SRATC2 SRATC3
SRATC4
LRATC
SRATC1SRMC1
SRMC2
SRMC3
SRMC4
Q*
Envelope of Short Run Average Total Cost Curves

© 2006 McGraw-Hill Ryerson Limited. All rights reserved.
21
Industry with Strong Economies of Scale

© 2006 McGraw-Hill Ryerson Limited. All rights reserved.
22
Entrepreneurial Activity and the Supply Decision
An entrepreneur is an individual who sees an opportunity to sell an item at a price higher than the average cost of producing it.

© 2006 McGraw-Hill Ryerson Limited. All rights reserved.
23
Using Cost Analysis in the Real World Some of the problems of using cost analysis
in the real world include the following: Economies of scope. Learning by doing and technological change. Many dimensions. Unmeasured costs.

© 2006 McGraw-Hill Ryerson Limited. All rights reserved.
24
Economies of Scope
There are economies of scope in production when the costs of producing goods are interdependent so that it is less costly for a firm to produce one good when it is already producing another.

© 2006 McGraw-Hill Ryerson Limited. All rights reserved.
25
Learning by Doing and Technological Change Learning by doing means that as we do
something, we learn what works and doesn’t, and over time we become more proficient at it.

© 2006 McGraw-Hill Ryerson Limited. All rights reserved.
26
Learning by Doing and Technological Change External economies are present in all
industries – those are the external forces at work which are capable of reducing costs for all firms belonging to the industry

© 2006 McGraw-Hill Ryerson Limited. All rights reserved.
27
Learning by Doing and Technological Change Technological change is an increase in the
range of production techniques that provides new ways of producing goods.

© 2006 McGraw-Hill Ryerson Limited. All rights reserved.
28
Production and Cost Analysis II
End of Chapter 9

© 2006 McGraw-Hill Ryerson Limited. All rights reserved.
29
Isocost/Isoquant Analysis
Chapter 9 Appendix
© 2006 McGraw-Hill Ryerson Limited. All rights reserved.
30
Isoquant Curve
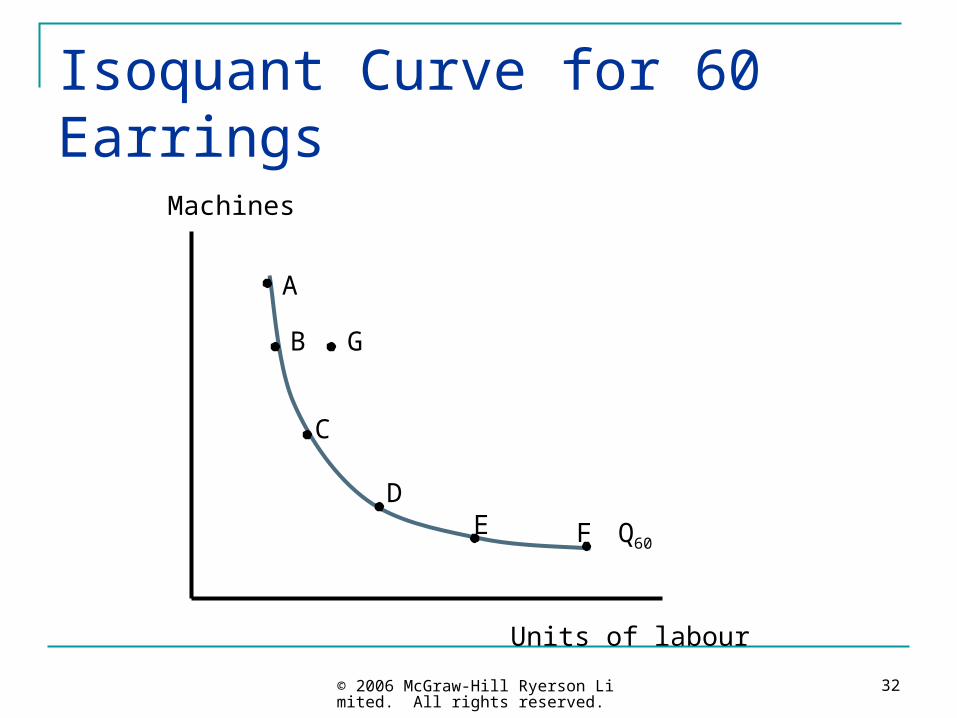
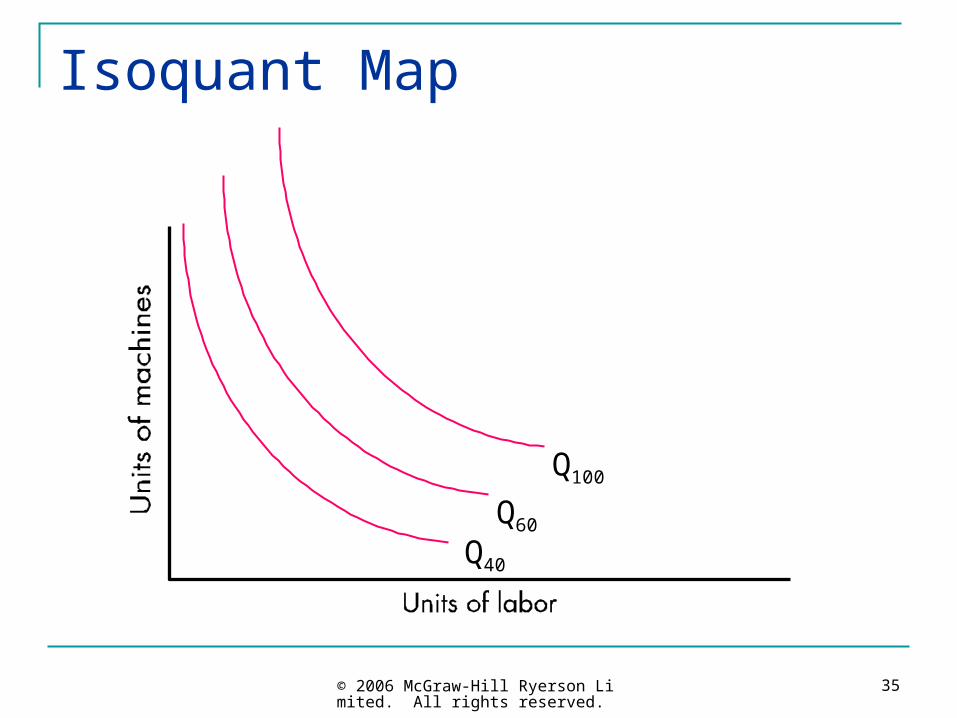
Isoquant curve –An isoquant curve (equal quantity) represents combinations of factors of production that result in equal amounts of output.
A point on the isoquant curve is technically efficient.

© 2006 McGraw-Hill Ryerson Limited. All rights reserved.
31
Isoquant Curve for 60 Earrings
© 2006 McGraw-Hill Ryerson Limited. All rights reserved.
32
Isoquant Curve for 60 Earrings
Units of labour
Machines
B
A
G
C
D
FE Q60
© 2006 McGraw-Hill Ryerson Limited. All rights reserved.
33
Isoquant Curve
Marginal rate of technical substitution – the rate at which one factor must be added to compensate for the loss of another factor, to keep output constant.
It is the slope of the isoquant curve.

© 2006 McGraw-Hill Ryerson Limited. All rights reserved.
34
Isoquant Curve
The absolute value of the slope at a point on the isoquant curve equals the ratio of the marginal productivity of labour to the marginal productivity of machines.
onsubstituti of rate MarginalMP
MPSlope
machine
labour
© 2006 McGraw-Hill Ryerson Limited. All rights reserved.
35
Isoquant Map
Q40
Q60
Q100

© 2006 McGraw-Hill Ryerson Limited. All rights reserved.
36
Isocost line
The isocost line (equal cost) represents alternative combinations of factors of production that have the same cost.
The slope of the isocost line equals the ratio of prices of the factors of production.

© 2006 McGraw-Hill Ryerson Limited. All rights reserved.
37
Isocost Lines
Units of labour
Machines
Slope = -Plabour/Pmachines
=-5/3
6 12
20
18
C
D A

© 2006 McGraw-Hill Ryerson Limited. All rights reserved.
38
Combining Isoquant and Isocost Curves
Units of labour
Machines
20
12
C
AB
MPlabour/MPmachines =Plabour/Pmachines
Q1
Q2

© 2006 McGraw-Hill Ryerson Limited. All rights reserved.
39
Isocost/Isoquant Analysis
End of Chapter 9 Appendix