Embed Size (px)
Citation preview
Munich Personal RePEc Archive
WORLD WAR III A TECHNO
ECONOMIC INTROSPECTION
Lahiri, Soumitra
Lahirionline.com
12 April 2007
Online at https://mpra.ub.uni-muenchen.de/8183/
MPRA Paper No. 8183, posted 10 Apr 2008 08:06 UTC
1
2
OVERVEIW
OVERVEIW
Present day popular interpretation of Technical Analysis of market trend is “ some
technology, that comes in the form of software, which helps one understand trend of price
movement of scripts/indices/commodities and thereby enabling one to fix price targets and
reaping profit from investment.” Costlier the software, the more user friendly are the
operations and lesser are knowledge requirement on part of the person operating the system”.
In brief, it has transformed itself as that kind of technology that helps in earning profits out of
the market and its application and use, mostly, is possibly not miles apart from one of the
primitive traits of gambling.
It is possibly the field of deployment/ application of this technology that has never
allowed it to prosper like other branches of social science. No wonder, we seldom find a
university curriculum that centers on market trend analysis. The easiness of its application,
the common thumb rules have seldom earned this branch of science recognition. Thus
common belief has never outgrown from the circumference of judging the market from the
angles of profit earning ratio vis a vis Demand supply comparison.
Little do we realize that from the time of advent of concepts like ‘Consumer Surplus’,
‘Law of Diminishing Returns’ etc, the science of modern Micro Economics began drifting
away from the rules of linier progression and started inclining towards the fact that human
sentiments are subject to the law of alternation. Given the same object of consumption,
depending on the status of overall environment, human behavior and/or reaction can vary
drastically and yield results that can be altogether divergent to common beliefs.
In other words, when dealing with human sentiment that is usually influenced by
surrounding environment, it is inapt to apply linier rules. As a matter of fact, it is incorrect to
draw any linier and/or non-linear correlation of human behavior to the environment or
external casualties. Human sentiment, truly speaking follows formological system, which is
neither linier nor non-linier in terms of event casualty because the cause of its process is not
events. A formological system is formologically casual, meaning that the form of the system
determines the shape of its process. Formological behavior is subject to Power Law that
evolves around Fractals or fractal formations.
3
What is Fractal? A fractal is an irregularly shaped object that is nonrandom in the
sense that its discontinuities (i.e. fluctuations) at all scales are similarly irregular. To make it
sound simple, Fractals are objects of nonrandom nature that tends to transform and/or repeat
them in a manner of branching out with a common factor of similarity that is dissimilar
within the overall structure of similarity. Fractals, therefore, can be self-identical where parts
are precisely the same as the whole or are self-similar only in that they are similarly irregular
at all scales. Fractals can also be robust in form where within a certain defined latitude, are
replicas of the larger forms. Scan on a two dimensional medium our blood circulation system
and our nervous system. Don’t the system of arteries branching out look similar? Yes the
mode is similar yet considered individually; each artery is different from the other. Why
human? The whole Universe is like that. The entire nature is a huge cluster of fractals and
human being an entity born within the very womb of nature, cannot go beyond the rules of
fractals in every aspect of metabolism and thought process. Human mind like human anatomy
is an all-encompassing complexity of fractals that originates from human’s basic instinct of
herdship and extends to various manifestations propelled either by environment or varying
depth of wisdom. That fractals comprise the very roots of human existence can be understood
from a quote published in New York Times of April 15, 1997 which goes as under:
“Dr. Ary L Gold Berger, director of electro cardiology at Beth Israel Hospital, determined
that healthy hearts exhibit slight fractal like irregularities- patterned variations of beating. A
heart beat that seems abnormally smooth and free of fractal variations may actually signal an
impending heart attack”.
This bit of rationalization is a gift of knowledge that has grown over the years. But it
is truly amazing to realize that concepts like ‘Consumer Surplus’, ‘Law of Diminishing
Returns’ or for that matter art of Wave Theory could grow about 70 years back when study of
human psychology or for that matter progression of sentiment had hardly developed.
Therefore, application of Technical Analysis goes much beyond the ambit of
judgment of market movement. Market, be it capital market or bullion market or for that
matter common market for purchasing day-to-day requirement is a place of interaction of
human or mass sentiment. The technology, besides being used as a tool for selecting a
portfolio that may prove most profitable to invest upon under a selected timeframe, can
effectively reflect the state of mind of the general mass/population. It is the most effective
tool to indicate where hysteria could be developing or where mass sentiment could have

4
started moving towards pessimism. The science of Technical Analysis being governed by
human’s social nature, it builds up on the plinth of formological concepts like Wave Theory
that is governed by man’s social nature and since he has such a nature, its expression
generates forms.
During 1930s, Ralph Nelson Elliot discovered that trend of human reactions/ nature
(reflected in terms of stock market prices) are susceptible to reverse in recognizable patterns.
The patterns he discerned are repetitive in form but not necessarily in time or amplitude.
Elliot isolated five such patterns or waves that recur in market price data. He named, defined
and illustrated these patterns and their variations. He then described how they link together to
form larger versions of themselves, how they in tern link to form the same patterns of the
next larger size and so on, producing a structured progression. He called this phenomenon
“The Wave Principle”. It was rather by accident (he was suggested by his publisher cum
friend) Mr. Elliot discovered close link between his theory and principles formulated by
Leonardo Fibonacci Da Pissa. Mr. Elliot called this as “ The Nature’s Law”.
The theme of the book has its plinth deeply cast within the parameters of Elliot’s
Wave Theory and applications of various Fibonacci principles. The book also refers to
findings of Mr. Samuel Benner who was possibly the first to document the rhythmic pattern
of stock/ commodity market price variations. Discovery of Mr. Nikolai Kondratieff (that
brought to life again which had been original belief of Mayas of Central America and also of
ancient Israelites) of the fifty to sixty year cycles of catastrophe and renewal also finds
extensive application in this detailed research work.
In other words, this is not a typical book of Technical Analysis that focuses only on
the markets. The basic aim behind compilation of this extensive research work is to project
the science of Technical Analysis as possibly the most effective tool that can be deployed to
determine the direction of movement of ongoing socio-economic evolution in the world. The
book besides analyzing various markets around the world, attempts to determine, through
study of events, as to how the present phase of hysteria could develop on a global scale and
sustain for so long.
Carl Jung (Swiss psychotherapist, 1875-1961) believed that the psychological
foundation we all share as human being makes us susceptible to ‘psychic contagion’ from
those about us. Today, because of electronic communications and mass media, such
5
contagion can rapidly become full scale epidemic. When this occurs, we are no longer
responsible, sensible individuals, but a herd. This is the situation today in the stock market,
virtually throughout the world.
What really drives an economic bubble or a stock market bubble (mania) is the
deepest level of the mind: The vast psychological powerhouse that we all share as members
of the same species; Jung called this the ‘collective unconscious’. This collective
unconsciousness does not erupt on its own, some external factors are required to instigate
and/or stimulate this mass euphoria. Jung believed that even highly self-aware individuals too
cannot escape the hypnotism /influence of this collective psyche. Mass sentiment is like a sea
which most of the time remains calm, but if storm arise, the little boat of our individual
consciousness do get swayed by the waves and are susceptible to being heaved around like a
cork. Such is the situation today in the stock market around the world. There is nothing new.
The purchasing power of money is constantly declining under the pressure of rising inflation,
the propaganda of so-called economic prosperity is nothing but a façade and viewed in terms
of gold, market indices do hardly indicate any noteworthy appreciation, yet every human
conscious is mesmerized with the idea of surfing at the crest of economic prosperity resulting
in market indexes of the third world countries float around in the Stratosphere.
The particular archetypal idea or image that enraptures people’s consciousness in the
stock market today, of essentially third world, is ascension or magical flight which has
happened due to gigantic generation of fictitious capital out of speculative trading and
investment that has flown in, of rather recent, in the camouflage of FDI (Foreign Direct
Investment). If we turn back pages of history and attempt reasoning as to what had resulted in
Tulip Mania (the first recorded economic bubble), we shall observe that over 300 years back,
Holland market had system of derivative trading comprising of futures and options (call and
put) that was nothing less advanced that what we witness in our markets now.
The ego inflation that causes the mass throwing off any and all caution, under the
influence of the ravishing archetype, is most evident in people’s attitude towards mutual
funds and FDI. The very idea that ‘ They will never let us down or that they will never leave
the market or that they will make us walk on the moon” causes this hysteria which is nothing
short of a mirage that generate out of vacuum and ends in nothingness. Jungian depth
psychology would condemn a unidirectional market as unhealthy and dangerous because
anything unidirectional eventually reaches an extreme that generates an extreme reversal,
6
which he termed as ‘enantiodromia’. Enantiodromia means a drastic reversal or swinging
over to the opposite.
What is the present state of world economy? The exchange value of US Dollar has
been declining over the years providing an extra bonus of exchange gain surplus with respect
to investments made in most of the third world countries. Rapid rise in FDI flowing in to
various countries based in Asia and Latin America resulted in shifting of the controlling
power to the investors / speculators due to low volume of market capital base there. To add to
misery was rampant trading in derivatives, especially options that led to accumulation of
wealth to the extent beyond reasoning or knowledge at this moment.
Most of the markets around the world, especially those of developed countries, had
experienced major fall during the years 2000 and 2003 with software and Dot Com boom
coming to an end. NASDAQ was worst hit by the crash. The index there had corrected by
almost 78%. Experts around the world attributed the correction to bursting of the stock
market bubble. What they did not realize was that, the retracements were not even amongst
markets. Furthermore, the fact that the bubble, ab-initio, had developed only in stock markets
of USA and not rest of the world had escaped detection.
The funds that came out from NASDAQ out of profit booking and disinvestments,
now flowed in to DJIA, S&P500 of USA and also markets of the third world and resulted in a
mania of much larger dimension.
Between May-July 2006 markets around the world experienced major correction
once again. Value of precious metal including gold did not escape virulence of the avalanche
resulting in gold price correcting from US$ 730 to US$543. On and from middle of June,
markets seemed to recover but by mid July, capital markets and bullion started moving on
divergent path. The divergence resulted in Gold price correcting again while market indices
of capital markets aiming at the sky. By October-November 2006 Gold too turned around but
by then a wide gap had developed between the two markets. Study of progression between
gold and capital markets indicates peculiar coincidence of gold price appreciation happening
when capital markets were experiencing temporary retracements or vice versa. Does this not
indicate flow of investment from Gold to capital markets and from capital markets to gold?
7
Starting from February 2007 world market is facing what we call enantiodromia. The
indices are correcting. It is not known whether this is the final correction but there is no doubt
that the bubble has burst and air out of it is gushing out slowly (fast on an extended time
frame). The biggest question faced by the world now is whether the bursting of the bubble
will bring in a deflationary environment as seeds of deflation are seen already germinating
very much within the core of rampant inflation envisaged everywhere.
‘Ke sera sera’ whatever will be, will be, but is it not important to investigate as to
how this economic menace could happen unnoticed by all? Was there any game plan
conceived by a few nations to make best use of the last bit of the Grand Supercycle that
began around 1789? Is it not important to rescan flaws remaining within the very system of
capital flow/accumulation and control?
The science of war, too, has undergone a sea of change. It is no more a concept of
battle of arms restricted to a specific war field. With the advent of globalization the
boundaries between countries have diluted. The new warfare recognizes no geographical
boundaries. It is clash of finance versus finance with ultimate objective remaining the same:
worldwide destruction and impoverishment of the rest of the world. Terrorist activities too
come within the ambit of this new framework of warfare that is nothing but deployment of
combinations. This is return of World War again. Whether we accept or not, truth remains,
World War III is going on, possibly since the year 1982.
At the beginning of this review, technical Analysis is seen to be a fantastic science
for deciphering the dynamics of any market, and at the same time, is also an effective tool to
read mindset of the mass that represents the status of socio-economic environment. It is not
just a medium to rationalize the past but does also facilitate a basis that can analyze the
present and indicate direction of the future. In brief, science of Technical Analysis is a
concept that enables us to summarize the entire process of socio economic evolution and
express the same in terms of some formula or logical derivation. That goes to show how
advantageous Technical Analysis is for us. However, though not intentional, yet, the book
happens to reflect its biggest disadvantage, where, deployed with ulterior motives, the same
science can/ has turned a few into ruthless, carefree psychic animals! After all did not
Janwillem van de Wetering say -Greed is a fat demon with a small mouth and whatever you
feed it is never enough?
8
This book dwells on the state of mania prevailing at most of the stock markets around
the world. The mania is also termed as stock market bubble that has led various economies to
a state of economic bubble as well. The presence of economic bubble is understood from the
sate of excess superficial liquidity visible in various economies that has resulted in lowering
of interest rates which again in cyclic effect has resulted in further market appreciation.
However, nothing in universe is permanent and this state of mania, too, is bound to end
sooner or later. Economic history of the world shows creation of alike economic bubble many
times earlier also but what is common is that each of these bubbles experienced burst when
they reached maximum state of growth only to crumble down to state of nothingness almost
in no time whatsoever.
It is not enough to infer existence of economic bubble unless reasons behind such
creation are detected. It is quite common for denunciations being rejected unless the
denouncer offers a "constructive criticism," that is, unless he puts forward a promising plan to
eliminate the evil he denounces. In other words, how much so ever words or phrases or pages
I may write detailing how ominous would be the consequences of an economic bubble, such
denunciation would truly deem meaningful and/or worth reading unless I have been capable
of assembling the building blocks which assembled together resulted in creation of this
colossal menace.
Economic scenario around the world has been positive since 2002. Thanks to
initiative from organizations like UNO/World Bank, world these days looks smaller with
geographical boundaries fading away yielding way for FDI (Foreign Direct Investment) to
percolate in all parts of the world. Especially the capital markets of the third world have
never witnessed this kind of prosperity ever in recent past. Another factor that helped the
economic boom has been the exchange value of US Dollar which has been steadily declining
against most of the other world currencies since the year 2002. US Dollar being still the base
currency for most of the international transactions/investments, its declining exchange value
helped growth of FDI since investments when effected in local currencies yielded additional
revenue, in real terms, on account of exchange gains. If World Investment Report is to be
perused, we shall observe that flow of investments accelerated tremendously from the year
2002 and exposure to enlarged demand scenario resulted in market appreciation in most of
the countries of the third world and that of USA.
9
The wave of liberalization, too, had a significant role to play in this newfound phase
of economic euphoria. Restrictions on investments diluted to a state of nullity under pressure
from G7 in most of the countries and as a result, investors from overseas now had wide
choice laid out in front of them to invest in whichever manner they wished. This also led to
widening and prosperity of derivative markets around the world and soon came a situation
where derivatives started governing the direction of market movement.
May-June 2006, markets irrespective of their nature, location crashed in unison. The
downward slide did not spare any segment, be it bullion, and be it capital market. Came July
2006, and world shook from the horror of Mumbai train blasts. Hundreds died. It was as if
return of September 11,2001 air strikes on the twin towers of Manhattan. Human civilization
seemed viewing a preview of its own extinction. Markets were expected to crash further
which, never happened. Good over evil prevailed, human irrespective of cast creed and
nationality, got united in solidarity, which led to capital markets bouncing back.
Even though the markets turned around, anomaly started creeping in. From July 2006
Gold price and market index started moving in divergent path. If capital markets appreciated,
Gold prices fell, when Gold appreciated, either capital markets corrected or moved sideways.
On and from January, 2007 Gold prices took off but failed to accelerate growth rate in capital
markets since most of them had reached levels never ever dreamed of even a couple of years
back. But the fact that at one time gold and capital markets had been moving in divergent
direction gave rise to question whether there had been flow of investments from gold and if
so, were such investments inflating market indices of capital markets?
Chart of Gold price movement placed beside charts of various capital markets around
the world indicate a peculiar trait of inverse variation. In other words, since July 2006, it is
noted that most of the pivots, from where gold price moved up, originated at a time when
capital markets experienced correction. Pivots from where capital markets derived
momentum to move upwards, happened when gold prices retraced downwards. Thus,
possibility of to and fro flow of investment between Gold and capital markets certainly
existed and could have just facilitated markets around the world with that slight extra
momentum that enabled the indexes to break the shackles of gravitational pull and get
airborne.
10
The investment scenario/preference underwent radical change with the arrival of new
millennium especially since 2002. Earlier, markets of the developed world that enjoyed the
fancy of the investors drifted to the second row and as the first choice immerged markets of
the third world especially those of Latin America and Asia. Dow Jones and S&P500 still led
from the front but it was markets of the third world that never sufficed much fancy only a
decade back, now recorded unprecedented growth. Liquidity seemed to pour from
everywhere and GDPs just zoomed upwards. Leaving aside statistics of GDP, which we shall
deal with later, if we look in to the size of market cap of various countries, we shall observe
that it was USA and Japan which comprised 50% of the global market capitalization. If we
would further segregate markets of the developed world therefrom, the portion that would
remain would truly be near insignificant amount that would always be susceptible for being
entirely or practically totally being taken over if global investments would flow in. In other
words, prime logic behind investments flowing in to third world was that interalia facilitated
investors of taking over sizeable chunk of the market itself and thereby possess requisite
power to maneuver the direction in which the index would move.
Under a situation where a small number of investors would gain control over the
market, it would be imperative that market would become imperfect and gap between the
market and its index would widen leaving a huge void in between that would gradually bloat
up to form the bubble. Derivatives comprising of futures and options under a state of
declining exchange rate became the main source of income generation as therein investments
will grow in multiplier effect rather than simple appreciations noticed under normal
circumstances.
However first step to determine likely longevity of this economic/investment
exuberance will be to examine charts of US$ exchange rate variations against various
currencies of the world and to determine as to how long this phase of declining Dollar value
would continue. In this book a number of such charts have been examined and it is observed
that such declining trend, mostly commencing around the year 2002, is a normal retracement
process that would wither out sooner or later. In other words, this trend of local currencies
gaining against US Dollars is not a permanent proposition and soon the trend will reverse
changing the scenario drastically.
Tabulation of market decline between May 2006 and July 2006 vis a vis index
appreciation thereafter till February 2007 indicates that in most of the capital markets,
11
indexes not only recover cent percent of the fall but have also moved far above their all time
highs. In terms of market appreciation, markets of the third world have overtaken their
counterparts of the developed world by a wide margin. Economic growth of these nations
irrespective, it is highly doubtful as to how much of this appreciation was real. Generation of
fictitious capital is almost certain and chronological to such short duration market ecstasy that
is essentially propelled by speculations in derivatives on a mass scale.
If we adopt DJIA chart as representative of world market, it is seen that the present
upward wave began essentially around 1990 and by now has run approximately 16 years.
Here I intend to draw attention to Mr. Samuel T Benner’s vision in his landmark book
Business Prophecies of the Future Ups and Downs in Prices published in 1875. With respect
to economic low points, Benner noted two series of time sequences indicating that recessions
(bad times) and depressions (panics) tend to alternate. His observations find substantial
support in Elliot’s Wave Theory, which too evolves around the process of alternation.
However, Benner adopted two time series like 8-9-10 years and 20-18-16 years for bad and
good time to alternate. However, following the subsequent research work, on this subject,
indicates that time series changed to 16-18-20 years fits better Fibonacci cycles and apply
more accurately to present day economic cycles.
Coming back to DJIA charts, it is observes that the upward cycle commenced around
November 1990 and therefore has lasted approximately 16 years. Thus, following Fibonacci
Benner cycle, the downward cycle could last 18 years from now or say up to 2025. In other
words, while world economists are tearing their hair apart in finding out measures to curb
inflation, world economy is passing through a transition phase that moves it from inflation to
a state of deflation which could last up to minimum 2025.
It is easy to draw conclusions especially when such conclusion talks about
eventualities likely to occur 18 years later. Unless we determine the reason for the market fall
during May- July 2006 market fall and manage to correlate the same to the overall rising
market trend persisting since 1990, the presence of economic bubble will not get
substantiated convincingly. And if existence of economic bubble is not established,
conclusions drawn will never acquire any material and/or reliable status.
While hunting for various socio-economic events happening between April and July
2006, I chanced to land up on Bank of Japan announcement of rate hike during July 2006.
12
Considering the fact that USA and Japan constitute between themselves almost half of the
world economy, it goes without saying that economic policies promulgated in these two
countries have worldwide implications and effects. Moreover, it is known to all, that Japan
had extended over US$ 1 trillion as loan in open market for over a decade and that too at
almost zero rate of interest. Ever since July, 2006 Bank of Japan shifted from the policy of
providing loan at almost zero rate of interest and ushered a new policy of gradually raising
the interest level. As a matter of fact, the way Bank of Japan has been progressing, it appears
that they would come at par with US Federal rates by 2014. With rumors of likely rate hike
circulating in the world market, it will not be illogical to consider this factor as a major factor
that could have influenced market turbulence during 2006.
We need to appreciate here that Board members of Bank of Japan did not wake up
one sudden morning in July 2006 and moved forward to initiate a trend that tantamount to
reversal of their stand for over one decade. In other words, news of the impending change in
stand spread from May 2006 itself and a large portion of investors around the world resorted
to booking profit in order to repay the loan outstanding or part thereof. Obviously question
has to arise here as to what difference could it have made since the quantum of interest
imposed by Bank of Japan was only 0.25%.
The thought process behind this symbolic imposition of interest was much more
complex than what surfaces superficially. Bank of Japan and Federal Bank of USA are
known to keenly watch each other. These two countries comprising between themselves
almost 50% of world economy literally determine path for rest of the world to follow through
their respective finance policies.
It is a fact that raising interest level by 0.25% is of hardly much significance and on
the face of it, should not have resulted in a worldwide market correction unless there had to
be factors beyond the imposition of said symbolic interest. Apart from interest exchange
value of local currency (here Yen) or rather the progression of its exchange rate offers the
second clue.
Before getting to analyze impact of Bank of Japan policies, we need to understand
economic background of the country. If any country would claim being most affected by
World War II it would undoubtedly be Japan since the war had left the country totally
devastated. Furthermore, the country had practically no natural resources and a population
13
that was aging. The birth rate in the country was one of the lowest to add the final keel to the
coffin of discomfiture. To overcome all these handicaps and to prosper the country had no
other option but to avail international finance that came by way of loan and to expand the
tentacles of its economic infrastructure beyond the geographical boundaries of the nation
where skilled labor and infrastructure facility were abundantly available.
1966 to 1982 was a period of economic slump for practically the whole world. While
the global economy struggled to overcome the adverse effects, Japan availed the opportunity
and expanded its industries practically all over the developed world. Setting up industries and
consolidating monopolistic control over various commercial sectors topped their agenda and
the same was effectively accomplished well in time before the economic slump could be
over. To bring about this economic prosperity and to motivate entrepreneurs from Japan to
move out, Bank of Japan almost tip toes US Federal policies and kept their interest rates well
bellow the levels declared by FED at USA. Availability of cheap loans facilitated
industrialists from Japan to expand their commercial base out side Japanese territory and
declining exchange rates of Japanese Yen facilitated borrowers with handsome capital gains
that took care of most of negligible borrowing cost and repayment installments as well.
Around the year 1982, Japanese Government possibly realized that the country had
achieved the economic status that they had aspired for. Furthermore, international loan
burden that the country had imposed on itself was colossal too and cost thereof was coming
to almost 170% of national GDP. There were only two ways in which Bank of Japan could
direct the economy to avoid impending economic collapse that loomed ominously. The first
choice was to make Yen gain on exchange value and the second choice was now to direct
investments abroad essentially in capital and bullion markets wherefrom handsome returns
could flow in at much shorter intervals.
Precisely around November 1982 there was a lateral shift in policies/circumstances,
which is somewhat, reflected in terms of BOJ interest rates. US FED rates were on upward
move since 1978 and stood at 14.94% in June 1982. From July 1982, FED rates started
declining and in October 1982 from double digit, it reduced to 9.71% and in the month
following to 9.2%. Between October 1982 and March 1983, US FED rates declined from
9.71% to 8.51%. In contrast to the above, Bank of Japan (BOJ) which had stipulated 5.50%
interest during December 1981, did not alter their rate till September 1983. This resulted in
narrowing of the gap between the two rates to an extent never witnessed ever before. The
14
strategy worked wonders and as if by magic, reversed the trend of exchange rate of JPY. JPY
started gaining against US$ and the exchange rate fell from US$-JPY 277.45 to JPY 235.7
between November 1982 and March 1983.
Bank of Japan there since kept on fluctuating their interest rates. They read the
economic, especially investment, scenario well enough. Whenever investment market needed
additional boost, the gap between US FED rates and BOJ rates expanded and when it would
be time to realize gains out of such investment, the gap would narrow to quench the money
supply. This policy of systematic rate fluctuation helped BOJ in reducing exchange value of
US$ from 277.45 of 1982 to mere 79.70 by 1995. The appreciation in Yen’s value helped
Japanese economy tremendously and in true sense reduced their loan burden by 71%.
Around 1995, Bank of Japan realized that investment market around the world was
about to heave upwards and that it was time to cajole investors from Japan to start investing
in overseas markets. Thus, even though, between November 1994 and May 1995 FED rates
went up from 4.76% to 6.01%, BOJ stuck to their 2.5% interest till March 1995 wherefrom
gradually brought it down to 1% by May 1995 and took the final step of brining down their
interest rate to mere 0.50% during September 1995. In other words, Japan, through their
policies played a key factor in the Dot COM mania that hypnotized investment world
between 1995 and 2000.
Like all mania, IT mania, too, ended in 2000 resulting in total chaos. Wherever IT
enjoyed lions share of the weightage, the devastation were more severe. NASDAQ was one
of them. The panic caused by sudden profit booking and mass exit of FII, sent the index
whirling down from 5132 to 1108 by October 2002. DJIA had a wider spread. The sell off
happened there also, but the impact was lesser in magnitude.
The crash of IT mania possibly led the bunch of investors shift profits from IT based
market to bullion and also to capital markets of the third world. As DJIA and S&P500 held
their relevance and impacted smaller markets of the other world, investments were directed
thereto also. With agenda being ready, BOJ reduced their rates in February 2001 from 0.50%
to 0.35%. 0.15% interest waiver was nothing but symbiotic. It conveyed the message to
Japanese investors to get ready to move forward again. Interest came down by another 0.10%
the following month. JPY fell against dollar but gold price moved forward again. On 1st
September2001, BOJ went for the kill and reduced their rates to nullity (0.10%).
15
September11, 2001 World Trade Center broke down like a pack of cards but mass sentiment
retaliated, markets all around absorbed the shock and as if to defy the horror, leaped forward.
Japan had won the game. US$1 fetched JPY 135.32 during January 2002. Even
though JPY had fallen in value, BOJ could relax as returns would soon start pouring in and
would elevate JPY value. They knew their net worth was bound to rise to new levels with
appreciation of the value of their investment and profits out of fund rotation outgrowing even
the sum invested.
By January 2005 JPY exchange value touched a new high (US$1= JPY 110.65) and
why should it not with Gold price shooting up to $456.75 (Dec 2004), DJIA jumping up to
10867 from the low of 7197? The third world markets were rising at unprecedented pace.
Peru Lima General rose from 1110 to 3935 and Jakarta composite from 323 to 1049 to name
a few. BOJ now had nothing to do but to sit and watch. The investors, including the ones
originating from Japan, gradually turned their attention to the largest democracy in the world
i.e. India since this country retained the potential to generate returns what 10 other third
world countries, taken together, could not.
Around May 2006 markets around the world reached an unprecedented high. Gold
value also appreciated to $730 levels. Bank of Japan read the investment market bit too well.
They could well realize that the Grand Supercycle had ended or was nearing completion. In
other words, time had come for investors to gradually withdraw their holdings and return
home with their gains. And in order to promulgate their message, without raising much
suspicion around, Bank of Japan increased their rates from 0.10% to 0.40% and thereafter in
February 2007 to 0.75%.
Considering the fact that Japanese funds have generated around the world trillions
worth of investment and disinvestments would happen global economy is sure heading
towards a major, if not total collapse. With regard to Japan, who has so long been servicing
their overseas loans out of exchange gains and profits derived from investments, the
likelihood of achieving unprecedented economic prosperity is almost certain. Japanese Yen
value is bound to appreciate and time is not far when US$ would possibly fetch JPY 50 and
30 in between.
16
Though end of the day charts of various capital markets around the world resemble
each other, disparity of trend assume stunning proportion when same charts are viewed under
extended time frame of month or year. While some charts indicate influence of mania, some
show recovery subsequent to the holocaust being left behind by mania. While some charts
indicate bright prospects ahead, for some the depths of depression could be just round the
bend. In other words, it becomes next to impossible to arrive at any uniform conclusion as to
the state of global economy.
Existence of economic bubble or mania over a large portion of the world is
unquestionably evident and there is no denial of the fact that these markets which now dwell
in the seventh heaven of delight, have their economic foundations corroded beyond repair
under the acid reaction of mania. What is mania after all? As defined by Robert R Prechter Jr,
“Historians characterize a mania as a kind of madness that takes hold of a population. The
widely shared illusion of endless huge profits that propels a mania also produces another kind
of madness: anger. Though the media report new highs in averages with giddy demeanor; it is
a clown mask that hides a miserable soul”. In other words, mania is a state of myth where
mirage is viewed and interpreted as reality by the mass. Economic history of the world has
witnessed many mania so far with each one of them crashing down after reaching a state of
maximum acceleration. The recent most real life example of such burst of bubble is Dot Com
mania in which NASDAQ crashed from 5132 to 1108 between March 2000 and October
2002.
Thus, the ultimate outcome of mania prevalent in DJIA, S&P500 plus most of the
Asian and Latin American countries is known. What is uncertain at present is whether air has
already started oozing out of the bubble and also the extent of rampage, which these markets
are likely to face when real impact of the burst will be felt.
Examining monthly charts continent wise indicate existence of Mania in DJIA, S&P
500. Presence of mania is viewed in most of the Latin American markets as well as those of
Asia (mainly China, India, Jakarta, Singapore etc). Surprisingly Japanese markets and
markets of European origin reflect normal growth and likelihood of achieving phenomenal
prosperity in times ahead. Thus, it is a fact that while a major portion of the world will plunge
deep under the perilous effect of bursting of the economic bubble, markets of Europe and that
of Japan will eventually rise high up in dazzling under the glory of prosperity. Such inverse
17
relationship between markets can only happen if the likely gainers have caused this mania or
rather engineered to make this happen.
European markets enjoy the unique facility of sharing a common currency and also
uniform trading umbrella of European Union. Better market control on part of European
markets as well as that of Japan, helped them in saving their markets from becoming subject
of any bubble creation. In addition to the above, investors from these countries, under a
regime of global liberalization, took advantage of negligible screening/restrictions eventually
assumed virtual control of a large number of stock markets and thus, resulted in this massive
bubble to bloat up.
Analysis of charts of both Euro Dollar and Japanese Yen indicate likelihood of these
currencies appreciating in exchange value to US Dollar in near future, which doubly testifies
the fact that these economies are at the verge of final take off. If old data pertaining to GB
Pond Sterling is checked it will be observed that there was a significant drop in its exchange
value between September 1992 and February 1993 which could possibly have been more due
to flow of outward investment and not essentially due to what is the common belief of
currency fluctuation at the onset of dual currency system. To put it in brief, currency charts of
both JPY and Euro provide outlook of likely economic prosperity which respective capital
markets do also correspond. Analysis of chart of Hong Kong Dollar indicates the likelihood
of this currency loosing out to US Dollar in near future and therefore, if there exists a cartel
of countries that have planned out and imposed mania on USA and most of the Third world
countries, Hong Kong is surely, not a member to the same.
Evolution of economics over the years has taught human civilizations to call a spade
a spade. Earlier economists, who used to shun concepts like economic bubble as frivolous
utopia, now find no hesitation in acknowledging the same. Credit for such shift in attitude
goes to Nobel Lauriat Dr. Vernon Smith who proved possibilities and mechanism of mania
under closed-end country funds and experimental markets. Mania is, as stated earlier, a phase
of unprecedented market appreciation, mostly centered on the market index that is caused by
hypothetical excess liquidity, leading to a state of speculation that causes unidirectional
movement of the index with occasional incomplete retracements that invariably end much
before reaching their likely destination. Such state of mania or stock market bubble often
results in infecting the economy as well on the whole and cause eruption of economic bubble
in general.
18
On March 20, 2007 China’s securities regulator barred companies from using
proceeds from share sales to invest in stocks, in an attempt to damp overheating financial
markets. The companies were also banned from buying derivatives and convertible bonds
with share sale proceeds in order to safe guard Shanghai’s Capital Market from occurrence of
mania. The regulators were apprehending that speculators were fuelling stock market frenzy
and that it was about time for implementing control to safeguard occurrence of the bubble
which sooner or later would burst invariably.
Another proof of Governments and economists acknowledging occurrence of stock
market bubble came when Mr. Jim Saxton Vice Chairman of the Joint Economic Committee
of the United States Congress tabled during March 2004 a joint economic committee study
titled “INTERNATIONAL ECONOMIC PERFORMANCE SINCE THE STOCK MARKET
BUBBLE”.
In other words, call it economic/stock market bubble or mania; the phenomenon is
now an accepted fact and the existence of such situation in present market is also duly
authenticated by the declaration of March 20,2007 made by Chinese authorities.
Now that we know that mania has set in to most of the capital markets of the third
world and that of USA, it becomes imperative for us to understand the nature and extent
impact that may follow chronologically to occurrence of such imperfection. Mania, as stated
earlier, happens due to a state of excess superficial liquidity or wherein big money chases to
acquire a segment of assets. If we turn back pages of history book of the world and look in to
what caused bubble in Holland, referred to as Tulip Mania, during the 17th century; we shall
observe that even during those days markets in Amsterdam facilitated investors with a
derivative market possibly as sophisticated as we visualize now. It was and it is centering
control of index movement amongst a handful of investors who indulge in rampant trading in
to Futures and options, which causes mania to occur.
Trading in derivatives facilitate investors with the opportunity of multiplying their
investments within a reasonable short period of time and thereby generate a state where
market gets propelled by movement of fictitious capital. The market index under this state
grow by leaps and bounds not due to any economic prosperity but as a result of wide spread
19
speculative investment pattern. Volumes practically escape from these markets and gap
between market in general and index in particular widen to an extent of absurdity.
Besides trading in derivatives and uncontrolled flow of foreign investments, another
factor that motivated influx of investments since 2002, was perpetually declining exchange
rate of US Dollars. Declining Dollar value facilitated investors with a substantial amount of
extra income that ended up being reinvested in the market adding to the volume speculative
funds causing the bubble. If we take for example Indian market and National Stock Exchange
(NSE) we shall observe that simply by availing the exchange gain and reinvesting the same in
index futures, investors could generate a return of 177% per annum during the period from
May 2006 to February 2007. Simply by concentrating focus on market index and index based
stocks and estimating on a very conservative basis, we shall observe that possibly official
Foreign investment of US$ 87 billions in this country may have grown to a magnitude of
minimum US$ 500 billions.
If on a conservative estimate US$ 87 billion can grow up to US$ 500 billion in India
alone, the magnitude of sum that could have accumulated now, in global perspective, value of
investments could be a sum beyond imagination possibly be good enough to buy entire IMF
and World Bank, not once but twice and thereafter to give it away on charity.
It needs no special emphasis to explain the nature of impending economic chaos
when these huge investments start drawing out of the markets. A question might arise here as
to why should it so happen? The reason is human nature that is subject to natures’ law. Even
satisfaction and greed is subject to an ultimate limit whereafter the decline and/or the process
of decay automatically sets in. This is the sole reason as to why each and every mania ended
in a huff and inflation gradually evolving in deflation and/or vice versa.
However, there will be an exception when the exodus actually happens. Markets
irrespective of their geographical location will face massive corrections but magnitude will
differ. While some economies will move deep in to the tightening tentacles of deflation, a few
will escape such eventuality and after a pause for a while will actually record tremendous
economic prosperity. Economies like Japan and European Union come within the
classification of those whose futures look bright. It needs no extra efforts to infer what is
there in store for USA and most of the Latin American as well as Asian economies. The new
era that is likely to evolve, going by Fibonacci Benner cycle, may last for minimum18 years.
20
If we take a look at the Grand Supercycle of the world economy we shall notice that
the cycle began some time around 1789 and have run possibly full five cycles described by
Mr. R.N. Elliot. It could well be possible for the Grand Supercycle to have actually ended
during May 2006 in which case the turbulences erupting thereafter could be consequent to
Wave A that is likely to follow. The phase of correction (Wave A) has started and has already
yielded an expanded flat correction since May 2006. Considering the fact that Wave (II) had
taken almost 30 years to complete, the present phase of decline, which will comprise of ABC
corrections, which may continue for about same duration, as that would only conform to rule
of alteration that is an economic compulsion/eventuality.
No discussion about world economy truly gathers moss unless Gold features some
where in between. Even though with world has drifted far from the notion of gold currency to
more recent concept of paper currency, gold was and continues to be what money truly means
in real sense of the term. The currencies floating around the world are essentially monopoly
money imposed on people by respective Governments and fundamentally base on
nothingness. Since evolution of concept of capital human have expressed and possessed their
wealth in terms precious metals and such preference will never end unless science of
economics invent a better and trustworthy medium of expression of possession of capital.
Study of gold chart of recent time indicates for sure that there exists no bubble there.
On a short term plat form restricted to price movement since 1999, the appreciation from
$300 levels of 2001 to $730 during May 2006 resemble that of a short term motive movement
resembling that of Third wave under Wave Theory developed by Mr. R.N. Elliot. Subsequent
retracement to $549 levels may constitute normal retracement to regression channel or could
have been consequent to corrective 4th Wave. As the chart indicates, a full-scale appreciative
5th wave is still pending wherein price of gold should move above the high of May 2006 i.e.
$730 levels.
The paragraph sited above is bound to sound confusing as it superficially contradicts
the inference of impending deflation over a major part of the world. It must be understood
here that first signs of deflation comes from rising gold prices. This peculiarity of initial
divergence in progression happens with gold consequent to people in general loosing faith in
the money/currency they possess. Under a scenario of all round price structure crumbling
down and accelerated value depreciation of assets including money, people usually opt for
21
the real money (i.e. gold) to salvage their savings by converting their capital in real terms of
gold. In other words, the first proof of deflation happening will come if gold price start
shooting upwards. Even under this scenario, a number of investors who will be liquidating
investments in capital markets will avail the last chance of inflating their wealth by entering
in to the gold market. Thus, irrespective of deflation to happen or not, likelihood of gold price
shooting up well beyond $730 levels does appear truly bright.
Consequent to bubble bursting in capital markets, the effects of contraction will
extend to overall economy in general which by now has also turned in to a huge bubble
created out of pyramids of debts. When installments of repayment start failing at the bottom
layer of this pyramid, spiral effect will shake the very core of every economic structure and
cause wide spread havoc and chaos. Governments will go frenzy to collect every collectible
as they too will face immense pressure from the lenders and/or investors who will demand to
repatriate their belongings. Scramble for currency and collectible will, for a while, increase
demand for currencies especially for US Dollar.
Like all motive waves end, the upward 5th Wave of gold too will end and possibly as
a reason for US Dollar value appreciating at a pace higher than that of gold. Thus, gold prices
will start correcting herefrom as well initially as a reaction to that of appreciation to US
Dollar value and thereafter due to profit booking and disinvestments. Technical analysis of
gold prices indicate possibility of gold price appreciating up to $850 or $1000 levels in short
run and thereafter to correct back to $540/$490 levels again.
In other words, going by technical analysis norms a roller coaster ride is apprehended
for gold prices in which during the first phase the price of gold will shoot up to $ 850 levels
or higher to be followed by an equally dynamic correction pushing the price of gold down to
$490 levels or much lower.
How can we be so confident? Let us expand the timeframe of our study and look in to
the gold price progression of earlier years as well. 1967 to 1980 (13 years) was the
prime time for gold during which the price appreciated from $197.50 to $850 levels.
Hereafter, gold prices have essentially been experiencing bear market and under no
circumstances shown tendency of developing in to a appreciative motive cycle
chronological to bull market. Even present appreciation is not an exception and does
22
constitute nothing but an inverse retracement that would wither off in time and if gold
price will run full ABC cycle, its price must eventually correct back to where it began
from in 1967 i.e. $ 197.50.
26 years have already gone since 1980. With gold movement, time and time again, showing
tendency of adhering to Fibonacci ratios, numbers etc, the downward cycle can enfold
anything between 34 to 55 years to complete. In other words, it may be another 8 years from
now or19 years. For me 19 years time seem more likely as that coincides with Fibonacci
Benner cycle which indicates 18 years of decline for most of the flourishing economies now.
Statistical sampling of GDP of various countries around the world indicates an
average growth rate of 4.78%. While calculating GDP of a nation, incomes from various
sectors are tabulated. The sum total of such tabulation, rationalized by the index of inflation,
leads to GDP formulation in real terms. In other words, GDP is the average yield of all
sectors of an economy. Thus, within the overall circumference of GDP nomenclature yields
/rate of growth are free to vary from sectors to sectors and also from one branch of commerce
to the other.
However, within the relaxation of varying output, if one branch of economy suddenly
start indicating disproportionate rate of growth possibly due to sudden rise in liquidity,
element of imperfection is interpreted as the cause for such irrational exuberance. This
imperfection factor perpetuated in a mass scale leads to mania. In other words, when
investment grows at a rate multiple of GDP and/or interest rate mania happens. Values of
scripts in this state increase disproportionately without any relevance to income yield. Scripts
are bought at this time not based on either their intrinsic value and or income generating
potential. Instead the yardstick for present valuation rests on the likely capitalized value of
possible future gain out of price difference between the time of purchasing and selling off.
This era essentially derives boost if interest rates in a state are on declining scale since that
results in higher capitalization factor. Trade evolution under this phase often flourish based
on creation of shadows where gains are generated in geometric proportion based on the
factors of uncertainty and risk. Thus, emphasis of capital market shifts from trading of
physical scripts to derivatives comprising of futures and options.
It may be worthwhile to add that no mania is possible in an economy unless the same
has been facilitated with tacit support, either directly or indirectly, by the Government or like
23
bodies. If we look in to the present state of world economy, we shall observe that
Governments all around along with UNO have propagated regime of liberalization and
globalization almost as a rule of must without truly investigating in to what possible negative
effects the proposition could associate. World Investment Report of 2006 indicates magical
figures of growth in foreign direct investments and also shifts of choice of directing
investments to third world countries.
The said report projects FDI to developing countries during the year 2005 at US$ 542
billion which truly is a colossal amount especially when totaled to the investments that had
flowed in prior to 2005. The Investment Report mentioned about the emerging trend of
declining interest rates but remained silent on the aspect that such decline was actually
instigating economic bubble to happen all around.
Funnily the report, stated above, also talks about rise in investments directed by
private equity funds that normally shifted investments in a time span between 5 to 10 years
and also about funds moving around which are generated from undisclosed sources
essentially routed through offshore institutions of places like Virgin Island, Isles of Man,
Mauritius etc.
To make the long story short, there are ample evidences to exhibit as to how liquidity
appreciated on a global scale in the recent years and link between the same and the present
state of irrational unprecedented market exuberance in DJIA, S&P500 and also markets of
Latin America and USA. The only thing that we do not find is the missing link of control,
which, if existing, could have saved majority world population from the perils of impending
economic catastrophe.
As usually envisaged during the ultimate stages of economic or stock market bubble,
cracks have already started happening within the economic infrastructure. From a state of
excess liquidity, economies that necessitated more and more exposure to creation of debts,
now cry of liquidity crunch. Not surprisingly during February 2007, Government of India had
to resort to importing U$$ 8 billion to stabilize its fund reserve. Interest rates that kept
perpetually spiraling downwards have taken a swing upwards again to turn the situation
worse. News of failures within various debt cycles have started hitting headlines of media
again and there is fear all around that multitude of crisis like housing collapse, subprime
chaos, bursting of liar loan balloon do not spill out of the boundaries of USA. Times have
changed as acknowledged by US Federal Reserve Governor Ms Susan Bies who said that
24
subprime defaults are at the ``beginning of a wave'' and banks are likely to see more missed
payments and foreclosures as consumers with weak credit histories begin to face higher
monthly mortgage payments.
There is no doubt that as mentioned by US Federal Reserve Governor Ms Susan Bies,
times have truly changed and we are truly standing at the threshold of a new era initial signs
of which are rather scary. Failure of subprime or liar loans should not worry people much
since fundamentals of present day macroeconomics is deeply enrooted in the shallows of
misconception and deceit.
The indices, being recast in terms of gold, actually indicate that most of the
worldwide indices have actually corrected between 2000 and 2003 and moved sideways
thereafter. There have been a few exceptions to the above also like that of India where index
appreciation, in terms of gold, have edged past its value in 2000 by a small margin. It may be
worthwhile to add here that SENSEX had reached the high of 6150.69 during 2000 and a
high of 14723.88 during February 2007. Converted to gold value as at January 2007, 100
SENSEX could buy 51.19 oz of gold in comparison to 42.21oz of the year 2000. In other
words, the appreciation in the index since the year 2000 has been only 21.27% in real terms
whereas the same read in terms of US$ was 167.78% and in Indian Rupee term was 139.38%.
Therefore, the growth of 146.51% (167.78-21.27) or 118.11%(139.38-21.27) is the
contribution of stock market bubble and is also a classic example of what is termed by
economists as ‘Fictitious Capital’. Thus, if we hypothetically consider the volume of market
capitalization of India at US$ 506 billion, the quantum of fictitious capital alone will be US$
300.74 billion.
Changes in the social mood do also signify changes in economic environment. The
high-strung temperaments, witnessed in every alternate news item as well as generally
spreading attitude of negativism do also forecast brewing up of the economic hailstorm. One
student (Cho Seung-Hui ) killing, in a feat of rage, 32 college goers at Virginia Tech campus or
one man hanging himself while telecasting his gruesome act of suicide over the internet, may
sound as a stray incidents to many but for sure, such stray incident or such frustrations do not
perpetuate under a state of economic prosperity.
However, considering the fact that while Grand Supercycle was drawing to an end, it
sounds truly confusing as to how a number of capital markets could engroupe among
25
themselves and eventually land up lost in the bewilderment of economic bubble. Even if we
hold excess liquidity as the culprit, fact remains as to why such funds get deployed at the first
place unless there was some factor that assured of market upheaval. It is known that wars
happen due to accumulation of negative feelings/sentiments but it is also a fact that once in
action, they cause sentiments to turn around completely. World has witnessed many wars so
far with each of them happening at the bottom of an economic slump. But what has been
peculiar, from economics point of view is that each war has been followed by a period of
economic upheaval or turn around.
In other words, war is something akin to volcanic eruption, wherein the outburst is
the net effect of suppressed accumulated negative sentiment resultant to period of economic
slump. The longer the slump, steeper the crash- longer is the duration of economic destitute-
greater is the brutality and viciousness of the war. But in spite of being an ultimate explosive
eruption of negativism, the downtrend in social mood that culminates in or leads to war
typically reverses and makes production trends to accelerate along the new path of upward
trend. Thus, even though wars happen to be the ultimate expression of negative sentiment, the
outbreak of it turns the social mood radically positive. A promise or challenge motivates
every human mind to overcome the predicament/obstacle and to outshine the darkness that
prevails. Another element that evokes positivism is possibly the feeling of patriotism and
solidarity.
In other words, there is no element of ambiguity as to whether war is good or bad for
the economy. A medium of human life destruction can never ever be a beneficial event but it
is also a fact that like every cloud has a silver lining, outbreak of war reverses the direction of
negativity and turns social mood in to positive. If we look in to history of world and correlate
it to ups and downs of economic cycles we shall observe uncanny coincidence of each one of
them happening chronological to periods of trough. World War I (result of decline between
1910 and 1914), World War II (chronological to 89% market collapse of 1932), and even
recent examples like Gulf war I (by product of bear phase between 1987 and 1990), Gulf War
II (followed market decline between 2001 and 2003) never violated the thumb rule of
coinciding with a market slump. But come to think of it, each of these horrific events was
followed by a phase of turning around in defiance of the pessimism and in compliance of
human zeal not only to survive but also to prosper from the ruins of mass destruction.
26
Terrorism is not war but it too is an expression of negativism and erupt identical
human reaction envisaged at the outbreak of war. It is the common human trait of revolting
against anything unjust and peril that brings about economic recovery out of worst possible
state of misery and human sufferings. Human civilization has seen many wars as well as
many acts akin to war designed to peril human lives but in each event it has been the sense of
resilience and solidarity that enabled human civilization to turn the direction of the tide. That
possibly is the reason as to why human civilization has outlived many Genghis Khans, many
Timurlang and Adolf Hitler and come to the threshold of 21st century.
In spite of everything question does come in mind as to why these terrorist attacks do
happen. What message do they carry? And fact remains that it costs huge amount of money to
stage these dastardly acts of mass destruction that ends up leaving only an obscure impression
in the pages of history and thereafter nothing whatsoever.
In other words, no terrorist attack, so far, has managed to destroy any economy. As
matter of fact, like war, these events, too, follow periods of periodical slumps and result in
turning around of human sentiment that makes a situation of slump to turn around and
appreciate along the paths of prosperity. Let us take for example attacks like those happening
on September 11,2001 or July 07, 2005 or for that matter recent bomb blast in Mumbai on
July 11,2006. Which of these attacks manage to leave effect for more than a few days? Did
not world an/or local economy turn around after absorbing the initial shock? In each of these
events, it was the human resolute that ultimately prevailed and as a result, each of these
events ended up acting as a boost factor for recovering from a period of economic slump.
Confused? Look at the charts. Did not September 11,2001 attack happen right after
the collapse that followed Dot Com mania? Do I need to say what happened thereafter? If I
say now that had not attacks of 9/11 or 7/7 taken place, possibly we would not have seen the
market indices anywhere near the level we see now. They would have remained miles lower
or could have plunged further down to a state of utter destitute by now.
Can I not, therefore, interpret that terrorist attacks are happening or being forced to
happen to induce human sentiments to recover from periods of trough and if such be the case
who would possibly instigating this to happen? It would certainly be those who have
deployed colossal stakes in the market and are speculating every day to make their wealth
multiply larger and larger, rather from larger to largest.
27
Thus it will be imprudent to take these terror strikes as isolated events. Wiser will be
to correlate them to period of slumps and gauge impact of such strike not from the point of
view of damage but from the angle of prosperity that followed. Possibly evolution of war
science has converged to one, those who plan acts of destruction and frames the destruction
of rules with the others who revise the rules and opt for combinations to accomplish identical
targets/objectives deploying more refined design, commensurate to the development of
science and technology. Occurrence of economic bubble over three fourth of the world and
hundreds of ghastly acts of terrorism are, in all likelihood, intertwined with each other and
constitute what is known as Unrestricted Warfare!
We want more schoolhouses and less jails; more books and less arsenals; more learning and less vice; more leisure and less greed; more justice and
less revenge; in fact, more of the opportunities to cultivate our better natures, to make manhood more noble, womanhood more beautiful, and
childhood more happy and bright…SAMUEL GOMPERS
28
INDEX Chapter Name: Page Nos.
1. Preamble a) An Introduction 31 b) Objective Of The Book 33 c) Theme and Focus of the Book 33 d) Significance of the Book 34 e) Outlook of the Book 34 f) Overlap with Existing Books 34
2. New Delhi, India February 28, 2007 36
An overview of a fierce Market Crash in India on the day of Union budget.
3. Gold 38 a) A preview of the inverse relationship between the world markets and Gold. b) Charts of Markets around the world 40 c) A Relationship Formation between Capital & Gold Markets 44 d) Tabular Representation of relation between Gold & Capital Capital Markets and Explanation. 44 e) Methodology of attaining profits extracted from “SHADOWS OF ECONOMIC PROSPERITY IN INDIA IN RETROSPECTION
OF CAPITAL MARKET” 50 f) Analysis of Exchange Gains in other Capital Markets 51 g) Going into the Grand Super Cycle 53
4. Japan 55
a) A view into Japan’s contribution in creating the Economic Bubble b) A look into BOJ interest rates and Japanese Yen, and how the two have worked together in the bubble creation process. 59 c) Japan’s path into supremacy 73
5. Disparity of Trend among Markets 81
a) A brief introduction into the disparity and the concept of Mania b) Study of North American Markets 83 c) Study of South American Markets 87 d) Study of Australian Market 90 e) Study of Asian Markets 91 f) Study of European Markets 102
6. Perpetrators of Economic Bubble 105
a) European Union and Its Economic Implications 106 b) Coming Back – A look back into History 106 c) Euro Again – An analysis of Euro 107 d) Proof of Mania 109 e) Impact of Mania 111 f) Indian Scenario 111
7. Short Note On Grand Super Cycle 124
8. What Happens To Gold? 128
a) A Detailed Wave Analysis of the current situation of Gold b) History of Gold 132
9. How Does Mania Set In? 136
A detailed Explanation with data and other articles to support the opinion.
29
10. The Origin of Capital Accumulation In Trade 154
An explanation on fund rotation a) Rational or irrational Phenomenon? 156 b) Economic Bubble 157 c) Outlook 165 d) Inadequate Capital Control 166
11. Beginning Of The End 174
A detailed explanation with wave analysis and incidents to prove the truth behind the beginning of the end
12. War And Terrorism 198
The bitter truth relating the current boom and terrorism with proof.
13. Short Notes On Technical Concepts 233
Basic Technical Theory Concepts to help the reader understand the Analysis Part.
30
1. PREAMBLE
Economic scenario around the world has been positive since 2002. Thanks to
initiative from organizations like UNO/World Bank, world has grown smaller with
geographical boundaries fading away yielding way for FDI (Foreign Direct Investment) to
percolate in all parts of the world. The capital markets of the third world have never
witnessed this kind of prosperity ever. The exchange value of US Dollar has been steadily
declining since the year 2002, which too has helped growth of FDI since investments in terms
of local currencies yielded extra revenue in terms of exchange gains.
May-June 2006, markets irrespective of their nature, location crashed in unison. The
downward slide did not spare any segment, be it bullion, and be it capital market. Came July
2006, and world shook from the horror of Mumbai train blasts. Hundreds died. It was as if
return of September 11,2001 air strikes on the twin towers of Manhattan. Human civilization
seemed viewing a preview of its own extinction. Markets were expected to crash further
which, never happened. Good over evil prevailed, human irrespective of cast creed and
nationality, got united in solidarity, which led to capital markets bouncing back.
Even though the markets turned around, anomaly started creeping in. From July 2006
Gold price and market index started moving in divergent path. If capital markets appreciated,
Gold prices fell, when Gold appreciated, either capital markets corrected or moved sideways.
On and from January, 2007 Gold prices took off but failed to accelerate growth rate in capital
markets since most of them had reached levels never ever dreamed of even a couple of years
back. But the fact that at one time gold and capital markets had been moving in divergent
direction gave rise to question if investments from gold were inflating market indices of
capital markets.
February 2007, Bank of Japan increased their interest rates marginally. They had
done this in July 2006 also. This did not go well with markets around the world. Markets
started correcting with DJIA falling by over 400 points, HANGSENG, NIKKEI declining by
over 500 points, in a day towards end of February and beginning of March. Was the symbolic
rise of interest rate from 0.40% to 0.75% a call to Japanese investors to return home?
31
A daily and weekly chart of capital markets around the world look identical yet the
same viewed on extended time frame of monthly or yearly radically changes the portraits.
While charts of DJIA, S&P500 and those of practically all markets of third world indicate
presence of stock market bubble, termed also as mania, charts of Japan and European
countries indicate normal economic prosperity. This difference in outlook shakes the very
core economic prosperity we witness now. Could it be possible that investments and
speculative investments from Japan and countries of Europe inflate the capital markets of rest
of the world to the deadly state of mania? World has witnessed many manias till date with the
Tulip Mania of 1688 being the first and each one of them ultimately ended in a crash. The
latest of the stock market bubble in NASDAQ too broke down like a pack of cards between
2000 and 2002. If a group of investors hailing from a group of countries could plan and
execute their investments in a manner to bring about this mania, it is also very much possible
that the peril associated with bursting of the economic bubble is featuring in their designs.
Going by the diagram of the Grand Super Cycle drawn by Mr. R.N. Elliot read with
Kondratieff and Benner cycles, world economy should be in or approaching the final Wave C
corrections. The 5th and the last motive wave started between 1982 and 1988 and went on till
May 2006. The correction of May/June 2006 constituted Wave A corrections and the
appreciation thereafter was recovery consequent to Wave B. Is it possible that a group of
countries studied well the economic pattern to maximize their gains during the last motive
wave and during the Wave B recovery?
War is always horrible and is the sum total effect of negative sentiment prevailing
consequent to an economic slump. However, once the war starts, it turns the direction of
social mood leading to positivism and rise in production that leads to economic recovery.
This shift of sentiment and economic environment has led to all round dilemmas whether war
is beneficial or harmful. However, there is a marked difference between war and acts of
terrorism. Terrorism is outburst of negative/speculative sentiment of a few. A study of
various terrorist attacks indicate that they too occur during period of slumps and generate
almost same degree of human resilience like wars do. It is proved that terrorists too invest
money in capital markets and manipulate hike in market index. Acts of terrorism being sheer
wastage of money and energy is it not possible that they are executed to generate human
resilience, which, almost in every instance, facilitates capital market with additional extra
momentum to recover from a correction or slump.
32
With above in view, the picture that emerges is threatening. It shows a group of
countries planning out a financial coup on rest of the world and under the umbrella of
protection being provided by UNO and taking advantage of the craze for liberalization,
speculate various markets to the extent of maximum that has led to stock market bubble
rampant in most of the exchanges of the third world, DJIA and S&P500. With Grand Super
Cycle entering 5th wave, the mass euphoria was declining and to boost sentiments from time
to time, it is possible, that terrorist strikes were planned out. What does this all sum up to?
Are we in a state of war?
Objective of the book:
Hamilton Bolton had remarked once “ The hardest thing is to believe what you see”.
Economists around the world, even to some extent World Bank/UNO have acknowledged the
fact that unrestricted flow of FDI can be extremely damaging. However, protagonists for
liberalization have won so far and hardly any effective road blockage/ arrangement for safe
guards have evolved in terms of policy. It is a fact that large parts of the world now suffer
from the syndrome of economic bubble which, truly speaking has developed puncture since
May 2006. The air out of bubble is coming out slowly since that helps speculators in
offloading their mountain load of portfolio and positions in derivatives comprising of futures
and options.
Within the rampant inflation that we witness now, the seeds of deflation have
germinated. And it will not take long for total shift of economic environment.
There are millions, possibly billions, of common individuals who have directly or
indirectly pledged their life savings in to capital markets. This book cannot rescue all. But
even if it helps a handful, the book will serve its purpose and the author will derive ultimate
professional satisfaction of being use to the society.
Theme and Focus of the book:
Market movement reflects progression of human sentiment. Therefore, charts are not
just pictorial reproduction of prices but are actually mirrors that reflect the direction of
movement general socio-economic mood. The charts besides standing testimony for the past
indicate how the future will actually evolve.
33
The book focuses on co-relating various events of the past and present with
contemporary charts and in view of the fact that human sentiment follows fractal movement
which are similar in dissimilarity, draws conclusions as to how future economic scenario
should evolve.
Significance of the book:
The book deals with a subject that we see but not acknowledge. It is a crusade on
negativism that has been imposed on humanity. Furthermore, the timing for the book is just
as the tidal wave we ride on has shown tendency of breaking down.
Technical analysis in India has not gained much popularity since it hardly finds any
place within curriculum of various professional and/or academic courses. This book will
surely motivate many to take a plunge in to this vast science. The book also provides small
tutorial on Elliot Waves which possibly was the most vital discovery relating to this branch of
social science.
Outline of the book:
The book will consist of, basically, five sections viz:
a) Changes in the progression of gold and study of divergence between gold and capital
markets.
b) Trend/progression of exchange rates of various third world currencies with
estimation of future possibilities.
c) Study of market progression of various countries and detection of exceptions.
d) State of capital control existing around the world concerning FDI and their growth.
e) Analysis of effects of various terrorist attacks on capital markets and detection of any
common factor and/or relationship between the strikes.
Overlap with existing books:
There is no book so far published on this subject in India. Mr. Robert Prechter Jr of
Elliot Wave International had authored a book titled “At the Crest of the Tidal Wave” during
1995 that essentially dealt with market scenario in USA then. Moreover, the book dealt with
possible after effects of mania and did not attempt investigating as to how the present time
global economic bubble could develop.

34
As my book will attempt detecting cause of mania, how the bubble managed to inflate to
gigantic proportion and possible after effects, it will be a pioneering study on the subject.
35
2. NEW DELHI, INDIA - FEBRUARY 28, 2007
It was carnage that the world woke up to on 27th of February 2007. The Shanghai
Composite crashed by 9% followed by vicious falls recorded in most of the other market
indexes around the world. Dow Jones corrected by near 400 points, NASDAQ by about 100
points. HANGSENG and NIKKEI 225 both staged a record fall of over 500 points.
Oblivious of what was happening in other countries, Indians woke up on 28th
February with a smile. The Union Minister of Finance was supposed to table the budget
around 11 in the morning. Both NSE50 (commonly called NIFTY- market index for National
Stock Exchange of India) and SENSEX (market index of Mumbai Stock Exchange) had been
faring rather poorly ever since 08th of February after attaining respective all time peak.
Inflation level was at all time high. Never the less, with GDP touching 9.2%, the
foreign exchange coffer brimming with 180 billion dollars (US$), the Finance Minister was
likely to pull out some magic card which could provide new momentum to the economy and
especially to the share market. Expectations ran high for that Midas touch which could re-
energies the sentiments so that indexes could realign themselves back on track aiming at the
sky. Yet, before any thing could happen, NIFTY fell from 3893 to 3675!
Finance Minister possibly had woken up facing the wrong side of the bed. He was
dull. The budget, as a result was mundane! The market indexes, which were trying to salvage
after the initial blow, lost vitality and failed to recover. Result was common. Newspapers and
media ransacked their chests to splash the front pages with photographs of hapless investors -
head bowed down with chin almost touching the ruffled hair sprouting from the chest.
I cursed myself for not writing this book a fortnight back. This was bound to happen
but had my article been published a fortnight back and been seen by some investors, they
would be smiling today. Never the less, this is not just a stray incident. This possibly marks
the beginning of a new era called deflation, which would accompany us for quite some time.
Hence, it is not too late for me to draw up the landscape that obviously eluded the vision of
many.
The world market has been upbeat for quite some time now. The movement of
indexes, around the world, has been mostly unidirectional i.e. upwards. However, there was a
36
break of tune between May 10, 2006 and June 15, 2006 when major exception to above
occurred as everything went whirling down around that time. Be it share market of any
geographical location or for that matter, script of any industry wherever located, the
avalanche was ominous to all and subjected everything to plunge down till the movements
came to a halt by middle of June last year. It was not just capital markets. The mayhem took
into its spiral even the bullion too forcing Gold and Silver, too, to decline sharply.
Surprisingly, from around middle of June last year, practically all capital markets
turned around and with the exception of another correction (of much less virulence) during
end part of July, never really looked back. Most of the indexes worldwide attained new all
time high levels and the dazzle of new glory gradually faded away the scar of blemish left
between May and June 2006.
Even amidst the glory of unprecedented market appreciation there was an element of
discord since till beginning of 2007, Gold and capital markets were moving along divergent
paths. Not to be left behind, Gold, too, took off but by then (January 2007) most of the
indexes of capital markets was comfortably flying high up in the sky.
With practically all currencies prevailing around the world being essentially paper
based, Gold price should logically have no forbearance on capital markets and therefore, the
correlation I am about to draw may raise may eyebrows in disbelief.
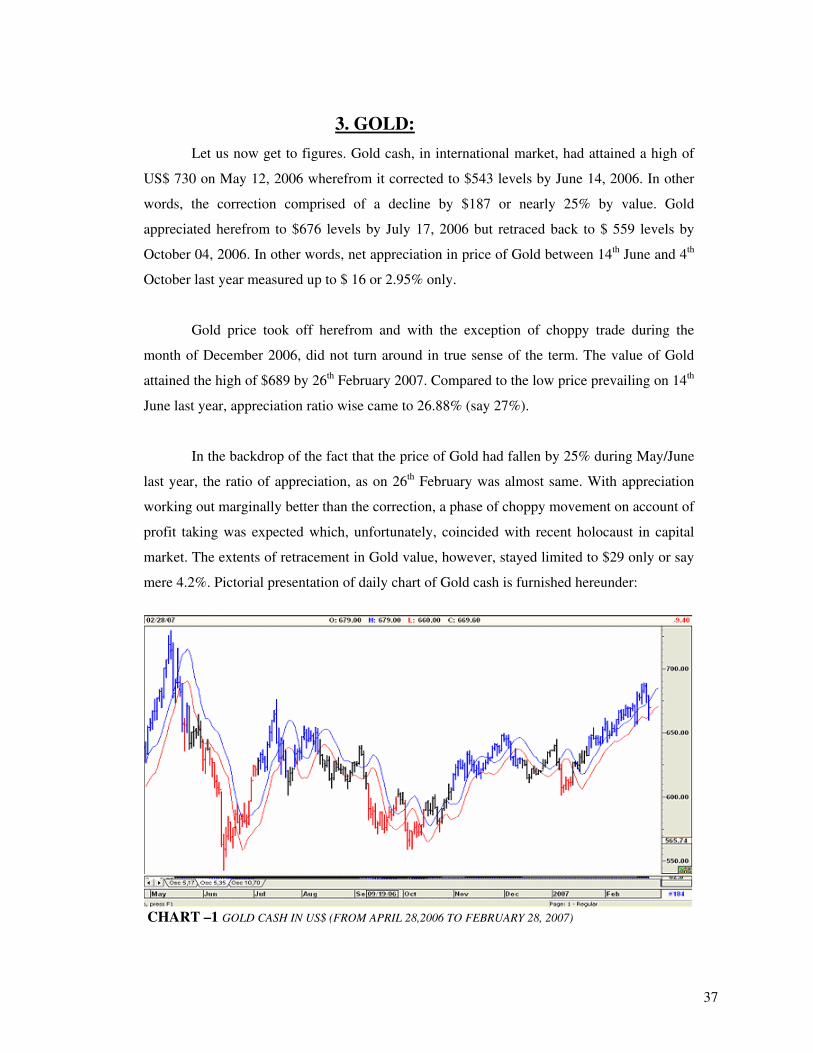
37
3. GOLD:
Let us now get to figures. Gold cash, in international market, had attained a high of
US$ 730 on May 12, 2006 wherefrom it corrected to $543 levels by June 14, 2006. In other
words, the correction comprised of a decline by $187 or nearly 25% by value. Gold
appreciated herefrom to $676 levels by July 17, 2006 but retraced back to $ 559 levels by
October 04, 2006. In other words, net appreciation in price of Gold between 14th June and 4th
October last year measured up to $ 16 or 2.95% only.
Gold price took off herefrom and with the exception of choppy trade during the
month of December 2006, did not turn around in true sense of the term. The value of Gold
attained the high of $689 by 26th February 2007. Compared to the low price prevailing on 14th
June last year, appreciation ratio wise came to 26.88% (say 27%).
In the backdrop of the fact that the price of Gold had fallen by 25% during May/June
last year, the ratio of appreciation, as on 26th February was almost same. With appreciation
working out marginally better than the correction, a phase of choppy movement on account of
profit taking was expected which, unfortunately, coincided with recent holocaust in capital
market. The extents of retracement in Gold value, however, stayed limited to $29 only or say
mere 4.2%. Pictorial presentation of daily chart of Gold cash is furnished hereunder:
CHART –1 GOLD CASH IN US$ (FROM APRIL 28,2006 TO FEBRUARY 28, 2007)
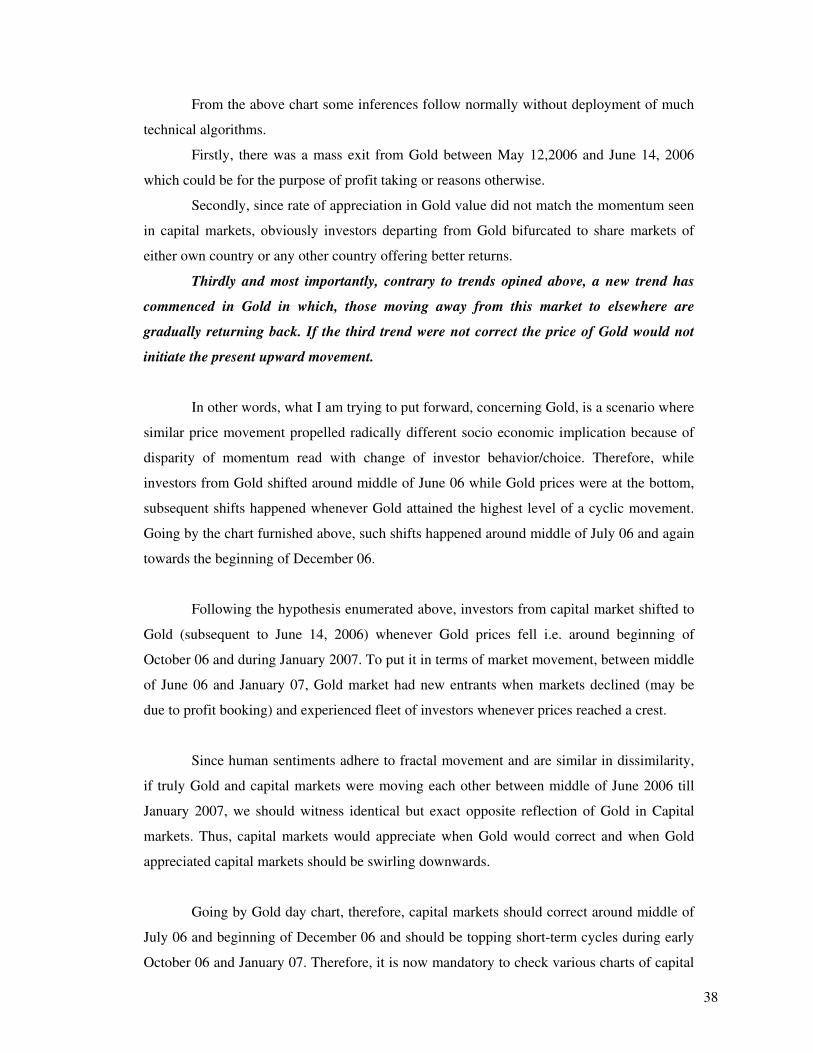
38
From the above chart some inferences follow normally without deployment of much
technical algorithms.
Firstly, there was a mass exit from Gold between May 12,2006 and June 14, 2006
which could be for the purpose of profit taking or reasons otherwise.
Secondly, since rate of appreciation in Gold value did not match the momentum seen
in capital markets, obviously investors departing from Gold bifurcated to share markets of
either own country or any other country offering better returns.
Thirdly and most importantly, contrary to trends opined above, a new trend has
commenced in Gold in which, those moving away from this market to elsewhere are
gradually returning back. If the third trend were not correct the price of Gold would not
initiate the present upward movement.
In other words, what I am trying to put forward, concerning Gold, is a scenario where
similar price movement propelled radically different socio economic implication because of
disparity of momentum read with change of investor behavior/choice. Therefore, while
investors from Gold shifted around middle of June 06 while Gold prices were at the bottom,
subsequent shifts happened whenever Gold attained the highest level of a cyclic movement.
Going by the chart furnished above, such shifts happened around middle of July 06 and again
towards the beginning of December 06.
Following the hypothesis enumerated above, investors from capital market shifted to
Gold (subsequent to June 14, 2006) whenever Gold prices fell i.e. around beginning of
October 06 and during January 2007. To put it in terms of market movement, between middle
of June 06 and January 07, Gold market had new entrants when markets declined (may be
due to profit booking) and experienced fleet of investors whenever prices reached a crest.
Since human sentiments adhere to fractal movement and are similar in dissimilarity,
if truly Gold and capital markets were moving each other between middle of June 2006 till
January 2007, we should witness identical but exact opposite reflection of Gold in Capital
markets. Thus, capital markets would appreciate when Gold would correct and when Gold
appreciated capital markets should be swirling downwards.
Going by Gold day chart, therefore, capital markets should correct around middle of
July 06 and beginning of December 06 and should be topping short-term cycles during early
October 06 and January 07. Therefore, it is now mandatory to check various charts of capital
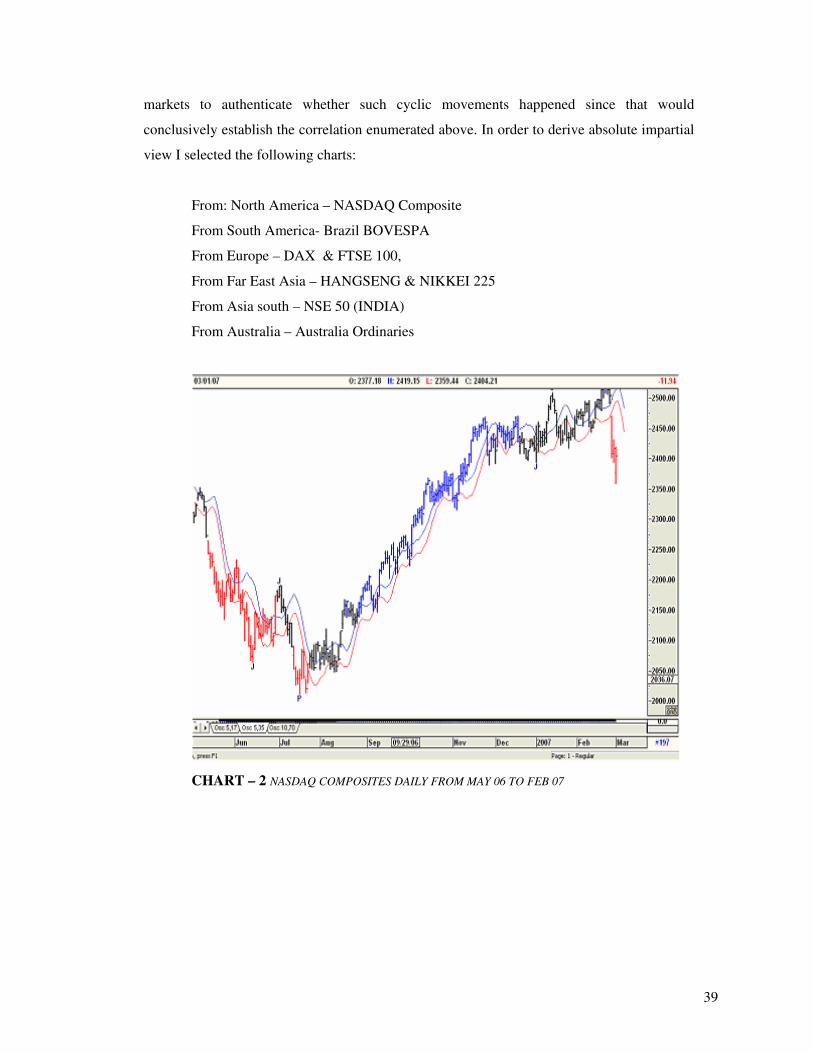
39
markets to authenticate whether such cyclic movements happened since that would
conclusively establish the correlation enumerated above. In order to derive absolute impartial
view I selected the following charts:
From: North America – NASDAQ Composite
From South America- Brazil BOVESPA
From Europe – DAX & FTSE 100,
From Far East Asia – HANGSENG & NIKKEI 225
From Asia south – NSE 50 (INDIA)
From Australia – Australia Ordinaries
CHART – 2 NASDAQ COMPOSITES DAILY FROM MAY 06 TO FEB 07
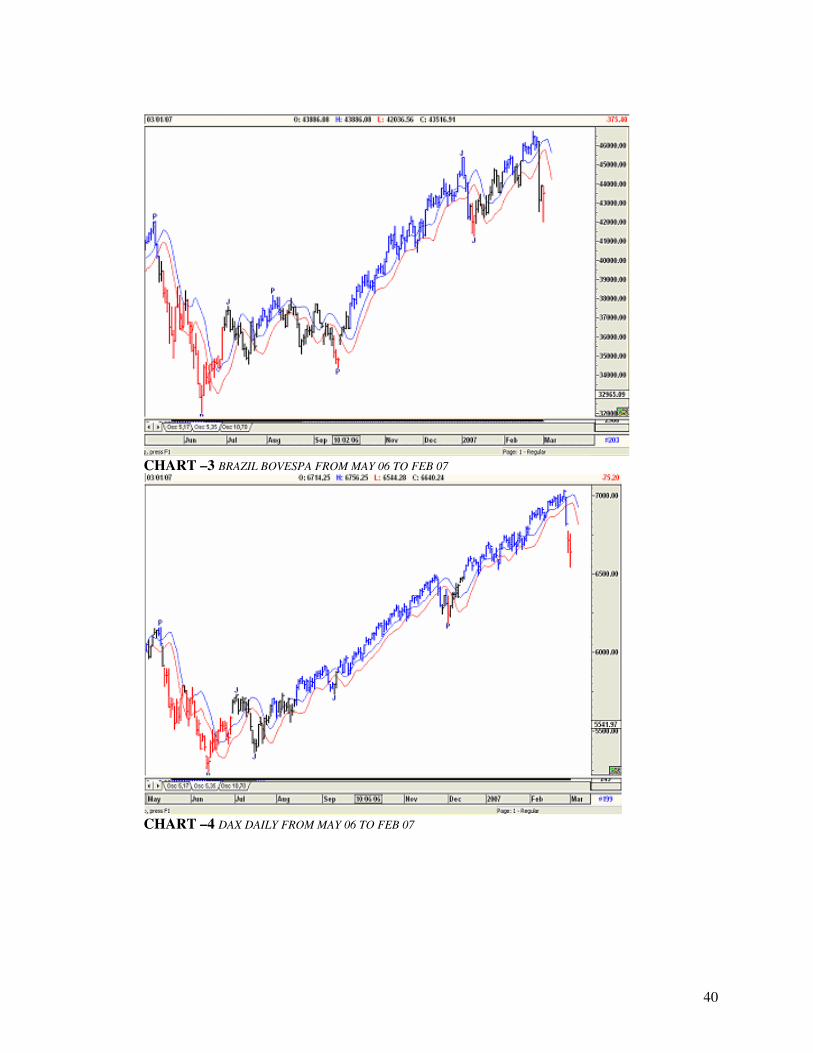
40
CHART –3 BRAZIL BOVESPA FROM MAY 06 TO FEB 07
CHART –4 DAX DAILY FROM MAY 06 TO FEB 07
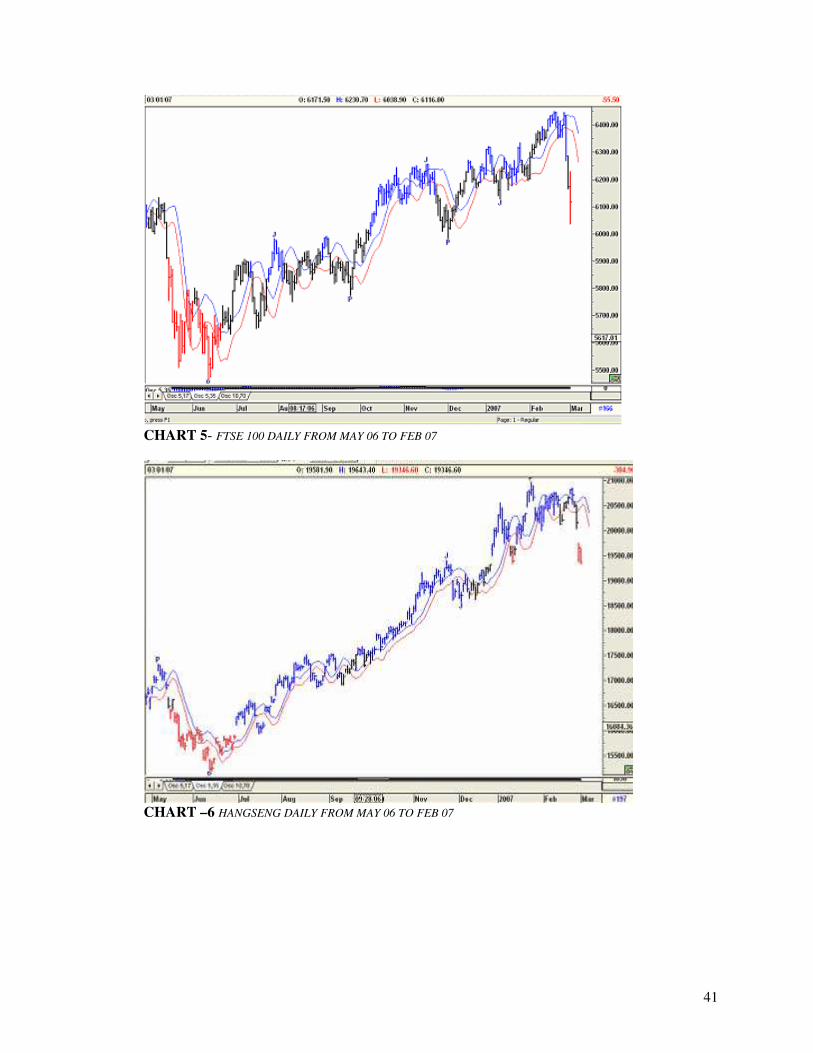
41
CHART 5- FTSE 100 DAILY FROM MAY 06 TO FEB 07
CHART –6 HANGSENG DAILY FROM MAY 06 TO FEB 07
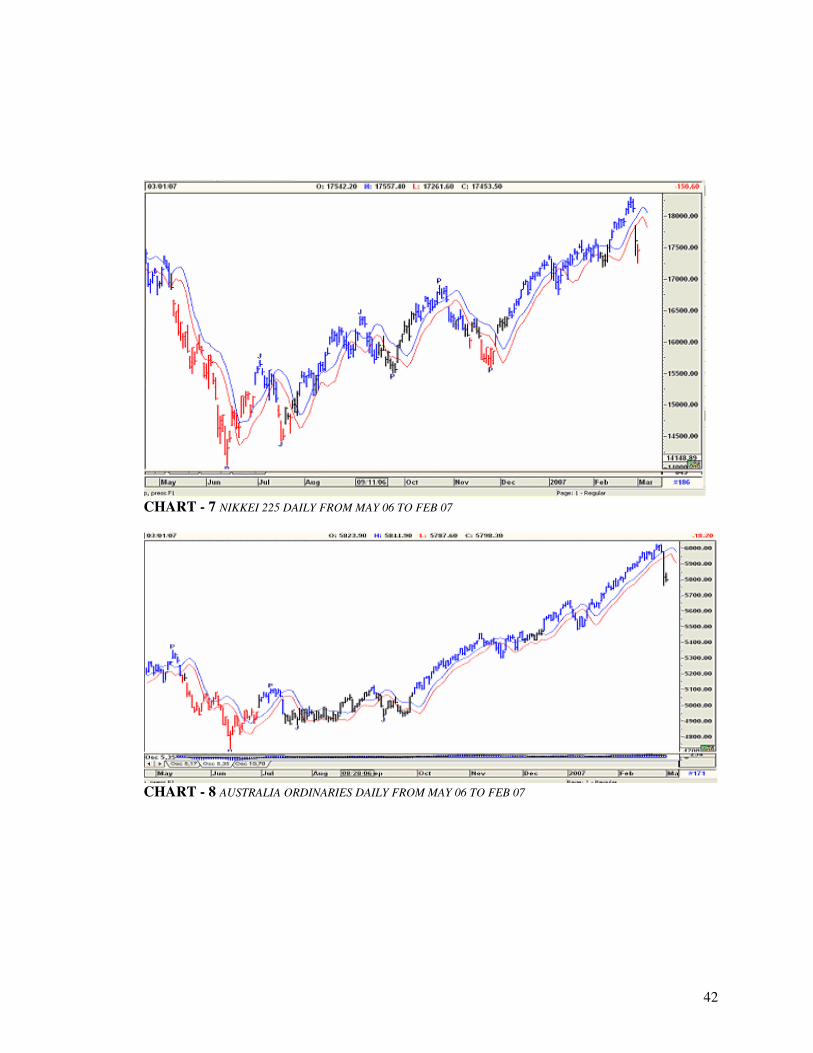
42
CHART - 7 NIKKEI 225 DAILY FROM MAY 06 TO FEB 07
CHART - 8 AUSTRALIA ORDINARIES DAILY FROM MAY 06 TO FEB 07
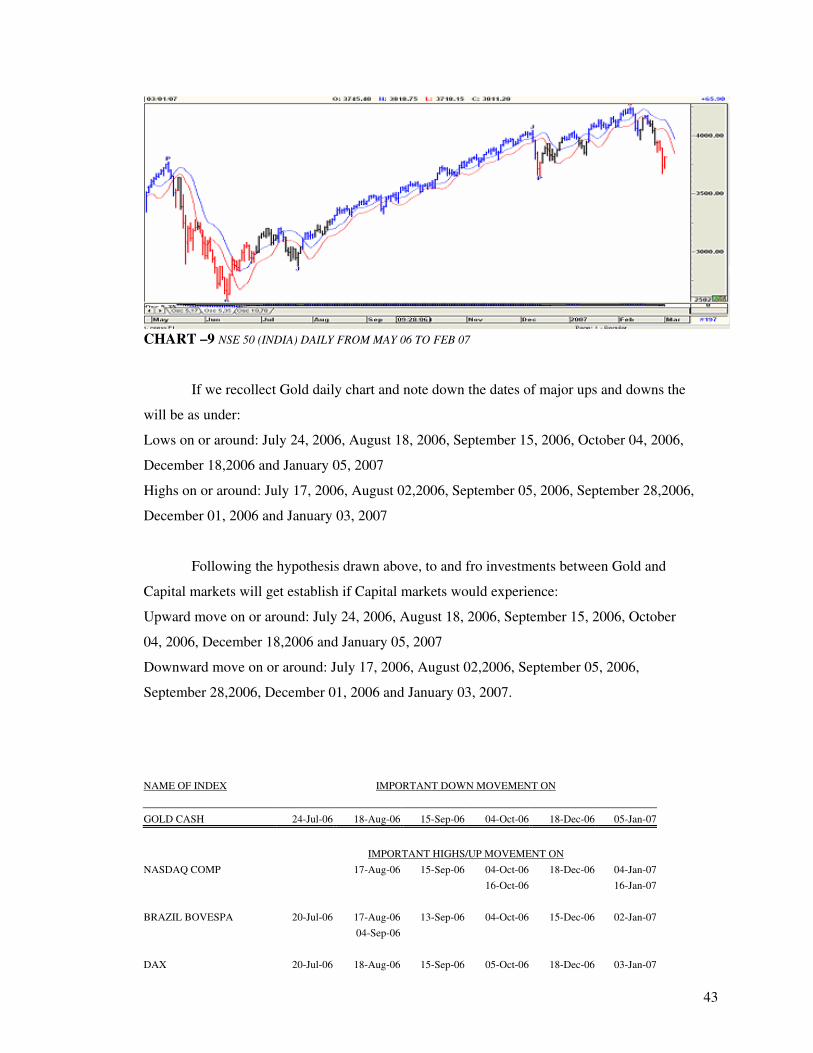
43
CHART –9 NSE 50 (INDIA) DAILY FROM MAY 06 TO FEB 07
If we recollect Gold daily chart and note down the dates of major ups and downs the
will be as under:
Lows on or around: July 24, 2006, August 18, 2006, September 15, 2006, October 04, 2006,
December 18,2006 and January 05, 2007
Highs on or around: July 17, 2006, August 02,2006, September 05, 2006, September 28,2006,
December 01, 2006 and January 03, 2007
Following the hypothesis drawn above, to and fro investments between Gold and
Capital markets will get establish if Capital markets would experience:
Upward move on or around: July 24, 2006, August 18, 2006, September 15, 2006, October
04, 2006, December 18,2006 and January 05, 2007
Downward move on or around: July 17, 2006, August 02,2006, September 05, 2006,
September 28,2006, December 01, 2006 and January 03, 2007.
NAME OF INDEX IMPORTANT DOWN MOVEMENT ON
GOLD CASH 24-Jul-06 18-Aug-06 15-Sep-06 04-Oct-06 18-Dec-06 05-Jan-07
IMPORTANT HIGHS/UP MOVEMENT ON
NASDAQ COMP 17-Aug-06 15-Sep-06 04-Oct-06 18-Dec-06 04-Jan-07
16-Oct-06 16-Jan-07
BRAZIL BOVESPA 20-Jul-06 17-Aug-06 13-Sep-06 04-Oct-06 15-Dec-06 02-Jan-07
04-Sep-06
DAX 20-Jul-06 18-Aug-06 15-Sep-06 05-Oct-06 18-Dec-06 03-Jan-07
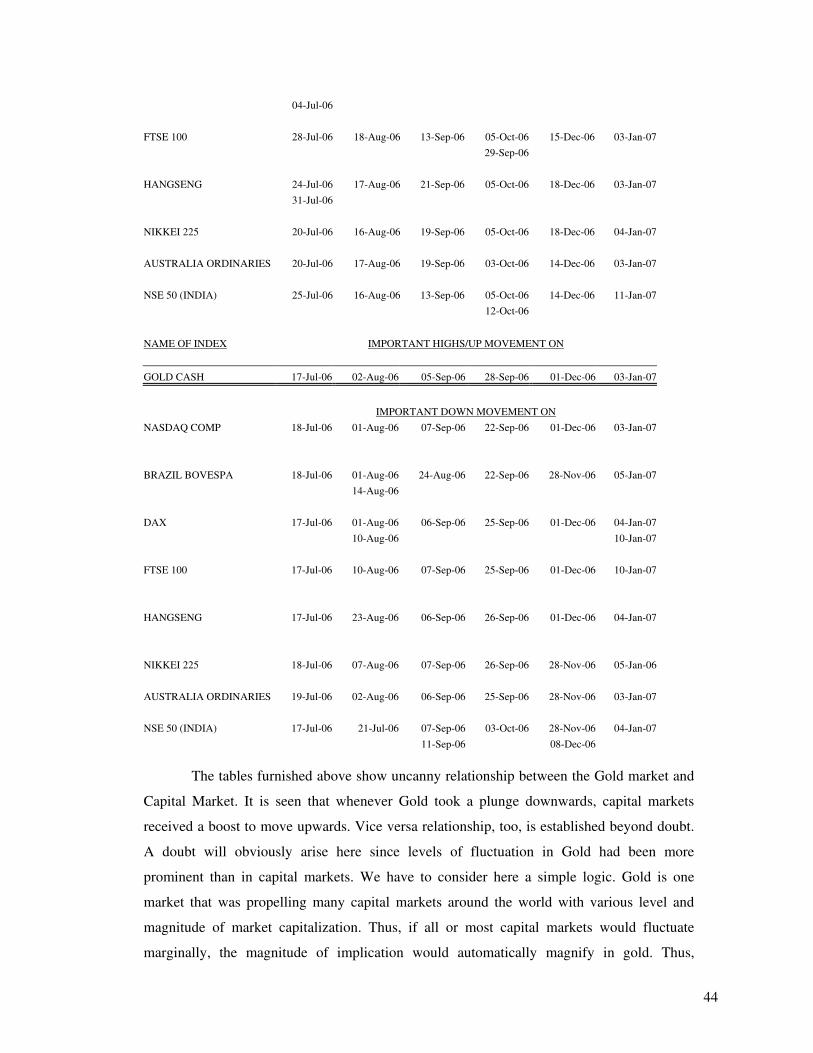
44
04-Jul-06
FTSE 100 28-Jul-06 18-Aug-06 13-Sep-06 05-Oct-06 15-Dec-06 03-Jan-07
29-Sep-06
HANGSENG 24-Jul-06 17-Aug-06 21-Sep-06 05-Oct-06 18-Dec-06 03-Jan-07
31-Jul-06
NIKKEI 225 20-Jul-06 16-Aug-06 19-Sep-06 05-Oct-06 18-Dec-06 04-Jan-07
AUSTRALIA ORDINARIES 20-Jul-06 17-Aug-06 19-Sep-06 03-Oct-06 14-Dec-06 03-Jan-07
NSE 50 (INDIA) 25-Jul-06 16-Aug-06 13-Sep-06 05-Oct-06 14-Dec-06 11-Jan-07
12-Oct-06
NAME OF INDEX IMPORTANT HIGHS/UP MOVEMENT ON
GOLD CASH 17-Jul-06 02-Aug-06 05-Sep-06 28-Sep-06 01-Dec-06 03-Jan-07
IMPORTANT DOWN MOVEMENT ON
NASDAQ COMP 18-Jul-06 01-Aug-06 07-Sep-06 22-Sep-06 01-Dec-06 03-Jan-07
BRAZIL BOVESPA 18-Jul-06 01-Aug-06 24-Aug-06 22-Sep-06 28-Nov-06 05-Jan-07
14-Aug-06
DAX 17-Jul-06 01-Aug-06 06-Sep-06 25-Sep-06 01-Dec-06 04-Jan-07
10-Aug-06 10-Jan-07
FTSE 100 17-Jul-06 10-Aug-06 07-Sep-06 25-Sep-06 01-Dec-06 10-Jan-07
HANGSENG 17-Jul-06 23-Aug-06 06-Sep-06 26-Sep-06 01-Dec-06 04-Jan-07
NIKKEI 225 18-Jul-06 07-Aug-06 07-Sep-06 26-Sep-06 28-Nov-06 05-Jan-06
AUSTRALIA ORDINARIES 19-Jul-06 02-Aug-06 06-Sep-06 25-Sep-06 28-Nov-06 03-Jan-07
NSE 50 (INDIA) 17-Jul-06 21-Jul-06 07-Sep-06 03-Oct-06 28-Nov-06 04-Jan-07
11-Sep-06 08-Dec-06
The tables furnished above show uncanny relationship between the Gold market and
Capital Market. It is seen that whenever Gold took a plunge downwards, capital markets
received a boost to move upwards. Vice versa relationship, too, is established beyond doubt.
A doubt will obviously arise here since levels of fluctuation in Gold had been more
prominent than in capital markets. We have to consider here a simple logic. Gold is one
market that was propelling many capital markets around the world with various level and
magnitude of market capitalization. Thus, if all or most capital markets would fluctuate
marginally, the magnitude of implication would automatically magnify in gold. Thus,
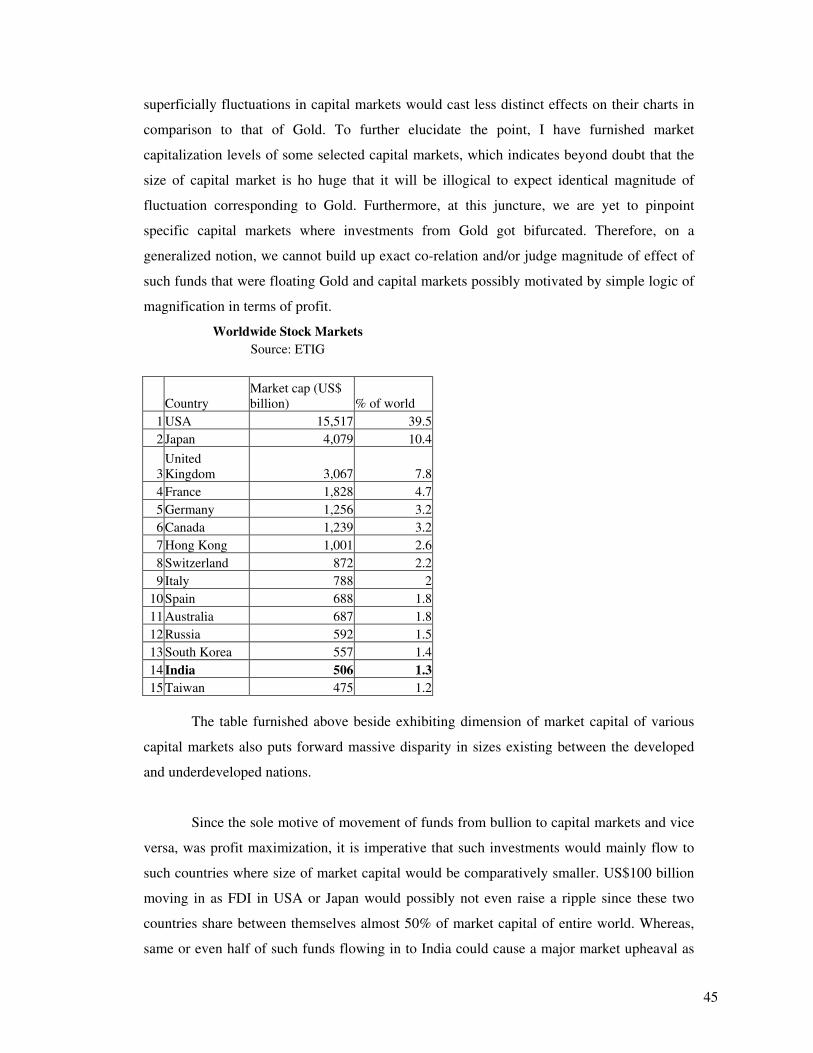
45
superficially fluctuations in capital markets would cast less distinct effects on their charts in
comparison to that of Gold. To further elucidate the point, I have furnished market
capitalization levels of some selected capital markets, which indicates beyond doubt that the
size of capital market is ho huge that it will be illogical to expect identical magnitude of
fluctuation corresponding to Gold. Furthermore, at this juncture, we are yet to pinpoint
specific capital markets where investments from Gold got bifurcated. Therefore, on a
generalized notion, we cannot build up exact co-relation and/or judge magnitude of effect of
such funds that were floating Gold and capital markets possibly motivated by simple logic of
magnification in terms of profit.
Worldwide Stock Markets
Source: ETIG
Country Market cap (US$ billion) % of world
1 USA 15,517 39.5
2 Japan 4,079 10.4
3 United Kingdom 3,067 7.8
4 France 1,828 4.7
5 Germany 1,256 3.2
6 Canada 1,239 3.2
7 Hong Kong 1,001 2.6
8 Switzerland 872 2.2
9 Italy 788 2
10 Spain 688 1.8
11 Australia 687 1.8
12 Russia 592 1.5
13 South Korea 557 1.4
14 India 506 1.3
15 Taiwan 475 1.2
The table furnished above beside exhibiting dimension of market capital of various
capital markets also puts forward massive disparity in sizes existing between the developed
and underdeveloped nations.
Since the sole motive of movement of funds from bullion to capital markets and vice
versa, was profit maximization, it is imperative that such investments would mainly flow to
such countries where size of market capital would be comparatively smaller. US$100 billion
moving in as FDI in USA or Japan would possibly not even raise a ripple since these two
countries share between themselves almost 50% of market capital of entire world. Whereas,
same or even half of such funds flowing in to India could cause a major market upheaval as
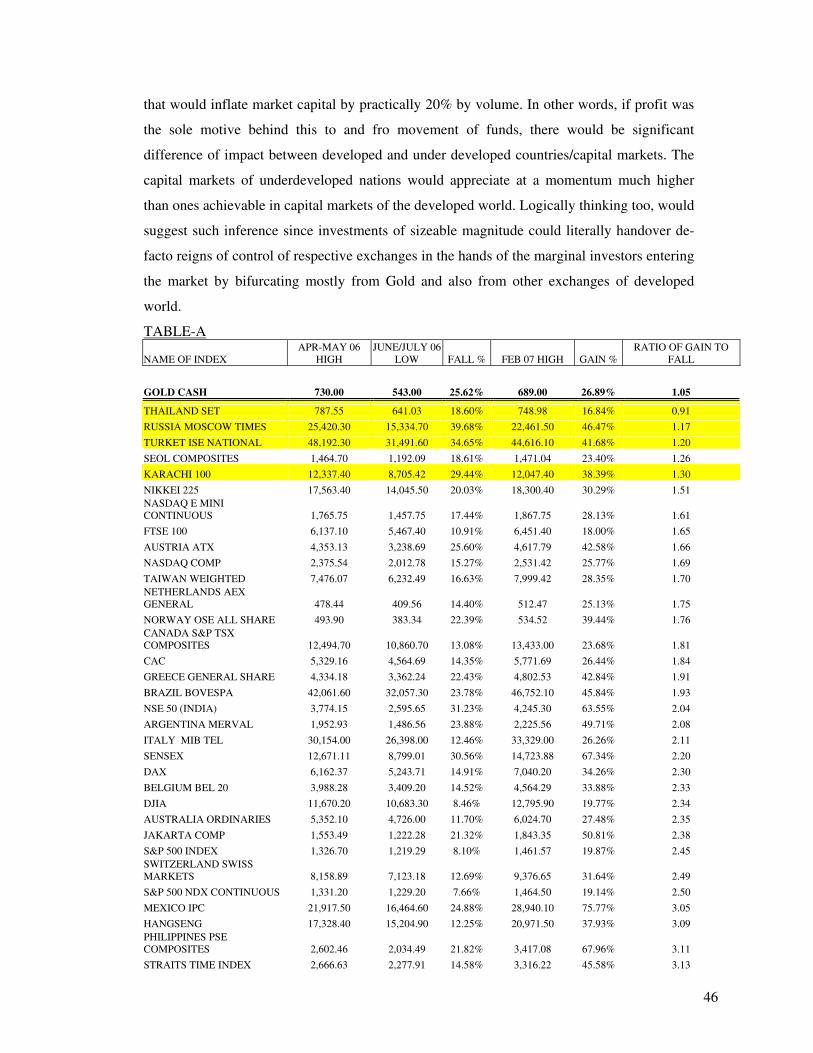
46
that would inflate market capital by practically 20% by volume. In other words, if profit was
the sole motive behind this to and fro movement of funds, there would be significant
difference of impact between developed and under developed countries/capital markets. The
capital markets of underdeveloped nations would appreciate at a momentum much higher
than ones achievable in capital markets of the developed world. Logically thinking too, would
suggest such inference since investments of sizeable magnitude could literally handover de-
facto reigns of control of respective exchanges in the hands of the marginal investors entering
the market by bifurcating mostly from Gold and also from other exchanges of developed
world.
TABLE-A
NAME OF INDEX APR-MAY 06
HIGH JUNE/JULY 06
LOW FALL % FEB 07 HIGH GAIN % RATIO OF GAIN TO
FALL
GOLD CASH 730.00 543.00 25.62% 689.00 26.89% 1.05
THAILAND SET 787.55 641.03 18.60% 748.98 16.84% 0.91
RUSSIA MOSCOW TIMES 25,420.30 15,334.70 39.68% 22,461.50 46.47% 1.17
TURKET ISE NATIONAL 48,192.30 31,491.60 34.65% 44,616.10 41.68% 1.20
SEOL COMPOSITES 1,464.70 1,192.09 18.61% 1,471.04 23.40% 1.26
KARACHI 100 12,337.40 8,705.42 29.44% 12,047.40 38.39% 1.30
NIKKEI 225 17,563.40 14,045.50 20.03% 18,300.40 30.29% 1.51
NASDAQ E MINI CONTINUOUS 1,765.75 1,457.75 17.44% 1,867.75 28.13% 1.61
FTSE 100 6,137.10 5,467.40 10.91% 6,451.40 18.00% 1.65
AUSTRIA ATX 4,353.13 3,238.69 25.60% 4,617.79 42.58% 1.66
NASDAQ COMP 2,375.54 2,012.78 15.27% 2,531.42 25.77% 1.69
TAIWAN WEIGHTED 7,476.07 6,232.49 16.63% 7,999.42 28.35% 1.70
NETHERLANDS AEX GENERAL 478.44 409.56 14.40% 512.47 25.13% 1.75
NORWAY OSE ALL SHARE 493.90 383.34 22.39% 534.52 39.44% 1.76
CANADA S&P TSX COMPOSITES 12,494.70 10,860.70 13.08% 13,433.00 23.68% 1.81
CAC 5,329.16 4,564.69 14.35% 5,771.69 26.44% 1.84
GREECE GENERAL SHARE 4,334.18 3,362.24 22.43% 4,802.53 42.84% 1.91
BRAZIL BOVESPA 42,061.60 32,057.30 23.78% 46,752.10 45.84% 1.93
NSE 50 (INDIA) 3,774.15 2,595.65 31.23% 4,245.30 63.55% 2.04
ARGENTINA MERVAL 1,952.93 1,486.56 23.88% 2,225.56 49.71% 2.08
ITALY MIB TEL 30,154.00 26,398.00 12.46% 33,329.00 26.26% 2.11
SENSEX 12,671.11 8,799.01 30.56% 14,723.88 67.34% 2.20
DAX 6,162.37 5,243.71 14.91% 7,040.20 34.26% 2.30
BELGIUM BEL 20 3,988.28 3,409.20 14.52% 4,564.29 33.88% 2.33
DJIA 11,670.20 10,683.30 8.46% 12,795.90 19.77% 2.34
AUSTRALIA ORDINARIES 5,352.10 4,726.00 11.70% 6,024.70 27.48% 2.35
JAKARTA COMP 1,553.49 1,222.28 21.32% 1,843.35 50.81% 2.38
S&P 500 INDEX 1,326.70 1,219.29 8.10% 1,461.57 19.87% 2.45
SWITZERLAND SWISS MARKETS 8,158.89 7,123.18 12.69% 9,376.65 31.64% 2.49
S&P 500 NDX CONTINUOUS 1,331.20 1,229.20 7.66% 1,464.50 19.14% 2.50
MEXICO IPC 21,917.50 16,464.60 24.88% 28,940.10 75.77% 3.05
HANGSENG 17,328.40 15,204.90 12.25% 20,971.50 37.93% 3.09
PHILIPPINES PSE COMPOSITES 2,602.46 2,034.49 21.82% 3,417.08 67.96% 3.11
STRAITS TIME INDEX 2,666.63 2,277.91 14.58% 3,316.22 45.58% 3.13
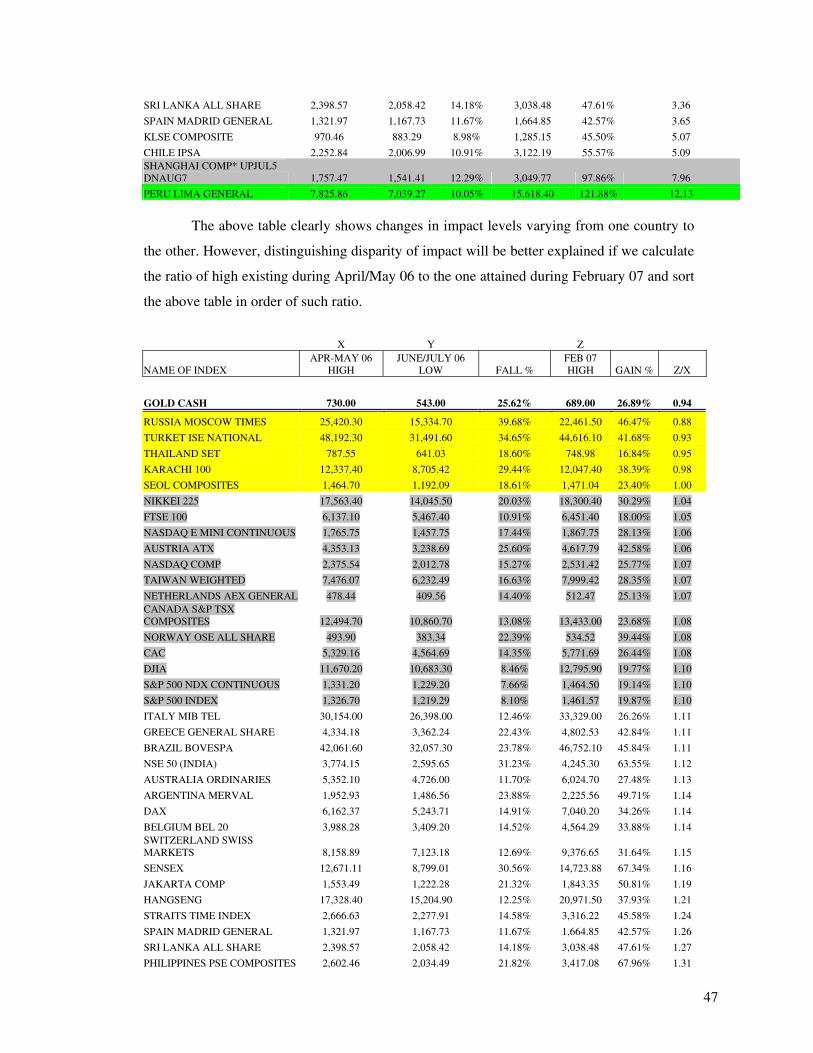
47
SRI LANKA ALL SHARE 2,398.57 2,058.42 14.18% 3,038.48 47.61% 3.36
SPAIN MADRID GENERAL 1,321.97 1,167.73 11.67% 1,664.85 42.57% 3.65
KLSE COMPOSITE 970.46 883.29 8.98% 1,285.15 45.50% 5.07
CHILE IPSA 2,252.84 2,006.99 10.91% 3,122.19 55.57% 5.09
SHANGHAI COMP* UPJUL5 DNAUG7 1,757.47 1,541.41 12.29% 3,049.77 97.86% 7.96
PERU LIMA GENERAL 7,825.86 7,039.27 10.05% 15,618.40 121.88% 12.13
The above table clearly shows changes in impact levels varying from one country to
the other. However, distinguishing disparity of impact will be better explained if we calculate
the ratio of high existing during April/May 06 to the one attained during February 07 and sort
the above table in order of such ratio.
X Y Z
NAME OF INDEX APR-MAY 06
HIGH JUNE/JULY 06
LOW FALL % FEB 07 HIGH GAIN % Z/X
GOLD CASH 730.00 543.00 25.62% 689.00 26.89% 0.94
RUSSIA MOSCOW TIMES 25,420.30 15,334.70 39.68% 22,461.50 46.47% 0.88
TURKET ISE NATIONAL 48,192.30 31,491.60 34.65% 44,616.10 41.68% 0.93
THAILAND SET 787.55 641.03 18.60% 748.98 16.84% 0.95
KARACHI 100 12,337.40 8,705.42 29.44% 12,047.40 38.39% 0.98
SEOL COMPOSITES 1,464.70 1,192.09 18.61% 1,471.04 23.40% 1.00
NIKKEI 225 17,563.40 14,045.50 20.03% 18,300.40 30.29% 1.04
FTSE 100 6,137.10 5,467.40 10.91% 6,451.40 18.00% 1.05
NASDAQ E MINI CONTINUOUS 1,765.75 1,457.75 17.44% 1,867.75 28.13% 1.06
AUSTRIA ATX 4,353.13 3,238.69 25.60% 4,617.79 42.58% 1.06
NASDAQ COMP 2,375.54 2,012.78 15.27% 2,531.42 25.77% 1.07
TAIWAN WEIGHTED 7,476.07 6,232.49 16.63% 7,999.42 28.35% 1.07
NETHERLANDS AEX GENERAL 478.44 409.56 14.40% 512.47 25.13% 1.07
CANADA S&P TSX COMPOSITES 12,494.70 10,860.70 13.08% 13,433.00 23.68% 1.08
NORWAY OSE ALL SHARE 493.90 383.34 22.39% 534.52 39.44% 1.08
CAC 5,329.16 4,564.69 14.35% 5,771.69 26.44% 1.08
DJIA 11,670.20 10,683.30 8.46% 12,795.90 19.77% 1.10
S&P 500 NDX CONTINUOUS 1,331.20 1,229.20 7.66% 1,464.50 19.14% 1.10
S&P 500 INDEX 1,326.70 1,219.29 8.10% 1,461.57 19.87% 1.10
ITALY MIB TEL 30,154.00 26,398.00 12.46% 33,329.00 26.26% 1.11
GREECE GENERAL SHARE 4,334.18 3,362.24 22.43% 4,802.53 42.84% 1.11
BRAZIL BOVESPA 42,061.60 32,057.30 23.78% 46,752.10 45.84% 1.11
NSE 50 (INDIA) 3,774.15 2,595.65 31.23% 4,245.30 63.55% 1.12
AUSTRALIA ORDINARIES 5,352.10 4,726.00 11.70% 6,024.70 27.48% 1.13
ARGENTINA MERVAL 1,952.93 1,486.56 23.88% 2,225.56 49.71% 1.14
DAX 6,162.37 5,243.71 14.91% 7,040.20 34.26% 1.14
BELGIUM BEL 20 3,988.28 3,409.20 14.52% 4,564.29 33.88% 1.14
SWITZERLAND SWISS MARKETS 8,158.89 7,123.18 12.69% 9,376.65 31.64% 1.15
SENSEX 12,671.11 8,799.01 30.56% 14,723.88 67.34% 1.16
JAKARTA COMP 1,553.49 1,222.28 21.32% 1,843.35 50.81% 1.19
HANGSENG 17,328.40 15,204.90 12.25% 20,971.50 37.93% 1.21
STRAITS TIME INDEX 2,666.63 2,277.91 14.58% 3,316.22 45.58% 1.24
SPAIN MADRID GENERAL 1,321.97 1,167.73 11.67% 1,664.85 42.57% 1.26
SRI LANKA ALL SHARE 2,398.57 2,058.42 14.18% 3,038.48 47.61% 1.27
PHILIPPINES PSE COMPOSITES 2,602.46 2,034.49 21.82% 3,417.08 67.96% 1.31
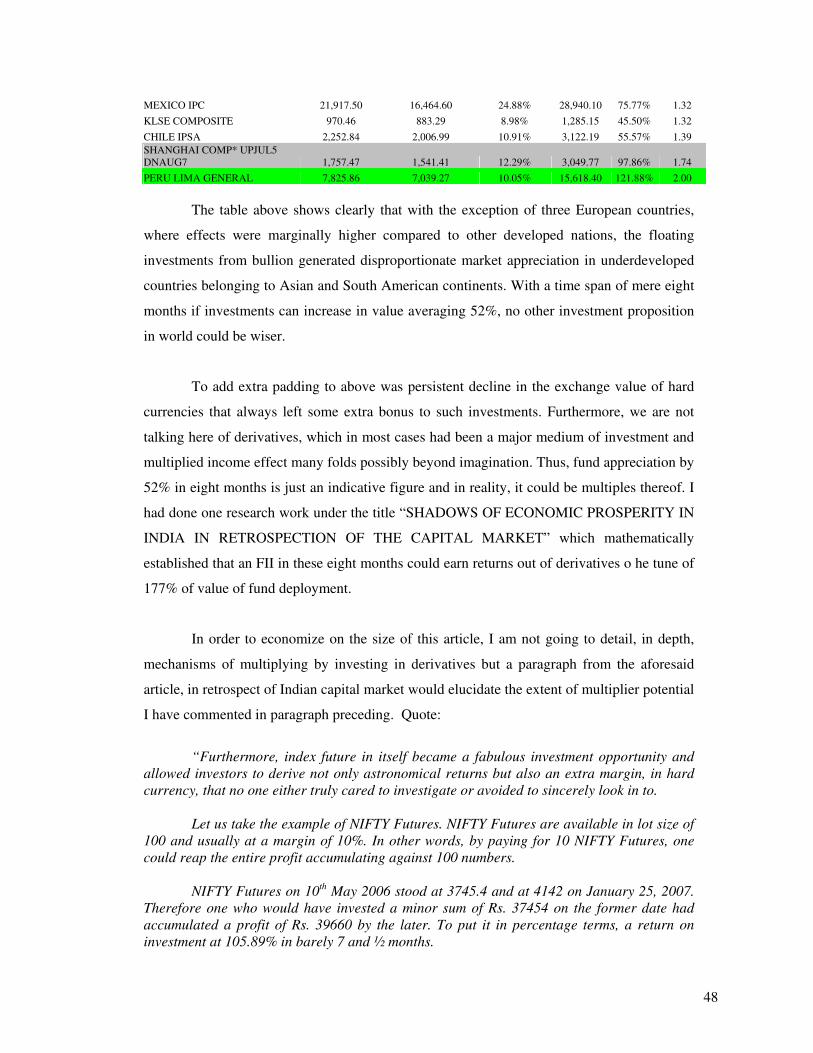
48
MEXICO IPC 21,917.50 16,464.60 24.88% 28,940.10 75.77% 1.32
KLSE COMPOSITE 970.46 883.29 8.98% 1,285.15 45.50% 1.32
CHILE IPSA 2,252.84 2,006.99 10.91% 3,122.19 55.57% 1.39
SHANGHAI COMP* UPJUL5 DNAUG7 1,757.47 1,541.41 12.29% 3,049.77 97.86% 1.74
PERU LIMA GENERAL 7,825.86 7,039.27 10.05% 15,618.40 121.88% 2.00
The table above shows clearly that with the exception of three European countries,
where effects were marginally higher compared to other developed nations, the floating
investments from bullion generated disproportionate market appreciation in underdeveloped
countries belonging to Asian and South American continents. With a time span of mere eight
months if investments can increase in value averaging 52%, no other investment proposition
in world could be wiser.
To add extra padding to above was persistent decline in the exchange value of hard
currencies that always left some extra bonus to such investments. Furthermore, we are not
talking here of derivatives, which in most cases had been a major medium of investment and
multiplied income effect many folds possibly beyond imagination. Thus, fund appreciation by
52% in eight months is just an indicative figure and in reality, it could be multiples thereof. I
had done one research work under the title “SHADOWS OF ECONOMIC PROSPERITY IN
INDIA IN RETROSPECTION OF THE CAPITAL MARKET” which mathematically
established that an FII in these eight months could earn returns out of derivatives o he tune of
177% of value of fund deployment.
In order to economize on the size of this article, I am not going to detail, in depth,
mechanisms of multiplying by investing in derivatives but a paragraph from the aforesaid
article, in retrospect of Indian capital market would elucidate the extent of multiplier potential
I have commented in paragraph preceding. Quote:
“Furthermore, index future in itself became a fabulous investment opportunity and
allowed investors to derive not only astronomical returns but also an extra margin, in hard currency, that no one either truly cared to investigate or avoided to sincerely look in to.
Let us take the example of NIFTY Futures. NIFTY Futures are available in lot size of 100 and usually at a margin of 10%. In other words, by paying for 10 NIFTY Futures, one could reap the entire profit accumulating against 100 numbers.
NIFTY Futures on 10th May 2006 stood at 3745.4 and at 4142 on January 25, 2007. Therefore one who would have invested a minor sum of Rs. 37454 on the former date had accumulated a profit of Rs. 39660 by the later. To put it in percentage terms, a return on investment at 105.89% in barely 7 and ½ months.
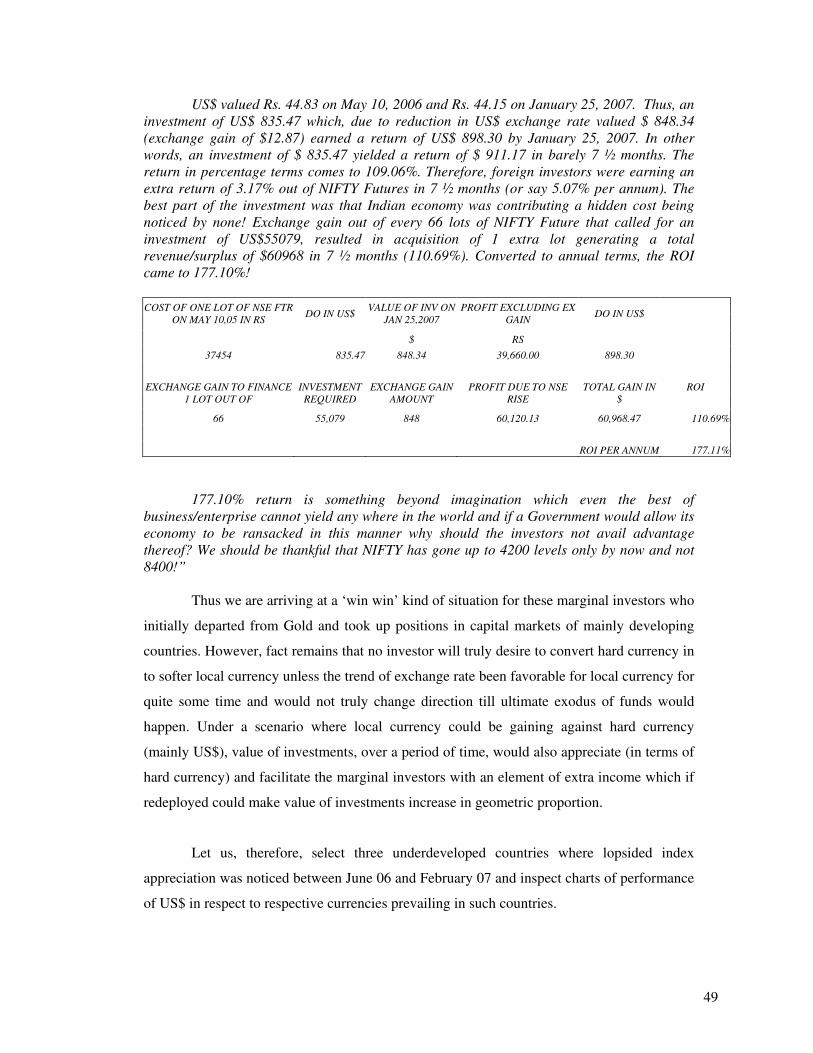
49
US$ valued Rs. 44.83 on May 10, 2006 and Rs. 44.15 on January 25, 2007. Thus, an investment of US$ 835.47 which, due to reduction in US$ exchange rate valued $ 848.34 (exchange gain of $12.87) earned a return of US$ 898.30 by January 25, 2007. In other words, an investment of $ 835.47 yielded a return of $ 911.17 in barely 7 ½ months. The return in percentage terms comes to 109.06%. Therefore, foreign investors were earning an extra return of 3.17% out of NIFTY Futures in 7 ½ months (or say 5.07% per annum). The best part of the investment was that Indian economy was contributing a hidden cost being noticed by none! Exchange gain out of every 66 lots of NIFTY Future that called for an investment of US$55079, resulted in acquisition of 1 extra lot generating a total revenue/surplus of $60968 in 7 ½ months (110.69%). Converted to annual terms, the ROI came to 177.10%!
COST OF ONE LOT OF NSE FTR ON MAY 10,05 IN RS
DO IN US$ VALUE OF INV ON
JAN 25,2007 PROFIT EXCLUDING EX
GAIN DO IN US$
$ RS
37454 835.47 848.34 39,660.00 898.30
ROI EXCHANGE GAIN TO FINANCE 1 LOT OUT OF
INVESTMENT REQUIRED
EXCHANGE GAIN AMOUNT
PROFIT DUE TO NSE RISE
TOTAL GAIN IN $
66 55,079 848 60,120.13 60,968.47 110.69%
ROI PER ANNUM 177.11%
177.10% return is something beyond imagination which even the best of business/enterprise cannot yield any where in the world and if a Government would allow its economy to be ransacked in this manner why should the investors not avail advantage thereof? We should be thankful that NIFTY has gone up to 4200 levels only by now and not 8400!”
Thus we are arriving at a ‘win win’ kind of situation for these marginal investors who
initially departed from Gold and took up positions in capital markets of mainly developing
countries. However, fact remains that no investor will truly desire to convert hard currency in
to softer local currency unless the trend of exchange rate been favorable for local currency for
quite some time and would not truly change direction till ultimate exodus of funds would
happen. Under a scenario where local currency could be gaining against hard currency
(mainly US$), value of investments, over a period of time, would also appreciate (in terms of
hard currency) and facilitate the marginal investors with an element of extra income which if
redeployed could make value of investments increase in geometric proportion.
Let us, therefore, select three underdeveloped countries where lopsided index
appreciation was noticed between June 06 and February 07 and inspect charts of performance
of US$ in respect to respective currencies prevailing in such countries.
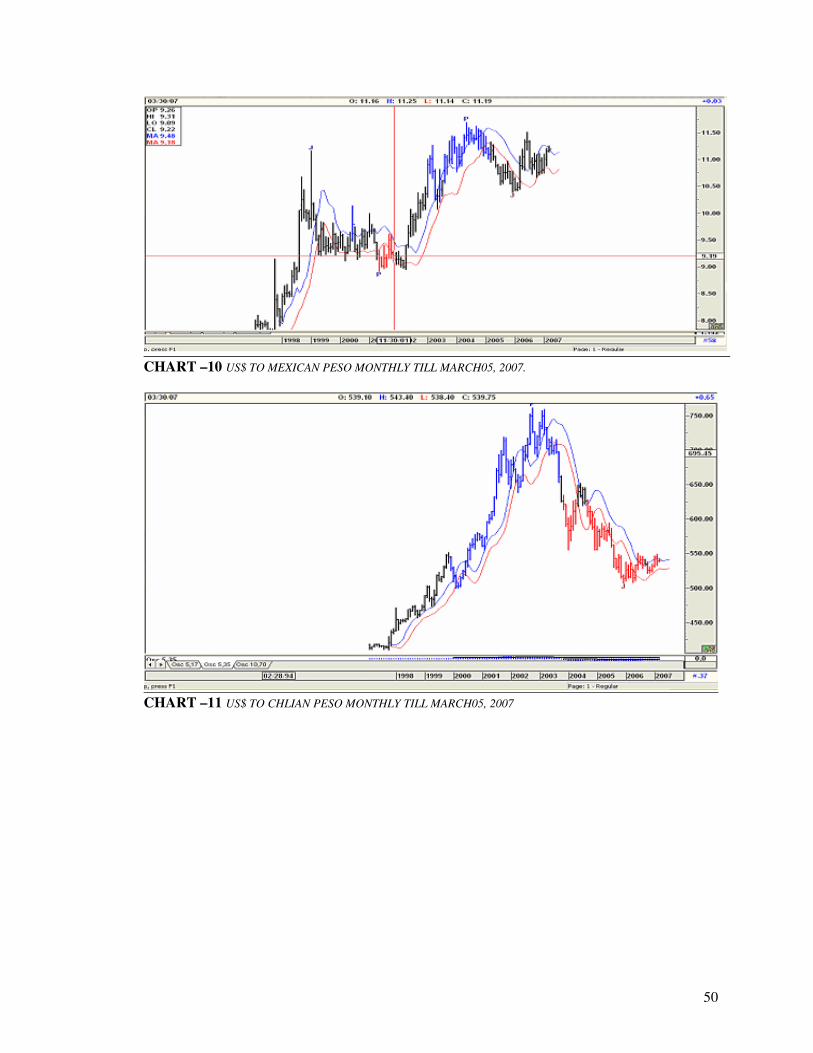
50
CHART –10 US$ TO MEXICAN PESO MONTHLY TILL MARCH05, 2007.
CHART –11 US$ TO CHLIAN PESO MONTHLY TILL MARCH05, 2007
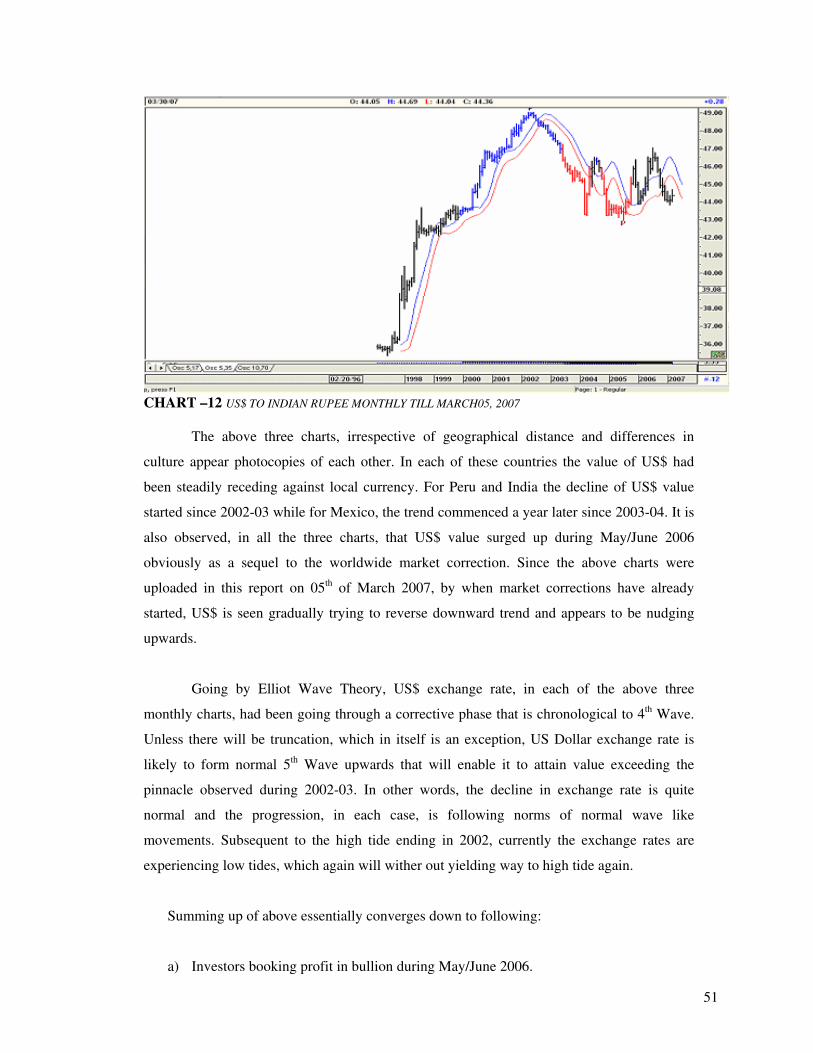
51
CHART –12 US$ TO INDIAN RUPEE MONTHLY TILL MARCH05, 2007
The above three charts, irrespective of geographical distance and differences in
culture appear photocopies of each other. In each of these countries the value of US$ had
been steadily receding against local currency. For Peru and India the decline of US$ value
started since 2002-03 while for Mexico, the trend commenced a year later since 2003-04. It is
also observed, in all the three charts, that US$ value surged up during May/June 2006
obviously as a sequel to the worldwide market correction. Since the above charts were
uploaded in this report on 05th of March 2007, by when market corrections have already
started, US$ is seen gradually trying to reverse downward trend and appears to be nudging
upwards.
Going by Elliot Wave Theory, US$ exchange rate, in each of the above three
monthly charts, had been going through a corrective phase that is chronological to 4th Wave.
Unless there will be truncation, which in itself is an exception, US Dollar exchange rate is
likely to form normal 5th Wave upwards that will enable it to attain value exceeding the
pinnacle observed during 2002-03. In other words, the decline in exchange rate is quite
normal and the progression, in each case, is following norms of normal wave like
movements. Subsequent to the high tide ending in 2002, currently the exchange rates are
experiencing low tides, which again will wither out yielding way to high tide again.
Summing up of above essentially converges down to following:
a) Investors booking profit in bullion during May/June 2006.
52
b) Investors booking profit in various capital markets during May/June 2006.
c) A chunk of investors from bullion bifurcating to capital markets of mostly
underdeveloped countries and earning astronomical profits by literally overpowering
the exchanges due to low levels of market capitalization prevailing there.
d) Time to time systematic profit booking and withdrawal of investments has started at
said capital markets and a part of this is being reinvested in Gold with the idea of
boosting up its value.
Let us now turn our attention to capital markets where we see indexes not only
recovering the slump of May/June 2006 but also appreciating in proportions higher than the
falls witnessed. Index appreciation factors, as seen in TABLE A, uncannily relate to
Fibonacci numbers and ratios. Fibonacci numbers like 1,2,3 and 5 are seen repeating in a
number of instances. Fibonacci ratios like 1.618 or square thereof (i.e.2.62) or (0.618) ²
/(0.618) ³ are seen often either independently or as an additional factor to another Fibonacci
number. For example 2.36 is 10 times (0.618) ³. Factors like 2.2 are derived from (2*55)/50.
Uncanny correlation to Fibonacci series and ratios lead us to Elliot Wave Theory once again.
Going by the famous graph drawn by Mr. R.N. Elliot himself (featuring later), that
showed likelihood of Grand Super Cycle which began around 1776 ending around 2012, the
world capital market at present, could either be at the ultimate state of the 5th Wave or in
between somewhere within the corrective phase. Why corrective phase? The looks of various
charts of market indices around the world do suggest that the Grand Super Cycle could have
ended during May /June 2006 and that we could be in Wave B (a phase of inverse
retracement). Often in instances of complex corrections, especially in the cases of Expanded
Flat corrections it is common for Wave B to appreciate beyond the high of the motive wave.
Therefore with Fibonacci ratios working out perfect (termed by Mr. Elliot as universal
ratios) there could be every possibility of February/March 2007 corrections leading to Wave
C downward. If Wave C has started around the world, there are good chances of present
moderate corrections gradually gaining on momentum and driving the entire world in to a
state of Deflation.
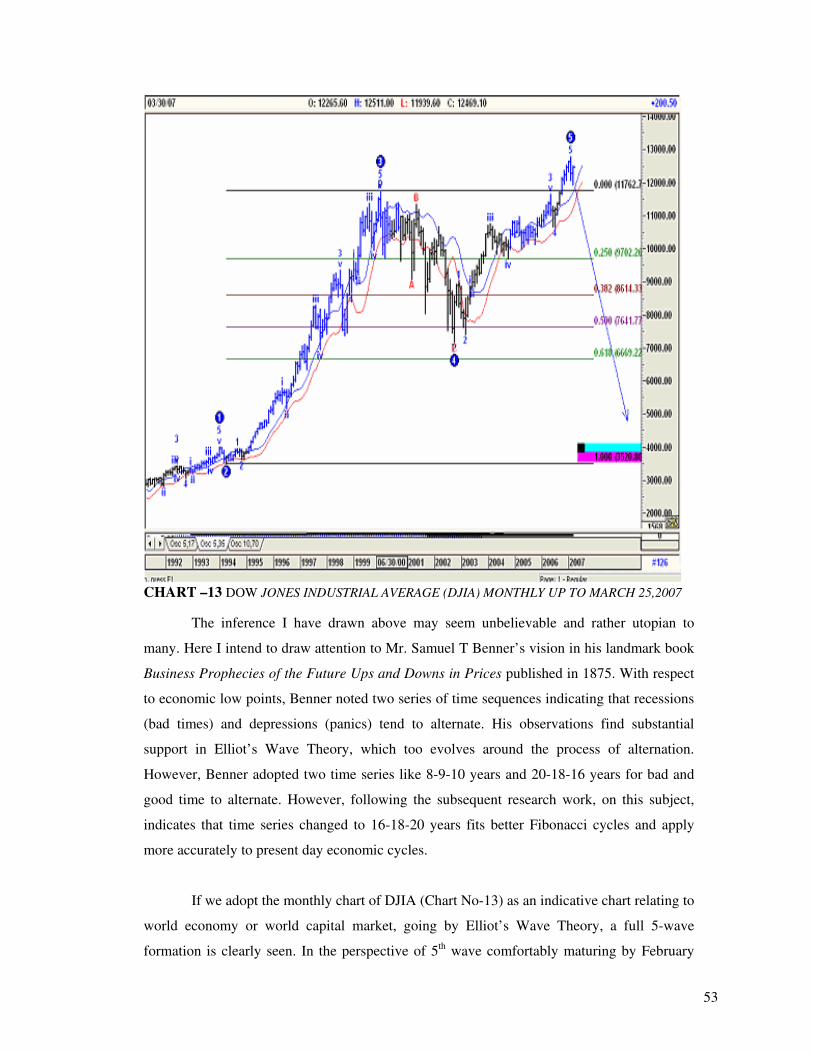
53
CHART –13 DOW JONES INDUSTRIAL AVERAGE (DJIA) MONTHLY UP TO MARCH 25,2007
The inference I have drawn above may seem unbelievable and rather utopian to
many. Here I intend to draw attention to Mr. Samuel T Benner’s vision in his landmark book
Business Prophecies of the Future Ups and Downs in Prices published in 1875. With respect
to economic low points, Benner noted two series of time sequences indicating that recessions
(bad times) and depressions (panics) tend to alternate. His observations find substantial
support in Elliot’s Wave Theory, which too evolves around the process of alternation.
However, Benner adopted two time series like 8-9-10 years and 20-18-16 years for bad and
good time to alternate. However, following the subsequent research work, on this subject,
indicates that time series changed to 16-18-20 years fits better Fibonacci cycles and apply
more accurately to present day economic cycles.
If we adopt the monthly chart of DJIA (Chart No-13) as an indicative chart relating to
world economy or world capital market, going by Elliot’s Wave Theory, a full 5-wave
formation is clearly seen. In the perspective of 5th wave comfortably maturing by February
54
2007, it will not be surprising if a 3 wave down cycle commence now. And should such
corrective trend set in, the Wave A itself should witness DJIA retracing to its 4th Wave
bottom levels i.e.7197 with Wave B and C to follow. With regard to time that should take for
this downward cycle to mature fully needs us to refer to Fibonacci Benner cycle described
above.
DJIA chart exhibits that the upward cycle commenced around November 1990 and
therefore has lasted approximately 16 years. Thus, following Fibonacci Benner cycle, the
downward cycle could last 18 years from now or say up to 2025. In other words, while world
economists are tearing their hair apart in finding out measures to curb inflation, world
economy is passing through a transition phase that moves it from inflation to a state of
deflation which could last up to minimum 2025.
Whether the world economy transforms from inflationary to deflationary irrespective,
I feel it would be of vital importance to detect reasons propelling the corrections during
May/June last year since bounce back therefrom caused the fascinating market uprising.
Factors which could have possibly added momentum and/or accelerated such market
appreciation also needs equal if not more emphasis but for the time being let us investigate
what could have sent shockwaves that resulted in market correction during May/June 2006
and had some what lingering effect even during the month following i.e. July 06.
55
4. JAPAN
Here I have no option but to point towards the second largest economy of the world
i.e. Japan that had extended over US$ 1 trillion as loan in open market for over a decade and
that too at almost zero rate of interest. It is known to all that since July, 2006 Bank of Japan
shifted from the policy of providing loan at almost zero rate of interest and ushered a new
policy of gradually raising the interest level. As a matter of fact, the way Bank of Japan has
been progressing, they would come at par with US Federal rates by 2014. The bank said in a
statement recently "The bank thinks that even if prices drop, that won't cripple economic
growth, and conditions were ripe for a rate hike"… "The bank made the right choice."
Though not relevant to market crash of May/June 2006, to understand sentiment,
which instigated BOJ to shift stand in this regard, let me quote a rather recent remark (of
January 25,2007) made by Ms. Myako Suda, Bank of Japan Board Member- quote “If there
is a high level of uncertainty, where there are widely varying views on the future economic
outlook, careful analysis and time are needed to read the trend out of mixed indicators … but
even so, by taking too much time in confirming (data), there is a risk of being too late in
raising rates, forcing us to step up the pace of future rate hikes … That would result in
causing big swings in economic activity and may hurt price stability in the long run.”
We need to appreciate here that Board members of Bank of Japan did not wake up
one sudden morning in July 2006 and moved forward to initiate a trend that tantamount to
reversal of their stand for over one decade. In other words, news of the impending change in
stand spread from May 2006 itself and a large portion of investors around the world resorted
to booking profit in order to repay the loan outstanding or part thereof. Obviously question
has to arise here as to what difference could it have made since the quantum of interest
imposed by Bank of Japan was only 0.25%.
The thought process behind this symbolic imposition of interest was much more
complex than what surfaces superficially. Bank of Japan and Federal Bank of USA are
known to keenly watch each other. These two countries comprising between themselves
almost 50% of world economy literally determine path for rest of the world to follow through
their respective finance policies.
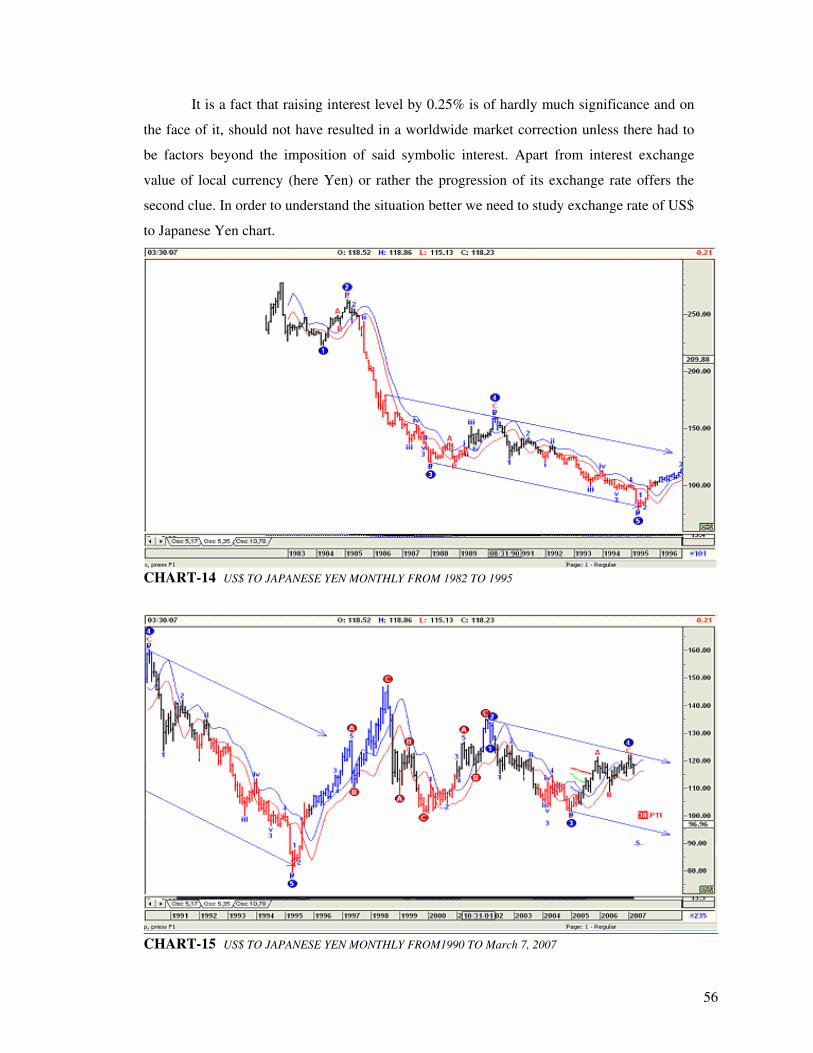
56
It is a fact that raising interest level by 0.25% is of hardly much significance and on
the face of it, should not have resulted in a worldwide market correction unless there had to
be factors beyond the imposition of said symbolic interest. Apart from interest exchange
value of local currency (here Yen) or rather the progression of its exchange rate offers the
second clue. In order to understand the situation better we need to study exchange rate of US$
to Japanese Yen chart.
CHART-14 US$ TO JAPANESE YEN MONTHLY FROM 1982 TO 1995
CHART-15 US$ TO JAPANESE YEN MONTHLY FROM1990 TO March 7, 2007
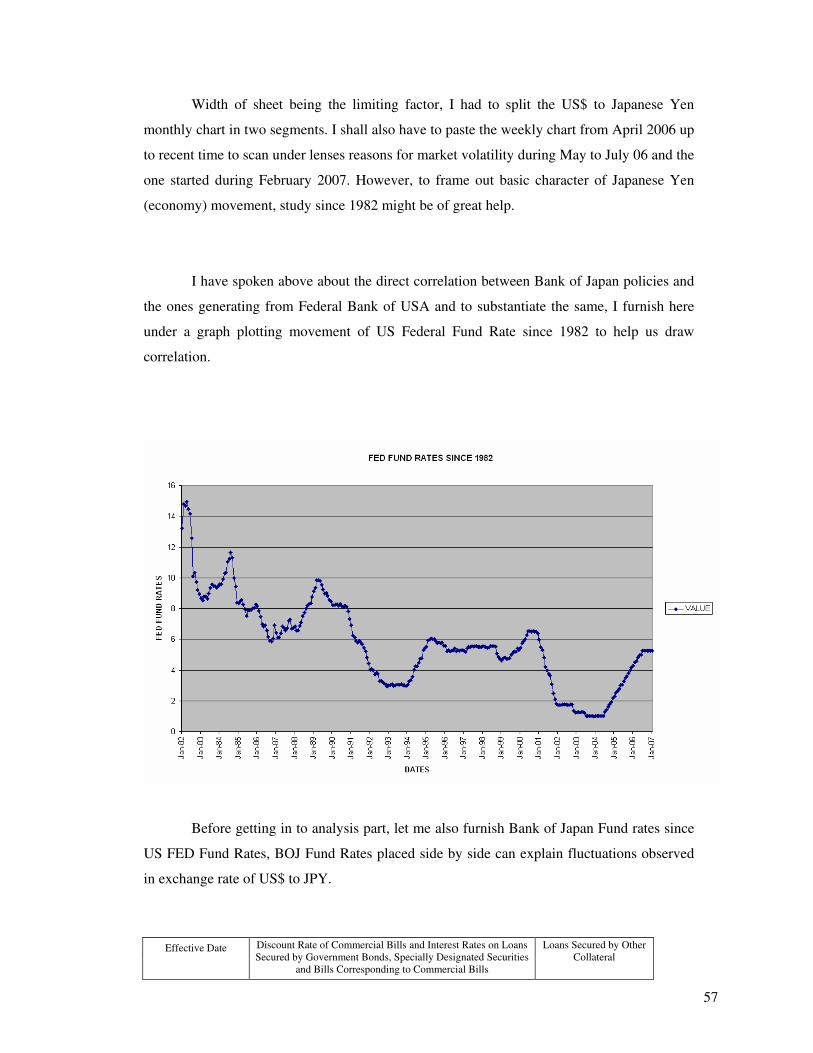
57
Width of sheet being the limiting factor, I had to split the US$ to Japanese Yen
monthly chart in two segments. I shall also have to paste the weekly chart from April 2006 up
to recent time to scan under lenses reasons for market volatility during May to July 06 and the
one started during February 2007. However, to frame out basic character of Japanese Yen
(economy) movement, study since 1982 might be of great help.
I have spoken above about the direct correlation between Bank of Japan policies and
the ones generating from Federal Bank of USA and to substantiate the same, I furnish here
under a graph plotting movement of US Federal Fund Rate since 1982 to help us draw
correlation.
Before getting in to analysis part, let me also furnish Bank of Japan Fund rates since
US FED Fund Rates, BOJ Fund Rates placed side by side can explain fluctuations observed
in exchange rate of US$ to JPY.
Effective Date Discount Rate of Commercial Bills and Interest Rates on Loans Secured by Government Bonds, Specially Designated Securities
and Bills Corresponding to Commercial Bills
Loans Secured by Other Collateral
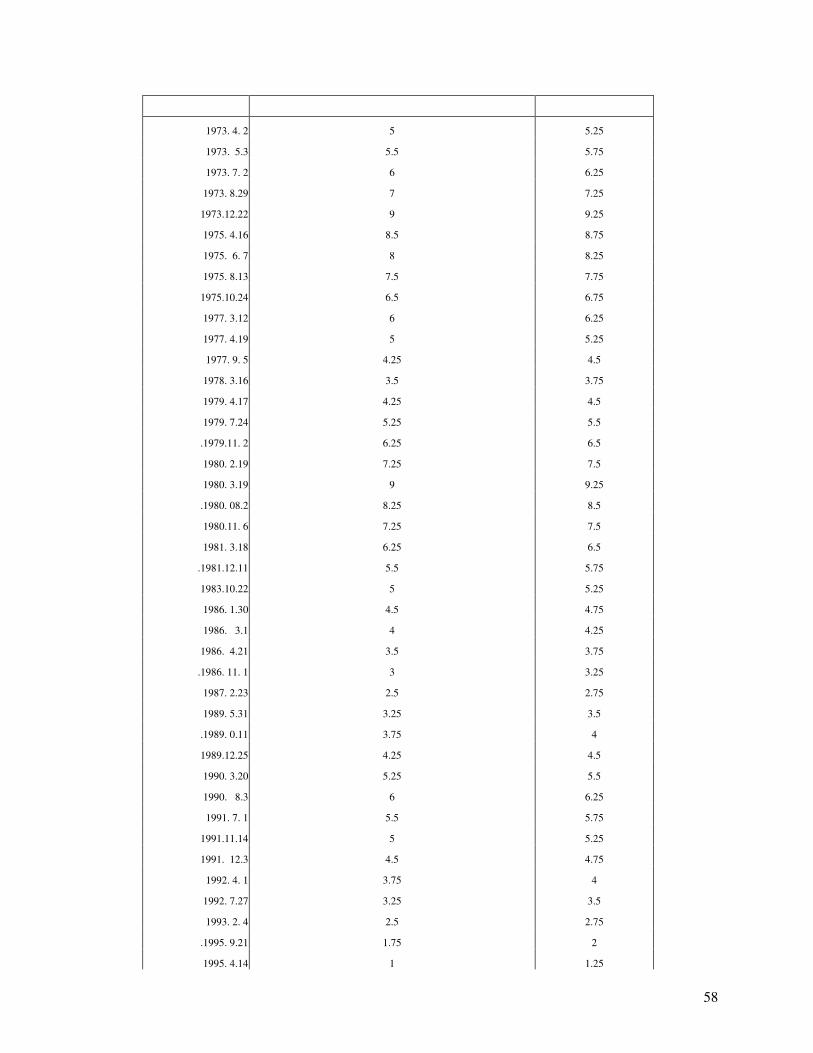
58
1973. 4. 2 5 5.25
1973. 5.3 5.5 5.75
1973. 7. 2 6 6.25
1973. 8.29 7 7.25
1973.12.22 9 9.25
1975. 4.16 8.5 8.75
1975. 6. 7 8 8.25
1975. 8.13 7.5 7.75
1975.10.24 6.5 6.75
1977. 3.12 6 6.25
1977. 4.19 5 5.25
1977. 9. 5 4.25 4.5
1978. 3.16 3.5 3.75
1979. 4.17 4.25 4.5
1979. 7.24 5.25 5.5
.1979.11. 2 6.25 6.5
1980. 2.19 7.25 7.5
1980. 3.19 9 9.25
.1980. 08.2 8.25 8.5
1980.11. 6 7.25 7.5
1981. 3.18 6.25 6.5
.1981.12.11 5.5 5.75
1983.10.22 5 5.25
1986. 1.30 4.5 4.75
1986. 3.1 4 4.25
1986. 4.21 3.5 3.75
.1986. 11. 1 3 3.25
1987. 2.23 2.5 2.75
1989. 5.31 3.25 3.5
.1989. 0.11 3.75 4
1989.12.25 4.25 4.5
1990. 3.20 5.25 5.5
1990. 8.3 6 6.25
1991. 7. 1 5.5 5.75
1991.11.14 5 5.25
1991. 12.3 4.5 4.75
1992. 4. 1 3.75 4
1992. 7.27 3.25 3.5
1993. 2. 4 2.5 2.75
.1995. 9.21 1.75 2
1995. 4.14 1 1.25
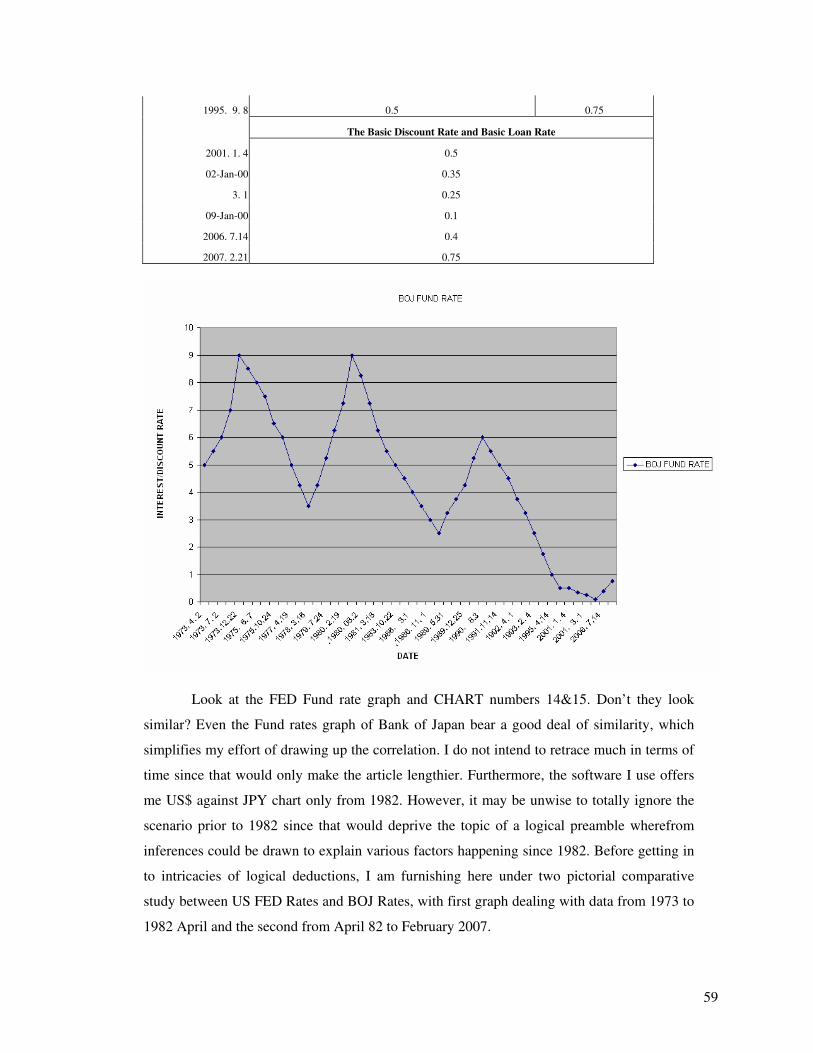
59
1995. 9. 8 0.5 0.75
The Basic Discount Rate and Basic Loan Rate
2001. 1. 4 0.5
02-Jan-00 0.35
3. 1 0.25
09-Jan-00 0.1
2006. 7.14 0.4
2007. 2.21 0.75
Look at the FED Fund rate graph and CHART numbers 14&15. Don’t they look
similar? Even the Fund rates graph of Bank of Japan bear a good deal of similarity, which
simplifies my effort of drawing up the correlation. I do not intend to retrace much in terms of
time since that would only make the article lengthier. Furthermore, the software I use offers
me US$ against JPY chart only from 1982. However, it may be unwise to totally ignore the
scenario prior to 1982 since that would deprive the topic of a logical preamble wherefrom
inferences could be drawn to explain various factors happening since 1982. Before getting in
to intricacies of logical deductions, I am furnishing here under two pictorial comparative
study between US FED Rates and BOJ Rates, with first graph dealing with data from 1973 to
1982 April and the second from April 82 to February 2007.
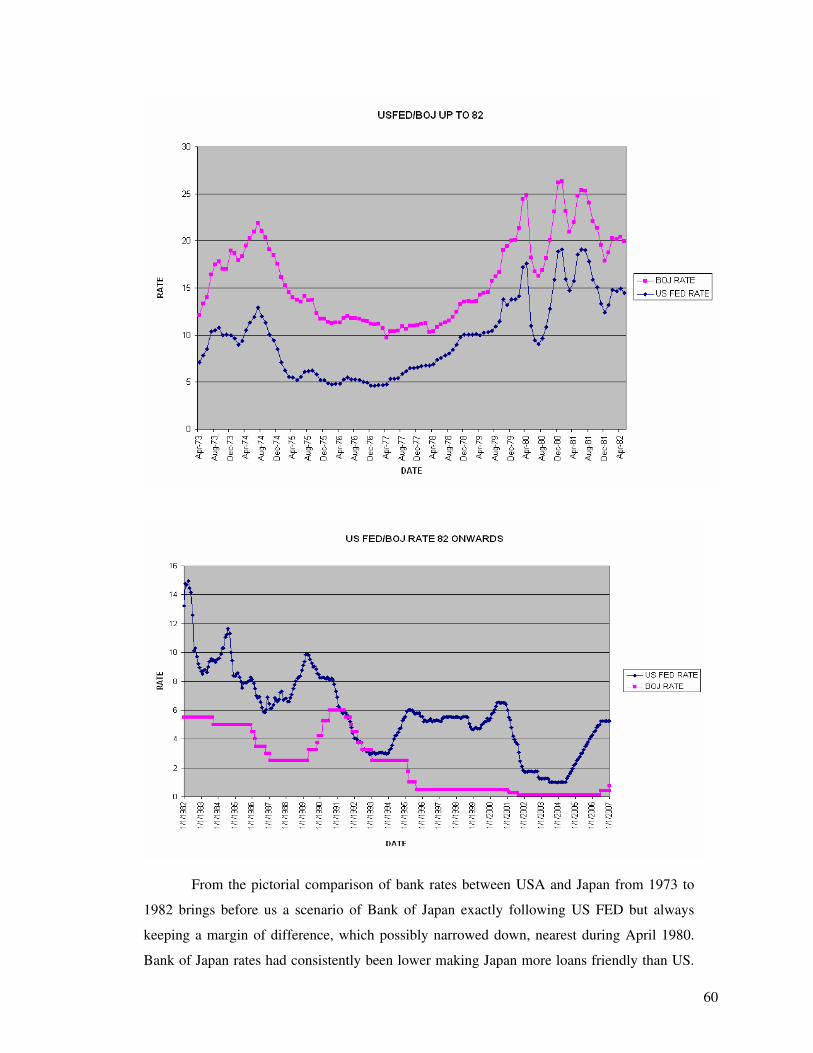
60
From the pictorial comparison of bank rates between USA and Japan from 1973 to
1982 brings before us a scenario of Bank of Japan exactly following US FED but always
keeping a margin of difference, which possibly narrowed down, nearest during April 1980.
Bank of Japan rates had consistently been lower making Japan more loans friendly than US.
61
With Japanese economy promoting investments abroad, the situation helped local investors to
borrow money from banks and invest in shares, industries etc in foreign countries, especially
in USA. With Bank of Japan extending loans freely and at that too at interest always lower
than US FED rate, Japanese investors found it wise to borrow money from banks in Japan
and convert it in US$ or other hard currency which fetched more interest. Even for investors,
based in USA or other developed countries, it was more profitable to take loan in JPY from
Bank of Japan and then convert the proceeds in US dollar or other hard currency. This lead to
Japanese Yen exchange value consistently declining and reaching the bottom of US$ 1=JPY
277.45 in April 1982.
Declining value for JPY helped investors of Japan since most of the investments
overseas had been in US dollar terms and fetched income also in hard currencies that fetched
more and more Yen when brought back in to Japan. Here we need to understand the
psychology. For countries generating/extending FDI (foreign direct investment) declining
exchange rate is always beneficial as the same yields a substantial amount of margin (over
and above normal income/return) on account of exchange gain.
In other words, in the backdrop of small geographical size and limited population,
Japan had no option but to expand its financial and economic base beyond its own territories
where ready infrastructures were available. Thus we saw Japanese industries spreading
around the world with an emphasis on developed countries and mainly USA. Takeovers were
aplenty since that enabled them to consolidate on sectors and assume global control thereof.
With industries expanding mostly in developed world, Japan faced no dearth of skilled
manpower, technology and raw material all three of which, were scarce in their own country.
While world cried in sympathy at their dwindling currency value, before any one
could think, Japan had already by sheer money power taken over control of a significant
portion of commerce originally belonging to developed countries. Japan, in my opinion,
was the first country to realize that money was mightier than sword and without loss of a
single drop of blood had conquered what was beyond their dreams 40 years back.
Precisely around November 1982 there was a lateral shift in policies/circumstances,
which is somewhat, reflected in terms of BOJ fund rates. US FED rates were on upward
move since 1978 and stood at 14.94% in June 1982. From July 1982, FED rates started
declining and in October 1982 from double digit, it reduced to 9.71% and in the month
62
following to 9.2%. Between October 1982 and March 1983, US FED rates declined from
9.71% to 8.51%. In contrast to the above, Bank of Japan (BOJ) which had stipulated 5.50%
interest during December 1981, did not alter their rate till September 1983. This resulted in
narrowing of the gap between the two rates to an extent never witnessed ever before. What
could be the reason behind this rigidity? No doubt with USA reducing FED rates, supply
factor for JPY would get affected as more investors would then run for US$ rather than JPY
as they were not responding to rate cut.
Looking at it from a different angle: while USA was reducing their interest rate, with
Japan rigidly holding firm, a message of Japanese currency gradually gaining foothold was
clear. It also had to generate a kind of message that Japanese economy was gaining stronger
and that more stringent fiscal policies would follow soon.
In other words, it was a call that time had come for reversal of trend in perpetually
declining exchange rates. The strategy worked wonders and as if by magic, reversed the trend
of exchange rate of JPY. JPY started gaining against US$ and the exchange rate fell from
US$-JPY 277.45 to JPY 235.7 between November 1982 and March 1983.
In my opinion and more so as reflected in terms of the charts of exchange rates, furnished
above, this was an experimental move. Logical reasons supporting such move possibly were
the following:
a) Japan had already extended tentacles of commerce and industry substantially by then
and possibly was reaching a saturation point.
b) With establishment of industries and commerce (deployment of funds) came the
necessity of deriving income therefrom.
c) Japan knew or was sure that the slump/lull in capital market between 1966 and 1982
was about to end and precisely during August/September something (Pan AM
bombing) happened or was made to happen that could provide momentum to the
market. In other words, Japan was sure that investors from Japan would gain from
market appreciation and it would really not matter to them if BOJ did not reduce their
fund rates.
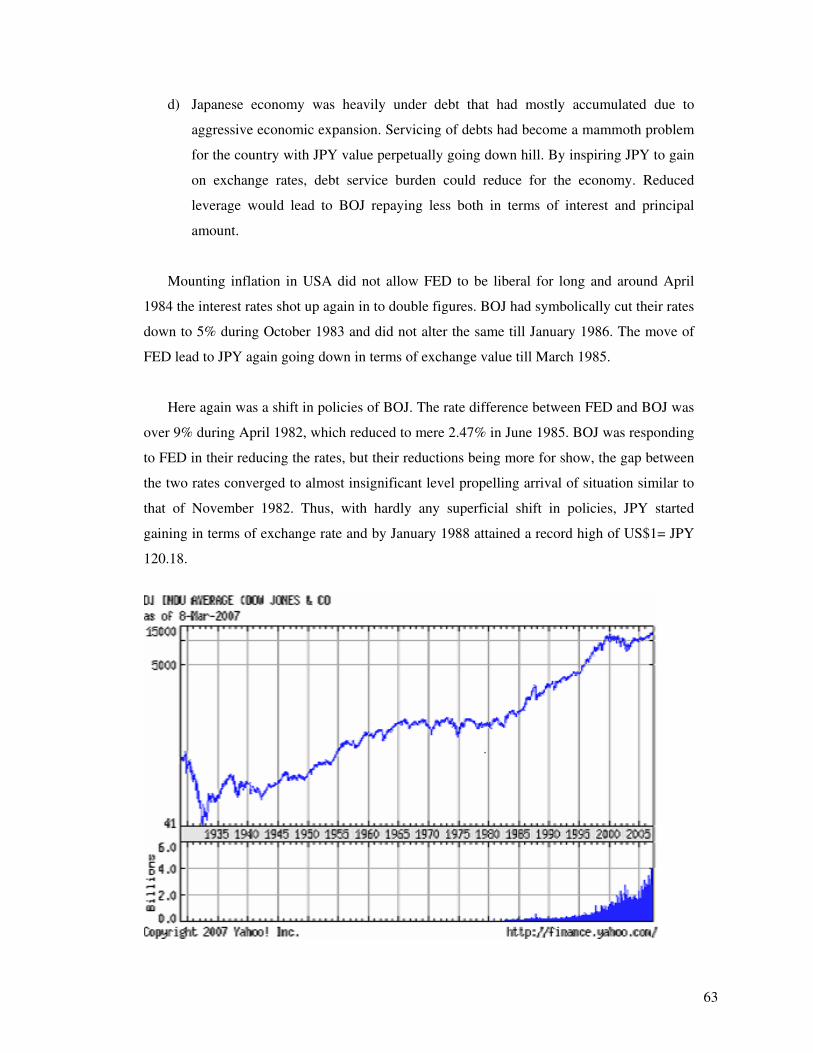
63
d) Japanese economy was heavily under debt that had mostly accumulated due to
aggressive economic expansion. Servicing of debts had become a mammoth problem
for the country with JPY value perpetually going down hill. By inspiring JPY to gain
on exchange rates, debt service burden could reduce for the economy. Reduced
leverage would lead to BOJ repaying less both in terms of interest and principal
amount.
Mounting inflation in USA did not allow FED to be liberal for long and around April
1984 the interest rates shot up again in to double figures. BOJ had symbolically cut their rates
down to 5% during October 1983 and did not alter the same till January 1986. The move of
FED lead to JPY again going down in terms of exchange value till March 1985.
Here again was a shift in policies of BOJ. The rate difference between FED and BOJ was
over 9% during April 1982, which reduced to mere 2.47% in June 1985. BOJ was responding
to FED in their reducing the rates, but their reductions being more for show, the gap between
the two rates converged to almost insignificant level propelling arrival of situation similar to
that of November 1982. Thus, with hardly any superficial shift in policies, JPY started
gaining in terms of exchange rate and by January 1988 attained a record high of US$1= JPY
120.18.
64
DJIA chart indicates a period of rapid growth between 1985 and 1988 thus with
income and investments both appreciating, it did not matter for Japanese investors.
Furthermore, with Japan slowing down (possibly) in aggressively investing abroad, it was a
double gain situation for Japanese investors as they were not only gaining in terms of
appreciation of investments but also in terms of their assets (converted in terms of JPY)
increasing in net worth in real terms.
From the point of view of debt, BOJ gained phenomenally as US$ value fell from
262.8 to 120.8. For an outstanding of U$1 million BOJ had to repay JPY 262,800,000 during
February 1985 whilst in January 1988 the debt came down to mere JPY 120.8 millions (gain
by 54%). In other words, in this mechanism, the debts, due to exchange rate advantage,
earned for BOJ a return of 18% (simple) per annum.
In other words, having read the likely movement of world capital market well, BOJ
could start a new sentiment amongst the investors originating from that country. The
investors developed the habit of repatriating their gains back to their own country, an ideal
situation possibly originally envisaged by BOJ.
Markets declined in 1988. FED had no alternative but to increase their rates till
September 1989. Japan knew that the slump was temporary and the real surge was just
around the corner. BOJ raised their rates too, but in a manner that gap between FED and
BOJ could expand. During March 1989, this gap was 7.35%. Think of it. From a gap of
mere 2.47% to 7.35%!
In other words, Japan knew precisely well when to invest and when to reap harvest
out of such investment without deployment of additional funds. When markets fell and fresh
positions had to be taken, BOJ let their rates down to motivate investors from Japan to invest
and when market reached the crest, created a situation, where JPY value would increase so
that gain could be maximized. With market in relatively low position, BOJ came up with rate
difference of 7.35% and with investment quota being almost complete, increased their rate
0.05% higher in October 1991. Some thing for sure told Japan than market all around the
world would heave upwards from October 1991 and that time had arrived to sit back and
enjoy the income from investments.
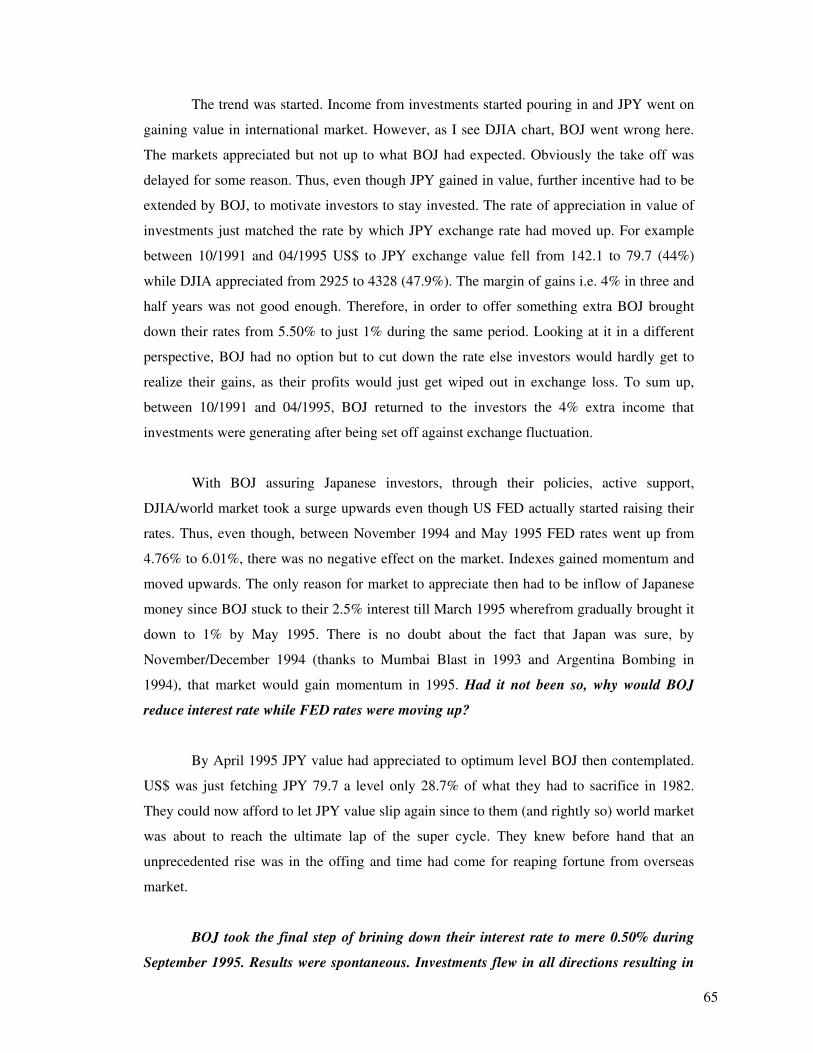
65
The trend was started. Income from investments started pouring in and JPY went on
gaining value in international market. However, as I see DJIA chart, BOJ went wrong here.
The markets appreciated but not up to what BOJ had expected. Obviously the take off was
delayed for some reason. Thus, even though JPY gained in value, further incentive had to be
extended by BOJ, to motivate investors to stay invested. The rate of appreciation in value of
investments just matched the rate by which JPY exchange rate had moved up. For example
between 10/1991 and 04/1995 US$ to JPY exchange value fell from 142.1 to 79.7 (44%)
while DJIA appreciated from 2925 to 4328 (47.9%). The margin of gains i.e. 4% in three and
half years was not good enough. Therefore, in order to offer something extra BOJ brought
down their rates from 5.50% to just 1% during the same period. Looking at it in a different
perspective, BOJ had no option but to cut down the rate else investors would hardly get to
realize their gains, as their profits would just get wiped out in exchange loss. To sum up,
between 10/1991 and 04/1995, BOJ returned to the investors the 4% extra income that
investments were generating after being set off against exchange fluctuation.
With BOJ assuring Japanese investors, through their policies, active support,
DJIA/world market took a surge upwards even though US FED actually started raising their
rates. Thus, even though, between November 1994 and May 1995 FED rates went up from
4.76% to 6.01%, there was no negative effect on the market. Indexes gained momentum and
moved upwards. The only reason for market to appreciate then had to be inflow of Japanese
money since BOJ stuck to their 2.5% interest till March 1995 wherefrom gradually brought it
down to 1% by May 1995. There is no doubt about the fact that Japan was sure, by
November/December 1994 (thanks to Mumbai Blast in 1993 and Argentina Bombing in
1994), that market would gain momentum in 1995. Had it not been so, why would BOJ
reduce interest rate while FED rates were moving up?
By April 1995 JPY value had appreciated to optimum level BOJ then contemplated.
US$ was just fetching JPY 79.7 a level only 28.7% of what they had to sacrifice in 1982.
They could now afford to let JPY value slip again since to them (and rightly so) world market
was about to reach the ultimate lap of the super cycle. They knew before hand that an
unprecedented rise was in the offing and time had come for reaping fortune from overseas
market.
BOJ took the final step of brining down their interest rate to mere 0.50% during
September 1995. Results were spontaneous. Investments flew in all directions resulting in
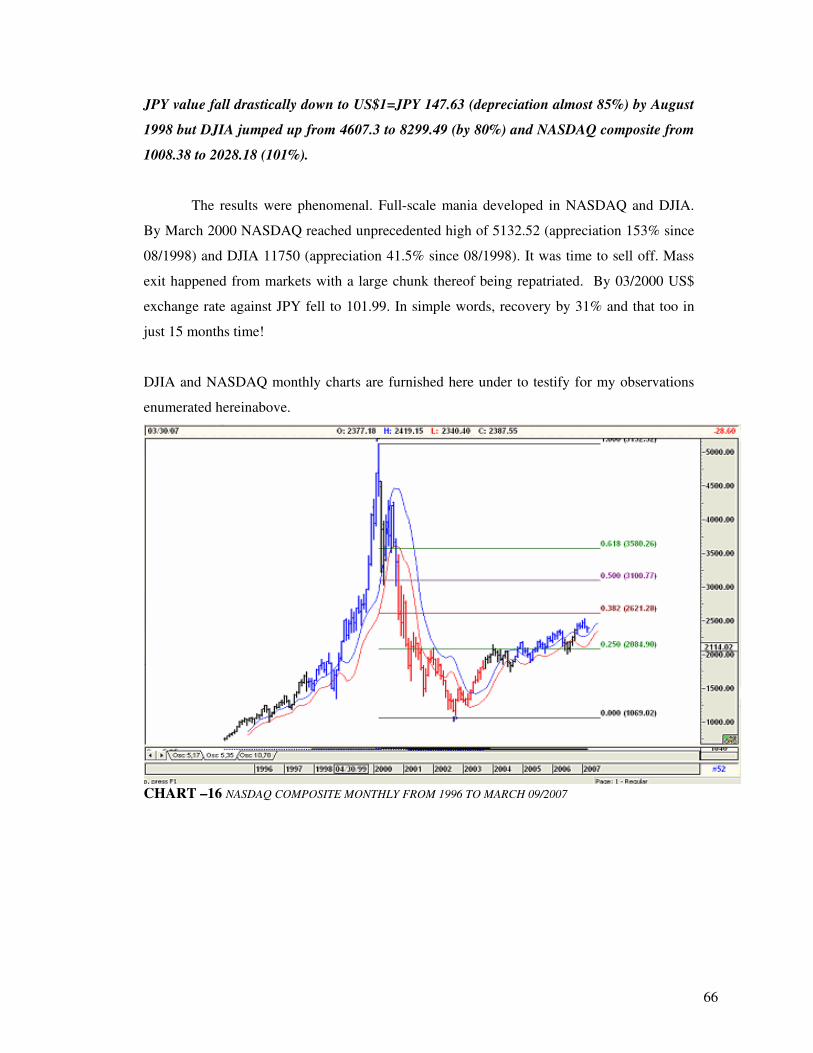
66
JPY value fall drastically down to US$1=JPY 147.63 (depreciation almost 85%) by August
1998 but DJIA jumped up from 4607.3 to 8299.49 (by 80%) and NASDAQ composite from
1008.38 to 2028.18 (101%).
The results were phenomenal. Full-scale mania developed in NASDAQ and DJIA.
By March 2000 NASDAQ reached unprecedented high of 5132.52 (appreciation 153% since
08/1998) and DJIA 11750 (appreciation 41.5% since 08/1998). It was time to sell off. Mass
exit happened from markets with a large chunk thereof being repatriated. By 03/2000 US$
exchange rate against JPY fell to 101.99. In simple words, recovery by 31% and that too in
just 15 months time!
DJIA and NASDAQ monthly charts are furnished here under to testify for my observations
enumerated hereinabove.
CHART –16 NASDAQ COMPOSITE MONTHLY FROM 1996 TO MARCH 09/2007
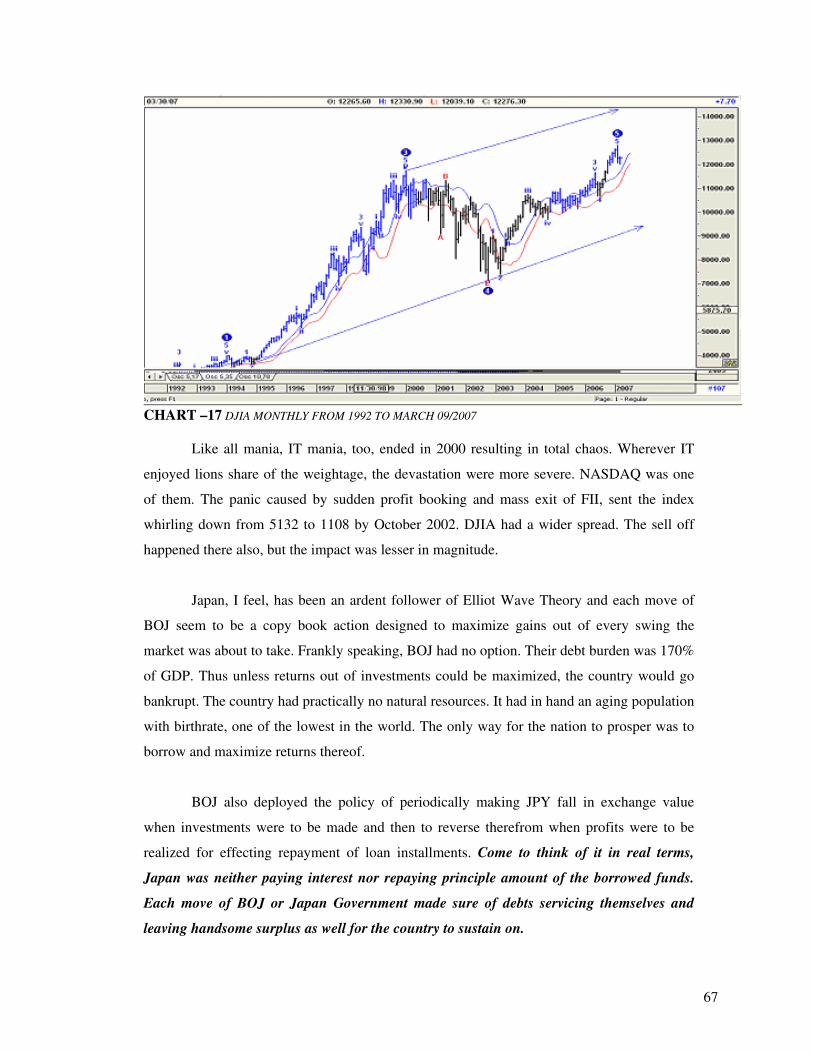
67
CHART –17 DJIA MONTHLY FROM 1992 TO MARCH 09/2007
Like all mania, IT mania, too, ended in 2000 resulting in total chaos. Wherever IT
enjoyed lions share of the weightage, the devastation were more severe. NASDAQ was one
of them. The panic caused by sudden profit booking and mass exit of FII, sent the index
whirling down from 5132 to 1108 by October 2002. DJIA had a wider spread. The sell off
happened there also, but the impact was lesser in magnitude.
Japan, I feel, has been an ardent follower of Elliot Wave Theory and each move of
BOJ seem to be a copy book action designed to maximize gains out of every swing the
market was about to take. Frankly speaking, BOJ had no option. Their debt burden was 170%
of GDP. Thus unless returns out of investments could be maximized, the country would go
bankrupt. The country had practically no natural resources. It had in hand an aging population
with birthrate, one of the lowest in the world. The only way for the nation to prosper was to
borrow and maximize returns thereof.
BOJ also deployed the policy of periodically making JPY fall in exchange value
when investments were to be made and then to reverse therefrom when profits were to be
realized for effecting repayment of loan installments. Come to think of it in real terms,
Japan was neither paying interest nor repaying principle amount of the borrowed funds.
Each move of BOJ or Japan Government made sure of debts servicing themselves and
leaving handsome surplus as well for the country to sustain on.
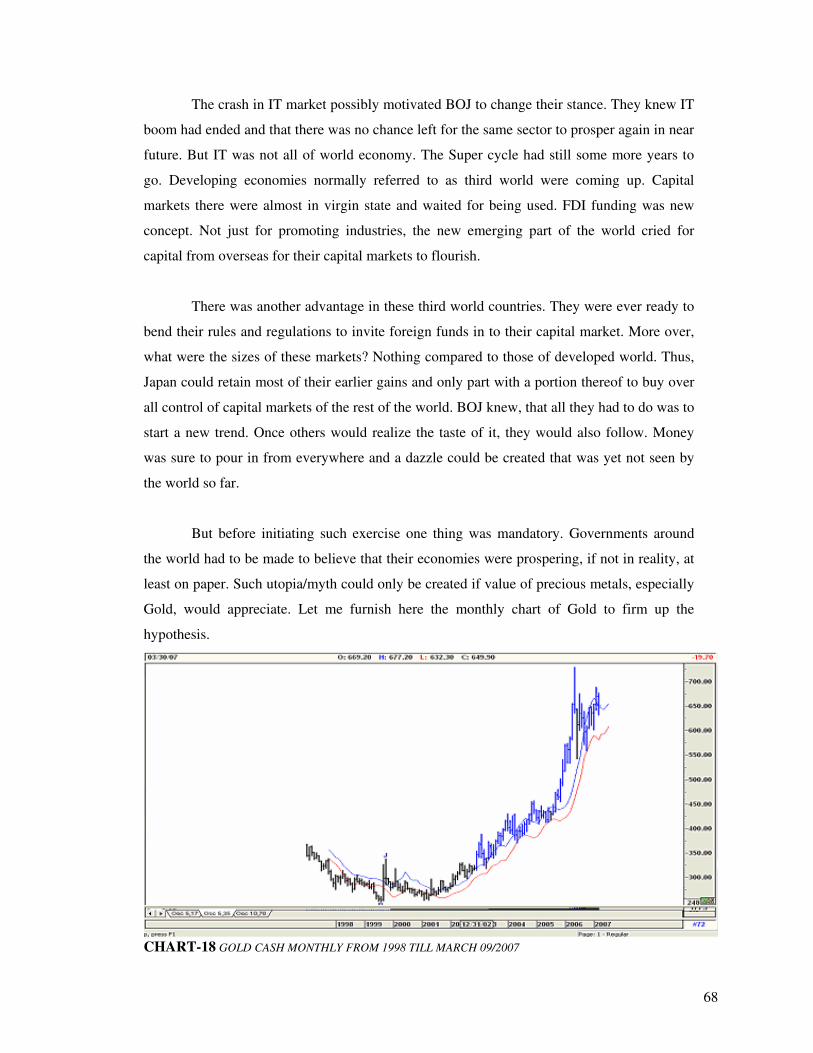
68
The crash in IT market possibly motivated BOJ to change their stance. They knew IT
boom had ended and that there was no chance left for the same sector to prosper again in near
future. But IT was not all of world economy. The Super cycle had still some more years to
go. Developing economies normally referred to as third world were coming up. Capital
markets there were almost in virgin state and waited for being used. FDI funding was new
concept. Not just for promoting industries, the new emerging part of the world cried for
capital from overseas for their capital markets to flourish.
There was another advantage in these third world countries. They were ever ready to
bend their rules and regulations to invite foreign funds in to their capital market. More over,
what were the sizes of these markets? Nothing compared to those of developed world. Thus,
Japan could retain most of their earlier gains and only part with a portion thereof to buy over
all control of capital markets of the rest of the world. BOJ knew, that all they had to do was to
start a new trend. Once others would realize the taste of it, they would also follow. Money
was sure to pour in from everywhere and a dazzle could be created that was yet not seen by
the world so far.
But before initiating such exercise one thing was mandatory. Governments around
the world had to be made to believe that their economies were prospering, if not in reality, at
least on paper. Such utopia/myth could only be created if value of precious metals, especially
Gold, would appreciate. Let me furnish here the monthly chart of Gold to firm up the
hypothesis.
CHART-18 GOLD CASH MONTHLY FROM 1998 TILL MARCH 09/2007
69
Gold had fallen to a record low of $251.70 in August 1999. Therefore if gold prices could
be made to increase the sentiments would automatically respond. With some marginal fund
support in capital markets of developed world as well, the world economy could be geared to
move in to the falsehood of sudden prosperity. The new agenda to evolve now was:
a) Invest in gold,
b) Invest in capital markets of third world and
c) On a lesser scale invest in markets of developed world
d) Adopt any other practice that could provide initiative momentum that the markets
required to break the shackles of recent crash and start galloping upwards.
With agenda being ready, BOJ reduced their rates in February 2001 from 0.50% to
0.35%. 0.15% interest waiver was nothing but symbiotic. It conveyed the message to
Japanese investors to get ready to move forward again. Interest came down by another 0.10%
the following month. JPY fell against dollar but gold price moved forward again. On 1st
September2001, BOJ went for the kill and reduced their rates to nullity (0.10%). September
11,2001 World Trade Center broke down like a pack of cards but mass sentiment retaliated,
markets all around absorbed the shock and as if to defy the horror, leaped forward.
Japan had won the game. US$1 fetched JPY 135.32 during January 2002. Even though
JPY had fallen in value, BOJ could relax as returns would soon start pouring in and would
elevate JPY value. They knew their net worth was bound to rise to new levels with
appreciation of the value of their investment and profits out of fund rotation outgrowing even
the sum invested.
By January 2005 JPY exchange value touched a new high (US$1= JPY 110.65) and why
should it not with Gold price shooting up to $456.75 (Dec 2004), DJIA jumping up to 10867
from the low of 7197? The third world markets were rising at unprecedented pace. Peru Lima
General rose from 1110 to 3935 and Jakarta composite from 323 to 1049 to name a few. BOJ
now had nothing to do but to sit and watch. The investors, including the ones originating
from Japan, gradually turned their attention to the largest democracy in the world i.e. India
since this country retained the potential to generate returns what 10 other third world
countries, taken together, could not.
Some short-term profit booking was made in Gold between February and April 2003 in
which gold price came down from $388 to 318 and markets of overseas countries between
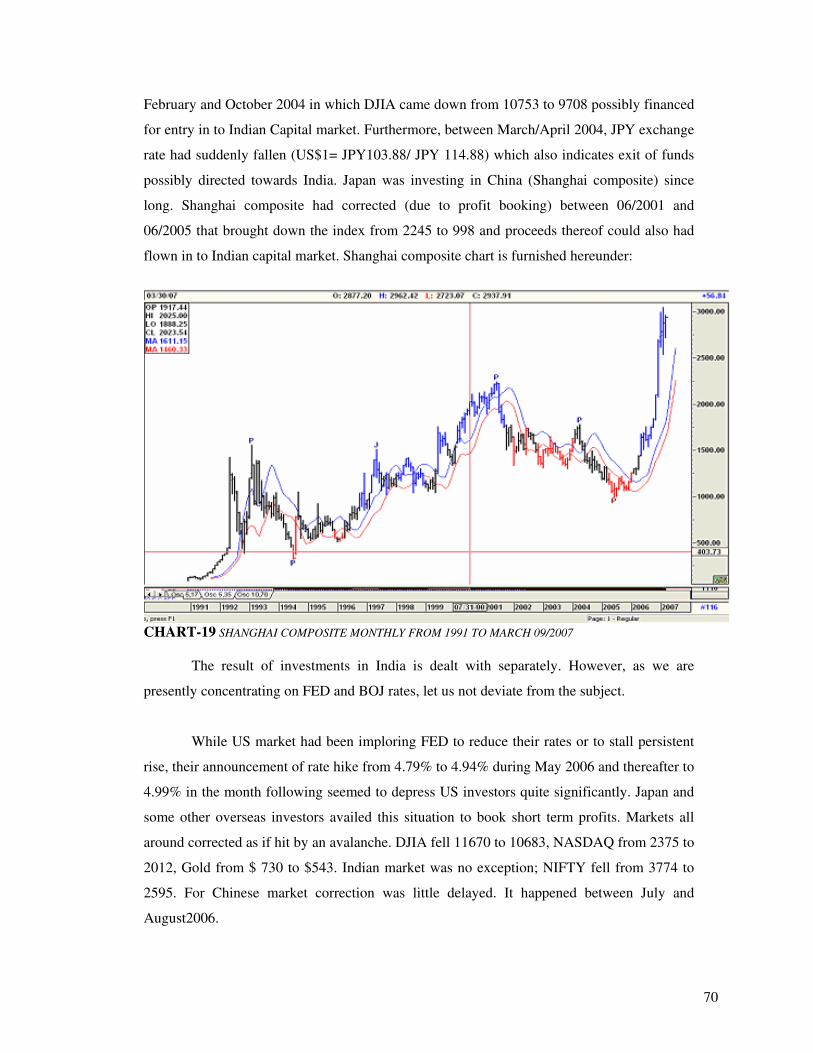
70
February and October 2004 in which DJIA came down from 10753 to 9708 possibly financed
for entry in to Indian Capital market. Furthermore, between March/April 2004, JPY exchange
rate had suddenly fallen (US$1= JPY103.88/ JPY 114.88) which also indicates exit of funds
possibly directed towards India. Japan was investing in China (Shanghai composite) since
long. Shanghai composite had corrected (due to profit booking) between 06/2001 and
06/2005 that brought down the index from 2245 to 998 and proceeds thereof could also had
flown in to Indian capital market. Shanghai composite chart is furnished hereunder:
CHART-19 SHANGHAI COMPOSITE MONTHLY FROM 1991 TO MARCH 09/2007
The result of investments in India is dealt with separately. However, as we are
presently concentrating on FED and BOJ rates, let us not deviate from the subject.
While US market had been imploring FED to reduce their rates or to stall persistent
rise, their announcement of rate hike from 4.79% to 4.94% during May 2006 and thereafter to
4.99% in the month following seemed to depress US investors quite significantly. Japan and
some other overseas investors availed this situation to book short term profits. Markets all
around corrected as if hit by an avalanche. DJIA fell 11670 to 10683, NASDAQ from 2375 to
2012, Gold from $ 730 to $543. Indian market was no exception; NIFTY fell from 3774 to
2595. For Chinese market correction was little delayed. It happened between July and
August2006.
71
BOJ during July 2006 sent out signal for gradual withdrawal by increasing their
rates from 0.10% to 0.40%. Super cycle had ended. Time had come for investors to return
home. However some thing had to be done to appreciate the value of gold to give the final
boost to JPY.
The mechanism was rather simple. It comprised of the following:
a) Retain major portion of profits booked.
b) Divert profit realized from Gold in to capital markets of mostly third world market
where mania like situation already existed.
c) Time to time profit booking in capital markets and divert proceeds to gold so that its
value could appreciate.
d) Sell gold when its price reaches crescendo and make it fall to the extent beyond
imagination.
e) Arrive at a situation where Japanese economy would prosper while rest of the world
plunge in depths of deflation.
Agenda for (d) and (e) above are drawn but remains to be executed after accomplishment
of (a, b &c).
Since I am talking of Japanese economy flourishing, where do I see JPY to be in near
future? Let me perform a Wave analysis on the same for which I would like to draw attention
of the reader to Chart numbers 14 and 15 furnished above. Data prior to 1982 is not available
with me. However, it is evident from circumstances that JPY value had hit a record low
around that time or may be little earlier. Furthermore, I need to tender apology for the
inconvenience of the reader since the charts I am referring to are essentially US$ charts
valued against JPY. Therefore, when I say JPY exchange rate hit a record low, the chart
would show just the reverse i.e. record high. Cannot really help the situation. I have got to
make use of what I have on hand and build up my analysis based on charts the software
72
offers. In other words, instead of JPY, I shall be performing wave analysis of US$ against
JPY since conclusion to develop therefrom would take us to the goal intended.
Let us come back to November 1982 when US$ fetched JPY 277.65. Quite obviously
US$ started loosing ground against JPY since that point and altogether a new downward new
cycle commenced therefrom. Going by Elliot Wave Theory, downward wave cycle comprises
of three (3) main waves termed ABC. Wave A comprises of downward movement, Wave B
upwards to be followed by Wave C that reaches the bottommost point completing the cycle.
Both wave A and C comprises of five (5) sub waves and Wave B enfolds one or many
smaller ABC corrections.
Thus in Wave A downwards we find sub wave 1 completing around April 1984 with
US$1= JPY 222.70. Sub wave 2, that brings about recovery but on principle, never reaching
the level of beginning of sub wave 1, started from April 1984 and continued till February
1985 with exchange rate for $ increasing to JPY 262.80 that was JPY 14.85 less than where
the cycle commenced. The third (3rd) Wave started here and went on till January 1988 with
US$ sliding to JPY120.18. 3rd Waves are always most dynamic and achieves maximum
momentum. In the present context, it brought about reduction of exchange value by JPY
142.62 that was 54% value what existed at the peak of sub wave 2.
Sub wave 4 which, like sub wave 2, brings about recovery lasted till April 1990 and
pulled up value of US$ to JPY 160.35. Wave A reached finality, as we see on the chart,
around April 1995 complete with sub wave 5. On completion of Wave A US$ fetched only
JPY 79.70 that was only 28.7% of what it used to value around November 1982. I really
wonder as to why the world did not wake up and consider twice as to what was going on
since it was surely not a matter of insignificance when a country’s currency gain in terms
of value by nearly 72% in just 12 years and 5 months. In simple terms, JPY was gaining on
exchange value by 5.74% per year and the rest of the world sat complacent thinking that
the country was reeling in the depths of depression!
The software I have indicates completion of Wave B towards end of January 2002 with
US$1=JPY135.15. Frankly speaking, I, personally, am not sure about this. In my opinion, it
is still premature to assume completion of Wave B and commencement of Wave C. If we
draw a Fibonacci Retracement Fan between the high and low of Wave A, it is seen that Wave
B, till now could maximum recover between 0.236 and 0.382 levels. It is possible that the
73
software is performing correct wave analysis but it will only get confirmed if the high of
February 2002 (i.e. US$1=JPY 135.04) do not get broken. As Wave C will also comprise of
five sub waves, it will be imperative that the beginning point of sub wave 1 would not get
breached. With US$ presently gaining against JPY marginally and more so, as I contemplate
some investments would now be directed towards gold, US$ may gain against JPY for a
while. If that would happen, JPY will cross 135.15 and exchange rates might appreciate
somewhat further.
However, the whole thing depends on the quantum of profit booking and proceeds of
gradual withdrawal from markets, which, God alone knows the likely volume. It surely will
run in Trillions of US dollars. Thus, there are 50:50 possibilities of Wave C beginning and
Wave B continuing. Whatever the present situation may be or in whatsoever manner the
future might unfold in front of us, in Wave C, US$ value could decline to any value between
JPY 70 or much bellow JPY35 even.
While on the subject, let me quote here a report published in Bloomberg.com. Quote:
Yen Rises as Flight From Risk Prompts Reversal of Carry Trades
By Agnes Lovasz and Chris Young
March 13 (Bloomberg) -- The yen strengthened the most in more than a week against
the dollar and the euro on speculation investors are reducing holdings of assets
funded by borrowing Japan's currency, known as the carry trade.
The yen rose more than any other currency against the dollar as increasing prospects
of bankruptcies in the U.S. mortgage industry prompted investors to dump riskier
assets. Investors sought safer assets on concern rising home-loan delinquencies
among the riskiest borrowers may hamper economic growth in the world's largest
economy.
``Worries about U.S. subprime mortgage lenders are weighing on market sentiment
and have triggered some unwinding of carry trades,'' said Elisabeth Andreew, chief
currency strategy analyst at Nordea Bank AB, the largest Nordic bank, in
Copenhagen. ``Risk aversion tends to rise when there's a slowdown in the U.S.''
74
The yen climbed to 116.88 per dollar at 11:27 a.m. in London from 117.72 in New
York yesterday. It strengthened to 154.08 per euro from 155.26. Andreew said the
yen will trade in a range of 115 to 121 per dollar in coming months.
The euro pared losses after a survey showed confidence among investors in Germany
rose more than expected this month, a sign of sustained growth in Europe's largest
economy.
Europe's common currency pared its decline against the dollar and the yen after the
ZEW Center for European Economic Research index of investor and analyst
expectations rose to 5.8 from 2.9 in February, the highest since July and compared
with a 3.2 percent increase forecast by economists.
The euro recently traded at $1.3185 in London, from $1.3189 yesterday and as low as
$1.3156 earlier.
High-Yielding Currencies
New Century Financial Corp., the second-biggest U.S. lender to borrowers with poor
credit histories, yesterday said it doesn't have the cash to pay creditors who are
demanding money.
The yen also gained the most in a week against the euro as a decline in Asian stock
markets signaled traders were avoiding riskier assets in favor of safer investments.
The Morgan Stanley Capital International Asia Pacific Index lost 0.5 percent and
Japan's Nikkei 225 Stock Average dropped 0.7 percent.
The yen gained most against currencies such as the South African rand that had
benefited from carry trades because of their higher interest rates. The higher-yielding
Australian and New Zealand dollars fell versus the Japanese currency for the first
time in four days.
75
``Lingering concern over the U.S. economy and stock market declines is causing the
unwinding of yen carry trades,'' said Masateru Otake, a currency manager at Chuo
Mitsui Trust and Banking Co. Ltd. The yen may rise to 117 this week, he said.
U.S. Retail Sales
The dollar may gain from speculation a U.S. Commerce Department report will show
February retail sales increased 0.3 percent, according to the median estimate in a
Bloomberg survey, reducing speculation the Federal Reserve will cut interest rates.
Consumer spending, which accounts for about two-thirds of the U.S. economy, may
help the dollar rebound from concern home loan defaults will stall growth. Fed
Governor Randall Kroszner yesterday said policy makers must not be complacent in
their fight against inflation.
``Stronger-than-expected retail sales will reinforce fears the Fed will either stay on
hold or hike,'' said Sue Trinh, a currency strategist at RBC Capital Markets in Sydney.
``It will go some way to mitigate the U.S. dollar's losses on the back of its subprime
mortgage woes.''
The dollar may reach 118.50 yen after the report, she said.
Mortgage Defaults
76
Mortgage defaults over the next two years may climb to $225 billion from $40
billion, although in the context of an $8.5 trillion home-loan market, this probably
won't drag on the U.S. economy, according to debt strategists at Lehman Brothers
Holdings Inc. yesterday.
``Concerns about systemic risk from the subprime defaults is slightly exaggerated,
given that 80 percent of U.S. homeowners are predominantly insulated from changes
from variable interest rates,'' said Monica Fan, global head of foreign exchange
strategy at RBC Capital Markets Ltd. in London. ``We will see renewed appetite for
high-yielding currencies funded by currencies like the yen and the Swiss franc.''
The yen will trade in a range of 117 to 120 against the dollar in the coming weeks,
she forecasts.
The Fed has held the overnight lending rate between banks at 5.25 percent for the past
nine months, compared with the Bank of Japan's 0.5 percent. Benchmark 10-year
U.S. Treasuries yield 2.94 percentage points more than like-dated Japanese debt, up
from 2.84 percentage points on March 2.
The euro may gain on speculation European Central Bank members will signal higher
rates, increasing the appeal of assets denominated in the currency.
President Jean-Claude Trichet March 8 said policy remains ``accommodative'' after
raising borrowing costs for the seventh time since December 2005 to 3.75 percent.
The euro has risen 13 percent against the dollar since the ECB started lifting rates.
Trichet speaks in London -tomorrow.
``The logic from the ZEW and from what Mr. Trichet has been saying suggests that
the euro should go higher,'' said Simon Derrick, chief currency strategist in London at
Bank of New York. – Unquote.
77
The main reason for furnishing the above report is to usher confidence of the reader
that I have not gone grossly biased. The outcome that I have analyzed has started happening.
If US$ will eventually fetch only JPY 35 where will Japanese economy be? Does its
present market indicate such eventuality?
After May/June 2006, since middle of February 2007, markets around the world are
showing signs of weakness. The blame, initially fell on Japan with BOJ raising their interest
rates from 0.40% to 0.75%. Opinion regarding how future will be seems to be divided. A few
apprehends global recession would come which fundamentalists jeer calling such idea
nothing but ill-conceived fiction. Day charts for most of stock exchanges, like May/June
2006, resemble each other with red lines plunging down but not yet assuming vicious
proportions observed last year.
Like rest of the world both NIKKEI 225 and HANGSENG had fallen by near 2000
points between 23/02/2007 and 05/03 and have, thereafter, shown signs of recovery (like
other exchanges of the world) but as of now (12/03), it is difficult to vouch for total turn
around since recovery level is yet to reach 50% mark of the slide downwards.
Let us hypothetically consider that market indexes, around the world, will turn
around and prosper like never before (as suggested by various experts). If such will happen it
will be next to impossible for JPY value appreciating to the level of US$ 1 = JPY 50/35. How
can that happen? If DJIA goes to 14000/15000 levels, can US$ value go for a tailspin? If
DJIA eventually reach 14000/15000 level or higher, it will be most unlikely for JPY value to
appreciate in such magnitude. It is quite possible. I may be wrong (since to err is human). Mr.
R. N. Elliot had forecast that Super cycle will last till 2012 and now it is only early stages of
2007.
Okay, moving with the idea that I am wrong. Will that dwarf the efforts of this
lengthy exercise down to a state of nullity? No, for sure. In such event, it will be Wave B of
US$/JPY chart that will get extended. In complex correction we often see highs of motive
wave being overtaken. Let US$ gain in value and fetch JPY 278+ in near future. Nothing will
change thereby. In such case it will be an extended flat correction where Wave C will be

78
more virulent. The Tsunami has to happen, if not tomorrow then day after. Wave cycles
follow laws of nature and are culminations of human interaction/sentiment. They do not
change course at whims of external factors. If you block them, they retard only to come back
with more virulence where all efforts to thwart fail and no choice gets left but to watch in
horror the extent of devastation.
In other words, there has to develop disparity of trend between markets either now or
later. I, therefore, changed my attention and instead of day charts, started looking at monthly
charts. It struck me hard to behold that disparity existed. I was not wrong and I am not
wrong! Time frame changed, charts no more looked similar. They differed from one another.
No wonder world indexes after 05th of March 2007 are running directionless!
79
5. DISPARITY OF TREND AMONGST MARKETS
Though day charts of various market indexes around the world resemble each other,
time frame changed to monthly, changes the complexion rather radically. While some charts
indicate influence of mania, some show recovery subsequent to the holocaust being left
behind by mania. While some charts indicate bright prospects ahead, for some the depths of
depression could be just round the bend. In other words, in global perspective, it is a fact, that
a generalist view cannot be adopted. Some sort of grouping can be done after charts randomly
selected are analyzed in terms of Elliot’s Wave Theory.
Before we get in to the analytical exercise, it will be better to describe what the term
mania is supposed to signify. What is mania? Normally when a motive wave in a Wave cycle
gets extended in a manner which leads to index or value of the script/index multiply over 4
(four) times, occurrence of mania is interpreted. There is as such no thumb rule but when
growth in index takes proportion akin to that of absurdity, the diagnosis often point to mania.
To quote Robert R Prechter Jr in View From the Top of the Grand Super cycle: “Historians
characterize a mania as a kind of madness that takes hold of a population. The widely shared
illusion of endless huge profits that propels a mania also produces another kind of madness:
anger. Though the media report new highs in averages with giddy demeanor; it is a clown
mask that hides a miserable soul”.
What happens hereafter? Science of technical analysis has not advanced to the extent
to pinpoint, in advance, likely turning point of mania. We have already seen to what gigantic
proportion the mania has grown and there is no certainty that it will not grow further. Mania
is a bubble that keeps on bloating up till it bursts leaving devastation behind. It is often
referred to as a state of anger or frustration that mounts to a crescendo based on void and then
collapse with virulence multiplied many folds.
World history has witnessed many a mania with each one of them had ending some
time or other. The exodus has never been gradual. It always ends with mass exit that
generates a huge holocaust with destructive power beyond imagination. In order to
economize on the size of this article, I am not venturing in to explaining how mania develops
and as to how it crashes. However, since visual presentation is always more comprehensive
than explanation though words, I am furnishing hereunder three charts exhibiting how mania
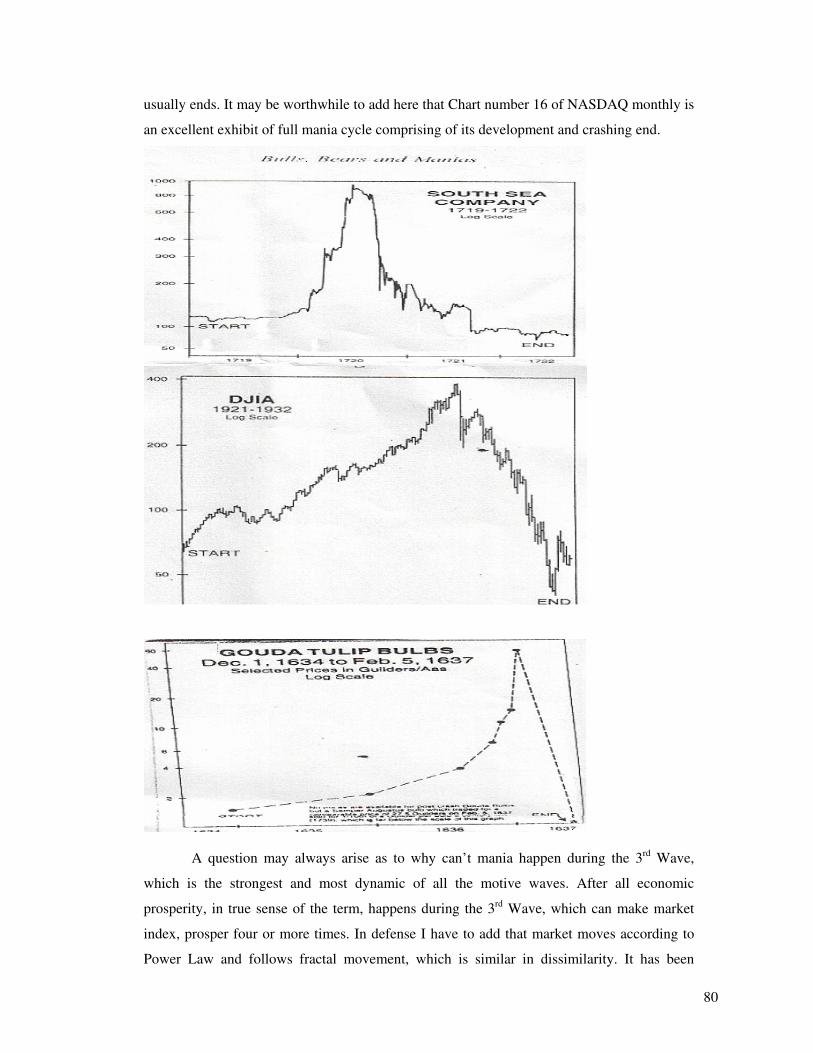
80
usually ends. It may be worthwhile to add here that Chart number 16 of NASDAQ monthly is
an excellent exhibit of full mania cycle comprising of its development and crashing end.
A question may always arise as to why can’t mania happen during the 3rd Wave,
which is the strongest and most dynamic of all the motive waves. After all economic
prosperity, in true sense of the term, happens during the 3rd Wave, which can make market
index, prosper four or more times. In defense I have to add that market moves according to
Power Law and follows fractal movement, which is similar in dissimilarity. It has been
81
observed that how much so ever a country’s economy may perform better; it is most unlikely
for market or market index to appreciate four times or more out of natural progression. In
other words, human sentiment becoming four times more appreciative within a given period
of time on one particular object is rather a misnomer since many other alternatives would
crop up in between also to avail the benefits of such appreciation. Furthermore, as economic
appreciation/utility decline by Law of Diminishing Returns, it is highly unlikely for a sudden
end of preference to happen which almost a certainty is concerning as to how mania ends. For
this reason mainly, no mania in history had ever traced out an extended third wave and then
undergone a long period of distribution. Every one ended suddenly, often shortly after the
point of maximum acceleration, as we see in NASDAQ monthly (Chart-16). However,
nothing is impossible, but when history gives us consistent results under certain conditions, it
is only prudent to apply the lessons accordingly. Therefore, while analyzing charts of various
markets, I shall presume existence of mania and extended fifth wave wherever, index will be
multiplying itself in excess of four times.
Let me now start analyzing monthly charts of various market indexes selected
randomly. No market study would truly firm up unless DJIA and NASDAQ are studied and
therefore, I start my work with DJIA which is furnished in chart no 13.
North America
Going by the monthly chart of DJIA, it appears that the current upward cycle
commenced some time around 1990 possibly with DJIA at 2344. The First Wave ended
around January 1994 with DJIA at 4002.84 (say 4003). The Second Wave was brief and
lasted up to end of April 1994 in which the index corrected to 3520 levels.
With regard to 3rd and 5th Wave, I have serious disagreement with my software. The
mathematical software I have shows extended 3rd wave formation lasting up to January 2000
in which DJIA appreciated to 11750 levels wherefrom the 4th Wave started forcing DJIA to
correct to 7197 by October 2002. The appreciation we see from November 2002 up till
February 2007 is supposed to be 5th Wave. Mathematically the calculation fits Fibonacci
Norms for two main reasons. Firstly, 4th Wave did not breach 0.618 levels and secondly, the
peak of 1st Wave was never under any threat of being breached.
My objection to above wave formation is in terms of the 3rd Wave itself. In the
backdrop of the fact that current cycle of waves had commenced from 2344, we have to
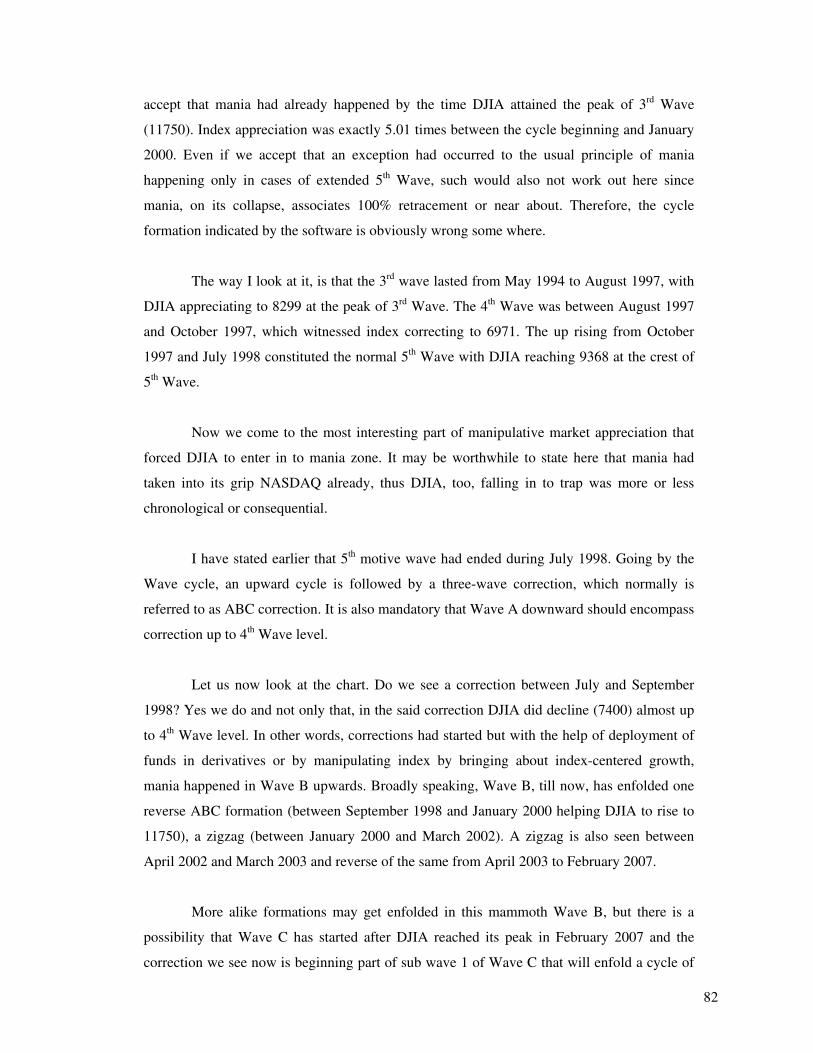
82
accept that mania had already happened by the time DJIA attained the peak of 3rd Wave
(11750). Index appreciation was exactly 5.01 times between the cycle beginning and January
2000. Even if we accept that an exception had occurred to the usual principle of mania
happening only in cases of extended 5th Wave, such would also not work out here since
mania, on its collapse, associates 100% retracement or near about. Therefore, the cycle
formation indicated by the software is obviously wrong some where.
The way I look at it, is that the 3rd wave lasted from May 1994 to August 1997, with
DJIA appreciating to 8299 at the peak of 3rd Wave. The 4th Wave was between August 1997
and October 1997, which witnessed index correcting to 6971. The up rising from October
1997 and July 1998 constituted the normal 5th Wave with DJIA reaching 9368 at the crest of
5th Wave.
Now we come to the most interesting part of manipulative market appreciation that
forced DJIA to enter in to mania zone. It may be worthwhile to state here that mania had
taken into its grip NASDAQ already, thus DJIA, too, falling in to trap was more or less
chronological or consequential.
I have stated earlier that 5th motive wave had ended during July 1998. Going by the
Wave cycle, an upward cycle is followed by a three-wave correction, which normally is
referred to as ABC correction. It is also mandatory that Wave A downward should encompass
correction up to 4th Wave level.
Let us now look at the chart. Do we see a correction between July and September
1998? Yes we do and not only that, in the said correction DJIA did decline (7400) almost up
to 4th Wave level. In other words, corrections had started but with the help of deployment of
funds in derivatives or by manipulating index by bringing about index-centered growth,
mania happened in Wave B upwards. Broadly speaking, Wave B, till now, has enfolded one
reverse ABC formation (between September 1998 and January 2000 helping DJIA to rise to
11750), a zigzag (between January 2000 and March 2002). A zigzag is also seen between
April 2002 and March 2003 and reverse of the same from April 2003 to February 2007.
More alike formations may get enfolded in this mammoth Wave B, but there is a
possibility that Wave C has started after DJIA reached its peak in February 2007 and the
correction we see now is beginning part of sub wave 1 of Wave C that will enfold a cycle of
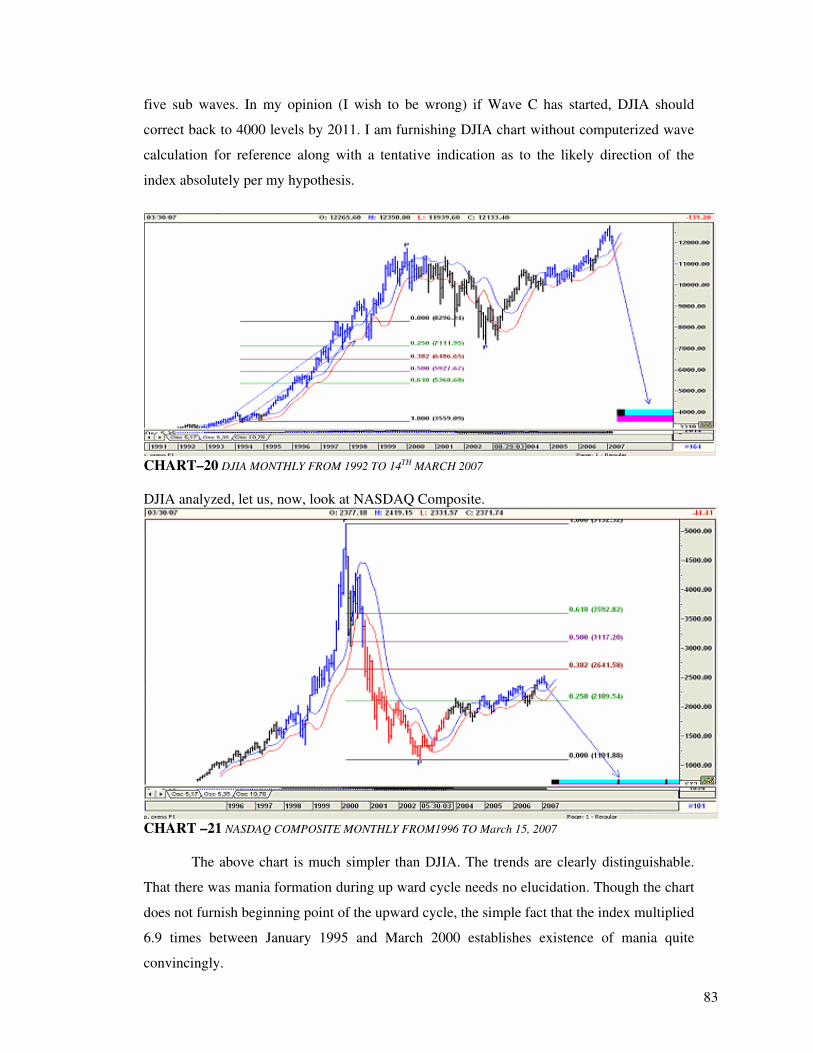
83
five sub waves. In my opinion (I wish to be wrong) if Wave C has started, DJIA should
correct back to 4000 levels by 2011. I am furnishing DJIA chart without computerized wave
calculation for reference along with a tentative indication as to the likely direction of the
index absolutely per my hypothesis.
CHART–20 DJIA MONTHLY FROM 1992 TO 14TH MARCH 2007
DJIA analyzed, let us, now, look at NASDAQ Composite.
CHART –21 NASDAQ COMPOSITE MONTHLY FROM1996 TO March 15, 2007
The above chart is much simpler than DJIA. The trends are clearly distinguishable.
That there was mania formation during up ward cycle needs no elucidation. Though the chart
does not furnish beginning point of the upward cycle, the simple fact that the index multiplied
6.9 times between January 1995 and March 2000 establishes existence of mania quite
convincingly.
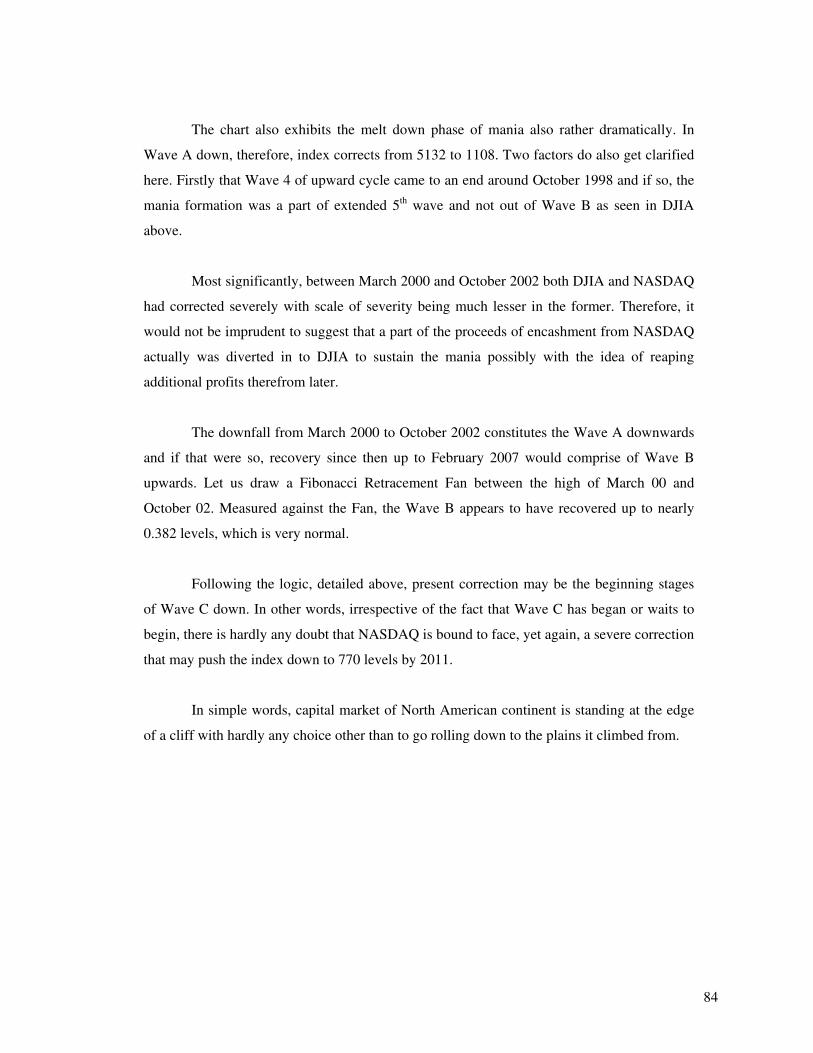
84
The chart also exhibits the melt down phase of mania also rather dramatically. In
Wave A down, therefore, index corrects from 5132 to 1108. Two factors do also get clarified
here. Firstly that Wave 4 of upward cycle came to an end around October 1998 and if so, the
mania formation was a part of extended 5th wave and not out of Wave B as seen in DJIA
above.
Most significantly, between March 2000 and October 2002 both DJIA and NASDAQ
had corrected severely with scale of severity being much lesser in the former. Therefore, it
would not be imprudent to suggest that a part of the proceeds of encashment from NASDAQ
actually was diverted in to DJIA to sustain the mania possibly with the idea of reaping
additional profits therefrom later.
The downfall from March 2000 to October 2002 constitutes the Wave A downwards
and if that were so, recovery since then up to February 2007 would comprise of Wave B
upwards. Let us draw a Fibonacci Retracement Fan between the high of March 00 and
October 02. Measured against the Fan, the Wave B appears to have recovered up to nearly
0.382 levels, which is very normal.
Following the logic, detailed above, present correction may be the beginning stages
of Wave C down. In other words, irrespective of the fact that Wave C has began or waits to
begin, there is hardly any doubt that NASDAQ is bound to face, yet again, a severe correction
that may push the index down to 770 levels by 2011.
In simple words, capital market of North American continent is standing at the edge
of a cliff with hardly any choice other than to go rolling down to the plains it climbed from.
85
South America
CHART - 22 ARGENTINA MERVAL MONTHLY FROM 1992 TO March 15, 2007
From North America let us come down to South America, which mostly consists of
countries commonly referred to as 3rd World. I have furnished, towards the beginning of this
article, chart of Brazil Bovespa. In order to select something different, I chose Argentina
Merval.
What does Argentina Merval show? Leaving aside Wave Theory, it indicates that the
index has gone up from 193.40 of November 2001 to 2226 by February 2007. To express in
mathematical terms, the market index has multiplied 11.51 times. Whoops!
This makes my life easier as prevalence of mania is beyond doubt and as the chart
looks, the same has curved out of nothing but extended 5th Wave. In order to estimate the
likely trajectory of decline that waits, I availed two alternatives. Firstly, I drew a Fibonacci
Retracement Fan between the low of 11/2001 and the high of February 2007. Secondly, I
joined the highs of August 1997 & February 2007 and thereafter drew a line from the low of
November 2001 parallel to the former. Mr. R. N. Elliot himself used this art of drawing trend
channels extensively and recommended the same to be very useful for estimation purposes.
Now it needs no emphasis to suggest that mania, once over, will bring about
avalanche and correction to the extent of 100% or near about will be there. However, since
downward slide will comprise of three waves, we can apprehend that the sub wave 1 of Wave
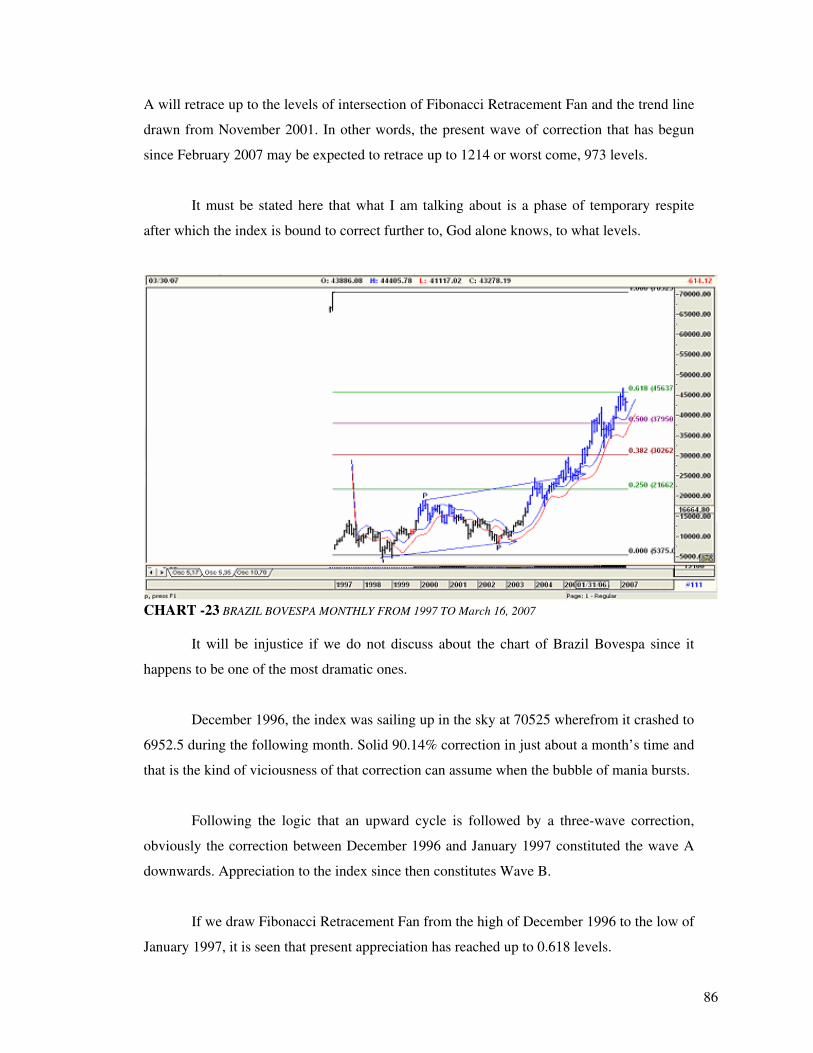
86
A will retrace up to the levels of intersection of Fibonacci Retracement Fan and the trend line
drawn from November 2001. In other words, the present wave of correction that has begun
since February 2007 may be expected to retrace up to 1214 or worst come, 973 levels.
It must be stated here that what I am talking about is a phase of temporary respite
after which the index is bound to correct further to, God alone knows, to what levels.
CHART -23 BRAZIL BOVESPA MONTHLY FROM 1997 TO March 16, 2007
It will be injustice if we do not discuss about the chart of Brazil Bovespa since it
happens to be one of the most dramatic ones.
December 1996, the index was sailing up in the sky at 70525 wherefrom it crashed to
6952.5 during the following month. Solid 90.14% correction in just about a month’s time and
that is the kind of viciousness of that correction can assume when the bubble of mania bursts.
Following the logic that an upward cycle is followed by a three-wave correction,
obviously the correction between December 1996 and January 1997 constituted the wave A
downwards. Appreciation to the index since then constitutes Wave B.
If we draw Fibonacci Retracement Fan from the high of December 1996 to the low of
January 1997, it is seen that present appreciation has reached up to 0.618 levels.
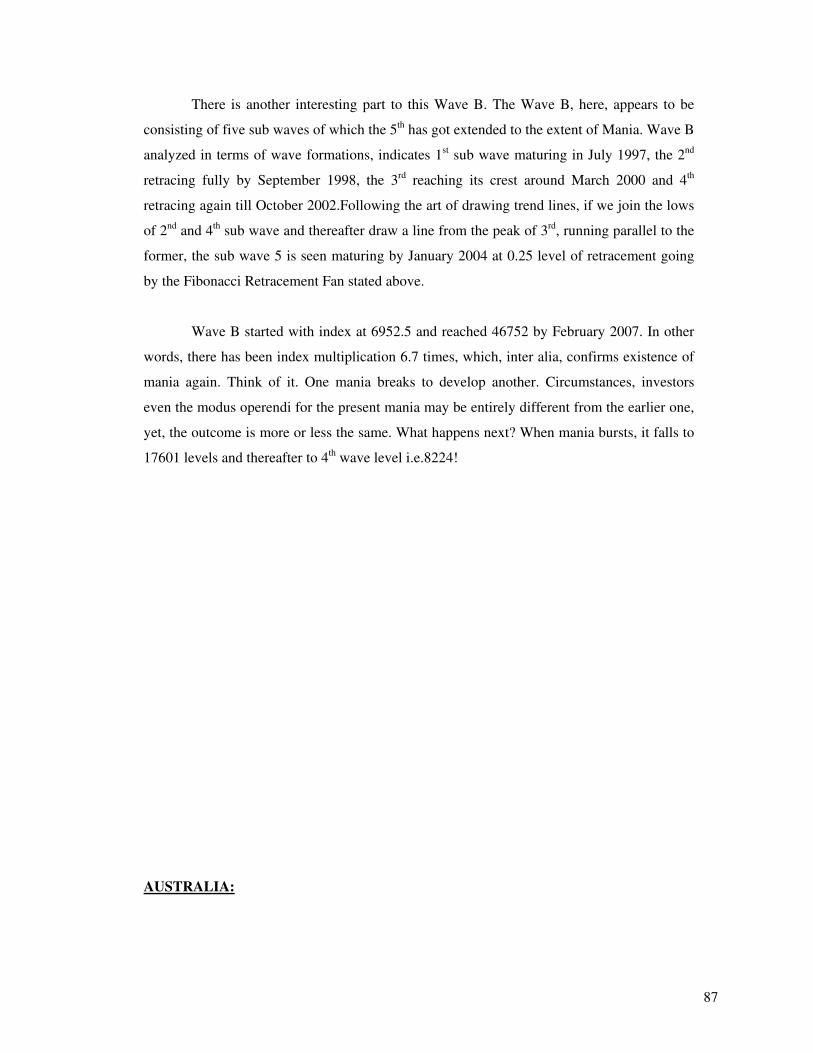
87
There is another interesting part to this Wave B. The Wave B, here, appears to be
consisting of five sub waves of which the 5th has got extended to the extent of Mania. Wave B
analyzed in terms of wave formations, indicates 1st sub wave maturing in July 1997, the 2nd
retracing fully by September 1998, the 3rd reaching its crest around March 2000 and 4th
retracing again till October 2002.Following the art of drawing trend lines, if we join the lows
of 2nd and 4th sub wave and thereafter draw a line from the peak of 3rd, running parallel to the
former, the sub wave 5 is seen maturing by January 2004 at 0.25 level of retracement going
by the Fibonacci Retracement Fan stated above.
Wave B started with index at 6952.5 and reached 46752 by February 2007. In other
words, there has been index multiplication 6.7 times, which, inter alia, confirms existence of
mania again. Think of it. One mania breaks to develop another. Circumstances, investors
even the modus operendi for the present mania may be entirely different from the earlier one,
yet, the outcome is more or less the same. What happens next? When mania bursts, it falls to
17601 levels and thereafter to 4th wave level i.e.8224!
AUSTRALIA:
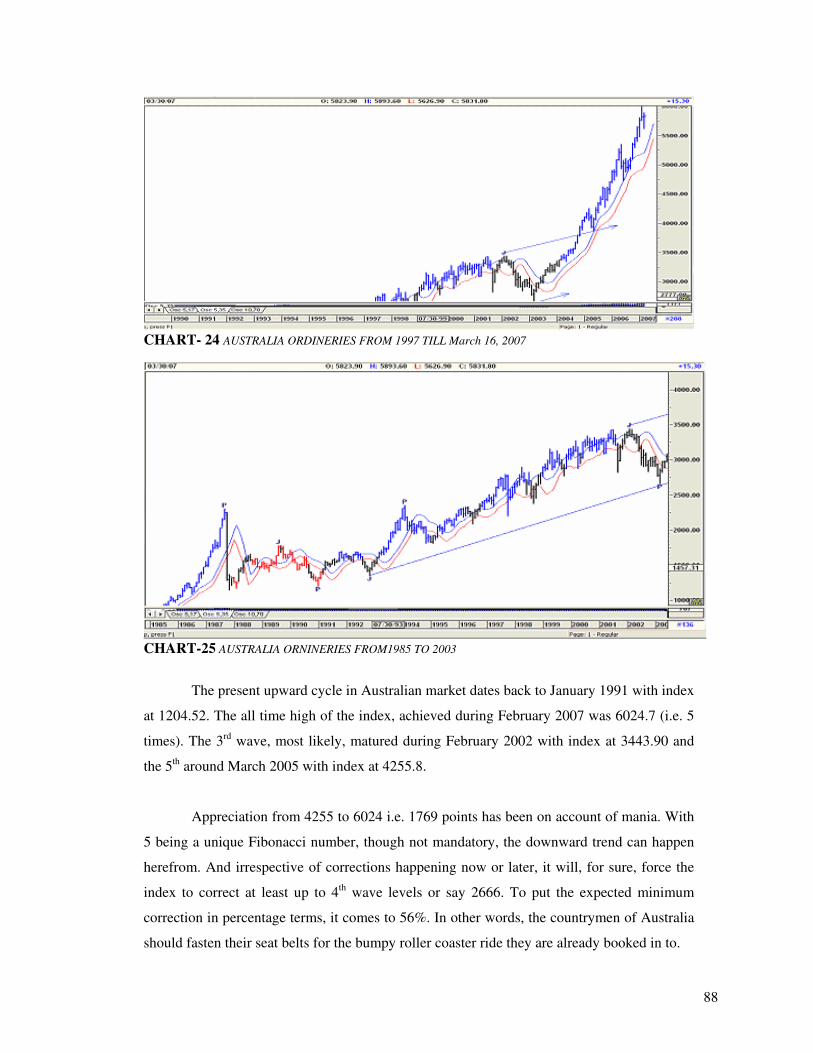
88
CHART- 24 AUSTRALIA ORDINERIES FROM 1997 TILL March 16, 2007
CHART-25 AUSTRALIA ORNINERIES FROM1985 TO 2003
The present upward cycle in Australian market dates back to January 1991 with index
at 1204.52. The all time high of the index, achieved during February 2007 was 6024.7 (i.e. 5
times). The 3rd wave, most likely, matured during February 2002 with index at 3443.90 and
the 5th around March 2005 with index at 4255.8.
Appreciation from 4255 to 6024 i.e. 1769 points has been on account of mania. With
5 being a unique Fibonacci number, though not mandatory, the downward trend can happen
herefrom. And irrespective of corrections happening now or later, it will, for sure, force the
index to correct at least up to 4th wave levels or say 2666. To put the expected minimum
correction in percentage terms, it comes to 56%. In other words, the countrymen of Australia
should fasten their seat belts for the bumpy roller coaster ride they are already booked in to.
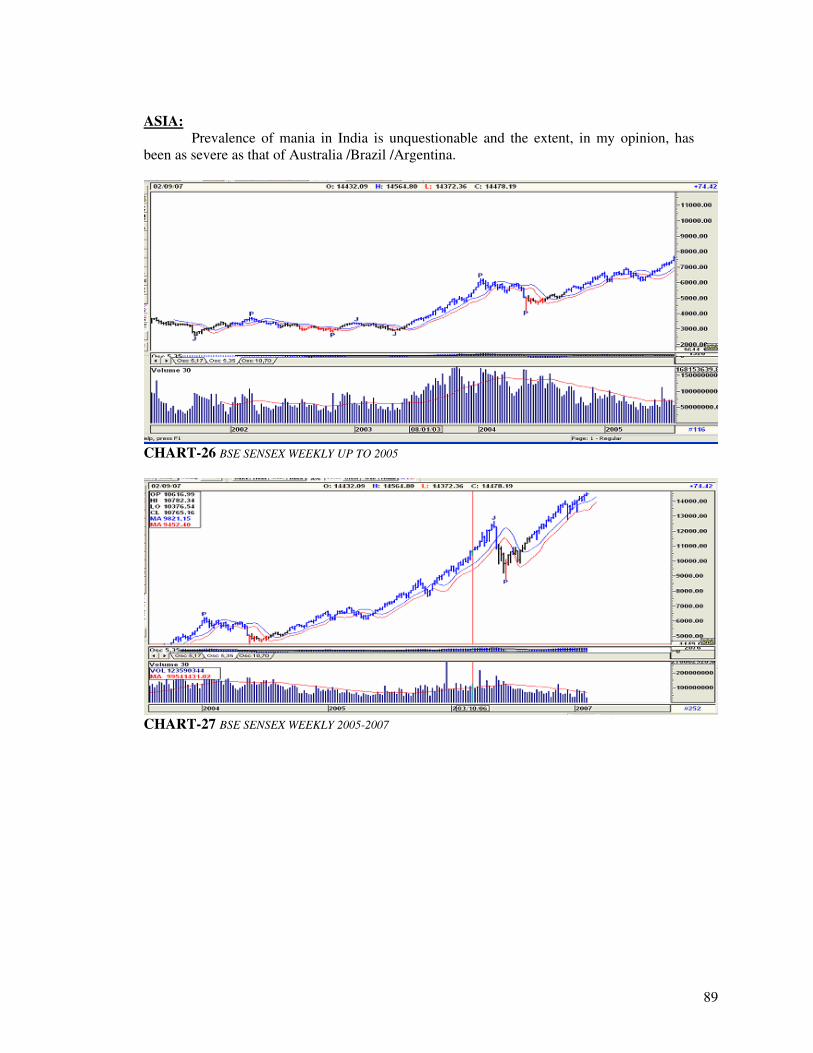
89
ASIA:
Prevalence of mania in India is unquestionable and the extent, in my opinion, has been as severe as that of Australia /Brazil /Argentina.
CHART-26 BSE SENSEX WEEKLY UP TO 2005
CHART-27 BSE SENSEX WEEKLY 2005-2007
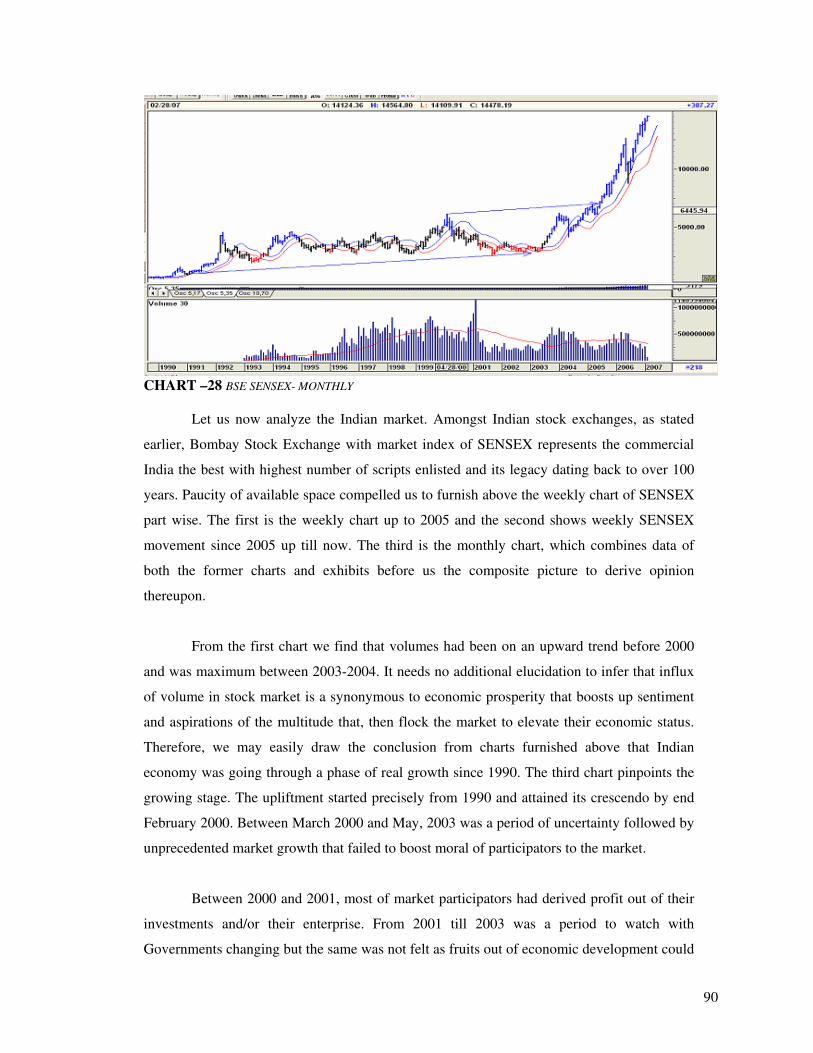
90
CHART –28 BSE SENSEX- MONTHLY
Let us now analyze the Indian market. Amongst Indian stock exchanges, as stated
earlier, Bombay Stock Exchange with market index of SENSEX represents the commercial
India the best with highest number of scripts enlisted and its legacy dating back to over 100
years. Paucity of available space compelled us to furnish above the weekly chart of SENSEX
part wise. The first is the weekly chart up to 2005 and the second shows weekly SENSEX
movement since 2005 up till now. The third is the monthly chart, which combines data of
both the former charts and exhibits before us the composite picture to derive opinion
thereupon.
From the first chart we find that volumes had been on an upward trend before 2000
and was maximum between 2003-2004. It needs no additional elucidation to infer that influx
of volume in stock market is a synonymous to economic prosperity that boosts up sentiment
and aspirations of the multitude that, then flock the market to elevate their economic status.
Therefore, we may easily draw the conclusion from charts furnished above that Indian
economy was going through a phase of real growth since 1990. The third chart pinpoints the
growing stage. The upliftment started precisely from 1990 and attained its crescendo by end
February 2000. Between March 2000 and May, 2003 was a period of uncertainty followed by
unprecedented market growth that failed to boost moral of participators to the market.
Between 2000 and 2001, most of market participators had derived profit out of their
investments and/or their enterprise. From 2001 till 2003 was a period to watch with
Governments changing but the same was not felt as fruits out of economic development could
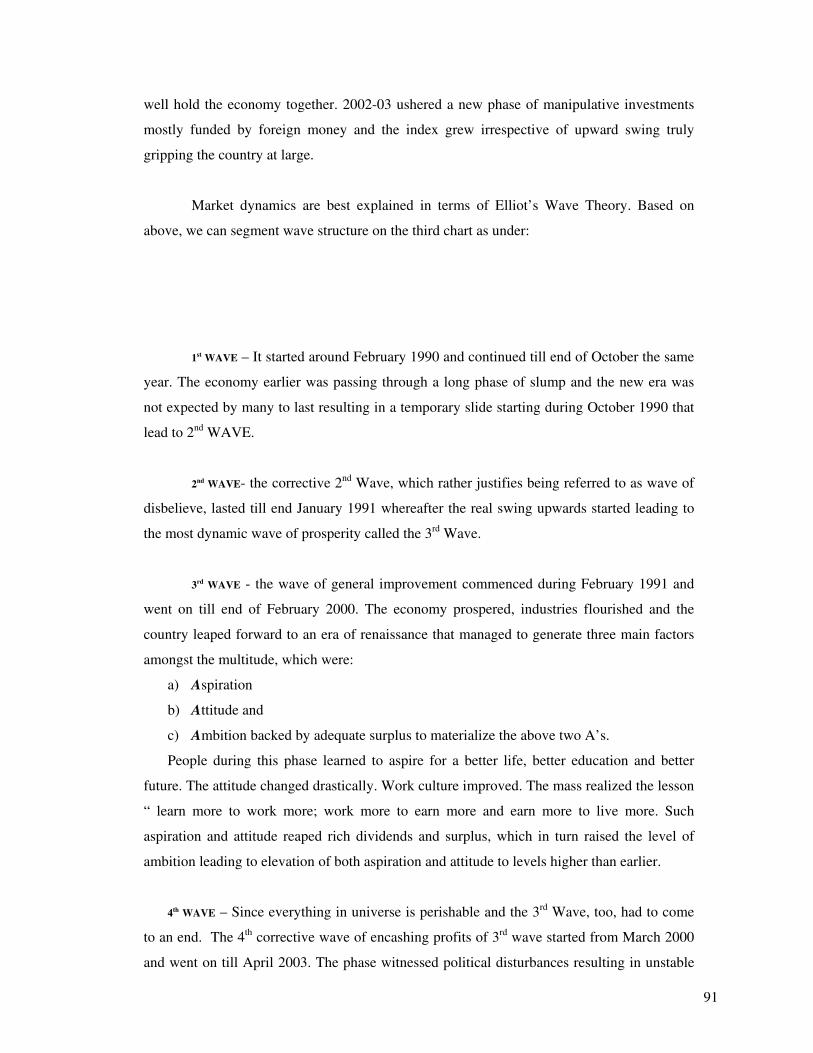
91
well hold the economy together. 2002-03 ushered a new phase of manipulative investments
mostly funded by foreign money and the index grew irrespective of upward swing truly
gripping the country at large.
Market dynamics are best explained in terms of Elliot’s Wave Theory. Based on
above, we can segment wave structure on the third chart as under:
1st WAVE – It started around February 1990 and continued till end of October the same
year. The economy earlier was passing through a long phase of slump and the new era was
not expected by many to last resulting in a temporary slide starting during October 1990 that
lead to 2nd WAVE.
2nd WAVE- the corrective 2nd Wave, which rather justifies being referred to as wave of
disbelieve, lasted till end January 1991 whereafter the real swing upwards started leading to
the most dynamic wave of prosperity called the 3rd Wave.
3rd WAVE - the wave of general improvement commenced during February 1991 and
went on till end of February 2000. The economy prospered, industries flourished and the
country leaped forward to an era of renaissance that managed to generate three main factors
amongst the multitude, which were:
a) Aspiration
b) Attitude and
c) Ambition backed by adequate surplus to materialize the above two A’s.
People during this phase learned to aspire for a better life, better education and better
future. The attitude changed drastically. Work culture improved. The mass realized the lesson
“ learn more to work more; work more to earn more and earn more to live more. Such
aspiration and attitude reaped rich dividends and surplus, which in turn raised the level of
ambition leading to elevation of both aspiration and attitude to levels higher than earlier.
4th WAVE – Since everything in universe is perishable and the 3rd Wave, too, had to come
to an end. The 4th corrective wave of encashing profits of 3rd wave started from March 2000
and went on till April 2003. The phase witnessed political disturbances resulting in unstable
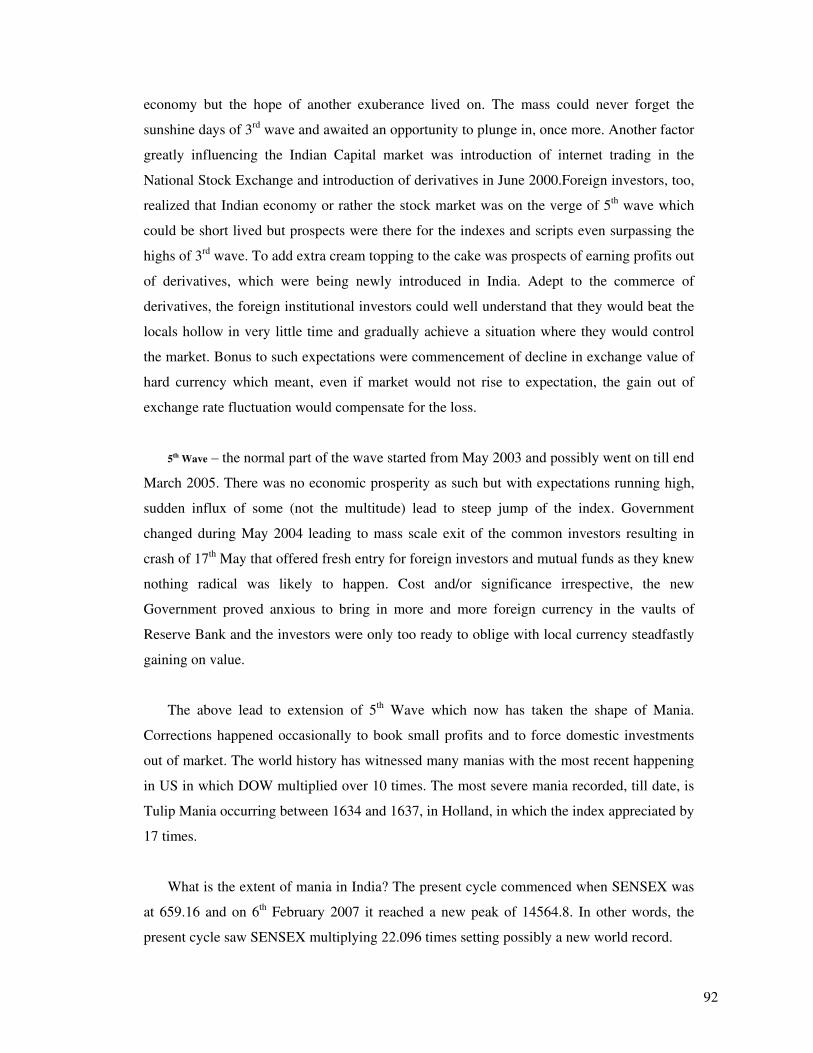
92
economy but the hope of another exuberance lived on. The mass could never forget the
sunshine days of 3rd wave and awaited an opportunity to plunge in, once more. Another factor
greatly influencing the Indian Capital market was introduction of internet trading in the
National Stock Exchange and introduction of derivatives in June 2000.Foreign investors, too,
realized that Indian economy or rather the stock market was on the verge of 5th wave which
could be short lived but prospects were there for the indexes and scripts even surpassing the
highs of 3rd wave. To add extra cream topping to the cake was prospects of earning profits out
of derivatives, which were being newly introduced in India. Adept to the commerce of
derivatives, the foreign institutional investors could well understand that they would beat the
locals hollow in very little time and gradually achieve a situation where they would control
the market. Bonus to such expectations were commencement of decline in exchange value of
hard currency which meant, even if market would not rise to expectation, the gain out of
exchange rate fluctuation would compensate for the loss.
5th Wave – the normal part of the wave started from May 2003 and possibly went on till end
March 2005. There was no economic prosperity as such but with expectations running high,
sudden influx of some (not the multitude) lead to steep jump of the index. Government
changed during May 2004 leading to mass scale exit of the common investors resulting in
crash of 17th May that offered fresh entry for foreign investors and mutual funds as they knew
nothing radical was likely to happen. Cost and/or significance irrespective, the new
Government proved anxious to bring in more and more foreign currency in the vaults of
Reserve Bank and the investors were only too ready to oblige with local currency steadfastly
gaining on value.
The above lead to extension of 5th Wave which now has taken the shape of Mania.
Corrections happened occasionally to book small profits and to force domestic investments
out of market. The world history has witnessed many manias with the most recent happening
in US in which DOW multiplied over 10 times. The most severe mania recorded, till date, is
Tulip Mania occurring between 1634 and 1637, in Holland, in which the index appreciated by
17 times.
What is the extent of mania in India? The present cycle commenced when SENSEX was
at 659.16 and on 6th February 2007 it reached a new peak of 14564.8. In other words, the
present cycle saw SENSEX multiplying 22.096 times setting possibly a new world record.
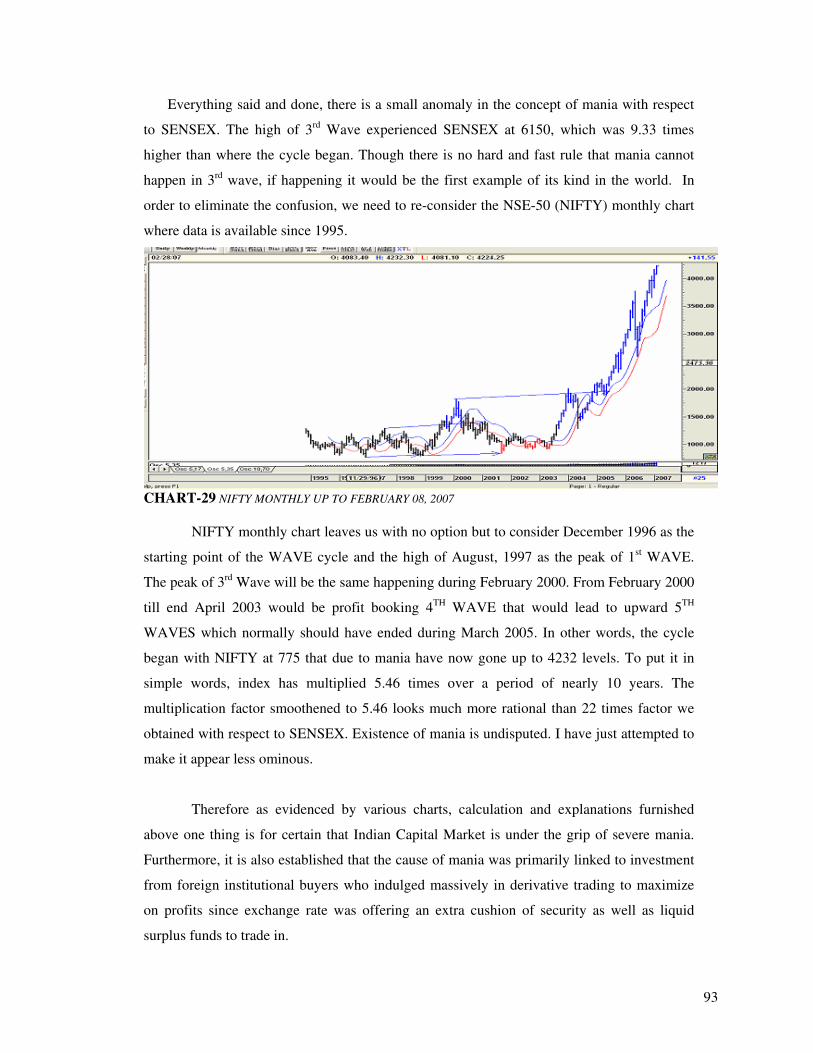
93
Everything said and done, there is a small anomaly in the concept of mania with respect
to SENSEX. The high of 3rd Wave experienced SENSEX at 6150, which was 9.33 times
higher than where the cycle began. Though there is no hard and fast rule that mania cannot
happen in 3rd wave, if happening it would be the first example of its kind in the world. In
order to eliminate the confusion, we need to re-consider the NSE-50 (NIFTY) monthly chart
where data is available since 1995.
CHART-29 NIFTY MONTHLY UP TO FEBRUARY 08, 2007
NIFTY monthly chart leaves us with no option but to consider December 1996 as the
starting point of the WAVE cycle and the high of August, 1997 as the peak of 1st WAVE.
The peak of 3rd Wave will be the same happening during February 2000. From February 2000
till end April 2003 would be profit booking 4TH WAVE that would lead to upward 5TH
WAVES which normally should have ended during March 2005. In other words, the cycle
began with NIFTY at 775 that due to mania have now gone up to 4232 levels. To put it in
simple words, index has multiplied 5.46 times over a period of nearly 10 years. The
multiplication factor smoothened to 5.46 looks much more rational than 22 times factor we
obtained with respect to SENSEX. Existence of mania is undisputed. I have just attempted to
make it appear less ominous.
Therefore as evidenced by various charts, calculation and explanations furnished
above one thing is for certain that Indian Capital Market is under the grip of severe mania.
Furthermore, it is also established that the cause of mania was primarily linked to investment
from foreign institutional buyers who indulged massively in derivative trading to maximize
on profits since exchange rate was offering an extra cushion of security as well as liquid
surplus funds to trade in.
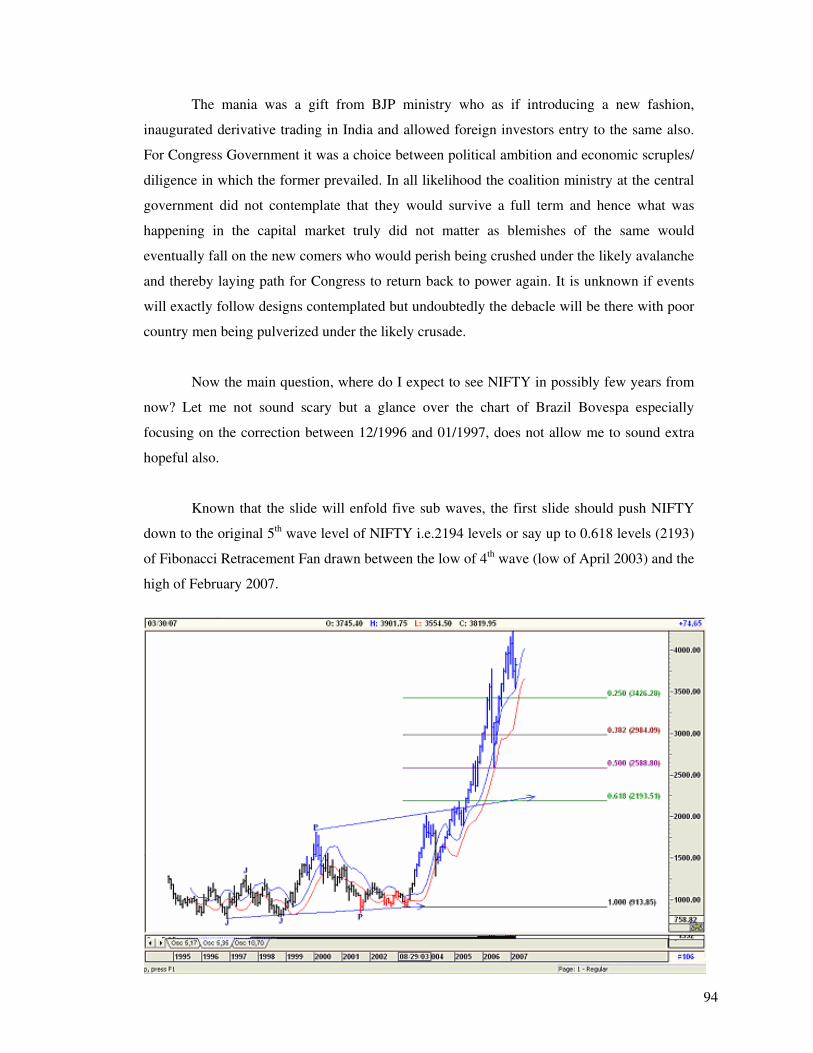
94
The mania was a gift from BJP ministry who as if introducing a new fashion,
inaugurated derivative trading in India and allowed foreign investors entry to the same also.
For Congress Government it was a choice between political ambition and economic scruples/
diligence in which the former prevailed. In all likelihood the coalition ministry at the central
government did not contemplate that they would survive a full term and hence what was
happening in the capital market truly did not matter as blemishes of the same would
eventually fall on the new comers who would perish being crushed under the likely avalanche
and thereby laying path for Congress to return back to power again. It is unknown if events
will exactly follow designs contemplated but undoubtedly the debacle will be there with poor
country men being pulverized under the likely crusade.
Now the main question, where do I expect to see NIFTY in possibly few years from
now? Let me not sound scary but a glance over the chart of Brazil Bovespa especially
focusing on the correction between 12/1996 and 01/1997, does not allow me to sound extra
hopeful also.
Known that the slide will enfold five sub waves, the first slide should push NIFTY
down to the original 5th wave level of NIFTY i.e.2194 levels or say up to 0.618 levels (2193)
of Fibonacci Retracement Fan drawn between the low of 4th wave (low of April 2003) and the
high of February 2007.
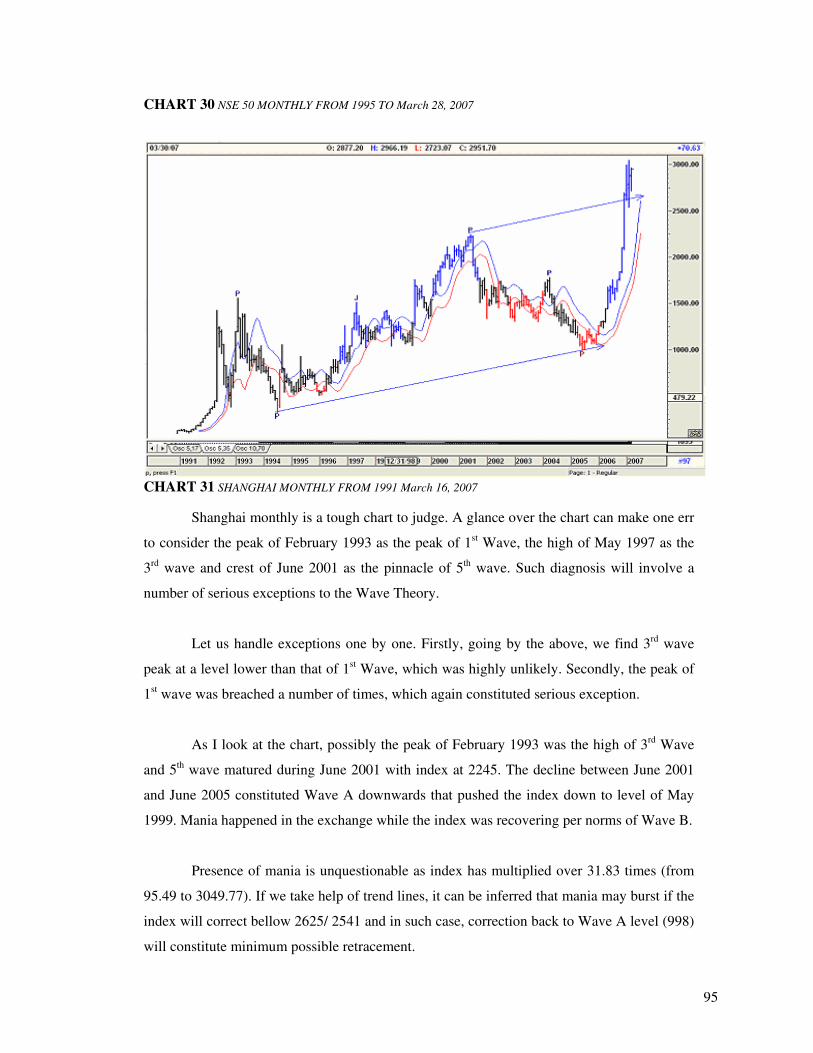
95
CHART 30 NSE 50 MONTHLY FROM 1995 TO March 28, 2007
CHART 31 SHANGHAI MONTHLY FROM 1991 March 16, 2007
Shanghai monthly is a tough chart to judge. A glance over the chart can make one err
to consider the peak of February 1993 as the peak of 1st Wave, the high of May 1997 as the
3rd wave and crest of June 2001 as the pinnacle of 5th wave. Such diagnosis will involve a
number of serious exceptions to the Wave Theory.
Let us handle exceptions one by one. Firstly, going by the above, we find 3rd wave
peak at a level lower than that of 1st Wave, which was highly unlikely. Secondly, the peak of
1st wave was breached a number of times, which again constituted serious exception.
As I look at the chart, possibly the peak of February 1993 was the high of 3rd Wave
and 5th wave matured during June 2001 with index at 2245. The decline between June 2001
and June 2005 constituted Wave A downwards that pushed the index down to level of May
1999. Mania happened in the exchange while the index was recovering per norms of Wave B.
Presence of mania is unquestionable as index has multiplied over 31.83 times (from
95.49 to 3049.77). If we take help of trend lines, it can be inferred that mania may burst if the
index will correct bellow 2625/ 2541 and in such case, correction back to Wave A level (998)
will constitute minimum possible retracement.
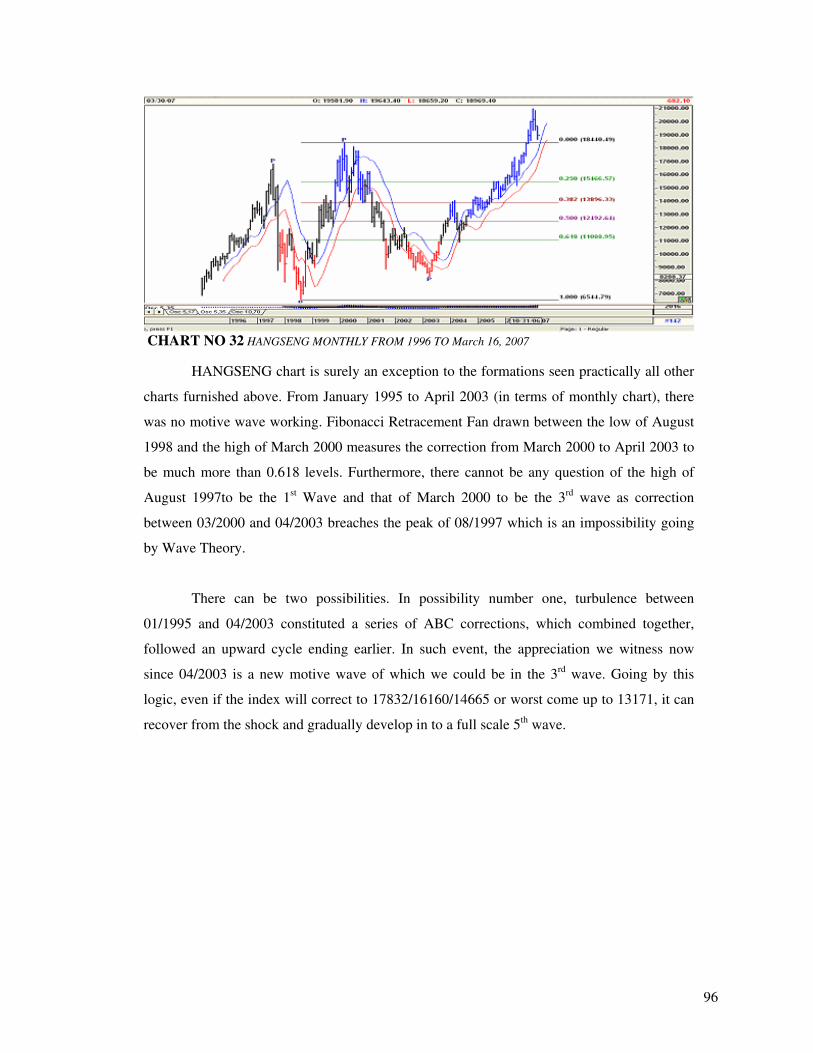
96
CHART NO 32 HANGSENG MONTHLY FROM 1996 TO March 16, 2007
HANGSENG chart is surely an exception to the formations seen practically all other
charts furnished above. From January 1995 to April 2003 (in terms of monthly chart), there
was no motive wave working. Fibonacci Retracement Fan drawn between the low of August
1998 and the high of March 2000 measures the correction from March 2000 to April 2003 to
be much more than 0.618 levels. Furthermore, there cannot be any question of the high of
August 1997to be the 1st Wave and that of March 2000 to be the 3rd wave as correction
between 03/2000 and 04/2003 breaches the peak of 08/1997 which is an impossibility going
by Wave Theory.
There can be two possibilities. In possibility number one, turbulence between
01/1995 and 04/2003 constituted a series of ABC corrections, which combined together,
followed an upward cycle ending earlier. In such event, the appreciation we witness now
since 04/2003 is a new motive wave of which we could be in the 3rd wave. Going by this
logic, even if the index will correct to 17832/16160/14665 or worst come up to 13171, it can
recover from the shock and gradually develop in to a full scale 5th wave.
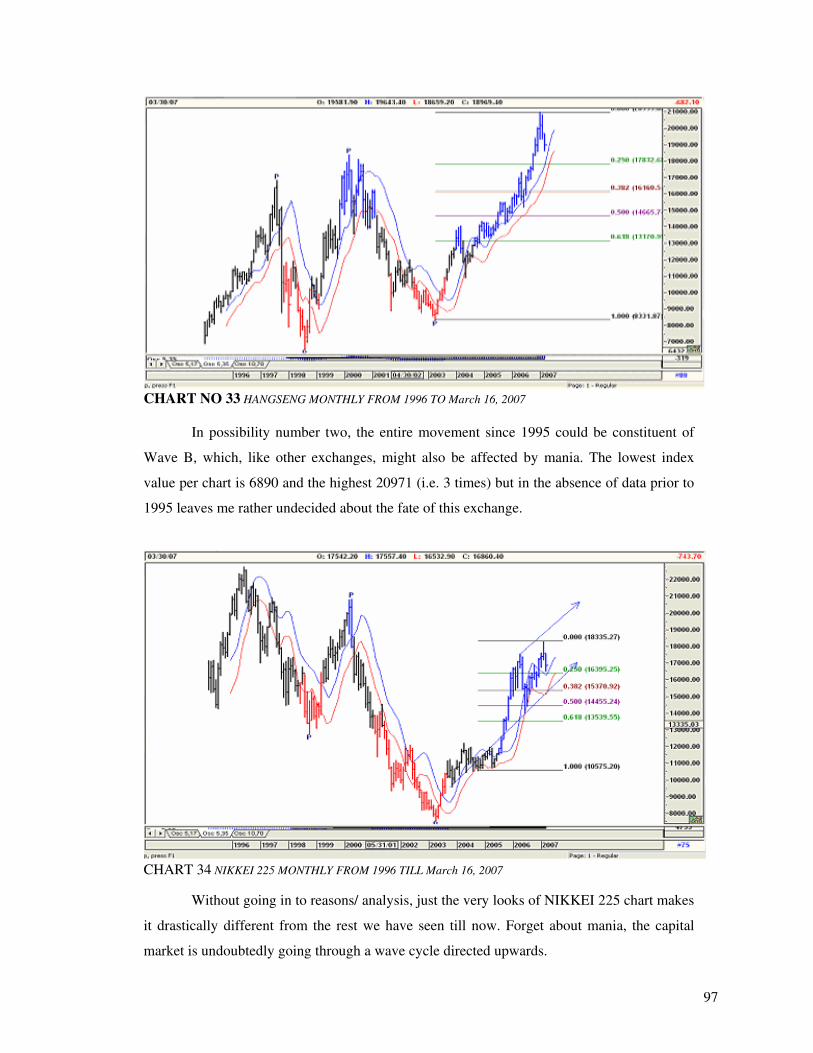
97
CHART NO 33 HANGSENG MONTHLY FROM 1996 TO March 16, 2007
In possibility number two, the entire movement since 1995 could be constituent of
Wave B, which, like other exchanges, might also be affected by mania. The lowest index
value per chart is 6890 and the highest 20971 (i.e. 3 times) but in the absence of data prior to
1995 leaves me rather undecided about the fate of this exchange.
CHART 34 NIKKEI 225 MONTHLY FROM 1996 TILL March 16, 2007
Without going in to reasons/ analysis, just the very looks of NIKKEI 225 chart makes
it drastically different from the rest we have seen till now. Forget about mania, the capital
market is undoubtedly going through a wave cycle directed upwards.
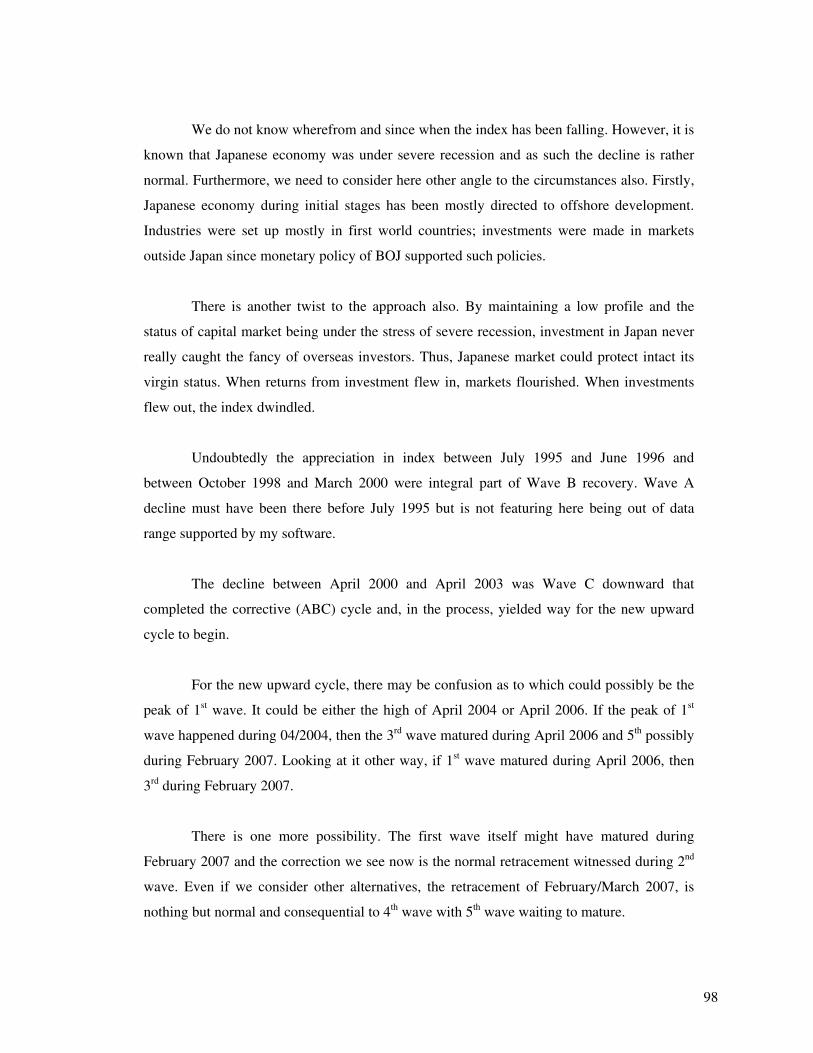
98
We do not know wherefrom and since when the index has been falling. However, it is
known that Japanese economy was under severe recession and as such the decline is rather
normal. Furthermore, we need to consider here other angle to the circumstances also. Firstly,
Japanese economy during initial stages has been mostly directed to offshore development.
Industries were set up mostly in first world countries; investments were made in markets
outside Japan since monetary policy of BOJ supported such policies.
There is another twist to the approach also. By maintaining a low profile and the
status of capital market being under the stress of severe recession, investment in Japan never
really caught the fancy of overseas investors. Thus, Japanese market could protect intact its
virgin status. When returns from investment flew in, markets flourished. When investments
flew out, the index dwindled.
Undoubtedly the appreciation in index between July 1995 and June 1996 and
between October 1998 and March 2000 were integral part of Wave B recovery. Wave A
decline must have been there before July 1995 but is not featuring here being out of data
range supported by my software.
The decline between April 2000 and April 2003 was Wave C downward that
completed the corrective (ABC) cycle and, in the process, yielded way for the new upward
cycle to begin.
For the new upward cycle, there may be confusion as to which could possibly be the
peak of 1st wave. It could be either the high of April 2004 or April 2006. If the peak of 1st
wave happened during 04/2004, then the 3rd wave matured during April 2006 and 5th possibly
during February 2007. Looking at it other way, if 1st wave matured during April 2006, then
3rd during February 2007.
There is one more possibility. The first wave itself might have matured during
February 2007 and the correction we see now is the normal retracement witnessed during 2nd
wave. Even if we consider other alternatives, the retracement of February/March 2007, is
nothing but normal and consequential to 4th wave with 5th wave waiting to mature.
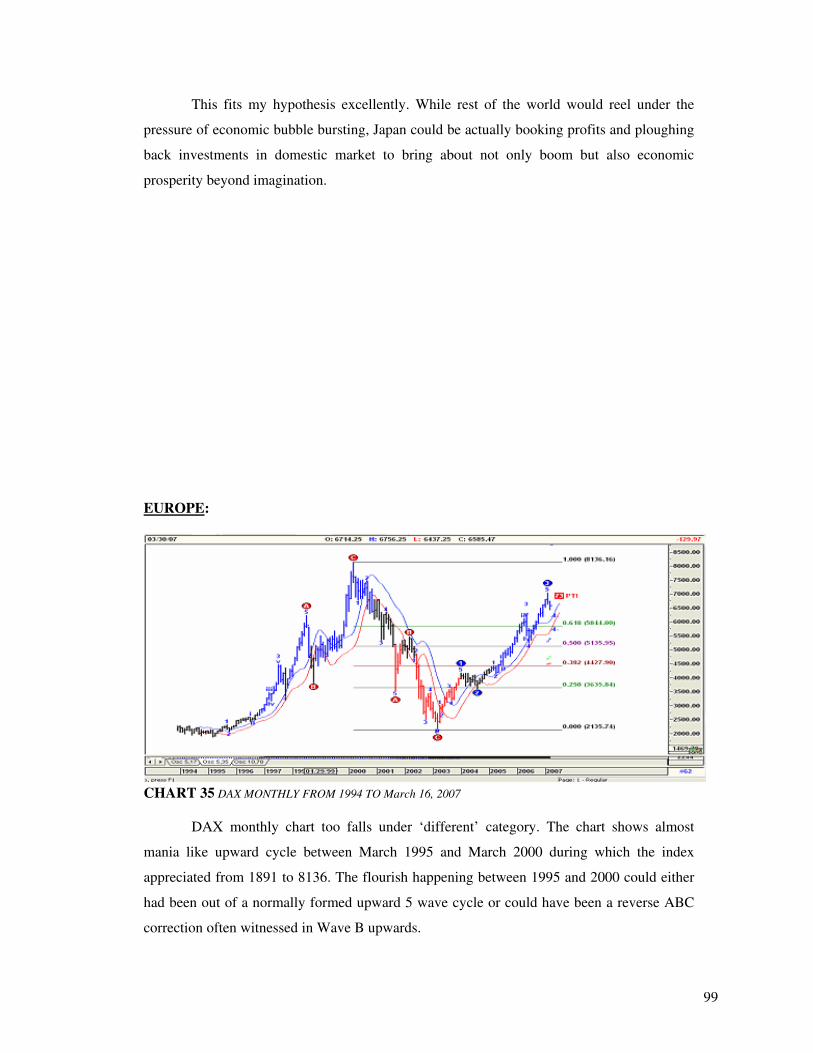
99
This fits my hypothesis excellently. While rest of the world would reel under the
pressure of economic bubble bursting, Japan could be actually booking profits and ploughing
back investments in domestic market to bring about not only boom but also economic
prosperity beyond imagination.
EUROPE:
CHART 35 DAX MONTHLY FROM 1994 TO March 16, 2007
DAX monthly chart too falls under ‘different’ category. The chart shows almost
mania like upward cycle between March 1995 and March 2000 during which the index
appreciated from 1891 to 8136. The flourish happening between 1995 and 2000 could either
had been out of a normally formed upward 5 wave cycle or could have been a reverse ABC
correction often witnessed in Wave B upwards.
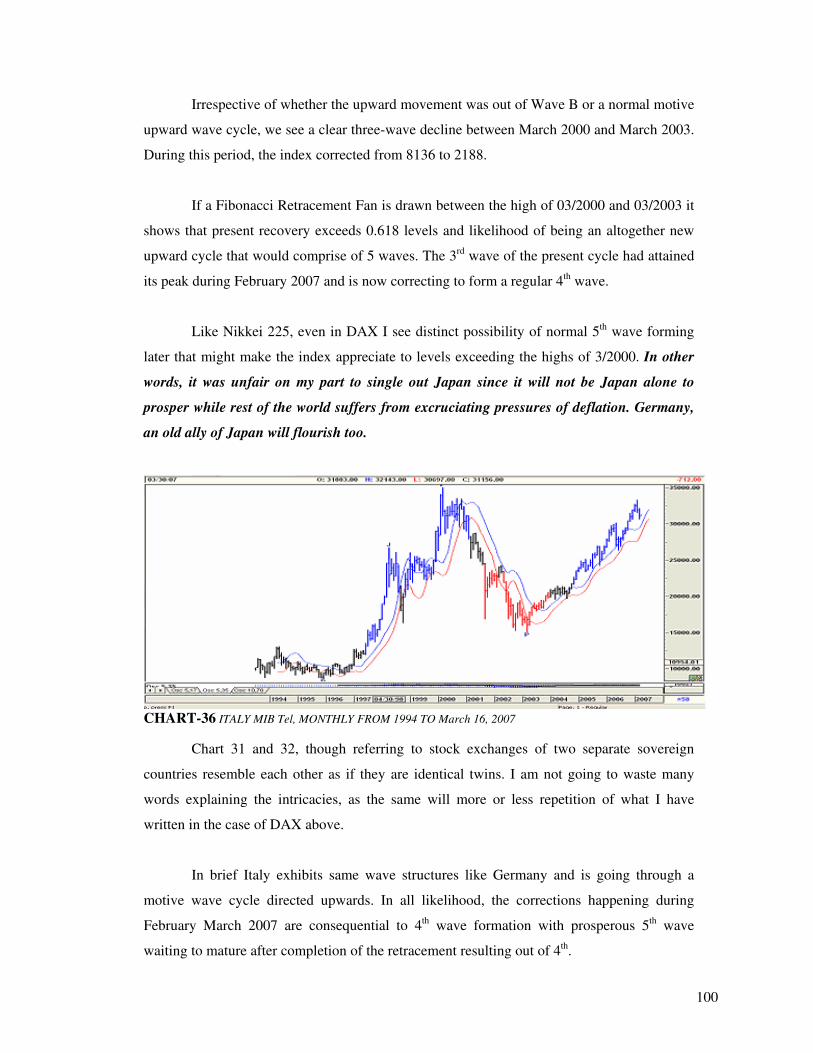
100
Irrespective of whether the upward movement was out of Wave B or a normal motive
upward wave cycle, we see a clear three-wave decline between March 2000 and March 2003.
During this period, the index corrected from 8136 to 2188.
If a Fibonacci Retracement Fan is drawn between the high of 03/2000 and 03/2003 it
shows that present recovery exceeds 0.618 levels and likelihood of being an altogether new
upward cycle that would comprise of 5 waves. The 3rd wave of the present cycle had attained
its peak during February 2007 and is now correcting to form a regular 4th wave.
Like Nikkei 225, even in DAX I see distinct possibility of normal 5th wave forming
later that might make the index appreciate to levels exceeding the highs of 3/2000. In other
words, it was unfair on my part to single out Japan since it will not be Japan alone to
prosper while rest of the world suffers from excruciating pressures of deflation. Germany,
an old ally of Japan will flourish too.
CHART-36 ITALY MIB Tel, MONTHLY FROM 1994 TO March 16, 2007
Chart 31 and 32, though referring to stock exchanges of two separate sovereign
countries resemble each other as if they are identical twins. I am not going to waste many
words explaining the intricacies, as the same will more or less repetition of what I have
written in the case of DAX above.
In brief Italy exhibits same wave structures like Germany and is going through a
motive wave cycle directed upwards. In all likelihood, the corrections happening during
February March 2007 are consequential to 4th wave formation with prosperous 5th wave
waiting to mature after completion of the retracement resulting out of 4th.
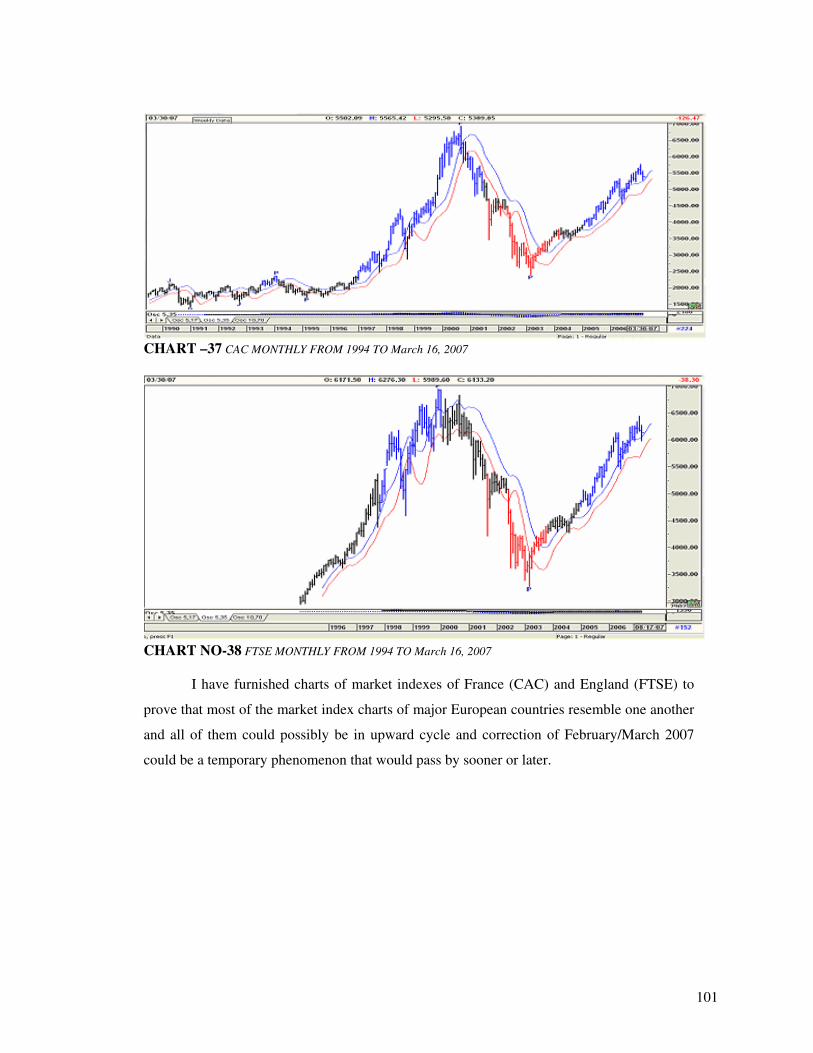
101
CHART –37 CAC MONTHLY FROM 1994 TO March 16, 2007
CHART NO-38 FTSE MONTHLY FROM 1994 TO March 16, 2007
I have furnished charts of market indexes of France (CAC) and England (FTSE) to
prove that most of the market index charts of major European countries resemble one another
and all of them could possibly be in upward cycle and correction of February/March 2007
could be a temporary phenomenon that would pass by sooner or later.
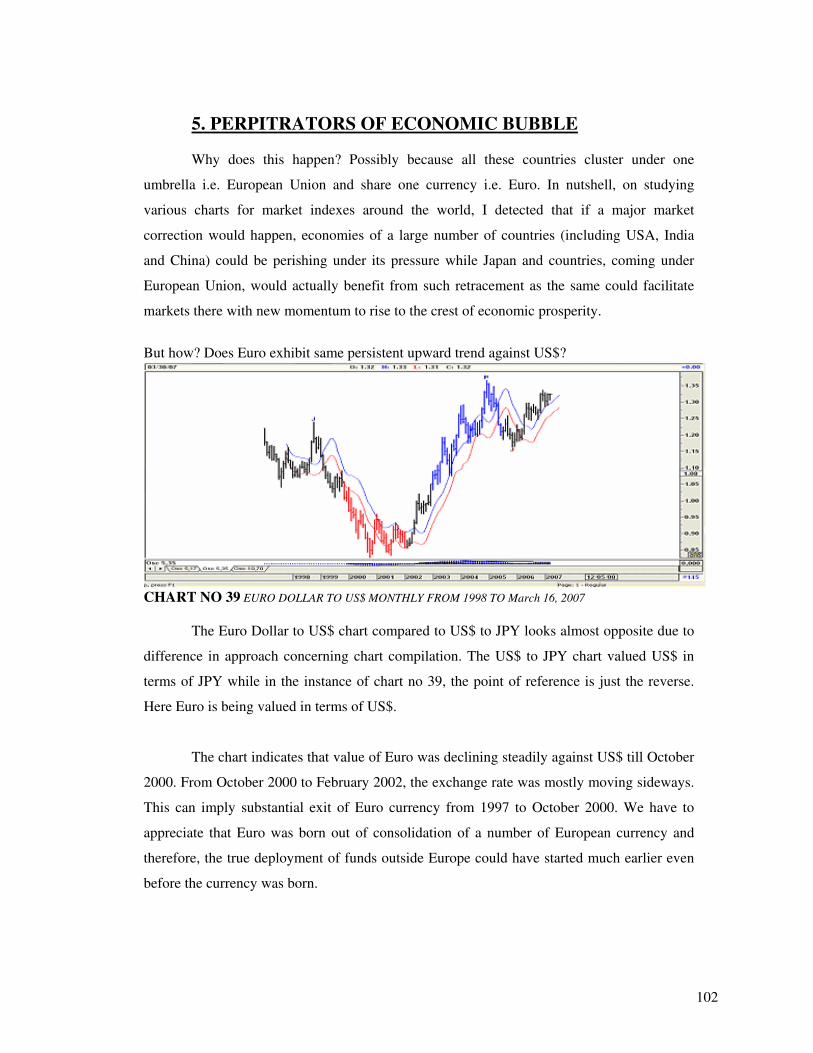
102
5. PERPITRATORS OF ECONOMIC BUBBLE
Why does this happen? Possibly because all these countries cluster under one
umbrella i.e. European Union and share one currency i.e. Euro. In nutshell, on studying
various charts for market indexes around the world, I detected that if a major market
correction would happen, economies of a large number of countries (including USA, India
and China) could be perishing under its pressure while Japan and countries, coming under
European Union, would actually benefit from such retracement as the same could facilitate
markets there with new momentum to rise to the crest of economic prosperity.
But how? Does Euro exhibit same persistent upward trend against US$?
CHART NO 39 EURO DOLLAR TO US$ MONTHLY FROM 1998 TO March 16, 2007
The Euro Dollar to US$ chart compared to US$ to JPY looks almost opposite due to
difference in approach concerning chart compilation. The US$ to JPY chart valued US$ in
terms of JPY while in the instance of chart no 39, the point of reference is just the reverse.
Here Euro is being valued in terms of US$.
The chart indicates that value of Euro was declining steadily against US$ till October
2000. From October 2000 to February 2002, the exchange rate was mostly moving sideways.
This can imply substantial exit of Euro currency from 1997 to October 2000. We have to
appreciate that Euro was born out of consolidation of a number of European currency and
therefore, the true deployment of funds outside Europe could have started much earlier even
before the currency was born.
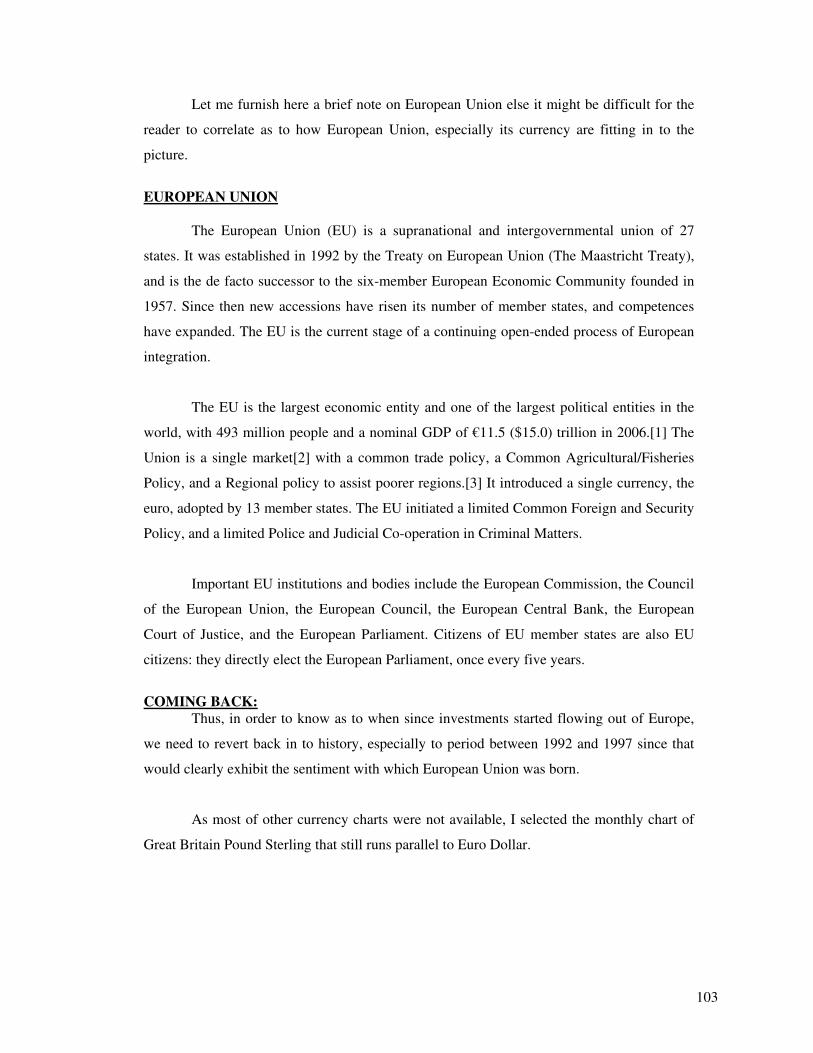
103
Let me furnish here a brief note on European Union else it might be difficult for the
reader to correlate as to how European Union, especially its currency are fitting in to the
picture.
EUROPEAN UNION
The European Union (EU) is a supranational and intergovernmental union of 27
states. It was established in 1992 by the Treaty on European Union (The Maastricht Treaty),
and is the de facto successor to the six-member European Economic Community founded in
1957. Since then new accessions have risen its number of member states, and competences
have expanded. The EU is the current stage of a continuing open-ended process of European
integration.
The EU is the largest economic entity and one of the largest political entities in the
world, with 493 million people and a nominal GDP of €11.5 ($15.0) trillion in 2006.[1] The
Union is a single market[2] with a common trade policy, a Common Agricultural/Fisheries
Policy, and a Regional policy to assist poorer regions.[3] It introduced a single currency, the
euro, adopted by 13 member states. The EU initiated a limited Common Foreign and Security
Policy, and a limited Police and Judicial Co-operation in Criminal Matters.
Important EU institutions and bodies include the European Commission, the Council
of the European Union, the European Council, the European Central Bank, the European
Court of Justice, and the European Parliament. Citizens of EU member states are also EU
citizens: they directly elect the European Parliament, once every five years.
COMING BACK: Thus, in order to know as to when since investments started flowing out of Europe,
we need to revert back in to history, especially to period between 1992 and 1997 since that
would clearly exhibit the sentiment with which European Union was born.
As most of other currency charts were not available, I selected the monthly chart of
Great Britain Pound Sterling that still runs parallel to Euro Dollar.
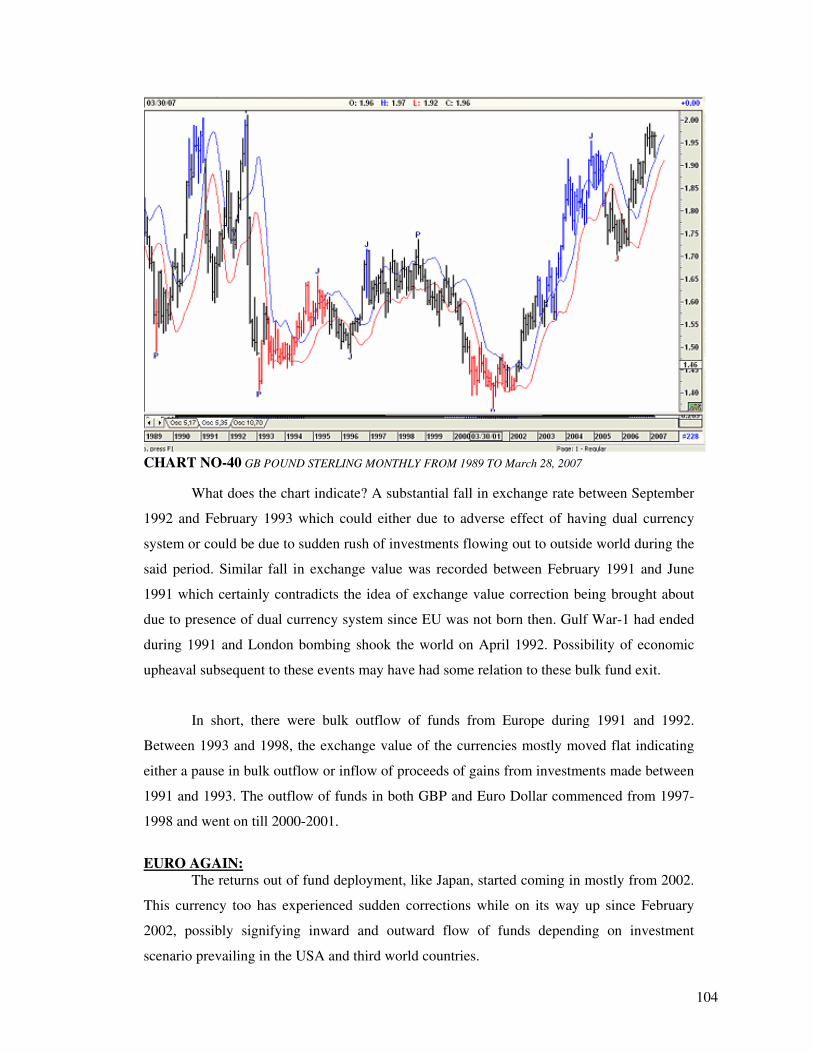
104
CHART NO-40 GB POUND STERLING MONTHLY FROM 1989 TO March 28, 2007
What does the chart indicate? A substantial fall in exchange rate between September
1992 and February 1993 which could either due to adverse effect of having dual currency
system or could be due to sudden rush of investments flowing out to outside world during the
said period. Similar fall in exchange value was recorded between February 1991 and June
1991 which certainly contradicts the idea of exchange value correction being brought about
due to presence of dual currency system since EU was not born then. Gulf War-1 had ended
during 1991 and London bombing shook the world on April 1992. Possibility of economic
upheaval subsequent to these events may have had some relation to these bulk fund exit.
In short, there were bulk outflow of funds from Europe during 1991 and 1992.
Between 1993 and 1998, the exchange value of the currencies mostly moved flat indicating
either a pause in bulk outflow or inflow of proceeds of gains from investments made between
1991 and 1993. The outflow of funds in both GBP and Euro Dollar commenced from 1997-
1998 and went on till 2000-2001.
EURO AGAIN:
The returns out of fund deployment, like Japan, started coming in mostly from 2002.
This currency too has experienced sudden corrections while on its way up since February
2002, possibly signifying inward and outward flow of funds depending on investment
scenario prevailing in the USA and third world countries.
105
The currency is on a five-wave motive cycle up and looks set to form a 5th wave
soon. If 5th wave will bloom in its true glory, Euro in future will fetch anything between US$
1.40 and US$ 1.50. It may be worthwhile to add, that as I write this portion of the article
today, Euro was fetching US$ 1.32 on exchange value. With regard to GB Pound Sterling, the
future looks equally bright and chances are bright for the currency to fetch, in near future, 2.1
times its value in US Dollar. The present exchange rate of GBP to US$ is 1.96.
To put it in brief, currency charts of both JPY and Euro provide outlook of likely
economic prosperity in countries they pertain to which respective capital markets do also
correspond.
The situation is not the same in Hong Kong as monthly chart of US$ to Hong Kong
Dollar indicate that the value of the later will dwindle sooner or later and in near future, US$1
will fetch anything between HKG$ 7.85/7.87 as compared to the present rate of 7.81.
CHART NO-41 US$ TO HONGKONG DOLLAR MONTHLY FROM 1998 TO March 16, 2007
Therefore, if there is a cartel of countries that have planned out and forced mania
to happen in USA and most of the Third world countries, Hong Kong is certainly not a
member to the same.
PROOF OF MANIA:
106
I shall not use too many words to build up the logic that mania is raging in a number
of capital markets of the world. The reasons as to why I call them as mania has been vividly
discussed along with implications. While I am plotting this article, like a blessing, a startling
item of news featured in Bloomberg.com, which goes to prove that at least one country now
acknowledges presence of mania and is making a decent effort to counter the same. The news
matter is as under:
China Bars Firms Speculating With Stock-Sale Funds By Josephine Lau and Jiang Jianguo March 20 (Bloomberg) -- China's securities regulator barred companies from using proceeds from share sales to invest in stocks, in an attempt to damp overheating financial markets. Companies are also banned from buying derivatives and convertible bonds with share sale proceeds, the China Securities Regulatory Commission said in a statement today. The Beijing- based regulator said it will monitor companies more closely. ``Regulators are concerned that proceeds are fueling the stock market frenzy,'' said Gabriel Gondard, who manages the equivalent of $3.5 billion at Fortune SGAM Fund Management, a venture of Societe Generale SA, in Shanghai. ``The government wants to start seeing more of that money reinvested into the companies or distributed as dividends.'' China wants to curb speculation in the real estate and stock markets to break boom-bust cycles fueled by 33.5 trillion yuan ($4.3 trillion) of household and corporate deposits. China's cabinet approved a task force last month to clamp down on illegal share sales and other banned activities in a market that saw $24.4 billion of share sales in the past year. Since January, the nation's banking watchdog has also cracked down bank loans used to invest in property and shares. The benchmark Shanghai and Shenzhen 300 Index more than doubled last year. Market Bubbles Zhengzhou Yutong Bus Co. and Finance Street Holding Co. are among the companies that said this year they plan to use some of the proceeds from prior share sales to invest in the initial public offerings of Chinese companies. Zhengzhou Yutong Bus is the China-based partner of MAN AG and Beijing-based Finance Street Holding develops property. The Shanghai-Shenzhen 300 Index gained 156 percent in the past 12 months after China ended a one-year ban on domestic stock sales in May. The government must pay attention to ``bubbles'' in the stock market before they get too large, Cheng Siwei, vice chairman of the Chinese legislature, wrote in a Feb. 6 commentary in the Chinese-language Financial News. In December, China's banking regulator sent out a statement, urging banks to stop lending for stock investments and to recall outstanding share loans. In January, the watchdog told domestic banks to strengthen efforts to rein in property loans to help slow an economy that grew the fastest in 11 years in 2006.
107
The Shanghai-Shenzhen index tumbled 9.2 percent on Feb. 27, the most in 10 years, on concern about government efforts to prevent overinvestment in shares. Previous Crackdowns ``The Chinese government similarly cracked down on share sale proceeds going into stocks in 1996 and 1997, when the markets were also soaring,'' said Stephen Green, senior economist at Standard Chartered Plc in Shanghai. Publicly traded companies must use share-sale proceeds as outlined in their prospectuses unless their stockholders approve changes, the securities regulator said today. Financial institutions such as China Life Insurance Co. and Ping An Insurance (Group) Co., the nation's two largest insurers, will still be able to invest in equities as allowed under their business scope. Ping An made 4.3 billion yuan -- more than a third of its total investment income in the first nine months last year -- from equities and mutual funds, according to its domestic share sale document. The Shenzhen-based insurer raised $5 billion in a share sale in China this year. China's securities regulator Shang Fulin is reinforcing the policies of central bank Governor Zhou Xiaochuan as the government tries to cool an economy that expanded 10.7 percent last year.
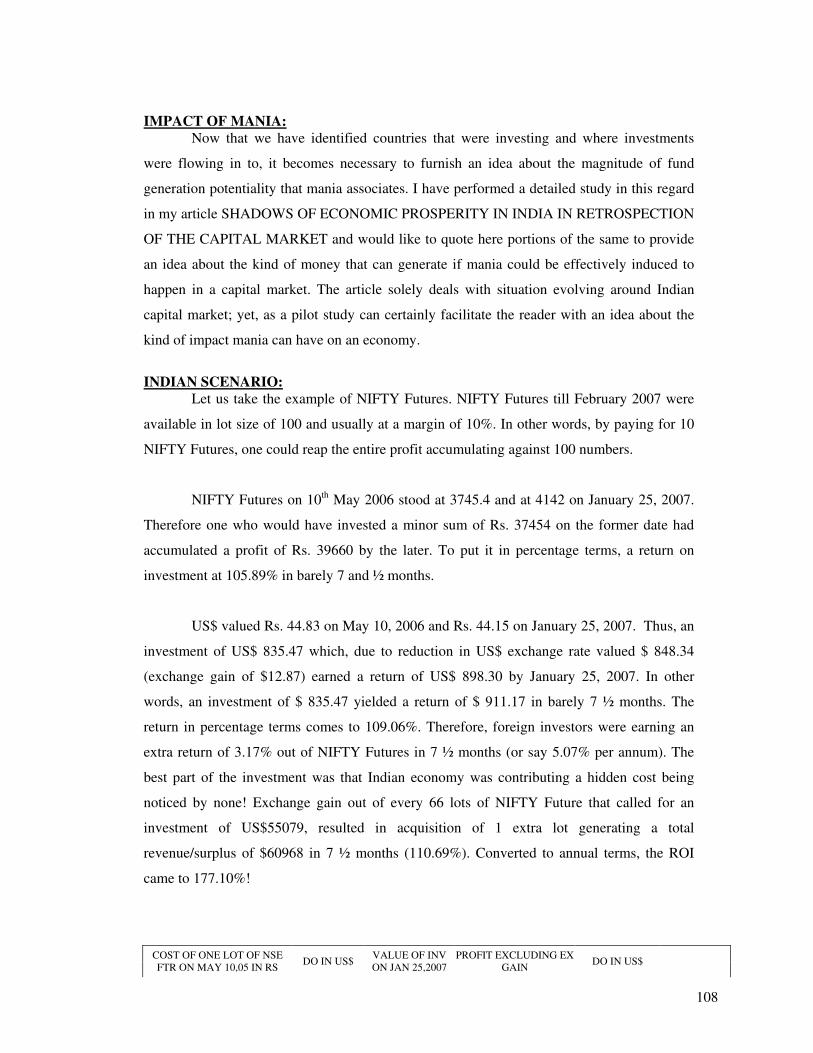
108
IMPACT OF MANIA:
Now that we have identified countries that were investing and where investments
were flowing in to, it becomes necessary to furnish an idea about the magnitude of fund
generation potentiality that mania associates. I have performed a detailed study in this regard
in my article SHADOWS OF ECONOMIC PROSPERITY IN INDIA IN RETROSPECTION
OF THE CAPITAL MARKET and would like to quote here portions of the same to provide
an idea about the kind of money that can generate if mania could be effectively induced to
happen in a capital market. The article solely deals with situation evolving around Indian
capital market; yet, as a pilot study can certainly facilitate the reader with an idea about the
kind of impact mania can have on an economy.
INDIAN SCENARIO:
Let us take the example of NIFTY Futures. NIFTY Futures till February 2007 were
available in lot size of 100 and usually at a margin of 10%. In other words, by paying for 10
NIFTY Futures, one could reap the entire profit accumulating against 100 numbers.
NIFTY Futures on 10th May 2006 stood at 3745.4 and at 4142 on January 25, 2007.
Therefore one who would have invested a minor sum of Rs. 37454 on the former date had
accumulated a profit of Rs. 39660 by the later. To put it in percentage terms, a return on
investment at 105.89% in barely 7 and ½ months.
US$ valued Rs. 44.83 on May 10, 2006 and Rs. 44.15 on January 25, 2007. Thus, an
investment of US$ 835.47 which, due to reduction in US$ exchange rate valued $ 848.34
(exchange gain of $12.87) earned a return of US$ 898.30 by January 25, 2007. In other
words, an investment of $ 835.47 yielded a return of $ 911.17 in barely 7 ½ months. The
return in percentage terms comes to 109.06%. Therefore, foreign investors were earning an
extra return of 3.17% out of NIFTY Futures in 7 ½ months (or say 5.07% per annum). The
best part of the investment was that Indian economy was contributing a hidden cost being
noticed by none! Exchange gain out of every 66 lots of NIFTY Future that called for an
investment of US$55079, resulted in acquisition of 1 extra lot generating a total
revenue/surplus of $60968 in 7 ½ months (110.69%). Converted to annual terms, the ROI
came to 177.10%!
COST OF ONE LOT OF NSE FTR ON MAY 10,05 IN RS
DO IN US$ VALUE OF INV ON JAN 25,2007
PROFIT EXCLUDING EX GAIN
DO IN US$
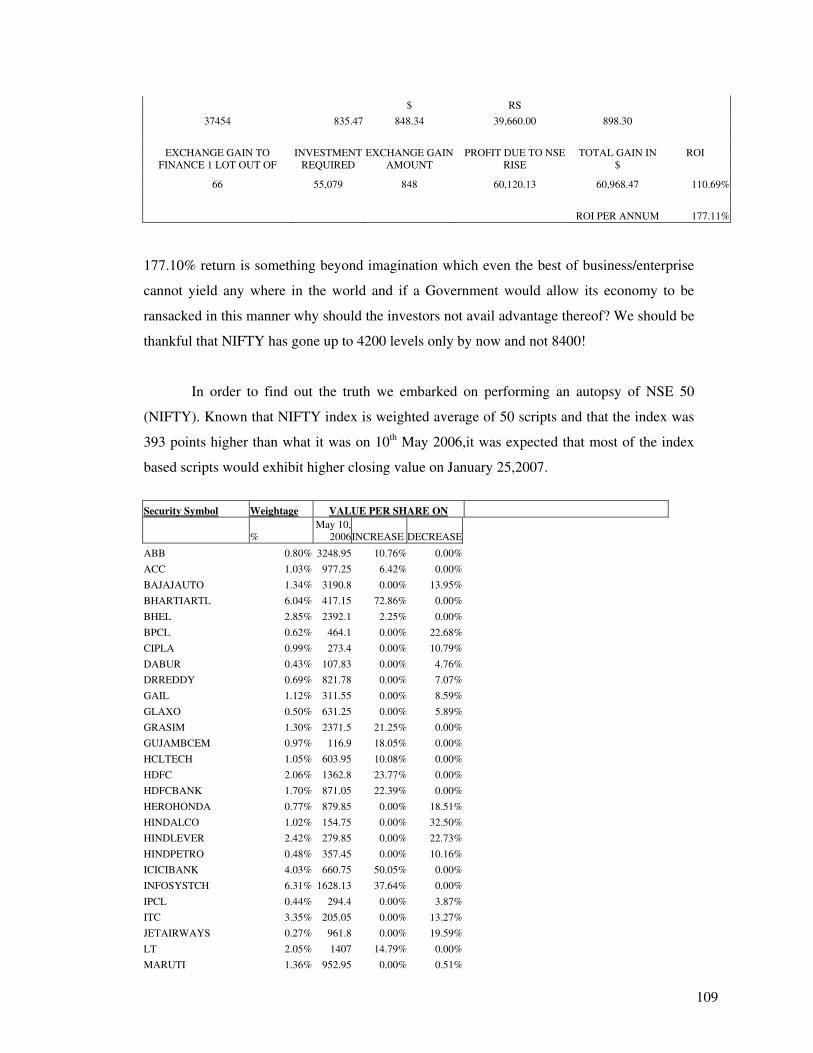
109
$ RS
37454 835.47 848.34 39,660.00 898.30
ROI EXCHANGE GAIN TO FINANCE 1 LOT OUT OF
INVESTMENT REQUIRED
EXCHANGE GAIN AMOUNT
PROFIT DUE TO NSE RISE
TOTAL GAIN IN $
66 55,079 848 60,120.13 60,968.47 110.69%
ROI PER ANNUM 177.11%
177.10% return is something beyond imagination which even the best of business/enterprise
cannot yield any where in the world and if a Government would allow its economy to be
ransacked in this manner why should the investors not avail advantage thereof? We should be
thankful that NIFTY has gone up to 4200 levels only by now and not 8400!
In order to find out the truth we embarked on performing an autopsy of NSE 50
(NIFTY). Known that NIFTY index is weighted average of 50 scripts and that the index was
393 points higher than what it was on 10th May 2006,it was expected that most of the index
based scripts would exhibit higher closing value on January 25,2007.
Security Symbol Weightage VALUE PER SHARE ON
% May 10,
2006 INCREASE DECREASE
ABB 0.80% 3248.95 10.76% 0.00%
ACC 1.03% 977.25 6.42% 0.00%
BAJAJAUTO 1.34% 3190.8 0.00% 13.95%
BHARTIARTL 6.04% 417.15 72.86% 0.00%
BHEL 2.85% 2392.1 2.25% 0.00%
BPCL 0.62% 464.1 0.00% 22.68%
CIPLA 0.99% 273.4 0.00% 10.79%
DABUR 0.43% 107.83 0.00% 4.76%
DRREDDY 0.69% 821.78 0.00% 7.07%
GAIL 1.12% 311.55 0.00% 8.59%
GLAXO 0.50% 631.25 0.00% 5.89%
GRASIM 1.30% 2371.5 21.25% 0.00%
GUJAMBCEM 0.97% 116.9 18.05% 0.00%
HCLTECH 1.05% 603.95 10.08% 0.00%
HDFC 2.06% 1362.8 23.77% 0.00%
HDFCBANK 1.70% 871.05 22.39% 0.00%
HEROHONDA 0.77% 879.85 0.00% 18.51%
HINDALCO 1.02% 154.75 0.00% 32.50%
HINDLEVER 2.42% 279.85 0.00% 22.73%
HINDPETRO 0.48% 357.45 0.00% 10.16%
ICICIBANK 4.03% 660.75 50.05% 0.00%
INFOSYSTCH 6.31% 1628.13 37.64% 0.00%
IPCL 0.44% 294.4 0.00% 3.87%
ITC 3.35% 205.05 0.00% 13.27%
JETAIRWAYS 0.27% 961.8 0.00% 19.59%
LT 2.05% 1407 14.79% 0.00%
MARUTI 1.36% 952.95 0.00% 0.51%
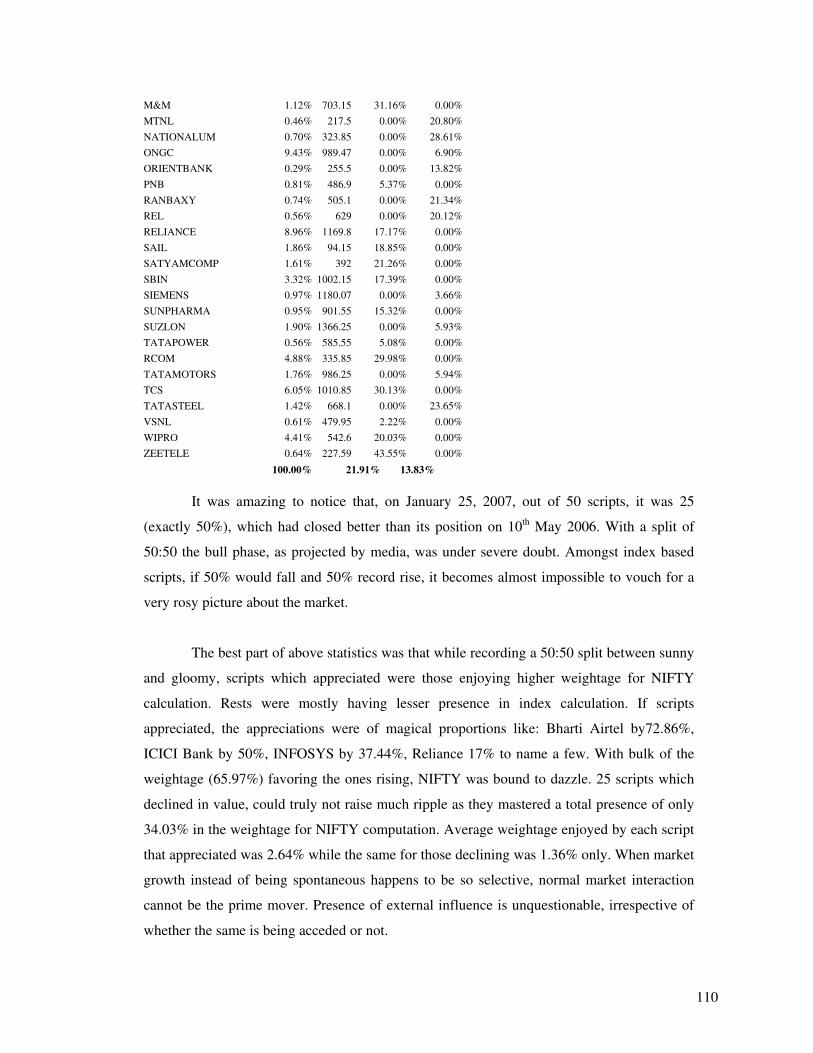
110
M&M 1.12% 703.15 31.16% 0.00%
MTNL 0.46% 217.5 0.00% 20.80%
NATIONALUM 0.70% 323.85 0.00% 28.61%
ONGC 9.43% 989.47 0.00% 6.90%
ORIENTBANK 0.29% 255.5 0.00% 13.82%
PNB 0.81% 486.9 5.37% 0.00%
RANBAXY 0.74% 505.1 0.00% 21.34%
REL 0.56% 629 0.00% 20.12%
RELIANCE 8.96% 1169.8 17.17% 0.00%
SAIL 1.86% 94.15 18.85% 0.00%
SATYAMCOMP 1.61% 392 21.26% 0.00%
SBIN 3.32% 1002.15 17.39% 0.00%
SIEMENS 0.97% 1180.07 0.00% 3.66%
SUNPHARMA 0.95% 901.55 15.32% 0.00%
SUZLON 1.90% 1366.25 0.00% 5.93%
TATAPOWER 0.56% 585.55 5.08% 0.00%
RCOM 4.88% 335.85 29.98% 0.00%
TATAMOTORS 1.76% 986.25 0.00% 5.94%
TCS 6.05% 1010.85 30.13% 0.00%
TATASTEEL 1.42% 668.1 0.00% 23.65%
VSNL 0.61% 479.95 2.22% 0.00%
WIPRO 4.41% 542.6 20.03% 0.00%
ZEETELE 0.64% 227.59 43.55% 0.00%
100.00% 21.91% 13.83%
It was amazing to notice that, on January 25, 2007, out of 50 scripts, it was 25
(exactly 50%), which had closed better than its position on 10th May 2006. With a split of
50:50 the bull phase, as projected by media, was under severe doubt. Amongst index based
scripts, if 50% would fall and 50% record rise, it becomes almost impossible to vouch for a
very rosy picture about the market.
The best part of above statistics was that while recording a 50:50 split between sunny
and gloomy, scripts which appreciated were those enjoying higher weightage for NIFTY
calculation. Rests were mostly having lesser presence in index calculation. If scripts
appreciated, the appreciations were of magical proportions like: Bharti Airtel by72.86%,
ICICI Bank by 50%, INFOSYS by 37.44%, Reliance 17% to name a few. With bulk of the
weightage (65.97%) favoring the ones rising, NIFTY was bound to dazzle. 25 scripts which
declined in value, could truly not raise much ripple as they mastered a total presence of only
34.03% in the weightage for NIFTY computation. Average weightage enjoyed by each script
that appreciated was 2.64% while the same for those declining was 1.36% only. When market
growth instead of being spontaneous happens to be so selective, normal market interaction
cannot be the prime mover. Presence of external influence is unquestionable, irrespective of
whether the same is being acceded or not.
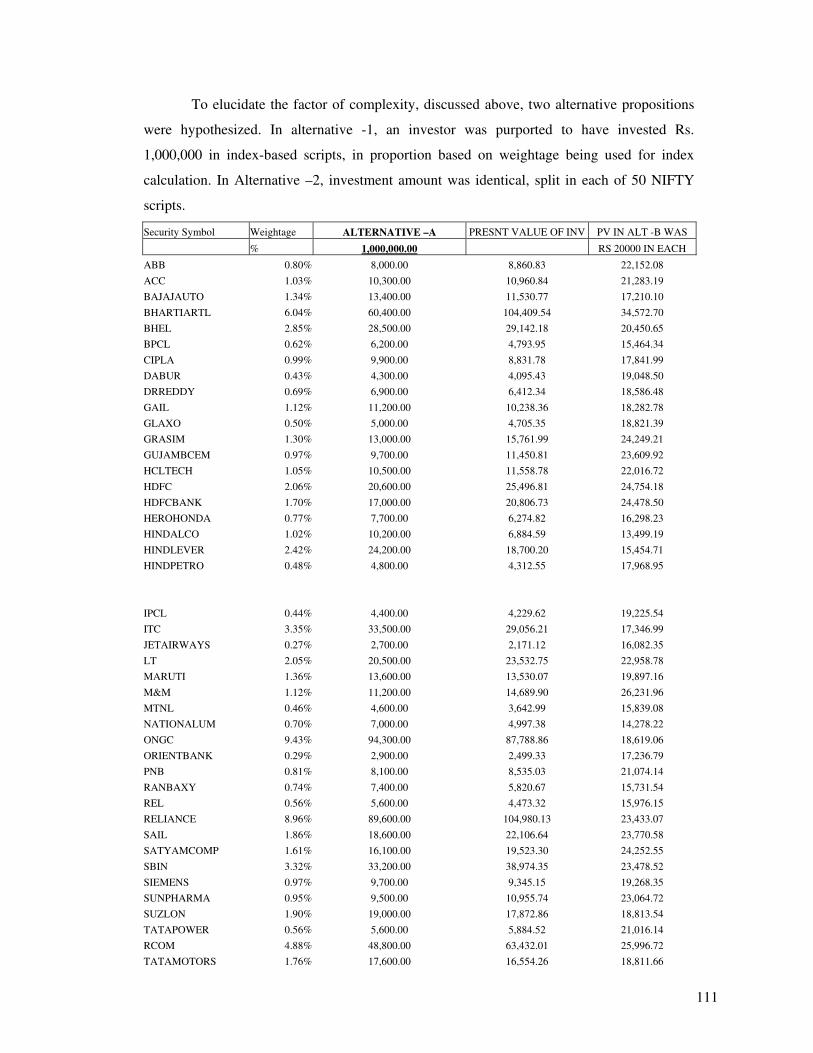
111
To elucidate the factor of complexity, discussed above, two alternative propositions
were hypothesized. In alternative -1, an investor was purported to have invested Rs.
1,000,000 in index-based scripts, in proportion based on weightage being used for index
calculation. In Alternative –2, investment amount was identical, split in each of 50 NIFTY
scripts.
Security Symbol Weightage ALTERNATIVE –A PRESNT VALUE OF INV PV IN ALT -B WAS
% 1,000,000.00 RS 20000 IN EACH
ABB 0.80% 8,000.00 8,860.83 22,152.08
ACC 1.03% 10,300.00 10,960.84 21,283.19
BAJAJAUTO 1.34% 13,400.00 11,530.77 17,210.10
BHARTIARTL 6.04% 60,400.00 104,409.54 34,572.70
BHEL 2.85% 28,500.00 29,142.18 20,450.65
BPCL 0.62% 6,200.00 4,793.95 15,464.34
CIPLA 0.99% 9,900.00 8,831.78 17,841.99
DABUR 0.43% 4,300.00 4,095.43 19,048.50
DRREDDY 0.69% 6,900.00 6,412.34 18,586.48
GAIL 1.12% 11,200.00 10,238.36 18,282.78
GLAXO 0.50% 5,000.00 4,705.35 18,821.39
GRASIM 1.30% 13,000.00 15,761.99 24,249.21
GUJAMBCEM 0.97% 9,700.00 11,450.81 23,609.92
HCLTECH 1.05% 10,500.00 11,558.78 22,016.72
HDFC 2.06% 20,600.00 25,496.81 24,754.18
HDFCBANK 1.70% 17,000.00 20,806.73 24,478.50
HEROHONDA 0.77% 7,700.00 6,274.82 16,298.23
HINDALCO 1.02% 10,200.00 6,884.59 13,499.19
HINDLEVER 2.42% 24,200.00 18,700.20 15,454.71
HINDPETRO 0.48% 4,800.00 4,312.55 17,968.95
IPCL 0.44% 4,400.00 4,229.62 19,225.54
ITC 3.35% 33,500.00 29,056.21 17,346.99
JETAIRWAYS 0.27% 2,700.00 2,171.12 16,082.35
LT 2.05% 20,500.00 23,532.75 22,958.78
MARUTI 1.36% 13,600.00 13,530.07 19,897.16
M&M 1.12% 11,200.00 14,689.90 26,231.96
MTNL 0.46% 4,600.00 3,642.99 15,839.08
NATIONALUM 0.70% 7,000.00 4,997.38 14,278.22
ONGC 9.43% 94,300.00 87,788.86 18,619.06
ORIENTBANK 0.29% 2,900.00 2,499.33 17,236.79
PNB 0.81% 8,100.00 8,535.03 21,074.14
RANBAXY 0.74% 7,400.00 5,820.67 15,731.54
REL 0.56% 5,600.00 4,473.32 15,976.15
RELIANCE 8.96% 89,600.00 104,980.13 23,433.07
SAIL 1.86% 18,600.00 22,106.64 23,770.58
SATYAMCOMP 1.61% 16,100.00 19,523.30 24,252.55
SBIN 3.32% 33,200.00 38,974.35 23,478.52
SIEMENS 0.97% 9,700.00 9,345.15 19,268.35
SUNPHARMA 0.95% 9,500.00 10,955.74 23,064.72
SUZLON 1.90% 19,000.00 17,872.86 18,813.54
TATAPOWER 0.56% 5,600.00 5,884.52 21,016.14
RCOM 4.88% 48,800.00 63,432.01 25,996.72
TATAMOTORS 1.76% 17,600.00 16,554.26 18,811.66
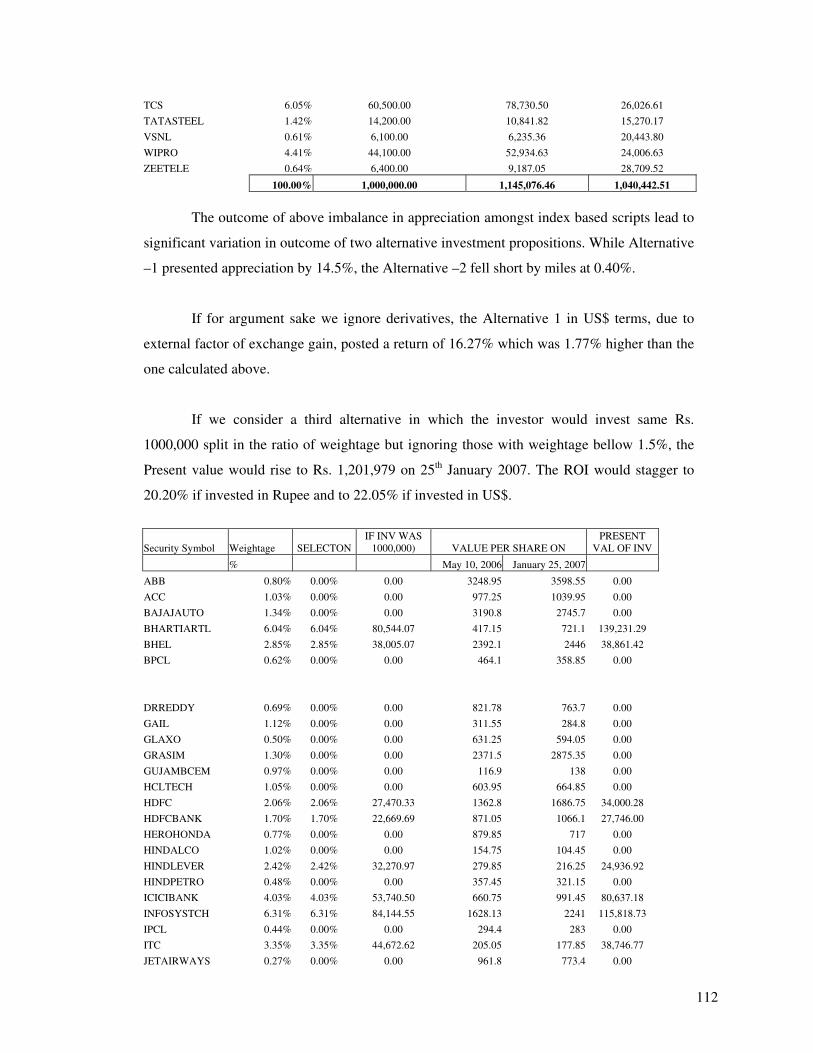
112
TCS 6.05% 60,500.00 78,730.50 26,026.61
TATASTEEL 1.42% 14,200.00 10,841.82 15,270.17
VSNL 0.61% 6,100.00 6,235.36 20,443.80
WIPRO 4.41% 44,100.00 52,934.63 24,006.63
ZEETELE 0.64% 6,400.00 9,187.05 28,709.52
100.00% 1,000,000.00 1,145,076.46 1,040,442.51
The outcome of above imbalance in appreciation amongst index based scripts lead to
significant variation in outcome of two alternative investment propositions. While Alternative
–1 presented appreciation by 14.5%, the Alternative –2 fell short by miles at 0.40%.
If for argument sake we ignore derivatives, the Alternative 1 in US$ terms, due to
external factor of exchange gain, posted a return of 16.27% which was 1.77% higher than the
one calculated above.
If we consider a third alternative in which the investor would invest same Rs.
1000,000 split in the ratio of weightage but ignoring those with weightage bellow 1.5%, the
Present value would rise to Rs. 1,201,979 on 25th January 2007. The ROI would stagger to
20.20% if invested in Rupee and to 22.05% if invested in US$.
Security Symbol Weightage SELECTON IF INV WAS
1000,000) VALUE PER SHARE ON PRESENT
VAL OF INV
% May 10, 2006 January 25, 2007
ABB 0.80% 0.00% 0.00 3248.95 3598.55 0.00
ACC 1.03% 0.00% 0.00 977.25 1039.95 0.00
BAJAJAUTO 1.34% 0.00% 0.00 3190.8 2745.7 0.00
BHARTIARTL 6.04% 6.04% 80,544.07 417.15 721.1 139,231.29
BHEL 2.85% 2.85% 38,005.07 2392.1 2446 38,861.42
BPCL 0.62% 0.00% 0.00 464.1 358.85 0.00
DRREDDY 0.69% 0.00% 0.00 821.78 763.7 0.00
GAIL 1.12% 0.00% 0.00 311.55 284.8 0.00
GLAXO 0.50% 0.00% 0.00 631.25 594.05 0.00
GRASIM 1.30% 0.00% 0.00 2371.5 2875.35 0.00
GUJAMBCEM 0.97% 0.00% 0.00 116.9 138 0.00
HCLTECH 1.05% 0.00% 0.00 603.95 664.85 0.00
HDFC 2.06% 2.06% 27,470.33 1362.8 1686.75 34,000.28
HDFCBANK 1.70% 1.70% 22,669.69 871.05 1066.1 27,746.00
HEROHONDA 0.77% 0.00% 0.00 879.85 717 0.00
HINDALCO 1.02% 0.00% 0.00 154.75 104.45 0.00
HINDLEVER 2.42% 2.42% 32,270.97 279.85 216.25 24,936.92
HINDPETRO 0.48% 0.00% 0.00 357.45 321.15 0.00
ICICIBANK 4.03% 4.03% 53,740.50 660.75 991.45 80,637.18
INFOSYSTCH 6.31% 6.31% 84,144.55 1628.13 2241 115,818.73
IPCL 0.44% 0.00% 0.00 294.4 283 0.00
ITC 3.35% 3.35% 44,672.62 205.05 177.85 38,746.77
JETAIRWAYS 0.27% 0.00% 0.00 961.8 773.4 0.00
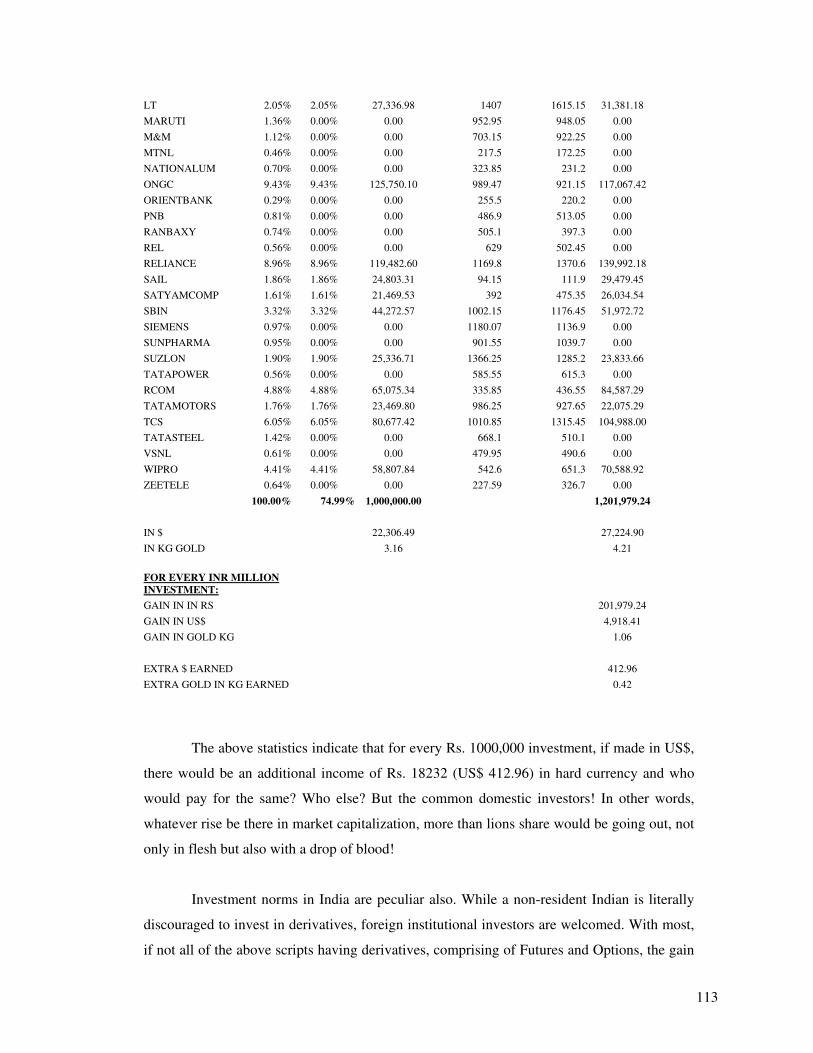
113
LT 2.05% 2.05% 27,336.98 1407 1615.15 31,381.18
MARUTI 1.36% 0.00% 0.00 952.95 948.05 0.00
M&M 1.12% 0.00% 0.00 703.15 922.25 0.00
MTNL 0.46% 0.00% 0.00 217.5 172.25 0.00
NATIONALUM 0.70% 0.00% 0.00 323.85 231.2 0.00
ONGC 9.43% 9.43% 125,750.10 989.47 921.15 117,067.42
ORIENTBANK 0.29% 0.00% 0.00 255.5 220.2 0.00
PNB 0.81% 0.00% 0.00 486.9 513.05 0.00
RANBAXY 0.74% 0.00% 0.00 505.1 397.3 0.00
REL 0.56% 0.00% 0.00 629 502.45 0.00
RELIANCE 8.96% 8.96% 119,482.60 1169.8 1370.6 139,992.18
SAIL 1.86% 1.86% 24,803.31 94.15 111.9 29,479.45
SATYAMCOMP 1.61% 1.61% 21,469.53 392 475.35 26,034.54
SBIN 3.32% 3.32% 44,272.57 1002.15 1176.45 51,972.72
SIEMENS 0.97% 0.00% 0.00 1180.07 1136.9 0.00
SUNPHARMA 0.95% 0.00% 0.00 901.55 1039.7 0.00
SUZLON 1.90% 1.90% 25,336.71 1366.25 1285.2 23,833.66
TATAPOWER 0.56% 0.00% 0.00 585.55 615.3 0.00
RCOM 4.88% 4.88% 65,075.34 335.85 436.55 84,587.29
TATAMOTORS 1.76% 1.76% 23,469.80 986.25 927.65 22,075.29
TCS 6.05% 6.05% 80,677.42 1010.85 1315.45 104,988.00
TATASTEEL 1.42% 0.00% 0.00 668.1 510.1 0.00
VSNL 0.61% 0.00% 0.00 479.95 490.6 0.00
WIPRO 4.41% 4.41% 58,807.84 542.6 651.3 70,588.92
ZEETELE 0.64% 0.00% 0.00 227.59 326.7 0.00
100.00% 74.99% 1,000,000.00 1,201,979.24
IN $ 22,306.49 27,224.90
IN KG GOLD 3.16 4.21
FOR EVERY INR MILLION INVESTMENT:
GAIN IN IN RS 201,979.24
GAIN IN US$ 4,918.41
GAIN IN GOLD KG 1.06
EXTRA $ EARNED 412.96
EXTRA GOLD IN KG EARNED 0.42
The above statistics indicate that for every Rs. 1000,000 investment, if made in US$,
there would be an additional income of Rs. 18232 (US$ 412.96) in hard currency and who
would pay for the same? Who else? But the common domestic investors! In other words,
whatever rise be there in market capitalization, more than lions share would be going out, not
only in flesh but also with a drop of blood!
Investment norms in India are peculiar also. While a non-resident Indian is literally
discouraged to invest in derivatives, foreign institutional investors are welcomed. With most,
if not all of the above scripts having derivatives, comprising of Futures and Options, the gain
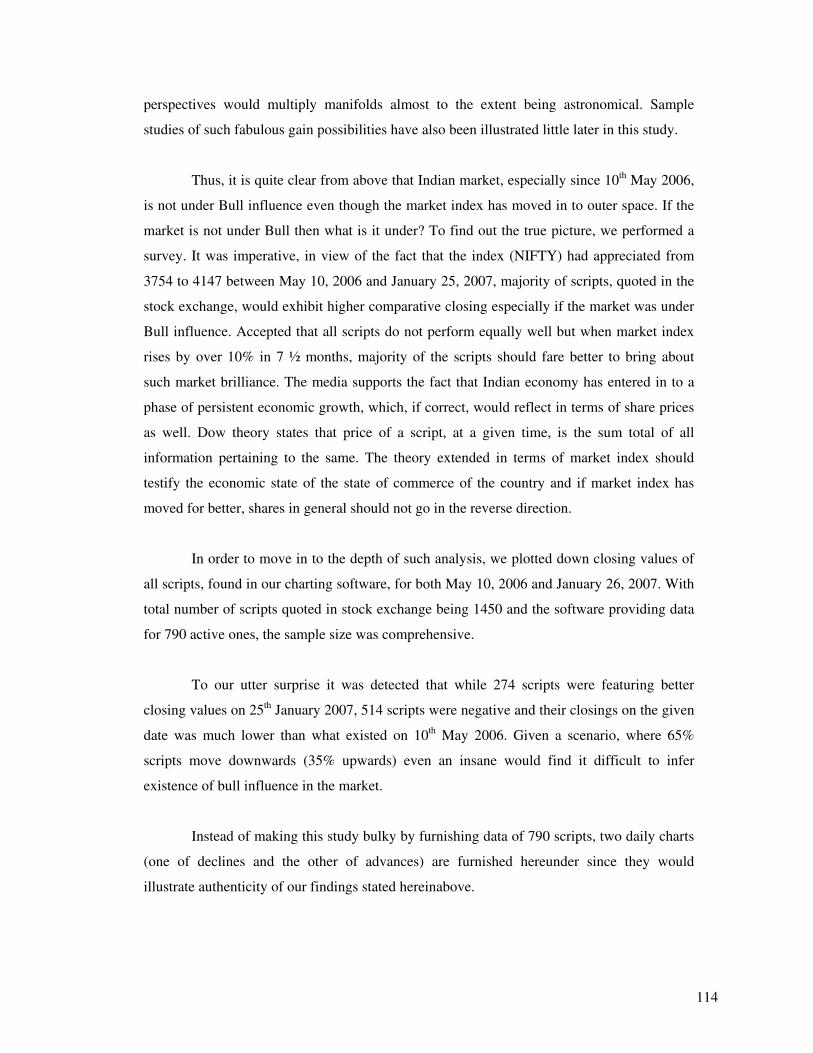
114
perspectives would multiply manifolds almost to the extent being astronomical. Sample
studies of such fabulous gain possibilities have also been illustrated little later in this study.
Thus, it is quite clear from above that Indian market, especially since 10th May 2006,
is not under Bull influence even though the market index has moved in to outer space. If the
market is not under Bull then what is it under? To find out the true picture, we performed a
survey. It was imperative, in view of the fact that the index (NIFTY) had appreciated from
3754 to 4147 between May 10, 2006 and January 25, 2007, majority of scripts, quoted in the
stock exchange, would exhibit higher comparative closing especially if the market was under
Bull influence. Accepted that all scripts do not perform equally well but when market index
rises by over 10% in 7 ½ months, majority of the scripts should fare better to bring about
such market brilliance. The media supports the fact that Indian economy has entered in to a
phase of persistent economic growth, which, if correct, would reflect in terms of share prices
as well. Dow theory states that price of a script, at a given time, is the sum total of all
information pertaining to the same. The theory extended in terms of market index should
testify the economic state of the state of commerce of the country and if market index has
moved for better, shares in general should not go in the reverse direction.
In order to move in to the depth of such analysis, we plotted down closing values of
all scripts, found in our charting software, for both May 10, 2006 and January 26, 2007. With
total number of scripts quoted in stock exchange being 1450 and the software providing data
for 790 active ones, the sample size was comprehensive.
To our utter surprise it was detected that while 274 scripts were featuring better
closing values on 25th January 2007, 514 scripts were negative and their closings on the given
date was much lower than what existed on 10th May 2006. Given a scenario, where 65%
scripts move downwards (35% upwards) even an insane would find it difficult to infer
existence of bull influence in the market.
Instead of making this study bulky by furnishing data of 790 scripts, two daily charts
(one of declines and the other of advances) are furnished hereunder since they would
illustrate authenticity of our findings stated hereinabove.
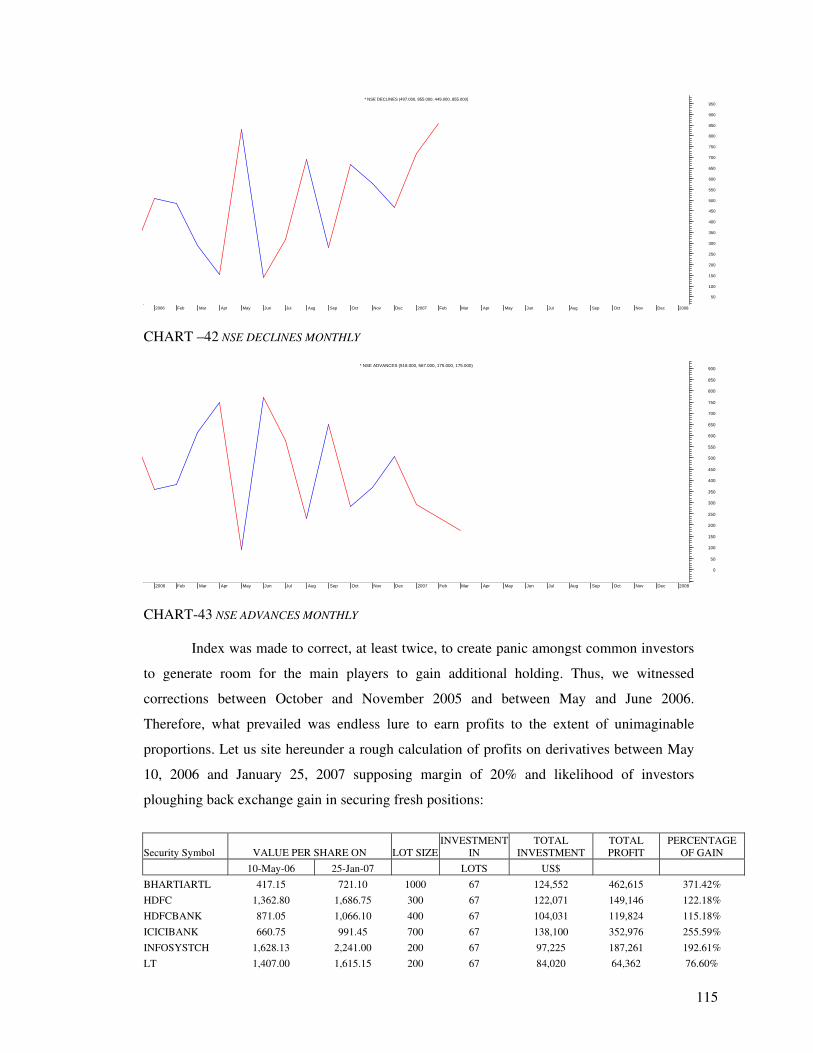
115
2006 Feb Mar Apr May Jun Jul Aug Sep Oct Nov Dec 2007 Feb Mar Apr May Jun Jul Aug Sep Oct Nov Dec 2008
50
100
150
200
250
300
350
400
450
500
550
600
650
700
750
800
850
900
950* NSE DECLINES (497.000, 855.000, 449.000, 855.000)
CHART –42 NSE DECLINES MONTHLY
2006 Feb Mar Apr May Jun Jul Aug Sep Oct Nov Dec 2007 Feb Mar Apr May Jun Jul Aug Sep Oct Nov Dec 2008
0
50
100
150
200
250
300
350
400
450
500
550
600
650
700
750
800
850
900* NSE ADVANCES (518.000, 567.000, 175.000, 175.000)
CHART-43 NSE ADVANCES MONTHLY
Index was made to correct, at least twice, to create panic amongst common investors
to generate room for the main players to gain additional holding. Thus, we witnessed
corrections between October and November 2005 and between May and June 2006.
Therefore, what prevailed was endless lure to earn profits to the extent of unimaginable
proportions. Let us site hereunder a rough calculation of profits on derivatives between May
10, 2006 and January 25, 2007 supposing margin of 20% and likelihood of investors
ploughing back exchange gain in securing fresh positions:
Security Symbol VALUE PER SHARE ON LOT SIZE INVESTMENT
IN TOTAL
INVESTMENT TOTAL PROFIT
PERCENTAGE OF GAIN
10-May-06 25-Jan-07 LOTS US$
BHARTIARTL 417.15 721.10 1000 67 124,552 462,615 371.42%
HDFC 1,362.80 1,686.75 300 67 122,071 149,146 122.18%
HDFCBANK 871.05 1,066.10 400 67 104,031 119,824 115.18%
ICICIBANK 660.75 991.45 700 67 138,100 352,976 255.59%
INFOSYSTCH 1,628.13 2,241.00 200 67 97,225 187,261 192.61%
LT 1,407.00 1,615.15 200 67 84,020 64,362 76.60%
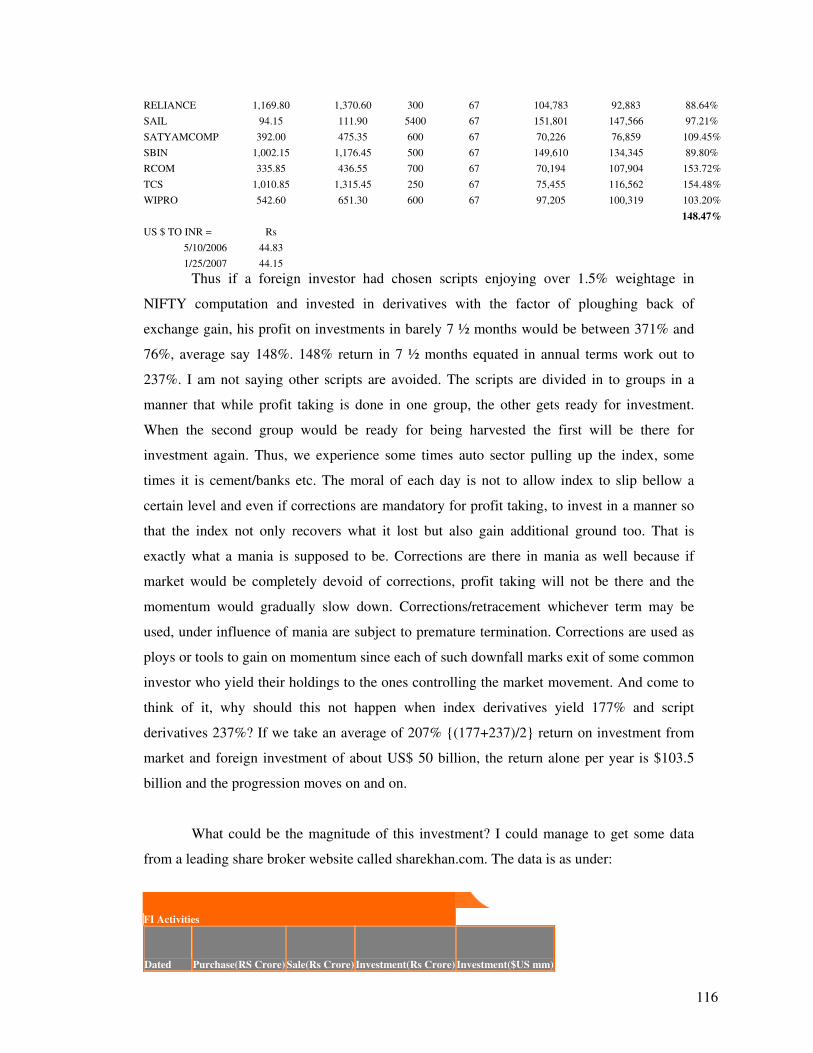
116
RELIANCE 1,169.80 1,370.60 300 67 104,783 92,883 88.64%
SAIL 94.15 111.90 5400 67 151,801 147,566 97.21%
SATYAMCOMP 392.00 475.35 600 67 70,226 76,859 109.45%
SBIN 1,002.15 1,176.45 500 67 149,610 134,345 89.80%
RCOM 335.85 436.55 700 67 70,194 107,904 153.72%
TCS 1,010.85 1,315.45 250 67 75,455 116,562 154.48%
WIPRO 542.60 651.30 600 67 97,205 100,319 103.20%
148.47%
US $ TO INR = Rs
5/10/2006 44.83
1/25/2007 44.15
Thus if a foreign investor had chosen scripts enjoying over 1.5% weightage in
NIFTY computation and invested in derivatives with the factor of ploughing back of
exchange gain, his profit on investments in barely 7 ½ months would be between 371% and
76%, average say 148%. 148% return in 7 ½ months equated in annual terms work out to
237%. I am not saying other scripts are avoided. The scripts are divided in to groups in a
manner that while profit taking is done in one group, the other gets ready for investment.
When the second group would be ready for being harvested the first will be there for
investment again. Thus, we experience some times auto sector pulling up the index, some
times it is cement/banks etc. The moral of each day is not to allow index to slip bellow a
certain level and even if corrections are mandatory for profit taking, to invest in a manner so
that the index not only recovers what it lost but also gain additional ground too. That is
exactly what a mania is supposed to be. Corrections are there in mania as well because if
market would be completely devoid of corrections, profit taking will not be there and the
momentum would gradually slow down. Corrections/retracement whichever term may be
used, under influence of mania are subject to premature termination. Corrections are used as
ploys or tools to gain on momentum since each of such downfall marks exit of some common
investor who yield their holdings to the ones controlling the market movement. And come to
think of it, why should this not happen when index derivatives yield 177% and script
derivatives 237%? If we take an average of 207% {(177+237)/2} return on investment from
market and foreign investment of about US$ 50 billion, the return alone per year is $103.5
billion and the progression moves on and on.
What could be the magnitude of this investment? I could manage to get some data
from a leading share broker website called sharekhan.com. The data is as under:
FI Activities
Dated Purchase(RS Crore) Sale(Rs Crore) Investment(Rs Crore) Investment($US mm)
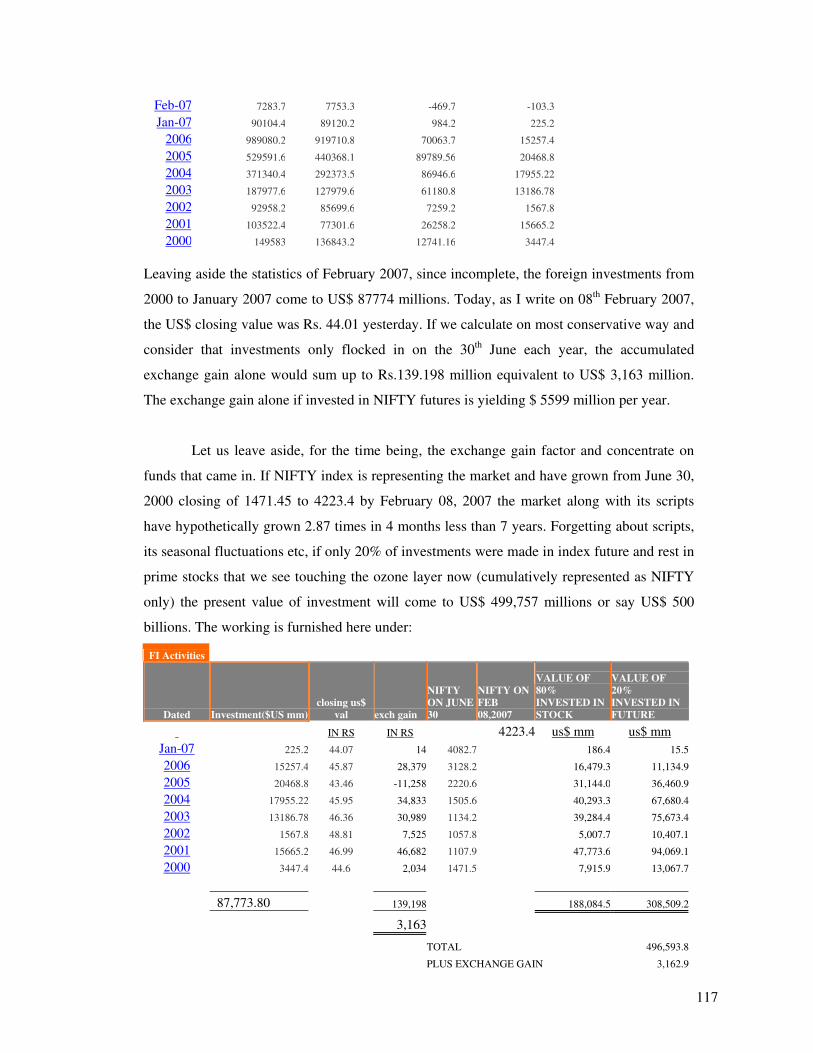
117
Feb-07 7283.7 7753.3 -469.7 -103.3
Jan-07 90104.4 89120.2 984.2 225.2
2006 989080.2 919710.8 70063.7 15257.4
2005 529591.6 440368.1 89789.56 20468.8
2004 371340.4 292373.5 86946.6 17955.22
2003 187977.6 127979.6 61180.8 13186.78
2002 92958.2 85699.6 7259.2 1567.8
2001 103522.4 77301.6 26258.2 15665.2
2000 149583 136843.2 12741.16 3447.4
Leaving aside the statistics of February 2007, since incomplete, the foreign investments from
2000 to January 2007 come to US$ 87774 millions. Today, as I write on 08th February 2007,
the US$ closing value was Rs. 44.01 yesterday. If we calculate on most conservative way and
consider that investments only flocked in on the 30th June each year, the accumulated
exchange gain alone would sum up to Rs.139.198 million equivalent to US$ 3,163 million.
The exchange gain alone if invested in NIFTY futures is yielding $ 5599 million per year.
Let us leave aside, for the time being, the exchange gain factor and concentrate on
funds that came in. If NIFTY index is representing the market and have grown from June 30,
2000 closing of 1471.45 to 4223.4 by February 08, 2007 the market along with its scripts
have hypothetically grown 2.87 times in 4 months less than 7 years. Forgetting about scripts,
its seasonal fluctuations etc, if only 20% of investments were made in index future and rest in
prime stocks that we see touching the ozone layer now (cumulatively represented as NIFTY
only) the present value of investment will come to US$ 499,757 millions or say US$ 500
billions. The working is furnished here under:
FI Activities
Dated Investment($US mm) closing us$
val exch gain
NIFTY ON JUNE 30
NIFTY ON FEB 08,2007
VALUE OF 80% INVESTED IN STOCK
VALUE OF 20% INVESTED IN FUTURE
IN RS IN RS 4223.4 us$ mm us$ mm
Jan-07 225.2 44.07 14 4082.7 186.4 15.5
2006 15257.4 45.87 28,379 3128.2 16,479.3 11,134.9
2005 20468.8 43.46 -11,258 2220.6 31,144.0 36,460.9
2004 17955.22 45.95 34,833 1505.6 40,293.3 67,680.4
2003 13186.78 46.36 30,989 1134.2 39,284.4 75,673.4
2002 1567.8 48.81 7,525 1057.8 5,007.7 10,407.1
2001 15665.2 46.99 46,682 1107.9 47,773.6 94,069.1
2000 3447.4 44.6 2,034 1471.5 7,915.9 13,067.7
87,773.80 139,198 188,084.5 308,509.2
3,163
TOTAL 496,593.8
PLUS EXCHANGE GAIN 3,162.9
118
US$ to Indian Rupee on February 08,2007=44.01 499,756.6
The above calculation is possibly most conservative, as it does not take in to account
surplus out of investment of exchange gains. Another vital point drastically rationalized is
possibility of investment in derivatives to the extent of 20% only and taking no exposure in
options which, if taken in to account would certainly push the value of investment above $
1000 billions. We have also ignored the possibility of reinvestment of gains that would grow
much faster than the original under multiplier effect. Thus the sum of $ 499.75 billions is
only indicative. The actual could be multiples thereof. Even if we move with $ 499.75
billions amassed in 7 years time the income generation per year comes to US$ 71.39 billions:
a figure which could possibly be exceeding the 5 year budget allocation of Indian
Government. Not to forget here that this huge sum of US$ 499.75 billions have grown out of
base investment of US$ 87.77 billions only. In other words, a poor country like India is
contributing $ 71.39 billions to developed countries in the world and to add insult to injury
adding the sum while calculating GDP for the Nation.
Even if the above study solely concern Indian capital market, it certainly tells us one
thing that index multiplication factor does not necessarily signify fund appreciation
potentiality. Market mechanism, instruments, derivatives etc allow investors to earn at a
pace much higher than the rate at which the index increases. If on a conservative estimate
US$ 87 billion can grow up to US$ 500 billion in India alone, the magnitude of sum that
could have accumulated now, in global perspective, could possibly be good enough to buy
World Bank even twice and thereafter to give it away on charity.
But why should investors withdraw from these markets? The investment that has grown
in geometric progression can still be retained. Why should they be withdrawn since the same
could be constantly ploughed back to appreciate more and more? The answer to the above
rests in the concept of mania itself. It is something like cancer where cells multiply in rapid
proportion and ultimately start rotting with blood not flowing in. Alike circumstances are
bound to develop some time or the other. It is us, common citizens who are feeding the
investors from our resources being canalized thorough either stock exchange or banks etc.
But one day the sources would also dry up like we see in USA now in terms of Housing
crisis, Sub prime crisis etc. Even if the income will generate, doubt may develop as to how
feasible it would be to realize the same in material terms. Furthermore, with volumes drying
119
up a situation arrives where there would be a handful of mutual funds and foreign investors
only to trade amongst themselves. The confidence, the hope, the hunger would then start
dwindling and exodus starts. Furthermore, economics teaches us that even utility factor too
diminish with supply of items offering utility. Thus, profit expectation too, has a maximum
limit, which like all other human factors, would be subject to universal ratios (Fibonacci
Ratios/numbers).
Let us look at NSE in India. The ratio of index gain between 14/06/2006 and 08/02/2007
was double of the ratio of fall during May/June 2006. Let us turn our attention to Table A,
furnished almost towards the beginning of this article. The ratio of gain is to loss in
perspective of the time frame; stated above, work out near exact to Fibonacci numbers 1, 2, 3,
5, 8 and 13. Presence of phi factor of 1.618 is seen in many places along with other Fibonacci
ratios like 0.146, 0.236, and 0.382.
In other words, the corrections we see happening in global terms since middle of
February 2007 is nothing abnormal. It remains to be seen whether this would grow deeper to
develop in to a recessive force or would wither out premature.
Here I am making an exception to the logic of disparity amongst markets worked out in
detail above. To herd is one of human’s basic natures. Tendency to herd, knowingly or
unknowingly, is prevalent amongst human since such habit generates out of our basic
instincts. This nature of herdship some times develops in to craze and also, at times, creates
panic too. Therefore, if DJIA will fall one day by 240 points, NIKKEI may slide by 500
points even. Should Brazil Bovespa appreciate by 5%, we may see Indian NIFTY too
corresponding with 3.50% jump.
Then where do we land? All markets crashing together makes a mincemeat of divergent
market movements detected above. Sincerely speaking, it does not. Perspective or relevance
of decline in one exchange may radically differ with another. Furthermore, even the extent of
correction may vary. Let us refer to TABLE –A again and compare the extent of correction
between exchanges. We find some correcting by more than 30% while the dent was mere
10% or less in cases of some. The correction was global yet the extent of virulence varied
from nation to nation, from exchange to exchange. Furthermore, all markets are not in
identical status in terms of Wave position. Thus, while for countries like Japan, Germany etc
the correction might transpire to be formation of 2nd or 4th Wave in the upward cycle, for
120
countries like USA, India it could be either Wave A or Wave C down. Therefore, calling the
present decline to be developing in to a global depression will be wrong.
Depression/deflation is happening but the tentacles will not entangle the whole world.
Some countries will remain out of it, at least for the time being.
One more question comes up here. The wave study I made, hereinabove, indicate a
number of countries heading towards final declining phase of Wave C. If such were the event,
is it not imperative, that the correction will be a temporary affair since a new upward cycle
can develop on completion of Wave C.
Theoretically, yes but practically no. Since my entire wave study were based on monthly
charts. What we see as mania formation during Wave B would transform in to extended 5th
wave if plotted in terms of yearly charts. Thus, existence of mania remaining constant,
relevant positioning in terms of Wave classification would vary radically and therefore,
almost in every case of mania, a full three wave cycle of decline will happen and going by
Benner Theory, this would take about 18 years to complete.
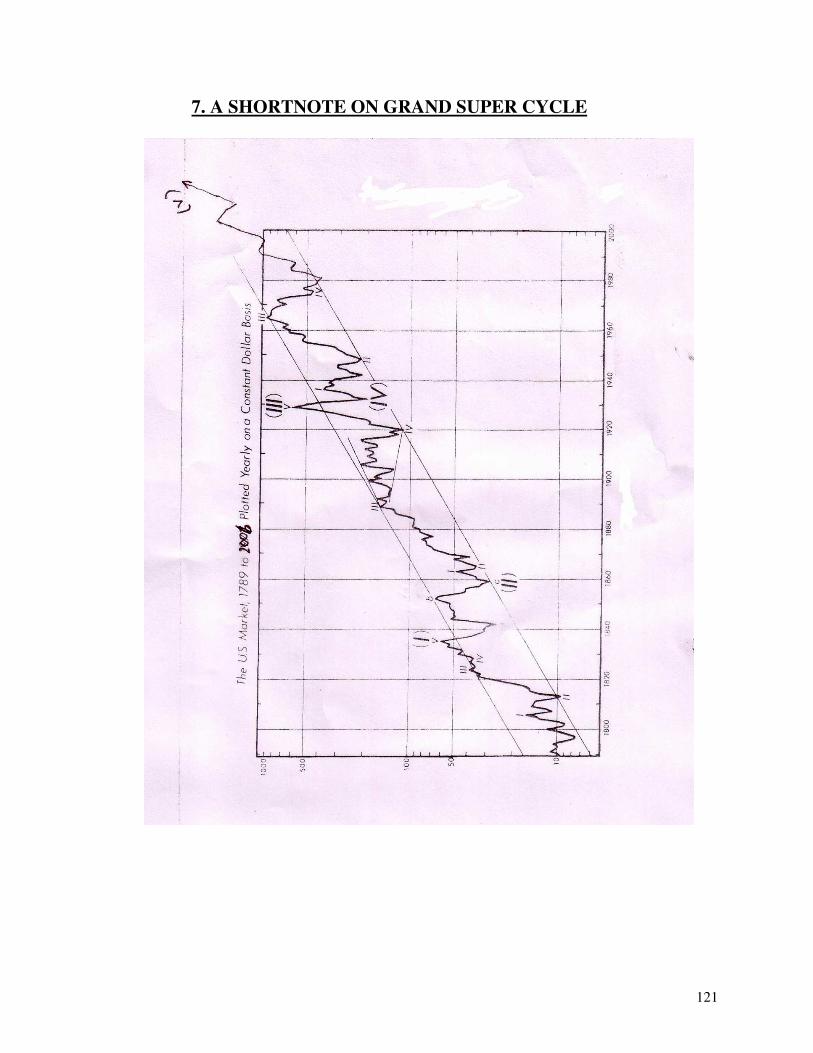
121
7. A SHORTNOTE ON GRAND SUPER CYCLE
122
Since I have time and time again referred to the Grand Super Cycle and shall be
doing so many times later in this book, it becomes a duty on my part to briefly elucidate the
basic character of this cycle to the reader.
Paucity of old data relating to most part of the world leaves me with no choice but to
take USA as the base economy representing the world market. This assumption may not seem
agreeable to many since there had been other economies in the world, like Great Britain,
Dutch, Spain etc which used to be more prominent than USA not so long ago. However, since
the long term price index compiled by Professor E.H. Phelps Brown and Sheila V Hopkins
and further enlarged by David Warsh in their path breaking publication “market basket of
human needs” serving data from 950AD to 1954, could somehow be obtained, I have no
choice but to adopt US economy as the base. Furthermore, the above diagram is plotted based
on yearly terms on a constant Dollar basis. This assumption, too, will not seem fair to many
but considering the fact that we are dealing with a wave starting from 1789 (i.e. spanning 217
years till 2006) some errors of omission and compilation have got to be exempted.
This long wave has the right look of three waves in the direction of the main trend
and two against the trend for a total of five, complete with an extended third wave. In the
diagram, stated above, the Supercycle subdivisions have been marked (I), (II), (III), (IV) and
(V).
Considering that we are exploring market history back to the days of canal
companies, horse drawn barges and meager statistics, it is surprising that the record of
constant dollar industrial share prices, which was developed by Gertrude Shirk for Cycles
magazine, forms such a clear Elliot pattern. Especially striking is the trend channel, baseline
of which connects several important cycle and Supercycle wave lows and upper parallel of
which connects the peaks of several advancing waves.
Wave (I) was a fairly clear five, assuming 1789 to be the beginning of the
Supercycle. Wave (II) was a flat, which neatly predicted a zigzag or a triangle for Wave (IV),
by rule of alternation. Wave (III) was extended and can easily be subdivided in to the
necessary five sub waves, including an expanding triangle characteristically in the fourth
wave position. Wave (IV) from 1929 to 1932 terminated within the area of the fourth wave of
lesser degree.
123
An inspection of Wave (IV) in the diagram illustrates in greater detail the zigzag of
Supercycle dimension that marked the most devastating market collapse in US history. In
Wave A of the decline, daily charts show that the third sub wave, in characteristic fashion,
included the Wall Street Crash of October29, 1929. Wave A was then retraced approximately
50 percent by Wave B, the “famous upward correction of 1930,” as Richard Russel termed it,
during which Robert Rhea was led by emotional nature of the rally to cover his short
positions. Wave C finally bottomed at 41.22, a drop of 253 points or about 1.382 times the
length of Wave A. It completed an 89 (Fibonacci number) percent drop in stock prices in 3
(Fibonacci number) years.
It should be mentioned again that Elliot always interpreted 1928 as the orthodox top
of Wave (III), with the 1929 peak marking an irregular top. This inference of his may not be
correct, as the decline from 1929 to 1932 is a fine specimen of a 5-3-5 zigzag decline. Next,
for Wave (III) to have topped in 1928, Wave (IV) would have to assume a shape that is not
consistent with the right look for a 3-3-5 expanded flat correction. Under that interpretation,
Wave C is way out of proportion to the smaller A & B waves and terminates an
uncomfortably great distance bellow the low of Wave A. Another problem was the power of
the supposed B Wave, which remained well within the up trend channel, and terminated
through the upper trend line as a fifth wave often does. Ratio analysis of the Wave (IV) both
Elliot’s contention of an irregular top and the corrected interpretation of an orthodox top
since Wave C under Elliot’s analysis was 2.618 times as long as net decline of Wave A from
November 1928 to November 1929 and under the corrected analysis Wave C was 1.382
(0.382 is the inverse of 2.618) times as long as Wave A from September 1929 to November,
1929.
Wave (V) of the Grand Supercycle possibly ended around May 2006 or should be
nearing completion. It was imperative that since Wave (III) was an extension, Wave (V)
should be approximately equal to Wave (I) in terms of time magnitude which, did not happen
in true sense of the term. Wave (I) took about 50 years to complete and if Wave (V) were to
follow identical designs, it would have ended around 1982-83. As is seen from the diagram
above, if Wave (V) had ended around May 2006, it would have approximately lasted about
75 years that was 1.50 (3/2, with both 3 & 2 being Fibonacci numbers) times of Wave (I).
Going by the simple logic that with Wave (III), in the Grand Supercycle, being
extended, Wave (V) would not assume dynamic proportion beyond certain norms and that its
124
duration has been 1.5 times that of Wave (I), it is most likely that the Grand Supercycle ended
around May 2006. The phase of correction (Wave A) has started and has already yielded an
expanded flat correction since May 2006. Considering the fact that Wave (II) had taken
almost 30 years to complete, the present phase of decline, which will comprise of ABC
corrections, should continue for about same duration, as that would only conform to rule of
alteration stated above.
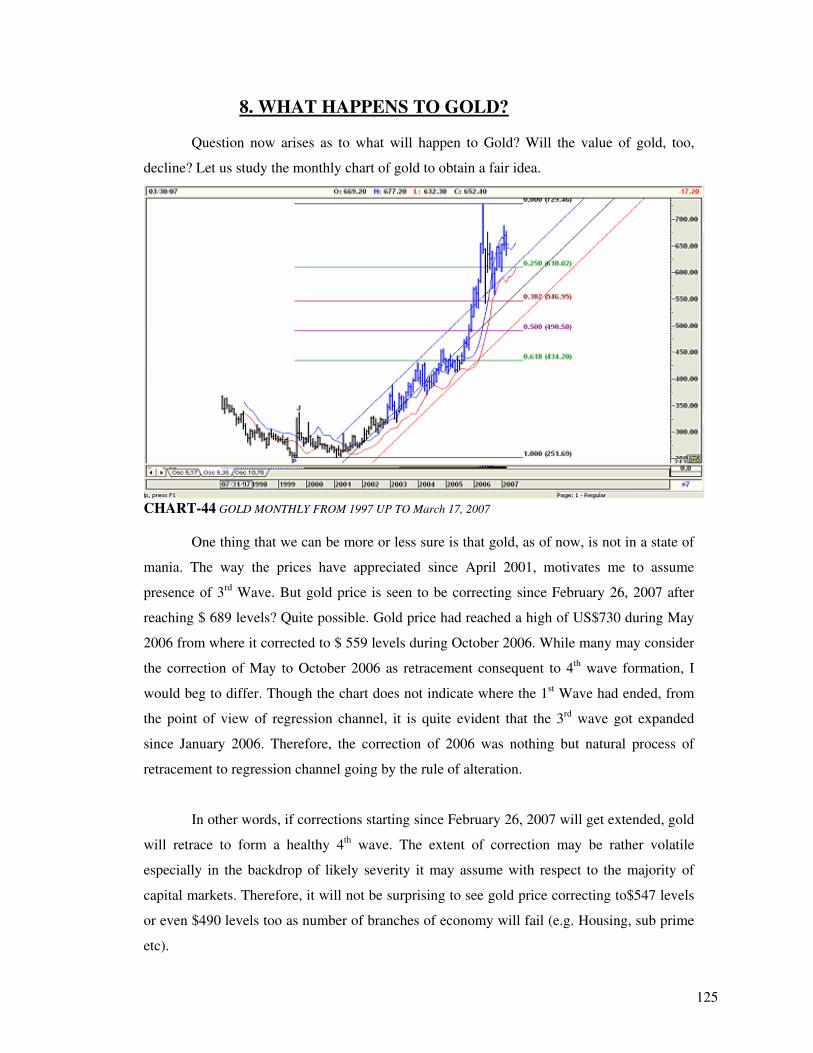
125
8. WHAT HAPPENS TO GOLD?
Question now arises as to what will happen to Gold? Will the value of gold, too,
decline? Let us study the monthly chart of gold to obtain a fair idea.
CHART-44 GOLD MONTHLY FROM 1997 UP TO March 17, 2007
One thing that we can be more or less sure is that gold, as of now, is not in a state of
mania. The way the prices have appreciated since April 2001, motivates me to assume
presence of 3rd Wave. But gold price is seen to be correcting since February 26, 2007 after
reaching $ 689 levels? Quite possible. Gold price had reached a high of US$730 during May
2006 from where it corrected to $ 559 levels during October 2006. While many may consider
the correction of May to October 2006 as retracement consequent to 4th wave formation, I
would beg to differ. Though the chart does not indicate where the 1st Wave had ended, from
the point of view of regression channel, it is quite evident that the 3rd wave got expanded
since January 2006. Therefore, the correction of 2006 was nothing but natural process of
retracement to regression channel going by the rule of alteration.
In other words, if corrections starting since February 26, 2007 will get extended, gold
will retrace to form a healthy 4th wave. The extent of correction may be rather volatile
especially in the backdrop of likely severity it may assume with respect to the majority of
capital markets. Therefore, it will not be surprising to see gold price correcting to$547 levels
or even $490 levels too as number of branches of economy will fail (e.g. Housing, sub prime
etc).
126
With people loosing faith in currencies, reliance on gold will increase. Majority will
attempt stocking in gold to let their savings acquire material substance. Moreover, the entire
proceeds of profit booking will not return to their origin as acquisition of gold will facilitate
that extra boost of prosperity to economies/countries who will stand to gain out of this
correction.
Thus even if the lions share of profit booking/ proceeds of disinvestments will
repatriate, the remaining portion along with money coming out of common men of
countries in a state of despair will make 5th Wave happen in terms of Gold price. Though it
is too premature, at this stage, to estimate likely altitude of gold price when 5th wave will
eventually mature, I am quite sure; it will not be anything less than US$ 850 or even $
1000.
Extension of 5th wave in gold price looks unlikely, as those assuming long position
during 4th wave would be prompted to book profits. The state of negativity or pessimism,
associated with deflation, will induce many to quit since state of panic will then be a part of
life for many countries. The countries flourishing too will sell gold to buy them back at
cheaper price but how far such objective will get factually accomplished, is a matter of wild
guess at this stage.
Before we come to final stages of 5th wave, how do I say that 4th wave will end at one
point and reverse its direction? Why should people loose faith in their own money? The
answer is simple. Gold was money and it still is. The currency we use is, after all, monopoly
money that is legalized and forced up on by local governments. The money we strive to earn
is the currency of the realm only because the state makes it mandatory for us to use and
makes other alternatives illegal.
Promissory notes issued by a state and declared the only legal tender are always
doomed to depreciate to worthlessness because of the natural incentives and forces associated
with governments. A state cannot resist a method of confiscating assets, particularly one that
is hidden from the view of most voters and subjects. By extension, it is unreasonable to
advocate a standard for such notes, which is simply a state’s promise that its currency will
always be redeemable in a specific amount of something valuable, such as gold. A gold
standard of this type is only as good as the political promise behind it, reducing its value to no
more than that of the paper. It could be argued, in fact, that a state-sponsored is far more
127
dangerous than none at all, as it induces citizens with false hope of security. Their long-range
plans are, therefore, built up on unreliable promise that the monetary measuring unit will
remain stable. Later, when the governments “IOU something specific” becomes “IOU-
nothing particular”, reliability disappears and the arbitrary reigns. Although the populace
tends to retain its confidence in the currency for a while thereafter, the ultimate result is
chaos.
The only sound monetary system is a voluntary one. The free market always chooses
the best possible form, or forms, of money. To date, the market’s choice through the
centuries, wherever a free market for money has existed, has been and remains precious
metals and currency redeemable in precious metal. This preference will undoubtedly remain
until a better form of money is discovered and chosen.
In other words, when industries collapse, commerce fails; state of chaos is bound to
drive citizens from converting their savings or whatever left, in terms of gold, as that would
offer some material worth and possibly elements of tangibility. And as investments start
flowing in to gold, a part of profit taking from markets would also flow in to this market. This
sudden rush of investments in precious metal would change the course of 4th wave and bring
about the fifth wave.
There is another way to look at the scenario that will bring about 5th wave in gold
prices. When markets fall on tremendous pressure of profit booking and bearish mood,
scramble for procuring currencies will increase many folds. Why? Governments in
countries facing the crisis will make desperate efforts to collect pending debts, as that will
help them in servicing their own debts being demanded upon. The increase in demand for
currency will push the value of currencies higher. It may be kept in mind here that the
countries to benefit out of this market crash will, too, realize their gains and disinvestments
proceeds in terms of local currencies only and if there will be a rush to repatriate, that
would not only bring about political unrest but will also reduce the value of local
currencies to a state of practically nothingness. In other words, exodus of investments
would happen but repatriation of proceeds, will be a gradual process.
When investors, attempt to take physical possession of their earnings, in cash, a huge
shortage of coinage is bound to erupt that will for a while, increase exchange value of these
currencies to higher levels. Most severe demand will develop for US$ as that, till date, has
128
been the base currency for most of the international transactions. I personally feel that a good
section of investors will opt for retaining their money converted in terms of US$ as that will
safeguard their wealth from sudden exchange fluctuation.
In short what I am trying to say is that, when price of gold falls, when markets all
around the world nosedive, Dollar rally must happen. The rally I apprehend will not be a
marginal one. It will increase Dollar’s exchange value against gold too. In other words,
gold prices will not fall as much out of profit booking as it will correct due to US$ gaining
against its value.
Just visualize the situation, gold price declining not due to liquidation of investments
but because value of a currency (US$) is shooting upwards. Possibly, FED will find the
situation conducive and lower their rates to re-energies the economy. FED’s action will
increase demand for $ more and gold prices will fall further.
Once gold price hits the circuit breaker (say) $540/$490 levels, the dollar in reserve
of investors will roll out and flow in to gold market. The fifth wave will begin. The moment
investment start moving in to gold, no matter what FED declares then, demand for Dollar
start tumbling down. Like the way, gold prices would fall without much sell of investments,
the prices here will start moving up at a pace higher than the rate of flow of investments.
Conversion from gold to currencies or origin will commence when 5th wave will be
in peak possibly above US$850 being the highest so far visualized in gold. The gold price
will too face corrections after it reaches its peak and in Wave A down, in matter of no time,
will scramble back to $540/$490 levels again.
HISTORY OF GOLD
By now I must be sounding truly confusing and my logic of gold prices jumping up
and down sounding like an excerpt out of any of Harry Potter movie. I feel an in sight about
the characteristics of gold price movements in past is mandatory. Unless we know as to how
gold prices behaved in past, how can we analyze the future convincingly?
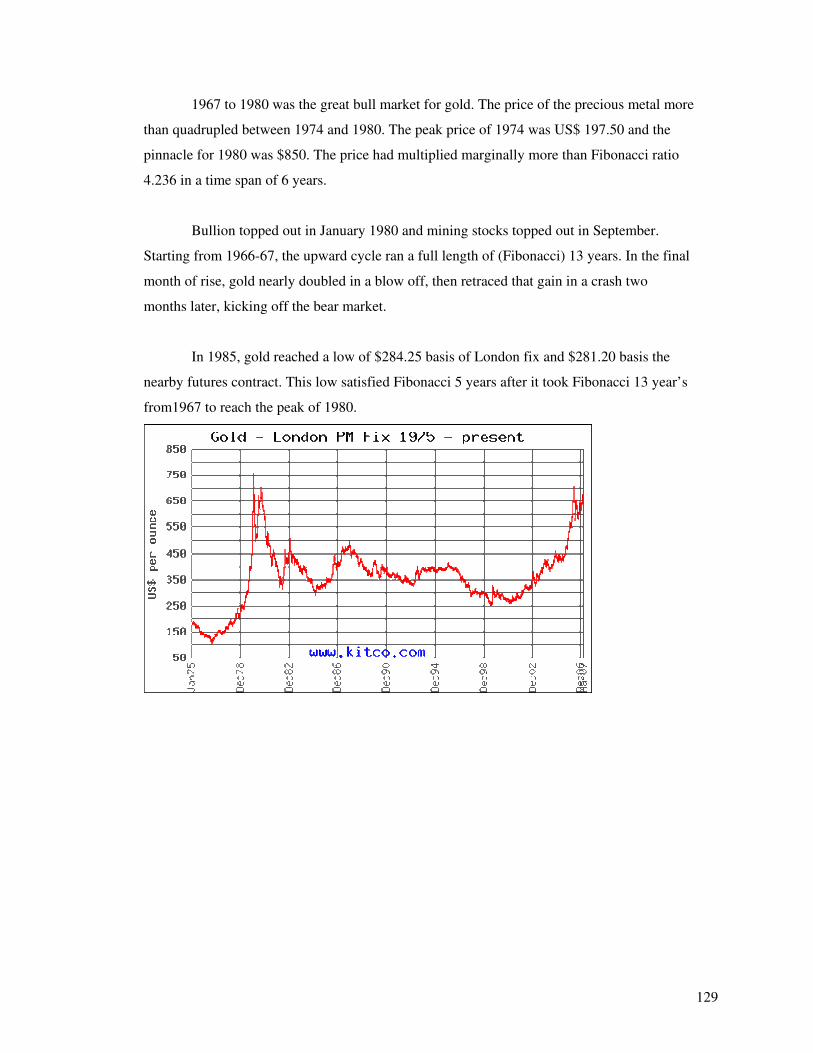
129
1967 to 1980 was the great bull market for gold. The price of the precious metal more
than quadrupled between 1974 and 1980. The peak price of 1974 was US$ 197.50 and the
pinnacle for 1980 was $850. The price had multiplied marginally more than Fibonacci ratio
4.236 in a time span of 6 years.
Bullion topped out in January 1980 and mining stocks topped out in September.
Starting from 1966-67, the upward cycle ran a full length of (Fibonacci) 13 years. In the final
month of rise, gold nearly doubled in a blow off, then retraced that gain in a crash two
months later, kicking off the bear market.
In 1985, gold reached a low of $284.25 basis of London fix and $281.20 basis the
nearby futures contract. This low satisfied Fibonacci 5 years after it took Fibonacci 13 year’s
from1967 to reach the peak of 1980.
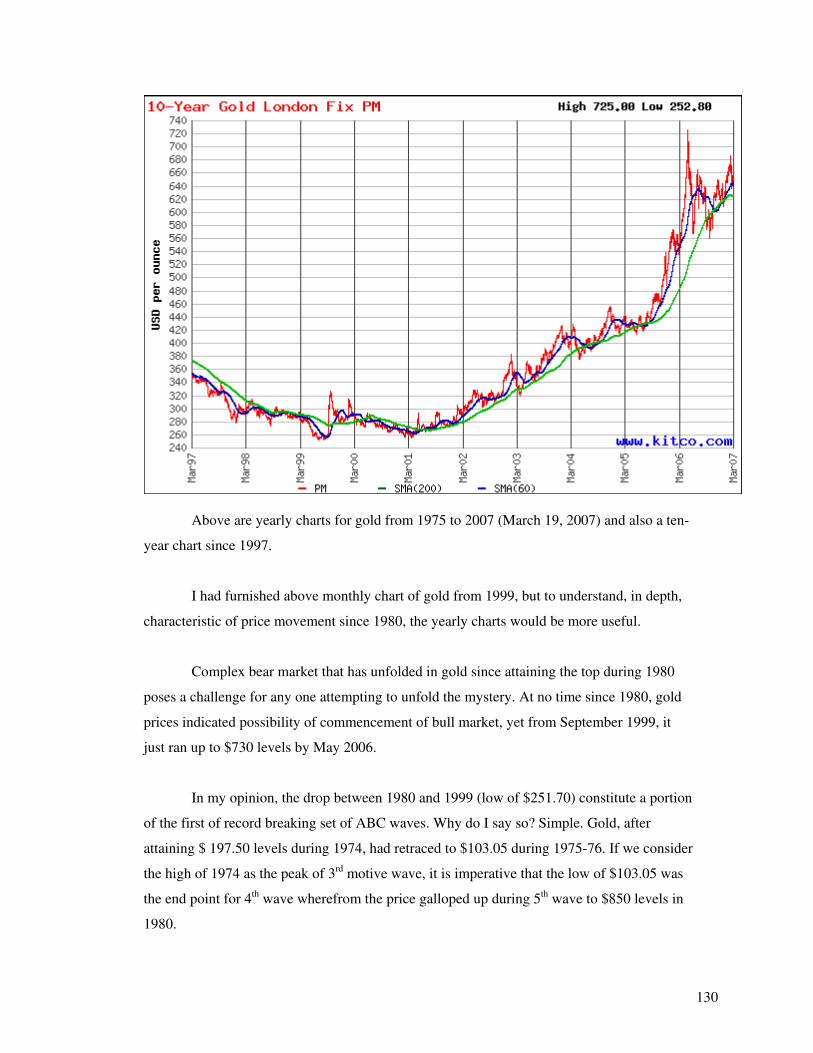
130
Above are yearly charts for gold from 1975 to 2007 (March 19, 2007) and also a ten-
year chart since 1997.
I had furnished above monthly chart of gold from 1999, but to understand, in depth,
characteristic of price movement since 1980, the yearly charts would be more useful.
Complex bear market that has unfolded in gold since attaining the top during 1980
poses a challenge for any one attempting to unfold the mystery. At no time since 1980, gold
prices indicated possibility of commencement of bull market, yet from September 1999, it
just ran up to $730 levels by May 2006.
In my opinion, the drop between 1980 and 1999 (low of $251.70) constitute a portion
of the first of record breaking set of ABC waves. Why do I say so? Simple. Gold, after
attaining $ 197.50 levels during 1974, had retraced to $103.05 during 1975-76. If we consider
the high of 1974 as the peak of 3rd motive wave, it is imperative that the low of $103.05 was
the end point for 4th wave wherefrom the price galloped up during 5th wave to $850 levels in
1980.
131
Retracement following completion of a five-wave cycle encompasses retracement,
minimum up to 4th wave level. In most cases, it is seen that in Wave A alone this level of
correction is achieved, with final C wave declining up to 2nd wave level or lower. Even if we
do not get in to such complications of performing autopsy of what wave we could be in, if an
upward cycle got completed in 1980, it is mandatory that there will be correction up to 4th
wave level or near about during the correcting phase.
During 1999, we had seen gold correcting up to $251 levels that was $53.50 above
the peak of 3rd wave. In other words, there is no way that bear phase could be over. The best
interpretation of wave status has been that the first phase of bear market ended in June 1982
from where gold began an intra-bear market recovery pattern enabling price to recover up to
$502.75 levels in 1987. From this level, gold took another Fibonacci 13 years to correct 50%
by August 1999.
If we consider the price correction between 1980 and 1999 as one broad Wave X, the
appreciation since 1999 (comprising of 5 sub waves), will constitute Wave Y with Wave Z
remaining to follow. No doubt XYZ will constitute an ABC correction but whether it will be
a zigzag or a flat or expanded flat, it is time that will determine the ultimate outcome.
If we shall have a zigzag, it is highly doubtful whether Gold will move above $ 730
levels again since that denotes 85% retracement (from $850). If it will be a flat $850 or near
about should be the limit. In the event of an expanded flat, gold price can move up to $1050
(1.236 times $850) to $1375 (1.618 times $850). It is most common in cases of complex
corrections, for the highs of motive waves being overtaken, hence even if gold will rise above
$850 levels, it will not imply presence of bullish tendency.
The Wave Z will be deadly since that will make price of gold crash to a level
between $ 197.50 and $103.05 or plunge lower.
26 years have already gone since 1980. With gold movement, time and time again,
showing tendency of adhering to Fibonacci ratios, numbers etc, the downward cycle can
enfold anything between 34 to 55 years to complete. In other words, it may be another 8 years
from now or19 years.

132
For me 19 years time seem more likely as that coincides with Fibonacci Benner cycle
which indicates 18 years of decline for most of the flourishing economies now.
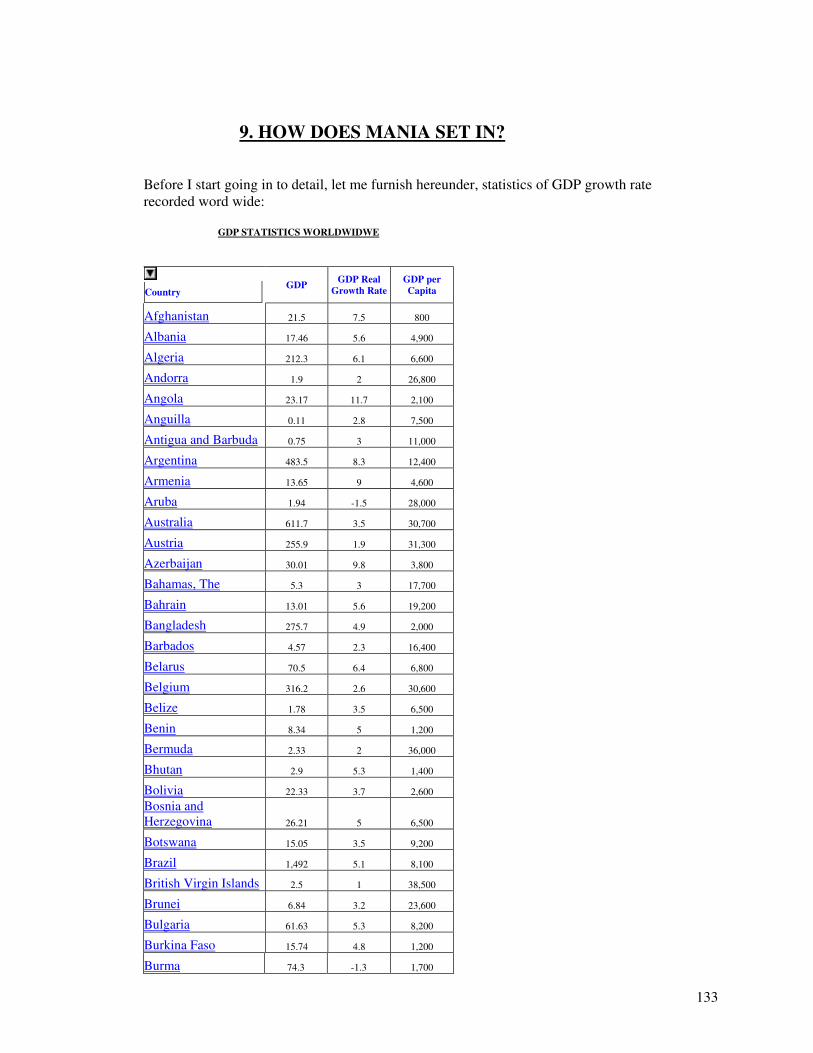
133
9. HOW DOES MANIA SET IN? Before I start going in to detail, let me furnish hereunder, statistics of GDP growth rate recorded word wide:
GDP STATISTICS WORLDWIDWE
Country
GDP GDP Real
Growth Rate GDP per Capita
Afghanistan 21.5 7.5 800
Albania 17.46 5.6 4,900
Algeria 212.3 6.1 6,600
Andorra 1.9 2 26,800
Angola 23.17 11.7 2,100
Anguilla 0.11 2.8 7,500
Antigua and Barbuda 0.75 3 11,000
Argentina 483.5 8.3 12,400
Armenia 13.65 9 4,600
Aruba 1.94 -1.5 28,000
Australia 611.7 3.5 30,700
Austria 255.9 1.9 31,300
Azerbaijan 30.01 9.8 3,800
Bahamas, The 5.3 3 17,700
Bahrain 13.01 5.6 19,200
Bangladesh 275.7 4.9 2,000
Barbados 4.57 2.3 16,400
Belarus 70.5 6.4 6,800
Belgium 316.2 2.6 30,600
Belize 1.78 3.5 6,500
Benin 8.34 5 1,200
Bermuda 2.33 2 36,000
Bhutan 2.9 5.3 1,400
Bolivia 22.33 3.7 2,600
Bosnia and Herzegovina 26.21 5 6,500
Botswana 15.05 3.5 9,200
Brazil 1,492 5.1 8,100
British Virgin Islands 2.5 1 38,500
Brunei 6.84 3.2 23,600
Bulgaria 61.63 5.3 8,200
Burkina Faso 15.74 4.8 1,200
Burma 74.3 -1.3 1,700
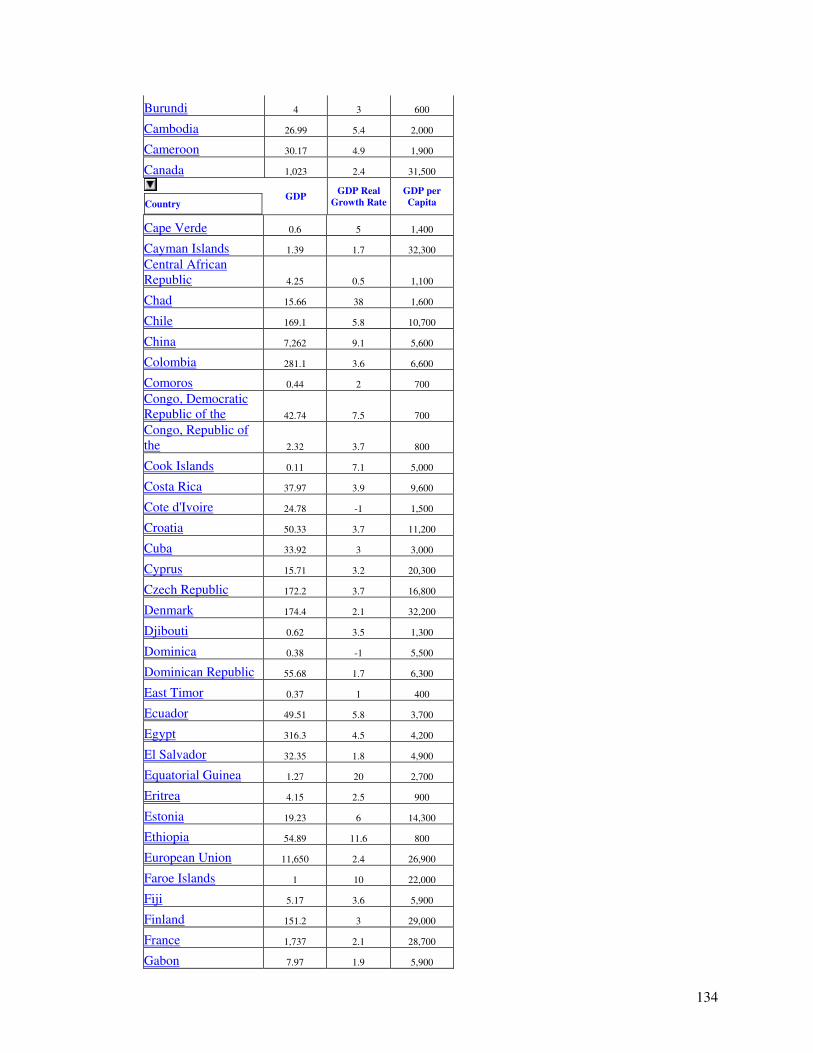
134
Burundi 4 3 600
Cambodia 26.99 5.4 2,000
Cameroon 30.17 4.9 1,900
Canada 1,023 2.4 31,500
Country
GDP GDP Real
Growth Rate GDP per Capita
Cape Verde 0.6 5 1,400
Cayman Islands 1.39 1.7 32,300
Central African Republic 4.25 0.5 1,100
Chad 15.66 38 1,600
Chile 169.1 5.8 10,700
China 7,262 9.1 5,600
Colombia 281.1 3.6 6,600
Comoros 0.44 2 700
Congo, Democratic Republic of the 42.74 7.5 700
Congo, Republic of the 2.32 3.7 800
Cook Islands 0.11 7.1 5,000
Costa Rica 37.97 3.9 9,600
Cote d'Ivoire 24.78 -1 1,500
Croatia 50.33 3.7 11,200
Cuba 33.92 3 3,000
Cyprus 15.71 3.2 20,300
Czech Republic 172.2 3.7 16,800
Denmark 174.4 2.1 32,200
Djibouti 0.62 3.5 1,300
Dominica 0.38 -1 5,500
Dominican Republic 55.68 1.7 6,300
East Timor 0.37 1 400
Ecuador 49.51 5.8 3,700
Egypt 316.3 4.5 4,200
El Salvador 32.35 1.8 4,900
Equatorial Guinea 1.27 20 2,700
Eritrea 4.15 2.5 900
Estonia 19.23 6 14,300
Ethiopia 54.89 11.6 800
European Union 11,650 2.4 26,900
Faroe Islands 1 10 22,000
Fiji 5.17 3.6 5,900
Finland 151.2 3 29,000
France 1,737 2.1 28,700
Gabon 7.97 1.9 5,900
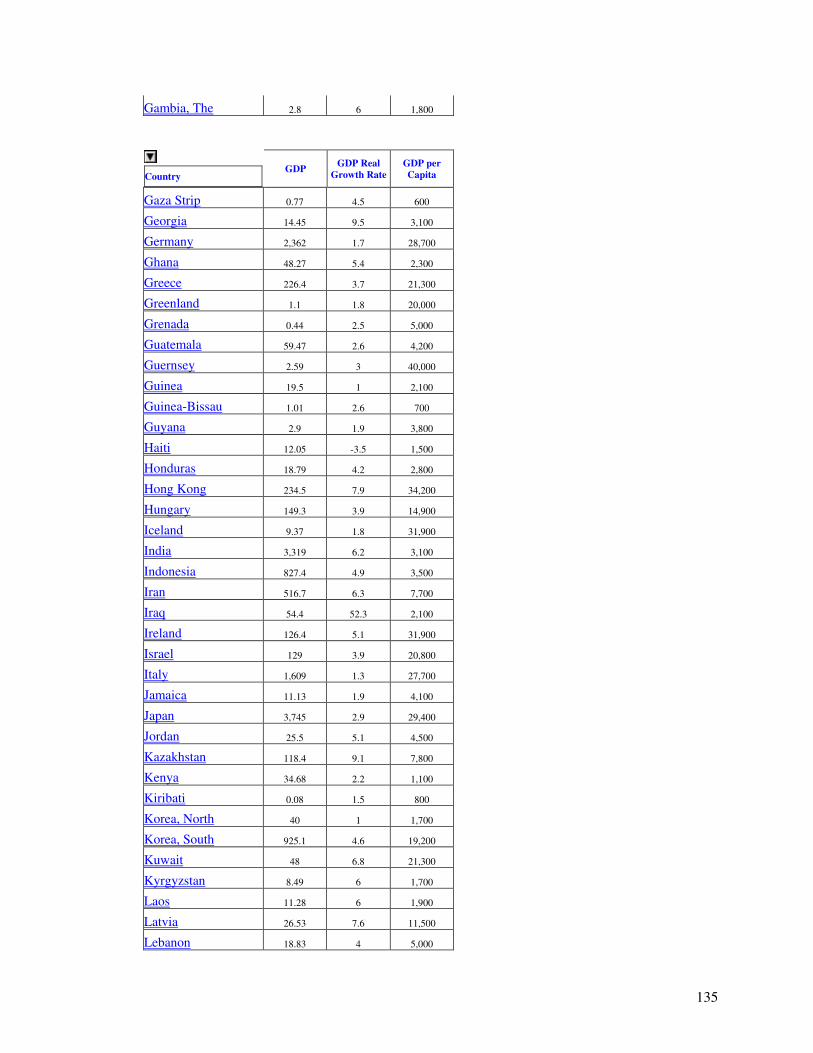
135
Gambia, The 2.8 6 1,800
Country
GDP GDP Real
Growth Rate GDP per Capita
Gaza Strip 0.77 4.5 600
Georgia 14.45 9.5 3,100
Germany 2,362 1.7 28,700
Ghana 48.27 5.4 2,300
Greece 226.4 3.7 21,300
Greenland 1.1 1.8 20,000
Grenada 0.44 2.5 5,000
Guatemala 59.47 2.6 4,200
Guernsey 2.59 3 40,000
Guinea 19.5 1 2,100
Guinea-Bissau 1.01 2.6 700
Guyana 2.9 1.9 3,800
Haiti 12.05 -3.5 1,500
Honduras 18.79 4.2 2,800
Hong Kong 234.5 7.9 34,200
Hungary 149.3 3.9 14,900
Iceland 9.37 1.8 31,900
India 3,319 6.2 3,100
Indonesia 827.4 4.9 3,500
Iran 516.7 6.3 7,700
Iraq 54.4 52.3 2,100
Ireland 126.4 5.1 31,900
Israel 129 3.9 20,800
Italy 1,609 1.3 27,700
Jamaica 11.13 1.9 4,100
Japan 3,745 2.9 29,400
Jordan 25.5 5.1 4,500
Kazakhstan 118.4 9.1 7,800
Kenya 34.68 2.2 1,100
Kiribati 0.08 1.5 800
Korea, North 40 1 1,700
Korea, South 925.1 4.6 19,200
Kuwait 48 6.8 21,300
Kyrgyzstan 8.49 6 1,700
Laos 11.28 6 1,900
Latvia 26.53 7.6 11,500
Lebanon 18.83 4 5,000
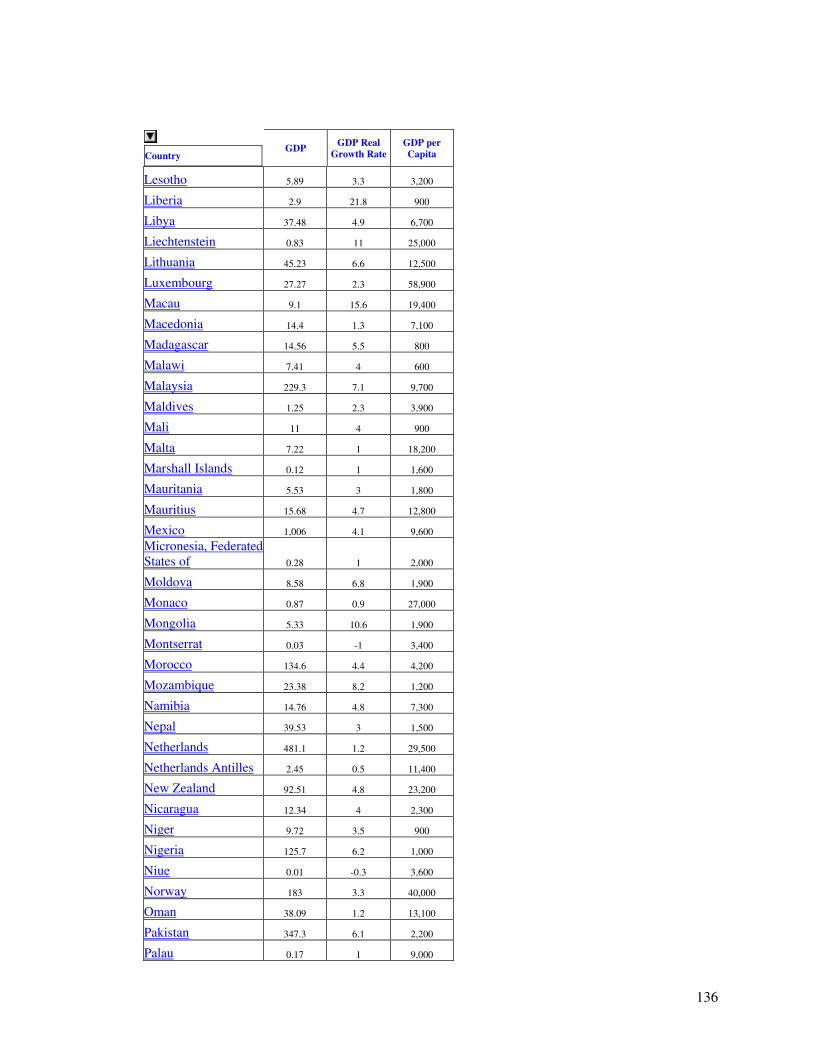
136
Country
GDP GDP Real
Growth Rate GDP per Capita
Lesotho 5.89 3.3 3,200
Liberia 2.9 21.8 900
Libya 37.48 4.9 6,700
Liechtenstein 0.83 11 25,000
Lithuania 45.23 6.6 12,500
Luxembourg 27.27 2.3 58,900
Macau 9.1 15.6 19,400
Macedonia 14.4 1.3 7,100
Madagascar 14.56 5.5 800
Malawi 7.41 4 600
Malaysia 229.3 7.1 9,700
Maldives 1.25 2.3 3,900
Mali 11 4 900
Malta 7.22 1 18,200
Marshall Islands 0.12 1 1,600
Mauritania 5.53 3 1,800
Mauritius 15.68 4.7 12,800
Mexico 1,006 4.1 9,600
Micronesia, Federated States of 0.28 1 2,000
Moldova 8.58 6.8 1,900
Monaco 0.87 0.9 27,000
Mongolia 5.33 10.6 1,900
Montserrat 0.03 -1 3,400
Morocco 134.6 4.4 4,200
Mozambique 23.38 8.2 1,200
Namibia 14.76 4.8 7,300
Nepal 39.53 3 1,500
Netherlands 481.1 1.2 29,500
Netherlands Antilles 2.45 0.5 11,400
New Zealand 92.51 4.8 23,200
Nicaragua 12.34 4 2,300
Niger 9.72 3.5 900
Nigeria 125.7 6.2 1,000
Niue 0.01 -0.3 3,600
Norway 183 3.3 40,000
Oman 38.09 1.2 13,100
Pakistan 347.3 6.1 2,200
Palau 0.17 1 9,000
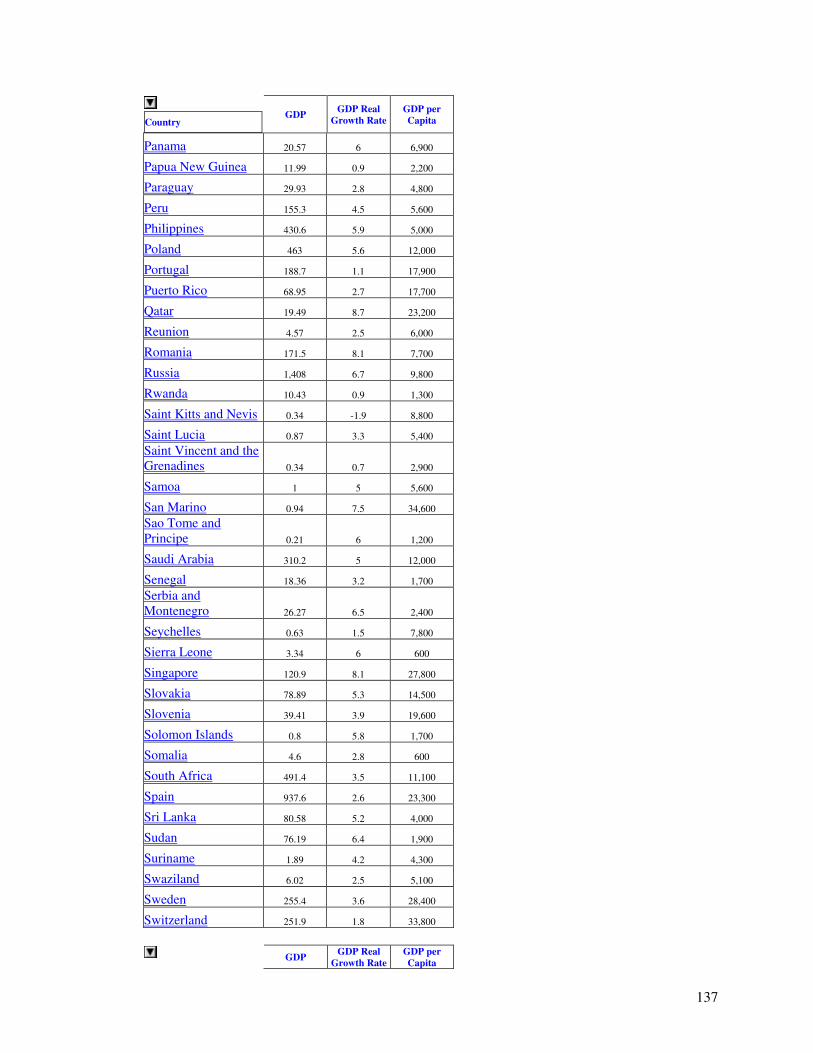
137
Country
GDP GDP Real
Growth Rate GDP per Capita
Panama 20.57 6 6,900
Papua New Guinea 11.99 0.9 2,200
Paraguay 29.93 2.8 4,800
Peru 155.3 4.5 5,600
Philippines 430.6 5.9 5,000
Poland 463 5.6 12,000
Portugal 188.7 1.1 17,900
Puerto Rico 68.95 2.7 17,700
Qatar 19.49 8.7 23,200
Reunion 4.57 2.5 6,000
Romania 171.5 8.1 7,700
Russia 1,408 6.7 9,800
Rwanda 10.43 0.9 1,300
Saint Kitts and Nevis 0.34 -1.9 8,800
Saint Lucia 0.87 3.3 5,400
Saint Vincent and the Grenadines 0.34 0.7 2,900
Samoa 1 5 5,600
San Marino 0.94 7.5 34,600
Sao Tome and Principe 0.21 6 1,200
Saudi Arabia 310.2 5 12,000
Senegal 18.36 3.2 1,700
Serbia and Montenegro 26.27 6.5 2,400
Seychelles 0.63 1.5 7,800
Sierra Leone 3.34 6 600
Singapore 120.9 8.1 27,800
Slovakia 78.89 5.3 14,500
Slovenia 39.41 3.9 19,600
Solomon Islands 0.8 5.8 1,700
Somalia 4.6 2.8 600
South Africa 491.4 3.5 11,100
Spain 937.6 2.6 23,300
Sri Lanka 80.58 5.2 4,000
Sudan 76.19 6.4 1,900
Suriname 1.89 4.2 4,300
Swaziland 6.02 2.5 5,100
Sweden 255.4 3.6 28,400
Switzerland 251.9 1.8 33,800
GDP
GDP Real Growth Rate
GDP per Capita
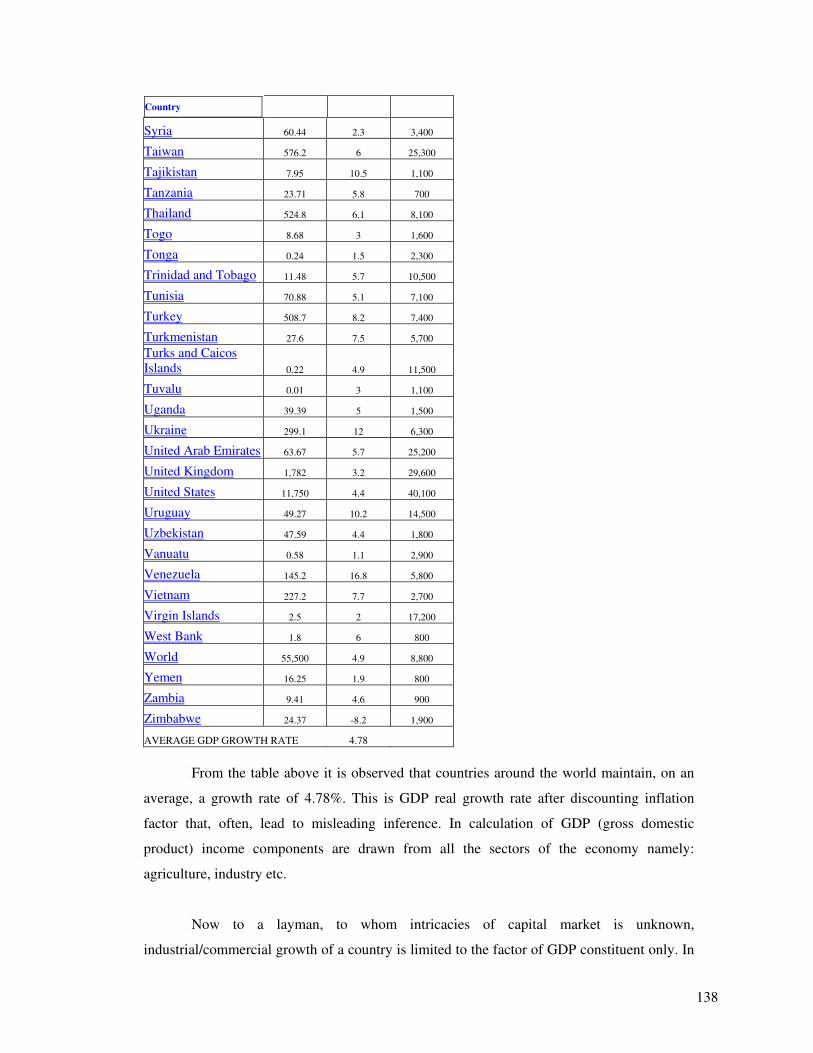
138
Country
Syria 60.44 2.3 3,400
Taiwan 576.2 6 25,300
Tajikistan 7.95 10.5 1,100
Tanzania 23.71 5.8 700
Thailand 524.8 6.1 8,100
Togo 8.68 3 1,600
Tonga 0.24 1.5 2,300
Trinidad and Tobago 11.48 5.7 10,500
Tunisia 70.88 5.1 7,100
Turkey 508.7 8.2 7,400
Turkmenistan 27.6 7.5 5,700
Turks and Caicos Islands 0.22 4.9 11,500
Tuvalu 0.01 3 1,100
Uganda 39.39 5 1,500
Ukraine 299.1 12 6,300
United Arab Emirates 63.67 5.7 25,200
United Kingdom 1,782 3.2 29,600
United States 11,750 4.4 40,100
Uruguay 49.27 10.2 14,500
Uzbekistan 47.59 4.4 1,800
Vanuatu 0.58 1.1 2,900
Venezuela 145.2 16.8 5,800
Vietnam 227.2 7.7 2,700
Virgin Islands 2.5 2 17,200
West Bank 1.8 6 800
World 55,500 4.9 8,800
Yemen 16.25 1.9 800
Zambia 9.41 4.6 900
Zimbabwe 24.37 -8.2 1,900
AVERAGE GDP GROWTH RATE 4.78
From the table above it is observed that countries around the world maintain, on an
average, a growth rate of 4.78%. This is GDP real growth rate after discounting inflation
factor that, often, lead to misleading inference. In calculation of GDP (gross domestic
product) income components are drawn from all the sectors of the economy namely:
agriculture, industry etc.
Now to a layman, to whom intricacies of capital market is unknown,
industrial/commercial growth of a country is limited to the factor of GDP constituent only. In
139
other words, in a country where industrial growth is 10%, commercial sector is growing by
10% also; capital market or market index should not increase by a factor more than 10% too.
This is also not fully correct. Price of shares quoted in a stock exchange can rise based on
their income yield compared to the base rate of interest prevailing at the given time.
Therefore, if base rate of interest of a country is say 5.25%, average rate of yield
from capital market is 10.50% and the GDP growth real rate is 5%, the market index can rise
by 10% or double of GDP. If we consider here an inflation factor of 10%, the market index
will record a growth of 11% and not more unless something is wrong or there is imperfection
in the market.
This imperfection factor perpetuated in a mass scale leads to mania. In other words,
when investment grows at a rate multiple of GDP and/or interest rate mania happens. Values
of scripts in this state increase disproportionately without any relevance to income yield.
Scripts are bought at this time not based on either their intrinsic value and or income
generating potential. Instead the yardstick for present valuation rests on the likely capitalized
value of possible future gain out of price difference between the time of purchasing and
selling off. This era essentially derives boost if interest rates in a state are on declining scale
since that results in higher capitalization factor.
With quantum of scripts being static in an exchange (usually), in order to bring in
unprecedented rise, emphasis moves on to creation of shadows to multiply the volume of
trade. With markets gradually shifting from state of perfect competition with limitless number
of buyers and unlimited sellers to a state of imperfection involving selected pockets
wherefrom volumes are generated, risk element in the market moves up. Trade evolution then
creates shadows where gains are generated in geometric proportion based on the factors of
uncertainty and risk. Thus, emphasis of capital market shifts from trading of physical scripts
to derivatives comprising of futures and options. It is a peculiar state where situation turns
just reverse. The shadow no more follows the real; instead it is the real that follows the
shadow. This state is known better as Proliferation of investment types, which is mandatory
in a state of mania.
Here we have to remember that no mania is possible unless there is active or tacit
support of the government. Let us look at the present scenario. Apart from USA, most of the
countries that are in a state of mania are mostly third world countries that are always hungry
140
for investments coming from abroad. World Bank, UNO etc organizations are equally, if not,
to a great extent to be blamed for the current state of affairs.
In order to elucidate active support of UNO to creation of this mess, I would prefer to
quote some excerpts from World Investment Report-2006 published by UNO under the
signature of the Secretary General.
“Inflows of foreign direct investment (FDI) were substantial in 2005. They rose by
29% - to reach $916 billion – having already increased by 27% in 2004. Inward FDI grew in all the main sub regions, in some to unprecedented levels and in 126 out of 200 economies covered by UNCTAD.” “In flows to developed countries in 2005 amounted to $542 billion, an increase of 37% over 2004, while to developing countries they rose to the highest level ever recorded- $334 billion.”
“ A new feature of the recent M&A boom is increasing investment by collective investment funds, mainly private equity and related funds. A number of factors, including historically low interest rates and increasing financial integration, have led private equity firms to undertake direct investments abroad, which are estimated to have reached $135 billion in 2005 and accounted for 19% of total cross border M&As. Unlike other kinds of FDI, private equity firms tend not to undertake long term investment and exit their positions with time horizon of 5 to 10 years (or an average of 5 to 6 years), long enough not to be regarded as typical portfolio investors. Thus, host countries and developing ones in particular need to be aware of this difference in time horizon.” ! Now a confirmation of wherefrom funds were coming- !
“ The TNC (Transnational Corporations) universe continues to be dominated by firms from the Triad – the EU, Japan and the United States – home to 85 of the world’s top 100 TNCs in 2004. Five countries (France, Germany, Japan, the United Kingdom and the United States) accounted for 73 of the top 100 firms, while 53 were from EU.” “ A sizeable share of FDI originates from offshore financial centers. The British Virgin Islands is by far the largest such source, with an outward FDI stock in 2005 estimated at almost $123 billion. From a statistical point of view, transshipping FDI via offshore financial centers makes it difficult to estimate the real size of outward FDI from specific economies and by specific companies. In some years, flows from these centers have been particularly large.” Kinds of inflow of funds:
“ FDI inflows in to South, East and South East Asia reached $165 billion in 2005, corresponding to 18% of world inflows.” “FDI inflows in to the 14 economies of West Asia soared by 85%”. And “ Latin America and the Caribbean saw inflows of $104 billion, representing small rise over 2004”.
UNO, World Bank duly supported by investing countries made sure liberalization continues. Thus the report “ In terms of regulatory trends relating to investment, the pattern observed in previous years has persisted: the bulk of regulatory changes have facilitated FDI.”
141
What truly surprises is the fact that UN did not understand that if the cumulative
amount of FDI were added they would possibly be multiples of the entire market capital of
the world? Did not they realize that the value of investments flowing in to so-called
developing world could buy every single share quoted in the stock exchanges not once but
many times over and over?
In other words, UNO and other governments oblivious of what was happening led the
markets to a state of mania. With market indexes soaring sky high, the Finance Ministers
were happy that their GDP would increase by leaps and bound. Little did they realize that
economy does not grow like that? It was a state of utopia, a myth that was or is destined to
end, unfortunately to the peril of billions of human being.
Where do all this investments go if shares are not available? During mania
specialization of stock mutual funds reaches an absurd extreme. Just surf the brochures of
these fund houses relating to any country now in a state of mania and you will see a truck
load of so called self designed funds or investment propositions. There would be general
funds, blue chip funds, small stock funds, income funds, growth funds, mid cap funds,
aggressive growth stock funds, index funds, futures funds, hedge funds, and shortable funds.
Mind you, it is just not mutual funds; the exchanges, themselves, will offer investors the
opportunity to play in funds and futures of their choice. In other words, exchanges will create
phenomenon or designs with due stamp of legality and provide investor the opportunity to
gain larger profits with limited risk factors.
Derivatives (securities based on other securities) were essentially nonexistent even 50
years back. Now they assume the front stage. Different fund managers around the world
report these days that their earnings from derivatives exceed their revenue from stocks. The
best part of derivatives is that if bought in right direction, gains are multiples of sums
invested. Now, in a country with $500 billion market cap, if FDI worth $350billion exists,
can decisions on direction of market movement go wrong when it comes from the ones
contributing $350 billion? It never does. $ 350 billion doubles in no time, then moves towards
being quadrupled. The media gets ecstatic; ministers go crazy and then, one fine morning the
exchange is left standing naked without a penny to survive upon.
142
There is a proverb in English “ History never forgets, nature never forgives”. Just
turn back the pages and take a look at the Tulip mania happening in Holland over 300 years
back during late 17th century. Would you believe that three hundred and twenty-five years
ago, at Amsterdam, Holland Stock Exchange had a call and put market every bit as
sophisticated as today’s. If you do not believe in what I am saying, please procure a book
titled “Confusion de Confusiones” authored by Joseph de la Vega, published during 1688.
The pictorial presentation of the said mania speaks for itself as to how the myth was created
and how it crashed like a pack of cards.
Tulip Mania happened during the last Grand Super Cycle peak. I personally expect
that options market to fade away again from stock exchanges since; the same very Grand
Super Cycle draws to an end finally.
I have worked out in detail the mechanisms followed and potentiality of investment
appreciation under influence of mania and as such, am not venturing in to repetition of the
same.
143
SIDE EFFECTS OF MANIA:
Mania is a state of euphoria where economic prosperity is assumed while the same do
not exist. Why? Rather simply. The difference between the rate of appreciation in market
capital (profits out of derivatives ignored) and GDP is a misnomer that is assumed by
governments to exist within the monetary cycle of the economy. This generates a kind of
false exuberance and governments tend to interpret the same as excess liquidity. Thus with
supply of money increasing, interest rates push downwards. When interest rates move down,
indexes further appreciate as their capitalization factors increase by inverse of rate of decline.
The so called euphoria of excess liquidity indulges banking sectors of the economy to
extend more and more loans and advances as that would balance their income vis a vis
expenditure under a scenario of diminishing interest regime.
More and more investments pour in. Market indexes appreciate higher and higher.
And the net result is reflected in interest rates pushing down till the very minimum. By the
time, interest rates hit the bottom level, chain of loans and advances expand and encompass a
circumference beyond comprehension.
The trend starts changing. Inflow of funds starts slowing down. But markets still
soar, now with euphoria percolating, common investors who too start investing in market to
let their savings inflate. This starts liquidity ratio turning unfavorable.
With liquidity gradually declining, governments have to cut down on advances,
which they do by increasing the interest rates. The reversal order starts and goes on till a time
arrives when mania cracks and the debt/credit balloon bursts.
Before going further ahead, let me furnish here two recent news reports published by CNN.
Subprime: The risk to Wall Street
As Subprime woes widen, the money machines at Morgan Stanley, Goldman and other banks may sputter. By Grace Wong, CNNMoney.com staff writer March 12 2007: 5:17 PM EDT
NEW YORK (CNNMoney.com) -- Wall Street's big banks have been moneymaking machines, posting record earnings in recent years, but the shakeout in the subprime mortgage business threatens to derail their stellar run.
144
Subprime mortgages - home loans given to borrowers with weak credit - have been a lucrative business for investment banks, which buy the loans, repackage them and sell them to investors around the world, including pension funds and hedge funds.
But cracks in the subprime sector have been surfacing at an alarming speed. On Monday, No. 2 subprime lender New Century Financial warned that it faces $8.4 billion in loan repayment obligations - little more than a week after revealing doubts about its ability to survive.
New Century also disclosed that it had financing deals with some of the nation's biggest investment and commercial banks, including Morgan Stanley, Citigroup, Bank of America and the mortgage division of Goldman Sachs.
That's cast a spotlight on how much the problems in the subprime mortgage business will hurt the big banks that have helped bankroll subprime lending.
The banks stand to take a double hit.
First, they lose if subprime lenders can't pay back the money they've borrowed from Wall Street to bankroll their mortgage business, said Gary Gordon, managing director of research at independent research firm Portales Partners.
Second, with the growing problems roiling subprime, there will be fewer of these mortgages issued for the banks to repackage and sell as securities to investors - an area that has become extremely lucrative for Wall Street.
How big a hit they take remains to be seen since they are so deeply involved in different parts of the subprime mortgage business, analysts said.
Lehman and Bear Stearns have been among the most aggressive in the business of buying subprime loans and repackaging them for sale to investors. Morgan Stanley and Merrill Lynch have jumped even further into the business, by purchasing subprime mortgage lenders outright.
"The biggest risk lies not so much in the losses that they're going to absorb [from defaulted loans] but in the fact that mortgage bankers aren't going to originate as many loans," said Punk Ziegel analyst Dick Bove.
Overall, lenders in the subprime sector made some $640 billion in mortgage loans last year, about a fifth of the total mortgage market and nearly double the amount from 2003.
But Gordon from Portales Partners expects the size of the market to tumble this year and next. He estimated it could be closer to $300 billion by 2008.
Investors and analysts may get a better look at the risk subprime poses when earnings are reported. Goldman Sachs, Bear Stearns and Lehman are all due to announce quarterly results this week.
Bove from Punk Ziegel expects many firms will eventually have to absorb some losses from mortgage lenders who themselves have gotten hit by rising defaults by borrowers. But he doesn't think the losses will be big enough to significantly impact earnings.
145
Prashant Bhatia, a Citigroup analyst, echoed that view, saying in a research note issued Friday that "the marketplace is overreacting to brokerage subprime exposures."
Bhatia is forecasting strong quarterly results from Goldman, Morgan Stanley and Lehman and expects them to say that subprime exposure is minimal and isn't spilling over to other parts of their business.
But Josh Rosner, a managing director at research firm Graham-Fisher, warned that the problems in subprime could start to spread to other borrowers in the mortgage market - which means the pain for Wall Street may just be starting.
"It makes sense that problems would surface first among subprime borrowers -these are the most leveraged borrowers with the least financial wherewithal to stay current with payments. But we're going to see it spread [to other borrowers]," he said. 'Liar loans': Mortgage woes beyond subprime
Loans where borrowers gave little proof of income could be the next threat to the troubled real estate market - and the economy. By Chris Isidore, CNNMoney.com senior writer March 19 2007: 5:01 PM EDT
NEW YORK (CNNMoney.com) -- Subprime mortgages have been generating a lot of attention, and worry, among investors, economists and regulators, but those loans may be only part of the threat posed to the housing market by risky lending.
Some experts in the field are now concerned about the so-called Alt. A mortgage loan market, which has grown even faster than the market for subprime mortgage loans to borrowers with less than top credit.
Alt. A refers to people with better credit scores (A-rated) who borrow with little or no verification of income, or so-called alternative documentation.
But some people in the industry call them "stated income" loans, or worse, "liar loans." And they were an important part of the record real estate boom of 2004 and 2005 that has recently shown signs of turning into a bust.
Standard & Poor's estimates that the Alt. A market has gone from less than $20 billion in loans in the fourth quarter of 2003 to more than $100 billion in each of the last three quarters. Overall, new Alt. A loans totaled $386 billion in 2006, according S&P's estimates - up 28 percent from 2005.
By comparison, subprime loans reached $640 billion in 2006, according to trade publication Inside Mortgage Finance, though that was down about 4 percent from the record level reached in 2005.
"Much of the growth of the last few years has come from reaching out beyond where the lenders should have reached out," said Guy Cecala, publisher of the trade publication. "It wasn't normal business that walked through their door. All was based on the idea that home price appreciation would cover over a lot of the problems that occurred. But that hasn't happened."
146
But just as the Alt. A market has grown even faster than subprime, some believe it could shrink even faster amid growing concerns in the marketplace. That means another pool of money that has supported home sales and housing prices being yanked just as home sales and prices are already in decline.
The loans were very popular with buyers seeking investment property rather than a home to live in. And while default and delinquency rates for Alt. A are just a fraction of the rates for subprime, the widespread use of the loans by investor-buyers is a concern. That's because there's a glut of investor-owned homes and condos already up for sale - with prices tumbling in many markets.
"There's a reason they ask on the application do you intend to live in the property," said David Berson, chief economist for mortgage financing firm Fannie Mae. "People who live in a property are less likely to default than investors."
Still, Berson said that while default rates are likely to rise for many Alt. A loans, he doesn't think it will reach the levels seen in the subprime sector. He said only 1.5 percent of Alt. A loans are now 60 days or more delinquent, while in subprime it is 7.5 percent. Absent a major recession, he doubts that Alt. A loans will reach the same kind of delinquency or default rates causing worries and lender bankruptcies in subprime.
But many in the field say that there is a real squeeze on Alt. A loans as lenders tighten up on underwriting standards. Mitch Ohlbaum, president of mortgage broker Legend Mortgage whose business was about 55 percent Alt. A, said he's seen a dramatic change in the business the last few years, and its now swinging back away from the loans.
"Stated income borrowers were typically self-employed people who write off a lot of income, so their tax returns really don't reflect what they're earning," said Ohlbaum. But he said the loans have grown in popularity for folks who had no money to put down on a home, or could only pay interest on a loan, especially by real estate investors.
"All that nutty stuff is going to disappear," said Ohlbaum. "Everyone today is shying away from the 100 percent of value loan. But anytime there's a big change in the market like there is now, everyone will overcompensate for a while. I think this will last for 12 to 14 months before things are back to normal, and I think you'll see more foreclosures, more people in trouble in the meantime."
And he said some types of Alt. A loans that had become popular, such as the no-money-down loans, are almost impossible to arrange today. And the definition of what is considered an A-quality borrower has tightened up.
Inside Mortgage Finance's Cecala said he believes underwriting of the loans had grown too loose by the end of last year, and that even some subprime borrowers were getting so-called low-doc or no-doc loans. He believes as much as a quarter of Alt. A loans were going to subprime borrowers. "In some ways it's the worst possible combination," he said.
Now with the market correcting, even some borrowers with good credit are having Alt. A loan applications rejected, Ohlbaum said. That will cut off another source of financing for the battered real estate market.
The biggest Alt. A lender is Pasadena, Calif-based IndyMac Bancorp. Trade publication Inside Mortgage Finance estimates it did $70.2 billion of the loans in 2006, up 48
147
percent from a year earlier. As the sector grew, its shares shot up nearly 50 percent in a year and hit a record high in April 2006. But with rising concern about the mortgage sector, its shares have plunged 36 percent since the start of 2007.
But it's not just the smaller lenders like IndyMac in the sector. Like subprime, some of the nation's largest finance firms are major players. Countrywide Financial, one of the nation's largest mortgage lenders, is the No. 2 Alt. A lender with $68 billion in loans, according Inside Mortgage Finance.
GMAC, the finance unit of General Motors that is now 51 percent owned by Cerberus Capital, is No. 3 on the list at $44 billion, and a unit of General Electric is No. 4 at $28.3 billion, just ahead of Washington Mutual, the nation's largest thrift with $25 billion in the loans.
What is not known is which Wall Street firms, banks and hedge funds have bought hundreds of billions of dollars worth of mortgage-backed securities comprised of Alt. A loans, or have lines of credit out to the smaller Alt. A lenders.
"If they get spooked, you'll see the same things that are happening in subprime - repurchase requests, funding sources drying up," said Cecala.
But Fannie Mae's Berson said he doesn't foresee the problems getting as bad as subprime, even if the problems in the sector do get worse. He said the changes taking place are needed, though they will raise the cost of credit.
"I would suspect that investors will view credit risk with a better eye going forward," he said. "Loans that have potentially more risk will end up with higher [rate] spreads. Maybe they'll just widen to where they should be."
The above news reports stands testimony to the fact that after reaching an ultimate
point the credit balloon bursts, basically because it was built on false projections of liquidity
that never existed and secondly because the credit chain had expanded, in geometric
progression, more to accommodate aforesaid liquidity rather than being based on any long
term fiscal policy of sound economic foresight.
Possibly best acceptance of above came from none other than US Federal Reserve
Governor Ms Susan Bies, who said on March 9,2007 that subprime defaults are at the
``beginning of a wave'' and banks are likely to see more missed payments and foreclosures as
consumers with weak credit histories begin to face higher monthly mortgage payments.” On
March 21, 2007 US FED held their short-term interest rates steady at 5.25% and expressed
concern over sub-prime crisis raising hopes for a rate cut soon. This raised positive mood in
the market and DJIA recorded highest gains for the last three weeks. Yet a report featured
somewhere in Bloomberg saying that Short Sellers' Who Predicted Subprime Rout See More
Declines’. As insight reports like this do not come out much, I take this opportunity of
furnishing here the item under reference:
148
Quote- Short Sellers' Who Predicted Subprime Rout See More Declines
By Michael Patterson
March 21 (Bloomberg) -- The collapse in shares of subprime- mortgage companies
over the past month rewarded so-called short sellers who bet that rising defaults among the riskiest borrowers would curb lenders' profits.
Some traders who predicted declines in shares of New Century Financial Corp., NovaStar Financial Inc. and Accredited Home Lenders Holding Co. say such stocks may fall further as loan delinquencies increase and demand for mortgage-backed securities wanes. New Century sank 90 percent last month, while NovaStar lost 73 percent. Accredited slid 54 percent.
``The subprime guys are history,'' said Steven Persky, chief executive officer of the $1.1 billion Los Angeles-based hedge fund Dalton Investments LLC, which began shorting shares of subprime lenders two years ago. ``They're ultimately going to have to file'' for bankruptcy.
New Century, NovaStar and Accredited Home were some of the most-shorted U.S. stocks from Feb. 12 to March 12, the date of last month's short-sale statistics from the New York Stock Exchange.
Short interest in the stocks climbed last month after New Century, the biggest specialist in home loans made to people with relatively low credit ratings, and HSBC Holdings Plc, Europe's biggest bank, said losses from bad U.S. home loans were piling up faster than they expected.
About 36 percent of New Century's shares available for trading, or float, was borrowed and sold to profit from falling prices. Traders sold short 46 percent of Accredited's float, while 44 percent of NovaStar's float was shorted.
Defaults Increased
Jeff Gentle, a NovaStar spokesman, declined to comment. New Century spokeswoman Laura Oberhelman didn't return a voice message seeking comment. Accredited spokesman Rick Howe also didn't reply to a message seeking comment.
The NYSE and American Stock Exchange will report March short-interest figures after the close of trading today. The Nasdaq Stock Market will follow on March 27.
Defaults on subprime loans increased as competition and a slower housing market prompted lenders to lower their standards and give mortgages to borrowers who couldn't make their monthly payments. More than 24 subprime lenders closed or sought buyers since the start of 2006 as late payments and defaults climbed.
Shares of mortgage companies plunged on Feb. 8 after New Century said it probably lost money in the last quarter and wouldn't make as many loans this year as it had previously forecast. HSBC said it set aside $1.76 billion more than analysts estimated to cover bad loans in 2006.

149
`No Skin in Game'
``The lending standards had loosened to the point where virtually anybody could get
a loan and the borrowers had little or no skin in the game,'' said Brian Horey, general partner at Aurelian Partners LP in New York, which has shorted New Century, Accredited, and Fremont General Corp., a California thrift that's selling its home-lending business.
Subprime lenders resumed their slide on Feb. 21 after NovaStar, a Kansas City, Missouri-based real estate investment trust, posted a surprise fourth-quarter loss and said it won't make much money on its mortgage investments for the next five years.
The stocks plummeted again after New Century said on March 2 that it may need waivers from its own lenders to stay in business and disclosed a criminal probe into its accounting. The same day, Fremont said a regulatory order would require it to stop giving mortgages to people who can't pay, and announced plans to exit the subprime home-loan business.
Shares Slide
The shares slid during the following week as New Century said it halted new loans and didn't have the cash to pay creditors, increasing speculation that the company will go bankrupt. The NYSE suspended trading in the New Century's shares.
The rout continued on March 13 after the Mortgage Bankers Association said late payments on subprime loans reached a four- year high of 13.3 percent, and foreclosures on all home loans rose to a record. Accredited led the decline after the company said it was considering ``strategic options'' because it couldn't meet its own lenders' demands for cash.
Horey of Aurelian Partners, who initiated his short positions in July and August, said he expects shares of subprime lenders to continue to fall as loan delinquencies and home foreclosures increase over the next few months.
``We're still in the early innings of the whole housing and lending slowdown,'' he said. ``We're not going to see a bottom probably before the end of this year.''
`Beginning of Wave'
That view is shared by Federal Reserve Governor Susan Bies, who said on March 9 that subprime defaults are at the ``beginning of a wave'' and banks are likely to see more missed payments and foreclosures as consumers with weak credit histories begin to face higher monthly mortgage payments.
Dalton's Persky says more subprime lenders may be forced into bankruptcy as they struggle to secure financing from investment banks and other institutions that purchase their loans and package them into securities to sell to investors.
``Their financing is dependent on being able to sell these subprime asset-backed securities, and the demand for that is now zero,'' said Persky. ``They won't be able to survive.''
150
New Century said yesterday that Fannie Mae, the biggest source of money for U.S. mortgages, served notice it will no longer buy the company's loans.
Shares of subprime lenders may be buoyed by acquisitions and new financing from hedge funds and banks. The stocks rebounded last week after buyout fund Blackstone Group LP agreed to acquire PHH Corp.'s home-lending business and Bear Stearns Cos., the biggest underwriter of mortgage-backed bonds, said it may buy more subprime loans.
Goldman Looking
Goldman Sachs Group Inc. may consider an acquisition of a subprime-lending company at bargain prices, the Wall Street Journal said on March 14, citing Chief Financial Officer David Viniar.
Accredited shares jumped 20 percent yesterday after the company got a $200 million loan from hedge-fund manager Farallon Capital Management LLC, giving the company time to attract more financing or find a buyer. Today, Citadel Investment Group LLC, the hedge fund that purchased bankrupt subprime lender ResMae Mortgage Corp., reported a 4.5 percent stake in Accredited.
``You have some of these subprime lenders that looked like they were going bankrupt getting lines of credit,'' said Steve Neimeth, who manages about $900 million at AIG SunAmerica Asset Management in Jersey City, New Jersey. ``Hedge funds and other financial institutions lending to them who are doing their due diligence say, `Things are OK, we'll lend to you.'''
Accredited has climbed 192 percent from an all-time low of $3.97 on March 13, and NovaStar has gained 78 percent during the same period. New Century is up 106 percent from an all-time low of 67 cents on March 14.
Deepening Woes?
Still, some traders said the subprime lenders' woes may be just beginning.
``I don't think anybody knows the extent of their problems,'' said Joseph Parnes, who helps manage $82 million as president of Baltimore-based Technomart Investment Advisors. He has short positions in mortgage lenders including American Home Mortgage Investment Corp.
The following list highlights some of the biggest moves among the most-shorted U.S. stocks last month. Percentage changes are from Feb. 12 to March 12, the date when this month's figures were compiled. ``Winners'' are stocks that fell in price, while ``losers'' rose.
151
10. THE ORIGIN OF CAPITAL ACCUMULATION IN TRADE
In the simplest circuit of commercial trade, a sum of money M is loaned and returned
with interest as the larger sum M'. Or, as a variation, M is traded for another currency, which
rises in value. In counter-trade (a form of barter in which money may be used only to value
goods and services), a commodity C exchanges for another commodity C', which may also
result in a larger sum of value. Marx calls the additional value surplus value.
In a slightly more complex trading circuit, a sum of money M buys a commodity C
which upon sale yields a larger sum of money M', which can be reinvested. Alternatively, the
circuit C − M − C' could substitute for M − C − M' but in this case the enlarged value consists
of commodities rather than of money. These circuits are basic to merchant trade.
In the more developed trading circuit of capitalism, however, M buys inputs C
(means of production and labor-power) that through new production creates outputs C' and
upon sale yield a larger sum of money M'. In this case, we are no longer dealing with
merchant capitalism, but with capitalist industry (the capitalist mode of production: all or
most of the inputs and outputs of production are available as marketed commodities, and the
costs & benefits of total production are rationally calculated in price terms.
In modern capitalism, the circuits of finance, commerce and production have become
exceedingly complex, often lack transparency and may involve multilateral exchanges or a lot
of fictitious capital. The daily trading volume in the world's foreign exchange markets was
estimated at $1.88 trillion in 2004, as against $590 billion in 1989 (current dollars) (Der
Spiegel, special edition 4/2005, p. 107). By comparison, the New York Stock Exchange daily
volume is said to be around $25 billion a day, and the international futures markets are said to
trade about $35 billion worth of contracts a day. Speculative trading makes up the bulk of the
daily trading volumes. Most rich people do not want to bother with the financial management
of most of their wealth, and know little about it. Investment specialists make their money
from investing the money of the rich using their superior market knowledge, contacts,
networks and commercial skills.
152
Most generally, the accumulation of capital refers simply to the gathering or
amassment of objects of value; the increase in wealth; or the creation of wealth. Capital can
be generally defined as assets invested for profit.
In economics, accounting and Marxian economics, capital accumulation is often
equated with investment, especially in real capital goods.
But capital accumulation can refer variously to:
• Real investment in tangible means of production.
• Financial investment in paper assets.
• Investment in non-productive physical assets such as residential real
estate that appreciate in value.
• "Human capital accumulation," i.e., new education and training
increasing the skills of the (potential) labor force.
Non-financial capital accumulation is an essential factor for economic growth, since
additional investment is essential to enlarge the scale of production and increase employment
opportunities. Without this, the total amount of tangible wealth that can be traded would not
increase. However, problems of disproportionate non-real growth often happens with
financial investments in paper assets since it does not essentially co-relate to savings
generated by an economy out of its national income as Keynesian economics points out,
savings do not automatically mean investment (as liquid funds may be hoarded for example).
Investment may also not be investment in fixed capital.
Irrational and/or speculative investments in paper assets if perpetuated on a
continuous basis gives rise to what is known as mania or creation of stock market bubble. A
stock market bubble is a type of economic bubble taking place in stock markets, in which a
wave of public enthusiasm or a chain of speculative investments causes an exaggerated bull
market. When such a bubble takes place, market prices of listed stocks rise dramatically,
making them significantly overvalued by any measure of stock valuation. Generally stock
market bubbles are followed by stock market crashes.
A rational or irrational phenomenon?
153
Emotional and cognitive biases (behavioral finance) seem to be the causes of
bubbles. But, often, when the phenomenon appears, pundits try to find a rationale, so as
not to be against the crowd. Thus, sometimes, people will dismiss concerns about
overpriced markets by citing a new economy where the old stock valuation rules may no
longer apply. This type of thinking helps to further propagate the bubble whereby everyone
is investing with the intent of finding a greater fool. Still, some analysts cite the wisdom of
crowds and say that price movements really do reflect rational expectations of fundamental
returns.
To sort out the competing claims between behavioral finance and efficient markets
theorists, observers need to find bubbles that occur when a readily available measure of
fundamental value is also observable. The bubble in closed-end country funds in the late
1980s is instructive here, as are the bubbles that occur in experimental asset markets. For
closed-end country funds, observers can compare the stock prices to the net asset value per
share (the net value of the fund's total holdings divided by the number of shares outstanding).
For experimental asset markets, observers can compare the stock prices to the expected
returns from holding the stock (which the experimenter determines and communicates to the
traders).
In both instances, closed-end country funds and experimental markets, stock prices
clearly diverge from fundamental values. Nobel laureate Dr. Vernon Smith has illustrated the
closed-end country fund phenomenon with a chart showing prices and net asset values of the
Spain Fund in 1989 and 1990 in his work on price bubbles. At its peak, the Spain Fund traded
near $35, nearly triple its Net Asset Value of about $12 per share. At the same time the Spain
Fund and other closed-end country funds were trading at very substantial premiums, the
number of closed-end country funds available exploded thanks to many issuers creating new
country funds and selling the IPOs at high premiums.
It only took a few months for the premiums in closed-end country funds to fade back
to the more typical discounts at which closed-end funds trade. Those who had bought them at
premiums had run out of "greater fools". For a while, though, the supply of "greater fools"
had been outstanding.
154
ECONOMIC BUBBLE An economic bubble (sometimes referred to as a "speculative bubble", a "market
bubble", a "price bubble", a "financial bubble", or a "speculative mania") refers to a market
condition in which the prices of commodities or asset classes increase to absurd or
unsustainable levels (that no longer reflect utility of usage and purchasing power). It occurs
when speculation in the underlying asset causes the price to increase, thus encouraging even
more speculation. A sudden drop in prices, known as a crash or a bubble burst usually
follows the bubble. Both the boom and the bust phases of the bubble are examples of a
positive feedback mechanism, in contrast to the negative feedback mechanism that
determines the equilibrium price under normal market circumstances. Prices in an economic
bubble can fluctuate chaotically, and become impossible to predict from supply and demand
alone.
Economic bubbles are generally considered to have a negative impact on the
economy because they cause misallocation of resources into non-optimal uses. In addition,
the crash, which usually follows an economic bubble, can destroy a large amount of wealth
and cause continuing economic malaise. A protracted period of low risk premiums can
simply prolong the downturn in asset price deflation, as was the case of the Great Depression
in the 1930s for much of the world and the 1990s for Japan. Not only can the aftermath of a
crash devastate the economy of a nation, but its effects can also reverberate beyond its
borders.
Another important aspect of economic bubbles is their impact on spending habits.
Market participants with overvalued assets tend to spend more because they "feel" richer (the
Wealth Effect). Many observers quote the housing market in the United Kingdom, Australia,
Spain and parts of the United States in recent times, as an example of this effect. When the
bubble inevitably bursts, those who hold on to these overvalued assets usually experience a
feeling of poorness and tend to cut discretionary spending at the same time, hindering
economic growth or, worse, exacerbating the economic slowdown. Therefore, it is imperative
for the central bank to keep its eyes on asset price appreciation and promptly take preemptive
measures to curb high level of speculative activity in financial assets.
Economic bubbles are mainly driven by the greed and irrational exuberance of overly
bullish investors. They argue that investors tend to extrapolate past extraordinary returns on
investment of certain assets into the future, causing them to overbid those risky assets in
155
order to capture those abnormal rates of return. Overbidding on certain assets will at some
point result in inadequate rates of return for investors, only then the asset price deflation will
begin. When investors feel that they are no longer well compensated for holding those risky
assets, they will start to demand higher rates of return on their investments. The issue is
readily addressed as a 'Floating Economic Bubble' which strains the economy for that
particular time but eventually phases out. Since this phenomenon creates a high assumed
charge over exact prices and rates, a 'Constant Economic Bubble' may emerge as happened in
2004 when National Australia Bank lost A$360 million resulting from foreign currency
trades undertaken by 4 option traders.
The cause of bubbles is excessive monetary liquidity in the financial system.
Excessive monetary liquidity potentially occurs while central banks are implementing
expansionary monetary policy (i.e. lowering of interest rates and flushing the financial system
with money supply). This state of over optimism and excess liquidity often leads to creation
of what is known as ‘fictitious capital’ within the integrated system of economic
development and credit. How?!?
a) Governments and banks create additional money or credit, which generates
purchasing power unrelated to the value of real production or real consumption, or to
the real value of physical assets owned.
b) They also issue debt securities of various kinds that can be traded in, regardless of
whether assets or deposits, and which become objects of speculation.
c) Companies, likewise, issue share certificates that are speculated in. Again, this
causes fluctuations in asset values unrelated to what a business and its production
were really worth.
d) The market value of physical and financial assets backed by credit, can be driven
up and artificially inflated by some margin, purely as a result of supply and demand
factors that can also be manipulated for profit. In other words, margin of value can
suddenly disappear, if large amounts of capital are withdrawn.
156
e) Profit can be made purely from trading in a variety of financial claims existing
only on paper and can solely be based on amounts borrowed to engage in speculative
trade, not backed up by any tangible asset.
When interest rates are going down, investors tend to avoid putting their capital into
savings accounts. Instead, investors tend to leverage their capital by borrowing from banks
and invest the leveraged capital in financial assets such as equities and real estate. Simply put,
economic bubbles often occur when too much money is chasing too few assets, causing both
good assets and bad assets to appreciate excessively beyond their fundamentals to an
unsustainable level. The bubbles will burst only when the central bank reverses its monetary
accommodation policy and soaks up the liquidity in the financial system. The removal of
monetary accommodation policy is commonly known as a contractionary monetary policy.
When the central bank raises interest rates, investors tend to become risk averse and thus
avoid leveraged capital because the costs of borrowing may become too expensive.
As appears to occur every five or six decades in human affairs, people and
institutions have assumed a heavy load of debt in recent years to fulfill desires ranging
beyond their immediate capacity to fund. This excess in debt buildup, particularly over the
past two decades, can hardly be described. Debt has been assumed by government to fulfill its
promises and engineer society, by industry to finance growth, and by everyday individuals to
acquire what they consider at this major mood peak to be the normal amenities of life.
Indeed, the “baby boomer” generation, now in 40s, saves virtually nothing and borrows to
finance its lifestyle. The multiple investment manias of recent years, as well as the growth of
the economy, have been sustained by growth of credit, which in turn is supported by
confidence and complacency. When the illusion of credit safety begins to dissolve, the
willingness to lend, and thus the demand for debt securities, will evaporate.
The consequences of this change in mood trend will be enormous. The reason that
confidence must eventually erode is that debt has now grown to the point that it is impossible
for any economy, even working at maximum capacity and efficiency, to pay the interest on
all of the country’s debt, much less the principal, with real production. Let us look at the
situation prevailing in United States of America.
The total value of registered debt issued by entities within the United States,
including $3.5 trillion in Treasury securities, $ 2.2 trillion in Federal agency securities,
157
$1.2trillion in tax exempt municipal bonds, $4.4 trillion in mortgages, $ 2.4 trillion in
corporate bonds, $ 8 trillion bank loans, $ 1 trillion in consumer credit, $0.6 trillion open
market paper and $ 1 trillion in S & L and finance company loans to business, is $ 17.1
trillion. This total does not include mob loans, loan shark loans, money owed to bookies, drug
dealers, friends and family, unfunded Social Security obligations (which total another $ 2.8
trillion to $10 trillion, depending upon one’s definitions), or Federal deposit insurance
obligations to banks, S & Ls and credit unions (which total another $ 2.8 trillion). These latter
items add between $ 6 trillion and $ 14 trillion to total debt. This amount might be offset
somewhat by the value of tax receipts that will be available to meet at least some of the
government’s insurance obligation, so we might very conservatively estimate total debt at $
20 trillion. This amount compares to the total value of privately held U.S real estate, which
stands at $ 12.9 trillion, and the total value of U.S equities, which stands at $ 6.1 trillion, for a
total value of privately held non-debt based investment assets of $ 19 trillion, approximately
to the same figure. To put the value of total debt in perspective, to pay it off tomorrow would
require the sale, at today’s high prices, of the entire land mass of the fifty United States and
its territories and all publicly owned U.S companies in existence (after which would still be
owing a trifling trillion dollars). The problem with even contemplating that fanciful solution
is that the debtors do not own much in the way of those assets. We can say that in essence,
the country’s debtors have borrowed, and to a great degree consumed, the entire investment
value of the United States of America.
The growing level of debt and its decreasing equality are not limited to U.S issues,
either; it is a worldwide phenomenon. The richest country per capita in the world, Japan, in
late 1880s went as far as to develop “two generation” mortgages of fifty years’ duration,
ultimately to be paid off by the children of the borrower. The World Bank has reached so far
down the creditworthiness scale in issuing its loans that it must have achieved and
unbreachable low. Although the bank had seldom made loans of less than $ 5 million before,
two years ago it began lending $ 50 and less to the world’s poor individuals, none of whom
have any collateral. It is as if the bank is trying to destroy money. In 1993, it lent $ 18 billion
in this fashion, and in 1994 $ 16 billion, mostly of U.S taxpayers’ money. Would you want to
hold these IOUs as an investment? The World Bank does. With poor individuals of the Third
World now in hook, is there anyone left unmortgaged? We cannot even exclude Roman
Catholic Church. The Vatican has amassed a multi-billion dollar debt and continuously
operates a deficit that is becoming acute.
158
The Coming Debt/Credit Contraction
If there is one fundamental event that will result from a major bear market in social
mood, is its collapse in the bloated debt structure, a devastating event that not one citizen in
ten thousand knows is coming. All this debt will have to be liquidated, and the process is
unlikely to be serene.
The only thing holding today’s debt pyramid together is confidence, one of those
amorphous mental states suited to analysis under the Wave Principle. It is confidence that
creates credit, and thus a kind of fictional money that is not real asset but promises to pay real
asset, which often means the promise to produce real asset that at present does not exist.
Owed money is as valuable as actual assets if in the aggregate, creditors’ mental processes
say it is valuable, and only then. If their opinion on that point changes, that from of money is
no longer on an equal footing with real assets. The danger to monetary system comes when
the outstanding credit outstrips the pool of assets and the productive capacity that back it up.
That is when a real deflationary crisis, a severe drop in the total money supply caused by
collapse in the portion that is credit (which in our economy is most of it), can occur. It will
actually occur when the confidence that supports it erodes and then dissolves. The timing of
that event is the province of market analysis.
The coming psychological change among the populace from an expansionary mood
to a mood of retrenchment will initially cause an actual net debt retirement to take place. The
retirement in debt will cause a contraction in money supply, which is deflation. A reduction
in the volume of outstanding credit will remove purchasing power from the financial system,
so investors and consumers will reduce purchases. Sellers will react by lowering prices, first
in investment markets, then in the market for goods, services and labor. As people begin to
sense that prices are declining, they will defer purchases even longer, waiting for even lower
prices. The postponement of purchases will induce sellers to lower prices further, which will
reinforce decisions to postpone purchases. The spiraling forces of falling prices and curtailed
spending will cause precarious businesses to fold. Those failures will create a further
contraction in business (as well as more unpaid debts), and cause otherwise marginally
successful businesses to follow suit.
As the money supply and economy contract, all classes of debtors and creditors will
be affected. Many individuals, who in the aggregate owe a record amount of money on credit
cards and installment plans and who have taken out second mortgages on their homes to buy
159
new cars, will have to sell assets to pay off debt. Variable mortgage payments and credit card
interest rates will rise, devouring greater percentage of income. Many corporations, some of
whom have billions worth of debt outstanding, will experience a drop in profits, and will have
to sell assets to pay interest. As the trend continues, local, state, federal and foreign
governments will experience a drop in tax receipts, and will have to curtail spending.
Events associated with debt collapse will provide continual justification for creditors
to call in loans. Banks will call in houses, property and other collateral. As debtors sell
everything they can to raise cash in a mad rush to stay solvent, unpaid creditors will sell
everything they must to make up for the shortfall due to defaults. Raising cash by all parties
will require the selling of stocks, real estate, commodities and bonds. The problem with
selling assets is that net selling reduces overall value of the assets. Thus, while the total value
of U.S property and public companies may be $19 trillion today, this very value will be
shrinking relentlessly as the deflationary process unfolds. In the deflation of 1930s, stocks,
real estate and commodities fell 90% in value, and questionable bonds fell 20% to 50%.
Many stocks went zero, and the companies were never heard from again. Many parcels of
land were places on the auction block. Many bonds went to zero as their issues defaulted. The
Elliot Wave outlook calls for a decline in asset values of at least that magnitude. At the end of
the process, the current 1:1 ratio between total ratio and real assets could change to 10:1 or
worse.
As the plight of debtors worsens, the selling of bonds based upon fear of default will
begin to reinforce the selling being done for cash-raising purposes. This part of the spiral will
be of devastating importance because the world’s wealth, and thus its presumed purchasing
power, is tied up more in IOUs today than at any time in the history. As the value of IOUs
falls, the value of bond investors’ portfolios will fall, and their wealth will disappear.
Disappearing wealth means disappearing money. This will not be money “withdrawn,” but
money evaporating. Evaporating money threatens the value of the remaining IOUs, as it is
money that services them and money that is ultimately required to pay them off. The threat
will be more deflation. Thus, the initial debt-contraction psychology of retrenchment will be
reinforced with every downtick in prices and every notch downward in economic activity.
The spiraling effect of these forces will destroy what many creditors today believe are their
stores of value.
160
Eventually, selling assets will prove fruitless for most debtors. Many individuals will
default as they turn their energies away from maintaining their credit ratings and toward
obtaining the basic necessities of life. The weakest corporate sectors, led by issuers of junk
bonds, will default. The next weakest sectors will be forces to pay huge rates to borrow just to
compensate for the risk that the investor sector falls, thereby proving such fears correct, the
rate rise will extend to more and more issues that were previously highly regarded but whose
prices will be falling because of the contracting economy. Every strong issuer will become a
victim of the weak. Banks under such conditions will be foundering in a sea of red ink, as
borrowers default and their collateral slides in value. When the trend becomes global, eastern
European countries despite the current euphoria over their future, will default on their loans.
Russia will default on its loans, Central and South American countries will default on their
loans and the third world will default on its loans. Many first world governments will default
on their guarantees to support third world debt then on their promises to bank depositors,
retirees, the ill, the poor and finally on their direct obligation to the bond holders. The few
remaining financially strong government will be left holding the nearly ruthless debt of weak
ones. By the end of the crisis, the total issue value of bonds that have gone to zero could well
be substantially more than the value of those that have not. Creditors will lose much of their
principle and the more incautious among them will go bankrupt.
The Role of Debt and/ Credit in Deflation and Depression
Mechanics of mood reinforcement such as those described above propel economic
expansion as well as contractions, Inflation as well as deflations. The dynamics is less
recognized in expansion because, due to their relative longevity, people view them as normal.
That is why Economists sometimes refer to Deflation as “Spirals,” but do not so refer to
booms. Yet they are both process involving mood and reinforcing feedback loop of result and
new cause. Expansions begin with a psychological change that produces initial positive
results, which then feed the psychology anew. This reinforcement continues until the
participants are exhausted. Booms last longer because optimism is fed are raising emotions
involving hope and greed, which, because they are tempered by cautions can reach maximum
intensity only over a long period of time and fulfillment only after prolonged effort. Busts are
swifter because pessimism is fed by fast-flaming emotions such as fear and anger, which can
be realized in a flash of destructive action. According to our Elliot Wave clock, the long,
spiraling, self-reinforcing expansion of the past two centuries has finally slowed enough to
161
reach a point of stasis, and form a point of stasis; it can only reverse the process and start a
spiral in the other direction.
The late A. Hamilton Bolton was well aware of the risks associated with excessive
credit. His studies of how credit relates to depressions were summarized in a personal letter to
Charles Collins dated February 11, 1957, as follows:
In reading history of major depressions in the U.S from 1830 on, I was impressed
with the following:
• All were set off by a deflation of excess credit. This was the one
factor in common
• Sometimes the excess-of-credit situation seemed to last years before
the bubble broke.
• Some outside event, such as a major failure, brought the thing to a
head, but the signs were visible many months, and in some cases
years, in advance.
• None was ever quite like the last, so that the public was always
fooled thereby.
• Some panics occurred under great government surpluses of revenue
(1837, for instance) and some under great government deficits.
• Credit is credit, whether non-self-liquidating or self-liquidating.*
• Deflation of non-self-liquidating credits usually produces greater
slumps.
*[This term may mean collateralized, but he gives no definition.]
Major deflations are ultimately extremely destructive, and the next one should be no
exception. That we are in the midst (and apparently near the end) of the greatest debt buildup
in world history suggests that the resulting deflation and depression will be correspondingly
severe. Against that backdrop, the Elliot Wave out-looks for the deepest depression in two
centuries hardly appears radical.
OUTLOOK
162
The brief deflationary crunch of 1919-1921 was an advance warning of what the
1930s would bring after an intervening paper asset boom. In the same way, the deflationary
crunch of 1980 – 1982 was an advance warning of what the next ten years will bring now that
the intervening paper asset boom is ending. Between May 2006 and July 2006 a dramatic
decline occurred in all three major markets: stocks, bonds and gold. As the previously strong
markets (gold and silver) fell sharply in the initial declines of their new bear trends, the
previously weak markets (stocks and bonds) plunged to a final bottoms in their old bear
trends. This across-the-board tumble was foreshadowing the coming difficulty, as the same
phenomenon is scheduled to recur, but more severely. This time, the previously strong
markets (stocks and bonds) will initiate Grand Super cycle bear markets, while the previously
weak markets (precious metals) will plunge to final bottoms in their old bear trends.
When the up trend ceases, a crushing bout of deflation will be unavoidable. A
reversal in the long term up trend in the stock market will be the sign that the confidence
bubble has burst. Proof that the deflation and depression are the bond market’s true concerns
will be given when the PPI and the CPI begin falling, yet bonds are unable to exceed their
previous highs.
While most prices will be falling during the coming deflation, there might be a few
items that enjoy rising prices. However, any price rises are likely to be product of temporary
and selective forces. Contrary to the popular idea that any rising prices indicate “inflation” or
are “inflationary,” rising prices, which when broadly based can reflect underlying inflation,
actually contribute to the forces of deflation by diminishing the purchasing power of the
consumer.
163
INADEQUATE CAPITAL CONTROL
We are arriving at an alarming picture wherein some countries belonging to
European Union along with Japan literally working out a financial coup on the rest of the
world. But how did it all start? Even if we take in to account advanced source of knowledge
and full idea about how the Grand Super Cycle was progressing, carrying out a coup of this
standard had to associate major flaws in the system that existed on a global scale. Thus, in the
pursuit of detecting reasons that germinated and developed in to mania/ economic bubble, we
cannot help but to make an inquest in to the state of Capital Control prevailing at present.
From the 1940s to the late 1980s, capital controls, or restrictions on the flow of
money across borders, were the norm around the world. In most part of the world, anyone
who needed foreign exchange to trade with another country (so-called “current account
transactions”) to buy goods or services could get it. But it was not so easy to get money that
could be used for currency speculation, or to buy and sell stocks in other country’s stock
markets. Often there was a special, less favorable, exchange rate for such transactions.
Ordinary individuals confronted these capital controls when they wanted to take a trip abroad:
typically, they were allowed only a limited amount of foreign exchange.
It hadn’t always been this way. In the 19th century there were no man-made
restrictions on the flow of capital. But at least partly because of the lack of technology,
capital moved far more slowly than it does today. Until the 1930s, the world was on the gold
standard—a system by which all domestic money had to be backed, in full, by the
government’s gold reserves. In essence, the government promised to convert any or all of the
country’s local currency for gold at a constant rate of exchange. The idea behind the system
was easy: if a country ran a balance of payments deficit, gold would leave the country as
payments for imports went out faster than payments for exports came in. The government
would have to take money out of circulation, that would make the money supply fall, and
prices would decline. This would make local goods more attractive and imported goods less
so. Exports would rise and imports would fall and the balance of payment deficit would, in
theory, turn into a surplus. Gold would return and equilibrium would be restored. Thus, for
the gold standard system to work, the capital account had to be liberal. Otherwise, gold could
not be shipped from one country to another.
164
The gold standard broke down and was abandoned by the U.S. in the Great
Depression: maintaining the system required a process of deflation that was simply too
painful to sustain, especially during a period of deep economic contraction. Other countries
also abandoned the system in droves; each hoping that freeing the exchange rate from the
gold standard’s “strait jacket” would increase exports. But, of course, when all countries tried
to do this simultaneously, nobody’s exports rose; imbalances remained and currencies
weakened. Capital controls had to be imposed. As World War II came to an end and the
advanced industrialized countries tried to reestablish the global economic order, a system of
fixed exchange rates was again set up, and the International Monetary Fund (IMF) was
created to help make it work. The system that was set up focused on trade; it centered on
reducing foreign exchange restrictions associated with trade, a process known as current
account liberalization. It was designed to maintain stability in exchange rates and a ready
availability of foreign exchange, both of which were required to facilitate trade. Today,
almost all countries have fully liberalized their current account.
Except for two brief periods, the Depression of 1929 and in the 1970s, the US always
had open capital markets. But it was only in the 1960s that some European countries began to
gradually ease restrictions and the trend spread very gradually until, by the 1990s, most
developed countries in the world had full capital account liberalization. In countries that
adopted these policies anyone could buy and sell any other currency that was fully
liberalized, for whatever purpose. Supposedly, the only reporting requirements were those
designed to ensure compliance with tax laws. Money could travel to buy stocks in other
countries, to invest in other countries or to buy other currencies. Soon, enormous markets in
foreign exchange developed with New York, London, Frankfurt and Tokyo becoming the
major money market centers, and with active trade also being done in Hong Kong and
Singapore.
The trend towards full capital account liberalization was part of a larger push for
economic liberalization that began in the U.S. with the election of President Ronald Reagan,
and in the UK with the election of Prime Minister Margaret Thatcher—both of whom were
great believers in free markets. Economists didn’t do much research, either theoretical or
empirical, as to whether liberalization was a good idea. Nonetheless, many believed the free
flow of capital would enrich countries all over the world. At an intuitive level, it made sense:
developing countries tend to have wealth of opportunities but little capital. Allowing
developing countries to import capital freely would be a “win-win” situation for all: the
165
developing countries’ growth potential is realized while, at the same time, profiting those
foreigners who made the investments. After all, trade and investment had helped wealthy
countries develop in the nineteenth century.
The UK lifted controls in 1979 and then Germany in 1984. The last European countries to lift
controls were Portugal and Ireland in the early 1990s. European countries pegged their
currencies to each other and traded in a band known as the European Exchange Rate
Mechanism. Some developing countries, such as China, India, and Sri Lanka, largely kept
their controls but others, especially in Latin America and East Asia, began to liberalize. In the
developing countries, the process started with Chile in the early 1970s and soon spread to
almost all Latin countries.
Asia was a latecomer into the game liberalizing capital accounts a decade or so later.
As barriers were removed, money began to flow into many of these developing countries.
Foreign investors eagerly bought the stocks and bonds issued by companies in developing
countries, as well as lending them money directly. Indeed, by September 1997, at its annual
meeting in Hong Kong, the IMF lobbied member-states to change its charter to allow it to
push countries towards full capital account liberalization.
The arguments for capital account liberalization and against capital controls can be
summarized thus:
Flows of foreign capital into a country can help improve productivity and this, in
turn, brings about a major increase in living standards. It also promotes integration of
economies into the world financial system; the increased availability of capital and diversity
of its source is good for growth.
Open capital accounts promote good policies: countries, which have, stable
governments, fair and consistent regulations, and attractive investment climates will attract
more funds. Capital market liberalization provides both a carrot and a stick; countries that
pursue such policies will find that they can attract more capital; those that do not will find
capital rapidly leaving.
Capital controls are micro-economically inefficient in that they hinder the optimal
allocation of resources i.e., money isn’t allowed to naturally flow to the most efficient or
166
successful companies, or investments. Controls also have large administrative costs, are
widely evaded, and give rise to corruption.
But the downside of the process proved to be painful, and a series of global financial
crises beginning in the late 1990s helped to start the reversal in the trend of rapid capital
market liberalization. True, the heavy inflow of capital into developing countries that
liberalized their capital accounts had pushed the value of those countries’ currencies upwards
against the U.S. dollar. But when foreign investors lost confidence in the economies of these
countries, they began to pull their money out. The value of the currencies then fell sharply
against the U.S. dollar, making it ever more difficult for the developing countries to pay back
their debts and causing foreign investors to lose even more confidence. The years after capital
market liberalization spread were punctuated by a series of financial crises, including the
Asian crisis in 1997, the Russian crisis in 1998, the Brazilian crisis in 1999, the crises in
Turkey and Argentina in 2001. Over a hundred countries have faced crises in the past 30
years. While a number of different factors have contributed to each, capital market
liberalization has usually been an important factor: Most of the crises have been precipitated
by the rapid flow of money out of the country, and in some cases, such as Thailand, the
country’s problems prior to the crisis had been exacerbated by rapid flows of money into the
country.
In 1997 the Asian crisis began when foreign exchange speculators began selling off
Asian currencies. The countries were stuck in a tight place. The way to stop money going out
of a country is to raise interest rates, but developing countries found that raising interest rates
was terrible for their banking sector. Higher interest rates mean that people and companies
who have borrowed money find it harder to pay it back. When they stop repaying, banks go
out of business and stop lending. Less developed countries don’t have strong stock markets
and so rely far more on bank finance to grow the economy and create jobs.
Bank closures can mean the economy stops growing. After currencies collapsed in
Thailand, South Korea and Indonesia, so did their banking systems. As things got worse,
commercial banks with long-term relations with many of the affected countries also reduced
their credit lines. The end result was massive bankruptcies and an increase in unemployment.
Ultimately some 12%-15% of Gross Domestic Product left these countries as capital flowed
out.
167
Of course, Thailand, South Korea, and Indonesia did not have perfect economies and
there were problems with some of their companies and banks, including shaky lending
practices; over investment in bubble assets, such as real estate; lack of regulation and
oversight—all of which contributed to the weakness in the region’s banks. But despite these
serious flaws, the crisis itself was triggered by the massive outflows of capital. Many people
began to question whether rapid widespread capital market liberalization was really a good
idea—what was the point of bringing in millions of dollars of foreign capital, driving up the
value of your own currency and then seeing it leave again? They noted that countries such as
China, India and Vietnam that have capital controls were relatively unaffected by the crisis.
In 1998 Malaysia imposed controls on hot money and, to some extent, was vindicated when it
turned out that these worked far better than people had predicted before they were imposed.
Critics of rapid capital account liberalization market say:
There is a difference between foreign direct investment (FDI), (that is, investment
in factories, businesses, and things that produce goods and services) and portfolio
investment in stocks and bonds, which tends to be more speculative. FDI is money that is
sunk into ownership of companies and property that can’t be pulled out of a country
overnight. Early supporters of capital account liberalization did not really think about the
differences between these two kinds of capital flows, but now while pretty much everyone
agrees that FDI is important, they worry about unregulated portfolio investment and the
effect it has on developing countries.
Many advocates of capital market liberalization claim that without capital market
liberalization, countries will not be able to attract foreign direct investment but there is little
evidence to support that conclusion. China, for example, is the largest FDI recipient in the
world and has a closed capital account (The Chinese government has made verbal
commitments to liberalize, but few measures have yet been taken).
Capital market liberalization was pushed even on countries where there was no
shortage of capital—those in East Asia, that were having a difficult time investing their
savings well. This is not necessarily a problem if a country has a strong regulatory framework
and financial sector. The G-7 groups of developed countries, for example, have liberalized
capital accounts and have not suffered major crises as a result.
168
Free capital mobility makes macro-economic management difficult, in good times, as
well as bad. In good times, the rush of money into a country can lead to an overvalued
exchange rate. That swells the country’s liquidity, which, in turn, fuels inflation. To avoid
inflation, countries often raise interest rates, but this simply makes matters worse, as more
capital is attracted into the country.
While many countries have had problems implementing capital controls, some have
done so with remarkable success, such as Chile and Malaysia. Even if controls are imperfect
and partially evaded, they still may help stabilize the economy (As Paul Volcker, former
chairman of the U.S. Federal Reserve, put it, a leaky umbrella still may provide some
protection on a rainy day.) But it’s important to distinguish between controls that stop capital
from coming in, as in Chile, and those that stop capital from flowing out, as in Malaysia. The
two types of controls have very different implications.
International financial markets are capricious. Even countries that have reasonably
good economic policies may find themselves suddenly facing higher interest rates, or a
broader loss of confidence as money is quickly pulled out. Changes in technology have
exacerbated the increase in volatility associated with capital market liberalization. When
capital movements were first liberalized, foreign exchange trading was far less developed and
communications were slower, so it was hard to imagine that it would be possible for
speculators and banks to take hundreds of millions of dollars out of a country overnight.
By the summer of 1999, the IMF’s chief economist, Michael Mussa, had publicly
acknowledged these risks, and the issue of the change in the charter was dropped. In
November 2001, the IMF’s new first deputy managing director, Anne Kreuger,
acknowledged that it might be desirable to impose capital controls in the event of a crisis. The
debate over capital controls has remained highly contentious, but even mainstream
economists have began to say that capital market liberalization should be done slowly and
only after certain conditions had been met such as:
Development of a strong banking sector that is able to handle large inflows and
channel them into productive investments.
A restructured and efficient corporate sector that can use inflows effectively and not
throw “good money after bad”.
169
A strong regulatory and legal regime that restricts monopolistic practices, ensures
prudential banking practices, and, when needed, regulates bankruptcy of debt-burdened
corporations.
A sound macroeconomic environment that avoids large fiscal deficits, which
exacerbates the overheating associated with capital inflows, and inflexible exchange rate
regimes, which can not handle the volatility of capital flows.
A strong system of prudential regulation, and laws that mandate proper accounting,
auditing, and reporting
No implicit government guarantees that encourage excessive inflows of short-term
capital.
As well, the idea of controls used as a preventive measure—to stop the build up of excessive
short -term liabilities—has become increasingly accepted by some top economists:
Fact remains that although free trade helps developing countries, the risks from
unfettered capital market liberalization are very high. There is no evidence that capital market
liberalization provides more benefits than one would get from opening up to foreign
investment, and that the benefits that do come from free movement of capital can be wiped
out by crises that cause growth to collapse.
There is no statistical evidence supporting that excessively rapid trade liberalization,
as well as capital market liberalization boosts economic growth or leads to more real
investment.
Studies at the World Bank and elsewhere showed that capital market liberalization
was systematically related to instability and crisis
Thus, system of forcing up on free economy and liberalization with little or no
control over incoming foreign funds incorporated major flaws inbuilt. The concept in itself
was a myth and possibly needed another hundred years of research before being forced
upon by UNO and other bodies on the developing countries. With a platform so weak to
safeguard speculative investments, the bubble had to develop one day or the other and
assume a mammoth proportion that none could ever imagine.
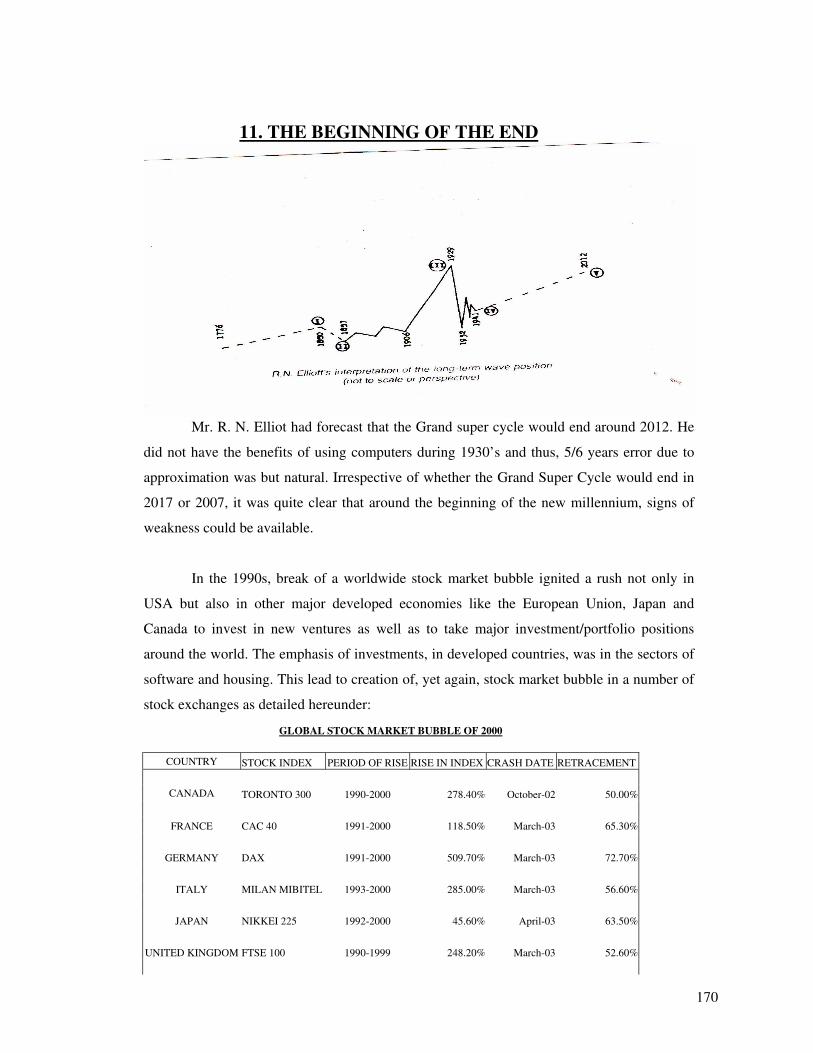
170
11. THE BEGINNING OF THE END
Mr. R. N. Elliot had forecast that the Grand super cycle would end around 2012. He
did not have the benefits of using computers during 1930’s and thus, 5/6 years error due to
approximation was but natural. Irrespective of whether the Grand Super Cycle would end in
2017 or 2007, it was quite clear that around the beginning of the new millennium, signs of
weakness could be available.
In the 1990s, break of a worldwide stock market bubble ignited a rush not only in
USA but also in other major developed economies like the European Union, Japan and
Canada to invest in new ventures as well as to take major investment/portfolio positions
around the world. The emphasis of investments, in developed countries, was in the sectors of
software and housing. This lead to creation of, yet again, stock market bubble in a number of
stock exchanges as detailed hereunder:
GLOBAL STOCK MARKET BUBBLE OF 2000
COUNTRY STOCK INDEX PERIOD OF RISE RISE IN INDEX CRASH DATE RETRACEMENT
CANADA TORONTO 300 1990-2000 278.40% October-02 50.00%
FRANCE CAC 40 1991-2000 118.50% March-03 65.30%
GERMANY DAX 1991-2000 509.70% March-03 72.70%
ITALY MILAN MIBITEL 1993-2000 285.00% March-03 56.60%
JAPAN NIKKEI 225 1992-2000 45.60% April-03 63.50%
UNITED KINGDOM FTSE 100 1990-1999 248.20% March-03 52.60%
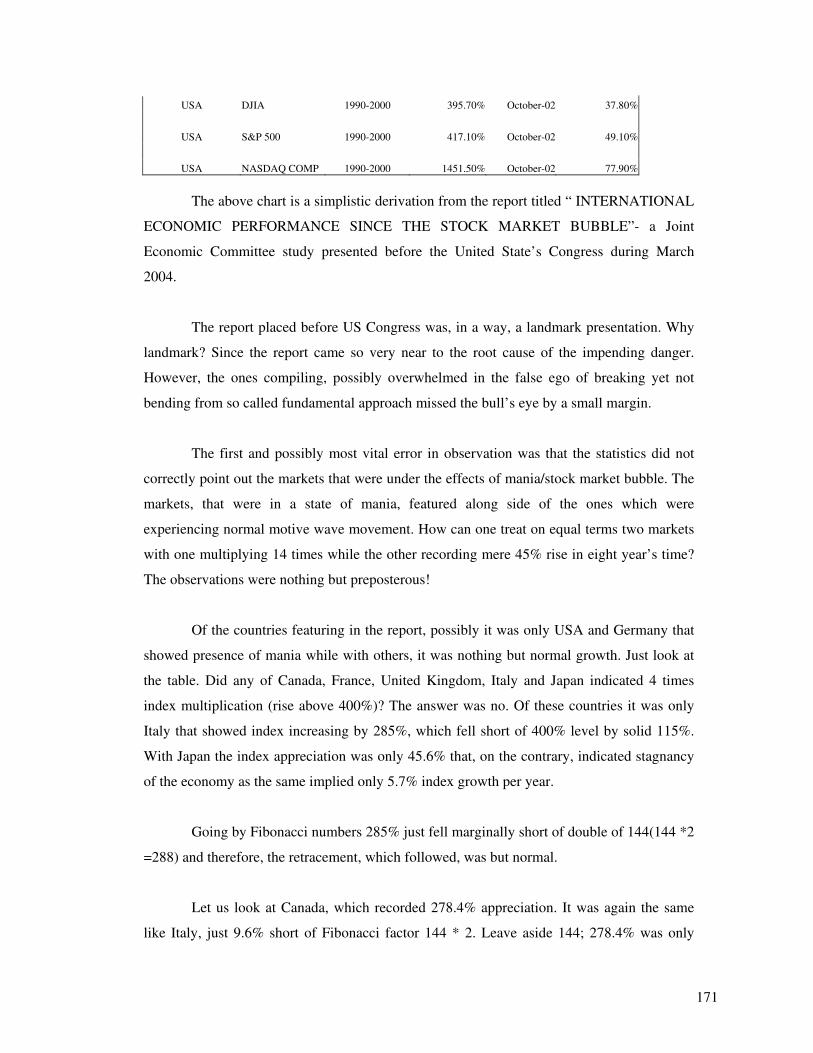
171
USA DJIA 1990-2000 395.70% October-02 37.80%
USA S&P 500 1990-2000 417.10% October-02 49.10%
USA NASDAQ COMP 1990-2000 1451.50% October-02 77.90%
The above chart is a simplistic derivation from the report titled “ INTERNATIONAL
ECONOMIC PERFORMANCE SINCE THE STOCK MARKET BUBBLE”- a Joint
Economic Committee study presented before the United State’s Congress during March
2004.
The report placed before US Congress was, in a way, a landmark presentation. Why
landmark? Since the report came so very near to the root cause of the impending danger.
However, the ones compiling, possibly overwhelmed in the false ego of breaking yet not
bending from so called fundamental approach missed the bull’s eye by a small margin.
The first and possibly most vital error in observation was that the statistics did not
correctly point out the markets that were under the effects of mania/stock market bubble. The
markets, that were in a state of mania, featured along side of the ones which were
experiencing normal motive wave movement. How can one treat on equal terms two markets
with one multiplying 14 times while the other recording mere 45% rise in eight year’s time?
The observations were nothing but preposterous!
Of the countries featuring in the report, possibly it was only USA and Germany that
showed presence of mania while with others, it was nothing but normal growth. Just look at
the table. Did any of Canada, France, United Kingdom, Italy and Japan indicated 4 times
index multiplication (rise above 400%)? The answer was no. Of these countries it was only
Italy that showed index increasing by 285%, which fell short of 400% level by solid 115%.
With Japan the index appreciation was only 45.6% that, on the contrary, indicated stagnancy
of the economy as the same implied only 5.7% index growth per year.
Going by Fibonacci numbers 285% just fell marginally short of double of 144(144 *2
=288) and therefore, the retracement, which followed, was but normal.
Let us look at Canada, which recorded 278.4% appreciation. It was again the same
like Italy, just 9.6% short of Fibonacci factor 144 * 2. Leave aside 144; 278.4% was only
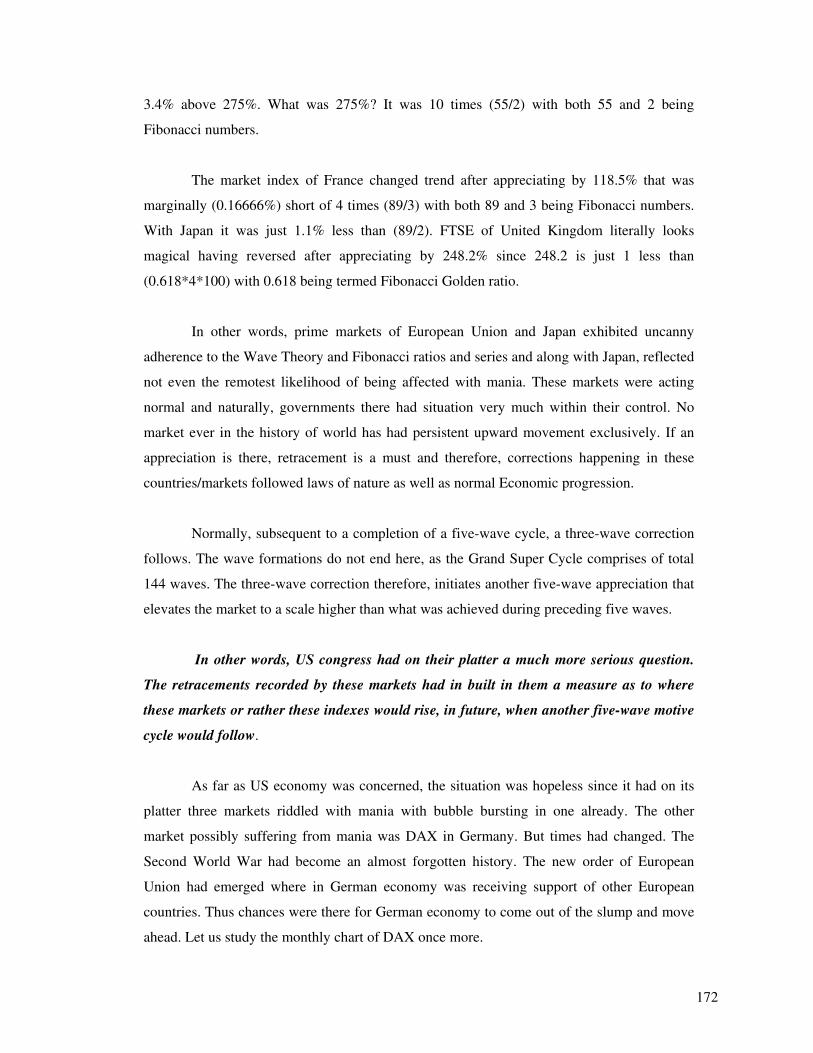
172
3.4% above 275%. What was 275%? It was 10 times (55/2) with both 55 and 2 being
Fibonacci numbers.
The market index of France changed trend after appreciating by 118.5% that was
marginally (0.16666%) short of 4 times (89/3) with both 89 and 3 being Fibonacci numbers.
With Japan it was just 1.1% less than (89/2). FTSE of United Kingdom literally looks
magical having reversed after appreciating by 248.2% since 248.2 is just 1 less than
(0.618*4*100) with 0.618 being termed Fibonacci Golden ratio.
In other words, prime markets of European Union and Japan exhibited uncanny
adherence to the Wave Theory and Fibonacci ratios and series and along with Japan, reflected
not even the remotest likelihood of being affected with mania. These markets were acting
normal and naturally, governments there had situation very much within their control. No
market ever in the history of world has had persistent upward movement exclusively. If an
appreciation is there, retracement is a must and therefore, corrections happening in these
countries/markets followed laws of nature as well as normal Economic progression.
Normally, subsequent to a completion of a five-wave cycle, a three-wave correction
follows. The wave formations do not end here, as the Grand Super Cycle comprises of total
144 waves. The three-wave correction therefore, initiates another five-wave appreciation that
elevates the market to a scale higher than what was achieved during preceding five waves.
In other words, US congress had on their platter a much more serious question.
The retracements recorded by these markets had in built in them a measure as to where
these markets or rather these indexes would rise, in future, when another five-wave motive
cycle would follow.
As far as US economy was concerned, the situation was hopeless since it had on its
platter three markets riddled with mania with bubble bursting in one already. The other
market possibly suffering from mania was DAX in Germany. But times had changed. The
Second World War had become an almost forgotten history. The new order of European
Union had emerged where in German economy was receiving support of other European
countries. Thus chances were there for German economy to come out of the slump and move
ahead. Let us study the monthly chart of DAX once more.
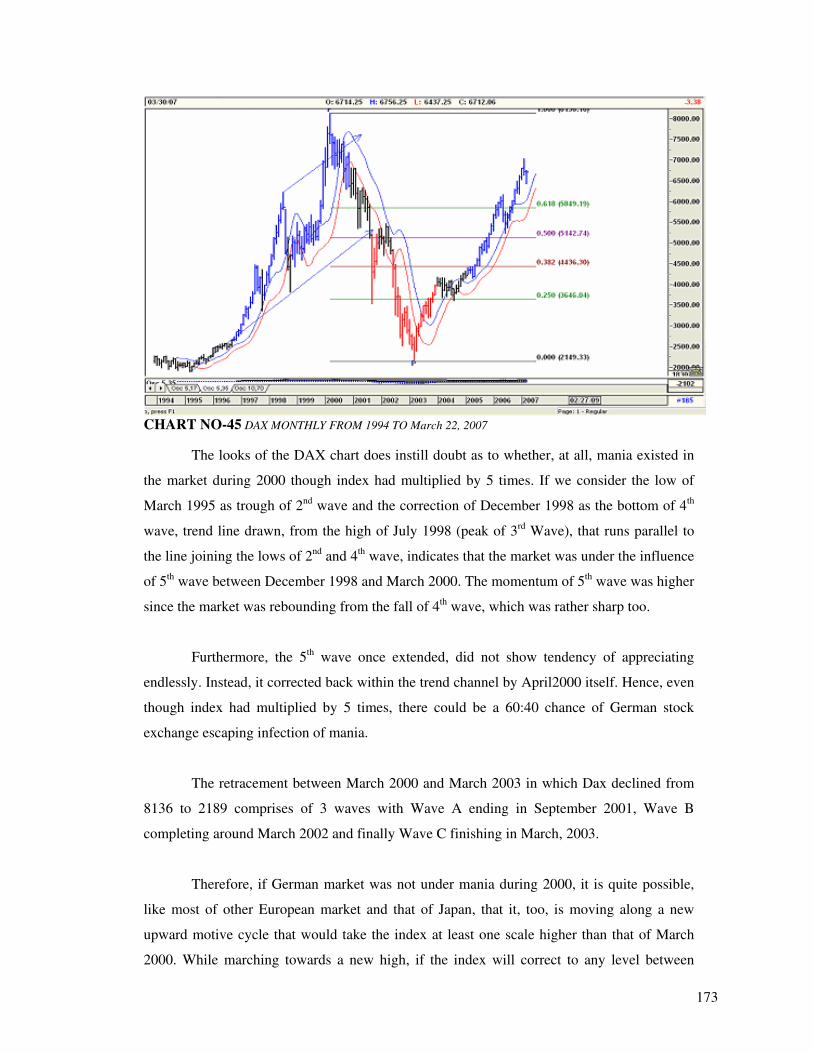
173
CHART NO-45 DAX MONTHLY FROM 1994 TO March 22, 2007
The looks of the DAX chart does instill doubt as to whether, at all, mania existed in
the market during 2000 though index had multiplied by 5 times. If we consider the low of
March 1995 as trough of 2nd wave and the correction of December 1998 as the bottom of 4th
wave, trend line drawn, from the high of July 1998 (peak of 3rd Wave), that runs parallel to
the line joining the lows of 2nd and 4th wave, indicates that the market was under the influence
of 5th wave between December 1998 and March 2000. The momentum of 5th wave was higher
since the market was rebounding from the fall of 4th wave, which was rather sharp too.
Furthermore, the 5th wave once extended, did not show tendency of appreciating
endlessly. Instead, it corrected back within the trend channel by April2000 itself. Hence, even
though index had multiplied by 5 times, there could be a 60:40 chance of German stock
exchange escaping infection of mania.
The retracement between March 2000 and March 2003 in which Dax declined from
8136 to 2189 comprises of 3 waves with Wave A ending in September 2001, Wave B
completing around March 2002 and finally Wave C finishing in March, 2003.
Therefore, if German market was not under mania during 2000, it is quite possible,
like most of other European market and that of Japan, that it, too, is moving along a new
upward motive cycle that would take the index at least one scale higher than that of March
2000. While marching towards a new high, if the index will correct to any level between
174
5849 and 5243 or may be slightly lower even, it would not vitiate the strength of its motive
wave by any means. Thus no matter how much DAX corrects, its circumstances is radically
different to that of NASDAQ/DJIA/S&P500.
When we come to USA the picture turns radically different. There is no doubt about
prevalence of mania in NASDAQ and that the fall between 2000 and 2002 constituted Wave
A of the correction. The appreciation between 2002 and now, is bounce back consequent to
Wave B with final decline of Wave C yet to mature.
Coming to DJIA, it is seen that the mania, that was gradually gripping the market till
2000, could set in full force aided by incomplete retracement between 2000 and 2002.
CHART - 46 S&P 500 MONTHLY FROM 1996 TO March 22, 2007
With S&P500 the situation looks even worse since the index was in mania during
2000.Thanks to incomplete retracement, traits of the same remained even though in Wave A
the index had corrected to its 4th wave levels. Like DJIA, in this case also, the retracement
between 2000 and 2002 was incomplete and there is an element of doubt whether the
correction under reference did at all constitute Wave A going by yearly chart.
In simple terms, circumstances that applied to USA did not apply to the rest of the
developed world. While US Congress should have investigated directions in which
disinvestments proceeds of global corrections of 2000-2002 went, they sat complacent that
GDP of all the G7 countries were recording positive growth.
175
Trillions of dollars had come out of the US and other markets and where this
money had headed to was The Most important question for US government and those
sitting at the helm of affairs in UNO. All the important markets in the world provided
opportunity to invest in derivatives comprising of Futures and Options and thus the
magnitude of profit booking could have been two times enough to finance for human
landing on Mars. Yet the report stated that there was nothing to worry at all. Why?
Because:
a) GDP growth was positive in most of developed countries during the recovery
phase. It had to be since rest of the developing countries was truly advancing under
the influence of motive wave. GDP computation for USA was, obviously, wrong as it
included appreciation in value of investments that belonged to investors from other
countries.
b) Industrial production was naturally rising in other developed countries while in
USA the statistics could be riddled under influence of inflation.
c) Employment rate was rising in rest of the developed countries consequent to
economic prosperity while in USA the decline had not started, as economic bubble
did not burst in true sense of the term.
Therefore, coming very near to detection of the disease and finding a cure thereof,
US Congress went the other way.
European Union along with Japan availed this opportunity to invest a part of the
proceeds of these disinvestments in third world countries where markets were still virgin or
almost virgin. West Asia also took up the lead herefrom. They had at their disposal huge
amount of petro-dollars. Furthermore, FDI were raining in to these countries from all parts of
the world. The sheikhs were not to be left behind. They too jumped in to the trade. World
Investment Report 2006 states: “West Asia is becoming a significant outward direct investor.
Traditionally most of the regions petro-dollars have gone in to the bank deposits and portfolio
purchase abroad particularly in United States. The present phase is witnessing substantial
outward FDI services in developing as well as in developed countries. One motivation for this
has been to forge stronger economic ties with emerging Asian giants China and India.”
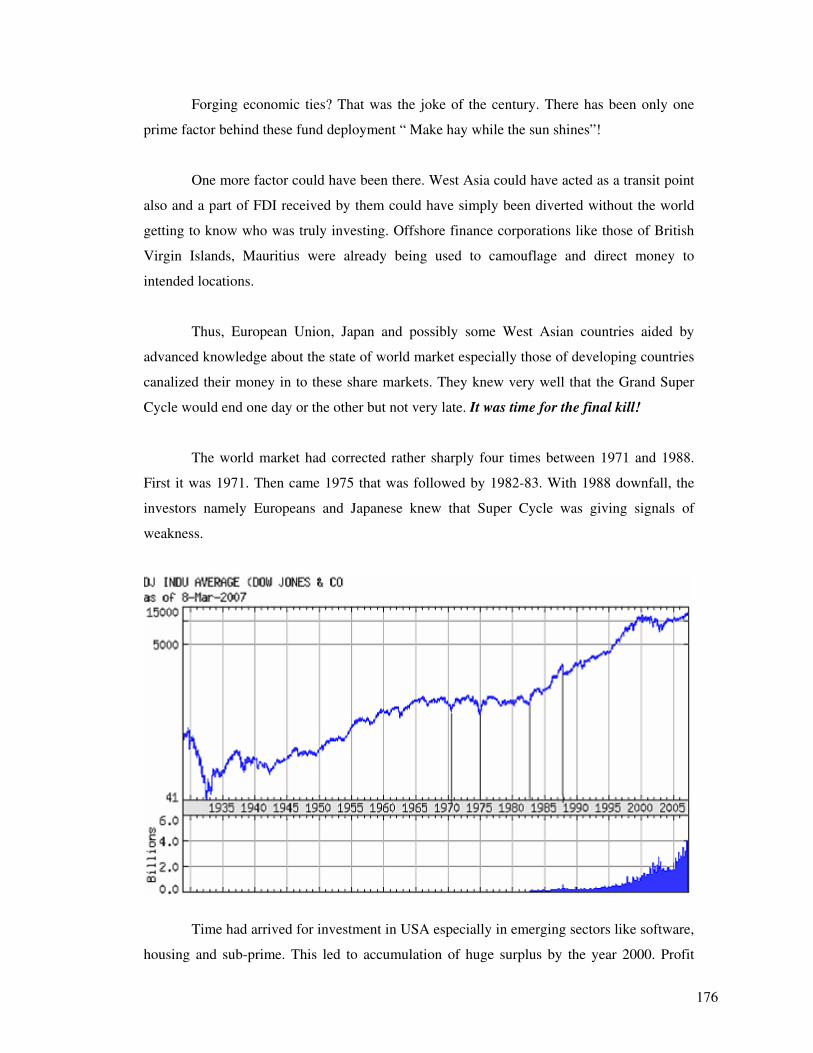
176
Forging economic ties? That was the joke of the century. There has been only one
prime factor behind these fund deployment “ Make hay while the sun shines”!
One more factor could have been there. West Asia could have acted as a transit point
also and a part of FDI received by them could have simply been diverted without the world
getting to know who was truly investing. Offshore finance corporations like those of British
Virgin Islands, Mauritius were already being used to camouflage and direct money to
intended locations.
Thus, European Union, Japan and possibly some West Asian countries aided by
advanced knowledge about the state of world market especially those of developing countries
canalized their money in to these share markets. They knew very well that the Grand Super
Cycle would end one day or the other but not very late. It was time for the final kill!
The world market had corrected rather sharply four times between 1971 and 1988.
First it was 1971. Then came 1975 that was followed by 1982-83. With 1988 downfall, the
investors namely Europeans and Japanese knew that Super Cycle was giving signals of
weakness.
Time had arrived for investment in USA especially in emerging sectors like software,
housing and sub-prime. This led to accumulation of huge surplus by the year 2000. Profit
177
taking and disinvestments during the years 2000 and 2001 provided fresh opportunities of
amassing further wealth if markets of third world countries could be invaded. The rise of
global resilience subsequent to September11, 2001 air strikes offered this opportunity too to
the investors. Investments rained in all parts of the globe in the camouflage of FDI. The
markets of third world were up for the grab and the perpetrators of mania were surely not
letting the opportunity slip out of their hands. The consequences were known but who
bothered, since everything was fair in love and war! It was war that no one dared to interpret
what it was.
The corrections of 2000 gave a signal of impending deflation. Gold value after
sharply rising from $251.70 of August 1999 to $338 by October 1999 actually fell to
$254.45 by April 2001. This was sign that real money was loosing purchasing power. Yet
none truly noticed.
Gold gave second notice of impending depression between May and October 2006
especially from July 2006 and October 2006. During this time value of gold declined from
$676 to $559. Between July and October 2006 most of the capital markets forged ahead.
DJIA advanced from 10683 to 12167. NSE in India moved from 2878 to 3782.
This was an impossibility being worked out in grand scale. It was nothing but
inflation that was causing markets to appreciate from one plane to the other while the
purchasing power of real money was absorbing the brunt by sacrificing its strengths. It is
true that within inflation only are sown the seeds of deflation which gets noticed only when
the roots have penetrated deep inside the innermost core of the economy. Thus seeds of
deflation had germinated already but, as usual, escaped notice of all. Those who detected
cried but their voices were lost in the mêlée of ecstasy of market appreciation.
Then came February/ March 2007. Yet again there was avalanche in the world
market. But this time it was different. Credit balloons in USA and many countries around the
world started showing signs of being at the point of bursting. Tide had turned possibly.
I have discussed in detail what would be the effect of this balloon bursting. No doubt
its holocaust will dwarf the size of the same pictured during Hiroshima bombing. I have, over
and over, tried to build up the inference that it was a handful of countries under European
178
Union, Japan mainly and in smaller scale west Asian countries that being propelled by
objective of amassing colossal gains have engineered this mania.
These investors availed opportunity of each and every correction to gain entry as well
as strengthen their foothold over capital markets of USA and those of the third world. As a
matter of fact, as shown by the charts, corrections have been utilized to shift investments
from one market to the other (like from NASDAQ to DJIA and markets of third world, from
gold to stock market and vice versa etc). The corrections have also helped these investors in
pushing out small and medium investors from the market and assume greater control. No
doubt, agencies like UNO and World Bank acted as their publicity agents and various fund
houses cum mutual funds as collaborators.
China government, on March 21, 2007, disallowed reinvestment of proceeds of sales
in market. The message was clear. “You have been messing with us. Pack up your baggage
and get lost”. But will this help? Even if re-investment is doomed, can the government stop
liquidation of investment and profit booking? Hence the damage that is to follow will follow.
When? Time will speak for itself. The might of the investors are seen. They made Thai SET
crash from 738 to 588 (20.32%) on December 19, 2006 and forced Shanghai Composite fall
from 3050 to 2763 (10.4%) on February 27, 2007.
It is well understood that withdrawal of investments, though sharp, will never be at a
time. It has to be gradual, as the investors will have to find buyers to offload their spoils. The
volume of their holding is so huge that mass exodus, at a time, will be next to impossible. In
other words, even the sudden crash, that follows economic bubble, placed on an extended
time frame, will take some time as well. In other words, even during fall, these speculators
will provide sudden push/momentum to the market that will lure common investors to take
entry and thereby facilitate these speculators with opportunity to offload their holdings.
Needless to state, that these holdings will soon depreciate to nothingness, in future, paving
way for a total chaos.
However having identified the creators of this economic bubble, it becomes absolute
necessary that an effort be made to determine a possible time frame as to when this bubble
could possibly burst. In my personal opinion, the bursting process has already started. Why
do I say so?
179
Let us turn our attention back to 1988. I, personally feel, that this year was a year
when the major players sat down together and plotted the plan to carry out this
financial/economic warfare. There are mainly two reasons for me to say so.
First reason- the investing countries, as the charts indicate, strictly follow Wave
Theory and Fibonacci ratios and numbers. Strict adherence to various Fibonacci numbers
with regard to market turn around in 2000 would not happen otherwise unless pre-planned
well in advance. The digits of 1988 added, result 8, which again is a Fibonacci number
providing, first reason for being chosen to commence the large-scale financial coup. The
logic doesn’t bite? It may not as 2006 too added comes to 8 so does 1997. Now 2006 was
certainly a year of activity and involved profit booking on a large scale and also shifting of
investments to and from gold. 1997 was rather a timid year possibly left out since it did not fit
in to Fibonacci Benner cycle of 18 years.
Second reason- 1988 was chosen since it completed the Kondratieff Wave cycle of
55 years since 1933. Nikolai Kondratieff, a Russian economist observed in 1920 that an
economy completes a cycle of trough-exuberance-trough in a time span of 55 years.
Kondratieff noted that war usually happens at the end of “troughs. A glance over the DJIA
chart and also the diagram of Grand Super Cycle, drawn by none other than Mr. R.N. Elliot
himself, indicated that the 5th and the ultimate motive wave had started from 1933. Though
the motive wave was to last till early stages of 2000, it was imperative, going by Kondratieff
cycle that the present wave would end around 1988. A war had to be there that could end the
cycle. The same war was also supposed to provide reasons/momentum for the last leap
upwards. The end of Iran Iraq war that lasted from 1980 to 1988 fitted in to prescription as if
designed by destiny.
Having selected 1988, it was known that the last bit of the 5th wave could last
between 16 to 20 years going by Fibonacci Benner cycle. In other words, the time span for
feverish activity was already set. It could be anything between 16 to 20 years. Thus earliest
the balloon was likely to burst was 2004 (1988+16) and latest was 2008.
However, the whole operation was not simple. It involved rotation of investments
from one sector to the other as well as from one market to the other. Furthermore, the
investors had to ensure that if one market crashed, the other had to stand up so that common
180
investing crowd could follow the trend and tip toe their design as seen in the fable Pied Piper
of Hamlin.
Here again, different Fibonacci numbers were chosen for likely cycle rotation time
span. Investments flowing since 1988 were to be allowed to appreciate for nearly 10 years
(totaling to 1). Thus choice fell up on a year where 10 minus 1 = 9 would become the
numeric number for the year concerned. British rule in Hong Kong ended in July 1997. Thus,
HANGSENG was now the venue where investments could also flow in. The choice fell on
1998 in which there was quite a bit of market fluctuation since the same involved shifting of
investments and possibly the first lot of profit booking.
After 1, it had to be 2 and thus 2000 was the year of choice. Numerically it came to 2
and it was exactly 12 years from 1988. 1+2 (12) made 3 also. Therefore, in 2000 a major part
of profit booking was done. In order to escape detection of plot, a major shift of investments
were carried out. NASDAQ was no more hot choice any more. Profits derived therefrom
were shifted to S&P500, DJIA and also to markets of third world countries.
2 had to be followed by 3 (Fibonacci number again!). Thus during 2001, BOJ
reduced their interest rates. EU and US FED too followed suit. A part of profit booking done
during 2000 and also during initial part of 2001, moved in to investment market. Subsequent
to September 11 attack; investments flowing in to capital markets were given red carpet
welcome. 3 were not to be a year of profit booking. The year was marked for investment else
BOJ would not have reduced their interest rates during September 2001 when world was still
shivering from the shock of collapse of twin towers of Manhattan.
After 3 the next Fibonacci number was 5, which equaled the numeric of the year
2003. With 1 and 2 being years earmarked for profit booking, 3 &5 were years selected for
investment. It had to be like that else; the 5th wave would not survive 20 years life span. The
capital markets around the world buzzed with new investments flowing in. Markets of third
world, especially that of India and China, became the two most favorites venues for
investment. The indexes of third world countries leaped up. All were happy. The world
economy was thought to be marching ahead.
In Fibonacci series, 5 is followed by 8, which was year 2006. The balloon, most
likely, was finally punctured this year around May. But the air within could not gush out at a
181
time. It had to be regulated in a manner that gains and capital sum could safely be encashed
and thereafter be repatriated safely. Fibonacci Benner cycle span of 18 years was complete.
The investments along with profits had multiplied to an extent unimaginable and the whole
thing could not come out at once.
The first lot of profit booking was done during May June 2006. The world economy
shook at its virulence. The investors had to lift up the spirits firstly to find buyers for their
second lot of offloading and secondly to camouflage their entire operation. The pundits of
economics had to vouch that everything was in order, as that would only lure fools to enter
the stock markets.
But everything said and done, it was not an easy order to carry out. Thus, the ploy
for selling gold came about. This had double advantage. Firstly with purchasing power of
money declining, capital market indices would automatically rise and secondly, proceeds of
disinvestments of gold could, under reduced value of money, provide necessary momentum
for indices to shoot upwards under influence of inflation.
The predators knew one thing for sure that the majority of world population was
fools who understood interpretation of media that were mostly founded on superficial dazzle.
Thus if indices could be made to appreciate by speculative means, some buyers would
definitely flock in to the market. One thing was additionally assuring factor for the investors
as they had already roped in most of the governments. Be it USA or Brazil, be it Argentina or
India, Finance Ministries were now in Catch 22 situations.
Though declining purchasing power and general negative mood was chasing away
common buyers and traders, Governments had emerged in the market as buyers since they
had no other alternative. It was but natural that if markets would fall, the governments would
follow since populace of no country would tolerate a Government that could have led the
country to a state of financial ruin. Therefore, governments had no option but to empty their
reserves, divert tax payers’ money to make the index keep floating high somehow even by
means of jugglery and falsehood.
The operation was simple. Just follow the raging inflation level and the indices
would automatically rise since purchasing power of money was declining. The statistics
would show prosperity while nothing would truly be there. And since governments would
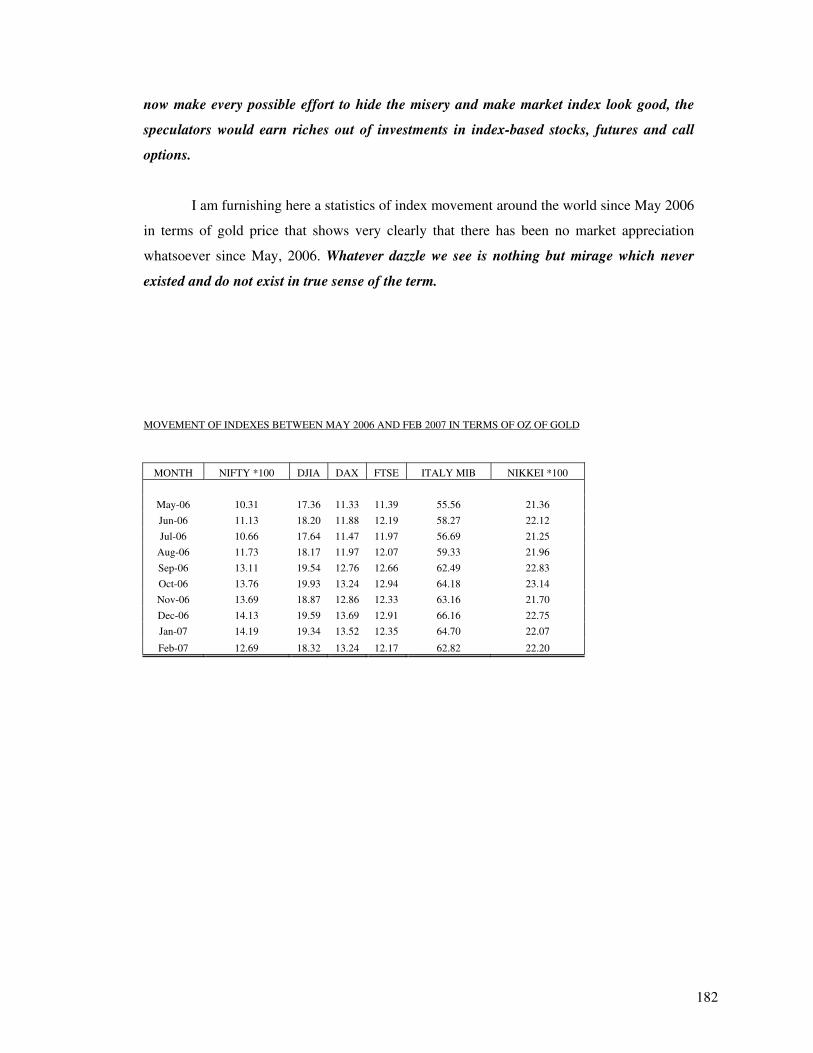
182
now make every possible effort to hide the misery and make market index look good, the
speculators would earn riches out of investments in index-based stocks, futures and call
options.
I am furnishing here a statistics of index movement around the world since May 2006
in terms of gold price that shows very clearly that there has been no market appreciation
whatsoever since May, 2006. Whatever dazzle we see is nothing but mirage which never
existed and do not exist in true sense of the term.
MOVEMENT OF INDEXES BETWEEN MAY 2006 AND FEB 2007 IN TERMS OF OZ OF GOLD
MONTH NIFTY *100 DJIA DAX FTSE ITALY MIB NIKKEI *100
May-06 10.31 17.36 11.33 11.39 55.56 21.36
Jun-06 11.13 18.20 11.88 12.19 58.27 22.12
Jul-06 10.66 17.64 11.47 11.97 56.69 21.25
Aug-06 11.73 18.17 11.97 12.07 59.33 21.96
Sep-06 13.11 19.54 12.76 12.66 62.49 22.83
Oct-06 13.76 19.93 13.24 12.94 64.18 23.14
Nov-06 13.69 18.87 12.86 12.33 63.16 21.70
Dec-06 14.13 19.59 13.69 12.91 66.16 22.75
Jan-07 14.19 19.34 13.52 12.35 64.70 22.07
Feb-07 12.69 18.32 13.24 12.17 62.82 22.20
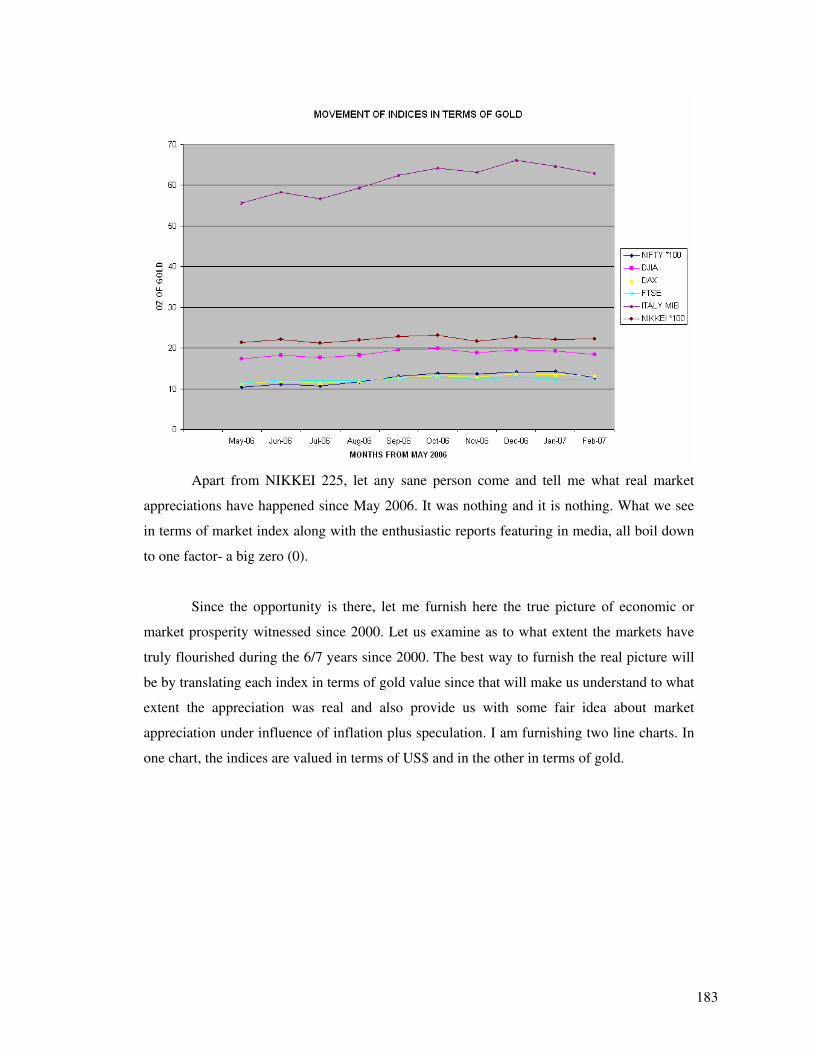
183
Apart from NIKKEI 225, let any sane person come and tell me what real market
appreciations have happened since May 2006. It was nothing and it is nothing. What we see
in terms of market index along with the enthusiastic reports featuring in media, all boil down
to one factor- a big zero (0).
Since the opportunity is there, let me furnish here the true picture of economic or
market prosperity witnessed since 2000. Let us examine as to what extent the markets have
truly flourished during the 6/7 years since 2000. The best way to furnish the real picture will
be by translating each index in terms of gold value since that will make us understand to what
extent the appreciation was real and also provide us with some fair idea about market
appreciation under influence of inflation plus speculation. I am furnishing two line charts. In
one chart, the indices are valued in terms of US$ and in the other in terms of gold.
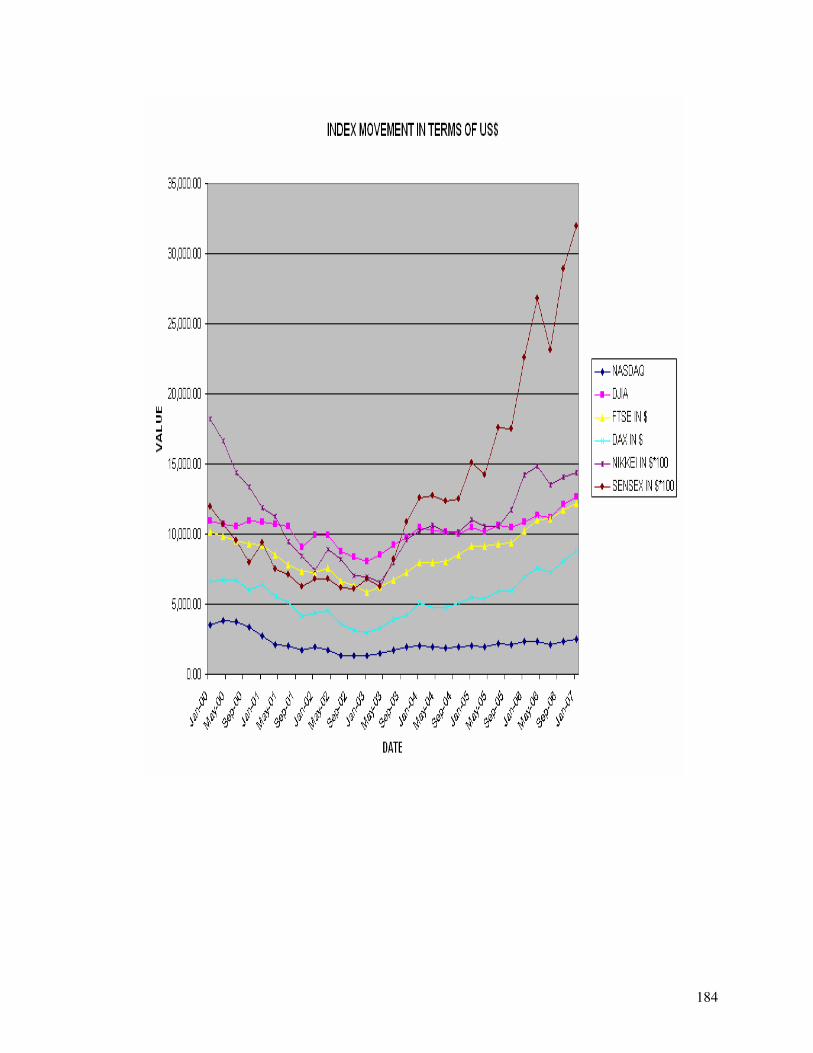
184
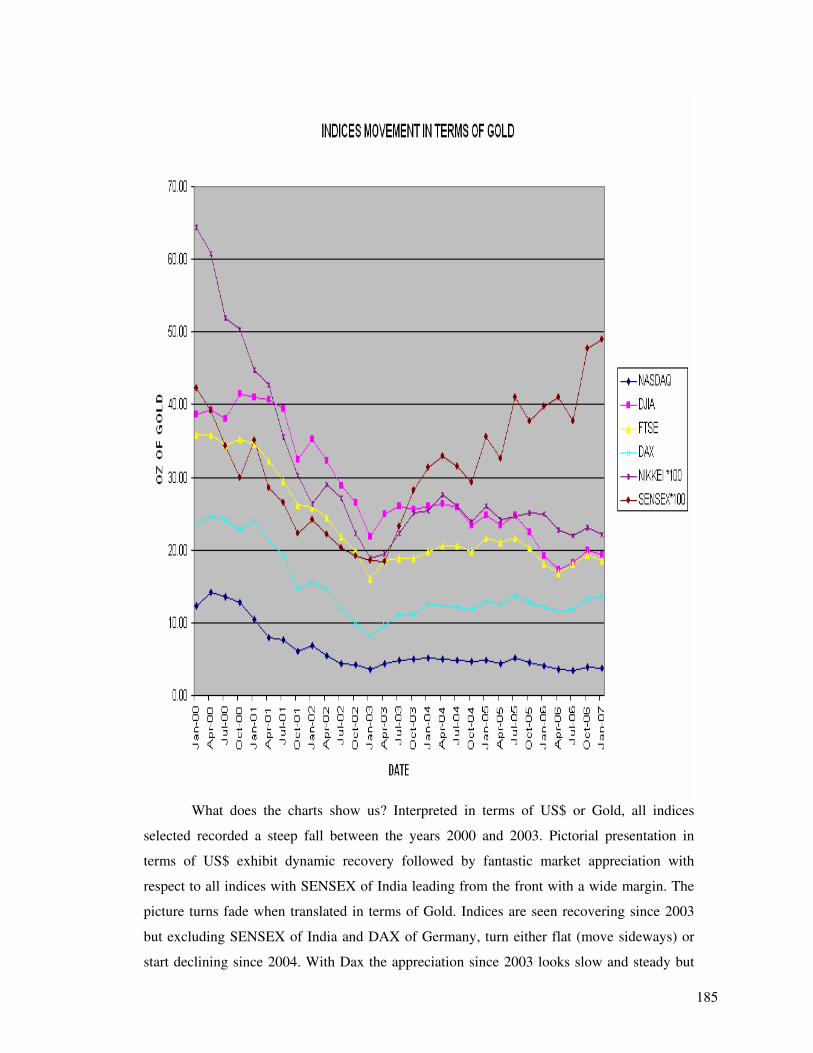
185
What does the charts show us? Interpreted in terms of US$ or Gold, all indices
selected recorded a steep fall between the years 2000 and 2003. Pictorial presentation in
terms of US$ exhibit dynamic recovery followed by fantastic market appreciation with
respect to all indices with SENSEX of India leading from the front with a wide margin. The
picture turns fade when translated in terms of Gold. Indices are seen recovering since 2003
but excluding SENSEX of India and DAX of Germany, turn either flat (move sideways) or
start declining since 2004. With Dax the appreciation since 2003 looks slow and steady but
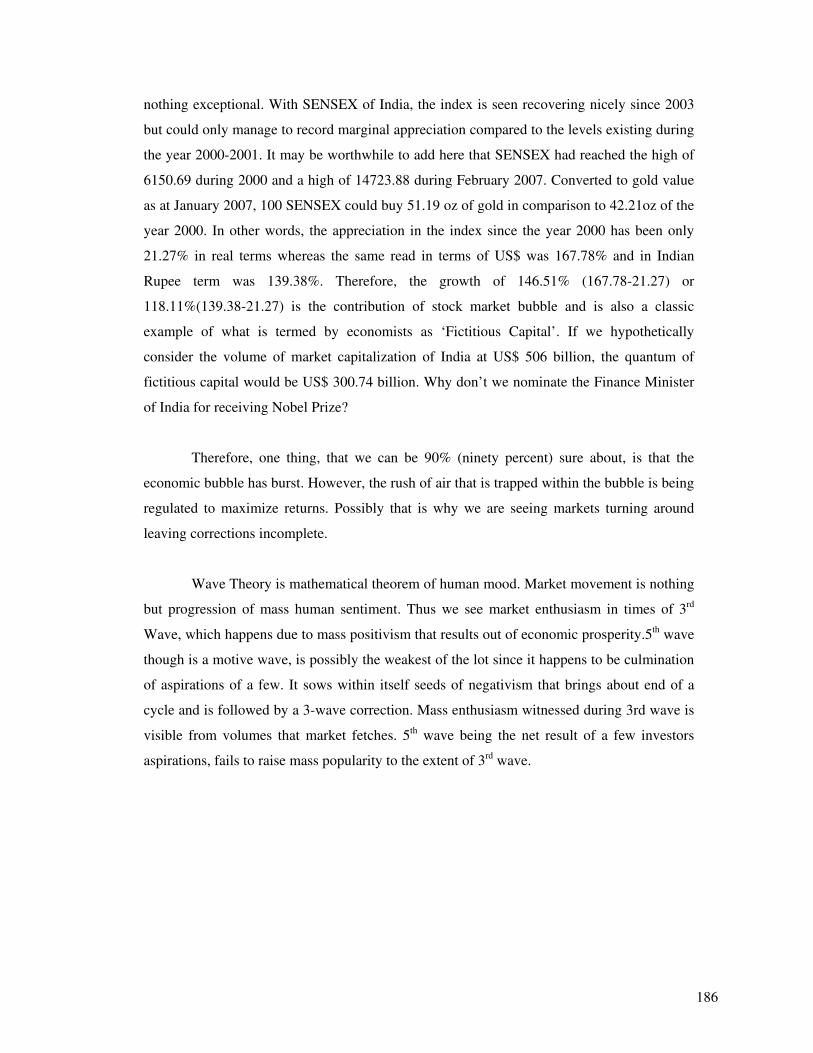
186
nothing exceptional. With SENSEX of India, the index is seen recovering nicely since 2003
but could only manage to record marginal appreciation compared to the levels existing during
the year 2000-2001. It may be worthwhile to add here that SENSEX had reached the high of
6150.69 during 2000 and a high of 14723.88 during February 2007. Converted to gold value
as at January 2007, 100 SENSEX could buy 51.19 oz of gold in comparison to 42.21oz of the
year 2000. In other words, the appreciation in the index since the year 2000 has been only
21.27% in real terms whereas the same read in terms of US$ was 167.78% and in Indian
Rupee term was 139.38%. Therefore, the growth of 146.51% (167.78-21.27) or
118.11%(139.38-21.27) is the contribution of stock market bubble and is also a classic
example of what is termed by economists as ‘Fictitious Capital’. If we hypothetically
consider the volume of market capitalization of India at US$ 506 billion, the quantum of
fictitious capital would be US$ 300.74 billion. Why don’t we nominate the Finance Minister
of India for receiving Nobel Prize?
Therefore, one thing, that we can be 90% (ninety percent) sure about, is that the
economic bubble has burst. However, the rush of air that is trapped within the bubble is being
regulated to maximize returns. Possibly that is why we are seeing markets turning around
leaving corrections incomplete.
Wave Theory is mathematical theorem of human mood. Market movement is nothing
but progression of mass human sentiment. Thus we see market enthusiasm in times of 3rd
Wave, which happens due to mass positivism that results out of economic prosperity.5th wave
though is a motive wave, is possibly the weakest of the lot since it happens to be culmination
of aspirations of a few. It sows within itself seeds of negativism that brings about end of a
cycle and is followed by a 3-wave correction. Mass enthusiasm witnessed during 3rd wave is
visible from volumes that market fetches. 5th wave being the net result of a few investors
aspirations, fails to raise mass popularity to the extent of 3rd wave.
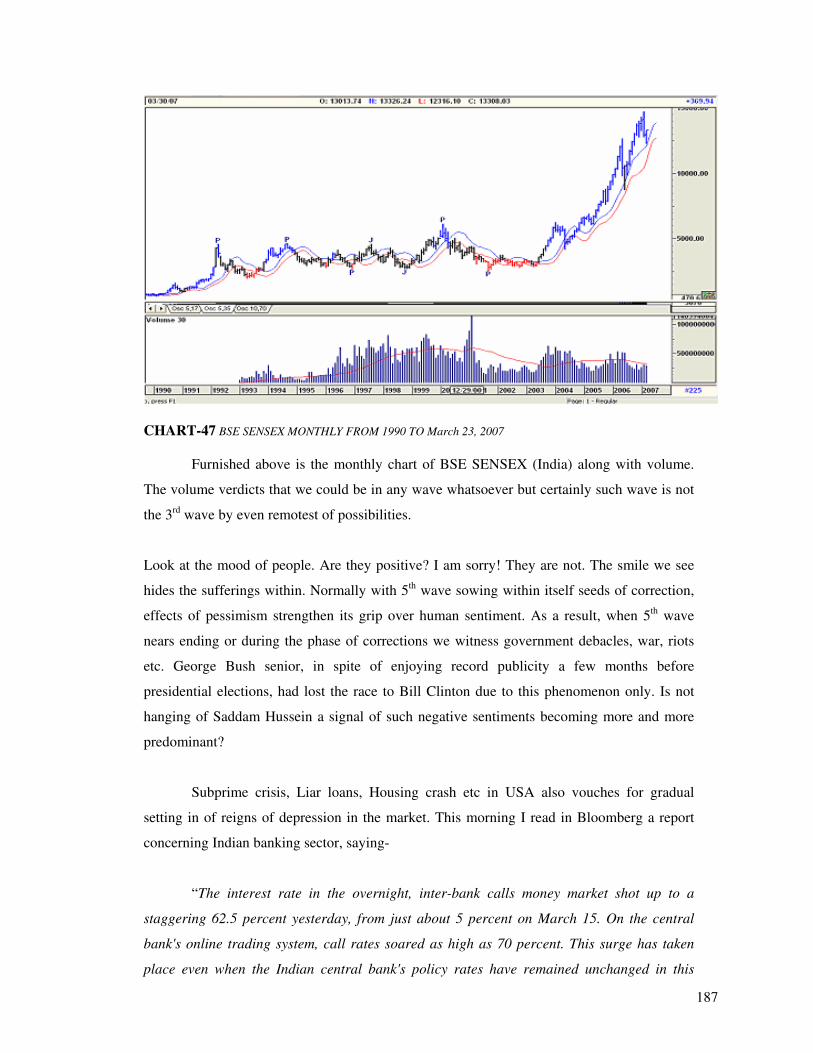
187
CHART-47 BSE SENSEX MONTHLY FROM 1990 TO March 23, 2007
Furnished above is the monthly chart of BSE SENSEX (India) along with volume.
The volume verdicts that we could be in any wave whatsoever but certainly such wave is not
the 3rd wave by even remotest of possibilities.
Look at the mood of people. Are they positive? I am sorry! They are not. The smile we see
hides the sufferings within. Normally with 5th wave sowing within itself seeds of correction,
effects of pessimism strengthen its grip over human sentiment. As a result, when 5th wave
nears ending or during the phase of corrections we witness government debacles, war, riots
etc. George Bush senior, in spite of enjoying record publicity a few months before
presidential elections, had lost the race to Bill Clinton due to this phenomenon only. Is not
hanging of Saddam Hussein a signal of such negative sentiments becoming more and more
predominant?
Subprime crisis, Liar loans, Housing crash etc in USA also vouches for gradual
setting in of reigns of depression in the market. This morning I read in Bloomberg a report
concerning Indian banking sector, saying-
“The interest rate in the overnight, inter-bank calls money market shot up to a
staggering 62.5 percent yesterday, from just about 5 percent on March 15. On the central
bank's online trading system, call rates soared as high as 70 percent. This surge has taken
place even when the Indian central bank's policy rates have remained unchanged in this
188
period. The Reserve Bank of India borrows surplus funds in the banking system at 6 percent
and lends, when needed, at 7.5 percent.”
Does not the report above exhibit the sorry state of affairs and loss of liquidity at our
banks too? The report further states:
With inflation beginning to crawl up since September, easy money conditions have
been untenable for a while. And yet, with inflows of overseas investment accelerating, the
Reserve Bank ended up buying almost $8 billion of the U.S. currency from November to
January to keep the rupee from rising too much, too quickly. Then, to contain the spill of
domestic liquidity from its dollar purchases, the central bank had to preempt funds in the
banking system by increasing the ratio of deposits that commercial banks have to set aside as
cash.
The results haven't been great. Inflation is running at 6.5 percent, a full percentage
point higher than the Reserve Bank's tolerance level.
The news reports points directly at where we stand. Reserve Bank of India did not
import $ 8 billion whimsically. It bought the amount since they had to meet the transfer
proceeds of disinvestments of foreign investors. Do we need further proofs to authenticate
that the economic bubble has burst?
Study of Socio Economy relates wave theory to many human habits and life style.
The new science of socionomics states that social actions are not causal to changes in “Social
mood,” but rather, changes in “social mood” motivate changes in social action. Humans'
unconscious impulses to follow the crowd affect the emergence of “social mood trends,”
which in turn shape the tone and character of social action. This perspective applies across all
realms of collective social activity – including the economy, finance, politics and the broader
culture. There have been studies about correlation of economic health/environment to length
of ladies skirts also (Termed Hem Theory- Harvard University).
Consider the mounting evidence. Horror movies are pouring out of the studios.
“Filmnoir” has turned ultra-violent. By the end of this year and into 2007, theaters will show
an increasing number of dark, disturbing film titles, such as “Grind House,” “Black
189
Christmas,” “Snuff Movie,” “Saw 3” and a remake of the 1974 groundbreaking horror film
“Texas Chainsaw Massacre.” Cable television network Showtime is following suit with its
new dark dramedy about a “heroic” serial killer, who preys on, well, other serial killers.
In July, North Korea partly failed in its testing of multi-stage missiles, but then
followed those botched tests with an apparently successful underground nuclear detonation.
The United Nations quickly responded with sanctions. But North Korea proudly used its fresh
status as the world’s ninth nuclear power to categorize the sanctions as a “declaration of
war,” even snubbing its nose at longtime ally China, then peculiarly apologizing for its
actions. Exclusionism is rising in the form of anti-Semitism and anti-immigration protests
across Europe, the Americas and elsewhere. Mexico’s president is denouncing U.S.
immigration laws, while the U.S. Congress looks at cracking down on Mexican border
jumpers. The president of Venezuela is publicly calling the U.S. president “a killer, a
genocidal murderer and a madman." Xenophobia is thriving: walls and fences are being
planned or built in Israel, Saudi Arabia and on the U.S. border with Mexico. There are plans
to encircle Baghdad, a city of millions, with a network of ditches. China has hastily built a
wall on parts of its border with N. Korea.
Free trade coalitions are fraying as “the costs of trade have become more important to
many voters than the benefits” (Wash. Post. May 13, 2005). The Chinese are in a fit of rage
over actions taken by the Japanese government over half a century ago. The United States has
been mired in war for five years. A wave of anti-America sentiment is rampant worldwide.
On May 27, 2005, Islamic groups observed the first “international anti-U.S. protest day.”
Anti-U.S. mobs gather violently and nonviolently across the globe in both ally and enemy
countries, not excluding the United States itself. The popularity of religion is soaring. Clinical
depression is on the rise. The electorate is polarizing into “red” and “blue” states like never
before.
Pornography spam is turning to themes of brutality. Car designs are changing from
angularity to the squat, rounded lines of the 1930s. Vicious street gangs are proliferating
throughout America, financed by severe market imbalances due to prohibition, just as in the
1930s. Smoking prohibition has reached such a high in the United States that the Omaha,
Neb., Police Department urges residents to call 911 to report anyone seen smoking in public.
Senseless violence in U.S. schools grabs news headlines almost daily. Record profits are
190
taken at Nevada casinos, a sign of the go-for-broke mentality that historically precedes a
crash.
Popularity of different games and sports has proved to move up and down directly in
relation to change of waves of economic progression. For example sports like Rugby, soccer,
wrestling are termed favorable during bearish time due to their rugged nature, brutality etc
that helps human sentiment to correlate the sport with sentiments of pessimism and anger that
dwells within. Games like cricket, baseball etc gain popularity during bull cycle due to their
inbuilt sophistication that goes well with mood of happiness that prevails in this phase.
Look at the happenings of World Cup Cricket 2007.
First: Pakistan (tipped as one of the favorites and champion of past) looses to West
Indies and then to Ireland and goes out of the tournament.
Second: Bangladesh defeats India (runner up of previous world cup)
Third: Bob Woolmer, coach of Pakistan gets murdered.
Fourth: Sri Lanka beats India with later going out of the tournament.
What is be the net result of all these? If India and Pakistan go out of the tournament
its viewership would reduce by minimum 60 to 80% and TRP in direct proportion thereof.
The most prominent tournament of cricket reduced to a state of mere formality. With India
being pushed out of tournament how many viewers will watch the telecast? What is the
general message?
Cricket is loosing popularity. Bookies are not making much money by betting in
favorable direction any more.
In other words, mood has changed. Market trends have changed too. It is a matter of
time now for the air out of the bubble to gush out which, to start with, will be slowly with
volume of exit increasing directly proportional to the extent/level of deflation of the bubble.
At present what we are having is “ Silent Crash”. The Crash, which will accompany a bang,
may take some time to mature.
191
Whatever may be, whichever may be the manner in which the economic bubble will
deflate, fact remains, the pin has struck the balloon and no plaster or glue invented ever
can seal this hole and stop air from gushing out.
In spite of knowing who were the ones causing this economic bubble, how it has
grown and what devastation it might leave about, a question does come in mind that just by
deployment of money this kind of euphoria and that too, in this colossal magnitude can not be
created. Mass hysteria, even for a short while, must have been there in between which
provided markets the initial momentum; else operation of this proportion could never
consolidate.
Think of it, a mass euphoria! A global challenge or country specific challenge! A
mass positivism is usually envisaged during progression of 3rd wave but when market was
recovering from 4th wave like in 1988/2000, such influence could only generate out of some
external shocks. Rather to be precise such external shocks were called for that motivated
people to revolt against direction of negativity.
A number of wars had happened in between, like Afghanistan War, Gulf War etc but
their effects had been temporary. Further more, Afghanistan war and/or Gulf war would not
have such significant effect on human sentiments of third world.
Therefore, there had to be events that threw challenge on humanity to revolt and
turn around. Moreover, such events or like ones must have kept on
happening/perpetuating, whenever the markets seemed to slacken. Human sentiments
follow fractal movement, which are similar in dissimilarity. In other words magnitude of
reaction varying from person to person, from state to state, the nature of incidents had to
be similar that propelled mass to retaliate in positive direction and consolidate to move
forward.
Going by Kondratieff ideology, it had to be war or something akin to that. This had
to be some thing prophesied by philosopher Kierkegaard, who posited that progress was
never smooth – “In life, only sudden decisions, leaps or jerks can lead to progress.
Something decisive occurs always only by a jerk, by a sudden turn which neither can be
predicted from its antecedents nor is determined by them”. Paul Davies in The Cosmic
192
Blueprint had said, “ Typically, errors in ordinary dynamical systems grow in proportion to
time. By contrast, in a chaotic system, the errors grow at an escalating rate; in fact, they
grow exponentially with time”.
That exactly hits the bull’s eye. There had to be incidents or better to say, incidents
were engineered to be there that created chaos. The idea was that the same chaos would
lead to mass revolting and positive reactions out of such resilience would grow at an
escalating rate, exponential with time and possibly in due course develop in to a huge
economic bubble. No wonder world economy turned around after September 11,2001 air
strikes on twin towers of Manhattan!
War in the age of technological integration and globalization has eliminated the
right of weapons to label war and, with regard to the new starting point, has realigned the
relationship of weapons to war, while the appearance of weapons of new concepts, and
particularly new concepts of weapons, has gradually blurred the face of war. Does a single
"hacker" attack count as a hostile act or not? Can using financial instruments to destroy a
country's economy be seen as a battle? And should an assessment of wartime actions look at
the means or the results? Obviously, proceeding with the traditional definition of war in
mind, there is no longer any way to answer the above questions. When we suddenly realize
that all these non-war actions may be the new factors constituting new evolution in warfare
ideology, we have to come up with a new name for this new form of war: Warfare which
transcends all boundaries and limits.
This kind of war means that all means will be in readiness, that information will be
omnipresent, and the battlefield will be everywhere. It means that all weapons and
technology can be superimposed at will, it means that all the boundaries lying between the
two worlds of war and non-war, of military and non-military, will be totally destroyed, and it
also means that many of the current principles of combat will be modified, and even that the
rules of war may need to be rewritten.
We are thus coming to terms with what is known as ‘Unrestricted warfare’ as
discovered by by Qiao Liang and Wang Xiangsui in their book ‘Unrestricted Warfare’
published by PLA Literature and Arts Publishing House, Beijing during February 1999. Just
to quote the term unrestricted warfare will be unfair on my part. Let me reproduce here two
concluding paragraphs of the book. Quote-
193
The world is no longer what it was originally, but war is still as brutal as it has
always been. The only thing that is different is that this brutality has been expanded through
differences in the modes in which two armies fight one other.
This, then, is globalization. This is warfare in the age of globalization. Although it is
but one aspect, it is a startling one. When the soldiers standing at the crossroads of the
centuries are faced with this aspect, perhaps each of them should ask himself, what can we
still do? If those such as Morris, bin Laden, and Soros can be considered soldiers in the wars
of tomorrow, then who isn't a soldier? If the likes of Powell, Schwartzkopf, Dayan, and
Sharon can be considered politicians in uniform, then who isn't a politician? This is the
conundrum that globalization and warfare in the age of globalization has left for the soldiers.
Although the boundaries between soldiers and non-soldiers have now been broken down, and
the chasm between warfare and non-warfare nearly filled up, globalization has made all the
tough problems interconnected and interlocking, and we must find a key for that. The key
should be able to open all the locks, if these locks are on the front door of war. And this key
must be suited to all the levels and dimensions, from war policy, strategy, and operational
techniques to tactics; and it must also fit the hands of individuals, from politicians and
generals to the common soldiers.
We can think of no other more appropriate key than "unrestricted warfare."
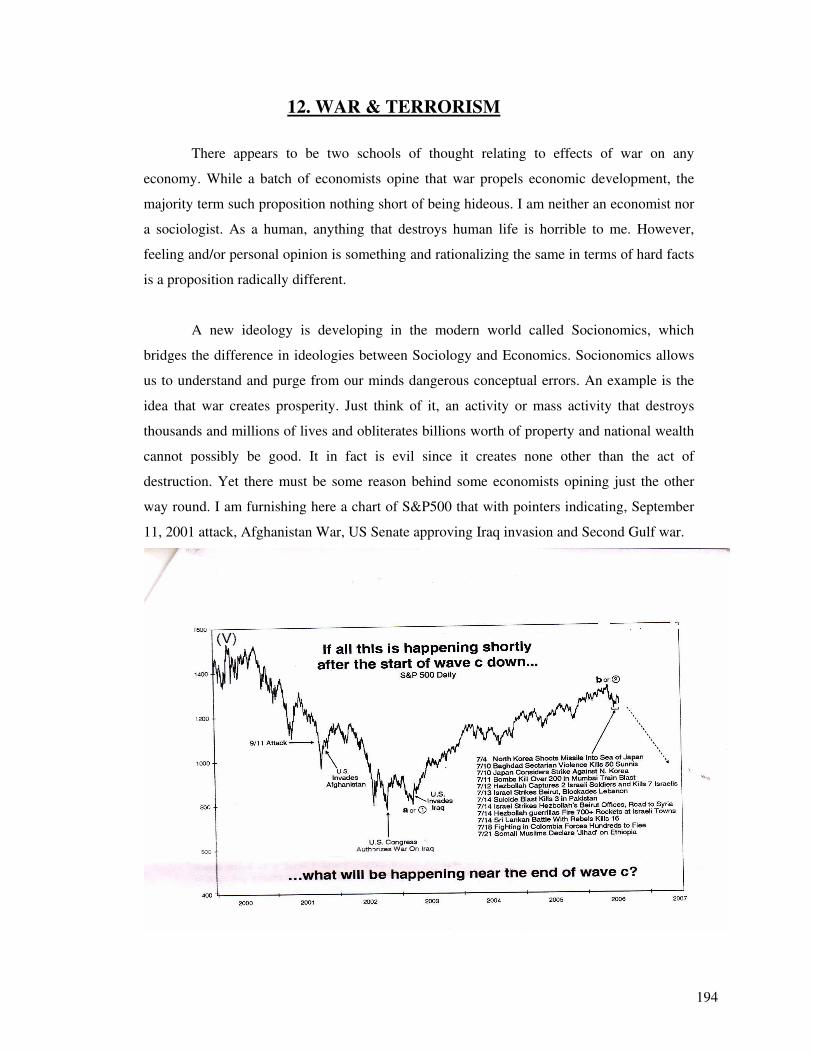
194
12. WAR & TERRORISM
There appears to be two schools of thought relating to effects of war on any
economy. While a batch of economists opine that war propels economic development, the
majority term such proposition nothing short of being hideous. I am neither an economist nor
a sociologist. As a human, anything that destroys human life is horrible to me. However,
feeling and/or personal opinion is something and rationalizing the same in terms of hard facts
is a proposition radically different.
A new ideology is developing in the modern world called Socionomics, which
bridges the difference in ideologies between Sociology and Economics. Socionomics allows
us to understand and purge from our minds dangerous conceptual errors. An example is the
idea that war creates prosperity. Just think of it, an activity or mass activity that destroys
thousands and millions of lives and obliterates billions worth of property and national wealth
cannot possibly be good. It in fact is evil since it creates none other than the act of
destruction. Yet there must be some reason behind some economists opining just the other
way round. I am furnishing here a chart of S&P500 that with pointers indicating, September
11, 2001 attack, Afghanistan War, US Senate approving Iraq invasion and Second Gulf war.
195
The above chart will surely baffle the viewer as each of these events apparently has
been followed by some kind of economic prosperity. Hamilton Bolton had once remarked “
The hardest thing is to believe what you see”. Ilya Prigogine won a Nobel Prize for
discovering a most amazing fact that: ordered complexity and life necessarily arise in open
systems. Entropy is not an antagonist in this arrangement but a partner, as the system takes in
energy and exports entropy to the larger environment. The structures that dissipates entropy
are created by and thrive in a far from equilibrium, high energy, unstable even volatile
environments. Michael Hutchison in Megabrain has commented “ Prigogine’s ideas
demonstrate that periods if instability, perturbation, upheaval, collapse and chaos are not to
be seen as absolute evils but instead as absolute necessities, as phases through which every
structure must pass in order to evolve to higher levels of complexity”.
Thus, good, bad or ugly whichever term be referred to, war or acts of destruction,
existing parallel to human civilization, has surely had some positive effects on economy.
Even having said that, I have to state that the above is only one side of the coin, as we are not
discussing the circumstances leading to war.
History viewed on the mirror of Elliot Waves and Socionomics indicate that major
mood retrenchment produces war, as human finally express their collective negative mood
extreme with representative collective action termed war. As with economic output, the size
of war is almost always related to the size of bear market that induces it. Take any chart of
any era and it will show relation of war to economic decline or recession. It is the ultimate act
of desperation that erupts out as war. For example Revolutionary War (1785) in USA began
near the end of the 64-year bear market in British stock prices that began in 1720. The civil
war followed 24 year bear market that ended in 1859. World War I began during the second
declining phase between 1910 and 1914. World War II began six years after the 89% collapse
in stock prices that bottomed in 1932 and during a 50% drop in to 1942.
Let us not dwell so far back in history and get in to rather recent acts of insurgency.
Gulf War-1 commencing in January 1991 was byproduct of market decline between 1987 and
1990. The chart furnished above indicates vividly that US invasion of Afghanistan and
second Gulf War too are consequential to market crash between 2000 and 2003.
196
To sum up we can say that war, like volcanic eruption, is the outburst of negative
sentiment consequential to periodical economic slump. The longer the slump, steeper the
crash- longer is the duration and greater is the brutality and viciousness of the war.
Then why do economists term war good? Simple- During wars, the downtrend in
social mood that caused the war typically reverses and production tends to rise along with
new up trend. Thus, while war being the ultimate expression of negative sentiment, the
outbreak of it turns the social mood positive. A promise or challenge comes to every human
mind to overcome the predicament/obstacle and to outshine the darkness that prevails.
Another element that evokes positivism is the feeling of patriotism. How many times is
common human thinking about their country? Every one is busy in their way/lives and is
engrossed solving hurdles faced in day-to-day mundane struggle for existence. A crisis
happens. Solidarity of a nation facing a challenge, each countryman stand erect energized
with the vitamins of patriotism.
Thus economists observed: “ World War I provided a quick fix to the economy…If
there ever was a great war for the economy, it was World War II… The Vietnam War was at
first positive in its economic effect but impacted adversely on inflation. Let us turn our
attention to who else but Adolf Hitler himself who assumed the reins of power in 1933 as a
result of the most extremely negative sentiment social sentiment in nearly a century. Stock
markets around the world soared from that point forward; never seeing the level of those lows
again.
In a nutshell war is the net result of negativism but the act or the aftermath is nothing
but positivism. Call it good call it bad, it inculcates both. Let me quote here excerpts from an
article authored by Mr. Robert Higgs that may help the reader to make a rational judgment as
to whether war is good or bad.
World War II and the Triumph of Keynesianism
By Robert Higgs, March 1995
War, everybody says, is hell. But many Americans do not really believe this truism,
especially when the war in question is World War II. Of course, for the men who had to
endure the horrors of combat, the war was terrible — just how terrible, hundreds of
thousands of them did not live to say. But the great majority of Americans never experienced
197
the fighting directly. It was something that went on "overseas," and government censors kept
reports of its brutal realities from the public.
For many Americans, at the time and since, World War II actually seemed to be a
fine thing, mainly because, as the hackneyed expression has it, "the war got the economy out
of the depression" in which it had wallowed for more than a decade. During the Great
Depression, many people had despaired over whether the economy would ever again operate
satisfactorily. Then, the mobilization for war coincided with what appeared to be a great
economic boom.
By 1944, all the usual indicators of economic well being signaled that the economy
was enjoying unprecedented prosperity. Most important, the official rate of unemployment
had sunk to just 1.2 percent — the lowest rate ever achieved before or since. After years of
turning away qualified job seekers, employers were beating the bushes in search of warm
bodies. Official figures showed that the Gross National Product (GNP), adjusted for
inflation, had risen some 70 percent since 1939 — later Commerce Department figures would
revise the increase upward, making it more than 90 percent.
For the economists who had recently embraced the ideas of John Maynard Keynes,
expressed in his General Theory of Employment, Interest, and Money (1936), the war seemed
to validate their beliefs. In Keynes's theory, in contrast to the previously accepted view, an
economic depression might continue indefinitely unless government spending, financed by a
budget deficit, were increased sufficiently. The Keynesians believed that the federal deficits of
the 1930s, never more than $3.5 billion per year, had been too small to lift the U.S. economy
from its slough. The huge wartime deficits, however, reaching as high as $55 billion in 1943,
seemed to have accomplished precisely what Keynes had said they would.
Ever since, most economists, historians, and educated laymen have accepted the
Keynesian conclusion. It seems obvious that the war got the economy out of the depression,
that it created a condition commonly called wartime prosperity. How could anyone argue
otherwise? Certainly no one can deny that the wartime budget deficits were immense — in
terms of today's dollars, they added some $2.2 trillion to the national debt.
After the war ended in the late summer of 1945, a genuine economic miracle took
place during the next two years. More than 10 million men were released from the armed
198
forces. Industry, which had occupied itself largely in producing war goods from 1942 to
1945, switched back to the production of civilian goods. The huge government budget deficit
disappeared, and during the fiscal years 1947-1949, the federal budget actually had a small
surplus. Yet, despite the fears and warnings of the Keynesian economists that such events
would plunge the economy back into depression, civilian production boomed, increasing by
nearly 27 percent from 1945 to 1946, and the rate of unemployment never exceeded 4 percent
until the recession of 1949.
Keynesian economics rests on the presumption that government spending, whether
for munitions or other goods, creates an addition to the economy's aggregate demand, which
brings into employment labor and other resources that otherwise would remain idle. The
economy gets not only the additional production occasioned by the use of those resources but
still more output via a "multiplier effect." Hence the Keynesian claim that even government
spending to hire people to dig holes in the ground and fill them up again has beneficial
effects; even though the diggers create nothing of value, the multiplier effect is set in motion
as they spend their newly acquired income for consumption goods newly produced by others.
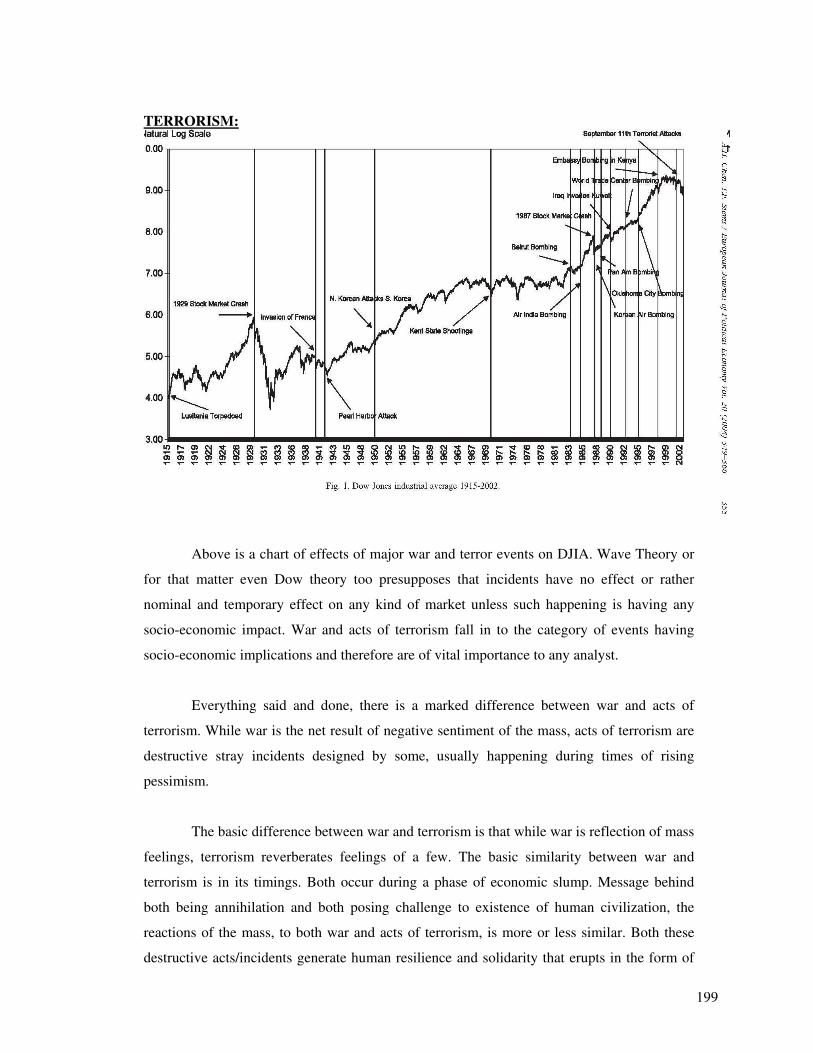
199
TERRORISM:
Above is a chart of effects of major war and terror events on DJIA. Wave Theory or
for that matter even Dow theory too presupposes that incidents have no effect or rather
nominal and temporary effect on any kind of market unless such happening is having any
socio-economic impact. War and acts of terrorism fall in to the category of events having
socio-economic implications and therefore are of vital importance to any analyst.
Everything said and done, there is a marked difference between war and acts of
terrorism. While war is the net result of negative sentiment of the mass, acts of terrorism are
destructive stray incidents designed by some, usually happening during times of rising
pessimism.
The basic difference between war and terrorism is that while war is reflection of mass
feelings, terrorism reverberates feelings of a few. The basic similarity between war and
terrorism is in its timings. Both occur during a phase of economic slump. Message behind
both being annihilation and both posing challenge to existence of human civilization, the
reactions of the mass, to both war and acts of terrorism, is more or less similar. Both these
destructive acts/incidents generate human resilience and solidarity that erupts in the form of
200
economic recovery/ short-term prosperity and also provide stock and commodity markets
with momentum to turn around.
In the modern era of living under constant threat of terror strikes, question therefore
comes to mind as to ‘Fear of terrorism has hurt stocks, but how much?’ For those investing
life’s savings in to stock market: How much does terrorism affect stock prices?
To find the answer, economists have parsed market reaction to events dating back to
the 1915 sinking of the Lusitanian, academics have studied how attacks on Mc Donald’s
restaurants have affected the company's stock price, and researchers in Israel have chronicled
what 13 years of suicide bombings did to stocks there.
Their unsurprising general conclusion is that terror attacks hurt stock prices -- but
some of the details are unexpected. For instance, after Sept. 11, 2001, the stocks in the
Standard & Poor's 500 rebounded to their pre-attack prices faster than every other major
world index except Japan's Nikkei, according to research by Andrew H. Chen of Southern
Methodist University and Thomas F. Siems of the Federal Reserve Bank of Dallas.
What none of the research has answered is the degree to which the fear of another
terrorist attack on the United States has been factored into stock prices. David Sowerby, chief
market analyst, Loomis, Sayles & Co., estimates that the threat of terrorism represents a 5
percent ``tether" on stocks. How did he get that number? The overhang is ``more than zero,
less than 10. Five seems reasonable. If I said 4, I'd be fine-tuning it too much," he said.
The price-to-earnings ratio on the S&P 500 is around 17. A traditional model pegs
the price-to-earnings ratio, one of the most popular methods of gauging a stock's value, to
Treasury bond yields. Under that formula, the price-to-earnings ratio should be closer to 20,
said David Wyss, chief economist for Standard & Poor's.
``We would likely see a drop in stock prices of significant proportion, but investors
seem to believe there would be a subsequent recovery," said Lynn Reaser, chief economist at
the investment strategies group of Bank of America ``As an important footnote, the scope and
the magnitude and the form of a terrorist attack would determine whether or not that
assessment is correct."
201
If the extent to which terrorism has pressured stocks is ``an academic question," as
Streed says, it is one academics have shown little interest in. Instead, they've focused their
studies on how markets responded to past terrorist attacks.
Chen and Siems tracked the Dow Jones industrial average's recovery time from
events ranging from the sinking of the passenger ship Lusitania by Germany during World
War I to Hitler's invasion of France to Sept. 11. They found that while the Dow rose the day
of the Oklahoma City bombing and the bombing of the US embassy in Kenya, it took the
index 795 trading days to recover from the invasion of France and 232 days to rebound from
the attack on Pearl Harbor. They theorize that faster communication and broader market
participation has led to faster stock rebounds.
A study by Israeli academics of stocks and suicide bombings found that stocks in
companies outside the defense sector fell 4.58 percent. And large-scale attacks aren't the only
way terrorism affects stocks. Seventy-five attacks between 1998 and 2003 targeted
businesses, according to G. Andrew Karolyi, a professor of finance at Ohio State University,
and Rodolfo Martell, an assistant professor of finance at Purdue University. The most
frequent target was McDonald's Corp., which was attacked 10 times, including the ransacking
of a half-built restaurant in France and a deadly firebombing in Indonesia. Stock in the
attacked companies had a one-day decline of only 0.83 percent.
What no one seems to talk about when it comes to terrorism is the possibility of a market
crash. That may be because a spate of attacks worldwide, from Madrid to Mumbai, has not caused
any country's market to crash. As former Securities and Exchange Commission chairman Harvey
L. Pitt testified:
``Unlike human beings, capital markets are capable of absorbing great shocks quickly."
Let me quote here a few reports immediately posted after September 11, 2001 strike
and after London bombings on 07/07/2005.
Wall Street has resilience
In the past, U.S. stocks have bounced back from terrorist attacks
NEW YORK (CNNfn) -
202
It will be a long while before business gets back to normal on Wall Street
after Tuesday's devastating terrorist attack, but a review of market history shows that acts of
terrorism against the United States have had limited impact on the Dow Jones industrial
average.
When bombs rained on U.S. embassies in Kenya and Tanzania on Aug. 7, 1998, the
Dow ended the day up 0.24 percent. By the end of the week, the index had given up 3 percent,
according to Ned Davis Research, a Florida market research firm.
And when terrorists bombed the World Trade Center on Feb. 26, 1993, the Dow closed up 1
percent that day and was up 0.15 percent by the end of the week.
"It's more of a psychological event than an economic event," said Robert Rodriguez,
manager of FPA New Income Fund and FPA Capital Fund, whose career on Wall Street
spans about 30 years.
On Oct. 23, 1983, the Dow rose 0.1 percent after terrorists bombed U.S. Marine
barracks in Beirut, killing 241 people and injuring another 80. The index closed down 2.05
percent by the end of the week, Ned Davis Research said.
The Dow edged down 0.64 percent on June 26, 1996 after bombs hit a U.S. military
base in Saudi Arabia, killing 19 Airmen. By week's end, the index was off 0.5 percent.
Acts of war by the United States have also helped trigger market rallies, according
to Ned Davis Research. For example, the three-week Gulf War pushed the index down 4.3
percent as of Jan. 16, 1991. But a month later, the Dow was up 17 percent. In three
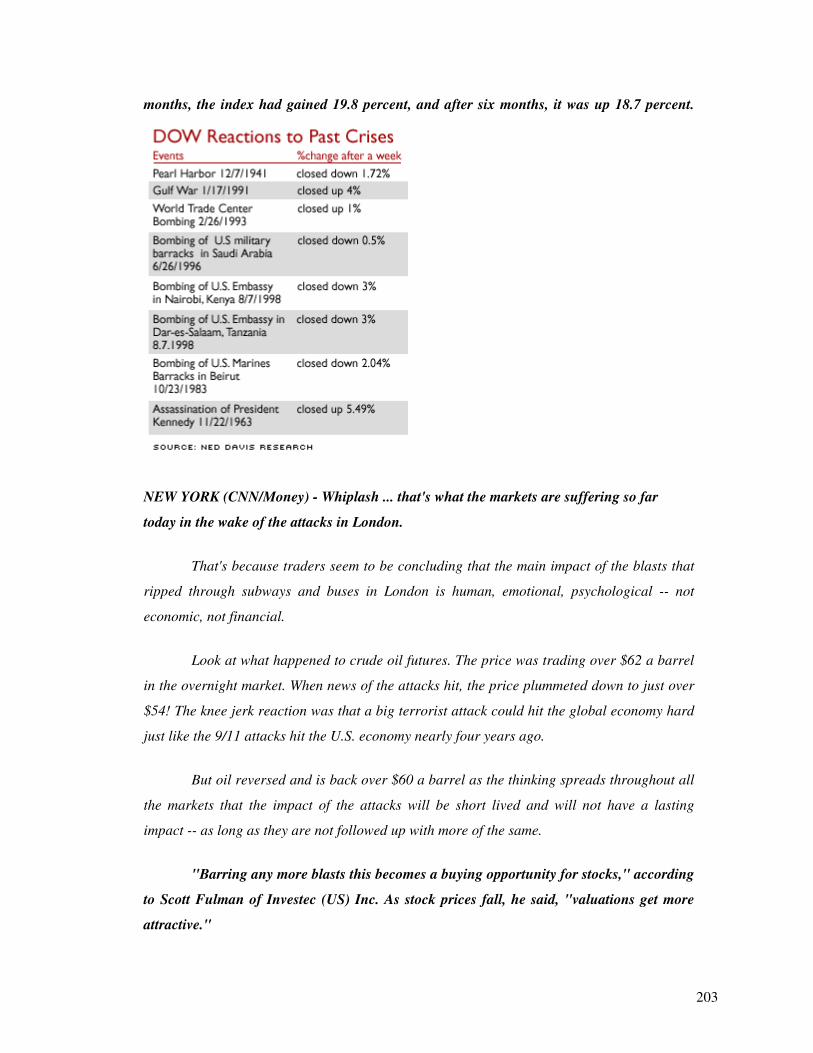
203
months, the index had gained 19.8 percent, and after six months, it was up 18.7 percent.
NEW YORK (CNN/Money) - Whiplash ... that's what the markets are suffering so far
today in the wake of the attacks in London.
That's because traders seem to be concluding that the main impact of the blasts that
ripped through subways and buses in London is human, emotional, psychological -- not
economic, not financial.
Look at what happened to crude oil futures. The price was trading over $62 a barrel
in the overnight market. When news of the attacks hit, the price plummeted down to just over
$54! The knee jerk reaction was that a big terrorist attack could hit the global economy hard
just like the 9/11 attacks hit the U.S. economy nearly four years ago.
But oil reversed and is back over $60 a barrel as the thinking spreads throughout all
the markets that the impact of the attacks will be short lived and will not have a lasting
impact -- as long as they are not followed up with more of the same.
"Barring any more blasts this becomes a buying opportunity for stocks," according
to Scott Fulman of Investec (US) Inc. As stock prices fall, he said, "valuations get more
attractive."
204
"There is usually a bounce in stocks after these kinds of things and I think we are
already starting to see it now."
Traders are already comparing the London events not to the September 11, 2001
attacks in New York City but to the Madrid train bombing. Stocks tumbled after the train
blast on March 11 of last year but within a week they had recovered all their losses.
Bottom line, if it isn't going to derail the U.S. economy then it isn't expected to have a
lasting impact on U.S. interest rates or the U.S. dollar.
David Edwards of Heron Capital Management said the impact of events like those
that occurred in London are fleeting because with each successive attack investors like him
have "programmed this into their risk models."
In fact, Edwards says his firm has increased the amount of U.S. government bonds it
holds "because we know that when something bad like this happens people will buy 10-year
Treasuries." Nor has his company owned travel-related stocks since 9/11 because when
terror attacks take place "we know they are going to dump airline stocks."
"People in my position have to look at world as it is," Edwards says. "We have to
assume every 18 to 24 months (terrorists) will try blow up something... (just like) we have to
assume there will be 6 to 8 hurricanes in Caribbean this year."
Stocks stand up to terror
Monday, July 11, 2005
By E.S. Browning, The Wall Street Journal
Investors live with concern that a terrorist attack will tank the stock market. But a
look at some of the past century's biggest terrorist attacks a show that has rarely happened.
The trend could be seen in the surprisingly rapid U.S. stock recovery after the terrorist
attacks in London last Thursday. More broadly, an analysis of market reaction following 15
different terrorist acts going back to 1920 suggests that, while terrorism may be a
generalized cause of fear, it has rarely been a major mover of markets.
205
Terror fears unquestionably have made investors more conservative, helping to
explain the surprising popularity of investments such as bonds, real estate and gold. Investors
react most strongly to events that they think will have a lasting impact on markets or the
economy, such as the Sept. 11, 2001, attacks and they have learned to shrug off others.
"The attacks in London were horrific, to be sure, but their market impact is likely to
be short-lived because the events are not likely to have a sustained impact on economic
conditions, monetary policies or capital flows, anywhere," wrote Bob Prince of money-
management firm
Bridgewater associates in a report to clients.
The data indicate that, even immediately following a terrorist event; the Dow Jones
Industrial Average has tended to rise.
On the first day that stocks traded following each of the 15 attacks, the Dow
industrials finished up eight times, including last Thursday, and down seven. By the end of
the fifth trading day after the other 14 attacks, it also was more likely to be up. After about a
year, the Dow was down in only four instances, and the average change did Ned Davis
Research in Venice, Fla conduct a gain of more than 13 percent, according to the analysis,
for The Wall Street Journal
.
The 15 events studied began with the 1920 anarchist bombing at the J.P. Morgan
building on Wall Street, which killed 40. They also included an attack on Congress in 1954,
as well as hostage-takings, hijackings and bombings in the Middle East, Europe, Asia, Africa
and Oklahoma City.
Among these events, the biggest one-day market decline came after trading reopened
following the 9/11 attacks, when blue chips fell 7 percent. The next-biggest event-day decline
followed the bombing of a TWA flight in 1974, a 2.2 percent plunge. After that was the
Madrid train bombing in March 2004, a 1.6 percent one-day drops. Other event-day declines
were minor. Over the one-week and one-year periods, the changes were random enough that
most appeared more attributable to normal market forces than to terrorism.
The 9/11 attack was especially damaging because investors feared lasting economic
impact and worried that another attack might follow. Some analysts, however, argue that
206
investors got over that shock faster than it seemed. In this view, later market declines were
due mainly to a downward stock-market spiral already under way after the popping of the
technology-market bubble. Whichever is true, terrorist events since haven't seemed to have
had the same disruptive impact.
"We find evidence that suggests that modern U.S. capital markets are more resilient
than they were in the past and that they recover sooner from terrorist/military attacks than
other global capital markets," wrote Andrew Chen of the Cox School of Business at Southern
Methodist University and Thomas Siems, senior economist at the Federal Reserve Bank of
Dallas, in a study published last year.
One way to see this is to compare the market impact of terrorist events with that of
war. Stocks took more than three years to recover from the German invasion of France in
1940. They took the better part of a year to recover from Pearl Harbor. The Vietnam War,
and the inflation it helped to spur, weighed on markets throughout the 1970s.
Last week, it took U.S. investors less than a day to get over the London bombings. To
the amazement of analysts, stocks actually finished higher on Thursday, the day of the attack,
and gold finished lower. By Friday, European markets, too, had largely recouped their
losses.
The week's big financial news turned out to be Friday's employment report, which
suggested a "Goldilocks" combination of low wage inflation and steady job creation, which
investors welcome. On Friday, the day after the London bombings, the Dow Jones Industrial
Average jumped 146.85 points, or 1.4 percent, to 10449.14, the biggest one-day gain since
April. It was up 145.70 points, or 1.4 percent, for the week, but remains down 3 percent for
2005.
What seems likely is that terrorism's more profound impact on financial markets
comes from the broader fear it creates, which has contributed to a cooling of enthusiasm for
stocks. Partly because of the tech-stock bubble's popping, and partly because of terrorism
fears, many investors have turned to real estate, bonds, gold and other commodities, deeming
them safer than stocks. That may help explain why demand for Treasury bonds has remained
surprisingly strong in recent years, holding the yield of the 10-year Treasury note down near
4 percent, far lower than almost any analyst had predicted.
207
As a matter of fact for most investors, the biggest surprise about the market action
after the July 7th London bombing was how quickly European markets recovered after the
initial shock. The first blast went off at 8:51 local time on Thursday morning, 9 minutes
before the London Stock Exchange opened. The FTSE-100 gapped down at the open and
plunged from 5,229 down to 5,022 – nearly 4%. But by mid-day, the index reversed and
finished trading only 71 points lower. And this morning (Friday, July 8), British stocks
opened with a gap up and closed at 5232, completely erasing Thursday’s losses. Like it never
happened.
All of media’s explanations for such remarkable resiliency have boiled down to one:
Traders and investors have been expecting a terrorist attack, and they simply brushed it off
saying that, “any market decline was likely to be short-lived” (BBC). In the words of one
well-known analyst, "I hate to sound cold hearted, but investors, to a large extent, have
become immune to terrorist attacks" (New York Times).
Have we really gotten so used to a terrorist threat that when an actual strike occurs,
we dismiss it and move on about our business? Perhaps, but are you truly willing to bet that
another terrorist attack, if it ever comes, will also leave the markets unscathed? I wouldn’t.
Trying to estimate the market’s reaction to an unknown future event is futile. We all have
seen cases when the markets take a completely irrational path, opposite to the one they
“should have” taken.
There is another explanation as to why British stocks erased their losses so quickly.
The Elliot Wave Principle teaches that the market moves in a basic pattern of 5 waves up and
3 waves down. The [FTSE-100 Index] then remained very near its high. A break below these
levels should signaled a fourth wave decline retesting at 5022.
On 07/07 FTSE dropping to 5022constituted a 4th wave correction. But since, 4th
wave was not the final leg in an Elliott wave pattern – a 5th wave was in the offing that got
initiated with people inertly revolting against the ghastly act on humanity.
In other words, if we go by the term that ‘History repeats itself’ a serious doubt does
come in mind as to why these terrorist attacks take place at all. Do not the perpetrators of the
attack realize that whatever be the magnitude of their assault, how many so ever lives get
208
sacrificed in the carnage, the mass will consolidate and will surely rise up to the occasions
each time?
Furthermore, in this era of inflation to carry out acts of mass destruction it surely
does one hell of a lot of money. First question thus is: where does this money come from?
And the Second: What do the attackers gain by wasting huge money in carrying out these
dastardly acts?
Call it religious extremism, call it madness, call it revolution, no logic truly bites
unless we find out means by which this money comes and unless we determine the process
by which money spent in acts of terrorism are ploughed back.
It is no more a secret that terrorists are also actively taking part in stock markets.
This is not a fairy tale. The revelation of this fact is an international truth that
international media and all governments do acknowledge.
In his address to the 43rd Munich Conference on Security Policy on February 11,
2007 M.K.Narayanan, National Security Adviser of the Government of India, spoke of the
various ways in which terrorist activities in India are funded.
While doing so, he said: 'Isolated instances of terrorist outfits manipulating the stock
markets to raise funds for their operations have been reported. Stock exchanges in Mumbai
and Chennai have, on occasion, reported that fictitious or notional companies were engaging
in stock market operations. Some of these companies were later traced to terrorist outfits.'
Stock markets as a likely source of funding for organised crime, terrorism and covert
operations of intelligence agencies has been a subject which has been engaging the attention
of not only intelligence and security agencies, but also stock market regulating authorities for
many years.
Organised criminal mafia, terrorists, and intelligence agencies seek to covertly use
the stock markets for earning funds as well as causing economic instability in a target
country. They generally use two methods for this purpose: stock market operations and stock
market manipulation.
209
Stock market operations help them to earn money and launder black money, and
stock market manipulation helps them to earn and launder money as well as cause economic
instability.
For a stock market operation, they use individual stock traders or companies --
either floated by them or their surrogates -- for buying and selling shares and making profits
-- like any other person interested in the stock market.
Their operations are legitimate, but the source of their investments or the ownership
of their companies is not. The only effective way of preventing this is by making enquiries
about such individuals or companies, identifying those suspected to be acting as a front for
crime mafia or terrorists or intelligence agencies and acting against them.
Even before 9/11, it was well documented by the intelligence and security agencies of
Western countries that Al Qaeda had an extensive financial and business network operated
through surrogates.
Some of them indulged in stock market operations for making profits and laundering
black money. Others ran seemingly legitimate businesses such as travel agencies,
construction companies, real estate companies etc and earned money.
Indian press reported the above sometime during February 2007. There was even a
report in CNN recently, which said that one leading corporation has confessed in public that
they helped terrorists deploy money in stock market.
Thus we are coming to one inference that terrorists do enter stock market and their
money forms a part of FDI (foreign direct investment) we welcome with red carpet. It is
also established that these investors take bulk positions in derivatives comprising of futures
and options and do manipulate index to move the same from higher to highest planes that
serve their purpose the best.
If we accept the above logic then we must also accept that terrorists are not
ignorant identities. They do know very well that when they strike and cause horror, the
mass will stand firm in their resolute and exhibit their dejection to such ghastly act by
turning around and providing market additional momentum.
210
In other words, what I am trying to say is that terrorists are investors/speculators
whose basic aim was and is to make this mania happen. Come to think of it, the present
mania would have never happened, especially after the market crash of 2000 unless there was
a tremendous force of positivism or mass appeal for a turn around and an arousal for proving
prevalence of good over evil and also solidarity of humanity on a global platform that
generated out of mass hysteria against the brutality caused by September 11, 2001 and July
07, 2005 terrorist attacks.
What I am trying to project here is that with evolution of time the term ‘war’ has
undergone a sea of change. Bullets, missiles and bombs are no more items of first preference.
Deception is the main artillery and knowledge is the main strategy that wins wars now. It is a
concept that considers no line of control and no protocol. The superficial message behind an
action can differ altogether from the main motto propelling the activity. Is this not true? If
billions worth of money can flock in to markets under the camouflage of harmless FDI but,
ultimately aim at forming a mania that can cripple the economy, why cannot acts of terrorism
not be motivated with ideologies miles apart from simple religious extremisms? The typical
characteristics of terrorism including being transnational, concealed, without rules, and
tremendously destructive, have given us reason to call it financial terrorism. Before the
tremendous state apparatus, terrorists and their organizations are perhaps not worth
mentioning in terms of numbers of peoples and methods, but in fact there is not one country
that dares to look at them lightly.
For bin Laden who hides under the hills of religious fundamentalism and a handful
group of countries that conceals themselves within the forests of free economics, no national
boundaries exist, and borders also are ineffective. What they want to do is carry out wanton
destruction within a regulated sphere and act wildly and run amuck within an unregulated
sphere. These new terrorist forces have formed an unprecedented serious challenge to the
existing world order, and in turn they have made us doubt to a certain degree the logical
production of a fixed order. Perhaps those who check the destruction of rules and those
who revise the rules are both necessary. This is because any destruction of rules always
brings on new problems, which need to be rigorously dealt with. In an age when an old order
is about to be removed, those in the lead are frequently those who are the first to destroy the
rules or those who are the earliest to adapt to this situation. Naturally, in this respect, the new
terrorists have already walked to the head of the international community.
211
Thus, what we seriously need to understand is that it has, till date, been foolish on our
part not to look beyond the outer peripheries of different terrorist attacks. Just think, a series
of bomb explosion take place in local trains of Mumbai resulting in loss of property worth in
millions and loss of a few hundreds of human life. What did terrorists gain out of this
operation? Did they succeed in conveying any specific message to the world? Could they free
any of their leaders locked up in jails? The answers are all: NO.
Not one single government/security agencies, till date, have been able to detect the
reason behind the strike. Media reports that government had prior information about the
attack. But what could they possibly do in a country as huge as India? We always learn about
a terrorist mission after the mission is carried out or caught in the process of being carried
out. But has any one truly attempted to find as to why these missions happen altogether?
Let us turn around and for a change pay attention to the SENSEX being the market
index of Mumbai Stock Exchange. SENSEX had corrected from 12671 to 8799 between
May11 and June14, 2006. Herefrom, though the index made some recovery but the progress
appeared to slow down during early parts of July 2006. The terror strikes of July11 resulted in
immediate reaction of the index jumping up from 10550 to 10940. The initial exuberance
died down resulting in index correcting back to 9875 by 24th wherefrom it never looked back
till reaching 14724 levels on February 09, 2007.
Following Chen and Siam’s theory, it is quite possible for Mumbai Stock Exchange
to have taken 12 days time to absorb the shock of the attack and rebound. If we are ready to
accept the above, we must also find courage to attribute a significant portion of the prosperity
of the said market index, recorded thereafter, to terrorist strikes of July 11, 2006?
We have no option but to accept that that real war will no longer be displayed in its
original form. To a very great extent, war is no longer even war but rather coming to grips on
the internet, and matching the mass media, assault and defense in forward exchange
transactions, market manipulation along with other things which we had never viewed as war,
now all possibly causing us to drop our eyeglasses. That is to say, the enemy is possibly not
the one we would contemplate, the weapons are not the original weapons, and the battlefield
are also not the original battlefield. Nothing is definite any more. What can be ascertained is
not definite. The game has already changed, and what we experience is a new type of fighting
method within various uncertainties. It is no longer that type of single prescription for treating
212
the symptoms and not the disease, but rather a hybrid type of gathering advantages so as to
allow a mango tree to bear both mangoes and banana. This then is combination and Addition
is the method of combination.
In a boxing arena, a person who from start to finish uses only one type of boxing
method to fight with an opponent is naturally not one who can combine straight punches,
jabs, swings and hooks to attack his opponent like a storm. The principle of this can be said to
be extremely simple: one plus one is greater than one. The problem is that such a simple
principle, which even a preschooler can understand, has been surprisingly unclear to many
persons responsible for the success and failure of the security and warfare of nations. These
people can excuse themselves saying they are using the method of combination boxing to
attack opponents. They have never forgotten the addition of technology with technology,
tactics with tactics, weapons with weapons, and measures with measures. Moreover, they can
also contemptuously come to conclusions and combinations that cannot be considered to be
anything new. They do not know that their ability to understand or not understand
combinations is not the key to the problem. What is truly important is whether or not one
understands what goes with what to implement combinations and how to combine. Lastly, but
certainly not the most important point, is whether or not one has thought of combining the
battlefield and non-battlefield, warfare and non-warfare, military and non-military which is
more specifically combining stealth aircraft and cruise missiles with network killers,
combining nuclear deterrence, financial wars and terrorist attacks
COMING BACK TO GRAND SUPER CYCLE:
We must not forget that Grand Super Cycle was on its final lap with weakness
developing at every stage and if this ploy was not adopted, the chances were remote for the
present cycle to get in to final declining phase much earlier.
What I am attempting to say is that the current reign of global terrorism, we witness,
is not carried out by a few offshoot fundamentalist bodies. They must be financed and/or
being planned by some masterly brainpower or consolidated brain power. The circumstantial
evidence or logic point’s fingers of doubt to the countries that have masterminded this mania
since subsequent reaction to these acts serve their interest the best. Think of it, a military
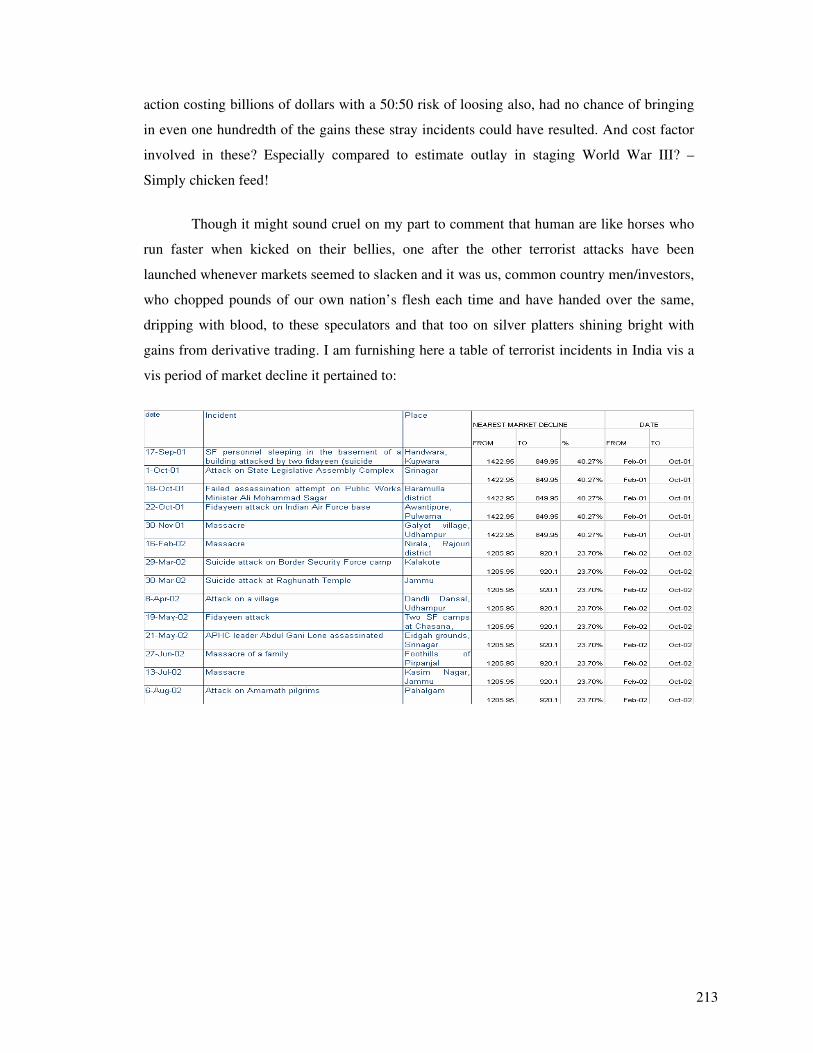
213
action costing billions of dollars with a 50:50 risk of loosing also, had no chance of bringing
in even one hundredth of the gains these stray incidents could have resulted. And cost factor
involved in these? Especially compared to estimate outlay in staging World War III? –
Simply chicken feed!
Though it might sound cruel on my part to comment that human are like horses who
run faster when kicked on their bellies, one after the other terrorist attacks have been
launched whenever markets seemed to slacken and it was us, common country men/investors,
who chopped pounds of our own nation’s flesh each time and have handed over the same,
dripping with blood, to these speculators and that too on silver platters shining bright with
gains from derivative trading. I am furnishing here a table of terrorist incidents in India vis a
vis period of market decline it pertained to:
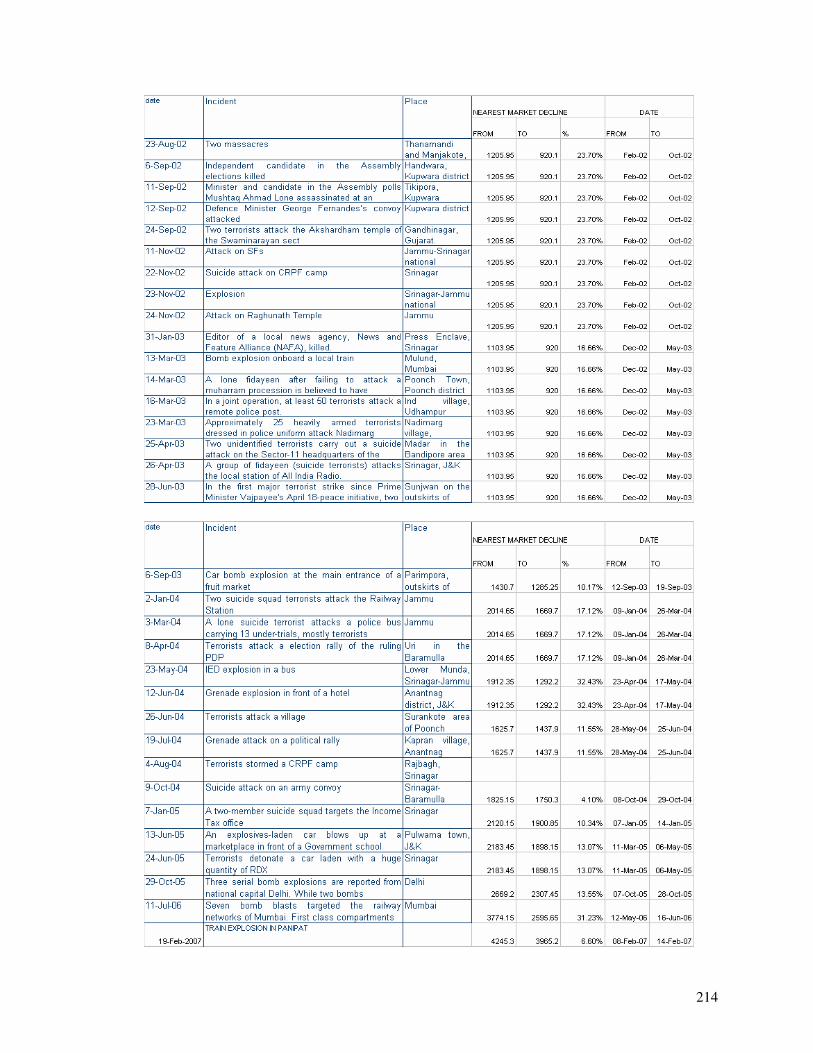
214
215
And interested to know what gains the above could have resulted in? The NSE 50
futures were at 851.25 during September 2001 and stood at 4239.95 on 08/02/2007. If a
speculator kept on rotating a lot of 200 NIFTY futures for all this time, it would have earned
him Rs.677600 against an investment of only Rs. 17024 (i.e. return of 3980% in just 6 years
time). Not bad! Isn’t it?
I suppose, it will be unfair on my part to state simply that all terrorist activities are
being sponsored by a cartel comprising of some countries in European Union, Japan and
some countries of Western Asia. It is not possible. Once an order gets in to practice, others
are bound to follow. Therefore, there has to be other agencies as well, who could also be
practicing the same methodology, however, surely on a smaller scale and essentially focusing
on localized market/country.
Another peculiar aspect of these terror attacks has been its three-tier arrangement/order.
Mind it three (3) tier i.e. again application of Fibonacci series! The strikes can be segregated
as:
a) First category of attacks: Attacks of massive severity that shakes the very core of
present civilization and generates impact on a global scale e.g. - Air strikes of
September11, 2001, London blast of 07/07/2005, Mumbai train blast of July 11,
2006.
b) Second category attacks: Strikes or threat thereof which either do not take place or
are planned in a manner to get detected or happen raising global tremors but on a
milder scale- e.g.- letter bomb to British Prime Minister, Threat of air strikes of 2006
foiled being detected in advance, Recent train blast in Panipat-India on 19th February,
2007.
c) Third category attacks: Strikes of lowest category carried out through regional
terrorist groups having localized/regional market based impact only.
The three types of attacks are carried out depending on the status of market on
global/regional basis. After the crash of Dot COM market in 2000, a massive jolt was
necessary to boost human sentiment on a global scale and therefore an attack of the
magnitude of September 11 was planned. Even when world markets seemed dwindling
under the onslaught of corrective Wave A during May/July 2006, unless a mass
annihilation of the scale of Mumbai blast had been carried out, the sentiment could never
216
had turned positive and conducive to the extent of transforming in to stock market mania
in most of the third world country share markets around the world.
The second and third category strikes, being cost effective and demanding lesser
planning, formed the cream topping of the cake. It kept refreshing horror memory in the
minds of the mass that reacted/corresponded by providing that little extra volume which
capital markets needed to turn around from a temporary correction.
What happens now? The times are changing. Now is the time for taking home the
gains. Wave C has started in all likelihood. But all the investment cannot go out at a time.
The profits then will not get realized. Therefore, the Wave C, too, will comprise of a
series of corrections, reversals and possibly a five-wave cycle downwards. In simple
words, even during the Wave C, there will be times when markets will appreciate. And
means of such appreciation too will demand booster of violence that will come either by
way of terror attacks or by way of armed conflicts amongst countries.
Many governments will change now. In fighting amongst countries will increase
more and more directly increasing in proportion to appreciation of negative sentiment and
deflation that will come with erosion of wealth consequent to disinvestments by foreign
investors. In other words, terror strikes will continue but possibly on a much-reduced
scale and on a much lesser frequency.
With perpetrators of mania and regime of terror, around the world, programming
their plans and programs on Fibonacci numbers, it is but natural that a common link
could be found between incidents and such link would be Fibonacci numbers again. Let
me reproduce here the beginning of Fibonacci series for the convenience of the reader.
The series progresses like: 1, 1, 2, 3, 5, 8, 13, 21, 34, 55, 89, 144 etc
Apart from the numbers stated above the numeric of 7 finds great significance being
nearest to 10 times of the Golden ratio of 0.618 and being the result/quotient of 21
divided by 3.
Out of simple whims, I added the numeric of dates in the form of DD/MM/YYYY of
the terror attacks in India since September 2001. There were precisely 47 strikes that
could directly be linked to various market corrections. Of the said 47 attacks dates of 35
added to either Fibonacci numbers or 7. An order perpetuating 35 times out of 47 cannot
be a result of simple coincidence. I could see the hidden hands. It is unfortunate that
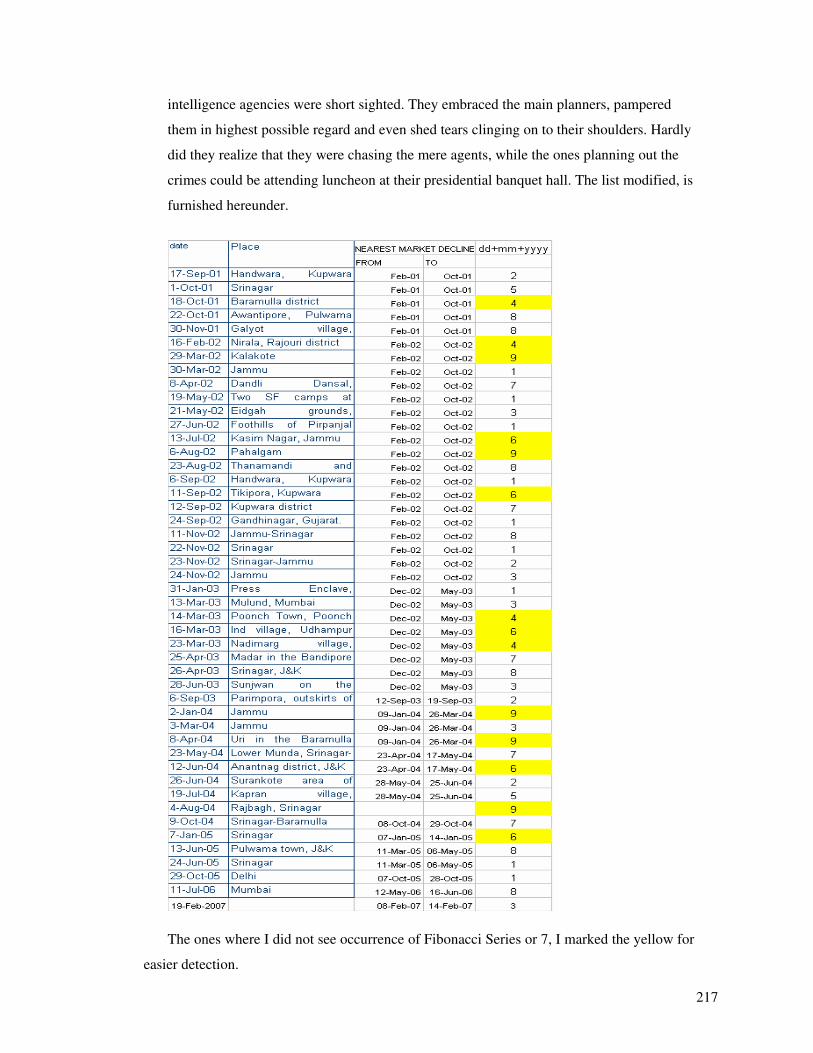
217
intelligence agencies were short sighted. They embraced the main planners, pampered
them in highest possible regard and even shed tears clinging on to their shoulders. Hardly
did they realize that they were chasing the mere agents, while the ones planning out the
crimes could be attending luncheon at their presidential banquet hall. The list modified, is
furnished hereunder.
The ones where I did not see occurrence of Fibonacci Series or 7, I marked the yellow for
easier detection.
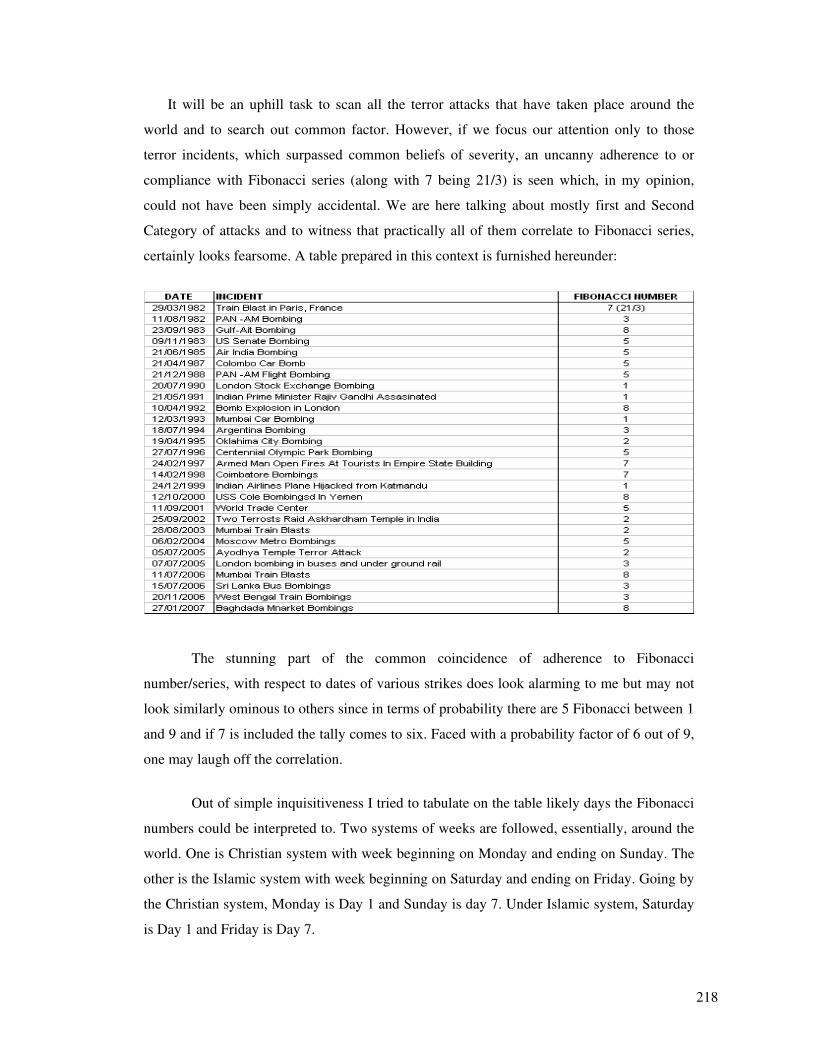
218
It will be an uphill task to scan all the terror attacks that have taken place around the
world and to search out common factor. However, if we focus our attention only to those
terror incidents, which surpassed common beliefs of severity, an uncanny adherence to or
compliance with Fibonacci series (along with 7 being 21/3) is seen which, in my opinion,
could not have been simply accidental. We are here talking about mostly first and Second
Category of attacks and to witness that practically all of them correlate to Fibonacci series,
certainly looks fearsome. A table prepared in this context is furnished hereunder:
The stunning part of the common coincidence of adherence to Fibonacci
number/series, with respect to dates of various strikes does look alarming to me but may not
look similarly ominous to others since in terms of probability there are 5 Fibonacci between 1
and 9 and if 7 is included the tally comes to six. Faced with a probability factor of 6 out of 9,
one may laugh off the correlation.
Out of simple inquisitiveness I tried to tabulate on the table likely days the Fibonacci
numbers could be interpreted to. Two systems of weeks are followed, essentially, around the
world. One is Christian system with week beginning on Monday and ending on Sunday. The
other is the Islamic system with week beginning on Saturday and ending on Friday. Going by
the Christian system, Monday is Day 1 and Sunday is day 7. Under Islamic system, Saturday
is Day 1 and Friday is Day 7.
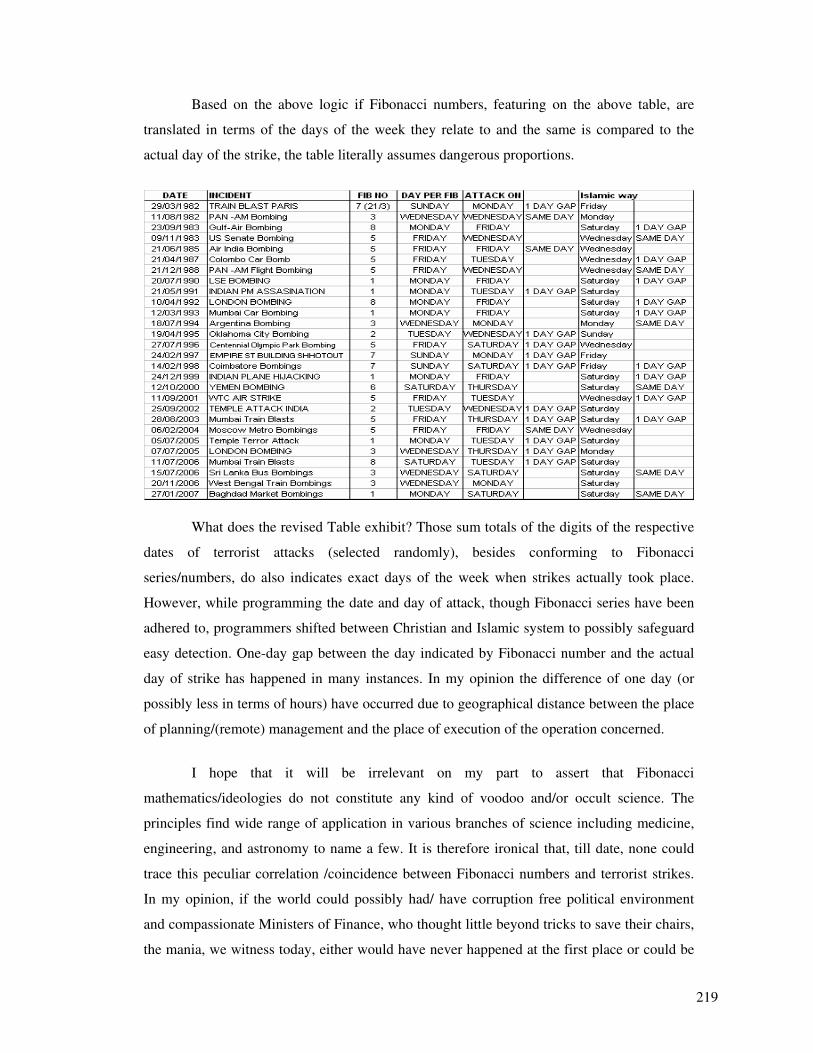
219
Based on the above logic if Fibonacci numbers, featuring on the above table, are
translated in terms of the days of the week they relate to and the same is compared to the
actual day of the strike, the table literally assumes dangerous proportions.
What does the revised Table exhibit? Those sum totals of the digits of the respective
dates of terrorist attacks (selected randomly), besides conforming to Fibonacci
series/numbers, do also indicates exact days of the week when strikes actually took place.
However, while programming the date and day of attack, though Fibonacci series have been
adhered to, programmers shifted between Christian and Islamic system to possibly safeguard
easy detection. One-day gap between the day indicated by Fibonacci number and the actual
day of strike has happened in many instances. In my opinion the difference of one day (or
possibly less in terms of hours) have occurred due to geographical distance between the place
of planning/(remote) management and the place of execution of the operation concerned.
I hope that it will be irrelevant on my part to assert that Fibonacci
mathematics/ideologies do not constitute any kind of voodoo and/or occult science. The
principles find wide range of application in various branches of science including medicine,
engineering, and astronomy to name a few. It is therefore ironical that, till date, none could
trace this peculiar correlation /coincidence between Fibonacci numbers and terrorist strikes.
In my opinion, if the world could possibly had/ have corruption free political environment
and compassionate Ministers of Finance, who thought little beyond tricks to save their chairs,
the mania, we witness today, either would have never happened at the first place or could be
220
restricted to a great extent. If mania could be quenched ab-initio, the financial warfare could
not have grown to this proportion and surely that would have spared the world from
experiencing innumerable number of terrorist strikes that has snatched away, God alone
knows, how many lives so far.
The above table also clears a lot of ambiguities that dwell in most of the common
minds. 27 terrorist strikes, spanning over 25 years, selected randomly cannot possibly share
the same co-incidence unless planned by maximum one or two power centers. Why am I
talking of possibility of two? It is because one set of attacks correspond to Islamic week
calculation while the other follows Christian counterpart. It is quite possible that one power
center/ cartel could be organizing this, but bifurcating applications in a different set of
designs to avoid detection. This more or less exempt’s identities like Saddam Hussein, Bin
Laden, and Carlos etc. These identities could be, at best tools for execution of the plots, but to
mastermind the same, exceed their respective capabilities by miles.
Even if hypothetically we hold the clan of Saddam, Laden, Carlos, and LTTE etc
responsible, the invisible link between the groups, that poured money/speculated in the
Capital Markets, on a global scale that led to formation of the economic bubble and the bunch
of terrorists cannot be denied as they were complimenting each other. Doubt does obviously
arise as to the motive behind Bin Laden & Co carrying out various ghastly acts unless they
were being more than enough compensated (cost wise) for carrying out strikes ranging from
Argentina to Myanmar. In other words, the ones creating the mania, and the designers of
these terror strikes had to be the same identities. Furthermore, it is a fact that even if the
entire clan of terrorists had pulled all their belongings together, they would not be able to
source 1/10th of money deployed to carry out the dastardly acts, one after the other with each
time successfully making the chill of horror trickle down the spine of the entire global
population.
Therefore, this was and is nothing but extension of financial coup. Terrorist attacks
have been resorted to for deriving uniform result, which is, speculating a colossal financial
advantage escaping notice of the world at large. This nature of unrestricted warfare can only
be carried out if plotted at the highest level, that is, between governments of a group of
countries. This certainly is not the cup of tea for some sic individuals.
221
Do we see some kind of a pattern/motive behind the attacks in the backdrop of
financial coup that has resulted in near worldwide spread of economic bubble? I am no
military strategist however, while on the context, let me quote a small portion from the book
“Unrestricted warfare” which would not suffice any further elucidation:
“If the attacking side secretly musters large amounts of capital without the enemy
nation being aware of this at all and launches a sneak attack against its financial markets,
then after causing a financial crisis, buries a computer virus and hacker detachment in the
opponent's computer system in advance, while at the same time carrying out a network attack
against the enemy so that the civilian electricity network, traffic dispatching network,
financial transaction network, telephone communications network, and mass media network
are completely paralyzed, this will cause the enemy nation to fall into social panic, street
riots, and a political crisis”.
Why did I take statistics since 1982 in particular? If we look in to progression of
capital markets around the world, especially focusing on USA, it will be seen that subsequent
to the market crash in response to Pearl Harbor bombing in 1943, market has been in general
advancing till 1970. Between 1970 and 1983 was period of slump and market essentially
moved flat and sideways experiencing, in between occasional corrections. We all know that
though initial response to Vietnam had been good, such positivism did not last long and
gradually lead to a phase of depression between 1970 and 1983. It was during 1982-83 that
markets around the world got energized and started moving forward with ultimate take off
being launched around 1988. 1982 is also important in world history for another reason since
it was a year of turmoil. First Argentina took over control of Falkland Islands and thereafter
towards end April 1982 the British Navy, in a brisk action regained the control back. The war
too, like all others preceding it, had a positive effect on world economy with markets
breaking out of its shackles and moving forward.
Whether it was 1982 or 1988 or much earlier, truth will surely surface one day sooner
or later. Once depression/deflation starts taking its tolls, brainstorming will commence and
researchers will surely discover the point/ the time wherefrom this massive financial and
social coup had started. Wizards will surely plot charts with pointers indicating the attacks
and find correlation for most of them with various market declines and subsequent revival.
Those who have been contemplating global destruction due to nuclear warfare
consequent to World War III were and are wrong. Progression of science and technology is
222
continuous with time and so is advancement of human evolution. Advancement of knowledge
has led to retardation of morality. If emperor Timur or Genghis khan found pleasure in
building hills out of human skull, Adolf Hitler fancied to eradicate from earth a race called
Jews. He invented means not only to kill them but also tried best to inflict such torture and
brutality which world history would remember for next two thousand years. In other words,
human had become crueler with advancement of time. World War 1 saw elevation of war
science from use of simple guns to deployment of tanks and aircraft. World War II got even
crueler and ended with first and only use of nuclear weapon on human race. World War III
cannot follow the same lines of World War I & II. It will move one step ahead since mass
destruction by nuclear means is first step to moving towards self-destruction too.
And why should one-use guns, aircrafts, bombs etc when you have money that has
proved, time and time again, to be the best weapon ever invented. Why use guns to kill
human? Just snatch away their money and leave them standing naked under the scorching
sun. They will either die out of hunger or perish fighting amongst themselves only. Just relax
and look back. Think logically of what is happening around us. Are we really not in a state of
war?
I shall possibly be the happiest man on earth if any one can prove to me logically that
I am wrong but if I am not, please avoid the capital market and save for your own self and for
the generation that follows us.
A BIT OF DETECTIVE WORK
In order to determine prevalence of a trend, let us expand our scope of basic assumptions
as follows:
a) If the digits of dates of respective terror attacks are added to single digit form (i.e. 13
becomes 4), the numbers uncannily tend to equal either Fibonacci number or 7. This
coincidence occurs almost in 74%instances.
b) The methodology of adding should be first to reduce DD, MM, and YYYY all in
single digit form and thereafter to add them together. If the result of such addition is
in more than one digit, to add the digits till it reduces to a single digit number.
c) ‘8’ is a Fibonacci number. However since week comprises of 7 days, we consider 8
as 1 (i.e. 8-7).

223
d) The 7 (seven days) of a week may be considered arranged in three ways:
1) Christian way, with Monday as day 1 and Sunday as day 7
2) Conventional way with Sunday as day 1 and Saturday as day 7
3) Islamic way with Saturday as day 1 and Friday as day 7
Instead of just randomly selecting only 27 international incidents of terrorist strikes,
if we select about 69 prime ones where conformity to assumptions made in (a) and (b) could
be established, the table would appear as follows:
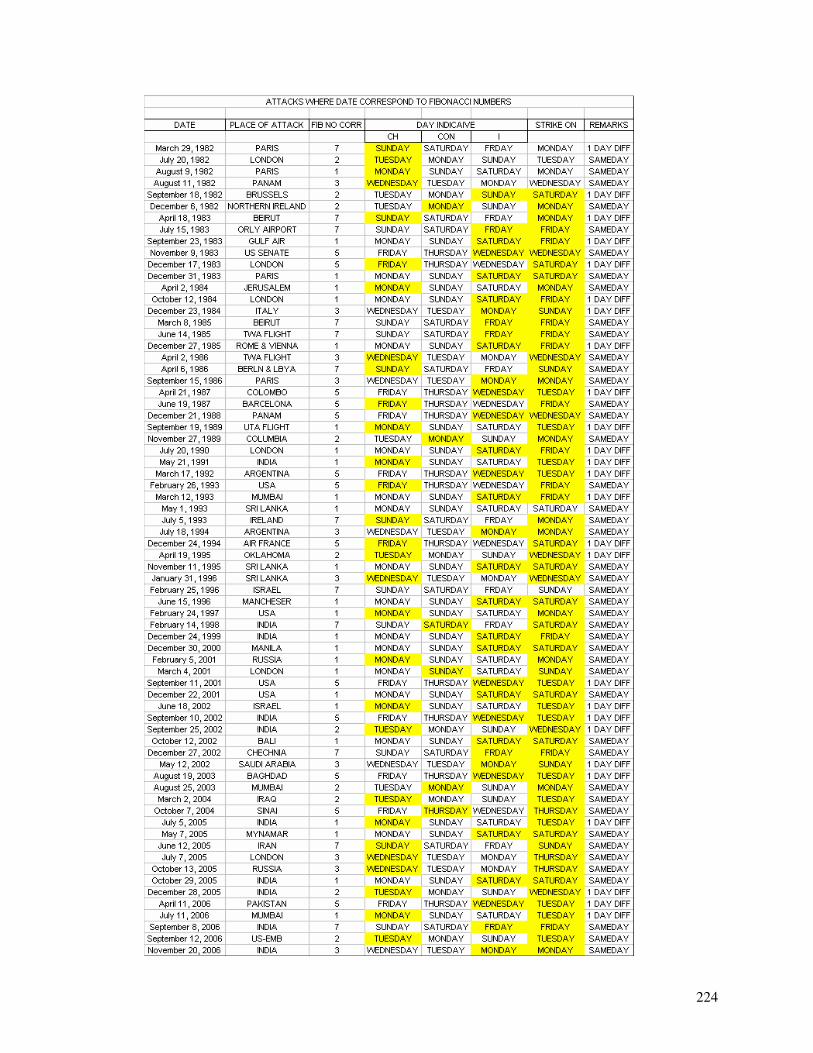
224
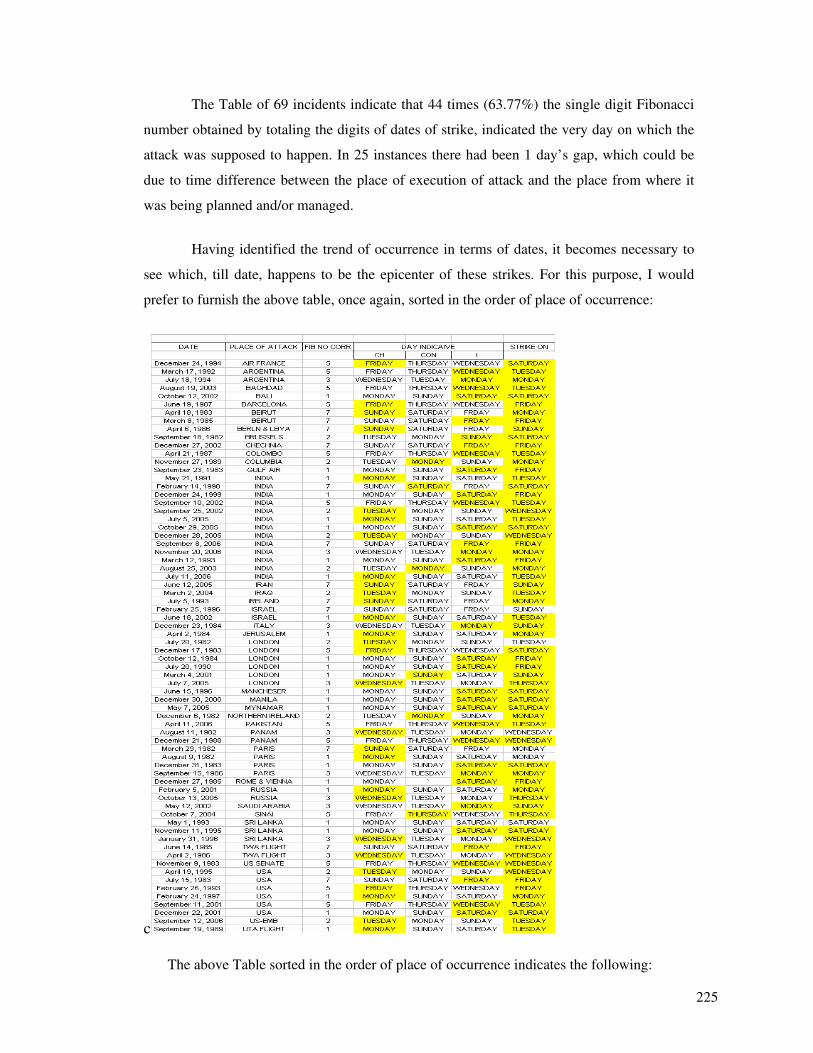
225
The Table of 69 incidents indicate that 44 times (63.77%) the single digit Fibonacci
number obtained by totaling the digits of dates of strike, indicated the very day on which the
attack was supposed to happen. In 25 instances there had been 1 day’s gap, which could be
due to time difference between the place of execution of attack and the place from where it
was being planned and/or managed.
Having identified the trend of occurrence in terms of dates, it becomes necessary to
see which, till date, happens to be the epicenter of these strikes. For this purpose, I would
prefer to furnish the above table, once again, sorted in the order of place of occurrence:
c
The above Table sorted in the order of place of occurrence indicates the following:
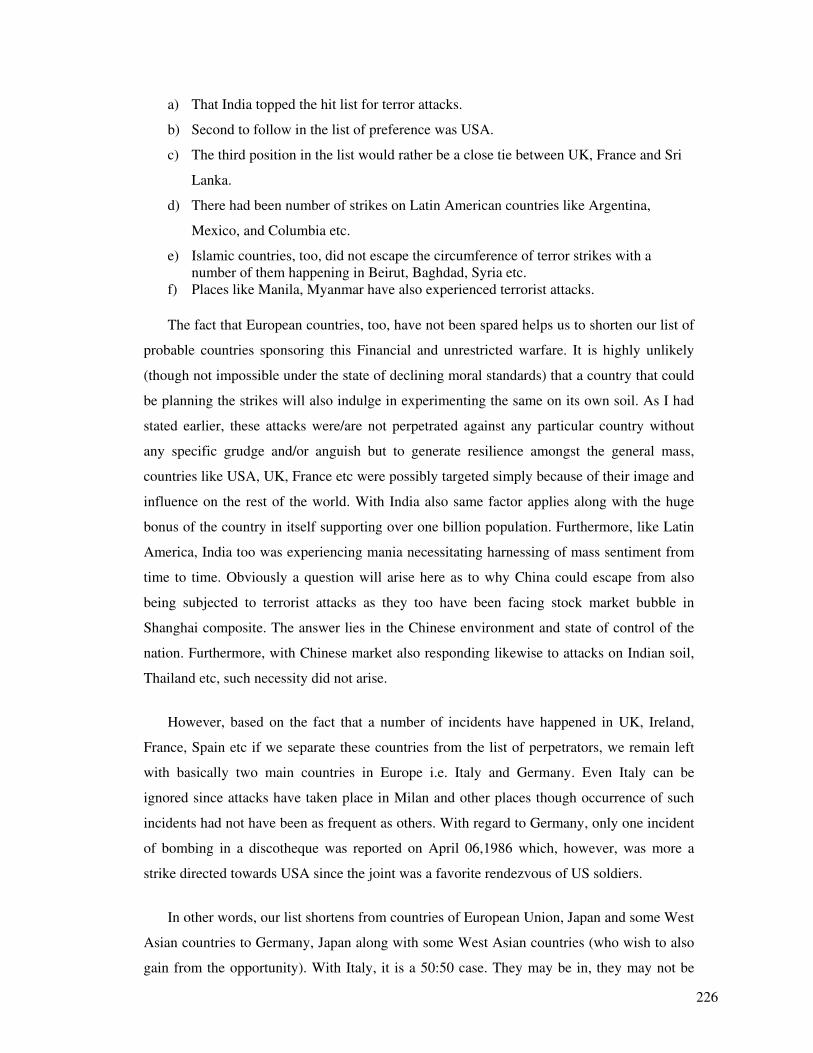
226
a) That India topped the hit list for terror attacks.
b) Second to follow in the list of preference was USA.
c) The third position in the list would rather be a close tie between UK, France and Sri
Lanka.
d) There had been number of strikes on Latin American countries like Argentina,
Mexico, and Columbia etc.
e) Islamic countries, too, did not escape the circumference of terror strikes with a number of them happening in Beirut, Baghdad, Syria etc.
f) Places like Manila, Myanmar have also experienced terrorist attacks.
The fact that European countries, too, have not been spared helps us to shorten our list of
probable countries sponsoring this Financial and unrestricted warfare. It is highly unlikely
(though not impossible under the state of declining moral standards) that a country that could
be planning the strikes will also indulge in experimenting the same on its own soil. As I had
stated earlier, these attacks were/are not perpetrated against any particular country without
any specific grudge and/or anguish but to generate resilience amongst the general mass,
countries like USA, UK, France etc were possibly targeted simply because of their image and
influence on the rest of the world. With India also same factor applies along with the huge
bonus of the country in itself supporting over one billion population. Furthermore, like Latin
America, India too was experiencing mania necessitating harnessing of mass sentiment from
time to time. Obviously a question will arise here as to why China could escape from also
being subjected to terrorist attacks as they too have been facing stock market bubble in
Shanghai composite. The answer lies in the Chinese environment and state of control of the
nation. Furthermore, with Chinese market also responding likewise to attacks on Indian soil,
Thailand etc, such necessity did not arise.
However, based on the fact that a number of incidents have happened in UK, Ireland,
France, Spain etc if we separate these countries from the list of perpetrators, we remain left
with basically two main countries in Europe i.e. Italy and Germany. Even Italy can be
ignored since attacks have taken place in Milan and other places though occurrence of such
incidents had not have been as frequent as others. With regard to Germany, only one incident
of bombing in a discotheque was reported on April 06,1986 which, however, was more a
strike directed towards USA since the joint was a favorite rendezvous of US soldiers.
In other words, our list shortens from countries of European Union, Japan and some West
Asian countries to Germany, Japan along with some West Asian countries (who wish to also
gain from the opportunity). With Italy, it is a 50:50 case. They may be in, they may not be
227
also. But such coordinated action between two countries or three countries do not develop out
of thin air unless close ties exist between them and history stands testimony to such alliance
happening in the past. Pursuing trail in this respect, on the Internet, led me to the clue I was
looking for. I shall, without wasting too many words on the subject, just reproduce here what
I discovered, possibly by accident.
The Axis
Originally founded on the concept of the Rome-Berlin-axis (the Pact of Steel), later
the Tripartite Pact, the Axis was not primarily a formal alliance. Each of the major countries
went to war on their own initiative (Nazi Germany in 1939, Italy in 1940, and Japan in 1937
against China and 1941 against USA), and not necessarily to assist each other. There was
little sharing of technology or resources, and also little in the way of cooperative strategic
planning between the major Axis Powers.With the demise of Italy, Germany and Japan each
functioned as wholly separate powers, each conducting the war in their theatre (Germany in
Europe and Japan in the Pacific). There were a number of smaller powers on the side of the
Axis, although for the most part the war effort was directed and powered by Germany and
Japan.
There is a saying in English ‘ History repeats itself’. Though it is the job of historians
to pinpoint the extent of collaboration and also how solid the tie had been during World War
II (again Fibonacci number), it is now established that these two countries had strived for
achieving same goal and had earlier carried out warfare on a global scale with a common
agenda. The coalition headed by Germany, Italy and Japan had, during World War II, had
opposed the Allied Powers. The alliance had originated in a series of agreements between
Germany and Italy, followed in 1936 by the Rome Berlin Axis declaration and the German-
Japanese Anti Comintern Pact. The connection was strengthened by the formal Pact of Steel
(1939) between Germany and Italy and by the Tripartite Pact signed by all the three powers
in 1940.
It is also known to all that the Axis had failed in their mission during World War II
and their respective economies were devastated by the Allied Powers. More than 60 years
have elapsed since the World War II and the countries belonging to the Axis have not only
recovered but now stand firm as distinctive individual power centers in the world. The World
War II was fought between the Axis and the Allied Powers extensively from 1939 and 1945.
Who got defeated and who won the war is, I suppose, irrelevant in this context. However,
going by the findings of Kondratieff, it is but natural for recurrence of the same to happen
228
between 55 to 60 years time. In other words, if war like activity started between 2000 and
2005 and initiated by the same force, it would only confirm the law of nature. If history will
or has already repeated itself, it is/will not be something unusual.
There is a difference however, between criminology and socionomics. A socionomist
is not a detective. How much so ever, I may try; I can never become a James Bond or Hercule
Poirot. I can build up logic, show the world direction of the mood and build up hypothesis
based on trend of events. But my findings can only become a Theory if the same is later
testified in reality based on real life material proof. Till then, whatever I say will transpire to
be, maximum, building up of a circumstantial evidence or a work of fiction… possibly
nothing more beyond the same.
Some people always reject denunciations unless the denouncer offers a "constructive
criticism," that is, unless he puts forward a promising plan to eliminate the evil he denounces.
I admit at once that I have discovered no cure for the human tendency to resort to war in any
form even financial warfare as described above. I'm trying to convince people that on nearly
all occasions, they are allowing speculators to bamboozle them and to turn them into cannon
fodder for purposes that serve the speculators' interests, not the people. I'm getting nowhere in
this effort, but I'm going to keep trying. I'm also going to continue to denounce stupidity,
ignorance, ugliness, bullying, on part of most governments and especially UNO even though
I don't expect to succeed in those quests, either.
229
13. SHORT NOTES ON TECHNICALCONCEPTS FOR MARKET TREND ANALYSIS
Technical Analysis is governed by man’s social nature and since he has such a
nature, its expressions generate forms. As the forms are repetitive, they have predictive value.
Sometimes the market appears to reflect outside conditions and events, but at other
times it is entirely detached from what most people assume are casual conditions. The reason
is that the market has a law of its own. It is not propelled by the external causalities to which
one becomes accustomed in the every day experience of the life. The path of prices is not a
product of news. Nor is the market the cyclically rhythmic machine that some declare it to be.
Its movement reflects a repetition of forms that is independent both of presumed casual
events and periodicity.
The market’s progression unfolds in waves. Waves are patterns of directional
movement. More specifically, a wave is any one of the patterns that naturally occur, as
described in the rest of this chapter.
Any form of market, that includes Capital market too, comprises of market dynamics
of demand supply interaction. Over the years the factors that influence development of
market trends have been consolidated in the form of Technical studies and in the backdrop of
modern era of technological advancement, have been interalia configured in state of the art
software programs that help investors/analysts in determining possible development of trends.
DOW THEORY
Dow Theory dates back to 1897 and as the name indicates, were developed by
Charles Dow. According to Charles H. Dow, the primary trend of market is the broad, all-
engulfing “tide,” which is interrupted by “waves,” or secondary reactions and rallies. The
latter are generally unimportant unless a line (defined as a sideways structure lasting at least
three weeks and occurring within the price range of five percent) is formed. The main tools of
the theory are the Transportation Average (formerly the Rail Average) and the Industrial
Average. The leading exponents of Dow’s theory, William Peter Hamilton, Robert Rhea,
Richard Russel and E. George Schaefer, rounded out Dow’s theory but never altered its basic
tenets.
230
As Charles Dow once observed, stakes can be driven into the sands of the seashore as
the waters ebb and flow to mark the direction of the tide in much the same way as charts are
used to show how prices are moving. Out of the experience came the fundamental Dow
Theory tenet that since both averages are part of the same ocean, the tidal action of one
average must move in unison with the other to be authentic. Thus, a movement to a new
extreme in an established trend by one average alone is a new high or new low that is said to
lack “confirmation” by the other average.
The theory comprises of six assumptions, namely:
i) The average discounts everything: The price of any script/stock reflects everything
known about the security. As new information surface, the market participant
quickly disseminates the same and let the price adjust accordingly.
ii) The market is comprised of three trends: Stock market experiences three trends viz:
Primary trend, Secondary trend and Minor trend. Primary trend usually lasts
more than one year and may extend for several years. Secondary trends are
intermediate corrective reactions to Primary trend and last from one to three
months and retrace from one-third to two thirds of the previous Secondary trends.
Minor trends depict short-term movements lasting from one day to three weeks.
In other words, Secondary trends are essentially clustered of Minor trends.
iii) Primary trends have three phases: The first phase of Primary trend experience
aggressive buying by informed investors in anticipation of economic recovery
and long-term growth. The second phase is characterized by better corporate
performance and improved economic conditions influencing the investors of
further accumulation of stocks. The third phase presupposes peak economic
environment and buying frenzy among general public. Dow assumed that the
investors during the first and second phase now start slowly liquidating their
investment at this stage in anticipation of gradual decline to follow.
iv) The averages must confirm each other: The averages have to extend beyond their
previous secondary peak (or trough) in order for a change of trend to confirm.
v) The volume confirms the trend: Volume should expand in the direction of Primary
trend. In other words, should the Primary be directing down wards, the volume
would increase with market decline. Similarly higher volume be experienced
consequent to market rise should the Primary be bullish in direction.
231
vi) A trend remains intact until it gives a definite sign of reversal: An up trend comprises
of a series of higher high and higher lows and for it to reverse, it must experience
at least one lower high and lower low.
Fibonacci Studies:
Overview Fibonacci numbers are the result of work by Leonardo Fibonacci in the
early 1200's while studying the Great Pyramid of Gizeh. The Fibonacci series is a
numerical sequence comprised of adding the previous numbers together, i.e.,
(1,2,3,5,8,13,21,34,55,89,144,233etc.) An interesting property of these numbers is that as
the series proceeds, any given number is 1.618 times the preceding number and 0.618%
of the next number. (34/55 = 55/89 = 144/233 =0.618) (55/34 =89/55 =233/144 =1.618),
and 1.618 =1/0.618. These properties of the Fibonacci series occur throughout nature,
science and mathematics. The number 0.618 is often referred to as the "golden ratio" as it
is the root of the following polynomial x^2+x-1=0 which can be rearranged to x=
1/(1+x). The other fibs 0.382 and 0.5 commonly used in technical analysis have a less
impressive background but are just as powerful in Technical analysis.
0.382=(1-.618)=(0.618*0.618) and 0.5 is the mean of the two numbers. Other neat fib
facts (0.618*(1+0.618)=1 and (0.382*(1+. 618))=0.618.
Use of Fibonacci in Technical Analysis Fibonacci numbers are commonly used in
Technical Analysis with or without a knowledge of Elliot Wave Analysis to determine
potential support, resistance, and price objectives. 38.2% retracements usually imply that
the prior trend will continue, 61.8% retracements imply a new trend is establishing itself.
50% retracement implies indecision. 38.2% retracements are considered neutral
retracements in a healthy trend.
Price objectives for a natural retracements (38.2%) can be determined by adding (or
subtracting in a downtrend) the magnitude of the previous trend to the 38.2%
retracements. After the 38.2% retracements the stock should break through the previous
swing point (B) on heavier volume. If the volume isn't there the magnitude of the move
will usually be diminished, especially on very low volume. 61.8% retracements are
warning signs of a potential trend changes.
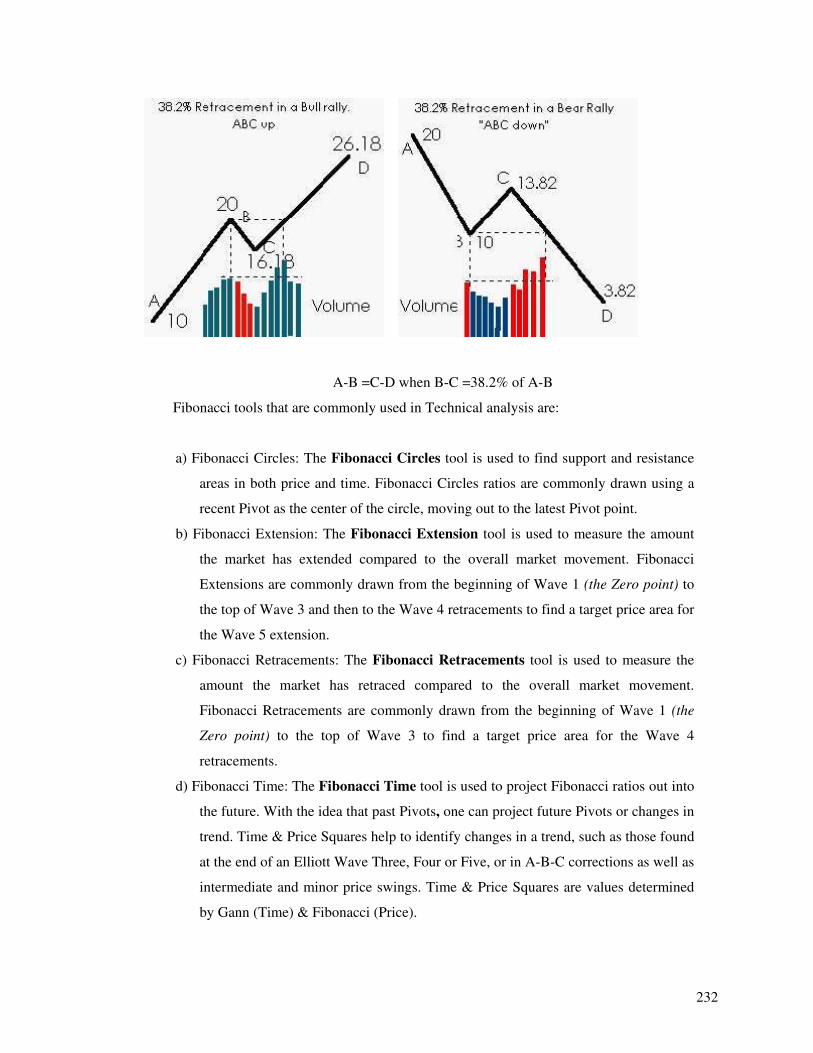
232
A-B =C-D when B-C =38.2% of A-B
Fibonacci tools that are commonly used in Technical analysis are:
a) Fibonacci Circles: The Fibonacci Circles tool is used to find support and resistance
areas in both price and time. Fibonacci Circles ratios are commonly drawn using a
recent Pivot as the center of the circle, moving out to the latest Pivot point.
b) Fibonacci Extension: The Fibonacci Extension tool is used to measure the amount
the market has extended compared to the overall market movement. Fibonacci
Extensions are commonly drawn from the beginning of Wave 1 (the Zero point) to
the top of Wave 3 and then to the Wave 4 retracements to find a target price area for
the Wave 5 extension.
c) Fibonacci Retracements: The Fibonacci Retracements tool is used to measure the
amount the market has retraced compared to the overall market movement.
Fibonacci Retracements are commonly drawn from the beginning of Wave 1 (the
Zero point) to the top of Wave 3 to find a target price area for the Wave 4
retracements.
d) Fibonacci Time: The Fibonacci Time tool is used to project Fibonacci ratios out into
the future. With the idea that past Pivots, one can project future Pivots or changes in
trend. Time & Price Squares help to identify changes in a trend, such as those found
at the end of an Elliott Wave Three, Four or Five, or in A-B-C corrections as well as
intermediate and minor price swings. Time & Price Squares are values determined
by Gann (Time) & Fibonacci (Price).
233
Gann Studies
W. D. Gann (1878-1955) designed several unique techniques for studying price
charts. Central to Gann's techniques was the use of geometric angles in conjunction
with time and price. Gann believed that specific geometric patterns and angles had
unique characteristics that could be used to predict price action.
All of Gann's techniques require that equal time and price intervals be used on the
charts, so that a rise/run of 1 x 1 will always equal a 45-degree angle.
Gann believed that the ideal balance between time and price exists when prices rise or
fall at a 45-degree angle relative to the time axis. This is also called a 1 x 1 angle (i.e.,
prices rise one price unit for each time unit).
Gann Angles are drawn between a significant bottom and top (or vice versa) at
various angles. Deemed the most important by Gann, the 1 x 1 trend line signifies a
bull market if prices are above the trend line or a bear market if below. Gann felt that a
1 x 1 trend line provides major support during an up-trend and when the trend line is
broken, it signifies a major reversal in the trend. Gann identified nine significant
angles, with the 1 x 1 being the most important:
1 x 8 - 82.5 degrees 1 x 4 - 75 degrees 1 x 3 - 71.25 degrees 1 x 2 - 63.75 degrees 1 x 1
- 45 degrees 2 x 1 - 26.25 degrees 3 x 1 - 18.75 degrees 4 x 1 - 15 degrees 8 x 1 - 7.5
degrees
In order for the rise/run values (e.g., 1 x 1, 1 x 8, etc.) to match the actual angles (in
degrees), the x- and y-axes must have equally spaced intervals. This means that one
unit on the x-axis (i.e., hour, day, week, month, etc.) must be the same distance as one
unit on the y-axis. The easiest way to calibrate the chart is make sure that a 1 x 1 angle
produces a 45-degree angle.
Gann observed that each of the angles could provide support and resistance
depending on the trend. For example, during an up-trend the 1 x 1 angle tends to
provide major support. A major reversal is signaled when prices fall below the 1 x 1
angled trend line. According to Gann, prices should then be expected to fall to the next
trend line (i.e., the 2 x 1 angle). In other words, as one angle is penetrated, expect
prices to move and consolidate at the next angle.

234
Gann developed several techniques for studying market action. These include Gann
Lines, Gann Fans, and Gann Grids.
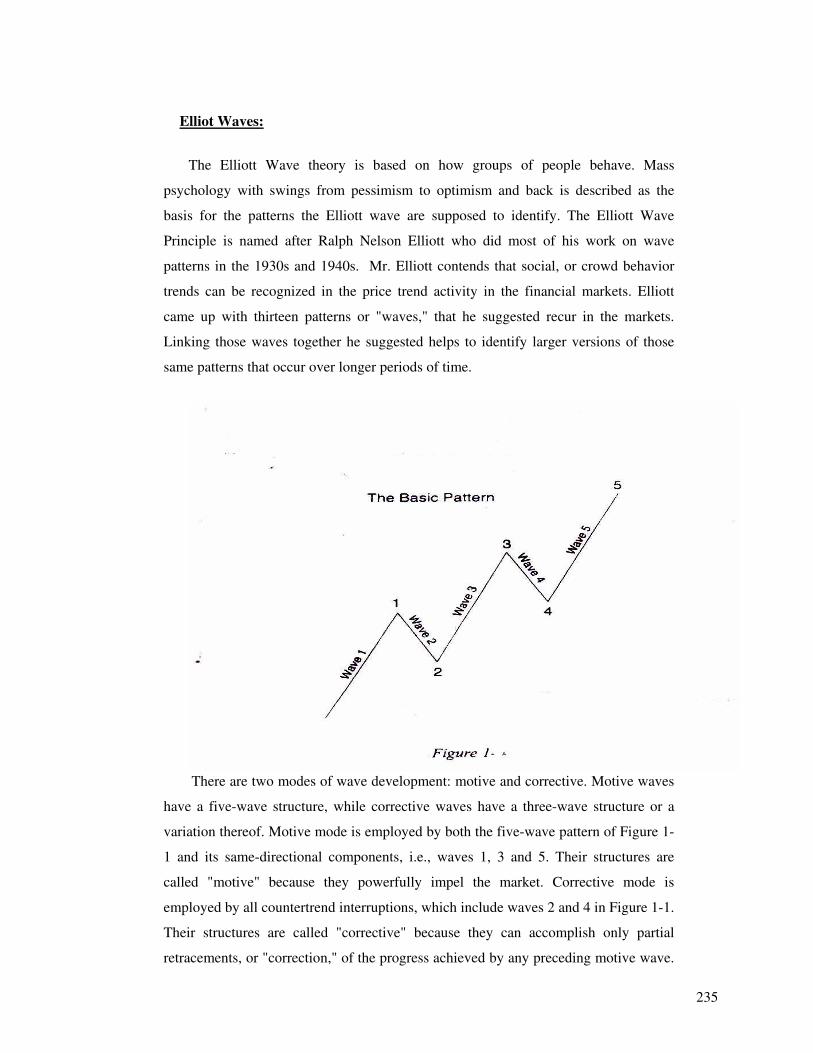
235
Elliot Waves:
The Elliott Wave theory is based on how groups of people behave. Mass
psychology with swings from pessimism to optimism and back is described as the
basis for the patterns the Elliott wave are supposed to identify. The Elliott Wave
Principle is named after Ralph Nelson Elliott who did most of his work on wave
patterns in the 1930s and 1940s. Mr. Elliott contends that social, or crowd behavior
trends can be recognized in the price trend activity in the financial markets. Elliott
came up with thirteen patterns or "waves," that he suggested recur in the markets.
Linking those waves together he suggested helps to identify larger versions of those
same patterns that occur over longer periods of time.
There are two modes of wave development: motive and corrective. Motive waves
have a five-wave structure, while corrective waves have a three-wave structure or a
variation thereof. Motive mode is employed by both the five-wave pattern of Figure 1-
1 and its same-directional components, i.e., waves 1, 3 and 5. Their structures are
called "motive" because they powerfully impel the market. Corrective mode is
employed by all countertrend interruptions, which include waves 2 and 4 in Figure 1-1.
Their structures are called "corrective" because they can accomplish only partial
retracements, or "correction," of the progress achieved by any preceding motive wave.
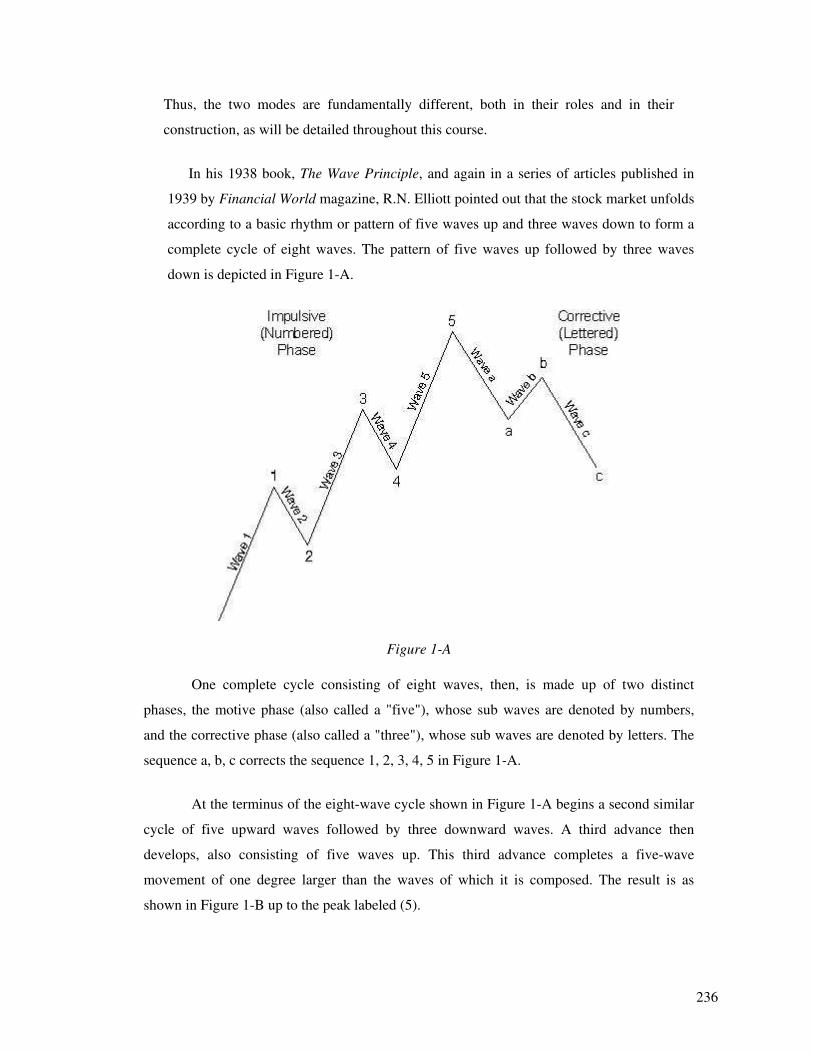
236
Thus, the two modes are fundamentally different, both in their roles and in their
construction, as will be detailed throughout this course.
In his 1938 book, The Wave Principle, and again in a series of articles published in
1939 by Financial World magazine, R.N. Elliott pointed out that the stock market unfolds
according to a basic rhythm or pattern of five waves up and three waves down to form a
complete cycle of eight waves. The pattern of five waves up followed by three waves
down is depicted in Figure 1-A.
Figure 1-A
One complete cycle consisting of eight waves, then, is made up of two distinct
phases, the motive phase (also called a "five"), whose sub waves are denoted by numbers,
and the corrective phase (also called a "three"), whose sub waves are denoted by letters. The
sequence a, b, c corrects the sequence 1, 2, 3, 4, 5 in Figure 1-A.
At the terminus of the eight-wave cycle shown in Figure 1-A begins a second similar
cycle of five upward waves followed by three downward waves. A third advance then
develops, also consisting of five waves up. This third advance completes a five-wave
movement of one degree larger than the waves of which it is composed. The result is as
shown in Figure 1-B up to the peak labeled (5).
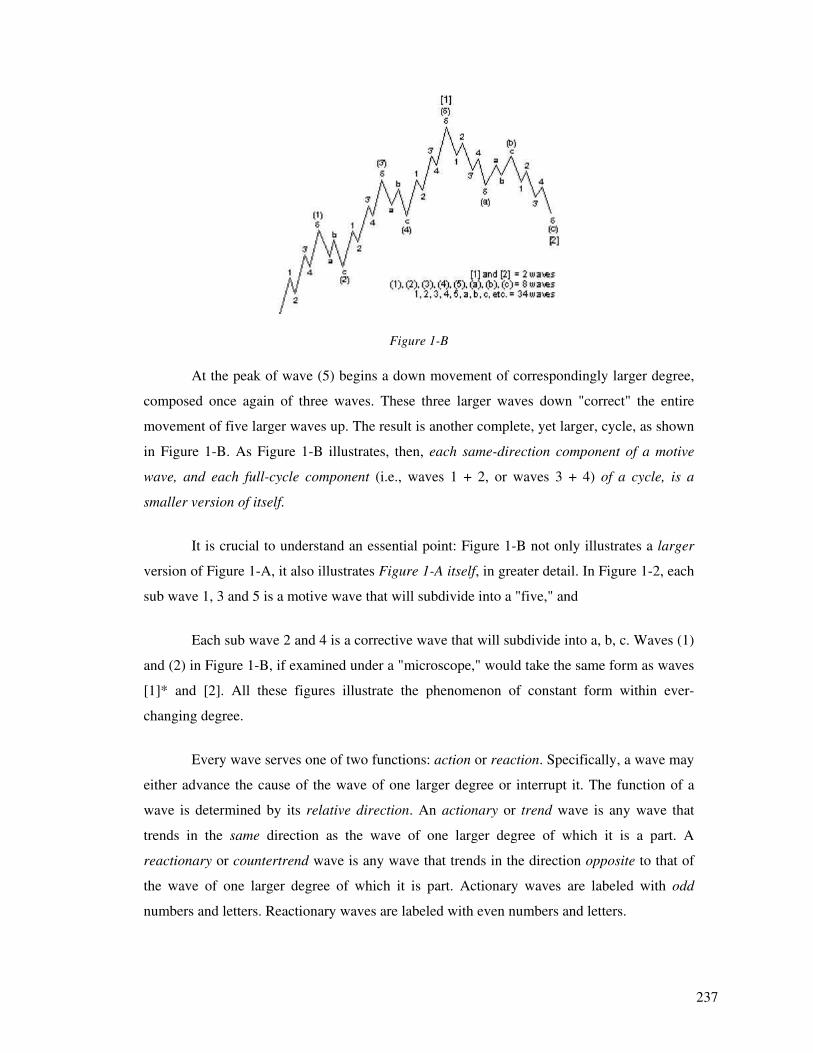
237
Figure 1-B
At the peak of wave (5) begins a down movement of correspondingly larger degree,
composed once again of three waves. These three larger waves down "correct" the entire
movement of five larger waves up. The result is another complete, yet larger, cycle, as shown
in Figure 1-B. As Figure 1-B illustrates, then, each same-direction component of a motive
wave, and each full-cycle component (i.e., waves 1 + 2, or waves 3 + 4) of a cycle, is a
smaller version of itself.
It is crucial to understand an essential point: Figure 1-B not only illustrates a larger
version of Figure 1-A, it also illustrates Figure 1-A itself, in greater detail. In Figure 1-2, each
sub wave 1, 3 and 5 is a motive wave that will subdivide into a "five," and
Each sub wave 2 and 4 is a corrective wave that will subdivide into a, b, c. Waves (1)
and (2) in Figure 1-B, if examined under a "microscope," would take the same form as waves
[1]* and [2]. All these figures illustrate the phenomenon of constant form within ever-
changing degree.
Every wave serves one of two functions: action or reaction. Specifically, a wave may
either advance the cause of the wave of one larger degree or interrupt it. The function of a
wave is determined by its relative direction. An actionary or trend wave is any wave that
trends in the same direction as the wave of one larger degree of which it is a part. A
reactionary or countertrend wave is any wave that trends in the direction opposite to that of
the wave of one larger degree of which it is part. Actionary waves are labeled with odd
numbers and letters. Reactionary waves are labeled with even numbers and letters.
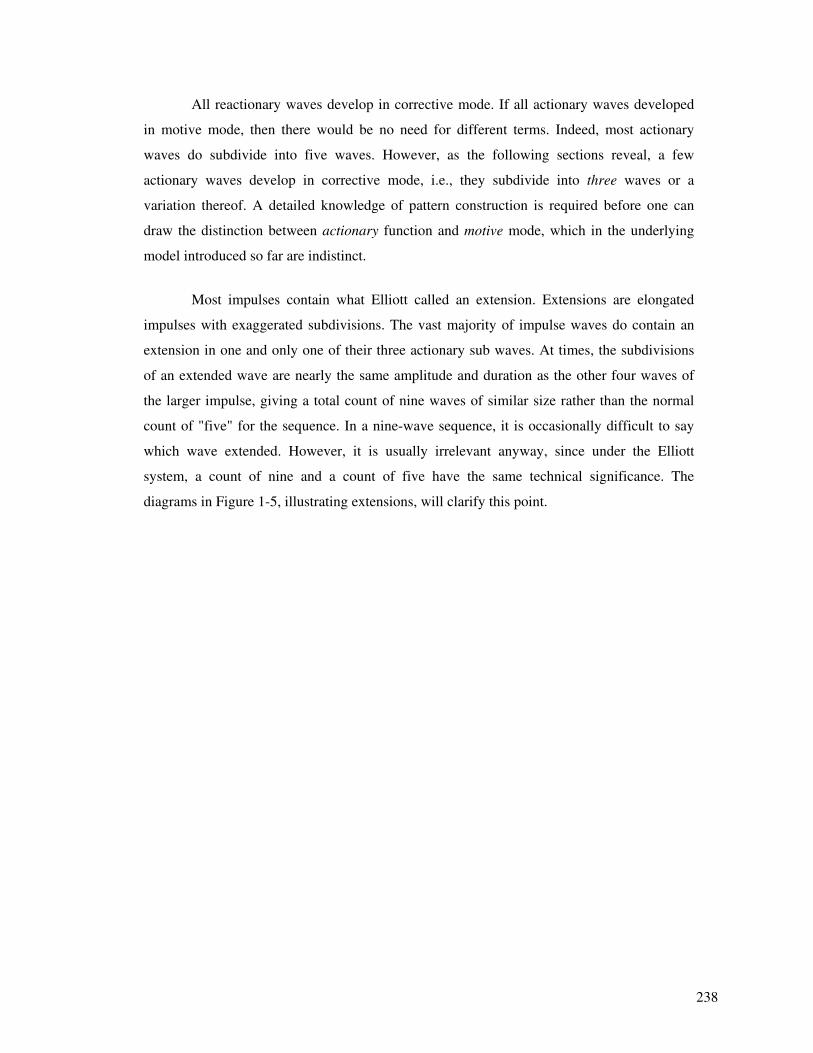
238
All reactionary waves develop in corrective mode. If all actionary waves developed
in motive mode, then there would be no need for different terms. Indeed, most actionary
waves do subdivide into five waves. However, as the following sections reveal, a few
actionary waves develop in corrective mode, i.e., they subdivide into three waves or a
variation thereof. A detailed knowledge of pattern construction is required before one can
draw the distinction between actionary function and motive mode, which in the underlying
model introduced so far are indistinct.
Most impulses contain what Elliott called an extension. Extensions are elongated
impulses with exaggerated subdivisions. The vast majority of impulse waves do contain an
extension in one and only one of their three actionary sub waves. At times, the subdivisions
of an extended wave are nearly the same amplitude and duration as the other four waves of
the larger impulse, giving a total count of nine waves of similar size rather than the normal
count of "five" for the sequence. In a nine-wave sequence, it is occasionally difficult to say
which wave extended. However, it is usually irrelevant anyway, since under the Elliott
system, a count of nine and a count of five have the same technical significance. The
diagrams in Figure 1-5, illustrating extensions, will clarify this point.
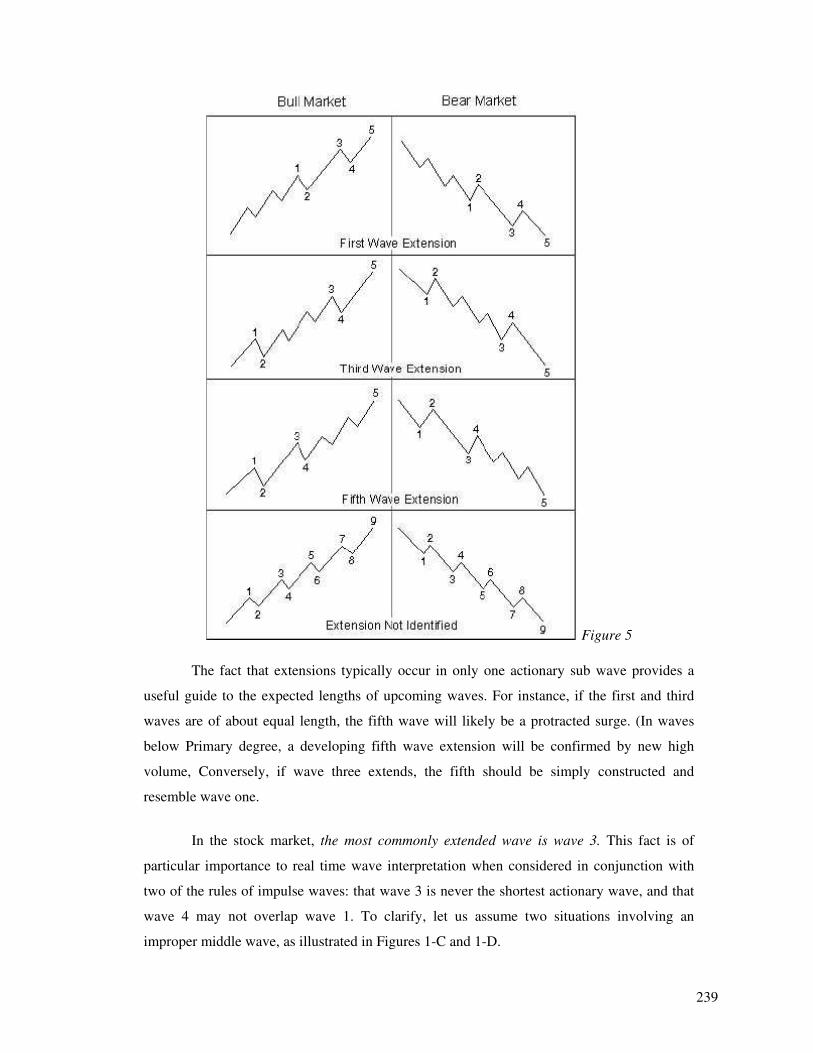
239
Figure 5
The fact that extensions typically occur in only one actionary sub wave provides a
useful guide to the expected lengths of upcoming waves. For instance, if the first and third
waves are of about equal length, the fifth wave will likely be a protracted surge. (In waves
below Primary degree, a developing fifth wave extension will be confirmed by new high
volume, Conversely, if wave three extends, the fifth should be simply constructed and
resemble wave one.
In the stock market, the most commonly extended wave is wave 3. This fact is of
particular importance to real time wave interpretation when considered in conjunction with
two of the rules of impulse waves: that wave 3 is never the shortest actionary wave, and that
wave 4 may not overlap wave 1. To clarify, let us assume two situations involving an
improper middle wave, as illustrated in Figures 1-C and 1-D.
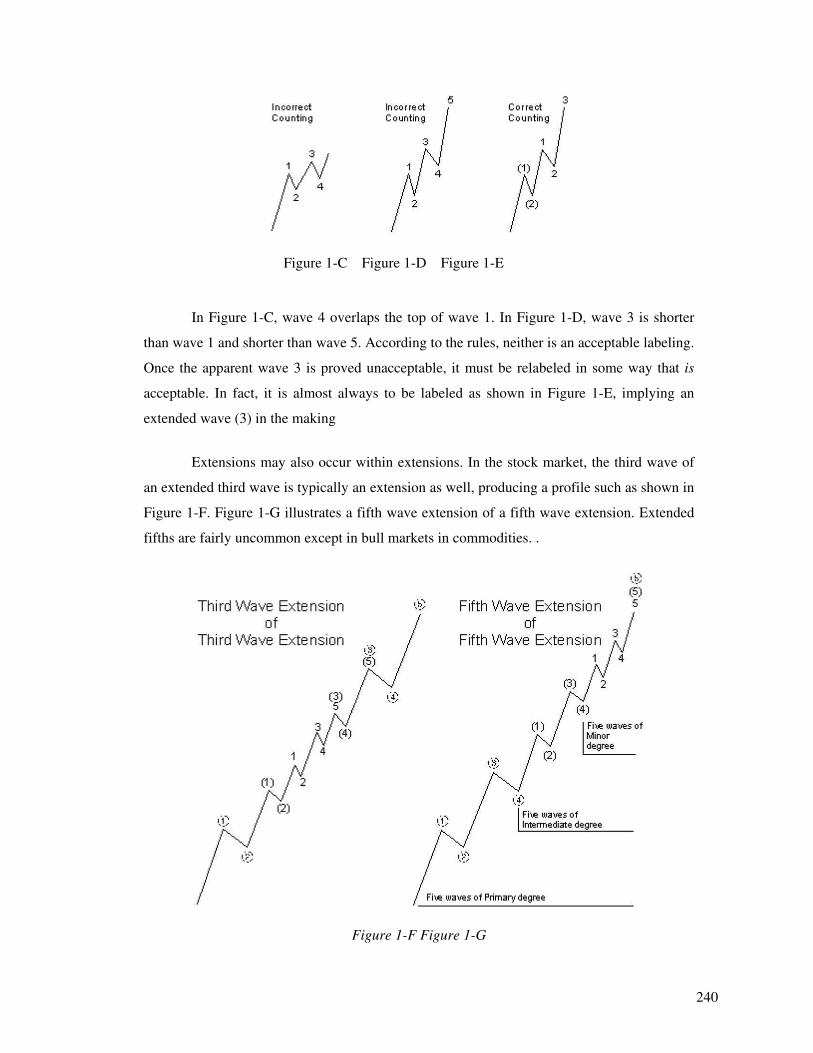
240
Figure 1-C Figure 1-D Figure 1-E
In Figure 1-C, wave 4 overlaps the top of wave 1. In Figure 1-D, wave 3 is shorter
than wave 1 and shorter than wave 5. According to the rules, neither is an acceptable labeling.
Once the apparent wave 3 is proved unacceptable, it must be relabeled in some way that is
acceptable. In fact, it is almost always to be labeled as shown in Figure 1-E, implying an
extended wave (3) in the making
Extensions may also occur within extensions. In the stock market, the third wave of
an extended third wave is typically an extension as well, producing a profile such as shown in
Figure 1-F. Figure 1-G illustrates a fifth wave extension of a fifth wave extension. Extended
fifths are fairly uncommon except in bull markets in commodities. .
Figure 1-F Figure 1-G
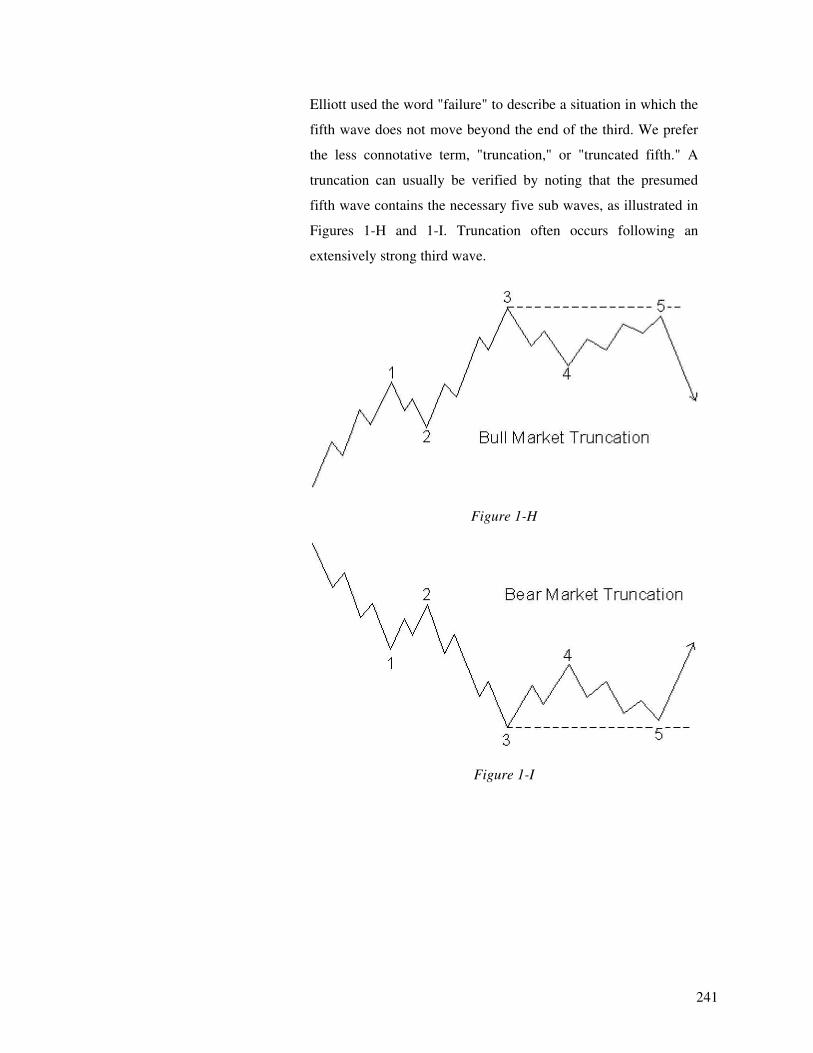
241
Elliott used the word "failure" to describe a situation in which the
fifth wave does not move beyond the end of the third. We prefer
the less connotative term, "truncation," or "truncated fifth." A
truncation can usually be verified by noting that the presumed
fifth wave contains the necessary five sub waves, as illustrated in
Figures 1-H and 1-I. Truncation often occurs following an
extensively strong third wave.
Figure 1-H
Figure 1-I
242
Markets move against the trend of one greater degree only with a seeming
struggle. Resistance from the larger trend appears to prevent a correction from
developing a full motive structure. This struggle between the two oppositely
trending degrees generally makes corrective waves less clearly identifiable than
motive waves, which always flow with comparative ease in the direction of the
one larger trend. As another result of this conflict between trends, corrective
waves are quite a bit more varied than motive waves. Further, they occasionally
increase or decrease in complexity as they unfold so that what are technically
sub waves of the same degree can by their complexity or time length appear to
be of different degree. For all these reasons, it can be difficult at times to fit
corrective waves into recognizable patterns until they are completed and behind
us. As the terminations of corrective waves are less predictable than those for
motive waves, the Elliott analyst must exercise more caution in his analysis
when the market is in a meandering corrective mood than when prices are in a
persistently motive trend.
The single most important rule that can be gleaned from a study of the various
corrective patterns is that corrections are never fives. Only motive waves are
fives. For this reason, an initial five-wave movement against the larger trend is
never the end of a correction, only part of it.
Corrective processes come in two styles. Sharp corrections angle steeply against
the larger trend. Sideways corrections, while always producing net retracements
of the preceding wave, typically contain a movement that carries back to or
beyond its starting level, thus producing an overall sideways appearance. The
discussion of the guideline of alternation in Lesson 10 will explain the reason
for noting these two styles.
Specific corrective patterns fall into four main categories:
Zigzags (5-3-5; includes three types: single, double, and triple);
Flats (3-3-5; includes three types: regular, expanded, and running);
Triangles (3-3-3-3-3; four types: three of the contracting variety (ascending,
descending, and symmetrical) and one of the expanding variety (reverse
243
symmetrical);
Double threes and triple threes (combined structures).
The idea of wave personality is a substantial expansion of the Wave Principle. It has
the advantages of bringing human behavior more personally into the equation and even more
important, of enhancing the utility of standard technical analysis.
The personality of each wave in the Elliott sequence is an integral part of the
reflection of the mass psychology it embodies. The progression of mass emotions from
pessimism to optimism and back again tends to follow a similar path each time around,
producing similar circumstances at corresponding points in the wave structure. The
personality of each wave type is usually manifest whether the wave is of Grand Super cycle
degree or Subminuette. These properties not only forewarn the analyst about what to expect
in the next sequence but at times can help determine one's present location in the progression
of waves, when for other reasons the count is unclear or open to differing interpretations. As
waves are in the process of unfolding, there are times when several different wave counts are
perfectly admissible under all known Elliott rules. It is at these junctures that knowledge of
wave personality can be invaluable. If the analyst recognizes the character of a single wave,
he can often correctly interpret the complexities of the larger pattern. The following
discussions relate to an underlying bull market picture,. These observations apply in reverse
when the actionary waves are downward and the reactionary waves are upward.
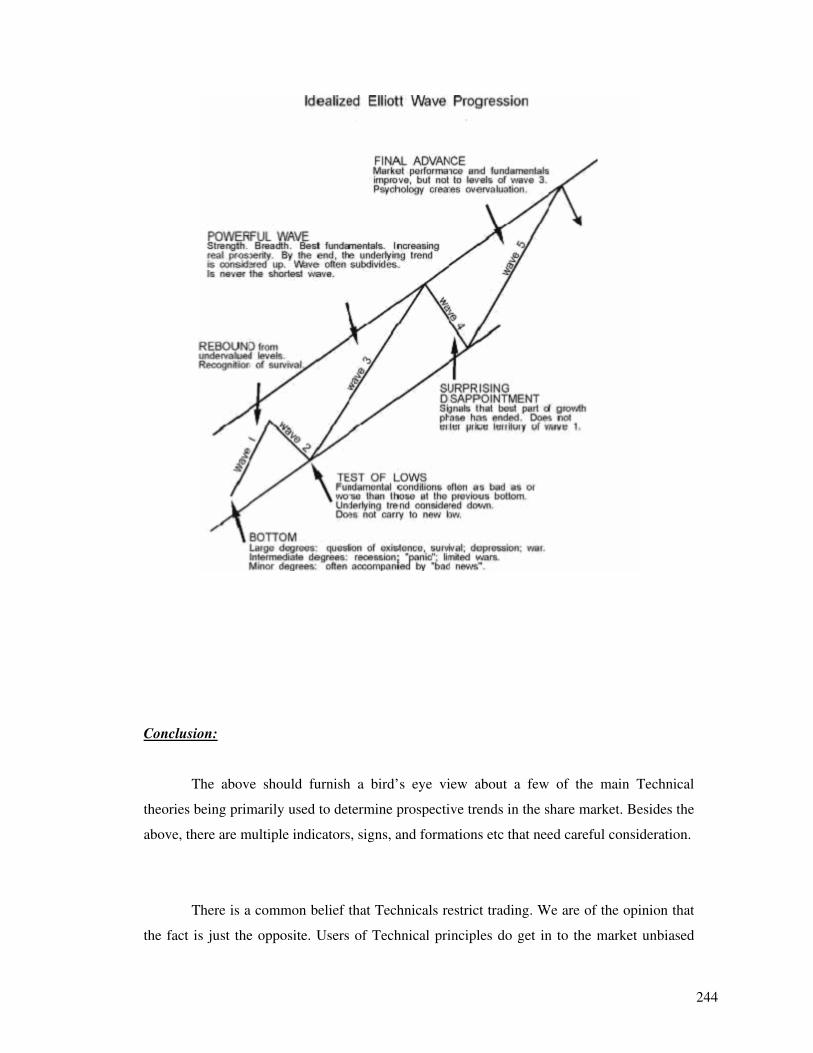
244
Conclusion:
The above should furnish a bird’s eye view about a few of the main Technical
theories being primarily used to determine prospective trends in the share market. Besides the
above, there are multiple indicators, signs, and formations etc that need careful consideration.
There is a common belief that Technicals restrict trading. We are of the opinion that
the fact is just the opposite. Users of Technical principles do get in to the market unbiased
245
and hunt for tradable scripts and embark on such trades where positive outcome is more
certain. This eliminates risky trades and maximizes profit prospects.
Often a debate is heard about prevalence of Fundamentals over Technicals. While not
undermining Fundamental studies, which comprises of examining industry performance,
Balance Sheet studies, judging P/E ratios etc, we have only a small reply to counter the same.
The reply is simply a direction to refer to the first assumption of Dow theory which says:”
The average discounts everything: The price of any script/stock reflects everything known
about the security”. In other words, what is referred to as Fundamental studies is nothing but
the starting point of Technicals. One must realize here that any market function with its own
dynamics of various economic forces and to base investment decision based on some
financial data would tantamount to leaving a big gap of uncertainty factor with respect to
future Expectations.
BIBILIOGRAPHY
246
Elliot Wave Principle by A. J. Frost and Robert R. Prechter. Jr The Wave Principle of Human Social Behavior and the New Science of Socionomics, by Robert R. Prechter. Jr At the Crest of the Tidal Wave by Robert R. Prechter. Jr View from the top of the Grand Supercycle, by Robert R. Prechter. Jr Market Analysis for the New Millennium by Robert R. Prechter. Jr SHADOWS OF ECONOMIC PROSPERITY IN INDIA IN RETROSPECTION OF THE CAPITAL MARKET- by Soumitra Lahiri World Investment Report 2006 by UNO The Effects of Terrorism on Global Capital Markets- by Andrew H Chen & Thomas S Siems World War II and the Triumph of Keynesianism by Robert Higgs, March 1995 Backgrounder: Capital Controls by Anya Schiffrin DJIA chart – Yahoo Finance Yen Rises as Flight From Risk Prompts Reversal of Carry Trades By Agnes Lovasz and Chris Young of Bloomberg.com China Bars Firms Speculating With Stock-Sale Funds By Josephine Lau and Jiang Jianguo March 20 (Bloomberg) Gold Charts- www.Kitco.com Subprime: The risk to Wall Street By Grace Wong, CNNMoney.com staff writer March 12 2007 'Liar loans': Mortgage woes beyond subprime- By Chris Isidore, CNNMoney.com senior writer March 19 2007 Short Sellers' Who Predicted Subprime Rout See More Declines By Michael Patterson-Bloomberg.com ‘Unrestricted warfare’ by Qiao Liang and Wang Xiangsui published by PLA Literature and Arts Publishing House, Beijing Wall Street has resilience NEW YORK (CNNfn):07/07/2005 Stocks stand up to terror Monday, July 11, 2005 By E.S. Browning, The Wall Street Journal