Embed Size (px)
Citation preview
WORLD ECONOMIC SURVEY, 1973
Part One. Population and Development
UNITED NATIONS
Et5486
STtESA/8
Department of Economic and Sociam Affairs
Part One.
NOTE
Symbols of United Nations documents are composed of capital letters combinedwith figures. Mention of such a symbol indicates a reference to a United Nationsdocument.
E/5486ST/ESA/8
UNITED NATIONS PUBLICATION
Sales No. E.74.II.C.I
Price: $U.S. 7.00
(or equivalent in other currencies)
FOREWORD
This report, Worm Economic Survey, 1973, is thetwenty-fifth in a series of comprehensive reviews ofworld economic conditions published by the UnitedNations. It is issued in response to General Assemblyresolution 118 (II), in which the Secretary-Generalwas requested to prepare an annual review andanalysis of world economic conditions and trends.The report is intended to meet the requirements of theEconomic and Social Council and other organs of theUnited Nations for an appraisal of world economicconditions which may serve as a basis for recommend-ations on economic matters. It is also intended tostimulate interest in and discussion of internationaleconomic problems among a more general publicaudience.
The present Survey appears in what the GeneralAssembly, in its resolution 2683 (XXV), designatedWorld Population Year, which is to culminate in theWorld Population Conference in August 1974. In thelight of this, it was decided to devote the Survey toan examination of recent interrelationships betweendemographic change and the process of socio-economicdevelopment. It seeks to present a range of data thatmay be found useful as background to the Conferenceand subsequently in discussions of population policyand in the formulation of development plans.
The Survey consists of four chapters preceded by abrief introduction which sets forth some of the salientaspects of the relationship between population anddevelopment. Chapter I is almost entirely statistical innature: it presents the latest demographic information,drawing as far as possible from the results of the 1970round of censuses, and the principal social andeconomic data on which the population variable tendsto impinge most directly. This chapter is global inscope. The other three chapters are devoted to anempirical examination of some of the more importantways in which recent changes in population size,structure, distribution and rates of growth haveaffected economic and social conditions and progressin the developed market economies (chapter II), in thecentrally planned economies (chapter III) and thedeveloping countries (chapter IV).1
The Worm Economic Survey is prepared in theCentre for Development Planning, Projections andPolicies of the Department of Economic and SocialAffairs of the United Nations Secretariat.
1 This threefold categorization of countries is intended forstatistical convenience; it does not necessarily imply a judgementregarding the stage of development of any particular country.
iii

CONTENTS
FOREWORD ...............................
EXPLANATORY NOTES ...........................
INTRODUCTION ..............................
Chapter
I. INTERACTION BETWEEN DEMOGRAPHIC AND SOCIO-ECONOMIC VARIABLES
Recent changes in vital rates ....................
The growth of population .....................
The age structure of the population .................
Population size ..... ÿ .....................
Page
iii
x
1
79
131718
II. THE IMPACT OF RECENT DEMOGRAPHIC CHANGES IN THE DEVELOPED MARKETECONOMIES ............................ 25
The size of population ....................... 25
The rate of growth and age distribution of population ......... 29The movement of population .................... 37
III. POPULATION AND ECONOMIC DEVELOPMENT IN EASTERN EUROPE AND THE USSR 48
Outline of main demographic trends ................. 48
Population growth and labour supply ................ 51
Demographic change and economic policy .............. 54
IV. Tim IMPACT OF RECENT DEMOGRAPHIC CHANGES IN THE DEVELOPING COUNTRIES 69Feeding the population ....................... 70
Increasing the savings of the population ............... 78
Infrastructure requirements and urbanization ............. 80
Educational requirements and employment .............. 85
ANNEX : Statistical tables • • • ...................... 91
v
Table
List tables
Page
1. World population and vital rates, by region, 1950-1970 . . . . . . . . " 7
2. Socio-economic characteristics of countries grouped according to vital rates. 9
3. Socio-economic characteristics of countries grouped according to rate ofincrease in population. . . . . . . . . . . . . . . . . . . . . 16
4. Socio-economic characteristics of countries grouped according to size 23
5. World consumption of the major non-ferrous metals, 1900-1970 . . 26
6. Per capita consumption of major non-ferrous metals, 1970. . . . . 27
7. United States of America: contribution of old scrap to metal consumption,1951-1952 and 1969-1970 . . . . . . . . . . . . . . . . . . . . . 27
8. Implicit claim on natural resources arising from populationgrowth, 1970 .. 31
9. Developed market economies: number oflive births, 1946-1970 . . . . .. 32
10. Developed market economies: primary and secondary school enrolments,1955-1969 . . . . . . . . . . . . . . . . . . . . . . . . . . . . . 32
11. Developed market economies: public expenditure on education, 1950-1970.. 33
12. Developed market economies: changes in life expectancies, 1950-1970 . . .. 34
13. Developed market economies: distribution according to ratio of elderly toworking age population, 1970 . . . . . . . . . . . . . . . . . . . .. 35
14. Developed market economies: distribution of population by size of households 36
15. Developed market economies: population growth and residential construction,1960-1970 . . . . . . . . . . . . . . . . . . . . . . . . . . . . .. 37
16. Developed market economies: change in urban and rural population, 1960-1970 " 38
17. European Economic Community: growth in regional population and income,1960-1970 . . . . . . . . . . . . . . . . . . . . . 42
18. Estimated deployment offoreign workers in Europe, 1972 . . . . . . . ., 44
19. Developed market economies: contribution of natural increase and migrationto population growth, 1950-1970 . . . . . . . . . . . . . . . . . . .. 46
20. Centrally planned economies of Eastern Europe and the USSR: populationgrowth, 1950-1970 . . . . . . . . . . . . . . . . . . . . . . . . 48
21. Centrally planned economies of Eastern Europe and the USSR: birth anddeath rates and rates of natural increase, 1950-1970. . . . . . . . . . .. 49
22. Centrally planned economies of Eastern Europe and the USSR: dependencyratios, 1950 to 1970: pre-productive, post-productive and total dependentpopulation as percentage of working age population . . . . . . . . . .. 50
23. Centrally planned economies of Europe and the USSR: urbanization and ruralcontraction, 1950 to 1970 . . . . . . . . . . . . . . . . . . . . . " 50
24. Centrally planned economies of Eastern Europe and the USSR: growth of totalpopulation, working age population and economically active population duringthe intercensal periods 51
vi
Table
25. Centrally planned economies of Eastern Europe and the USSR: share ofworking age population (15-64) in total population ............
34.
35.
36.
37.
38.
39.
40.
41.
45.
33.
32.
31.
27.
28.
26. Centrally planned economies of Eastern Europe and the USSR: age and sexstructure of labour supply and labour force ...............
Centrally planned economies of Eastern Europe and the USSR: labour forceparticipation rates, total and by sex ...................
Centrally planned economies of Eastern Europe and the USSR" selected age-specific labour force participation rates .................
29. Centrally planned economies of Eastern Europe and the USSR: intercensalchanges in the sectoral structure of the economically active population
30. Centrally planned economies of Eastern Europe and the USSR: growth of inputsinto value added in major sectors, 1950s and 1960s ............
Centrally planned economies of Eastern Europe and the USSR: sectoralstructure of GDP and major inputs, 1951-1952 and 1967-1969 .......
Centrally planned economies of Eastern Europe and the USSR: personal con-sumption and net capital formation, 1960 to 1970 ............
Centrally planned economies of Eastern Europe and the USSR: growth oftotal andper capita net material product, 1950 to 1970 ..........
Selected centrally planned economies: growth of components of consumption,1960 to 1970 .............................
Centrally planned economies of Eastern Europe and the USSR: major com-ponents of gross fixed capital formation, 1960 to 1970 ...........
Selected centrally planned economies of Eastern Europe: capital formation inhousing and social services, 1960 to 1970 ................
Centrally planned economies of Eastern Europe and the USSR: selected indi-cators of population services, 1950 to 1970 ...............
Centrally planned economies of Eastern Europe and the USSR: expansion ofeducation, 1950 to 1970 ........................
Developing countries in which food production outran population growth inthe 1960s
Developing countries in which food production lagged seriously behind popu-lation growth in the 1960s .......................
Developing countries in which food production increased more or less in linewith population in the 1960s ......................
42. Developing countries: changes in cereal areas, output and yield, 1960s . .
43. Indian food-grain production, by state .................
44. Selected developing countries: household savings and demographic charac-teristics, 1970 ............................
Developing countries: distribution of countries according to rate of urbaniz-ation, 1960-1970 ...........................
46. Developing countries: distribution of population and labour force, 1970 .
47. Developing countries: growth of school age population and school enrolment,1960-1970 ....................... . ........
Page
51
52
53
53
55
56
57
58
62
63
64
65
66
68
70
72
74
75
77
81
82
85
89
vii
Annex tables
Table
A.!.
A.2.
A.3.
A.4.
A.5.
A.6.
A.7.
A.8.
A.9.
A.10.
A.11.
A.12.
A.13.
A.14.
A.15.
A.161
A.17.
A.18.
A.19.
Page
Distribution of countries according to mortality change and per capitaincome, 1950-1970 ......................... 93
Distribution of countries according to change in mortality and income,1955-1970 ............................ 95
Distribution of countries according to changes in mortality and degree ofurbanization, 1960-1970 ...................... 97
Distribution of countries according to changes in birth rate and degree ofurbanization, 1960-1970 ..................... 99
Distribution of countries according to changes in birth rate and per capitaincome, 1950-1970 ........................ 101
Distribution of countries according to changes in birth rate and economicgrowth, 1955-1970 ........................ 103
Distribution of countries according to educational attainment and birth rate 105
Distribution of countries according to population growth and income, 1970 106
Distribution of countries according to rates of growth of population andincome, 1961-1970 ........................ 108
Distribution of countries according to rates of growth in population andper capita gross domestic product, 1961-1970 ............. 110
Distribution of countries according to rates of growth in population andsavings ratio, 1968-1970 ...................... 112
Distribution of countries according to rate of population growth and degreeof urbanization, 1970 ...................... 114
Distribution of countries according to population growth and school enrol-ment, late 1960s ......................... 116
Distribution of countries according to population growth and female schoolenrolment ratio, 1970 ....................... 118
Distribution of countries according to rate of population growth and percapita calorie consumption, 1965-1970 ................ 120
Distribution of countries according to rate of population growth and percapita protein consumption, 1965-1970 ................ 122
Distribution of countries according to rate of population growth and percapita food imports, 1970 ..................... 124
Distribution of countries according to working age ratio and per capitaincome, 1970 ........................... 125
Distribution of countries according to youthfulness and per capita income,1970 ............................... 127
A. 20. Distribution of countries according to working age ratio and savings ratio,1970 ............................... 129
A.23.
A.22.
Distribution of countries according to working age ratio and rate of growthof production, 1970 ........................ 131
Distribution of countries according to school age ratio and educationalexpenditure, late 1960s ....................... 133
Distribution of countries according to population size and growth rate, 1970 135
A.21.
viii
Table
A. 24.
A.25.
A.26.
A.27.
A.28.
A. 29.
A.30.
A.31.
A.32.
A.33.
A.34.
A.35.
A.36.
A.37.
A.38.
A.39.
A.40.
A.41.
A.42.
A.43.
A.44.
A.45.
A.46.
A.47.
A.48.
A.49.
Figure
Page
Distribution of countries according to population size and per capita grossdomestic product, !970 ...................... 137
Distribution of countries according to size of population and rate of growthof production, 1970 ....................... 139
Distribution of countries according to size of population and rate of increaseinper capita production, 1961-1970 ................. 141
Distribution of countries according to population and savings ratio, average1968-1970 ........................... 143
Distribution of countries according to population size and density, 1970 145
Distribution of countries according to population size and ratio to agri-cultural land, 1970 ....................... 147
Distribution of countries according to size of population and degree ofurbanization, 1970 ......................... 149
Distribution of countries according to population size and rural density, 1970 150
Distribution of countries according to size of population and the proportionof economically active population engaged in agriculture, 1970 ..... 152
Distribution of countries according to population and self-sufficiency incereals, 1970 ........................... 153
Distribution of countries according to size of population and food importbill, 1970 ............................. 155
Distribution of countries according to population size and ratio of exportsto imports, 1969-1971 ....................... 156
Distribution of countries according to population size and degree of eco-nomic openness, 1970 ....................... 158
Average annual per capita consumption of major commodities in developedmarket economies and developing countries, !970 ........... 160
Developed market economies: changes in age structure of the population,1950-1970 ........................... 162
Developing countries: changes in cereal area, output and yield, 1960s 163
Distribution of developing countries according to population density andsmall-stock units per person, 1970 .................. 165
Developing countries: national savings and age dependency ratios, 1970 167
Distribution of countries according to population size and infrastructureinvestment ratio, 1970 ....................... 170
Distribution of countries according to population growth and housingconstruction, 1965-1970 ...................... 171
Brazil: geographical distribution of population and output, 1970 .... 172
Developing countries: growth of urban population and labour force, 1960-1970 ......... : ..................... 174
Distribution of countries according to population growth and female par-ticipation rate, 1970 ....................... 177
Developing countries: population structure and growth and educationenrolment and expenditure, 1970 .................. 179
Distribution of countries according to population growth and ratio offemale to male enrolment in secondary school, late 1960s ........ 182
Distribution of countries according to growth of 5-19 age group and of thenumbers not in school, 1960-1970 .................. 184
10I. Cross-country distribution of birth and death rates, average 1965-1970 .
ix
Explanatory notes
The following symbols have been used in the tables throughout the report:
Three dots (...) indicate that data are not available or are not separately reported.
A dash (--) indicates that the amount is nil or negligible.
A blank in a table indicates that the item is not applicable.
A minus sign (--) indicates a deficit or decrease, except as indicated.
A full stop {.) is used to indicate decimals.
A comma (,) is used to distinguish thousands and millions.
A slash (/) indicates a crop year or financial year, e.g., 1970/71.
Use of a hyphen (-) between dates representing years, e.g., 1971-1973, signifies thefull period involved, including the beginning and end years.
Reference to "tons" indicates metric tons, and to "dollars" ($) United States dollars,unless otherwise stated.
The term "billion" signifies a thousand million.
Annual rates of growth or change, unless otherwise stated, refer to annual compoundrates.
Details and percentages in tables do not necessarily add to totals, because of rounding.
The following abbreviations have been used:
CMEAEECFAOGRCILOSITC
Council for Mutual Economic AssistanceEuropean Economic CommunityFood and Agriculture Organization of the United Nationsgross reproduction coefficientsInternational Labour OrganisationStandard International Trade Classification
The designations employed and the presentation of the material in this publicationdo not imply the expression of any opinion whatsoever on the part of the Secretariatof the United Nations concerning the legal status of any country or territory or of itsauthorities, or concerning the delimitation of its frontiers.
x
INTRODUCTION
It is surprising how small a part population questionshave played in the planning of economic and socialdevelopment. References to demographic changes arerelatively few in plan documents and where populationmatters are dealt with it has often been implicitly--through the denomination of the economic or socialvariable in per capita terms, for example--rather than
explicitly.
The explanation for this reticence lies partly inignorance: many countries--including some thatengage in development planning--are still uncertainof the precise size, distribution and composition oftheir population. In very few developing countries isthere an adequate system of birth and death registra-tions. Censuses, when they are taken, are usually10 years apart, whereas most planning is done formuch shorter periods, rarely more than five years.Traditionally, moreover, population has not beenregarded as a socio-economic variable: it has beenthought of--in high-income and low-income countriesalike--almost as an exogenous factor, subject toinexorable, but necessarily slow, evolutionary move-ment.
the United States of America, for example) birth ratescontinued to rise in the 1950s, but in others there wasa marked decline (most notably in Japan but also inDenmark, France, the Netherlands and Sweden) andthis reduction in fertility became more general in the1960s. In almost all the high-income countries birthrates in the early 1970s were substantially lower thanat the beginning of the previous decade. And every-where the pace of physical movement rose steeply:migration between countries, both temporary andpermanent, was at a markedly higher level and urbanareas expanded and their populations changed incomposition at a disconcerting rate.
This situation has been altering in recent years.Many countries have now taken three censuses sincethe Second World War and these have providedstatistical evidence of what was becoming increasinglyapparent in a visual, impressionistic manner, namely,that the pace of demographic change has greatlyaccelerated.
At the root of this in the developing countries hasbeen a decline in death rates, at a speed and on a scalewithout parallel in human history. Accentuating theeffects of this reduction in mortality has been anunprecedented increase in human mobility, resultingin the regrouping and concentration of populationsthe scope of which has also been without historicalparallel.
In the face of this manifest speeding up of the paceat which the demographic situation was altering,attitudes towards the position of the population factorin the process of economic and social developmentalso began to change more rapidly. This process wasassisted by the progress being made in the technologyof birth control. By the end of the 1960s, a majority ofcountries had adopted active population policiesinvolving the official sponsorship of family planning.Though few countries have yet gone as far as to settargets for any of the demographic variables, it is clearthat they are no longer being regarded as exogenousand unalterable. The new generation of plans, chartingthe desired course of development over the 1970s, isbeginning to deal explicitly with population questions,either stating the basic assumptions made in respectof key demographic variables or, increasingly, settingforth policies to be adopted in order to bring aboutchanges in those variables.
In the higher-income countries there has also beena quickening of demographic change. Populationstructures still reflect the differential birth and deathrates occasioned by the 1939-1945 war and the sub-sequent demobilization with its accelerated familyformation. In the early post-war years fertility recoveredfrom the low levels recorded in the 1930s. In somecountries (Belgium, Canada, Luxembourg, Spain and
What are considered key demographic variablesdiffer from case to case but, in the light of recenthistory, there are three sets of population factorsthat tend to impinge most directly on the developmentprocess, influencing not only the pace and scale ofeconomic growth but even the nature of necessary andfeasible social change. First is the absolute size of thepopulation which both governs the extent of a coun-try's internal division of labour and to an importantdegree helps to shape its external relations. Then comethe various aspects of demographic structure, mostnotably age composition and family size, both closelyassociated with--and to some extent the result of--thepattern of birth rates and death rates. The more
immediate consequence of births and deaths is naturalincrease of population, and the rate of populationgrowth is a major determinant of the course of econ-omic and social development. Thirdly, there is thequestion of geographical distribution: the process ofdevelopment is directly affected by population concen-tration and density and by changes in spatial arrange-ment brought about by migration including, in parti-cular, the movement of people into and out of urbangroupings.
Concern about the size of population has mountedin recent years as evolving life styles have begun toimpinge upon physical constraints. In 1972 and 1973the more general malaise arising from a felt deteriora-tion in the "quality of life" was greatly intensified bythe emergence of a number of specific shortages, mostnotably in food-stuffs and energy. The relationshipbetween population and natural resources has there-fore come under renewed scrutiny.
development proceeds and the division of labourintensifies, the farm worker is called upon to providefood not only for himself but for an increasing numberof other persons active outside agriculture. On theaverage, a farm family is now responsible for feedingone non-farm family in the developing countries butas many as !0 in the developed market economies.About 10 times as much energy is used per capita forfood production, distribution and preparation in theUnited States as is used for all purposes in Indonesia,Paraguay, Senegal, Sri Lanka or the Sudan.
In the developing countries the chief problem is theratio of people to land and how land use can beimproved so as to assure an adequate supply of basicfood-stuffs and in due course a raising of dietarystandards. Where an improvement in the diet dependson a larger intake of livestock products the need toincrease cereal yields (per hectare of planted area)become more urgent. The difficulties rise with thedensity of occupation of arable land and the scarcityof water or the irregularity of its supply.
The escape from the pressure of population on theland by way of diversification and technology thusshifts the burden to other natural resources, particu-
larly energy, required to control water supplies, toproduce fertilizers and pesticides, to mechanize farmoperations whose scale or speed lies beyond thecapacity of the farm worker, to transport the resultantproduce and to process it into forms suitable forstorage and mass distribution. In this transformation,the consumption patterns that have evolved in thedeveloped market economies with their 700 millioninhabitants cannot be the model for the developingcountries with between three and four times thatpopulation: milled grain, fresh fruits and vegetables,fish, milk and vegetable oils will have to play a moreimportant and direct nutritional role than meat andthe processed food-stuffs that tend to be so much moreresource-extravagant.
In one sense the more advanced countries haveovercome this particular set of problems. Collectively,at least, they produce a food supply that is sufficientto provide all their inhabitants with a nutritionallysatisfactory diet. Of some of their inhabitants do notin fact enjoy such a diet, it is the result of inequalitiesin income distribution rather then inadequacies in foodsupply.) But to assure every one an adequate dietthese countries have adopted technologies and lifestyles that impose unprecedented strains on the supplyof minerals, particularly fuels. To provide each indi-vidual with the necessary supply of just over 1 millioncalories a year now requires the expenditure of morethan 8 million calories in agriculture, transport andfood processing (together accounting for rather morethan half the total) and in wholesale and retail distri-bution and home storage and preparation.1
In a subsistence society no external energy (otherthan the sun) is used to produce the required foodsupply, and very little to prepare it for eating. As
1 Based on the estimates made by Eric Hirst of the Environ-mental Program of Oak Ridge National Laboratory, Tennessee,United States of America.
The second major area of demographic concern isthe rate of increase of population. This is independentof population size, though the implications of a givenrate of increase clearly vary with the size of the popula-tion involved, both in absolute terms and in relationto its natural resource base. Its implications alsodepend on its vital level; in particular, on the deathrate it embodies: in view of the proven tendency formortality to be capable of a very rapid decline undercontemporary conditions, a given rate of naturalincrease has a much greater growth potential at ahigh death rate than at a low death rate. The signifi-cance of the rate of population increase also dependson the length of time for which the rate has beenoperative, for that determines the age structure of thepopulation and that in turn influences its labour forceand the composition of consumption.
Concern over the rate of increase in populationstems principally from its impact on employment,productivity and saving. Interest in its employmentaspects is universal; its bearing on productivity is aquestion concentrated largely in the more advancedcountries; its effect on saving is crucial to the developingcountries.
2
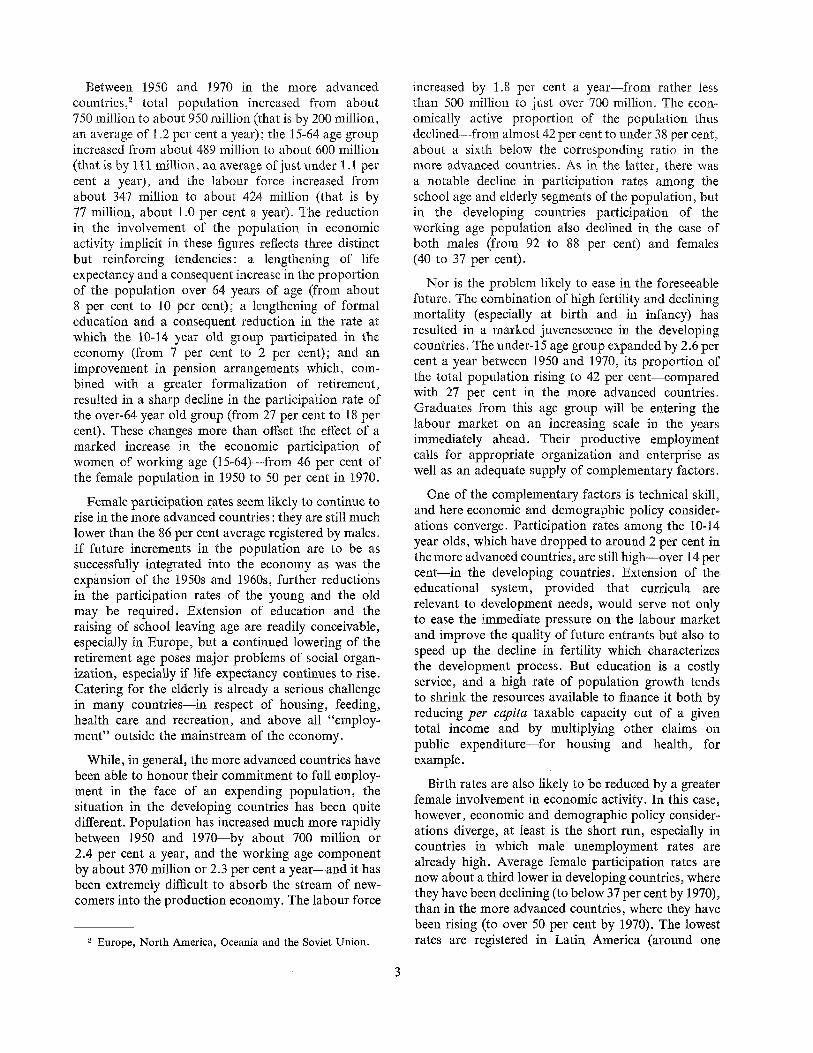
Between 1950 and 1970 in the more advancedcountries,2 total population increased from about750 million to about 950 million (that is by 200 million,an average of 1.2 per cent a year); the 15-64 age groupincreased from about 489 million to about 600 million(that is by 111 million, an average of just under 1.1 percent a year), and the labour force increased fromabout 347 million to about 424 million (that is by77 million, about 1.0 per cent a year). The reductionin the involvement of the population in economicactivity implicit in these figures reflects three distinctbut reinforcing tendencies: a lengthening of lifeexpectancy and a consequent increase in the proportionof the population over 64 years of age (from about8 per cent to 10 per cent); a lengthening of formaleducation and a consequent reduction in the rate atwhich the 10-14 year old group participated in theeconomy (from 7 per cent to 2 per cent); and animprovement in pension arrangements which, com-bined with a greater formalization of retirement,resulted in a sharp decline in the participation rate ofthe over-64 year old group (from 27 per cent to 18 percent). These changes more than offset the effect of amarked increase in the economic participation ofwomen of working age (15-64)--from 46 per cent ofthe female population in 1950 to 50 per cent in 1970.
increased by 1.8 per cent a year--from rather lessthan 500 million to just over 700 million. The econ-omically active proportion of the population thusdeclined--from almost 42 per cent to under 38 per cent,about a sixth below the corresponding ratio in themore advanced countries. As in the latter, there wasa notable decline in participation rates among theschool age and elderly segments of the population, butin the developing countries participation of theworking age population also declined in the case ofboth males (from 92 to 88 per cent) and females(40 to 37 per cent).
Nor is the problem likely to ease in the foreseeablefuture. The combination of high fertility and decliningmortality (especially at birth and in infancy) hasresulted in a marked juvenescence in the developingcountries. The under-15 age group expanded by 2.6 percent a year between 1950 and 1970, its proportion ofthe total population rising to 42 per cent--comparedwith 27 per cent in the more advanced countries.Graduates from this age group will be entering thelabour market on an increasing scale in the yearsimmediately ahead. Their productive employmentcalls for appropriate organization and enterprise aswell as an adequate supply of complementary factors.
Female participation rates seem likely to continue torise in the more advanced countries: they are still muchlower than the 86 per cent average registered by males.If future increments in the population are to be assuccessfully integrated into the economy as was theexpansion of the 1950s and 1960s, further reductionsin the participation rates of the young and the oldmay be required. Extension of education and theraising of school leaving age are readily conceivable,especially in Europe, but a continued lowering of theretirement age poses major problems of social organ-ization, especially if life expectancy continues to rise.Catering for the elderly is already a serious challengein many countries--in respect of housing, feeding,health care and recreation, and above all "employ-ment" outside the mainstream of the economy.
While, in general, the more advanced countries havebeen able to honour their commitment to full employ-ment in the face of an expending population, thesituation in the developing countries has been quitedifferent. Population has increased much more rapidlybetween 1950 and 1970--by about 700 million or2.4 per cent a year, and the working age componentby about 370 million or 2.3 per cent a year--and it hasbeen extremely difficult to absorb the stream of new-comers into the production economy. The labour force
One of the complementary factors is technical skill,and here economic and demographic policy consider-ations converge. Participation rates among the 10-14year olds, which have dropped to around 2 per cent inthe more advanced countries, are still high--over 14 percent--in the developing countries. Extension of theeducational system, provided that curricula arerelevant to development needs, would serve not onlyto ease the immediate pressure on the labour marketand improve the quality of future entrants but also tospeed up the decline in fertility which characterizesthe development process. But education is a costlyservice, and a high rate of population growth tendsto shrink the resources available to finance it both byreducing per capita taxable capacity out of a giventotal income and by multiplying other claims onpublic expenditure--for housing and health, forexample.
2 Europe, North America, Oceania and the Soviet Union.
Birth rates are also likely to be reduced by a greaterfemale involvement in economic activity. In this case,however, economic and demographic policy consider-ations diverge, at least is the short run, especially incountries in which male unemployment rates arealready high. Average female participation rates arenow about a third lower in developing countries, wherethey have been declining (to below 37 per cent by 1970),than in the more advanced countries, where they havebeen rising (to over 50 per cent by 1970). The lowestrates are registered in Latin America (around one
fifth), where population growth is fastest (2.8 per centa year in the 1960s). tf historical precedent is anyguide, the process of development will draw anincreasing proportion of women towards the produc-tion economy. This will greatly increase the need forjob opportunities, the supply of which is alreadyconstrained by the lack of complementary factors.
Another of these factors is capital, and in thisrespect, too, the demographic situation is itself ahandicap. For the higher the fertility the younger thepopulation, and the higher the proportion of thepopulation that consumes but does not produce themore difficult it is--especially in low-income coun-tries-to increase the savings that are needed tofinance the plant and tools and equipment requiredfor expanding employment.
Thus, concern about the growth of population in thedeveloping countries reflects the realization that the"natural" forces making for lower fertility--risingincomes, employment and education, especially ofwomen--operate only uncertainly, against obstaclesthat are magnified by the demographic situation, whilethe forces reducing mortality tend to be much morecertain and, since many represent imported knowledgeand techniques, much less dependent on changesinduced by the development process itself. Hence, ifthe rate of population growth is to be slowed down,efforts to accelerate the development process may haveto be supplemented by a more active and directdemographic policy.
harder work, less concentration of population so asto reintegrate the consumer in the production process,more repair and recycling activity to reduce prematureobsolescing and scrapping, and more emphasis onavoiding pollution and other nuisances than on thesubsequent remedying of their consequences.
Like the rate of population growth, the third majorarea of demographic concern--physical movement--involves different problems in different contexts. Thebroad common denominator is the drift of workerstowards employment opportunities or the prospect ofhigher income, but the speed and effect of this driftvary markedly with the circumstances in which itoccurs, lrn general, the movement has been fromcountryside to town, and urban population hasexpanded much more rapidly than rural population,but the pattern of migration between farm, town, cityand suburb differs considerably from country tocountry.
In the developing countries the dominant trend isfrom farm to city, often bypassing the smaller towns.In the 1960s, urban growth was 2 to 3 times as rapidas rural growth; urban population expansion in excessof 6 per cent a year was recorded in a number ofcountries, and in the aggregate the proportion of thepopulation living in urban areas rose from a fifth toa fourth.
In the more advanced countries where rates ofpopulation increase are much lower--well under halfthe average for the developing countries--the desireto reduce them is motivated more by environmentalthan by developmental considerations. The lower therate of population growth the more economic growthwill depend on increasing productivity. This depen-dence is magnified by the aging of the population andthe relative decline in the size of the labour force andalso by the well-established tendency of the labourforce to shift from material production sectors (agri-culture and industry) to the service sector. Becauseproductivity gains tend to be so meagre inthe servicesector, economic growth depends on correspondinglylarge gains in the production sectors. This in turngenerally means an increase in capital intensity in thosesectors, a higher degree of mechanization, a greaterintake of non-renewable resources and a greater outputof waste heat and hard to dispose of effluents andby-products. If economic growth rates are to bemaintained in the face of reduced population growthrates and increased environment-maintaining costs,certain changes appear to be called for in life stylesand production technology--later retirement and
There are very few cities that have been able toaccommodate this influx. Despite major efforts toextend urban infrastructure, unplanned squattersettlements have proliferated in the peri-urban areasand in many instances their visibility and concentrationhave caused serious political as well as social problems.Because the basic cause of the migration is a rural/urban imbalance, local success is unattainable: peri-urban improvement tends to stimulate the flow. Whilethe main elements of a long-run remedial policy arewidely recognized--agricultural development, landtenure reform, industrial dispersion and the decentral-ization of the principal social services--urgentshort-run needs often dictate decisions. Food pricesare kept low relative to those of manufactures, urbanhousing and transport are subsidized and social costsare prevented from entering market prices, andeducation, health and welfare services are strengthenedin the urban areas where the pressures are politicallygreatest.
Similar problems afflict the more advanced countriesbut there have been important differences both in thedimensions of the population movement and in theresponse. Since population has been increasing somuch more slowly and by 1960 was already nearly60 per cent urbanized, the relative impact of thetownward drift has been much smaller. Rural pressure
4
has also been much weaker: agricultural productivityhas been rising rapidly and farm support programmeshave kept incomes from getting too far out of line withthose in urban areas, while in many countries the ruralpopulation has been declining not only relatively buteven in absolute terms.
Supplementing this indigenous rural-urban move-ment, however, has been en inflow of foreign migrantsinto many of industrial towns of Europe and NorthAmerica. This has introduced cultural and linguisticcomplications into the urbanization process. In manycases the situation has been further complicated by themovement to the suburbs of a significant proportionof the older residents in the higher-income brackets.Thus, even where city populations have not materiallyincreased in numbers they have undergone an awkwardchange in composition, losing important elements intheir tax base and gaining large groups with a muchgreater dependence on public services• In manycountries local financial arrangements have provedinadequate and the central Government has had toshare the burden of accommodating the demographicchange.
Over°and above the rural-urban movement, therehas been a certain shift of population betweenurban areas--from declining to expanding industries.
Because this tends to leave infrastructure under-utilized and poorly maintained in some places andoverloaded and lagging behind needs in others,Governments have in varying degree adopted regionalpolicies designed to attract new enterprises to decayingtowns and to discourage them from establishment inplaces that are already booming. The need for such apolicy reflects not only a desire to use existing capitalassets effectively but also the fact that even thoughpopulation movements tend to be large and easy byhistorical standards, they often remain selective: theyoung and vigorous migrate, the old and less venture-some stay behind•
This is true in many developing countries, too:young males migrate from the land to work in minesor plantations or factories, even across nationalboundaries, leaving behind women and the older malesto run the farms. When the absences are seasona! orshort term, they tend to have an inhibiting effect onagricultural innovation, making rural development alittle more difficult than it might otherwise be. Thisis not to argue against such migration--which maybenefit not only the migrant but also his community,through his remittances--but it does suggest that theremight be gains from a development policy that aimedat a more stable working force both in industry andon the farms.

Chapter [
THE INTERACTION BETWEEN DEMOGRAPHICAND SOCIO-ECONOMIC VARIABLES
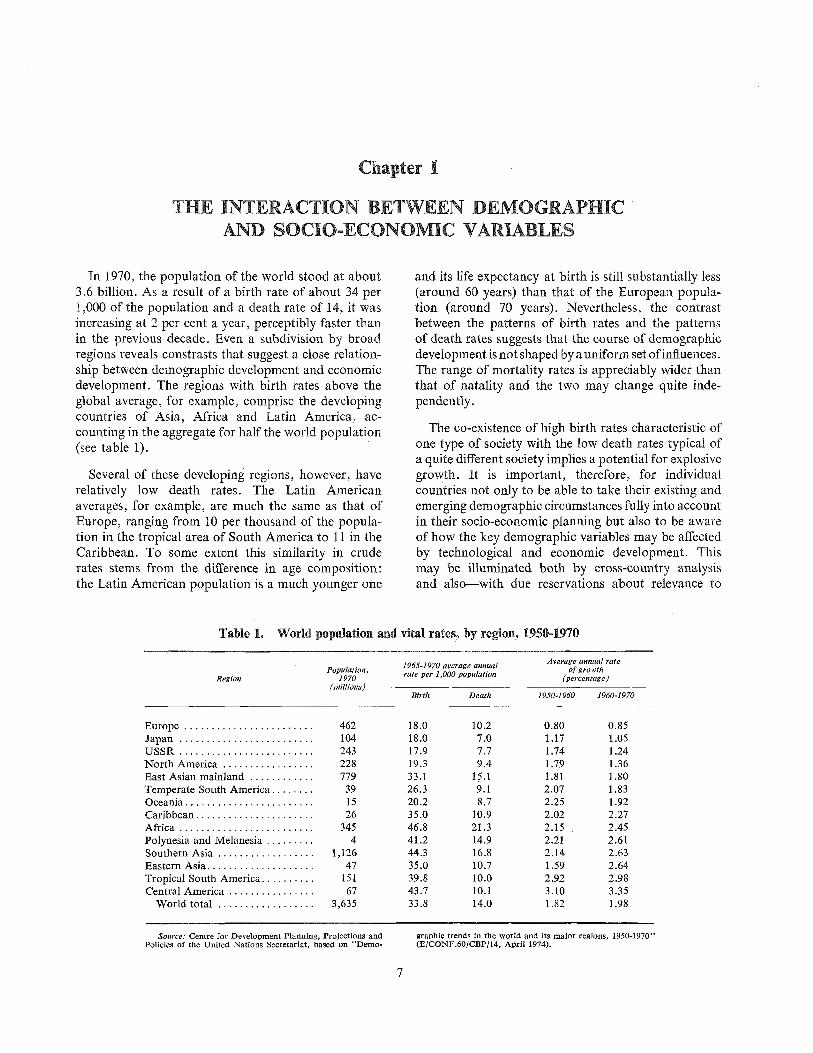
In 1970, the population of the world stood at about3.6 billion. As a result of a birth rate of about 34 per1,000 of the population and a death rate of 14, it wasincreasing at 2 per cent a year, perceptibly faster thanin the previous decade. Even a subdivision by broadregions reveals constrasts that suggest a close relation-ship between demographic development and economicdevelopment. The regions with birth rates above theglobal average, for example, comprise the developingcountries of Asia, Africa and Latin America, ac-counting in the aggregate for half the world population(see table 1).
and its life expectancy at birth is still substantially less(around 60 years) than that of the European popula-tion (around 70 years). Nevertheless, the contrastbetween the patterns of birth rates and the patternsof death rates suggests that the course of demographicdevelopment is not shaped by a uniform set of influences.The range of mortality rates is appreciably wider thanthat of natality and the two may change quite inde-pendently.
Several of these developing regions, however, haverelatively low death rates. The Latin Americanaverages, for example, are much the same as that ofEurope, ranging from 10 per thousand of the popula-tion in the tropical area of South America to 11 in theCaribbean. To some extent this similarity in cruderates stems from the difference in age composition:the Latin American population is a much younger one
The co-existence of high birth rates characteristic ofone type of society with the low death rates typical ofa quite different society implies a potential for explosivegrowth. It is important, therefore, for individualcountries not only to be able to take their existing andemerging demographic circumstances fully into accountin their socio-economic planning but also to be awareof how the key demographic variables may be affectedby technological and economic development. Thismay be illuminated both by cross-country analysisand also--with due reservations about relevance to
Table 1. World population and vital rates, by region, 1950-1970
Region
Average annual ratePopulation, 1965-1970 average annual of growth
1970 rate per 1,000 population (percentage)(millions)
Birth Death 1950-1960 1960-1970
Europe ........................ 462
Japan ......................... 104
USSR ......................... 243
North America ................. 228
East Asian mainland ............ 779
Temperate South America ........ 39
Oceania ........................ 15
Caribbean ...................... 26
Africa ......................... 345
Polynesia and Melanesia ......... 4
Southern Asia .................. 1,126
Eastern Asia .................... 47
Tropical South America .......... 151
Central America ................ 67
World total .................. 3,635
18.0 10.2 0.80 0.8518.0 7.0 1.17 1.0517.9 7.7 1.74 1.2419.3 9.4 1.79 1.3633.1 15.1 1.81 1.8026.3 9.1 2.07 1.8320.2 8.7 2.25 1.9235.0 10.9 2.02 2.2746.8 21.3 2.15 2.4541.2 14.9 2.21 2.6144.3 16.8 2.14 2.6335.0 10.7 1.59 2.6439.8 10.0 2.92 2.9843.7 10.1 3.10 3.3533.8 14.0 1.82 1.98
Source: Centre for Development Planning, Projections andPolicies of the United Nations Secretariat, based on "Demo-
graphic trends in the world and its major regions, 1950-1970"(E[CONF.60]CBP]14, April 1974).
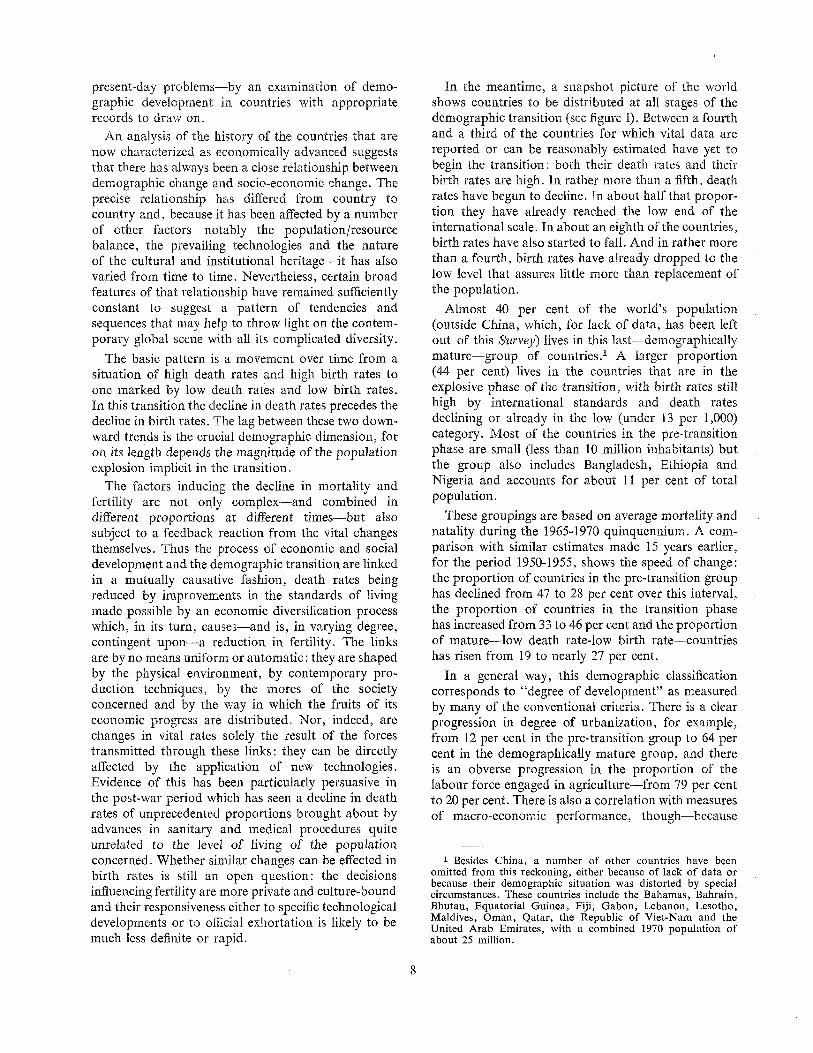
present-day problems--by an examination of demo-graphic development in countries with appropriaterecords to draw on.
An analysis of the history of the countries that arenow characterized as economically advanced suggeststhat there has always been a close relationship betweendemographic change and socio-economic change. Theprecise relationship has differed from country tocountry and, because it has been affected by a numberof other factors--notably the population/resourcebalance, the prevailing technologies and the natureof the cultural and institutional heritage--it has alsovaried from time to time. Nevertheless, certain broadfeatures of that relationship have remained sufficientlyconstant to suggest a pattern of tendencies andsequences that may help to throw light on the contem-porary global scene with all its complicated diversity.
The basic pattern is a movement over time from asituation of high death rates and high birth rates toone marked by low death rates and low birth rates.In this transition the decline in death rates precedes thedecline in birth rates. The lag between these two down-ward trends is the crucial demographic dimension, foron its length depends the magnitude of the populationexplosion implicit in the transition.
The factors inducing the decline in mortality andfertility are not only complex--and combined indifferent proportions at different times--but alsosubject to a feedback reaction from the vital changesthemselves. Thus the process of economic and socialdevelopment and the demographic transition are linkedin a mutually causative fashion, death rates beingreduced by improvements in the standards of livingmade possible by an economic diversification processwhich, in its turn, causea--and is, in varying degree,contingent upon--a reduction in fertility. The linksare by no means uniform or automatic: they are shapedby the physical environment, by contemporary pro-duction techniques, by the mores of the societyconcerned and by the way in which the fruits of itseconomic progress are distributed. Nor, indeed, arechanges in vital rates solely the result of the forcestransmitted through these links: they can be directlyaffected by the application of new technologies.Evidence of this has been particularly persuasive inthe post-war period which has seen a decline in deathrates of unprecedented proportions brought about byadvances in sanitary and medical procedures quiteunrelated to the level of living of the populationconcerned. Whether similar changes can be effected inbirth rates is still an open question: the decisionsinfluencing fertility are more private and culture-boundand their responsiveness either to specific technologicaldevelopments or to official exhortation is likely to bemuch less definite or rapid.
In the meantime, a snapshot picture of the worldshows countries to be distributed at all stages of thedemographic transition (see figure I). Between a fourthand a third of the countries for which vital data arereported or can be reasonably estimated have yet tobegin the transition: both their death rates and theirbirth rates are high. In rather more than a fifth, deathrates have begun to decline. In about half that propor-tion they have already reached the low end of theinternational scale. In about an eighth of the countries,birth rates have also started to fall. And in rather morethan a fourth, birth rates have already dropped to thelow level that assures little more than replacement ofthe population.
Almost 40 per cent of the world's population(outside China, which, for lack of data, has been leftout of this Survey) lives in this last--demographicallymature--group of countries.1 A larger proportion(44 per cent) lives in the countries that are in theexplosive phase of the transition, with birth rates stillhigh by international standards and death ratesdeclining or already in the low (under 13 per 1,000)category. Most of the countries in the pre-transitionphase are small (less than 10 million inhabitants) butthe group also includes Bangladesh, Ethiopia andNigeria and accounts for about 11 per cent of totalpopulation.
These groupings are based on average mortality andnatality during the 1965-1970 quinquennium. A com-parison with similar estimates made 15 years earlier,for the period 1950-1955, shows the speed of change:the proportion of countries in the pre-transition grouphas declined from 47 to 28 per cent over this interval,the proportion of countries in the transition phasehas increased from 33 to 46 per cent and the proportionof mature--low death rate-low birth rate--countrieshas risen from 19 to nearly 27 per cent.
In a general way, this demographic classificationcorresponds to "degree of development" as measuredby many of the conventional criteria. There is a clearprogression in degree of urbanization, for example,from 12 per cent in the pre-transition group to 64 percent in the demographically mature group, and thereis an obverse progression in the proportion of thelabour force engaged in agriculture from 79 per centto 20 per cent. There is also a correlation with measuresof macro-economic performance, though--because
1 Besides China, a number of other countries have beenomitted from this reckoning, either because of lack of data orbecause their demographic situation was distorted by specialcircumstances. These countries include the Bahamas, Bahrain,Bhutan, Equatorial Guinea, Fiji, Gabon, Lebanon, Lesotho,Maldives, Oman, Qatar, the Republic of Viet-Nam and theUnited Arab Emirates, with a combined 1970 population ofabout 25 million.
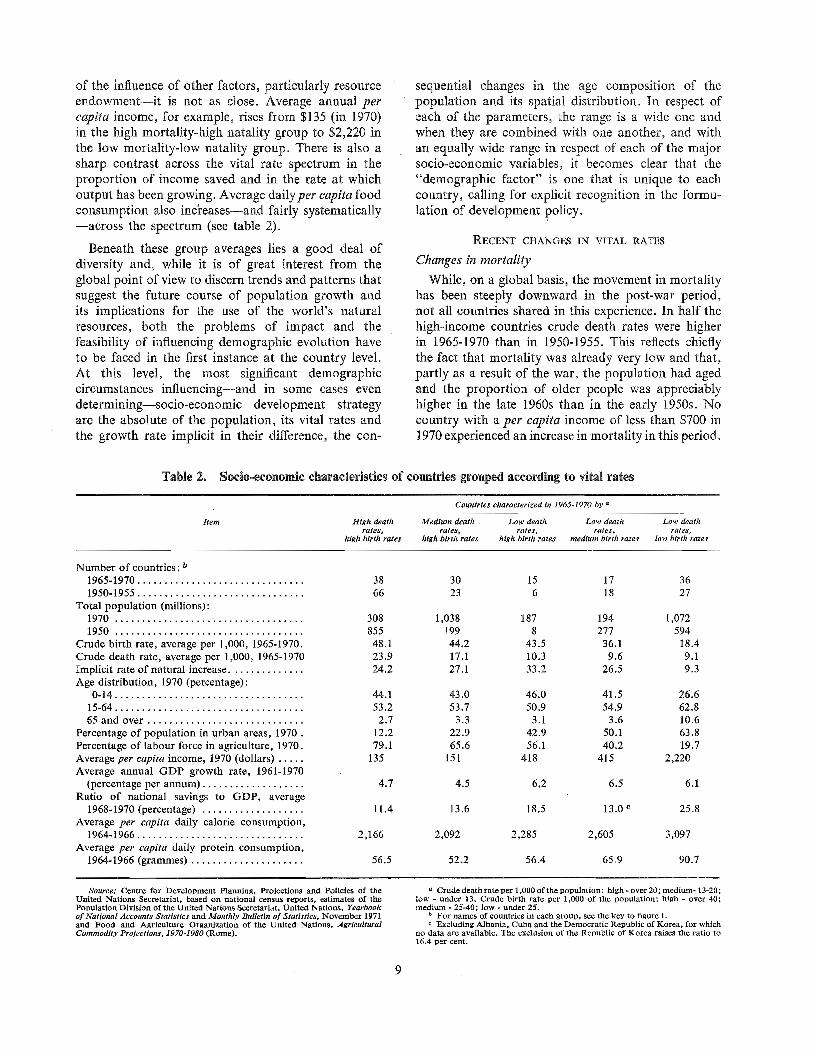
of the influence of other factors, particularly resourceendowment--it is not as close. Average annual percapita income, for example, rises from $135 (in 1970)in the high mortality-high natality group to $2,220 inthe low mortality-!ow natality group. There is also asharp contrast across the vital rate spectrum in theproportion of income saved and in the rate at whichoutput has been growing. Average dailyper capita foodconsumption also inckeases--and fairly systematically--across the spectrum (see table 2).
sequential changes in the age composition of thepopulation and its spatial distribution. In respect ofeach of the parameters, the range is a wide one andwhen they are combined with one another, and withan equally wide range in respect of each of the majorsocio-economic variables, it becomes clear that the"demographic factor" is one that is unique to eachcountry, calling for explicit recognition in the formu-lation of development policy.
Beneath these group averages lies a good deal ofdiversity and, while it is of great interest from theglobal point of view to discern trends and patterns thatsuggest the future course of population growth andits implications for the use of the world's naturalresources, both the problems of impact and thefeasibility of influencing demographic evolution haveto be faced in the first instance at the country level.At this level, the most significant demographiccircumstances influencing--and in some cases evendetermining--socio-economic development strategyare the absolute of the population, its vital rates andthe growth rate implicit in their difference, the con-
RECENT CHANGES IN VITAL RATES
Changes in mortality
While, on a global basis, the movement in mortalityhas been steeply downward in the post-war period,not all countries shared in this experience. In half thehigh-income countries crude death rates were higherin 1965-1970 than in 1950-1955. This reflects chieflythe fact that mortality was already very low and that,partly as a result of the war, the population had agedand the proportion of older people was appreciablyhigher in the late 1960s than in the early 1950s. Nocountry with a per capita income of less than $700 in1970 experienced an increase in mortality in this period.
Table 2. Soclo-economic characteristics of countries grouped according to vital rates
Item
Countries characterized in 1965-1970 by a
High death Medium death Low death Low death Low deathrates, rates, rates, rates, rates,
high birth rates high birth rates high birth rates medium birth rates low birth rates
Number of countries : b1965-1970 ...............................
1950-1955 ...............................
Total population (millions):1970 ...................................
1950 ...................................
Crude birth rate, average per 1,000, 1965-1970.Crude death rate, average per 1,000, 1965-1970Implicit rate of natural increase ..............
Age distribution, 1970 (percentage):0-14 ...................................
15 - 64 ...................................
65 and over .............................
Percentage of population in urban areas, 1970.Percentage of labour force in agriculture, 1970.Average per capita income, 1970 (dollars) .....Average annual GDP growth rate, 1961-1970
(percentage per annum) ...................
Ratio of national savings to GDP, average1968-1970 (percentage) ...................
Average per capita daily calorie consumption,1964-1966 ...............................
Average per capita daily protein consumption,1964-1966 (grammes) .....................
38 30 15 17 3666 23 6 18 27
308 1,038 187 194 1,072855 199 8 277 59448.1 44.2 43.5 36.1 18.423.9 17.1 10.3 9.6 9.124.2 27.1 33.2 26.5 9.3
44.1 43.0 46.0 41.5 26.653.2 53.7 50.9 54.9 62.8
2.7 3.3 3.1 3.6 10.612.2 22.9 42.9 50.1 63.879.1 65.6 56.1 40.2 19.7
135 151 418 415 2,220
4.7 4.5 6,2 6.5 6.1
11.4 13.6 18.5 13.0 e 25.8
2,166 2,092 2,285 2,605 3,097
56.5 52.2 56.4 65.9 90.7
Source: Centre for Development Planning, Projections and Policies of theUnited Nations Secretariat, based on national census reports, estimates of thePopulation Division of the United Nations Secretariat, United Nations, Yearbookof National Accounts Statistics and Monthly Bulletln of Statistics, November 1971and Food and Agriculture Organization of the United Nations, AgriculturalCommodity Projections, 1970-1980 (Rome).
a Crude death rate per 1,000 of the population: high - over 20; medium- 13-20;low - under 13. Crude birth rate per 1,000 of the population: high - over 40;medium - 25-40; low - under 25.
b For names of countries in each group, see the key to figure Le Excluding Albania, Cuba and the Democratic Republic of Korea, for which
no data are available. The exclusion of the Republic of Korea raises the ratio to16.4 per cent.
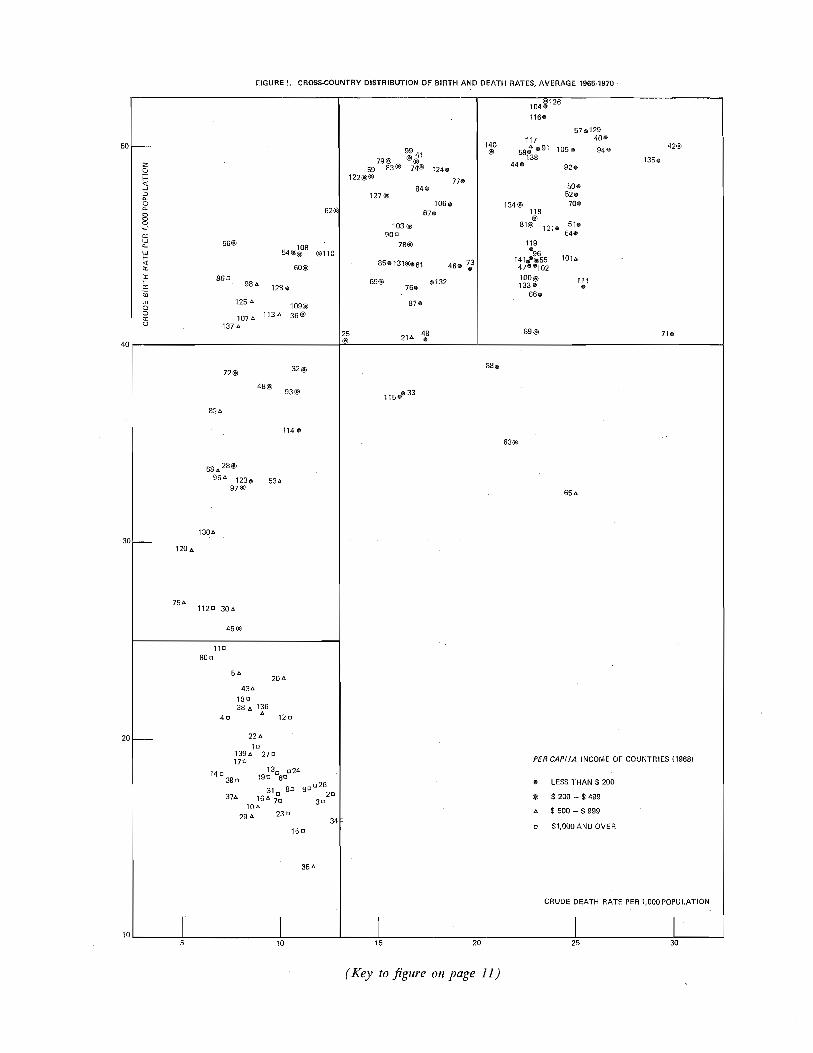
FIGURE I. CROSS-COUNTRY DISTRIBUTION OF BIRTH AND DEATH RATES, AVERAGE 1965-1970
T-3
,,..-
e..
E
4O
2O
7541!2o 30,ÿ-
I5
127@
62ÿ
56@54®l°8 @110
60®86 o
98& 128,
125 109 ®107ÿ' 1134 36®
137 ÿ.
72® 32®
48®93@
824
114e
68,.*,28@954 123, 534
97 ®
45®
lla80 m
5z,20a,
43ÿ,18o38 zÿ 136
4n 12n
22ÿla
139ÿ. 27o17o
130 o2414"39o 19o 6°
:31o 8o 9Da2616a" 7o 3a2a37z,
104294 23a
34150
35ÿ,
I I I10 15 20
79@59 83 ®
122@@
41
@ 124e
77"84"
106,67e
103®900
78@
85"131@e61
69®
25 49® 21ÿ' ®
104ÿ126
116"
57,129117 40ÿ'
140® 58ÿ91 105, 94"
44" 92,
50,52e
134 @ 70,118@
81® 121® 51e64,
119
46-
e13276,
87e
"96141,®®55 101tÿ47ee102
100@ 111133e
66®
89 ®
88,
115e,33
63®
65ÿ
42®
135,
71,
PERCAPITA INCOME OF COUNTRIES (1968)
e LESS THAN $ 200
® $ 200 - $ 499
t, $ 500 - $ 999
a $1,OOO AND OVER
CRUDE DEATH RATE PER 1,000POPULATION
I I25 30
(Key to figure on page ll)
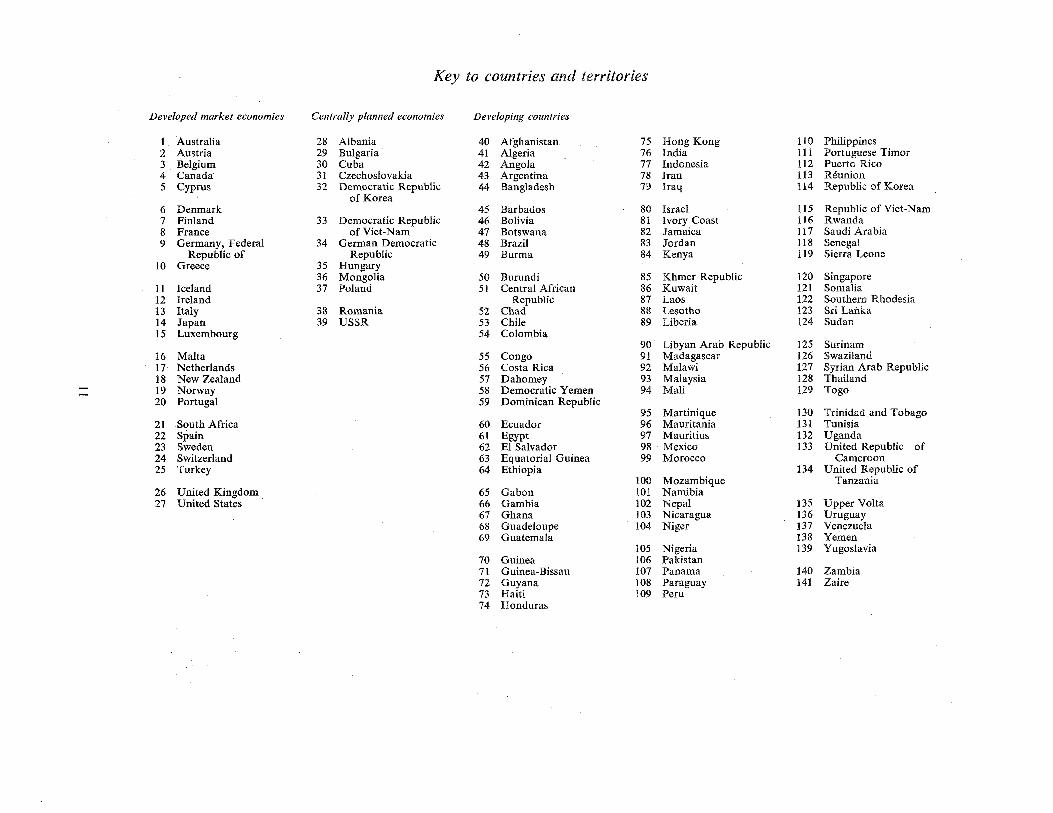
Key to countries and territories
Developed market economies Centrally planned economies Developing countries
11 Iceland12 Ireland13 Italy14 Japan15 Luxembourg
16 Malta17 Netherlands18 New Zealand19 Norway20 Portugal
21 South Africa22 Spain23 Sweden24 Switzerland25 Turkey
26 United Kingdom27 United States
6 Denmark7 Finland8 France9 Germany, Federal
Republic of10 Greece
28 Albania29 Bulgaria30 Cuba31 Czechoslovakia32 Democratic Republic
of Korea
33 Democratic Republicof Viet-Nam
34 German DemocraticRepublic
35 Hungary36 Mongolia37 Poland
38 Romania39 USSR
1 Australia2 Austria3 Belgium4 Canada5 Cyprus
40 Afghanistan41 Algeria42 Angola43 Argentina44 Bangladesh
45 Barbados46 Bolivia47 Botswana48 Brazil49 Burma
50 Burundi51 Central African
Republic52 Chad53 Chile54 Colombia
55 Congo56 Costa Rica57 Dahomey58 Democratic Yemen59 Dominican Republic
60 Ecuador61 Egypt62 E1 Salvador63 Equatorial Guinea64 Ethiopia
65 Gabon66 Gambia67 Ghana68 Guadeloupe69 Guatemala
70 Guinea71 Guinea-Bissau72 Guyana73 Haiti74 Honduras
75 Hong Kong76 India77 Indonesia78 Iran79 Iraq
80 Israel81 Ivory Coast82 Jamaica83 Jordan84 Kenya
85 Khmer Republic86 Kuwait87 Laos88 Lesotho89 Liberia
90 Libyan Arab Republic91 Madagascar92 Malawi93 Malaysia94 Mall
95 Martinique96 Mauritania97 Mauritius98 Mexico99 Morocco
100 Mozambique101 Namibia102 Nepal103 Nicaragua104 Niger
105 Nigeriat06 Pakistan107 Panama108 Paraguay109 Peru
110 Philippines111 Portuguese Timor112 Puerto Rico113 Rÿunion114 Republic of Korea
115 Republic of Viet-Nam116 Rwanda117 Saudi Arabia118 Senegal119 Sierra Leone
120 Singapore121 Somalia122 Southern Rhodesia123 Sri Lanka124 Sudan
125 Surinam126 Swaziland127 Syrian Arab Republic128 Thailand129 Togo
130 Trinidadand Tobago131 Tunisia132 Uganda133 United Republic of
Cameroon134 United Republic of
Tanzania
135 Upper Volta136 Uruguay137 Venezuela138 Yemen139 Yugoslavia
140 Zambia141 Zaire
Small reductions in mortality--up to 15 per cent--were concentrated among the higher-income countries.Three fourths of the countries in the lowest-incomebracket--less than $200per capita in 1970--experiencedmortality reductions of 15-30 per cent. Countries withsomewhat higher per capita income--between $200and $1,000--were able to achieve an even greaterreduction: three fourths of the countries in which deathrates declined by over 30 per cent between the early1950s and the late 1960s were in the middle incomegroup (see annex table A.1).
It is clear that the possibility of lowering death ratesis not limited by a country's income status. Some ofthe techniques for reducing mortality--chemicals forcombating disease vectors and pharmaceuticals for therelief of specific illnesses, for example--while theymay have been developed in the more advancedcountries, are available--and, indeed, have beendep!oyed--in low-income countries. As incomes rise,however, it becomes possible to extend the range oflife-preserving measures--by improving nutrition, forexample, and increasing the availability of potablewater--permitting further reductions in mortality.As more than a fourth of all countries still have highmortality--a crude death rate of over 20 per 1,000of the population--plenty of scope remains for suchfurther reductions, even though, as the rate falls, thepace of improvement is bound to decelerate.
The importance of income to efforts to lowermortality is borne out by the relationship between therates of change in these two variables. Of the countriesthat achieved art annual rate of increase in total outputof 6 per cent or more in the period 1955-1970, 6 outof 10 reduced their crude death rates by more than25 per cent and 9 out of 10 reduced their death ratesby more than 15 per cent. Among the slower-growingcountries--under 5 per cent a year--less than a thirdrecorded a decline in death rates of more than 25 percent and only two thirds a decline of more than 15 percent (see annex table A.2).
countries enjoyed a marked reduction in mortality--over 15 per cent of the rate recorded in the early1950s--despite the fact that their production wasincreasing more slowly than their population. Most ofthese were low-income countries in Africa and Asiaand the lowering of their death rates again points tothe importance of exogenous factors such as importedpesticides and antibiotics.
Among the developing countries, there was a slighttendency for the reduction in death rates to be asso-ciated with an increase in urbanization. But some ofthe most rapid rates of urbanization--increases duringthe 1960s of over 35 per cent in the proportion of thepopulation living in urban areas ÿ--occurred in coun-tries in which death rates registered a decline ofrelatively modest proportions (between 15 and 25 percent). A more moderate rate of urbanization seemsto have been more conducive to greater reductions inmortality (see annex table A.3).
Where the townward movement has been so rapidthat peri-urban settlements have grown without thebenefit of appropriate infrastructure, living conditionshave usually deteriorated--in some cases to the pointat which the downward trend in mortality has beenreversed. With population density rising and standardsof sanitation falling, the scene has been set for anincrease in both deficiency and fly-borne diseases anda more rapid spread of communicable diseases. Theresult has often been a sharp rise in local infantmortality.
Changes in natality
A similar difference between a moderate and anover-rapid increase in urbanization can be discernedin respect of fertility. Up to an increase of 25 per centin the degree of urbanization in the course of the 1960s,there was a rising proportion of countries in whichbirth rates declined by more than 5 per cent between
Of the countries that achieved the greatest reductionin mortality between the early 1950s and the late1960s--over 30 per cent of the earlier death rate--almost half were in the high economic growth category(with gains in production of over 6 per cent a year)and two thirds expanded their output by more than5 per cent a year, while only 6 per cent were in thelowest growth category (under 3 per cent a year). Whilethe process of economic growth clearly helped toprovide resources that could be used to preventpremature death, the prolongation of working lifeimplicit in the declining death rate must be counted asone of the factors making for a better productionperformance. It is worth noting, however, that some
2 Here and elsewhere in this Survey, national definitions of"urban area" have been accepted. These differ from country tocountry but tend to conform to one or more of the followingconcepts:1. Administrative or local government area: areas correspond-ing to one of the administrative divisions of the territory, orareas identified with places possessing some form of localgovernment;2. Population size: areas identified with places (variouslydesignated as cities, towns, clusters, agglomerations, villages,population centres, localities) having either a specified minimumnumber of inhabitants or a specified minimum number of inhabi-tants per unit of area;3. Urban characteristics: areas identified with places possessingcertain urban characteristics such as established street patternsor one or more of such public services as sewerage, piped watersupply, electric lighting or a church or hospital;4. Predominant economic activity: areas identified with placeswhere a specified minimum proportion of the economicallyactive population is engaged in non-agricultural activities.
12
!950-1955 and 1960-!965. At higher rates of urbaniza-tion the decline in birth rates was smaller: among thedeveloping countries in which the degree of urbaniza-tion rose by between 25 and 45 per cent in the 1960sonly a fifth had a birth rate reduction of over 3 percent. And among those in which the degree of urban-ization had risen by more than 45 per cent there wasnone in which birth rates had declined by more than5 per cent (see annex table A.4).
Historically, urbanization has been characterized bylater marriage and smaller families and households.But in the unstructured peri-urban communities thattend to be formed when the townward movementexceeds the absorptive capacity of established authorityand facilities, propinquity tends to result in more, andmore casual, liaisons and hence larger and looserhouseholds.
had attended school for 7-I2 years were in the lowerbirth rate categories (less than 30 per 1,000). A cor-respondingly high proportion of the countries in whichless than 10 per cent of the over-14 population had7-12 years of schooling were in the high (over 40 per1,000) birth rate category (see annex table A.7).Clearly the higher the birth rate the greater the burdenof providing an adequate formal education to the childpopulation. The problem is especially severe in low-income countries where public revenues are usuallyattenuated and subject to many other claims, someof which are also magnified by the high birth rate.It also involves something of a vicious circle since highfertility is itself a symptom of lack of education.
THE GROWTH OF POPULATION
Except in parts of Western Europe, where birthrates were somewhat higher in 1965-1970 than the lowfigures registered in 1950-1955, there was a positiverelationship between per capita income and the reduc-tion in natality over this period. Two thirds of thecountries experiencing a decline in crude birth ratein excess of 10 per cent had per capita incomes of over$700 in 1970 and only 1 in 7 had an income of less than$400. Correspondingly, those in which there was amore modest reduction in natality were concentratedvery largely in the low-income groups. A third of allcountries withper capita incomes of under $400 in 1970had virtually the same birth rate in 1965-1970 as in1950-1955 or even higher. A majority of the developingcountries of Africa fall into this category (see annextable A.5).
To what extent changes in natality affected thecourse of national production and income is impossibleto determine. It is significant, however, that five outof every six low-growth countries--in which the grossdomestic product increased at less than 3 per cent ayear between 1955 and 1970--were among those withvery little change in crude birth rate. The countries inwhich birth rates declined by more than 5 per centbetween the early 1950s and the late 1960s wereconcentrated in the higher economic growth categories:two thirds of those with an over-10 per cent reductionin birth rate achieved gross domestic product increasesof over 5 per cent a year (see annex table A.6).
One of the mechanisms through which changes infertility are transmitted through the economic develop-ment process is education. The limited evidenceavailable in this area from the most recent reportedcensus suggests that there is a negative relationshipbetween birth rate and the educational status of thecountry concerned. Most of the countries in whichmore than a fifth of the population 15 years and over
In most countries the difference between the vitalrates determines the rate at which the populationgrows; in very few cases do the gains or losses frommigration play a major role? Since the demographictransition that seems to occur in the course of socio-economic development begins with a decline in thedeath rate, to be followed--but only after a significantdelay--by a decline in the birth rate, the early stagesare marked by an appreciable rise in the rate of naturalincrease. As indicated in table 1 above, the peak rateof population growth is reached in the third phaseof the transition: by this time death rates have droppedto a low level but changes in fertility have made verylittle progress. Even in the fourth phase, when birthrates are clearly moving downwards, their differencefrom the low rates that mortality has already attainedmay be great enough to yield a rate of natura! increasehigher than that typical of a high death rate-high birthrate pre-transition community. It is only in the finalphase that the rate of natural increase falls sharply tothe levels that characterize economically advancedcountries.
Population growth and income
Some aspects of this transformation over time canbe captured in a snapshot cross-country picture.4This shows that in 1970 the lowest-income group ofcountries tended to have rates of population increase
3 Some of the most important of these cases are discussed inchapter II below; see especially table 19.
4 This and all the other cross-country pictures presented inthis chapter are not intended to imply any direct causal relation-ship between the demographic variable and the socio-economicvariable being depicted. The relationships that do exist betweensuch variables are generally indirect, complex and reciprocal andsome of them are discussed in later chapters in the context ofparticular countries and situations. The matrix format fordisplaying some of the data in this chapter is designed to illus-trate graphically the spectrum of bivariate relationships and theposition of individual countries in that spectrum.
13
between 2 and 3 per cent a year: over 80 per cent ofthe countries with a per capita income of less than$200 were in this population growth rate category°Countries in the intermediate-income range--$200-$700 a year per capita--were divided more or lessequally between the 2-3 per cent population growthcategory (reflecting the early stages of the decline indeath rates) and the highest population growth category(in which low mortality and high fertility yielded anincrease of over 3 per cent a year). Of the countries withhigher per capita incomes (over $700 a year) threefourths has rates of population growth of less than2 per cent a year and two thirds had rates of less than1.5 per cent (see annex table A.8).
As for the remaining countries, special factorsaccounted for their being outside their income-popula-tion growth category. Many of the countries that hadlower rates of population growth than might have beenexpected from their income status were among thoseregistering emigration losses--Barbados, Cuba, Le-sotho, Portugal and Yugoslavia, for example. At theother end of the spectrum some owed their highincomes to a particularly active export sector less thanfully integrated with the domestic economy (as in thecase of the Libyan Arab Republic, Panama, Surinam,Trinidad and Tobago and Venezuela, for example) orto exceptional immigration gains (as in the case ofAustralia, Hong Kong, Israel, Kuwait and Singapore).
Changes inper capita income were much more sensi-tive to differences in population growth rates in the1960s. There was a systematic increase in the propor-tion of countries with an average annual gain of lessthan 2 per cent in output per person--from zero amongthe countries in which population was expanding atless than 1 per cent a year and a sixth of those in the1-2 per cent growth group to 37 per cent among thosewith a population growth rate of over 3 per cent a year.The proportion achieving an increase of over 3 per centa year in per capita output fell away correspondingly--from 94 per cent in the countries with the lowestpopulation growth rate to 26 per cent in those withthe highest. The countries registering large gains inper capita income notwithstanding rapid populationgrowth were chiefly major mineral exporters--Iran,the Libyan Arab Republic, Saudi Arabia and Surinam(see annex table A.10).
Population growth and savings
Population growth and economic growth
Relatively few of the countries with low rates ofpopulation growth have low savings ratios: in theperiod 1968-1970, for example, about half the countriesin which population had been increasing at less than1.5 per cent a year saved more than a fourth of theirgross product while the proportion saving less than15 per cent was not much more than an eighth.Correspondingly, the low savers were largely thosewith high population growth: less than an eighth ofthe countries in which population was increasing atover 2 per cent a year had savings ratios of more than25 per cent (see annex table A.11).
While there is thus a discernible pattern in therelationship between income levels and vital charac-teristics, demographic factors pale into insignificanceamong the determinants of economic growth. On theother hand, differences in the rate of increase in pro-duction and income do tend to induce movements ofpopulation, though these occur chiefly within countriesrather than between countries. And with a few notableexceptions--in which differences in income levels playa more important role than differences in growthrates--international population movements are smallin relation to natural increase. Though the rate ofincrease in population influences savings, especiallyin low-income countries, this effect tends to have amuch smaller impact on the growth of output than dochanges is technology or discoveries of naturalresources. And even where population growth doesseriously affect national savings, the impact on pro-duction may be more then offset by internationalmovements of capital. It is not surprising, therefore,that a matrix of population and production growthrates for the 1960s reveals no systematic relationshippattern (see annex table A.9).
The countries not conforming to this negativerelationship between population growth and savingswere in many cases subject to special influences. Amongthe low savers, for example, population was held downby net emigration from such countries as Barbados,Lesotho and Portugal. And among the high populationgrowth countries, savings were boosted by the activitiesof mineral-exporting companies in the case of Kuwait,the Libyan Arab Republic, Saudi Arabia, Surinam,Venezuela and Zambia.5
Population growth and urbanization
There is an inverse relationship between the rateof increase in population and the degree of urbaniza-tion. Among the low-growth countries (with populationrising by less than 1.5 per cent a year) hardly any hadan urban component of less than 30 per cent in 1970and only a fifth had as much as 40 per cent of their
5 The interaction between demographic factors and thesavings function in the process of economic development isdiscussed in chapter IV below.
14
population living in urban areas. Conversely, only asixth of the countries in which population was increasingat between 2 and 3 per cent a year had an urbanizationratio of over 40 per cent (see annex table A.12).
This pattern did not carry over into the group ofcountries with the highest--more than 3 per cent ayear--rate of population increase, however. Half thishigh-growth group had more than 40 per cent of itspopulation living in urban areas. Though, in general,fertility tends to be lower in urban communities thanin rural, this group combines the highest rate ofpopulation increase with the highest degree of urbaniza-tion. As the countries concerned were either Arab(Algeria, Iraq, Jordan, Kuwait, the Syrian ArabRepublic and Tunisia) or Latin American (Colombia,E1 Salvador, Mexico, Panama, Peru and Venezuela),it is clear that the exception was more a reflection ofcultural factors than of the process of economicdevelopment.
among the countries in which population was in-creasing at between 2.5 and 3 per cent a year, abouta half had three boys in secondary school for everygirl.
Population growth and nutrition
Population growth and education
Not unrelated to the extent of urbanization is theschool enrolment ratio. In only an eighth of thecountries in which population was growing at less than1.5 per cent a year in the late 1960s was less than60 per cent of the 5-19 age group enrolled in formaleducation. Conversely, among the countries with rapidpopulation growth--over 2.5 per cent a year--only aneighth had an enrolment ratio of more than 60 per cent(see annex table A.13).
The highest concentration of low enrolment ratios,however, was in the intermediate-growth group inwhich population was increasing at 2.2-3.0 per centa year: in almost half the countries in this group enrol-ment was less than a third of the relevant age bracket.In the Arab-Latin American group of high populationgrowth countries, on the other hand, between 30 and60 per cent of all 5-19 year old children were enrolledin school.
Just as the difficulty of providing adequate educationfacilities is magnified by a high rate of natural increase,so is the problem of feeding the population. Thus inthe late 1960s, among the slow-growth countries onlya handful had a daily average calorie intake of lessthan 2,600 per person and two thirds of them had anaverage of over 2,900 calories available. Conversely,among the countries in which population was increasingmore rapidly (at over 2 per cent a year), very few(about 9 per cent) had more than 2,600 caloriesavailable per capita. In this group, indeed, almosttwo thirds of the countries had an average daily intakeof less than 2,300 per person (see annex table A.15).
Protein availability presents a very similar picture:around 80 per cent of the slow-growing countries hadan average daily intake in excess of 80 grammes perperson while in the case of the faster-growing countries(with population increasing at more than 2 per centa year) about 80 per cent had a daily intake averagingless than 70 grammes per person (see annex table A. 16).
For many countries the growth of population addssignificantly to the food import bill. An the end ofthe 1960s, half the countries were spending more then$15 a year per person on basic food imports, and afourth were spending more than $40. Most of thesecountries were in the high-income category but theyalso included a number of the smaller islands amongthe developing countries, as well as such countries asChile and, among those with very high populationgrowth, Costa Rica, Jordan, Lebanon and Panama(see annex table A.17).
Cultural patterns again emerge in the sex composi-tion of this school enrolment. In the high-growth groupthere was a sharp contrast between the representationof girls in the Latin American countries, on the onehand (over 85 per cent of the number of enrolled boysin most cases), and in the Arab countries, on the other(with less than 70 per cent of the number of boys).In none of the countries in which population wasincreasing at less than 1.5 per cent a year was femaleenrolment less than half of male enrolment. Amongthe higher-growth countries, however, low enrolmentof girls was quite common: in over a fourth it wasbelow 50 per cent of the male level and in almost halfbelow 70 per cent (see annex table A.14). Even lowerratios were recorded in respect of secondary education:
Population growth and indicators of economic develop-ment
Though the pictures drawn in this section have allbeen static, they suggest that the demographic transi-tion that was associated with the economic develop-ment of the countries that are now classified as moreadvanced is in various stages of fulfilment among thedeveloping countries. Perhaps the most importantaspect of the transition--arising from the fact that thedecline in mortality precedes the decline in fertility byan inderterminate, but not inconsiderable, period--isthe implicit increase in the rate of population growthas economic and demographic development proceeds.Thus the general inverse relationship between the rateof population increase and the various criteria of thestate of development is not smooth and continuous:
15
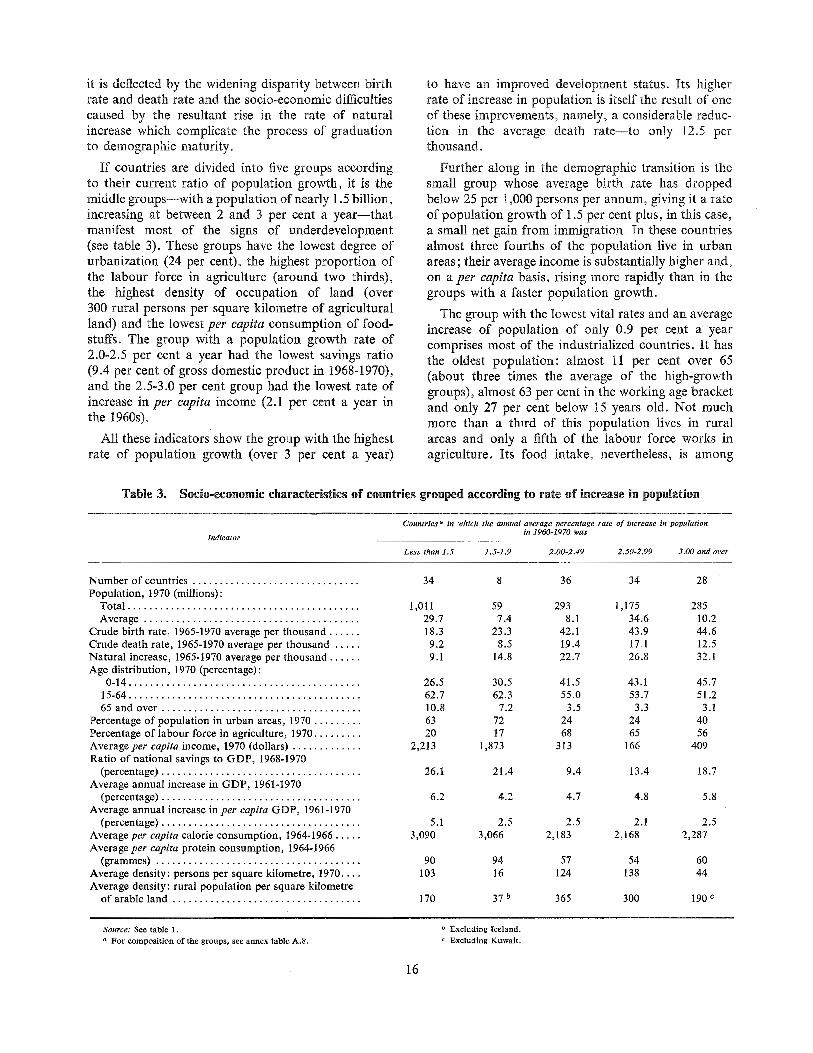
it is deflected by the widening disparity between birthrate and death rate and the socio-economic difficultiescaused by the resultant rise in the rate of naturalincrease which complicate the process of graduationto demographic maturity°
If countries are divided into five groups accordingto their current ratio of population growth, it is themiddle groups--with a population of nearly 1.5 billion,increasing at between 2 and 3 per cent a year--thatmanifest most of the signs of underdevelopment(see table 3). These groups have the lowest degree ofurbanization (24 per cent), the highest proportion ofthe labour force in agriculture (around two thirds),the highest density of occupation of land (over300 rural persons per square kilometre of agriculturalland) and the lowest per capita consumption of food-stuffs. The group with a population growth rate of2.0-2.5 per cent a year had the lowest savings ratio(9.4 per cent of gross domestic product in 1968-1970),and the 2.5-3.0 per cent group had the lowest rate ofincrease in per capita income (2.1 per cent a year inthe 1960s).
All these indicators show the group with the highestrate of population growth (over 3 per cent a year)
to have an improved development status. Its higherrate of increase in population is itself the result of oneof these improvements, namely, a considerable reduc-tion in the average death rate--to only 12.5 perthousand.
Further along in the demographic transition is thesmall group whose average birth rate has droppedbelow 25 per 1,000 persons per annum, giving it a rateof population growth of 1.5 per cent plus, in this case,a small net gain from immigration. In these countriesalmost three fourths of the population live in urbanareas; their average income is substantially higher and,on a per capita basis, rising more rapidly than in thegroups with a faster population growth.
The group with the lowest vital rates and an averageincrease of population of only 0.9 per cent a yearcomprises most of the industrialized countries. It hasthe oldest population: almost 11 per cent over 65(about three times the average of the high-growthgroups), almost 63 per cent in the working age bracketand only 27 per cent below 15 years old. Not muchmore than a third of this population lives in ruralareas and only a fifth of the labour force works inagriculture, Its food intake, nevertheless, is among
Table 3. Soeio-econonfic characteristics of countries grouped according to rate of increase in population
btdicator
Countries a in which the annual average percentage rate of increase in populationin 1960-1970 was
Less than 1.5 1.5-1.9 2,00-2.49 2.50-2.99 3.00 and over
Number of countries ............................... 34 8
Population, 1970 (millions):Total ........................................... 1,011 59
Average ........................................ 29.7 7.4
Crude birth rate, 1965-1970 average per thousand ...... 18.3 23.3Crude death rate, 1965-1970 average per thousand ..... 9.2 8.5
Natural increase, 1965-1970 average per thousand ...... 9.1 14.8
Age distribution, 1970 (percentage) :0-14 ........................................... 26.5 30.5
15-64 ........................................... 62.7 62.3
65 and over ..................................... 10.8 7.2
Percentage of population in urban areas, 1970 ......... 63 72
Percentage of labour force in agriculture, 1970 ......... 20 17
Average per capita income, 1970 (dollars) ............. 2,213 1,873
Ratio of national savings to GDP, 1968-1970(percentage) ..................................... 26.1 21.4
Average annual increase in GDP, 1961-1970(percentage) ..................................... 6.2 4.2
Average annual increase in per capita GDP, 1961-1970(percentage) ..................................... 5.1 2.5
Average per capita calorie consumption, 1964-1966 ..... 3,090 3,066Average per capita protein consumption, 1964-1966
(grammes) ...................................... 90 94
Average density: persons per square kilometre, 1970 .... 103 16Average density: rural population per square kilometre
of arable land ................................... 170 37 b
36 34 28
293 1,175 2858.1 34.6 10.2
42.1 43.9 44.619.4 17.1 12.522.7 26.8 32.1
41.5 43.1 45.755.0 53.7 51.23.5 3.3 3.1
24 24 4068 65 56
313 166 409
9.4 13.4 18.7
4.7 4.8 5.8
2.5
2,1832.1 2.5
2,168 2,287
57 54 60124 138 44
365 300 190 e
Soarce: See table 1,a For composition of the groups, see annex table A,8,
b Excluding Iceland.c Excluding Kuwait.
16
the highest, averaging nearly 3,100 calories and90 grammes of protein per person per day. Thisreflects its high per capita income (over $2,200 a year)which in turn reflects its high savings ratio (26 per cent).The group has also had the highest rate of growth ofproduction, especially when this is measured on aper capita basis--twice as high as any other group inthe 1960s.
countries (Kuwait and the Libyan Arab Republic,with their special circumstances) was more than$1,000 a year generated by a population in which morethan 44 per cent was outside the 15-64 age bracket(see annex table A. 18).
THE AGE STRUCTURE OF THE POPULATION
One of the ways in which a country's vital charac-teristics shapes its economic development is throughthe changes that are brought about in the age composi-tion of the population. The productive performanceof a country depends very largely on its "working age"population; its expenditure and consumption patternare strongly influenced by the size of the groups thatare either too young or too old to work.
The relationship between pet" capita income and theage composition of the population seems to bevirtually independent of the total size of the population.Over the whole size spectrum--from under 1 millionto over 100 million--each income group is associatedwith a more or less similar proportion of the totalpopulation in the Working age bracket, ranging fromaround 55 per cent in the lower-income countries upto 63 per cent in those with 1970 per capita incomesof over $1,000.
The age structure of a given population reflects thecourse of vital events over a whole generation. Changesin birth rates, however, soon show up in changes inthe proportion of children in the population. Theimmediate effect of a change in the death rate dependson which part of the age range is involved: a declinein infant mortality will raise the child proportion,improvements in geriatric care may prolong life andadd to the proportion of elderly in the population.Thus age composition at any given point of time is theproduct of the more distant as well as the immediatepast.
In 1970, the working age population (15-64 year old)constituted 60 per cent or more of the population in afourth of all countries. These were for the most partthe demographically mature countries belonging to thehigh-income group: all but a seventh had per capitaincomes of over $700 a year and two thirds had over$1,000 a year. There would seem to be a clear con-nexion between the proportion of the population ofworking age and per capita production: in only two
Age structure and income
The demographica!ly mature countries that havelong had low vital rates tend to be characterized byrelatively small child populations, long lives and largegroups of older people. The countries that have notyet embarked on the demographic transition tend tohave much shorter life expectancies and smallerproportions of older people. Because one of the earlyfeatures of the transition is a decline in infant deathrates, the countries concerned tend to have relativelylarge child populations. Later in the transition, lifespans tend to lengthen and the numbers of elderlyrise and ultimately their proportion as well.
Three fourths of the countries in which the workingpopulation was less than 56 per cent of the totalproduced less than $400 per person in 1970. Again,however, there is a contrast between the pre-transitioncountries that are heavily concentrated in the groupwith a working age proportion of 53-56 per cent andper capita income of tess than $200 a year, and thosethat have began the demographic transition andconsequently have a smaller proportion in the 15-64 agebracket and, in many cases, a higherper capita income.
Focusing on the more sensitive under-14 year oldgroup serves to dramatize the relationship betweenincome and age structure. In most of the high-incomecountries, juveniles constitute less than a fourth of thepopulation. Conversely, three fourths of the countriesin which juveniles constitute more than a third of thepopulation had a per capita output of less than $400in 1970 (see annex table A.19).
In a fifth of all countries, more than 46 per cent ofthe population was under 15 years of age in 1970. Afew of these were in the pre-transition stage of highdeath rates as well as high birth rates and, except forSwaziland and Zambia, they were in the lowest-incomegroup, producing less than $100 per person. The bulkof them, however, were in the transition, continuingto experience high birth rates notwithstanding areduction in death rates, moderate in most cases butin some countries--Colombia, Costa Rica, Ecuador,E1 Salvador, Mexico, Paraguay, the Philippines andSurinam--sufficient to bring them down to levelstypical of demographically mature countries.
Age structure and savings
As the old and the young tend to be consumers ratherthan producers, the smaller their proportion in thecommunity the greater is its capacity to save likelyto be. This relationship is reinforced by the tendencyfor countries with low age dependency ratios to have
17
highper capita incomes. This is borne out by the actualsavings record in the late 1960s. Among the countriesin which the 15-64 year old group constituted morethan 60 per cent of the population, only a fourth savedless than 20 per cent of their national output. Bycontrast, among the countries in which the workingage group constituted less than 56 per cent of thepopulation, only a fifth saved more than 20 per centof their output (see annex table A.20).
While, in general, higher savings ratios make forhigher rates of economic growth, the link is a tenuousone, especially in the developing countries where, atleast in the short run, exogenous factors such as theweather, resource discoveries and imported technologyand capital, tend to play a predominant role. Thetendency for a lower dependency ratio to improvesavings performance, therefore, does not ensure acorresponding relationship with the course of produc-tion. The rates of gross domestic product growthachieved in the 1960s seem, in fact, not to have beeninfluenced by the proportion of the population in theworking age bracket (see annex table A.21).
difficulty most of them experience in raising publicrevenue, the potentia! burden of providing schooling toso large a proportion of the population ranks as oneof the most baleful consequences of high fertility inlow-income communities.
POPULATION SIZE
Because economic and social planning and policyformulation are carried out by national entities, theabsolute size of the population of a country is a basicfactor in determining both objectives and measures.Population size governs the degree of specializationthat is practicable the nature of the appropriateinfrastructure and the extent of necessary decentral-ization in the production of goods and services andin decision-making. And the lower the per capitaincome the greater the weight of the population factorin determining the course of development.
Age structure and education
The proportion of the population in the school agebracket has a direct bearing on the potential resourcesrequired to provide formal education. The volume ofpublic resources actually used for education, however,is influenced by other factors as well--the extent towhich private resources are available, for example,and official policy in respect of school enrolment andattendance, and public response to that policy. Thereis a sharp contrast between the developing countriesand the more advanced countries in these matters: thepotential burden is much greater in the former, actualexpenditures are much greater in the latter.
In very few of the more advanced countries doesthe school age group (5-19 year olds) constitute morethan 30 per cent of the total population. Canada,Iceland, Malta and New ÿZealand were the onlyexceptions in 1970. And very few of these countriesspend less than 4 per cent of their total output onpublic education. The Federal Republic of Germany,Greece, Portugal and Spain were the only exceptionsat the end of the 1960s. Among the developing coun-tries; on the other hand, only Argentina and Uruguayand a school age population of less than 30 per cent ofthe total, and in an eighth of these countries the5-19 year olds were over 40 per cent of the population.And only a third of the developing countries devotedmore than 4 per cent of total production to publiceducation (see annex table A.22)
Given the great lag in educational attainment thatcharacterizes the developing countries and the great
It is not necessary to postulate a minimum popula-tion below which the development process is inhibited;clearly the relevant variable is not population alone,but rather a combination of population, ressourcesand technology. Countries that are regarded aseconomically advanced are to be found in all the sizegroups. They constitute around 15 per cent of countrieswith a population of less then 5 million, around 30 percent of those with a 5-50 million population, and50 per cent of the largest groups with Over 50 millioninhabitants. Nevertheless, development options areconstrained by the size of the population concerned.The smaller the population of a country the less depthwill its feasible production structure tend to have. Onits own, a small population will find it difficult tosustain the division of labour implicit in most forms ofheavy industry, in capital-intensive physical infra-structure, in specialized third-level educational facil-ities or in an elaborate research apparatus. Thislimitation has not always been recognized in develop-ment plans: visions of the development process andassumptions about the time path of industrializationand social "modernization" have often tended to be
insufficiently attentive to differences among countries,even in respect to so basic a factor as size of population.
The importance of this lies in the number of planningentities whose constituencies are very small: a fifth ofthe developing countries that are Members of theUnited Nations have populations of less than 1 millionand almost half have under 5 million inhabitants,while the majority of territories that are not yetMembers tend to be even smaller.
The rate of growth of national population does notseem to be greatly affected by their size although, inthe 1960s, high rates of population increase wererather more frequent among small countries than
18
among large (see annex table A.23). Rates of growthin excess of 2.5 per cent a year, for example, wererecorded in only 4 of the 14 countries with populationof over 50 million, about 60 per cent of the corre-sponding incidence among countries with less than5 million inhabitants. Correspondingly, the proportionof low growth rates--less than ! .5 per cent a year--wasmore than twice as high (one half) among largecountries as among small countries (one fifth). Asimplied above, however, this contrast is partly areflection of the proportion of more advanced countriesin the various population groups. Except for Gabon,no developing country had a population growth rateof less than 1 per cent a year, whereas almost 60 percent of the more advanced countries were in this
category in 1970. Correspondingly, half the developingcountries had population growth rates in excess of2.5 per cent a year compared with a mere 6 per centof the more advanced countries.
$2,800. And population is increasing over twice asrapidly in the low-income giants as in their high-income counterparts.
Population size and economic growth
In the aggregate, the proportion of countries in whichthe rate of population increase was less than 2 per centa year rose from 27 per cent among the small countries(under 5 million) and 32 per cent among the medium-sized countries (5-23 million) to 40 per cent among thelarge countries (25 million and over). This should nothide the fact, however, that in this last group, countrieswith a combined population of almost 1 billion wereexpanding at between 2 and 3 per cent a year.
Population size and income
The large-country group epitomizes some of thecontrasts on the world demographic and economicscene. While in each of the other size groups, aroundhalf the countries occupy the middle ground in regardto per capita income, with average between $200 and$1,000 in 1970, in the large-country group it is theextremes that predominate. At the one end of thespectrum are six countries with a combined populationapproaching 1.7 billion and an average per capitaoutput of approximately $120 in 1970. At the otherend are seven countries with a population approaching0.8 billion and a per capita output averaging over
Reflecting the fact that it includes a high proportionof mineral-exporting countries, the group with thesmallest population contained by far the lowest pro-portion of low-income countries--only 16 per centwith a gross domestic product of less than $200 percapita in 1970, half the over-all average. About 40 percent of these mini-States had a per capita grossdomestic product in excess of $700 in 1970; this wasa higher proportion than in any of the other size groupsexcept the largest, half of which produced more than$1,000 per capita in 1970 (see annex table A.24).
The best growth performance in the 1960s wasrecorded by the small and the large countries. Whileonly a fourth of the countries with a populationbetween 5 and 25 million increased their productionby more than 5.5 per cent a year, half the smaller andthe larger countries were in this category. Among thesmaller countries--whose production growth rateaveraged 5.6 per cent a year in the 1960s--the achieve-ment was largely resource-based: half the countrieswith less than 1 million population that expanded theiroutput at more than 5.5 per cent a year were essentiallymineral-exporters. Most of the other small high-growth countries were also strongly export-oriented(see annex table A.25).
The record of the smallest and the largest countrieswas also somewhat better than the others when theincrease of population is taken into account. The pro-portion achieving a rate of growth in per capita pro-duction of over 4 per cent a year in the 1960s was overa third in the case of countries with less than 1 millionpopulation and in countries with more than 25 million,but under a fourth in countries in between. Among thelarge countries, only India and Indonesia failed toachieve an average annual gain of over 2 per cent inper capita production; among the mini-States theproportion was almost a fourth and in the intermediategroup as much as 40 per cent. In about 10 per cent ofthis intermediate group, per capita production actuallydeclined in the course of the decade and in a roughlysimilar proportion it rose by less than 1 per cent a year(see annex table A.26).
Eleven of these economically stagnating countrieswere among the original list of 25 hard-core "leastdeveloped" countries recommended by the GeneralAssembly for special assistance.
Population size and savings
A country's ability to save is not greatly affected byits size. The highest proportion of countries savingmore than a fourth of gross output in 1968-1970 wasamong the mini-States (37 per cent) while the highestaverage savings ratio (19.2 per cent) was that of thecountries with population of over 50 million. Thepoorest savings performace was returned by the smallcountries with populations between 1 and 5 million:almost 60 per cent of these saved less than 15 per centof their gross national product, and the average ratiofor the 40 countries in this size group was only 13.5 per
19
cent. Half the countries in the next size group alsosaved less than 15 per cent of gross national product,though the presence of some industrialized countries inthis group as well as some high-income developingcountries raised its average savings ratio to over18 per cent. More serious in its global impact is thefact that a third of the larger countries--each witha population of over 25 million and accounting in theaggregate for almost a billion people--were in thislow-savings category (see annex table A.27)°
A somewhat more realistic picture of the pressure ofpopulation on the land may be obtained by concen-trating attention on usable area. While this cannot bedefined with any precision--since what is usable ispartly a function of locally available technology ashuman adaptability--an approximation of it exists inthe concept of "agricultural land". This at leasteliminates areas that are topographically or climaticallyunusable for normal human settlement.
Population size and density
The size classification by number of inhabitants doesnot necessarily conform to a classification by area.Some of the countries that have small populations areindeed quite large in terms of territory. Thus, half thecountries with fewer than 5 million inhabitants havea density of less than 25 persons per square kilometreof surface area. The corresponding proportion amongthe larger countries--with over 29 million inhabitants--is only a fifth (see annex table A.28).
Though land area is not a good measure of naturalresource endowment--indeed, in most cases theinhospitable nature of the terrain is itself one explana-tion of the smallness of the population--its relativeabundance in so many of the small countries must becounted a favourable factor, providing room formanoeuvre at present and a resource of increasingpotential value in the face of future world populationgrowth. Most of the countries with less than 10 personsper square kilometre are clustered around the world'smajor deserts--Arabian and Gobi in Asia, andKalihari and Sahara in Africa. But many of them, aswell as others with an unfavourable climate or topo-graphy-Bolivia, Gabon, Guyana and Surinam, forexample--have become leading suppliers of petroleumand other minerals in recent years.
While two thirds of the small countries are sparselypopulated--less than 50 persons per square kilo-metre--it is among the small countries that the highestdensities are found. A handful of them, indeed, haveover 400 persons per square kilometre--includingHong Kong and Singapore and the small island nationsof Barbados, Malta and Mauritius.
The distribution of countries by their populationdensity in relation to agricultural land is broadlysimilar to that by over-all average density. It has twomerits, however. First, it adjusts the relative positionof those countries that have large tracts of land that,for whatever reason, is not readily usable. Thus,countries such as Egypt, Iceland, Kuwait, Mauritania,Saudi Arabia and Democratic Yemen are transferredfrom one end of the density spectrum to the other,while a number of others make smaller moves in thehigher density direction. And secondly, the actualdimensions of the relationship are revealed morestrikingly. While about a fifth of all countries had anaverage density of under 10 persons per squarekilometre in 1970, only an eighth had less than 100 per-sons per square ki!ometre of agricultural land and inalmost a fifth there were more than 700 persons persquare kilometre of agricultural land (see annextable A.29).
The greater the physical size of a country the morediverse are its natural characteristics likely to be. Andwide differences in climate, topography and water andmineral resources are likely to lead to correspondingdifferences in population concentration. These differ-ences are the basis of a good deal of geographicalmovement and will be examined again in that context.6While low average density in large countries does notpreclude the existence of local over-population, highdensity in small countries poses special problems foreconomic and social development and calls for closelinks with the rest of the world.
The large countries--with populations of over50 million--also cover the density spectrum. Theyinclude the highly industrialized temperate zone nationsof the Federal Republic of Germany, Japan and theUnited Kingdom with 200-300 persons per squarekilometre, and Bangladesh, one of the most crowdedareas of rural tropical settlement, as well as the vastterritories of Brazil and the Soviet Union with averagedensities of only 11 persons per square kilometre.
Behind the fact that 38 per cent of the countries withless than 1 million inhabitants had an average density ofover 700 persons per square kilometre of agriculturalland in 1970 lies another phenomenon, however,namely, urbanization. And this needs to be taken intoaccount in assessing densities measured in averages forcountries as single entities.
The proportion of population living in urban areasin 1970 was remarkably similar in the various sizegroups, despite the wide differences in the degree of
6 See the discussion on population movement in the developedmarket economies in chapter lI, section on Movement ofpoptfla-tion.
20
urbanization of individual countries. The average ratiowas lowest (rather less than 35 per cent) in the groupof countries with 5-10 million inhabitants, and highest(rather more than 42 per cent) in next largest group,with 10-25 million inhabitants. There was virtuallythe same proportion of urban population in the mini-States as in the giants with over 50 million inhabitants.However, the proportion of countries with low degreesof urbanization (less than 17 per cent) was nearly twiceas high among those with populations of under5 million as among those with population of over25 million. And among the largest countries (withpopulations of over 50 million), almost 60 per centhad more than half of their inhabitants living in urbanareas, while the remainder were at the other end ofthe range, with less than 30 per cent in urban areas.In the other size groups, countries were spread moreuniformly across the urbanization spectrum (see annextable A.30).
the other countries in this group still have high ratesof natural increase--over 2.5 per cent a year in mostcases--straining further the balance between popula-tion and natural resources.
Population size and agricultural status
Town dwellers draw little of their natural sustenancefrom the land on which they reside or work: it isbrought in--as food-stuffs and raw materials--from
some rural area, not necessarily in the same country.This suggests that one of the key dimensions of therelationship between population and land is thenumber of rural persons per square kilometre ofagricultural land. By this measure, the proportion ofcountries with the heaviest population load is highestat the extremes: around 30 per cent of the countrieswith under 1 million or over 50 million inhabitants hadmore than 400 rural dwellers per square kilometre ofagricultural land compared with only 17 per cent ofthe countries with intermediate populations. With theexceptions of Japan and Switzerland, in particular,the industrial countries, with their highly urbanizedpopulations, have a relatively low rural density: veryfew had more than 200 per square kilometre ofagricultural land which was the median figure in 1970and several-including not only the North Americanand southern hemisphere countries but also theGerman Democratic Republic, France, the SovietUnion and most of the Scandinavian countries--hada rural density of less than 100 (see annex table A.31).
Rural density is often a reflection of the relativeimportance of agriculture in the employment patteru,This is the case in Bangladesh and Indonesia amongthe large countries, for example, in the DemocraticRepublic of Viet-Nam, Haiti, Kenya and the Republicof Viet-Nam, among the medium-sized countries, andin Mauritania and Rwanda, among the smaller ones.In all these countries rural density exceeded 400 per-sons per square kilometre of agricultural land in 1970and over 70 per cent of the labour force was engagedin agriculture. To only a slightly less degree, high ruraldensity and the predominance of agricultural employ-ment are the joint characteristics of a number of othercountries including India, Pakistan, the Philippinesand Thailand, among the larger ones, and Angola,Burundi, Gabon, Laos, Democratic Yemen and SaudiArabia, among the smaller.
Low proportions of agricultural employment aremost frequent among the very small and very largecountries: in 1970, for example, over 40 per cent ofthese extreme groups had less than a fourth of theirlabour force engaged in agriculture, while in the inter-mediate groups less than a sixth of the countries hadsuch low agricultural employment ratios. In this inter-mediate group, a third of the countries had over 70 percent of their labour force in agriculture--twice theproportion registered by the mini-States and the giants(see annex table A.32).
The countries with the most unfavourable land/population ratio in 1970 were Barbados, Lebanon andMauritius among the small ones, and Bangladesh andthe Republic of Korea among the large. Thesecountries had extremely high densities both rural andtotal, and therefore face particularly difficult problemsin seeking to reduce population pressure either byurbanization or by converting or reclaiming land forhuman settlement. By a combination of emigrationand lower natality, Barbados has reduced its rate ofpopulation growth to less than 1.5 per cent a year, but
Differences in rural density and in the proportion ofthe work force engaged in agriculture did not have anysignificant effect on food consumption, at least interms of the national average? Average per capitacalorie intake ranged, erratically and narrowly, from2,366 per day in the mini-States to 2,521 in countriesin the middle range (10-25 million) of population size.And there was a similar narrow and random spreadin protein intake--from an average of 60 grammes perperson per day in the 5-10 million population groupto 67 in the 25-50 million group. The wide disparitiesin domestic production were more or less evened outby trade flows.
7 At the local level, differences were much greater, especiallyin the less developed countries where deficiencies in transportand marketing arrangements hamper the movement of goods.Some aspects of tfiis problem are discussed in chapter IV below.
21
Population size alzd international trade
The low agricultural involvement in the mini-Statesmeans that they tend to be heavily dependent onimports for food supplies. In 1970, over half of themproduced less than a fifth of the volume of cereals theyconsumed. The larger the country the smaller the inci-dence of such import-dependence: the proportion ofcountries producing less than 60 per cent of the cerealsconsumed declined progressively from three fourthsamong the mini-States to a mere 8 per cent amongcountries with populations of over 25 million. Therewas a corresponding tendency for the proportion ofcereal-exporters to rise with country size: it was only5 per cent among the mini-States and 9 per cent amongthose with populations between 1 and 5 million, butit increased to a fifth of the 5-10 million group andover a third of the 10-25 million group, before recedingto a fourth of those with over 25 million inhabitants(see annex table A.33).
Among the larger countries, the lowest degree ofcereal self-sufficiency was registered by some of themajor industrial nations (the Federal Republic ofGermany, Italy, Japan, Poland, Spain and the UnitedKingdom), but import-dependence was also significantin some of the countries characterized by high ruralpopulation density (Egypt and the Republic of Korea)or by a high agricultural employment ratio thePhilippines and Turkey) or by both (Bangladesh andIndonesia). The cereal deficit of most of these devel-oping countries was less than 10 per cent of con-sumption but; given their size, the absolute quantitiestend to bulk large in world cereal trade, as indeed dothe imports of the large developing countries that havea less than 5 per cent shortfall--Brazil, China, Indiaand Nigeria.
Cereals constitute the principal food import of thesecountries, and in most cases8 basic food-stuffsaccounted for more than 10 per cent of the total1969-1971 import bill. In Egypt, Pakistan-Bangladeshand the Republic of Korea, the food bill was 15-20 percent of the total, and in India, more than 20 per cent(see annex table A.34). Over 15 per cent of the importexpenditure was for basic food-stuffs in many of thesmaller countries, too. Some of these were countrieswith high rural densities--Barbados, Hong Kong,Lebanon, Mauritania and Sri Lanka, all with morethan 400 rural dwellers per square kilometre of agri-cultural area. Some of them had the high agriculturalemployment ratios that tend to characterize subsistenceeconomies--Laos, Mali, Senegal and the Upper Volta,
in which over 70 per cent of the labour force was inagriculture. Some--like Mauritania and the Republicof Viet-Nam--had both characteristics. In others,however, the reasons for high imports-dependence layelesewhere, sometimes in agricultural and economicpolicy 9
One of the results of their relatively high import billfor food-stuffs has been to put small countries ill over-all trade deficit. In 1969-1971 less than a fifth of thecountries with under 5 million inhabitants had anactive balance of trade, compared with almost 30 percent of medium-sized countries (5-50 million) and halfthe giants with over 50 million inhabitants. And thedeficits of the mini-States tend to be, proportionately,the largest: half of them paid for less than half theirimports (valued c.i.f.) by means of commodity exportsin 1969-1971, compared with 11 per cent of thecountries in the 1-10 million population group andonly 5 per cent of those with more than 10 million inha-bitants (see annex table A.35).
Among the developing countries, irrespective of size,it is the mineral exporters that run active trade balances :Guyana and Surinam (bauxite), Bolivia and Malaysia(tin), Liberia and Mauritania (iron ore), Chile, Zaireand Zambia (copper) and Peru (a range of ores andmetals), and most notably the petroleum producers,represented in each of the size groupings.
It is among the small countries, however, that inter-national trade bulks largest. In no mini-State did thevalue of trade (measured as the average of exportsf.o.b, and imports c.i.f.) constitute less than a fifth oftotal production in 1970. The proportion of countrieswith this high degree of economic openness declineswith size: it was two thirds among small countries(1-5 million inhabitants) in 1970, rather less than halfamong those with 5-10 million, and about a fourthamong those with 10-25 million, while a 20 per centratio was virtually unknown among the larger countries(see annex table A.36).
The decline in the quantitative significance offoreign trade as the size of the population--and thedomestic economy--increases does not imply a paralleldecline in its qualitative importance. The imports ofa large country--whatever the stage of its develop-ment--may consist of essential food-stuffs, fuels andraw material or desirable technology. But it is clearly
8 Based on an analysis of the trade of the 81 countries report-ing in accordance with the Standard International Trade Classi-fication (SITC).
9 Not all countries with high food import bills have large fooddeficits. Some, indeed, run a food surplus: Brazil and the Phil-ippines among the larger countries, for example, finance theircereal imports by exporting sugar and edible oils and seeds, andEgypt pays for its wheat imports with exports of rice andonions, while among the smaller countries, Dahomey (oil-seeds),Mali (fish and ground-nuts), the Upper Volta (cattle and ground-nuts) and Fiji and Barbados (sugar) were all in over-all foodsurplus in 1969-1971.
22
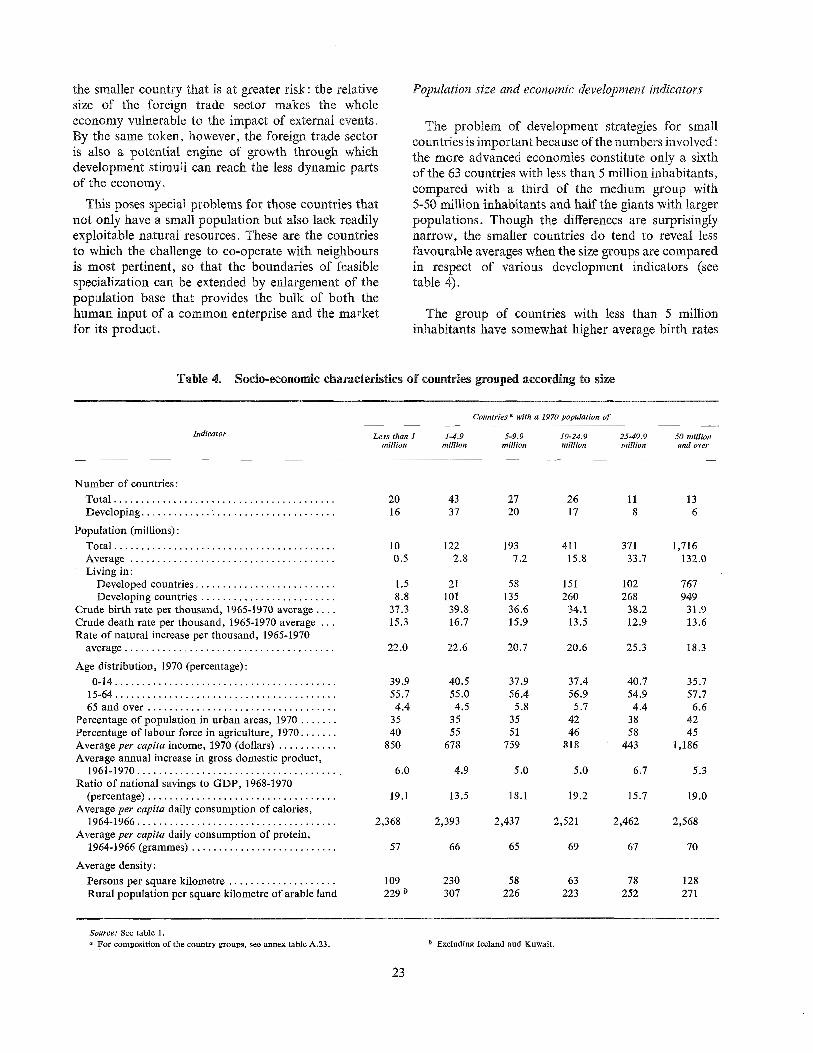
the smaller country that is at greater risk: the relativesize of the foreign trade sector makes the wholeeconomy vulnerable to the impact of external events.By the same token, however, the foreign trade sectoris also a potential engine of growth through whichdevelopment stimuli can reach the less dynamic partsof the economy.
This poses special problems for those countries thatnot only have a small population but also lack readilyexploitable natural resources. These are the countriesto which the challenge to co-operate with neighboursis most pertinent, so that the boundaries of feasiblespecialization can be extended by enlargement of thepopulation base that provides the bulk of both thehuman input of a common enterprise and the marketfor its product.
Population size and economic development indicators
The problem of development strategies for smallcountries is important because of the numbers involved:the more advanced economies constitute only a sixthof the 63 countries with less than 5 million inhabitants,compared with a third of the medium group with5-513 million inhabitants and half the giants with largerpopulations. Though the differences are surprisinglynarrow, the smaller countries do tend to reveal lessfavourable averages when the size groups are comparedin respect of various development indicators (seetable 4).
The group of countries with less than 5 millioninhabitants have somewhat higher average birth rates
TaNe 4. Soclo-economie characteristics of countries grouped according to size
Countries ÿ with a 1970 population of
Indicator Less than 1 1-4.9 5-9.9 10-24.9 25-49.9 50 millionmillion million million million million and over
Number of countries:
Total ......................................... 20 43
Developing .................................... 16 37
Population (millions) :Total ......................................... 10 122
Average ...................................... 0.5 2.8
Living in:Developed countries .......................... 1.5 21
Developing countries ......................... 8.8 101
Crude birth rate per thousand, 1965-1970 average .... 37.3 39.8Crude death rate per thousand, 1965-1970 average ... 15.3 16.7Rate of natural increase per thousand, 1965-1970
average ....................................... 22.0 22.6
Age distribution, 1970 (percentage):0-14 ......................................... 39.9 40.5
15-64 ......................................... 55.7 55.0
65 and over ................................... 4.4 4.5
Percentage of population in urban areas, 1970 ....... 35 35
Percentage of labour force in agriculture, 1970 ....... 40 55
Average per capita income, 1970 (dollars) ........... 850 678
Average annual increase in gross domestic product,1961-1970 ...................................... 6.0 4.9
Ratio of national savings to GDP, 1968-1970(percentage) ................................... 19.1 13.5
Average per capita daily consumption of calories,1964-1966 ..................................... 2,368 2,393
Average per capita daily consumption of protein,1964-1966 (grammes) ........................... 57 66
Average density:
Persons per square kilometre .................... 109 230
Rural population per square kilometre of arable land 229 0 307
27 26 11 1320 17 8 6
193 411 371 1,7167.2 15.8 33.7 132.0
58 151 102 767135 260 268 94936.6 34.1 38.2 31.915.9 13.5 12.9 13.6
20.7 20.6 25.3 18.3
37.9 37.4 40.7 35.756.4 56.9 54.9 57.75.8 5.7 4.4 6.6
35 42 38 4251 46 58 45
759 818 443 1,186
5.0 5.0 6.7 5.3
18.1 19.2 15.7 19.0
2,437 2,521 2,462 2,568
65 69 67 70
58 63 78 128226 223 252 271
Source: See table 1.a For composition of the country groups, see annex table A.23. Excluding Iceland and Kuwait.
23

(about 39 per thousand) and death rates (about 16 perthousand) than any of the larger-country groups. Itschild population proportion is slightly higher (over40 per cent) and its working age proportion slightlylower (about 55 per cent). The proportion of its popu-lation in urban areas is relatively low (35 per cent) andthe proportion in agriculture relatively high (53 percent). Density of occupation is also high--about
300 rural persons per square kilometre of arable land.While the average per capita income, saving ratio andeconomic growth rate of the 20 mini-States comparefavourably with those of larger countries, these indi-cators are substantially lower in the group of 43 coun-tries with 1-5 million inhabitants, confirming theimpression that the process of economic developmentis particularly difficult in small countries.
24
Chapter II
THE IMPACT OF RECENT DEMOGRAPHIC CHANGESIN THE DEVELOPED MARKET ECONOMIES
Concern over questions of population has increasedin the developed market economies in recent years inthree distinct but interrelated respects. The mostfrequently expressed concern relates to population size,especially as it impinges on certain natural resources--water, minerals and land area usable for farming,building and recreation. Linked to that is the questionof the rate of population growth, regarded not only asa matter of increasing size but also in terms of theresultant changes in age composition. And, linked inother ways to the size and growth of population, is itsgeographical distribution: changes in that distribution,through migration--chiefly towards employment--have also become a matter of considerable concern inmany countries.
a third or more of the land area has been given overto roads, airports and parking lots. The search forliving space, coupled with the availability of personaltransport, has tended to spread the population overmuch greater distances, with the consequent evolutionof new life styles, one of the main features of which isthe phenomenon of "commuting" between place ofresidence and place of employment. For millions ofpeople in the developed market economies, thisjourney to and from work has dramatized the demo-graphic situation, and the result has been a newawareness of overcrowding as a contemporary problem,
THE SIZE OF POPULATION
Apprehension about population size is a recentdevelopment. It reflects the material consequences ofrising living standards, the spread of mechanicaltechnologies and the resultant change in life styles.Just as the application of heat to a gas agitates themolecules and raises its pressure, so the combinationof higher incomes and new production and transporttechniques has caused the population to impinge withincreasing intensity on the natural environment. Thepost-war period has seen an extraordinary increase inthe volume and speed of movement of goods andpeople. Production in the developed market economieshas expanded at the unprecedented rate of 4-5 per centa year and their imports and exports of goods at twicethat pace. And, in the face of a tremendous upsurgein the use of motor-cars and aeroplanes, there has beencorresponding expansion in the amount of personaltravel, both internally and between countries.
The changing relationship between population andspace under the influence of increasing mobility hasbeen evidenced in many other contexts: pressure onparks and beaches and other recreational facilities, forexample, and the extending range of organized tourism.The escalation of land prices, especially in suburbanlocalities, also reflects the pressure of mobile andrising-income population on a given living space.1Though the immediate impact of these changes onindividuals is occasional rather than continuous, they,too, have contributed to the general concern over
population size.
Less direct than the relationship between people andtheir living space is the link between population andthe intake of natural resources required to sustaincurrent modes of living. While, in general, there hasbeen no great upsurge in the consumption of rawmaterials, whether expressed in average per capitalevels or in terms of growth rates, the exponential rateof increase in industrial absorption has not noticeablyslackened. Indeed, in the case of the major non-ferrousmetals--prime examples of non-renewable resources--
This increase in human movement has induced anew sense of crowdedness not only among lower-income groups--which have always lived in morecongested circumstances--but also among the wealthierwho have had to move further and further away toenjoy the privacy or isolation they once could experienceclose to home. Shortage of space has become mostnoticeable in the larger urban areas, in many of which
1 In England and Wales, for example, land prices for privatehousing rose at an average rate of 12 per cent a year between1963 and 1969, three times as fast as consumer prices (seeUnited Kingdom, Central Statistical Office, Economic Trends(London), February 1971, p. xlviii). In Japan, land prices in thecities are estimated to have risen 23-fold in the 18-year period1955-1973, an increase of about 19 per cent a year, almostfive times as fast as the cost of living (see Japan Institute of RealEstate Research, as reported in Japan Economic Journal (NikonKeizai Shimbun) (Tokyo), 2 October 1973).
25
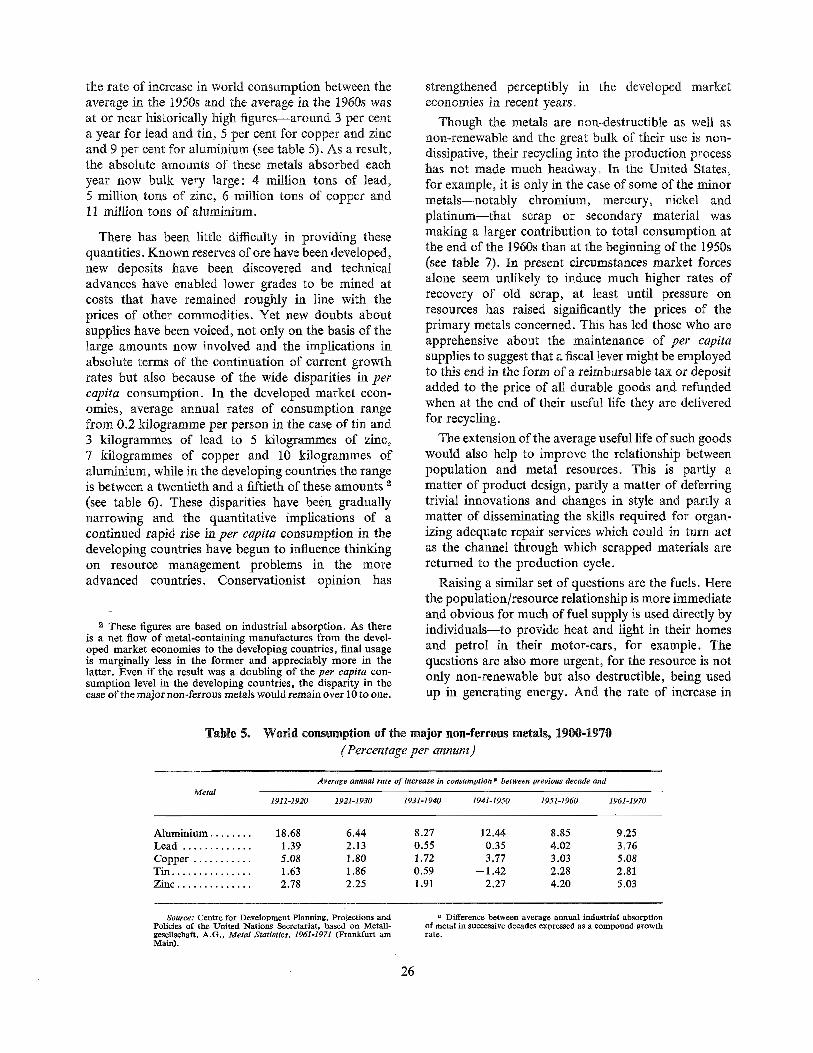
the rate of increase in world consumption between theaverage in the 1950s and the average in the 1960s wasat or near historically high figures--around 3 per centa year for lead and tin, 5 per cent for copper and zincand 9 per cent for aluminium (see table 5)° As a result,the absolute amounts of these metals absorbed eachyear now bulk very large: 4 million tons of lead,5 million tons of zinc, 6 million tons of copper and11 million tons of aluminium.
There has been little difficulty in providing thesequantities. Known reserves of ore have been developed,new deposits have been discovered and technicaladvances have enabled lower grades to be mined atcosts that have remained roughly in line with theprices of other commodities. Yet new doubts aboutsupplies have been voiced, not only on the basis of thelarge amounts now involved and the implications inabsolute terms of the continuation of current growthrates but also because of the wide disparities in percapita consumption. In the developed market econ-omies, average annual rates of consumption rangefrom 0.2 kilogramme per person in the case of tin and3 kilogrammes of lead to 5 kilogrammes of zinc,7 kilogrammes of copper and 10 kilogrammes ofaluminium, while in the developing countries the rangeis between a twentieth and a fiftieth of these amounts 2(see table 6). These disparities have been graduallynarrowing and the quantitative implications of acontinued rapid rise in per capita consumption in thedeveloping countries have begun to influence thinkingon resource management problems in the moreadvanced countries. Conservationist opinion has
These figures are based on industrial absorption. As thereis a net flow of metal-containing manufactures from the devel-oped market economies to the developing countries, final usageis marginally less in the former and appreciably more in thelatter. Even if the result was a doubling of the per capita con-sumption level in the developing countries, the disparity in thecase of the major non-ferrous metals would remain over 10 to one.
strengthened perceptibly in the developed marketeconomies in recent years.
Though the metals are non-destructible as well asnon-renewable and the great bulk of their use is non-dissipative, their recycling into the production processhas not made much headway. In the United States,for example, it is only in the case of some of the minormetals--notably chromium, mercury, nickel andplatinum--that scrap or secondary material wasmaking a larger contribution to total consumption atthe end of the 1960s than at the beginning of the 1950s(see table 7). In present circumstances market forcesalone seem unlikely to induce much higher rates ofrecovery of old scrap, at least until pressure onresources has raised significantly the prices of theprimary metals concerned. This has led those who areapprehensive about the maintenance of per capitasupplies to suggest that a fiscal lever might be employedto this end in the form of a reimbursable tax or depositadded to the price of all durable goods and refundedwhen at the end of their useful life they are deliveredfor recycling.
The extension of the average useful life of such goodswould also help to improve the relationship betweenpopulation and metal resources. This is partly amatter of product design, partly a matter of deferringtrivial innovations and changes in style and partly amatter of disseminating the skills required for organ-izing adequate repair services which could in turn actas the channel through which scrapped materials arereturned to the production cycle.
Raising a similar set of questions are the fuels. Herethe population/resource relationship is more immediateand obvious for much of fuel supply is used directly byindividuals--to provide heat and light in their homesand petrol in their motor-cars, for example. Thequestions are also more urgent, for the resource is notonly non-renewable but also destructible, being usedup in generating energy. And the rate of increase in
Table 5. World consumption of the major non-ferrous metals, 1900-1970(Percentage per annum)
Average annual rate of Increase in consumption a between previous decadeandMetal
1911-1920 1921-1930 1931-1940 1941-1950 1951-1960 1961-1970
Aluminium ........ 18.68 6.44 8.27 12.44 8.85 9.25
Lead ............. 1.39 2.13 0.55 0.35 4.02 3.76
Copper ........... 5.08 1.80 1.72 3.77 3.03 5.08
Tin ............... 1.63 1.86 0.59 --1.42 2.28 2.81
Zinc .............. 2.78 2.25 1.91 2.27 4.20 5.03
Source: Centre for Development Planning. Proiections andPolicies of the United Nations Secretariat, based on ietall-gesellsehaft. A.G., Metal Statistics, 1961-1971 (Frankfurt amMain).
a Difference between average annual industrial absorptionof metal in successive decades expressed as a compound growthrate.
26
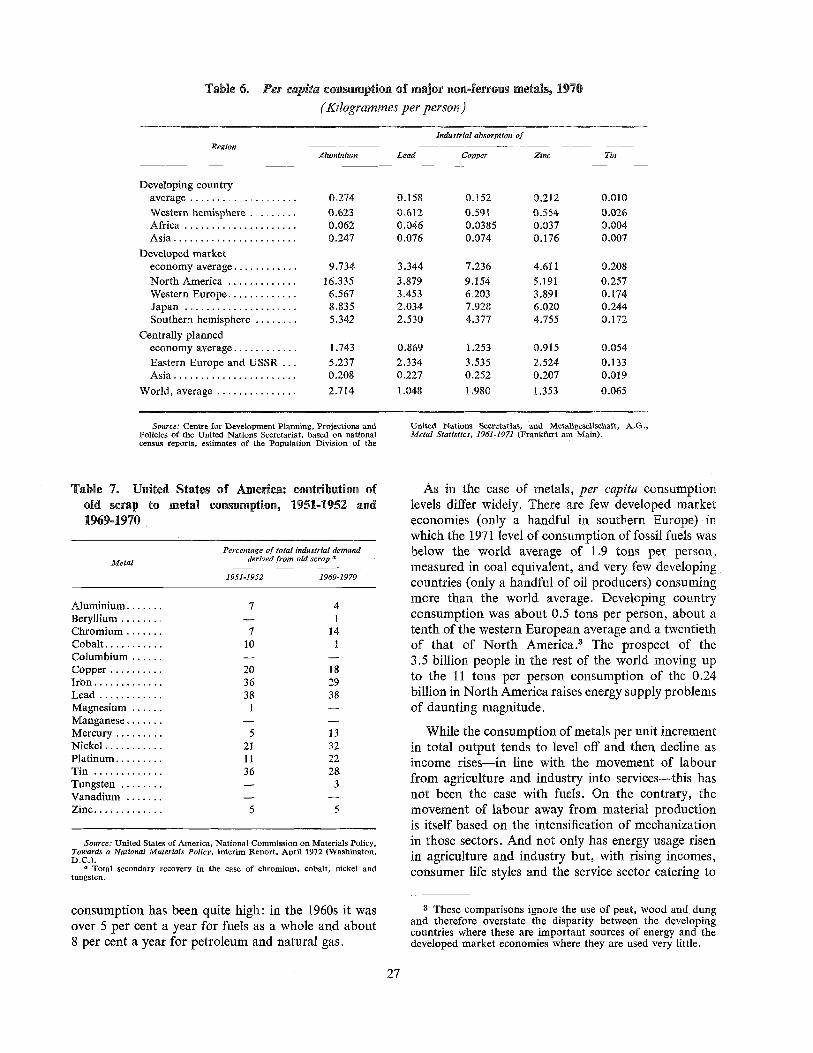
Table ÿ. Per capita consumption of major non-ferrous metalsÿ 1970
(Kilogrammes per person)
RegionAlumtntum
Industrial absorption of
Lead Copper Zinc Tin
Developing countryaverage .................... 0.274 O. 158
Western hemisphere ......... 0.623 0.612
Africa ..................... 0.062 0.046
Asia ....................... 0,247 0.076
Developed marketeconomy average ............ 9,734 3.344
North America ............. 16.335 3.879
Western Europe ............. 6,567 3.453
Japan ..................... 8,835 2.034
Southern hemisphere ........ 5.342 2.530
Centrally plannedeconomy average ............ 1.743 0.869
Eastern Europe and USSR... 5.237 2.334Asia ....................... 0,208 0.227
World, average ............... 2.714 1.048
0.152 0,212 0,0100.591 0.554 0.0260.0385 0.037 0.0040.074 0.176 0.007
7.236 4.611 0.2089.154 5.191 0.2576.203 3.891 0.1747.928 6.020 0.2444.377 4.755 0.172
1.253 0.915 0.0543.535 2.524 0.1330.252 0.207 0,0191.980 1,353 0.065
Source: Centre for Development Planning, Projections andPolicies of the United Nations Secretariat, based on nationalcensus reports, estimates of the Population Division of the
United Nations Secretariat, and Metallgesellschaft, A,G.,Metal Statistics, 1961-1971 (Frankfurt am Main).
Table 7. United States of America: contribution ofold scrap to metal consumpfionÿ 1951-1952 and1969-1970
Metal
Percentage of total industrial demandderived from old scrap ÿ
1951-1952 1969-1970
Aluminium ....... 7 4
Beryllium ........ -- l
Chromium ....... 7 14
Cobalt ........... 10 1
Columbium ...... --
Copper .......... 20 18
Iron ............. 36 29
Lead ............ 38 38
Magnesium ...... 1
Manganese ....... --
Mercury ......... 5 13
Nickel ........... 21 32
Platinum ......... 11 22
Tin ............. 36 28
Tungsten ........ -- 3
Vanadium ....... --
Zinc ............. 5 5
As in the case of metals, per capita consumptionlevels differ widely. There are few developed marketeconomies (only a handful in southern Europe) inwhich the 1971 level of consumption of fossil fuels wasbelow the world average of 1.9 tons per person,measured in coal equivalent, and very few developingcountries (only a handful of oil producers) consumingmore than the world average. Developing countryconsumption was about 0.5 tons per person, about atenth of the western European average and a twentiethof that of North America? The prospect of the3.5 billion people in the rest of the world moving upto the 11 tons per person consumption of the 0.24billion in North America raises energy supply problemsof daunting magnitude.
Source: United States of America, National Commission on Materials Policy,Towards a National Materials Policy, Interim lÿeport, April 1972 (Washington,D.C.).
a Total secondary recovery in the case of chromium, cobalt, nickel andtungsten.
While the consumption of metals per unit incrementin total output tends to level off and then decline asincome rises--in line with the movement of labourfrom agriculture and industry into services--this hasnot been the case with fuels. On the contrary, themovement of labour away from material productionis itself based on the intensification of mechanizationin those sectors. And not only has energy usage risenin agriculture and industry but, with rising incomes,consumer life styles and the service sector catering to
consumption has been quite high: in the 1960s it wasover 5 per cent a year for fuels as a whole and about8 per cent a year for petroleum and natural gas.
3 These comparisons ignore the use of peat, wood and dungand therefore overstate the disparity between the developingcountries where these are important sources of energy and thedeveloped market economies where they are used very little.
27
them have also become more energyqntensive. In theEuropean Economic Community (EEC), for example,gross internal energy consumption increased at about6 per cent a year in the 1960s--4.4 per cent a year inindustry, 6.4 per cent a year in transport and 8 percent a year in the household-tertiary sector. Thus,while energy consumption increased less rapidly thanmaterial output in industry and less rapidly than thevehicle park in transport, it increased more rapidlythan private consumption in the household sector.4
Another natural resource that has come under strainin recent years is water, use of which has increasedrapidly both directly by consumers and indirectlythrough production processes including, in particular,the generation of electricity. In many countries therehas also been a notable expansion in the use of waterfor irrigation as an essential part of the technologicalrevolution that has underpinned the industrializationof agriculture.
Whether energy use will continue to run ahead oftotal consumption in the household sector as incomesrise and the ownership of mechanized assets spreads tosaturation depends as much on technological develop-ments as on location and style of living.5 In thedeveloped market economies as a whole, however, itis clear that the link between fuel requirements andsize of population will remain very close for theforeseeable future. This adds significance to the rateat which domestic consumption of energy has beenoutrunning domestic production. In EEC, the ratio ofnet imports (excluding bunkers) to inland consumptionrose from 30 per cent in 1960 to 63 per cent in 1970.And even in the resource-rich United States, an energydeficit began to emerge in the 1950s ÿ and by thebeginning of the 1970s it had reached 10 per cent ofover-all consumption and as much as a fourth in thecase of petroleum alone.
As a result of this agricultural transformation, thedeveloped market economies have had relatively littledifficulty in feeding their populations. Indeed, notonly has the developed market economy populationbeen better fed by fewer people on the land but thesefarmers have become the suppliers of critical foodmargins required to sustain populations in otherregions. This has been achieved by increasing veryconsiderably the claims of agriculture both on watersupplies and on fuel resources--for the energy neededfor the mechanization of many farm operations andas feedstock for the production of nitrogenous fertilizersand various petro-chemical pesticides and fungicides.
4 See Statistical Office of the European Communities,Energy Statistics, 1972 Yearbook (Luxembourg), pp. 2 and 25.
5 In the United States, gross energy consumption per dollarof gross national product declined fairly steadily between themid-1950s and the mid-1960s and then rose sharply and by1970 was back at the 1950s average of about 93,000 BTU per1958 dollar of gross national product. If life styles become lessenergy-intensive (through a shortening of home-to-work travel,for example, or more efficient use of fuels in households) andmaterial output continues to increase more slowly than totaloutput as national income rises, the energy/gross national pro-duct ratio should fall. These assumptions are exemplified in theUnited States Department of the Interior projection, UnitedStates Energy through the Year 2000, by Walter G. Dupree andJames A. West (Washington, D.C., December 1972), whichforecasts a reversal in the acceleration in the growth of percapita fuel use in the household and commercial sector. On theassumption of a reduction in the rate of population growth anda saturation of households with central heating and air-condi-tioning and other energy-consuming devices, the average annualincrease in per capita fuel use, which has risen steadily from1.0 per cent to 3.3 per cent in the past four quinquennia, ispredicted to decline to 1.5 per cent in the next four.
6 Despite the fact that domestic petroleum production in the1950s--about 24.5 billion barrels--was in excess of the entireamount produced before the Second World War. The 1950s alsosaw the production of more natural gas--99 × 1012 cubic feet--than had been previously produced in the United States. SeeUnited States of America, Department of the Interior, Bureauof Mines, Production of Mineral Fuels and Hydropower in theUnited States since 1800, by R. M. Gooding (Washington,D.C., 1963). This tremendous upsurge in the rate at which fossilfuel deposits were being used up has served to dramatize thecrucial relationship between population and non-renewablenatural resources.
The population/natural resource relationship is notlimited to raw material absorption and use; it is alsoaffected by the movement of the resources throughthe system, serving their intended purpose but alsogenerating unwanted side effects and leaving residualmaterials that call for additional handling and disposal.In this respect, too, there has been an awakening tothe magnitude of the problem and a growing apprecia-tion of the dimensions of the demographic impact onthe environment.
The discharge of gaseous effluents into the atmo-sphere tends not only to waste heat and dissipatematerials of potential value, such as sulphur, but alsoto corrode steel and stone structures and damagehuman eye, skin and lung tissues as well as trees andfoliage and the creatures to which they act as host.The discharge of liquid effluents has a similar potentialfor harm, wasting heat and various solutes andcontaminating lakes and rivers, reducing the usabilityof the water both for aquatic life and as a naturalresource. The disposal of solid residues poses com-parable problems both in terms of the waste involved--in the material itself as well as in handling andtransporting it--and because of its frequently noxiouscharacteristics.
The magnitude of this environmental impactproblem rises rapidly with population density. In theUnited States, urban solid waste collection nowexceeds 5 pounds per person per day and the amountgenerated by farms, mines and factories is over
28
4 billion tons a year.7 The past decade has thus seena proliferation of protective measures in all theindustrial countries. Zoning laws have been tightened,limiting the locational choice of industries witheffluent and waste disposal difficulties. In Japan, forexample, a determined effort is now being made toprevent the further industrialization of the Tokyo-Yokohama-Nagoya-Osaka conurbation. In most coun-tries standards have been raised in respect of thevolume, temperature and toxicity of the fluid dis-charged from factories and power stations. And evenwithin the general framework of stricter rules, citizengroups have often resisted particular industrial develop-ments through court action, claiming the probabilityof specific environmental damage.
Much of this action has been inimical to thepopulation/resource balance, narrowly defined. Olderfacilities that could not readily be modified to meetthe new standards for effluents have been closed down;this has resulted in a reduction in zinc-refining capacityin the United States, for example from 1.25 milliontons in 1968 to less than 1 million tons in 1971. Miningexpansion has been slowed down, the strongestresistance being manifested against open-cast tech-niques and stripping which destroy land in the conven-tional sense, especially where the run-off of rain canwash the agriculturally usable top soil into the riversand the sea. Offshore drilling has also been stronglyopposed because of the danger of oil spillage and theconsequent harm to fish, birds and beaches. Opposi-tion to the passage of a pipeline of heated oil acrossthe tundra, because of the ecological risks, has delayedthe exploitation of the North Slope oil deposits ofAlaska for several years. The damming of rivers forhydroelectric purposes has also met with organizedresistance, from those anxious to protect the habitat offish and other wild life and to preserve the wilderness.Local objections to the siting of nuclear power stationshave held back the process of supplementing generatingfacilities based on fossil fuels. Strain on fossil fuelresources has also come from efforts to prevent furtherdeterioration in the quality of air resources: theburning of high-sulphur coal and oil has been restrictedin many places, for example, and the current technologyfor reducing harmful emissions from internal combus-tion engines results in a significant reduction in theefficiency with which fuel is converted into mechanicalenergy.
the population has a direct and simple relationshiphave taken precedence over the further developmentof resources such as fuels and metals whose relationshipwith the population is only indirect--through acomplex industrial system, shaped by a changingtechnology--and hence less readily perceived. It is farfrom clear, however, how durable these new preferenceswill prove. The first test may well be at hand in thepresent energy shortage. Will the long-establishedtrend towards more energy-intensive life styles bereversed, if not permanently then at least for longenough to permit the development of environmentallyneutral sources of energy--solar, geothermal, wind,tide and perhaps even nuclear fusion--to supplementand gradually replace the fossil fuels ?
As the test has come upon the developed marketeconomies earlier than was expected and the patternof asset holding, the distribution of industrial influenceand the established expectations of the bulk of thepopulation are all such as to resist radical change, it isby no means certain that the new preferences will bemaintained in the face of high transitional costs andinconvenience. Nevertheless, the vision of man as partof nature, of the interconnectedness of the system andof the need for caution in initiating disequilibratingchanges seems likely to persist. It spread with sur-prising speed and influence in the 1960s, especiallyamong the young, and it will almost certainly colourall thinking about population questions in the fore-seeable future.
THE RATE OF GROWTH AND AGE DISTRIBUTIONOF POPULATION
It is clear that a definite reordering of priorities hasbeen under way. The protection and restoration of thebasic resources--land and water and air--with which
7 United States of America, Council on EnvironmentalQuality, Environmental Quality; First Annual Report of theCouncil (Washington, D.C., 1970).
One of the major consequences of population growthis implicit in the foregoing discussion of the relation-ship between population and natural resources. It isclear that for purposes of economic analysis there isno such thing as a demographic unit in the abstract.A population increment takes place in a concrete socio-economic environment. When a new baby arrives itadds to total consumption a volume and range ofgoods and services that are largely predetermined bythe standards and customs of the group into which itis born. Correspondingly, a death reduces consumptionby an amount that depends on the age of the deceasedand the group in which he was living. A net increasein the population requires an increase in investmentsufficient to maintain the average level of fixed capitalper person if the group is to preserve its industrialstructure and its life style. Thus the implications forthe population/resources balance of a given incrementin population are much greater in the developedmarket economies than in the developing countries.
29
Birth rates in the developed market economies variedrather erratically between 1950 and 1970, but thereductions outnumbered the increases and weregenerally greater, especially among the countries inwhich the crude birth rate in the early 1950s exceeded20 per thousand--Australia, Canada, Cyprus, Finland,Japan, the Netherlands, Turkey, the United States andYugoslavia, for example. Where birth rates rose it wasinvariably from low levels, as in the case of a numberof European countries--notably Austria, the FederalRepublic of Germany, Luxembourg, Sweden, Switzer-land and the United Kingdom--so there was aperceptible tendency for rates to converge in the 17-19per thousand range.
Death rates also showed a general downwardmovement, most noticeable in countries in which theyhad exceeded 10 per thousand in the early 1950s--France, Ireland, Portugal, Spain, Turkey andYugoslavia, for example--but also in Australia,Canada, Japan and New Zealand, where the rate fellto around 8 per thousand. The result was a markednarrowing in the range of rates of natural increase--a reduction in the high rates (Australia, Canada,Finland, Japan, Greece, the Netherlands, the UnitedStates and Yugoslavia) and an increase in the low rates(Austria, the Federal Republic of Germany, Luxem-bourg, Switzerland and the United Kingdom). Theaverage rate of natural increase for the developedmarket economies as a group declined to about 10 perthousand.
On the whole, the rate of population growth has notbeen a matter of widespread concern in the developedmarket economies; much more importance has beenattached to the absolute size of the population and itsdistribution in relation to available resources andfacilities. This emphasis reflects the fact that the endof the Second World War found most of thesecountries with infrastructure under great strain:destruction, obsolescence and lack of investment hadleft the stock of housing, public buildings, transportequipment and other overhead capital severely depleted.With population growing at not much more than 1 percent a year, the incremental problem paled intoinsignificance before that of over-all population/facilities imbalance. And when the backlog had beenlargely overcome, concern about the populationgrowth rate was related more to the question ofmaintaining a 4-5 per cent per annum increase in theproduction of goods and services in the face of a 1 percent increase in the labour force. While anxiety overthe impact of large numbers on the natural environmentmounted in the 1960s, it left attitudes to populationgrowth rate surprisingly ambivalent.
Measures tending to increase fertility were asfrequent as those tending to reduce it. Among the
former were major improvements in maternal andchild care services, tax allowances based on family sizeand the removal of discrimination--in housing oremployment--against large families. In general,improvements in the housing situation have tended tostimulate family formation, as indeed have thegenerally high levels of employment that have prevailedin the post-war period. Common countervailing policiesinclude the extension of sex education, birth controland family planning services, regularizing--and gener-ally liberalizing--laws and arrangements regardingabortion, the raising of the school leaving age and theminimum age for marriage, the reduction in discrimi-nation against women in education and employment,and the provision of day care facilities for the childrenof working mothers.
Intellectual and even popular opinion seems to haveveered towards lower population growth rates. In1969, the Advisory Council on Population Problemsin Japan (Jinko Mondai Shingiokai) was the firstto recommend a policy of zero growth, and in 1972a specially appointed Commission (on PopulationGrowth and the American Future) came to the sameconclusion in the United States. But official endorse-ment has not been forthcoming and although thesentiment has been for lower growth not only in theUnited States 8 but also in the Netherlands and theUnited Kingdom, it has tended to favour highergrowth in a number of other countries--France,Greece, Japan and Spain, for example.
In the face of this ambivalent attitude towardspopulation growth from the point of view of domesticconsiderations, the strongest arguments for reducedgrowth have tended to be motivated by concern overglobal resource use. The annual increment in developedmarket economy population at the beginning of the1970s, was about 7.7 million compared with a devel-oping country increment of about 43.2 million. Thoughthe former was thus not much more than a sixth ofthe latter, its implicit claim on natural resources wasvirtually the same (see table 8 and annex table A.37).
The main difference in resource requirements liesin the volume of minerals necessary to sustain a givenpopulation increment in an industrialized economy.Given the present differential growth rate, requirements
8 Public attitudes in the United States have been affected bythe fact that greater difficulty has been experienced there thanin most other developed market economies in absorbing all thenew entrants into the labour force. The emergence in the 1960sof a visible pool of unemployed young people began to influencegovernment thinking about the growth of population. However,the first important official step was not taken until early in 1966,when the Department of Health, Education and Welfareinaugurated a programme of family planning assistance at thelocal level. Research, training and information services in thefamily planning field have been greatly expanded since then.
30
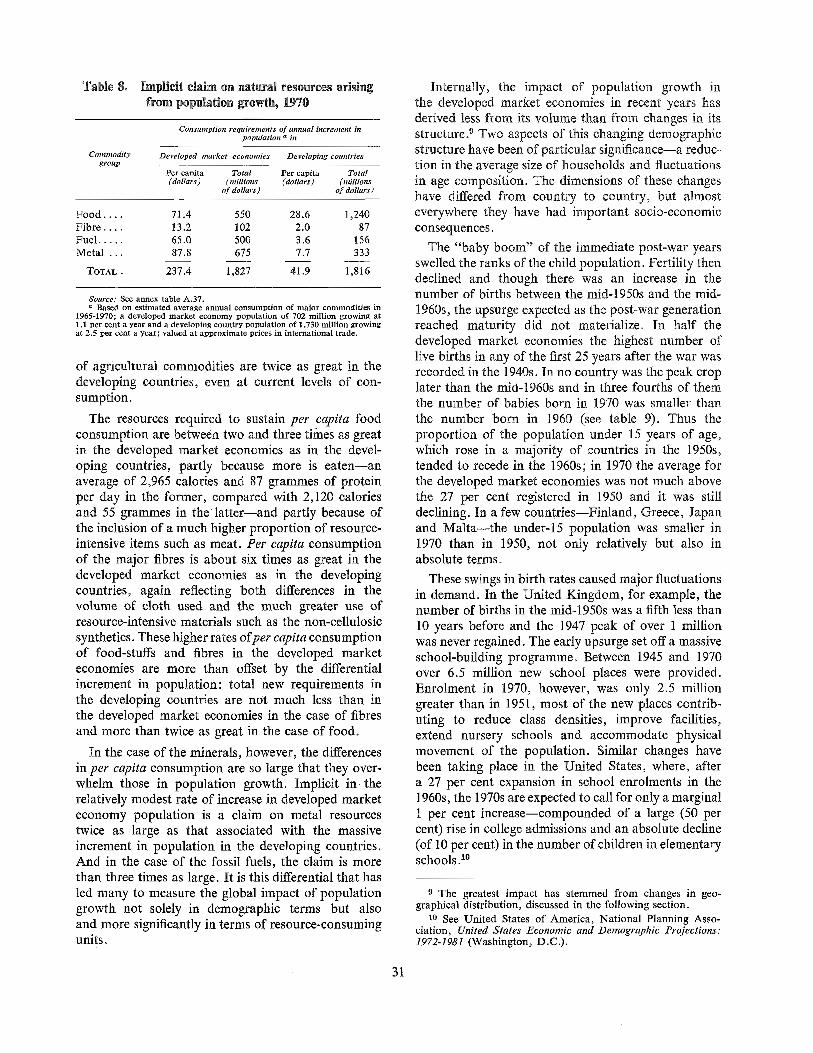
Table 8, Implicit claim on natural resources arisingfrom population growthÿ 1970
Consumption requirements of annual increment inpopulation a in
Commodity Developed market economies Developing countriesgroup
Per capita Total Per capita Total(dollars) (millions (dollars) (millions
of dollars) of dollars)
Food .... 71.4 550 28.6 1,240
Fibre .... 13.2 102 2.0 87
Fuel ..... 65.0 500 3.6 156
Metal ... 87.8 675 7.7 333
TOTAL. 237.4 1,827 41.9 1,816
Source: See annex table A.37.Based on estimated average annual consumption of major commodities in
1965-1970; a developed market economy population of 702 million growing at1.1 per cent a year and a developing country population of 1,730 million growingat 2,5 per cent a year; valued at approximate prices in international trade.
of agricultural commodities are twice as great in thedeveloping countries, even at current levels of con-sumption.
The resources required to sustain per capita foodconsumption are between two and three times as greatin the developed market economies as in the devel-oping countries, partly because more is eaten--anaverage of 2,965 calories and 87 grammes of proteinper day in the former, compared with 2,120 caloriesand 55 grammes in the latter--and partly because ofthe inclusion of a much higher proportion of resource-intensive items such as meat. Per capita consumptionof the major fibres is about six times as great in thedeveloped market economies as in the developingcountries, again reflecting both differences in thevolume of cloth used and the much greater use ofresource-intensive materials such as the non-cellulosic
synthetics. These higher rates of per capita consumptionof food-stuffs and fibres in the developed marketeconomies are more than offset by the differentialincrement in population: total new requirements inthe developing countries are not much less than inthe developed market economies in the case of fibresand more than twice as great in the case of food.
Internally, the impact of population growth inthe developed market economies in recent years hasderived less from its volume than from changes in itsstructure? Two aspects of this changing demographicstructure have been of particular significance--a reduc-tion in the average size of households and fluctuationsin age composition. The dimensions of these changeshave differed from country to country, but almosteverywhere they have had important socio-economicconsequences.
The "baby boom" of the immediate post-war yearsswelled the ranks of the child population. Fertility thendeclined and though there was an increase in thenumber of births between the mid-1950s and the mid-1960s, the upsurge expected as the post-war generationreached maturity did not materialize. In half thedeveloped market economies the highest number oflive births in any of the first 25 years after the war wasrecorded in the 1940s. In no country was the peak croplater than the mid-1960s and in three fourths of themthe number of babies born in 1970 was smaller thanthe number born in 1960 (see table 9). Thus theproportion of the population under 15 years of age,which rose in a majority of countries in the 1950s,tended to recede in the 1960s; in 1970 the average forthe developed market economies was not much abovethe 27 per cent registered in 1950 and it was stilldeclining. In a few countries--Finland, Greece, Japanand Malta--the under-15 population was smaller in1970 than in 1950, not only relatively but also inabsolute terms.
In the case of the minerals, however, the differencesin per capita consumption are so large that they over-whelm those in population growth. Implicit in therelatively modest rate of increase in developed marketeconomy population is a claim on metal resourcestwice as large as that associated with the massiveincrement in population in the developing countries.And in the case of the fossil fuels, the claim is morethan three times as large. It is this differential that hasled many to measure the global impact of populationgrowth not solely in demographic terms but alsoand more significantly in terms of resource-consumingunits.
These swings in birth rates caused major fluctuationsin demand. In the United Kingdom, for example, thenumber of births in the mid-1950s was a fifth less than10 years before and the 1947 peak of over 1 millionwas never regained. The early upsurge set off a massiveschool-building programme. Between 1945 and 1970over 6.5 million new school places were provided.Enrotment in 1970, however, was only 2.5 milliongreater than in 1951, most of the new places contrib-uting to reduce class densities, improve facilities,extend nursery schools and accommodate physicalmovement of the population. Similar changes havebeen taking place in the United States, where, aftera 27 per cent expansion in school enrolments in the1960s, the 1970s are expected to call for only a marginal1 per cent increase--compounded of a large (50 percent) rise in college admissions and an absolute decline(of 10 per cent) in the number of children in elementaryschools .lo
9 The greatest impact has stemmed from changes in geo-graphical distribution, discussed in the following section.
10 See United States of America, National Planning Asso-ciation, United States Economic and Demographic Projections:1972-1981 (Washington, D.C.).
31
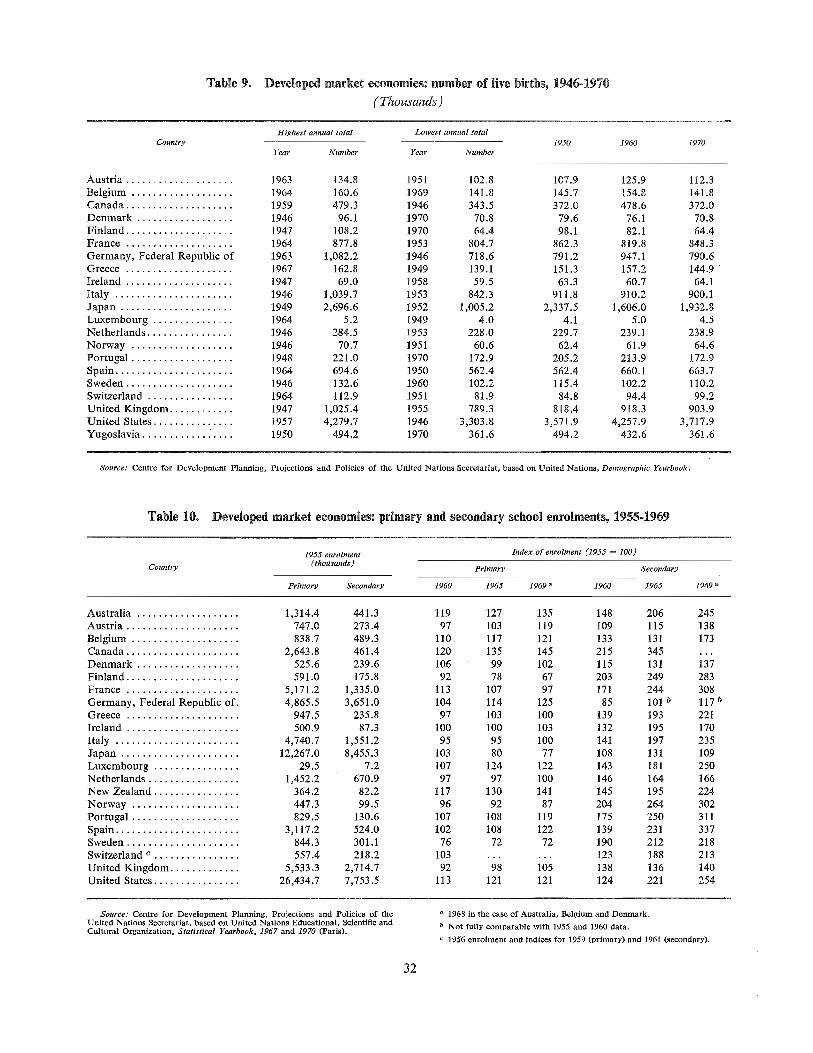
Table 9° Developed market economies: number of live births, 1946ÿ1970
(Thousands)
Highest annual total Lowest annual totalCountry 1950 1960 1970
Year Number Year Number
Austria .................... 1963 134.8 1951 102.8 107.9 125.9 112.3
Belgium ................... 1964 160.6 1969 141.8 145.7 154.8 141.8
Canada .................... 1959 479.3 1946 343.5 372.0 478.6 372.0
Denmark .................. 1946 96.1 1970 70.8 79.6 76.1 70.8
Finland .................... 1947 108.2 1970 64.4 98.1 82.1 64.4
France .................... 1964 877.8 1953 804.7 862.3 819.8 848.3
Germany, Federal Republic of 1963 1,082.2 1946 718.6 791o2 947.1 790.6Greece .................... 1967 162.8 1949 139.1 ! 51.3 157.2 144.9
Ireland .................... 1947 69.0 1958 59.5 63.3 60.7 64.1
Italy ...................... 1946 1,039.7 1953 842.3 911.8 910.2 900.1
Japan ..................... 1949 2,696.6 1952 1,005.2 2,337.5 1,606.0 1,932.8
Luxembourg ............... 1964 5.2 1949 4.0 4.1 5.0 4.5
Netherlands ................ 1946 284.5 1953 228.0 229.7 239. i 238.9
Norway ................... 1946 70.7 1951 60.6 62.4 61.9 64.6
Portugal ................... 1948 221.0 1970 172.9 205.2 213.9 172.9
Spain ...................... 1964 694.6 1950 562.4 562.4 660.1 663.7
Sweden .................... 1946 132.6 1960 102.2 115.4 102.2 110.2
Switzerland ................ 1964 112.9 1951 81.9 84.8 94.4 99.2
United Kingdom ............ 1947 1,025.4 1955 789.3 818.4 918.3 903.9
United States ............... 1957 4,279.7 1946 3,303.8 3,571.9 4,257.9 3,717.9
Yugoslavia ................. 1950 494.2 1970 361.6 494.2 432.6 361.6
Source: Centre for Development Planning, Projections and Policies of the United Nations Secretariat, based on United Nations, Demographic Yearbook,
Table 10. Developed market economies: primary and secondary school enrolments, 1955o1969
Country
1955 enrolment Index o[ enrolment (1955 = 100)(thousands)
Primary Secondary
Primary Secondary 1960 1965 1969 . 1960 1965 1969 a
Australia ................... 1,314.4 441.3
Austria ..................... 747.0 273.4
Belgium .................... 838.7 489.3
Canada ..................... 2,643.8 461.4
Denmark ................... 525.6 239.6
Finland ..................... 591.0 175.8
France ..................... 5,171.2 1,335.0
Germany, Federal Republic of. 4,865.5 3,651.0Greece ..................... 947.5 235.8
Ireland ..................... 500.9 87.3
Italy ....................... 4,740.7 1,551.2
Japan ...................... 12,267.0 8,455.3
Luxembourg ................ 29.5 7.2
Netherlands ................. 1,452.2 670.9
New Zealand ................ 364.2 82.2
Norway .................... 447.3 99.5
Portugal .................... 829.5 130.6
Spain ....................... 3,117.2 524.0
Sweden ..................... 844.3 301.1
Switzerland e ................ 557.4 218.2
United Kingdom ............. 5,533.3 2,714.7
United States ................ 26,434.7 7,753.5
119 127 135 148 206 24597 103 119 109 115 138
110 1!7 121 133 131 173120 135 145 215 345 ...106 99 102 115 131 13792 78 67 203 249 283
113 107 97 171 244 308104 114 125 85 101 b 117 b97 103 100 139 193 221
100 100 103 132 195 17095 95 100 141 197 235
103 80 77 108 131 109107 124 122 143 181 25097 97 100 146 164 166
tt7 130 141 145 195 22496 92 87 204 264 302
107 108 119 175 250 311102 108 122 139 231 33776 72 72 190 212 218103 ...... 123 188 213
92 98 105 138 136 140113 121 121 124 221 254
Source: Centre for Development Planning, Projections and Policies of theUnited Nations Secretariat, based on United Nations Educational, Scientific andCultural Organization, Statistical Yearbook, 1967 and 1970 (Paris).
a 1968 in the case of Australia, Belgium and Denmark.
b Not fully comparable with 1955 and 1960 data.
c 1956 enrolment and indices for 1959 (primary) and 1961 (secondary).
32
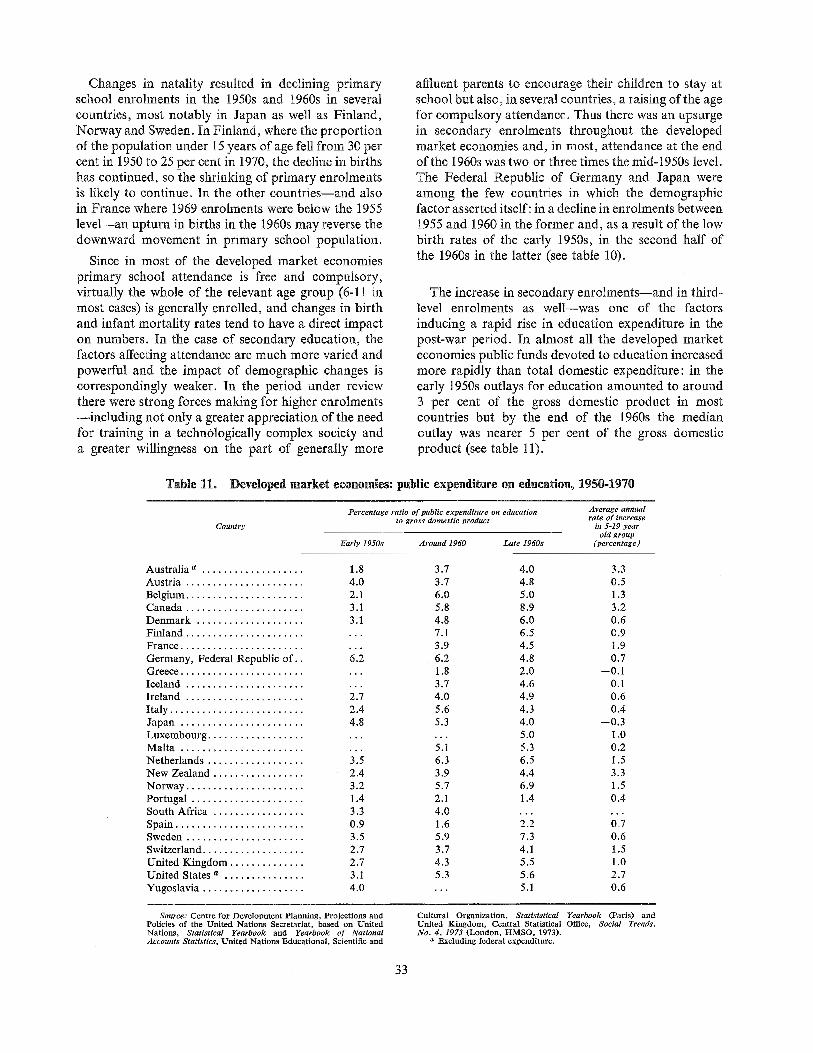
Changes in natality resulted in declining primaryschool enrolments in the 1950s and 1960s in severalcountries, most notably in Japan as well as Finland,Norway and Sweden. In Finland, where the proportionof the population under 15 years of age fell from 30 percent in 1950 to 25 per cent in 1970, the decline in birthshas continued, so the shrinking of primary enrolmentsis likely to continue. In the other countries--and alsoin France where t969 enrolments were below the 1955level-an upturn in births in the 1960s may reverse thedownward movement in primary school population.
Since in most of the developed market economiesprimary school attendance is free and compulsory,virtually the whole of the relevant age group (6-11 inmost cases) is generally enrolled, and changes in birthand infant mortality rates tend to have a direct impacton numbers. In the case of secondary education, thefactors affecting attendance are much more varied andpowerful and the impact of demographic changes iscorrespondingly weaker. In the period under reviewthere were strong forces making for higher enrolments--including not only a greater appreciation of the needfor training in a technologically complex society anda greater willingness on the part of generally more
affluent parents to encourage their children to stay atschool but also, in several countries, a raising of the agefor compulsory attendance. Thus there was an upsurgein secondary enrolments throughout the developedmarket economies and, in most, attendance at the endof the 1960s was two or three times the mid-1950s level.The Federal Republic of Germany and Japan wereamong the few countries in which the demographicfactor asserted itself: in a decline in enrolments between1955 and 1960 in the former and, as a result of the lowbirth rates of the early 1950s, in the second half ofthe 1960s in the latter (see table 10).
The increase in secondary enrolments--and in third-level enrolments as well--was one of the factorsinducing a rapid rise in education expenditure in thepost-war period. In almost all the developed marketeconomies public funds devoted to education increasedmore rapidly than total domestic expenditure: in theearly 1950s outlays for education amounted to around3 per cent of the gross domestic product in mostcountries but by the end of the 1960s the medianoutlay was nearer 5 per cent of the gross domesticproduct (see table 11).
Table 1L Developed market economies: public expenditure on education, 1950-1970
Country
Percentage ratio of public expenditure on educationto gross domestic product
Early 1950s Around 1960 Late 1960s
Average attmtalrate of increase
in 5-19 yearold group
(percentage)
Australia a ................... 1.8
Austria ...................... 4.0
Belgium ...................... 2.1
Canada ...................... 3.1
Denmark .................... 3.1
Finland .........................
France ..........................
Germany, Federal Republic of.. 6.2Greece ..........................
Iceland .........................
Ireland ...................... 2.7
Italy ......................... 2.4
Japan ....................... 4.8
Luxembourg .....................
Malta ..........................
Netherlands .................. 3.5
New Zealand ................. 2.4
Norway ...................... 3.2
Portugal ..................... 1.4
South Africa ................. 3.3
Spain ........................ 0.9
Sweden ...................... 3.5
Switzerland ................... 2.7
United Kingdom .............. 2.7
United States a ............... 3.1
Yugoslavia ................... 4.0
3.7 4.0 3.3
3.7 4.8 0.5
6.0 5.0 1.3
5.8 8.9 3.2
4.8 6.0 0.6
7.1 6.5 0.9
3.9 4.5 1.9
6.2 4.8 0.7
1.8 2.0 --0.1
3.7 4.6 0.1
4.0 4.9 0.6
5.6 4.3 0.4
5.3 4.0 --0.3
... 5.0 1.0
5.1 5.3 0.2
6.3 6.5 1.5
3.9 4.4 3.3
5.7 6.9 1.5
2.1 1.4 0.4
4.0 ......
1.6 2.2 0.7
5.9 7.3 0.6
3.7 4.1 1.5
4.3 5.5 1.0
5.3 5.6 2.7
... 5.1 0.6
Source: Centre for Development Planning, Projections andPolicies of the United Nations Secretariat, based on UnitedNations, Statistical Yearbook and Yearbook of NationalAccounts Statistics, United Nations Educational, Scientific and
Cultural Organization, Statisistlcal Yearbook (Paris) andUnited Kingdom, Central Statistical Office, Social Trends,No. 4, 1973 (London, tIMSO, 1973).
a Excluding federal expenditure.
33
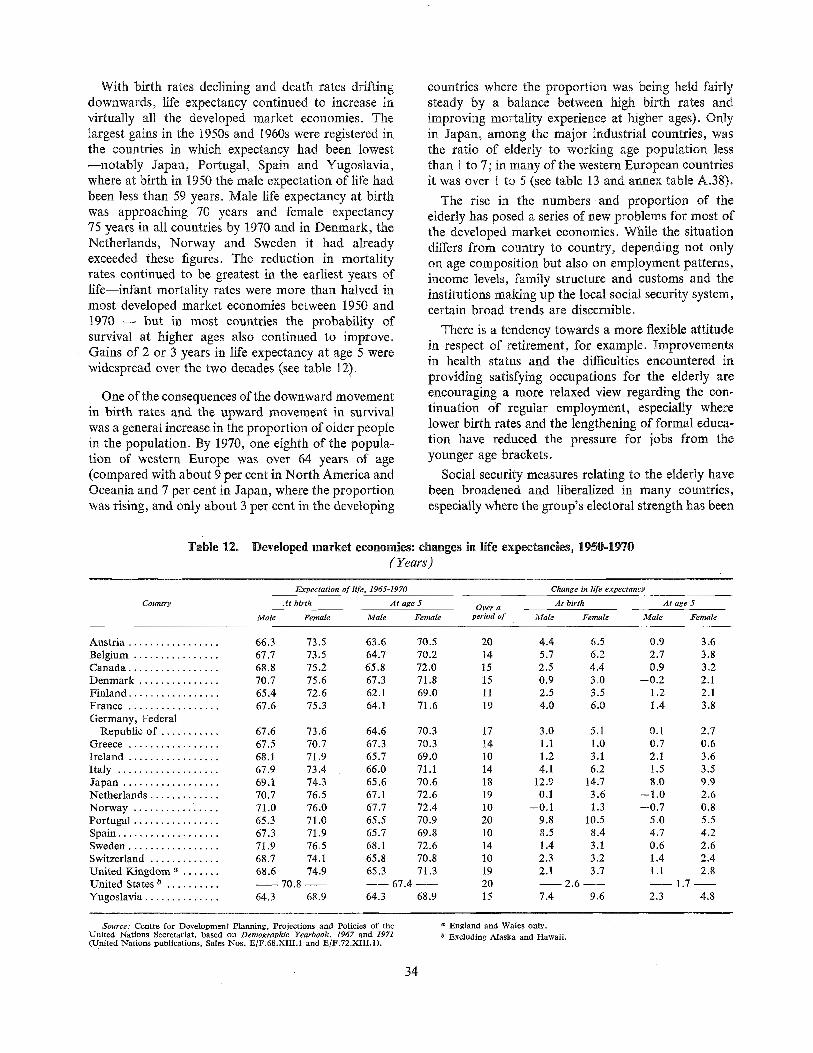
With birth rates declining and death rates driftingdownwards, life expectancy continued to increase invirtually all the developed market economies. Thelargest gains in the 1950s and 1960s were registered inthe countries in which expectancy had been lowest--notably Japan, Portugal, Spain and Yugoslavia,where at birth in 1950 the male expectation of life hadbeen less than 59 years. Male life expectancy at birthwas approaching 70 years and female expectancy75 years in all countries by 1970 and in Denmark, theNetherlands, Norway and Sweden it had alreadyexceeded these figures. The reduction in mortalityrates continued to be greatest in the earliest years oflife--infant mortality rates were more than halved inmost developed market economies between 1950 and1970 -- but in most countries the probability ofsurvival at higher ages also continued to improve.Gains of 2 or 3 years in life expectancy at age 5 werewidespread over the two decades (see table 12).
countries where the proportion was being held fairlysteady by a balance between high birth rates andimproving mortality experience at higher ages). Onlyin Japan, among the major industrial countries, wasthe ratio of elderly to working age population lessthan 1 to 7; in many of the western European countriesit was over 1 to 5 (see table 13 and annex table A.38).
The rise in the numbers and proportion of theelderly has posed a series of new problems for most ofthe developed market economies. While the situationdiffers from country to country, depending not onlyon age composition but also on employment patterns,income levels, family structure and customs and theinstitutions making up the local social security system,certain broad trends are discernible.
One of the consequences of the downward movementin birth rates and the upward movement in survivalwas a general increase in the proportion of older peoplein the population. By 1970, one eighth of the popula-tion of western Europe was over 64 years of age(compared with about 9 per cent in North America andOceania and 7 per cent in Japan, where the proportionwas rising, and only about 3 per cent in the developing
There is a tendency towards a more flexible attitudein respect of retirement, for example. Improvementsin health status and the difficulties encountered inproviding satisfying occupations for the elderly areencouraging a more relaxed view regarding the con-tinuation of regular employment, especially wherelower birth rates and the lengthening of formal educa-tion have reduced the pressure for jobs from theyounger age brackets.
Social security measures relating to the elderly havebeen broadened and liberalized in many countries,especially where the group's electoral strength has been
Table 12. Developed market economies: changes in llfe expectanclesÿ 1950o1970(Years)
Expectation of life, 1965-1970
Country At birth At age 5
Male Female Male Female
Change in life expectancy
At birth At age 5Over aperiod of Male Female Male Female
Austria ................. 66.3
Belgium ................ 67.7
Canada ................. 68.8
Denmark ............... 70.7
Finland ................. 65.4
France ................. 67.6
Germany, FederalRepublic of ........... 67.6
Greece ................. 67.5
Ireland ................. 68.1
Italy ................... 67.9
Japan .................. 69.1
Netherlands ............. 70.7
Norway ................ 71.0
Portugal ................ 65.3
Spain ................... 67.3
Sweden ................. 71.9
Switzerland ............. 68.7
United Kingdom a ....... 68.6
United States b ..........
Yugoslavia .............. 64.3
-- 70.8 ----
73.5 63,6 70.5 20 4,4 6.5 0.9 3.673,5 64.7 70.2 14 5,7 6.2 2.7 3.875.2 65.8 72.0 15 2.5 4.4 0.9 3,275.6 67.3 71.8 15 0.9 3.0 --0.2 2.1
72.6 62.1 69.0 11 2.5 3.5 1.2 2.175.3 64.1 71.6 19 4.0 6.0 1.4 3.8
73,6 64.6 70.3 17 3.0 5.1 0.1 2.770.7 67.3 70.3 14 1.1 1.0 0.7 0.671.9 65.7 69.0 10 1,2 3.1 2.1 3.673.4 66.0 71.1 14 4.1 6.2 ! .5 3.574.3 65.6 70.6 18 12,9 14.7 8.0 9.976.5 67.1 72.6 19 0,1 3.6 --1.0 2.6
76.0 67.7 72.4 10 --0,1 1.3 --0.7 0.8
71.0 65.5 70.9 20 9,8 10.5 5.0 5.571.9 65.7 69.8 10 8.5 8.4 4.7 4.276.5 68.1 72.6 14 1,4 3.1 0.6 2.674.1 65.8 70.8 10 2,3 3.2 1.4 2.474.9 65.3 71.3 19 2,1 3.7 1.1 2.8
---- 67.4. -- 20 -- 2.6 -- 1.768.9 64.3 68.9 15 7,4 9.6 2.3 4,8
Source." Centre for Development Planning, Projections and Policies of theUnited Nations Secretariat, based on Demographic Yearbook, 1967 and 1971(United Nations publications, Sales Nos. E/F.68.XIII.1 and E/F.72.XIlI.1).
a England and Wales only.Excluding Alaska and Hawaii.
34
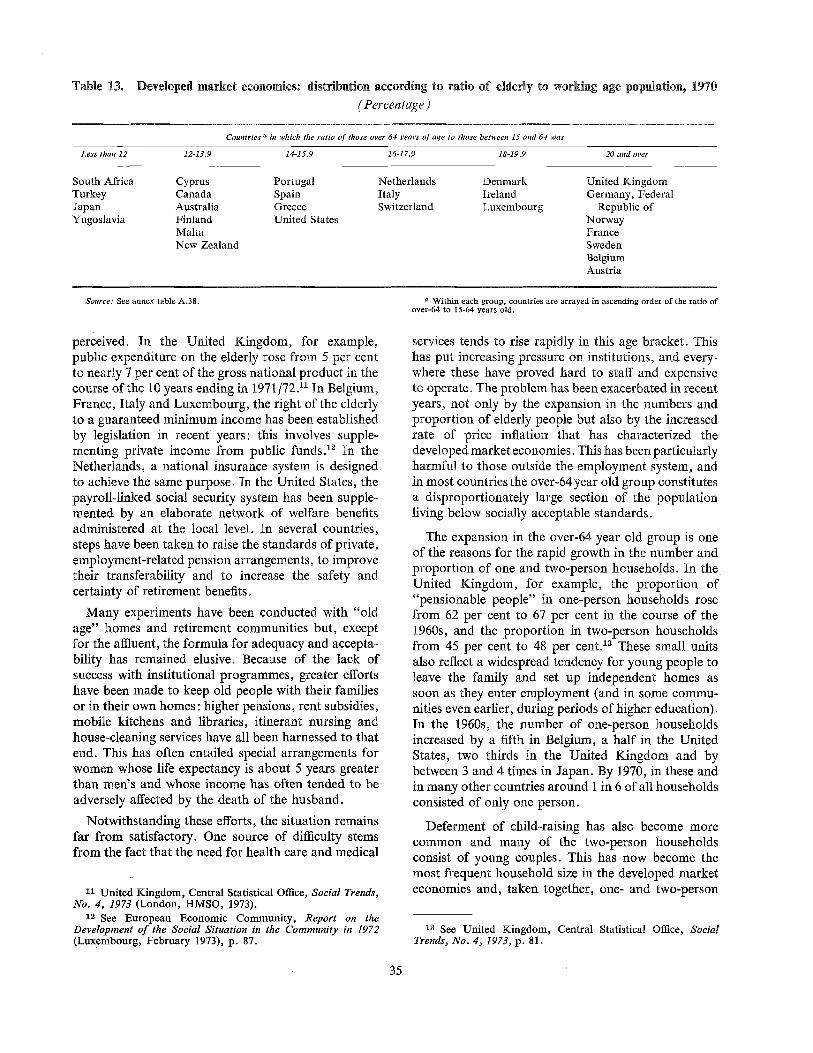
Table 13. Developed market economies: distribution according to ratio of elderly to working age population, 1970
(Percentage)
Countries ÿ in which the ratio of those over 64 years of age to those between 15 attd 64 was
Less than 12 12-13.9 14-15.9 16-17.9 18-19.9 20 and over
South Africa Cyprus Portugal Netherlands Denmark United KingdomTurkey Canada Spain Italy Ireland Germany, FederalJapan Australia Greece Switzerland Luxembourg Republic ofYugoslavia Finland United States Norway
Malta FranceNew Zealand Sweden
BelgiumAustria
Source: See annex table A.38. a Within each group, countries are arrayed in ascending order of the ratio ofover-64 to 15-64 years old.
perceived. In the United Kingdom, for example,public expenditure on the elderly rose from 5 per centto nearly 7 per cent of the gross national product in thecourse of the 10 years ending in 1971/72.11 In Belgium,France, Italy and Luxembourg, the right of the elderlyto a guaranteed minimum income has been establishedby legislation in recent years: this involves supple-menting private income from public funds:2 In theNetherlands, a national insurance system is designedto achieve the same purpose. In the United States, thepayroll-linked social security system has been supple-mented by an elaborate network of welfare benefitsadministered at the local level. In several countries,steps have been taken to raise the standards of private,employment-related pension arrangements, to improvetheir transferability and to increase the safety andcertainty of retirement benefits.
services tends to rise rapidly in this age bracket. Thishas put increasing pressure on institutions, and every-where these have proved hard to staff and expensiveto operate. The problem has been exacerbated in recentyears, not only by the expansion in the numbers andproportion of elderly people but also by the increasedrate of price inflation that has characterized thedeveloped market economies. This has been particularlyharmfu! to those outside the employment system, andin most countries the over-64 year old group constitutesa disproportionately large section of the populationliving below socially acceptable standards.
Notwithstanding these efforts, the situation remainsfar from satisfactory. One source of difficulty stemsfrom the fact that the need for health care and medical
11 United Kingdom, Central Statistical Office, Social Trends,No. 4, 1973 (London, HMSO, 1973).
12 See European Economic Community, Report on theDevelopment of the Social Situation in the Community in 1972(Luxembourg, February 1973), p. 87.
Many experiments have been conducted with "oldage" homes and retirement communities but, exceptfor the affluent, the formula for adequacy and accepta-bility has remained elusive. Because of the lack ofsuccess with institutional programmes, greater effortshave been made to keep old people with their familiesor in their own homes: higher pensions, rent subsidies,mobile kitchens and libraries, itinerant nursing andhouse-cleaning services have all been harnessed to thatend. This has often entailed special arrangements forwomen whose life expectancy is about 5 years greaterthan men's and whose income has often tended to beadversely affected by the death of the husband.
The expansion in the over-64 year old group is oneof the reasons for the rapid growth in the number andproportion of one and two-person households. In theUnited Kingdom, for example, the proportion of"pensionable people" in one-person households rosefrom 62 per cent to 67 per cent in the course of the1960s, and the proportion in two-person householdsfrom 45 per cent to 48 per cent:3 These small unitsalso reflect a widespread tendency for young people toleave the family and set up independent homes assoon as they enter employment (and in some commu-nities even earlier, during periods of higher education).In the 1960s, the number of one-person householdsincreased by a fifth in Belgium, a half in the UnitedStates, two thirds in the United Kingdom and bybetween 3 and 4 times in Japan. By 1970, in these andin many other countries around 1 in 6 of all householdsconsisted of only one person.
Deferment of child-raising has also become morecommon and many of the two-person householdsconsist of young couples. This has now become themost frequent household size in the developed marketeconomies and, taken together, one- and two-person
13 See United Kingdom, Central Statistical Office, SocialTrends, No. 4, 1973, p. 81.
35
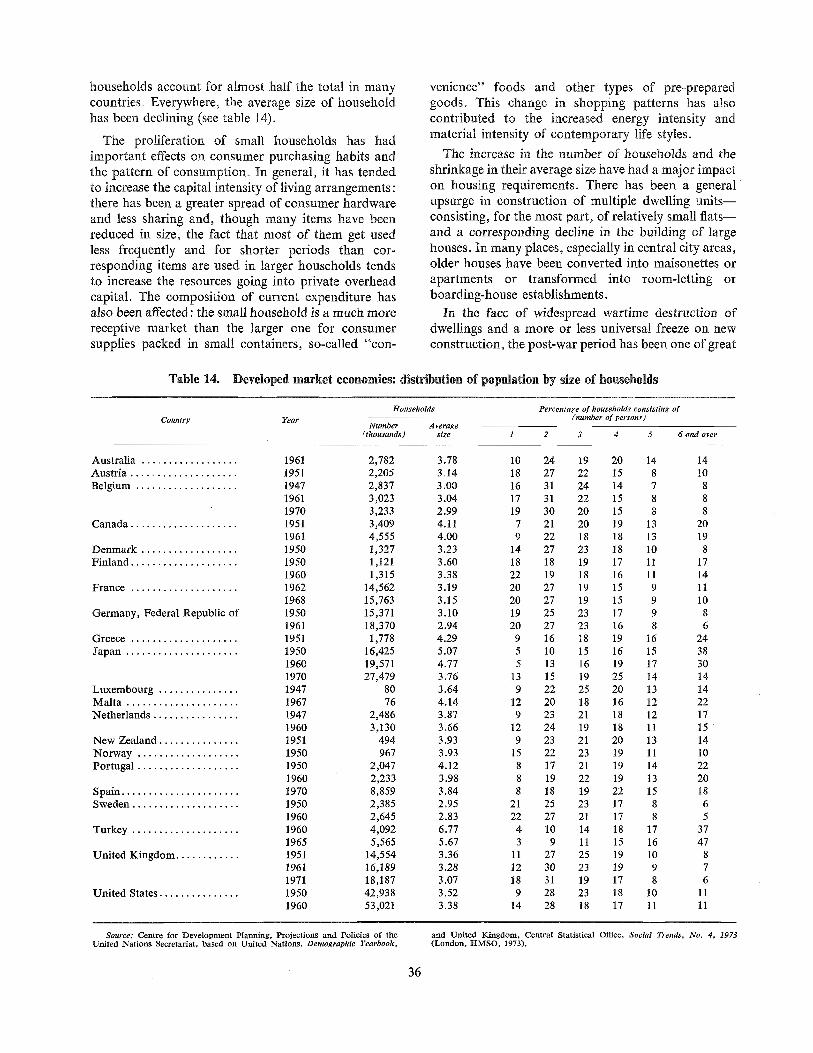
households account for almost half the total in manycountries. Everywhere, the average size of householdhas been declining (see table 14).
The proliferation of small households has hadimportant effects on consumer purchasing habits andthe pattern of consumption. In general, it has tendedto increase the capital intensity of living arrangements:there has been a greater spread of consumer hardwareand less sharing and, though many items have beenreduced in size, the fact that most of them get usedless frequently and for shorter periods than cor-responding items are used in larger households tendsto increase the resources going into private overheadcapital. The composition of current expenditure hasalso been affected: the small household is a much morereceptive market than the larger one for consumersupplies packed in small containers, so-called "con-
venience" foods and other types of pre-preparedgoods. This change in shopping patterns has alsocontributed to the increased energy intensity andmaterial intensity of contemporary life styles.
The increase in the number of households and theshrinkage in their average size have had a major impacton housing requirements. There has been a generalupsurge in construction of multiple dwelling units--consisting, for the most part, of relatively small flats--and a corresponding decline in the building of largehouses. In many places, especially in central city areas,older houses have been converted into maisonettes orapartments or transformed into room-letting orboarding-house establishments.
In the face of widespread wartime destruction ofdwellings and a more or less universal freeze on newconstruction, the post-war period has been one of great
Table 14. Developed market economies: distribution of population by size of households
Households Percentage of households consisting ofCountry Year (number of persons)
Number Average(thousands) size 1 2 3 4 5 6 and over
Australia ..................
Austria ....................
Belgium ...................
Canada ....................
Denmark ..................
Finland ....................
France ....................
Germany, Federal Republic of
Greece ....................
Japan .....................
Luxembourg ...............
Malta .....................
Netherlands ................
New Zealand ...............
Norway ...................
Portugal ...................
Spain ......................
Sweden ....................
Turkey ....................
United Kingdom ............
United States ...............
1961 2,782 3.78 10 24 19 20 14 141951 2,205 3.14 18 27 22 15 8 101947 2,837 3.00 16 31 24 14 7 81961 3,023 3.04 17 31 22 15 8 81970 3,233 2.99 19 30 20 15 8 81951 3,409 4.11 7 21 20 19 13 201961 4,555 4.00 9 22 18 18 13 191950 1,327 3.23 14 27 23 18 10 81950 1,121 3.60 18 18 19 17 I1 171960 1,315 3.38 22 19 18 16 11 141962 14,562 3.19 20 27 19 15 9 111968 15,763 3.15 20 27 19 15 9 101950 15,371 3.10 19 25 23 17 9 81961 18,370 2.94 20 27 23 16 8 61951 1,778 4.29 9 16 18 19 16 241950 16,425 5.07 5 10 15 16 15 381960 19,571 4.77 5 13 16 19 17 301970 27,479 3.76 13 15 19 25 14 141947 80 3.64 9 22 25 20 13 141967 76 4.14 12 20 18 16 12 221947 2,486 3.87 9 23 21 18 12 17t960 3,130 3.66 12 24 19 18 11 151951 494 3.93 9 23 21 20 13 141950 967 3.93 15 22 23 19 11 101950 2,047 4.12 8 17 21 19 14 221960 2,233 3.98 8 19 22 19 13 201970 8,859 3.84 8 18 19 22 15 181950 2,385 2.95 21 25 23 17 8 61960 2,645 2.83 22 27 21 17 8 51960 4,092 6.77 4 10 14 18 17 371965 5,565 5.67 3 9 11 15 16 471951 14,554 3.36 11 27 25 19 10 81961 16,189 3.28 12 30 23 19 9 71971 18,187 3.07 18 31 19 17 8 61950 42,938 3.52 9 28 23 18 10 111960 53,021 3.38 14 28 18 17 11 11
Source: Centre for Development Planning, Projections and Policies of theUnited Nations Secretariat, based on United Nations, Demographic Yearbook,
and United Kingdom, Central Statistical Office, Social Trends. No. 4, 1973(London, ItMSO, 1973).
36
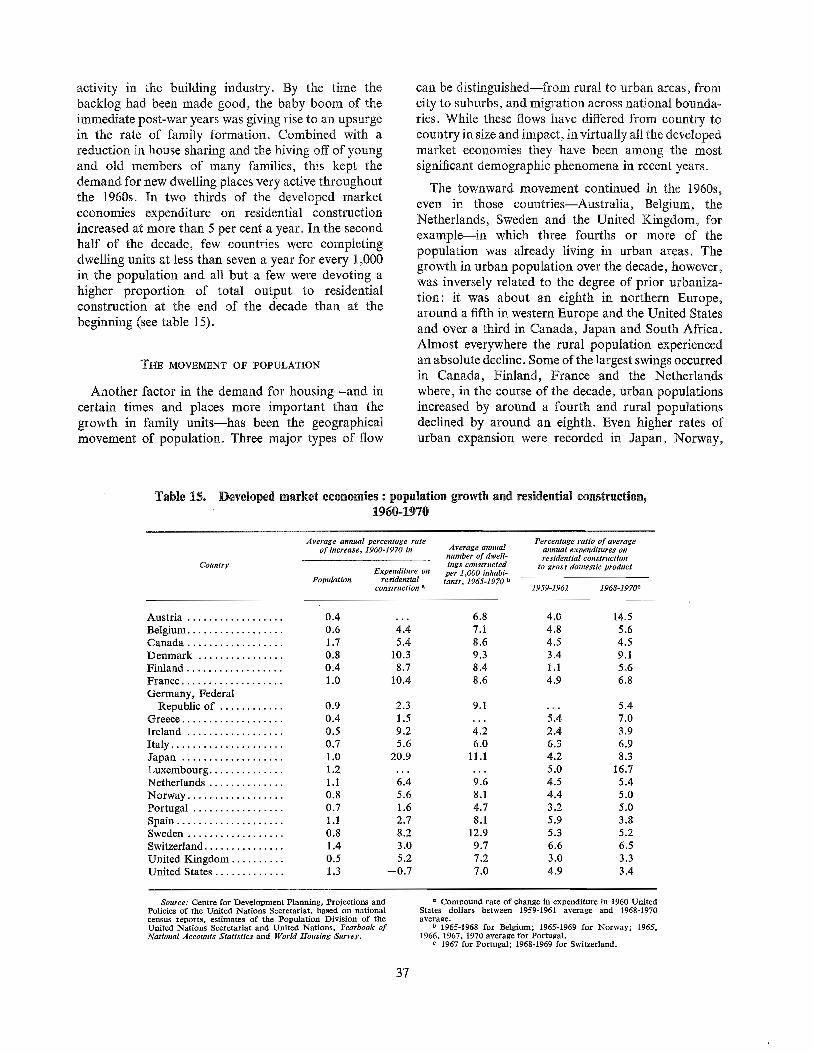
activity in the building industry. By the time thebacklog had been made good, the baby boom of theimmediate post-war years was giving rise to an upsurgein the rate of family formation. Combined with areduction in house sharing and the hiving off of youngand old members of many families, this kept thedemand for new dwelling places very active throughoutthe 1960s. In two thirds of the developed marketeconomies expenditure on residential constructionincreased at more than 5 per cent a year. In the secondhalf of the decade, few countries were completingdwelling units at less than seven a year for every 1,000in the population and all but a few were devoting ahigher proportion of total output to residentialconstruction at the end of the decade than at thebeginning (see table 15).
can be distinguished--from rural to urban areas, fromcity to suburbs, and migration across national bounda-ries. While these flows have differed from country tocountry in size and impact, in virtually all the developedmarket economies they have been among the mostsignificant demographic phenomena in recent years.
THE MOVEMENT OF POPULATION
Another factor in the demand for housing--and incertain times and places more important than thegrowth in family units--has been the geographicalmovement of population. Three major types of flow
The townward movement continued in the 1960s,even in those countries--Australia, Belgium, theNetherlands, Sweden and the United Kingdom, forexample--in which three fourths or more of thepopulation was already living in urban areas. Thegrowth in urban population over the decade, however,was inversely related to the degree of prior urbaniza-tion: it was about an eighth in northern Europe,around a fifth in western Europe and the United Statesand over a third in Canada, Japan and South Africa.Almost everywhere the rural population experiencedan absolute decline. Some of the largest swings occurredin Canada, Finland, France and the Netherlandswhere, in the course of the decade, urban populationsincreased by around a fourth and rural populationsdeclined by around an eighth. Even higher rates ofurban expansion were recorded in Japan, Norway,
Table 15. Developed market economies : population growth and residential construction,1960-1970
Country
Average annual percentage rateof increase, 1960-1970 In Average annual
number of dwell-ings constructed
Expenditure on per 1,000 inhabi-Population residential rants, 1965-1970 b
construction a
Percentage ratio of averageannual expendltnres onresidential construction
to gross domestic product
1959-1961 1968-1970o
Austria .................. 0.4 ...
Belgium .................. 0.6 4.4
Canada .................. 1.7 5.4
Denmark ................ 0.8 10.3
Finland .................. 0.4 8.7
France ................... 1.0 10.4
Germany, FederalRepublic of ............ 0.9 2.3
Greece ................... 0.4 1.5
Ireland .................. 0.5 9.2
Italy ..................... 0.7 5.6
Japan ................... 1.0 20.9
Luxembourg .............. 1.2 ...
Netherlands .............. 1.1 6.4
Norway .................. 0.8 5.6
Portugal ................. 0.7 1.6
Spain .................... 1.1 2.7
Sweden .................. 0.8 8.2
Switzerland ............... 1.4 3.0
United Kingdom .......... 0.5 5.2
United States ............. 1.3 --0.7
6.8 4.0 14.57.1 4.8 5.68.6 4.5 4.5
9,3 3.4 9.1
8.4 1.1 5.68.6 4.9 6.8
9.1 ... 5.4
... 5.4 7,0
4.2 2.4 3.9
6.0 6.3 6.9
11.1 4.2 8.3.., 5.0 16.7
9.6 4.5 5.4
8.1 4.4 5.0
4.7 3.2 5.0
8.1 5.9 3.8
12.9 5.3 5.29.7 6.6 6.5
7.2 3.0 3.3
7.0 4.9 3.4
Source: Centre for Development Planning, Projections andPolicies of the United Nations Secretariat, based on nationalcensus reports, estimates of the Population Division of theUnited Nations Secretariat and United Nations, Yearbook ofNational Accounts Statistics and Worm Housing Survey.
a Compound rate of change in expenditure in 1960 UnitedStates dollars between 1959-1961 average and 1968-1970average.
b 1965-1968 for Belgium; 1965-1969 for Norway; 1965,1966, 1967, 1970 average for Portugal.
c 1967 for Portugal; 1968-1969 for Switzerland.
37
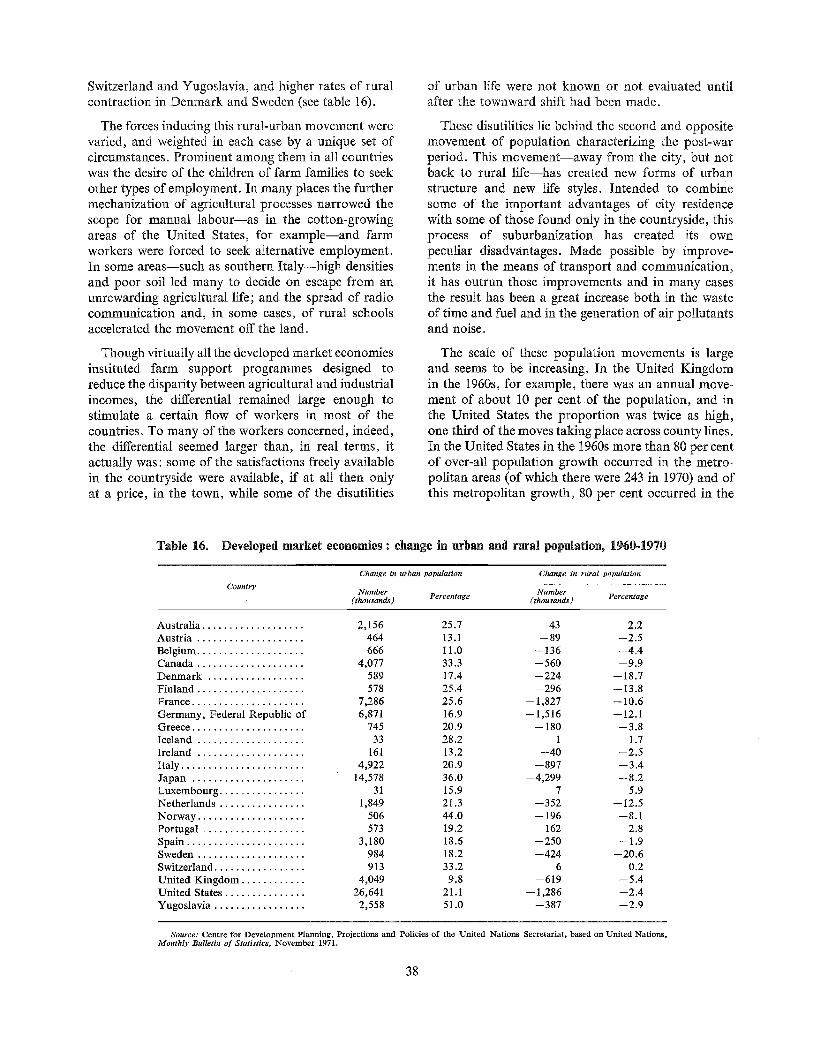
Switzerland and Yugoslavia, and higher rates of ruralcontraction in Denmark and Sweden (see table 16).
of urban life were not known or not evaluated untilafter the townward shift had been made.
The forces inducing this rural-urban movement werevaried, and weighted in each case by a unique set ofcircumstances. Prominent among them in all countrieswas the desire of the children of farm families to seekother types of employment. In many places the furthermechanization of agricultural processes narrowed thescope for manual labour--as in the cotton-growingareas of the United States, for example--and farmworkers were forced to seek alternative employment.In some areas--such as southern Italy--high densitiesand poor soil led many to decide on escape from anunrewarding agricultural life; and the spread of radiocommunication and, in some cases, of rural schoolsaccelerated the movement off the land.
These disutilities lie behind the second and oppositemovement of population characterizing the post-warperiod. This movement--away from the city, but notback to rural life---has created new forms of urbanstructure and new life styles. Intended to combinesome of the important advantages of city residencewith some of those found only in the countryside, thisprocess of suburbanization has created its ownpeculiar disadvantages. Made possible by improve-ments in the means of transport and communication,it has outrun those improvements and in many casesthe result has been a great increase both in the wasteof time and fuel and in the generation of air pollutantsand noise.
Though virtually all the developed market economiesinstituted farm support programmes designed toreduce the disparity between agricultura! and industrialincomes, the differential remained large enough tostimulate a certain flow of workers in most of thecountries. To many of the workers concerned, indeed,the differential seemed larger than, in real terms, itactually was: some of the satisfactions freely availablein the countryside were available, if at all then onlyat a price, in the town, while some of the disutilities
The scale of these population movements is largeand seems to be increasing. In the United Kingdomin the 1960s, for example, there was an annual move-ment of about 10 per cent of the population, and inthe United States the proportion was twice as high,one third of the moves taking place across county lines.In the United States in the 1960s more than 80 per centof over-all population growth occurred in the metro-politan areas (of which there were 243 in 1970) and ofthis metropolitan growth, 80 per cent occurred in the
Table 16. Developed market economies : change in urban and rural population, 1960-1970
Country
Change in urban population Change in rural population
Number Number(thousands) Percentage (thousands) Percentage
Australia ................... 2,156
Austria .................... 464
Belgium .................... 666
Canada .................... 4,077
Denmark .................. 589
Finland .................... 578
France ..................... 7,286
Germany, Federal Republic of 6,871Greece ..................... 745
Iceland .................... 33
Ireland .................... 161
Italy ....................... 4,922
Japan ..................... 14,578
Luxembourg ................ 31
Netherlands ................ 1,849
Norway .................... 506
Portugal ................... 573
Spain ...................... 3,180
Sweden .................... 984
Switzerland ................. 913
United Kingdom ............ 4,049
United States ............... 26,641
Yugoslavia ................. 2,558
25.7 43 2.213.1 --89 --2.5
11.0 --136 --4.4
33.3 --560 --9.9
17.4 -- 224 -- 18.7
25.4 --296 -- 13.8
25.6 --1,827 --10.6
16.9 --1,516 --12.1
20.9 --180 --3.8
28.2 1 1.713.2 --40 --2.5
20.9 --897 --3.4
36.0 --4,299 --8.2
15.9 7 5.921.3 --352 --12.5
44.0 --196 --8.1
19.2 162 2.818.6 --250 --1.9
18.2 --424 --20.6
33.2 6 0.29.8 --619 --5.4
21.1 --1,286 --2.4
51.0 --387 --2.9
Source: Centre for Development Planning, Projections and Policies of the United Nations Secretariat, based on United Nations,Monthly Bulletin of Statistics, November 1971.
38
suburbs. Thus by 1970, these suburbs housed 76 millionpeople, compared with 64 million in the central citiesand 63 million in the rest of the country.
Illustrative of this flux is the West Midland (Binning-ham) Conurbation in the United Kingdom (popula-tion about 2.4 million): in the five years preceding the1966 census, while 127,000 people moved into thearea and 169,000 moved out, nearly 600,000 movedwithin the area, mostly from the centre towards theperiphery.
In many cases the concurrent inflow and outflow ofpopulation have modified the socio-economic structureof the conurbation. The central city has tended to losebetter-educated and higher-income families to thesuburbs and receive in their place poorer-educated andlover-income families from the countryside. Such amovement resulted in the virtual exchange of over2 million people in New York City in the course of the1950s and 1960s?4 Where transfers of this nature haveoccurred, they have had serious financial implications,simultaneously increasing the claims on city budgetsand shrinldng the tax base from which the requisiterevenue has to be raised. The result has been a wide-spread tendency towards greater dependence on thecentral Government, even where the nominal policyhas been one of decentralization and leaving to thelocal authorities those functions that impinge mostdirectly on the people.
In general, official policy has been to discourageundue concentration of population in metropolitanareas, and to this end zoning and other laws governingthe location of industry, the height of buildings and thedensity of occupation have been used to regulate boththe type of economic activity and the pattern of resi-dential construction. Nowhere, however, have theresults been wholly satisfactory: conflicts among endsand misuse of means have often tended to introduceinconsistencies in government actions and to exposethe fact that the social interest of an urban communityis not necessarily the sum of interests of the individualsconstituting it.
Thus there is often a good deal of competitionbetween local authorities to attract new industrieseven when the population is already in excess Of whatvarious physical and social criteria suggest as optimum
numbers. Steps are often taken to hold down--by fiator by subsidy--urban prices that market forces aretending to push upwards. Along with more accessiblesocial services, this tends to raise the relative attrac-tiveness of the town to potential migrants in the country-side. This differential is often increased by the inabilityof the market to register social costs: this makesrecorded and visible financial costs and prices a poorguide to the real relationship between population andresources in the city, again tending to make it seemmore attractive than it really is?5
Nor is the motive of the individual for moving eitheruniform or simple, or amenable to long-range planning.As suggested above, a prime factor, especially in therural-urban move, is the search for employment. Thisalso motivates much of the intercity movement.Within the urban areas, however, housing needs andsocial services and amenities play a more importantrole. For a particular family, these change over time:as the family grows, house size and neighbourhoodeducational facilities become the main determinants ofmovement and lie behind much of the suburbanizationin many countries. Later in the cycle there is hivingoff and, increasingly, the setting up of one-memberhouseholds, often in the central city, followed byfamily formation and in due course another movetowards the suburbs. As age advances, employmentconsiderations weaken and after retirement weatherand physical surroundings tend to become the domi-nant factors; in many places this has been reflected inmovement to smaller towns.
Though such intertown transfers have increasedmarkedly in recent years, the most mobile groupcontinues to be young adults in the period beforeparenthood. In terms of population distribution,moreover, the movement of this group tends itself tobe disequilibrating: it transfers not merely individualsbut the main force of future demographic growth.Thus the losing area tends to develop a significantlyolder population structure than the gaining area, whichcorrespondingly acquires the source of acceleratedinternal increase.
Regional and urban policies
To slow down this cumulative process, Governmentshave introduced a variety of schemes to stimulateeconomic activity in the regions of actual or potential
14 Between 1950 and 1970 in the United States, the "centralcity" population increased from 52.1 to 61.5 million, that is,by 9.4 million, of which 6.4 million were black and 2.1 millionwhite. The "suburban" population of the metropolitan areasincreased from 36.8 to 68.8 million, that is, by 32 million, ofwhich 30 million were white and only 1.3 million black. Outsidethe metropolitan areas the black population declined marginally(to 6.4 million) while the white population increased from54.2 to 64.7 million. (United States of America, Department ofCommerce, Social Indicators, 1973 (Washington, D.C.).)
15 This is not merely a question of imposing adequatestandards of performance on industry and firmly adopting theprinciple that the polluter must pay. It also involves recognitionof the fact that the relationship between a given environment-cum-infrastructure and a growing population is more likely tobe parabolic than linear. Beyond a certain notional optimumeach additional user unit (population or motor-car or otherspace- and air-consuming asset) entails a progressively higherreal cost on the community.
39
decline. Corresponding to the agricultural supportarrangements referred to above, for example, variousincentives--such as capital grants and accelerateddepreciation--have been offered to encourage invest-ment in new industries in areas in which activity islagging, the population aging, unemployment risingand infrastructure being under-utilized. At the sametime, efforts have been made to prevent the excessiveor over-rapid bnild-up of population in the moreprosperous areas. These include administrative re-structuring of contiguous older areas and the creationof completely new towns.
The administrative changes have generally soughtto give explicit recognition to the essential functionalunity of separate local authorities that have beendrawn together in a conurbation. Illustrative of thisapproach is the Greater London Council (GLC),brought into being in 1963 to consolidate the responsi-bilities of the 90 local authorities that then administeredin a disparate manner what was essentially a singleurban organism. While the land use planning functionrests with GLC, responsibility for public housing,road and amenity maintenance and health and welfareservices has been devolved to 32 borough councils eachdealing with up to a quarter of a million residents.Surrounding Greater London is a so-called "greenbelt" of farms, woodland, cemeteries, playing fieldsand other open space whose genesis goes back to theUnwin Report of 1933 and the Green Belt Act of 1938and now amounting to about 600,000 acres.
52 per cent was in the 15-44 age bracket and 23 percent older) and to the rest of the South East Region,28,500 (of which 53 per cent was over 44 and only27 per cent between 15 and 44).16
A "green belt" surrounding the city at a radius of15-25 kilometres was part of the first Master Plan forTokyo framed by a Capital City Construction Com-mittee soon after the war. The speed of subsequenturbanization and industrialization overtook theseintentions, however, and by 1965, when a revised planwas formulated, the whole area within a 50 kilometresradius of Central Tokyo had to be designated "built-up". Between 1955 and 1970, the population densityof the Tokyo region increased from 587 to 824 persquare kilometre, that of the Chubu (Nagoya) regionfrom 255 to 324, and that of the Kinki (Osaka-Kobe)region from 405 to 530. In the rest of Japan averagedensity declined from 159 to 153 persons per kilometrein this period. In the Osaka-Tokyo megalopolis,industrial districts and dormitory towns have beenwelded together by high-speed rail and road transitsystems. In the face of the high concentration ofpopulation and soaring land prices, emphasis has nowswung towards industrial decentralization: by im-proving infrastructure in other parts of Japan--in-cluding the relatively sparsely populated northernisland of Hokkaido--it is hoped to relieve the pressureon the overcrowded south-east where the physicalquality of life has been visibly deteriorating.
General policy, implemented with varying degree ofintensity, has been to limit population growth withinthe green belt, and this has been achieved: between1951 and 1971 the number of residents declined from8.2 million to 7.4 million. However, this easing ofinternal pressure was bought, in part at least, by arapid (50 per cent) expansion in the population of theOuter Metropolitan Region (from 3.5 million to over5.2 million) and even, to some extent, by the slower(25 per cent) expansion of the remainder of the SouthEast Region (from 3.5 million to over 4.3 million).In Greater London--with its disproportionate shareof young one-member households--the average rateof natural increase during this period was 0.5 per centa year, but the loss from migration was almost twiceas great. In the Outer Metropolitan Region--home ofthe commuter and his family--the gain from naturalincrease averaged 0.75 per cent a year, and this wassupplemented by a migration gain over twice as large.In the rest of the South East Region--with more thanits share of retired people--natural increase averagedonly 0.3 per cent a year but migration gains were threetimes as large. In a typical year in the mid-1960s thenet movement of population from Greater London tothe Outer Metropolitan Area was 65,200 (of which
Another approach to the problems of urbanizingpopulation is exemplified by the "new towns" concept.Designed to avoid the undesirable consequences ofexcessive piecemeal growth of existing urban concen-trations by over-crowding the centre, by peripheralaccretion, or by ribbon development between suchconcentrations, new towns have generally been plannedas more or less self-contained entities with fixedboundaries and a maximum prospective size. In theUnited Kingdom, where the idea was endorsed by theBarlow Commission in 1940 and given institutionallife by the New Towns Act of 1946, no less than 34such towns are in various stages of growth. The 15designated between 1946 and 1955 had an originalpopulation ranging from zero to 25,000 (total 132,000),a target population ranging from 30,000 to 134,000(total 1.1 million) and art actual 1971 populationranging from 24,000 to 85,000 (total 750,000). Manyof those designated more recently, especially since1967, started with much larger populations and five ofthem have target populations in excess of 200,000.
16 See J. B. CuUingworth, Problems of an Urban Society,vol. 1, The Social Framework of Planning (London, Allen andUnwin, 1973), p. 45 ft.
40
The verdict on their operation appears to be a mixedone. On the whole, the planned layout and strictcontrol of land use have yielded a higher physicalquality of life, safer, healthier and pleasanter environ-ments and more efficient organization of civic services.The deficiencies have arisen in part from the homo-geneity of the population and in part from the"artificial" nature of relationships in such syntheticcommunities. The homogeneity characterizes not onlyemployment, income levels and educational andcultural background but also the demographic situa-tion. New towns tend to attract a disproportionatenumber of young couples, appropriate in terms ofplanned short-run employment opportunities butawkward later on when their children mature andgenerate a wave of educational and job requirements.Growth tends to be more balanced and less difficultto cope with in more diversified communities.
a year in the 1960s--second only to the Mediterraneanregion, and 50 per cent above the national average--and by the end of the decade it was approaching10 million. Nevertheless, efforts at decentralization,combined with farm price supports embodied in theCommon Agricultural Policy of EEC, were notwithout some results: the disparity in per capitaproduction between the Paris region (with an incomeof almost $2,700 per person in 1970) and the westernand south-western regions (with an income of about$1,700) had been reduced from 180 per cent to 160 percent in the course of the decade (see table 17).
New towns are also the subject of experiment inFrance, though here they are being designed with lesseconomic autonomy and with closer links to establishedcities. In some cases, indeed, the new settlements aremore in the nature of satellite or dormitory areasaccommodating overspill and relieving overcrowdingin existing towns--such as Caen, Montpellier andToulouse, for example. The main focus of attention,however, has been Paris which has come underincreasing demographic pressure with a twentiethcentury population growth four times as rapid as thatof the country as a whole.
In the Netherlands, regional disparities are muchsmaller. Though they were not reduced in the 1960s--the low-income agricultural north gaining less thanthe national average both in population andper capitaincome--the most heavily populated region, containingthe ring of towns between Amsterdam and Rotterdam,registered the lowest rate of increase. This gain tendedto accrue less to the towns themselves then to the areasbetween them; the suburbanization process, so evidentin the 1950s, was thus continued in the 1960s. Thishas complicated the task of provincial--as againstmunicipal--administration and has greatly increasedthe amount and distance of home-to-work commuting.
To counter this pressure and the resultant inflationof land values, 1958 legislation permitted large areasoutside the city to be purchased and put undermunicipal control for priority development--Zonesurbaniser en prioritd (ZUP). Later (1962) legislationprovided for the freezing of prices in anticipation offurther purchases of land--to be held as a zone fordeferred municipal development--Zones d'amÿnage-ment diff&d (ZAD). And in 1970 a third zone wascreated Zones d'amÿnagement eoncertd (ZAC) forapproved private development. In 1965, a ParisRegional Plan was formulated to provide for thecontinued but controlled growth of the conurbation.Five new towns were envisaged each within 40 kilo-metres of Paris, each with a projected 1985 populationof about a quarter of a million, providing as muchlocal employment as possible--14 jobs per 10 housingunits--but linked, organically as well as physically(by rapid transit), to the metropolis.
In Italy, the movement of population from south tonorth continued in the 1960s though at a somewhatslower pace than earlier. The highest-income regions(Lombardy and the north-west region, embracing theMilan-Genoa-Turin triangle) showed high rates ofpopulation increase--almost twice the national average.The most rapid gain, however, was registered by theLatium region, with the city of Rome, the principalmagnet, passing the 2 million mark by the end of thedecade. Across the peninsula, Abruzzi-Molise was oneof the very few regions in Western Europe to experiencean absolute decline in population in the 1960s. Themovement of population and the official efforts toencourage investment in the south combined to narrowthe income disparity, but in 1970 the industrial northwas still reporting a per capita income twice that ofCampania (Naples) and the area to the south, with apopulation of 11.5 million.
In the of interest better country-wide balance,similar new towns are being developed in conjunctionwith some of the major provincial cities, such as Lille,Lyons, Marseilles and Rouen. Paris has continued toattract, however: its population grew at 1.5 per cent
On a smaller scale, the north south imbalance isevident in Belgium, too. The southern region, hingedaround the Charleroi-Mons axis of declining coalmining, registered a very small increase in populationin the 1960s and dropped sharply below the nationalaverage per capita income. The income gain wasgreatest is the north, in the area dominated by theAntwerp-Ghent industrial conurbation. But the mostrapid expansion in population was in the central(Brabant) region, with Brussels and its suburbsaccounting for more than a million inhabitants by 1970.
41
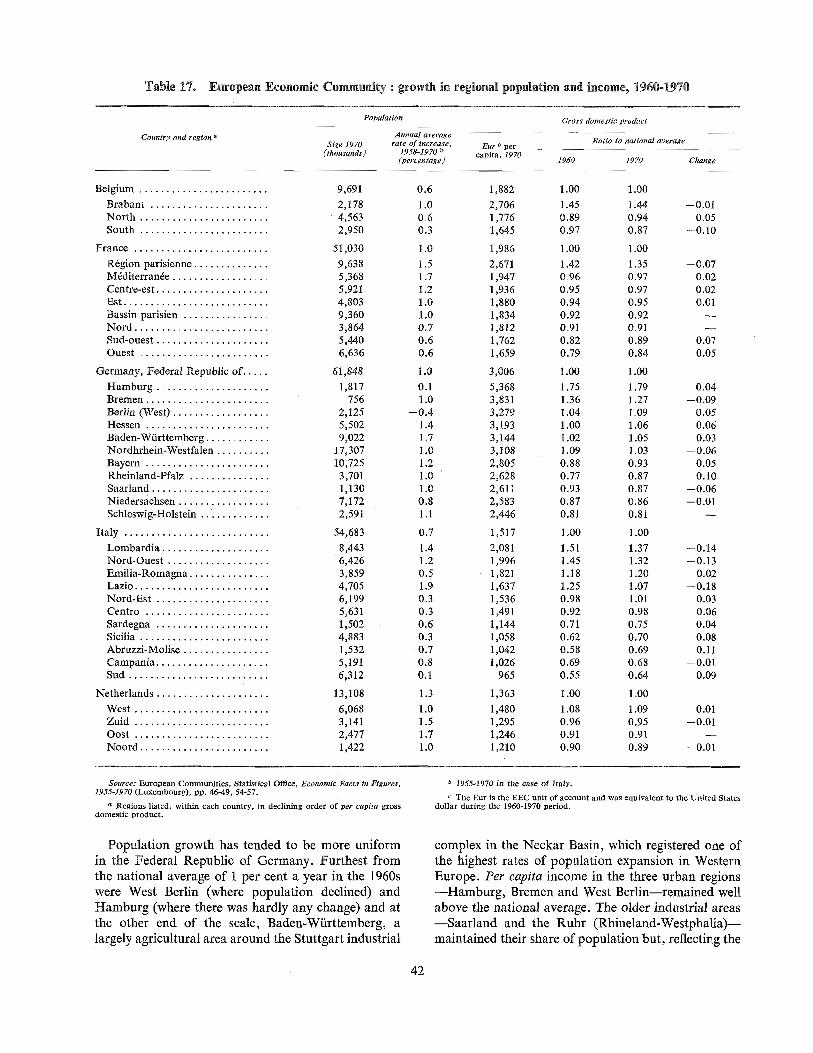
Table 17. European Economic Community : growth in regional population and income, 1960-1970
Population Gross domestic product
Size 1970(thousands)
Country and region ÿ Annualaveragerate ofinctÿase,
1958-1970 b(percentage
Ratio to rtatlonal averageEur c percapita, 1970
1960 1970 Change
Belgium ........................
Brabant ......................
North ........................
South ........................
France .........................
Rdgion parisienne ..............
Mdditerrange ..................
Centre-est .....................
Est ...........................
Bassin parisien ................
Nord .........................
Sud-ouest .....................
Ouest ........................
Germany, Federal Republic of .....
Hamburg .....................
Bremen .......................
Berlin (West) ..................
Hessen .......................
Baden-Wiirttemberg ............
Nordhrhein-Westfalen ..........
Bayern .......................
Rheinland-Pfalz ...............
Saarland ......................
Niedersachsen .................
Schleswig-Holstein .............
Italy ...........................
Lombardia ....................
Nord-Ouest ...................
Emilia-Romagna ...............
Lazio .........................
Nord-Est .....................
Centro ................. i .....
Sardegna .....................
Sicilia ........................
Abruzzi-Molise ................
Campania .....................
Sud ..........................
Netherlands .....................
West .........................
Zuid .........................
Oost .........................
Noord ........................
9,691 0.6
2,178 1.04,563 0.62,950 0.3
51,030 1.09,638 1.55,368 1.75,921 1.24,803 1.09,360 1.03,864 0.75,440 0.66,636 0.6
61,848 1.01,817 0.1
756 1.02,125 --0.4
5,502 1.49,022 1.7
17,307 ] .010,725 1.23,701 1.01,130 1.07,172 0.82,591 1.1
54,683 0.78,443 1.46,426 1.23,859 0.54,705 1.96,199 0.35,631 0.31,502 0.64,883 0.31,532 --0.7
5,191 0.86,312 0.1
13,108 1.36,068 1.03,141 1.52,477 1.71,422 1.0
1,882 1.00 1.00
2,706 1.45 1.44 --0.01
1,776 0.89 0.94 0.051,645 0.97 0.87 --0.10
1,986 1.00 1.00
2,671 1.42 1.35 --0.07
1,947 0.96 0.97 0.021,936 0.95 0.97 0.021,880 0.94 0.95 0.011,834 0.92 0.92 --
1,812 0.91 0.91 --
1,762 0.82 0.89 0.071,659 0.79 0.84 0.05
3,006 1.00 1.00
5,368 1.75 1.79 0.043,831 1.36 1.27 --0.09
3,279 1.04 1.09 0.053,193 1.00 1.06 0.063,144 1.02 1.05 0.033,108 1.09 1.03 --0.06
2,805 0.88 0.93 0.052,628 0.77 0.87 0.102,611 0.93 0.87 --0.06
2,583 0.87 0.86 --0.01
2,446 0.81 0.81 --
1,517 1.00 1.00
2,081 1.51 1.37 --0.14
1,996 1.45 1.32 --0.13
1,821 1.18 1.20 0.021,637 1.25 1.07 --0.18
1,536 0.98 1.01 0.031,491 0.92 0.98 0.061,144 0.71 0.75 0.041,058 0.62 0.70 0.081,042 0.58 0.69 0.111,026 0.69 0.68 --0.01
965 0.55 0.64 0.09
1,363 1.00 1.00
1,480 1.08 1.09 0.011,295 0.96 0.95 --0.01
1,246 0.91 0.911,210 0.90 0.89 --0.01
Source: European Communities, Statistical ONce, Economic Facts in Figures,1955-1970 (Luxembourg), pp. 46-49, 54-57.
Regions listed, within each country, in declining order of per capita grossdomestic product.
b 1955-1970 in the case of Italy.
e The Eur is the EEC unit of account and was equivalent to the United Statesdollar during the 1960-1970 period.
Population growth has tended to be more uniformin the Federal Republic of Germany. Furthest fromthe national average of 1 per cent a year in the 1960swere West Berlin (where population declined) andHamburg (where there was hardly any change) and atthe other end of the scale, Baden-Wiirttemberg, alargely agricultural area around the Stuttgart industrial
complex in the Neckar Basin, which registered one ofthe highest rates of population expansion in WesternEurope. Per capita income in the three urban regions--Hamburg, Bremen and West Berlin--remained wellabove the national average. The older industrial areas--Saarland and the Ruhr (Rhineland-Westphalia)-maintained their share of population but, reflecting the
42
difficulties in coal mining lost ground in per capitaincome.
These population figures represent de facto totals,and therefore include foreign workers enumerated attheir place of employment, rather than de jure in theirhome areas where, in many cases, their families werecounted. Because there is no common definition of a"foreign worker" and because there has been a gooddeal of illegal immigration, the numbers of suchworkers are not known with certainty but the mostauthoritative estimates put the 1972 EEC total at about4.4 million--over 5 per cent of the combined domesticlabour force or, excluding Italy, the source of muchof the flow, almost 8 per cent of the labour force ofthe five host countries, and over !1 per cent of themale labour force.
the economic situation and other circumstances arefavourable, otherwise terminated, though this is notnecessarily followed by return home.is Most are male
and in the younger (under-45) age groups. Most areunaccompanied, though the proportion with familieshas been rising--particularly in France--and thenumber of dependents who subsequently follow themale to his place of work has been increasing.
Migration across national boundaries
This flow, which represents an extension acrossnational boundaries of the rural-urban movementdiscussed earlier in this section, has been institution-alized in the course of the post-war period, both byarrangements and legislation within the Communityand by means of specific labour agreements signedbetween individual Community members and suchcountries as Greece, Spain, Turkey and Yugoslavia,where difficulties were being encountered in providingthe local labour force with suitable employment.Earlier provisions regarding the social security offoreign workers were consolidated by Communityaction in 1959, and during the 1960s most of the rightsof domestic workers were assured to all Communitynationals. By 1968, free movement was guaranteed,subject only to a safeguard clause which reserves theright to restrain immigration to defined Communityprocedures. In 1970 over a million Communitynationals (mostly Italians) were working in otherCommunity countries, half of them in the FederalRepublic of Germany.17
Because of the differences in the demand for Labourbetween the industrialized area of north-west Europeand the peripheral region to the south and east, therehas been a much greater inflow from beyond theCommunity--from the southern tier of Europeancountries and from North Africa. Quite apart fromthe incidence of illegal and unrecorded entries, theproblem of evaluating this movement is complicatedby its state of flux. Few of the migrants intend per-manent residence and some are strictly seasonal,seeking employment in agriculture or tourist-relatedactivities. Many take 12-month contracts, renewed if
In 1969, a year of active movement, about a millionworkers entered the European north-west, a fifth eachfrom Italy and Yugoslavia, an eighth from Turkey,a tenth each from Portugal and Spain, 7 per cent fromGreece and the remaining 15 per cent chiefly fromNorth Africa and the Caribbean area. Two thirds ofthem went to the Federal Republic of Germany andmost of the remainder to France and Switzerland.The number leaving the Federal Republic in 1969 wasabout half of the number arriving, giving a net increaseof about 350,000. Smaller increments, cumulatedthroughout the 1960s, brought the total of residentforeign workers to about 2.3 million by the beginningof the 1970s. A similar cumulation of net inflowsbrought the total in France to about 1.7 million, andto about 0.3 million in the Benelux area (see table 18).
Outside EEC, a number of other European countrieshave become accustomed to similar population move-ments. In Austria there are an estimated 0.2 millionforeign workers--over 6 per Cent of the local labourforce--mostly from Yugoslavia. A similar number offoreigners work in Sweden, coming in this case largelyfrom Finland. Switzerland has become much moredependent on foreign labour: in 1972 there were about0.6 million so-called "permanent" foreign workerswith Swiss domicile or annually renewable permits,constituting over a fifth of the total labour force. Alarge body of permanent foreign workers has also beenbuilt up in the United Kingdom: they have comemainly from the West Indies and Asian members ofthe Commonwealth and by 1972 they were providing7 per cent of the labour force.
The number of dependants associated with theseworkers--sometimes accompanying them on theiroriginal search for employment, sometimes joiningthem later--varies from country to country. The ratiois thought to average only 1 to 5 in the FederalRepublic of Germany and around 1 to 2 in Denmark,the Netherlands and the United Kingdom; but else-where the dependents are beginning to outnumber theworkers in this migrant population and in France theaverage size of the Foreign worker's family is 2.Thus, in the aggregate--including Commonwealth
17 European Communities, The Common Market and theCommon Man (Brussels, June 1972), p. 7.
18 In the case of the Federal Republic of Germany, forexample, almost half the incoming workers remain for five yearsor more and a fourth settle down for "permanent" residence.
43
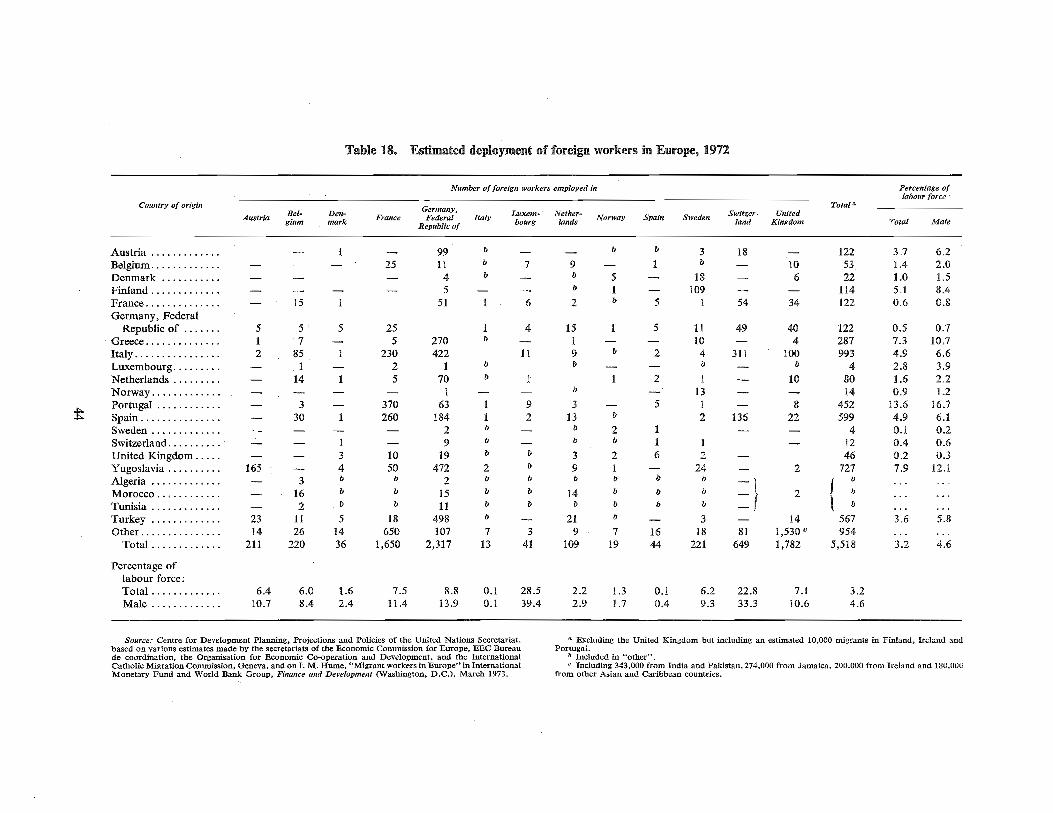
Table 18. Estimated deployment of foreign workers in Europe, 1972
Number of foreign workers employed in Percentage oflabour force
Country of origin
Austria ............. -- 1 -- 99 o
Belgium ............. -- -- 25 11 o
Denmark ........... -- -- -- 4 b
Finland ............. -- -- -- -- 5 --
France .............. -- 15 1 51 1
Germany, FederalRepublic of ....... 5 5 5 25 1
Greece .............. 1 7 -- 5 270 o
Italy ................ 2 85 1 230 422
Luxembourg ......... -- 1 -- 2 1 o
Netherlands ......... -- 14 1 5 70 b
Norway ............. -- -- -- -- 1 --Portugal ............ -- 3 -- 370 63 1
Spain ............... -- 30 1 260 184 1
Sweden ............. -- -- -- -- 2 o
Switzerland .......... - -- -- 1 -- 9
United Kingdom ..... -- -- 3 10 19
Yugoslavia .......... 165 -- 4 50 472 2
Algeria ............. -- 3 b b 2 0
Morocco ............ -- 16 b b 15 0
Tunisia ............. -- 2 b o 11 o
Turkey ............. 23 11 5 18 498 b
Other ............... 14 26 14 650 107 7
Total ............. 211 220 36 1,650 2,317 13
Percentage oflabour force:Total ............. 6.4 6.0 1.6 7.5 8.8 0.1
Male ............. 10.7 8.4 2.4 11.4 13.9 0.1
4ÿ4ÿ
Bel-gium
Den-mark
Germany, Luxem- Nether- Switzer- UnitedFrance Federal Italy bourg lands Norway Spain Sweden land Kingdom
Republic of
_ __ b 0 3 18 -- 122 3.7 6.27 9 -- 1 b __ 10 53 1.4 2.0
__ b 5 -- 18 -- 6 22 1.0 1.5__ 0 1 -- 109 -- -- 114 5.1 8.46 2 b 5 1 54 34 122 0.6 0.8
4 15 1 5 11 49 40 122 0.5 0.7-- 1 -- -- 10 -- 4 287 7.3 10.71! 9 b 2 4 311 100 993 4.9 6.6
o __ __ o __ b 4 2.8 3.91 1 2 I -- 10 80 1.6 2.2
__ b -- 13 -- -- 14 0.9 1.29 3 -- 5 1 -- 8 452 13.6 16.72 13 b 2 136 22 599 4.9 6.1
__ b 2 I -- -- 4 0.1 0.2__ o 0 1 1 -- 12 0.4 0.6
b 3 2 6 2 -- 46 0.2 0.3o 9 1 -- 24 -- 2 727 7.9 12.1o o o ÿ b __ÿ ÿ 0 ......
o 14 o b b --I 2t b ......b ÿ b b b __ b ......
-- 21 0 __ 3 -- 14 567 3.6 5.83 9 7 16 18 81 1,530 e 954 ......
41 109 19 44 221 649 1,782 5,518 3.2 4.6
28.5 2.2 1.3 0.1 6.2 22.8 7.1 3.2
39.4 2.9 1.7 0.4 9.3 33.3 10.6 4.6
Total a
Austria Total Male
Source: Centre for Development Planning, Projections and Policies of the United Nations Secretariat,based on various estimates made by the secretariats of the Economic Commission for Europe, EEC Bureaude coordination, the Organisation for Economic Co-operation and Development, and the InternationalCatholic Migration Commission, Geneva, and on I. M. Hume, "Migrant workers in Europe" in InternationalMonetary Fund and World Bank Group, Finance and Development (Washington, D.C.), March 1973.
a Excluding the United Kingdom but including an estimated 10,000 migrants in Finland, Ireland andPortugal.
b Included in "other".c Including 343,000 from India and Pakistan,274,000 from Jamaica, 200,000 from Ireland and 180,000
from other Asian and Caribbean countries.
immigrants in the United Kingdom--the number offoreign workers in Europe is now approaching8 million and the total migrant population exceeds11 million.
The impact of this population movement has beenmagnified not only by its flux but also by the degreeto which the foreign workers have tended to concen-trate geographically and occupationally. Distinguishedfrom the indigenous population by language andcustoms, and usually lagging in education and skills,they have typically found employment in many of theheavy and menial jobs that the more affluent localworkers tend to avoid. Intent on sending home ortaking back with them as much of their earnings aspossible, they live frugal lives, complicated in manycases by difficulties in obtaining suitable accommoda-tion at rents within their modest means.
Their cultural isolation and abnormal age and sexstructure have made these migrant worker groupsdifficult for the local community to deal with, and astheir size and numbers have grown their degree ofacceptance has diminished. The recent increase in theproportion of family migration and settlement has notimproved relationships, however; indeed, with the sortof problems long experienced in housing now spreadingto education, there seems to have been a generalhardening of attitudes towards immigration. This wasforeshadowed in Switzerland with its large alien popu-lation: in 1970 a referendum on a proposed constitu-tional amendment limiting the proportion of foreignresidents in any canton to 10 per cent of its populationwas only narrowly defeated. In France a new efforthas been launched to reduce illegal immigration andenforce the regulations requiring employers to provideadequate housing for their foreign workers. In 1972the Federal Republic of Germany curtailed indepen-dent immigration by requiring all recruitment offoreign workers to be channelled through the govern-ment labour office. Here too, the obligation onemployers to house their foreign workers is being morestrictly enforced and the recruitment capitation fee hasbeen trebled, to about $400. The Netherlands is alsotrying to discourage new recruitment and to controlthe internal movement and treatment of migrants moreeffectively.
"guest workers" in Europe are not regarded as partof the "brain drain" for very few arrive with parti-cular skills or training 19--disappointment has beenexpressed that they rarely return with new skills thatmight be usefully deployed for development of theeconomy. The greatest contribution of the migrantscomes from their remittances which in the early 1970sreached an annual total of over $2.5 billion. In severa!countries--notably Turkey and Yugoslavia in recentyears--this flow of funds has become a major sourceof foreign exchange receipts. Apart from beinggenerated in hard currency, a migrant's animalearnings--and in many cases even his remittances--are often above the average per capita income level inhis home country. Nevertheless, it is being argued thatthe development process would be better served if,instead of labour migration with all the personal costsand discomforts associated with fringe employment,the requisite capital and technology moved to thesource of labour--as tends to happen in the case ofa depressed or lagging area within one of the moreadvanced countries.
Offsetting the tendency for national policies tobecome more restrictive are projections of continuedlabour shortage in Western Europe, reflecting in partthe low birth rates that have characterized recent yearsand in part the growing reluctance of a better-educatedand higher-income domestic labour force to participatein heavy and repetitive work. Also making for acontinuation of the movement that developed in the1960s is the existence of a now well-established pipelineand a network of recruiting and processing offices tofacilitate the entry and repatriation of new workers,the over-all supply of whom shows few signs ofdrying up.
The very size of the migration in relation to thenatural increase of population would seem to militateagainst a rapid shrinkage. In the period 1950-1970, athird of the total increase in population in WesternEurope came from the excess of immigrants overemigrants. The net gain from migration was over halfthe natural increase in France, two thirds of it inLuxembourg and Switzerland and as much as 80 percent of it in the Federal Republic of Germany (seetable 19).
Signs of disquiet are also surfacing in the countriesfrom which the migrants come. Though there is littleevidence of labour shortage in any of these countries,it is realized that foreign employment has a differentialappeal and misgivings are now being expressedregarding the long-range consequences of the loss--seemingly permanent in an increasing number ofcases--of many of the most vigorous and enterprisingmembers of the population. While, in general, the
The counterpart to the migration gains of WesternEurope were the losses of southern Europe. These
19 French immigration records between 1964 and 1968 showthat only 1 in 5 of incoming workers was classified as skilled(I. M. Hume, op. cit.). The 1971 Yugoslav census indicates thata fourth of departing workers claimed to be "skilled"; thiscorresponds more or less to the ratio for the labour force as awhole.
45

Table 19. Developed market economies : contribution of natural increase and migrationto population growth, 1950-1970
CountryTotal
Iacrease in population (thousands) Ratio of net migrationto population
From From incrementnatural net (percentage)increase migration
Western Europe .................
Austria ......................
Belgium ......................
France .......................
Germany, Federal Republic of..Luxembourg ..................
Netherlands ..................
Switzerland ...................
26,176 17,428 8,748 33.4488 591 --103 --21.1
1,044 833 211 20.29,407 6,149 3,258 34.6
10,732 5,952 4,780 44.555 33 22 40.0
2,863 2,913 --50 --1.7
1,587 957 630 39.7
Northern Europe ................
Denmark ....................
Finland ......................
Ireland ......................
Norway ......................
Sweden ......................
United Kingdom ..............
Southern Europe ................
Greece .......................
Italy .........................
Malta .......................
Portugal .....................
Spain ........................
North America ..................
Canada ......................
United States .................
8,389 9,087 --698 --8.3
675 707 --32 --4.7
703 917 --214 --30.4
--14 544 --558626 636 --10 --1.6
1,026 729 297 28.95,373 5,554 --181 --3.4
14,742 20,761 --6,019 --40.81,326 1,977 --651 --49.1
6,898 8,856 --1,958 --28.4--3 78 --81
1,156 3,108 ,--1,952 --168.9
5,365 6,742 --1,377 --25.7
Oceania ........................
Australia .....................
New Zealand .................
Total change, 22 countries ....... 116,011
61,457 52,759 8,698 14.27,689 5,887 1,802 23.4
53,768 46,872 6,896 12.8
5,247 3,390 1,857 35.44,295 2,583 1,712 39.9
952 807 145 15.2
103,425 12,586 10.8
Source: Centre for Development Plalming, Projections andPolicies of the United Nations Secretariat, based on nationalcensus reports, estimates of the Population Division of the
United Nations Secretariat, "Trends in international migration,1950-1970" (E[CONF.60/CBP/18), and International LabourOffice, Labour Force Proiections, 1965-1985 (Geneva).
outweighed the natural increase in Malta and amountedto a fifth of the natural increase in Italy and Spain, athird in Greece and almost two thirds in Portugal.Finland and Ireland also experienced a sizable outflowof population--the former chiefly to Sweden, the latterchiefly to the United Kingdom. The United Kingdom,notwithstanding a large inflow of immigrants--notonly from Ireland but, as indicated above, also fromthe West Indies and the Indian subcontinent--experi-enced a net loss over the 20 years.
Most of the emigrants from the United Kingdom,and many from continental Europe, went to NorthAmerica or Oceania. In New Zealand and the UnitedStates, around one seventh of over-all population
growth stemmed from migration gains, in Canada,almost a fourth and in Australia, over a third.
The United States was one of the few countries toliberalize immigration rules and procedures in the1960s and as a result the proportion of populationincrease accounted for by immigrants rose in thesecond half of the decade, reaching a fifth in the early1970s, compared with about 9 per cent in the cor-responding period of the 1950s and 1960s. More ofthese immigrants had professional qualifications--about an eighth in 1970, 50 per cent more than 10 yearsearlier--and, with the ending of national quotas in1965, fewer were coming from northern and WesternEurope and more from Asia and Africa.
46

Though some of the immigrants into North Americaand Oceania return home after a relatively short stay,there has been more settlement and permanence in thecase of this movement than in the case of the labourmigrations in Europe. The longer the latter continue,however, and the more prevalent the tendency forthe young male migrant to be accompanied (or laterjoined) by a wife or other dependants, the more likely
it is that the end result will be a permanent populationtransfer. This is already the case in the United King-dom, where the immigration law has been amended inrecognition of the fact, and it reflects the de factosituation in France and Switzerland. The °ÿguestworker" phenomenon of the 1950s and 1960s may beevolving into a more conventional form of populationmovement,
47
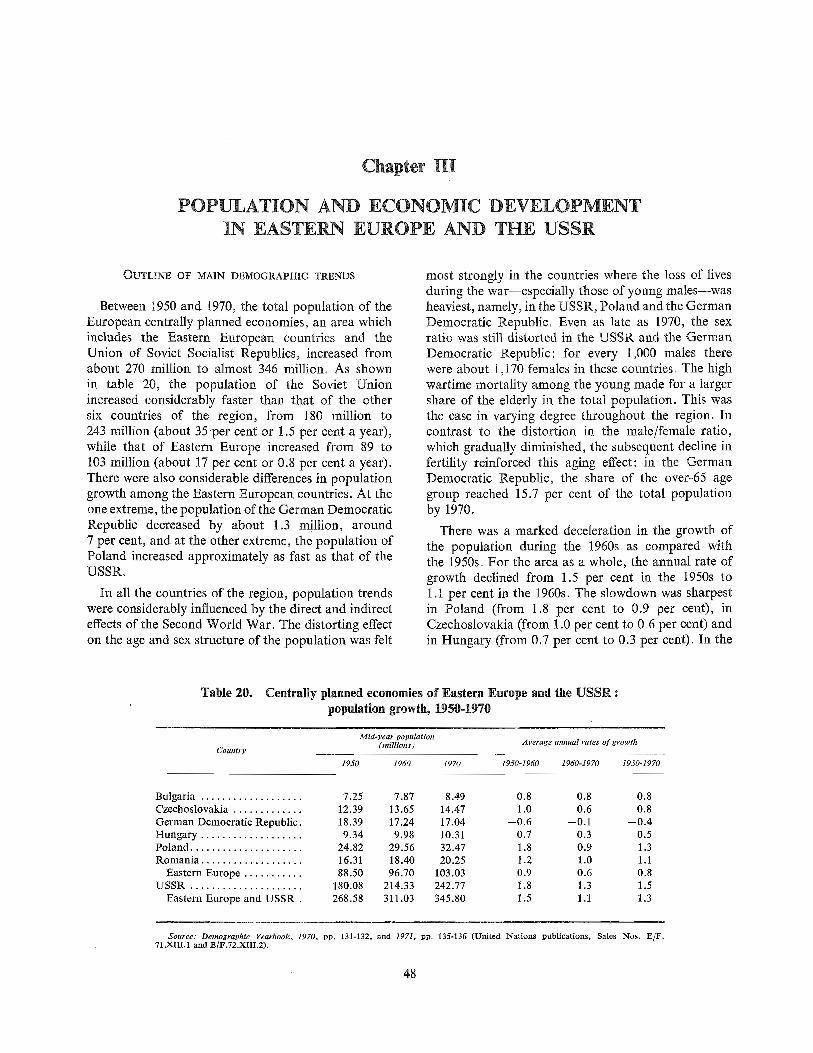
Chapter III
POPULATION AND ECONOMIC DEVELOPMENTIN EASTERN EUROPE AND THE USSR
OUTLINE OF MAIN DEMOGRAPHIC TRENDS
Between 1950 and !970, the total population of theEuropean centrally planned economies, an area whichincludes the Eastern European countries and theUnion of Soviet Socialist Republics, increased fromabout 270 million to almost 346 million. As shownin table 20, the population of the Soviet Unionincreased considerably faster than that of the othersix countries of the region, from 180 million to243 million (about 35 per cent or 1.5 per cent a year),while that of Eastern Europe increased from 89 to103 million (about 17 per cent or 0.8 per cent a year).There were also considerable differences in populationgrowth among the Eastern European countries. At theone extreme, the population of the German DemocraticRepublic decreased by about 1.3 million, around7 per cent, and at the other extreme, the population ofPoland increased approximately as fast as that of theUSSR.
In all the countries of the region, population trendswere considerably influenced by the direct and indirecteffects of the Second World War. The distorting effecton the age and sex structure of the population was felt
most strongly in the countries where the loss of livesduring the war--especially those of young males--washeaviest, namely, in the USSR, Poland and the GermanDemocratic Republic. Even as late as 1970, the sexratio was still distorted in the USSR and the GermanDemocratic Republic: for every 1,000 males therewere about 1,170 females in these countries. The highwartime mortality among the young made for a largershare of the elderly in the total population. This wasthe case in varying degree throughout the region, Incontrast to the distortion in the male/female ratio,which gradually diminished, the subsequent decline infertility reinforced this aging effect: in the GermanDemocratic Republic, the share of the over-65 agegroup reached 15.7 per cent of the total populationby 1970.
There was a marked deceleration in the growth ofthe population during the 1960s as compared withthe 1950s. For the area as a whole, the annual rate ofgrowth declined from 1.5 per cent in the 1950s to1.1 per cent in the 1960s. The slowdown was sharpestin Poland (from 1.8 per cent to 0.9 per cent), inCzechoslovakia (from 1.0 per cent to 0.6 per cent) andin Hungary (from 0.7 per cent to 0.3 per cent). In the
Table 20. Centrally planned economies of Eastern Europe and the USSR :population growth, 1950-1970
Country
Mid-year population(millions) Average annual rates of growth
1950 1960 1970 1950-1960 1960-1970 1950-1970
Bulgaria ................... 7.25 7.87 8.49 0.8 0.8 0.8
Czechoslovakia ............. 12.39 13.65 14.47 1.0 0.6 0.8
German Democratic Republic. 18.39 17.24 17.04 --0.6 --0.1 --0.4
Hungary ................... 9.34 9.98 10.31 0.7 0.3 0.5
Poland ..................... 24.82 29.56 32.47 1.8 0.9 1.3
Romania ................... 16.31 18.40 20.25 1.2 1.0 1.1
Eastern Europe ........... 88.50 96.70 103.03 0.9 0.6 0.8
USSR ..................... 180.08 214.33 242.77 1.8 1.3 1.5
Eastern Europe and USSR . 268.58 311.03 345.80 1.5 1.1 1.3
Source: Demographic Yearbook, 1970, PD. 131-132, and 1971, pp. 135-136 (United Nations publications, Sales Nos. E/F.71.XIII.! and E/F.72.XIII.2).
48
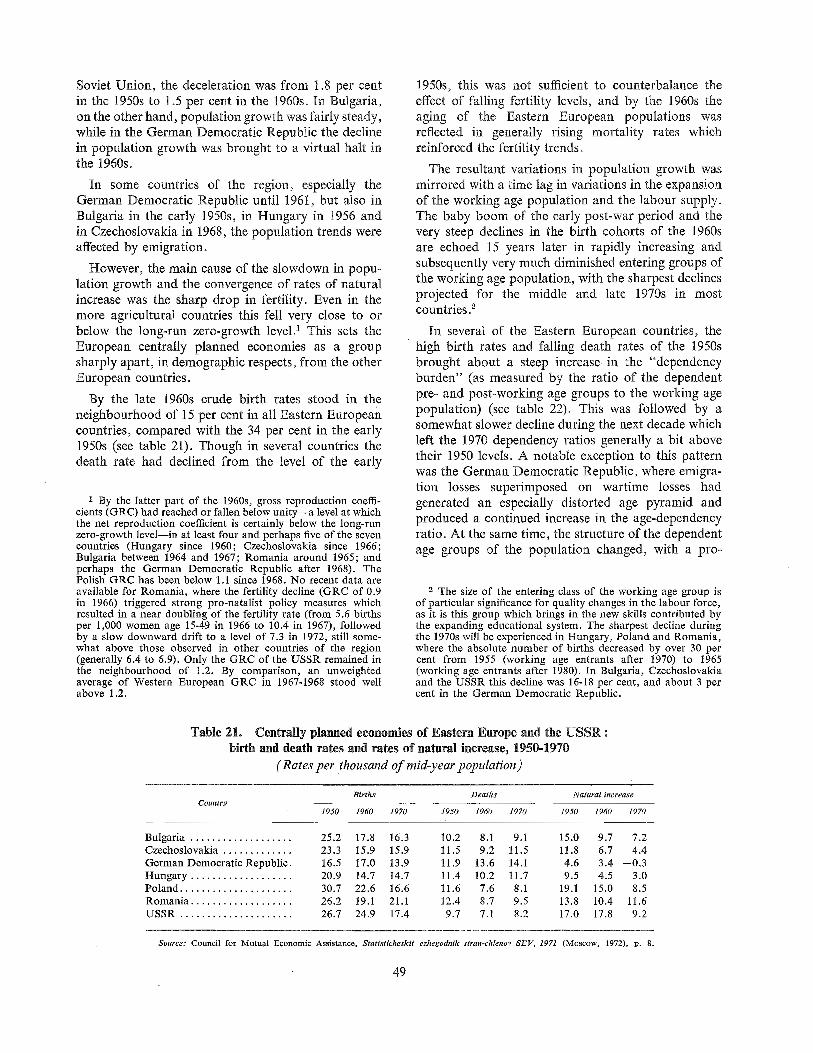
Soviet Union, the deceleration was from 1.8 per centin the 1950s to 1.5 per cent in the 1960s. In Bulgaria,on the other hand, population growth was fairly steady,while in the German Democratic Republic the declinein population growth was brought to a virtual halt inthe 1960s.
In some countries of the region, especially theGerman Democratic Republic until 1961, but also inBulgaria in the early 1950s, in Hungary in 1956 andin Czechoslovakia in 1968, the population trends wereaffected by emigration.
However, the main cause of the slowdown in popu-lation growth and the convergence of rates of naturalincrease was the sharp drop in fertility. Even in themore agricultural countries this fell very close to orbelow the long-run zero-growth level.1 This sets theEuropean centrally planned economies as a groupsharply apart, in demographic respects, from the otherEuropean countries.
1950s, this was not sufficient to counterbalance theeffect of falling fertility levels, and by the 1960s theaging of the Eastern European populations wasreflected in generally rising mortality rates whichreinforced the fertility trends.
The resultant variations in population growth wasmirrored with a time lag in variations in the expansionof the working age population and the labour supply.The baby boom of the early post-war period and thevery steep declines in the birth cohorts of the 1960sare echoed 15 years later in rapidly increasing andsubsequently very much diminished entering groups ofthe working age population, with the sharpest declinesprojected for the middle and late 1970s in mostcountries 2
By the late 1960s crude birth rates stood in theneighbourhood of 15 per cent in all Eastern Europeancountries, compared with the 34 per cent in the early1950s (see table 21). Though in several countries thedeath rate had declined from the level of the early
1 By the latter part of the 1960s, gross reproduction coeffi-cients (GRC) had reached or fallen below unity--a level at whichthe net reproduction coefficient is certainly below the long-runzero-growth level--in at least four and perhaps five of the sevencountries (Hungary since 1960; Czechoslovakia since 1966;Bulgaria between 1964 and 1967; Romania around 1965; andperhaps the German Democratic Republic after 1968). ThePolish GRC has been below 1.1 since 1968. No recent data areavailable for Romania, where the fertility decline (GRC of 0.9in 1966) triggered strong pro-natalist policy measures whichresulted in a near doubling of the fertility rate (from 5.6 birthsper 1,000 women age 15-49 in 1966 to 10.4 in 1967), followedby a slow downward drift to a level of 7.3 in 1972, still some-what above those observed in other countries of the region(generally 6.4 to 6.9). Only the GRC of the USSR remained inthe neighbourhood of 1.2. By comparison, an unweightedaverage of Western European GRC in 1967-1968 stood wellabove 1.2.
In several of the Eastern European countries, thehigh birth rates and falling death rates of the 1950sbrought about a steep increase in the "dependencyburden" (as measured by the ratio of the dependentpre- and post-working age groups to the working agepopulation) (see table 22). This was followed by asomewhat slower decline during the next decade whichleft the 1970 dependency ratios generally a bit abovetheir 1950 levels. A notable exception to this patternwas the German Democratic Republic, where emigra-tion losses superimposed on wartime losses hadgenerated an especially distorted age pyramid andproduced a continued increase in the age-dependencyratio. At the same time, the structure of the dependentage groups of the population changed, with a pro-
2 The size of the entering class of the working age group isof particular significance for quality changes in the labour force,as it is this group which brings in the new skills contributed bythe expanding educational system. The sharpest decline duringthe 1970s will be experienced in Hungary, Poland and Romania,where the absolute number of births decreased by over 30 percent from 1955 (working age entrants after 1970) to 1965(working age entrants after 1980). In Bulgaria, Czechoslovakiaand the USSR this decline was 16-18 per cent, and about 3 percent in the German Democratic Republic.
Table 21. Centrally planned economies of Eastern Europe and the USSR :birth and death rates and rates of natural increase, 1950-1970
(Rates per thousand of mid-year population)
CountryBirths Deaths Natural increase
1950 1960 1970 1950 1960 1970 1950 1960 1970
Bulgaria ................... 25.2 17.8 16.3 10.2 8.1 9.1 15.0 9.7 7.2
Czechoslovakia ............. 23.3 15.9 15.9 11.5 9.2 11.5 11.8 6.7 4.4
German Democratic Republic. 16.5 17.0 13.9 11.9 13.6 14.1 4.6 3.4 --0.3Hungary ................... 20.9 14.7 14.7 11.4 10.2 11.7 9.5 4.5 3.0
Poland ..................... 30.7 22.6 16.6 11.6 7.6 8.1 19.1 15.0 8.5
Romania ................... 26.2 19.1 21.1 12.4 8.7 9.5 13.8 10.4 11.6
USSR ..................... 26.7 24.9 17.4 9.7 7.1 8.2 17.0 17.8 9.2
Source: Council for Mutual Economic Assistance, Statisticheskii ezhegodnik stran-chlenov SEV, 1971 (Moscow, 1972), p. 8.
49
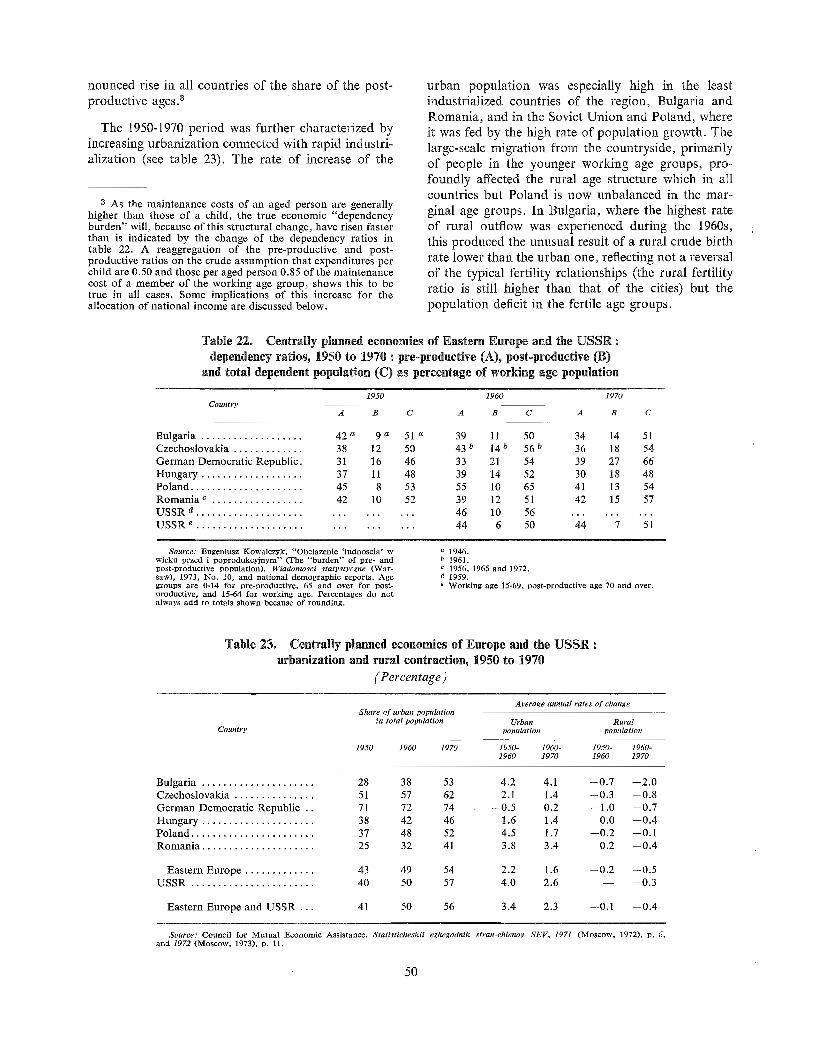
nounced rise in all countries of the share of the post°productive ages.3
The 1950-1970 period was further characterized byincreasing urbanization connected with rapid industri-alization (see table 23). The rate of increase of the
As the maintenance costs of an aged person are generallyhigher than those of a child, the true economic "dependencyburden" will, because of this structural change, have risen fasterthan is indicated by the change of the dependency ratios intable 22. A reaggregation of the pre-productive and post-productive ratios on the crude assumption that expenditures perchild are 0.50 and those per aged person 0.85 of the maintenancecost of a member of the working age group, shows this to betrue in all cases. Some implications of this increase for theallocation of national income are discussed below.
urban population was especially high in the leastindustrialized countries of the region, Bulgaria andRomania, and in the Soviet Union and Poland, whereit was fed by the high rate of population growth. Thelarge-scale migration from the countryside, primarilyof people in the younger working age groups, pro-foundly affected the rural age structure which in allcountries but Poland is now unbalanced in the mar-
ginal age groups. In Bulgaria, where the highest rateof rural outflow was experienced during the 1960s,this produced the unusual result of a rural crude birthrate lower than the urban one, reflecting not a reversalof the typical fertility relationships (the rural fertilityratio is still higher than that of the cities) but thepopulation deficit in the fertile age groups.
Table 22. Centrally planned economies of Eastern Europe and the USSR :dependency ratios, 1950 to 1970 : pre-productive (A), post-productive (B)
and total dependent population (C) as percentage of working age population
Country1950 1960 1970
A B C A B C A B C
Bulgaria ................... 42 a 9 a 51 ÿ 39 11 50 34 14 51
Czechoslovakia ............. 38 12 50 43 b 14 b 56 b 36 18 54
German Democratic Republic. 31 16 46 33 21 54 39 27 66Hungary ................... 37 11 48 39 14 52 30 18 48
Poland ..................... 45 8 53 55 10 65 41 13 54
Romania e ................. 42 10 52 39 12 51 42 15 57
USSR a ............................. 46 10 56 .........
USSR e ............................. 44 6 50 44 7 51
Source: Eugeniusz Kowalczyk, "Obciazenie 'ludnoscia' wwieku przed i poprodukcyjnym" (The "burden" of pre- andpost-productive population), Wiadomosci statystyczne (War-saw), 1973, No. 10, and national demographic reports. Agegroups are 0-14 for pre-productive, 65 and over for post-productive, and 15-64 for working age. Percentages do notalways add to totals shown because of rounding.
a 1946.o 1961.c 1956, 1965 and 1972.a 1959.e Working age 15-69, post-productive age 70 and over.
Table 23. Centrally planned econnnfies of Europe and the USSR :urbanization and rural contraction, 1950 to 1970
(Percentage)
Country
Average annual rates of changeShare of urban population
in total population Urban Ruralpopulation population
1950 1960 1970 1950- 1960- 1950- 1960-1960 1970 1960 1970
Bulgaria ..................... 28 38 53 4.2 4.1 --0.7 --2.0
Czechoslovakia ............... 51 57 62 2.1 1.4 --0.3 --0.8
German Democratic Republic .. 71 72 74 --0.5 0.2 --1.0 --0.7
Hungary ..................... 38 42 46 1.6 1.4 0.0 --0.4
Poland ....................... 37 48 52 4.5 1.7 --0.2 --0.1
Romania ..................... 25 32 41 3.8 3.4 0.2 --0.4
Eastern Europe ............. 43 49 54 2.2 1.6 --0.2 --0.5
USSR ....................... 40 50 57 4.0 2.6 -- --0.3
Eastern Europe and USSR ... 41 50 56 3.4 2.3 --0.1 --0.4
Source: Council for Mutual Economic Assistance, Statisticheskii ezhegodnik stran-chlenov SEV, 1971 (Moscow, 1972), p. 6,and 1972 (Moscow, 1973), p, 11.
50
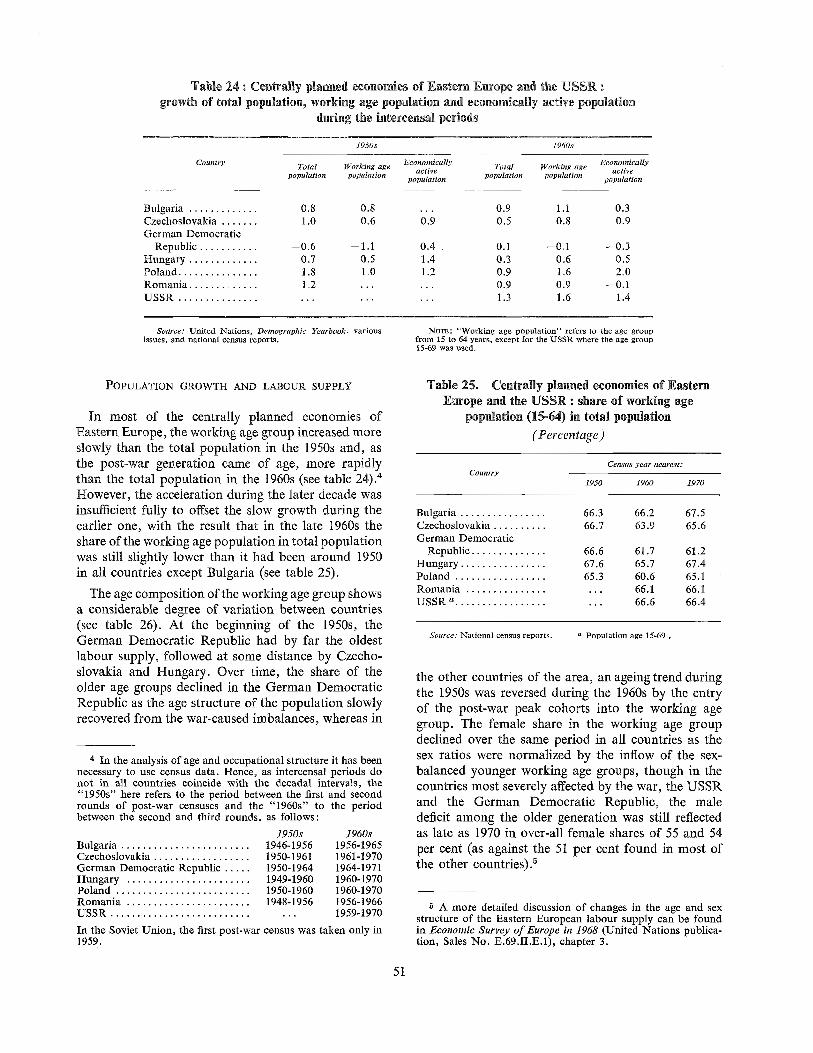
Table 24 : Centrally planned eeononfies of Eastern Europe and the USSR :growth of total popÿation, working age population and economically active population
during the hltereensal periods
1950s J960s
Country Total Working age Economically Total Working age Economicallyactive active
population population population population population population
Bulgaria ............. 0.8
Czechoslovakia ....... 1.0
German DemocraticRepublic ........... -- 0.6
Hungary ............. 0.7
Poland ............... 1.8
Romania ............. 1.2
USSR ..................
0.8 ... 0.9 1.1 0.3
0.6 0.9 0.5 0.8 0.9
--1.1
0.5
1.0
0.4 0.1 --0.1 --0.3
1.4 0.3 0.6 0.5
1.2 0.9 1.6 2.0
... 0.9 0.9 --0.1
... 1.3 1.6 1.4
Source: United Nations, Demographic Yearbook, variousissues, and national census reports.
NOTE: "Working age population" refers to the age groupfrom 15 to 64 years, except for the USSR where the age group15-69 was used.
POPULATION GROWTH AND LABOUR SUPPLY
In most of the centrally planned economies ofEastern Europe, the working age group increased moreslowly than the total population in the 1950s and, asthe post-war generation came of age, more rapidlythan the total population in the 1960s (see table 24).4However, the acceleration during the later decade wasinsufficient fully to offset the slow growth during theearlier one, with the result that in the late 1960s theshare of the working age population in total populationwas still slightly lower than it had been around 1950in all countries except Bulgaria (see table 25).
Table 25. Centrally planned economies of EasternEurope and the USSR : share of working age
population (15*64) in total population
(Percentage)
CountryCensus year nearest:
1950 1960 1970
1960s1956-19651961-19701964-19711960-19701960-19701956-19661959-1970
In the Soviet Union, the first post-war census was taken only in1959.
1950sBulgaria ........................ 1946-1956Czechoslovakia .................. 1950-1961German Democratic Republic ..... 1950-1964Hungary ....................... 1949-1960Poland ......................... 1950-1960Romania ....................... 1948-1956USSR .............................
4 In the analysis of age and occupational structure it has beennecessary to use census data. Hence, as intercensal periods donot in all countries coincide with the decadal intervals, the"1950s" here refers to the period between the first and secondrounds of post-war censuses and the "1960s" to the periodbetween the second and third rounds, as follows:
The age composition of the working age group showsa considerable degree of variation between countries(see table 26). At the beginning of the 1950s, theGerman Democratic Republic had by far the oldestlabour supply, followed at some distance by Czecho-slovakia and Hungary. Over time, the share of theolder age groups declined in the German DemocraticRepublic as the age structure of the population slowlyrecovered from the war-caused imbalances, whereas in
Bulgaria ................ 66.3 66.2 67.5
Czechoslovakia .......... 66.7 63.9 65.6
German DemocraticRepublic .............. 66.6 61.7 61.2
Hungary ................ 67.6 65.7 67.4
Poland ................. 65.3 60.6 65.1
Romania .................. 66.1 66.1
USSR a .................... 66.6 66.4
Source." National census reports, a Population age 15-69 .
the other countries of the area, an ageing trend duringthe 1950s was reversed during the 1960s by the entryof the post-war peak cohorts into the working agegroup. The female share in the working age groupdeclined over the same period in all countries as thesex ratios were normalized by the inflow of the sex-balanced younger working age groups, though in thecountries most severely affected by the war, the USSRand the German Democratic Republic, the maledeficit among the older generation was still reflectedas late as 1970 in over-all female shares of 55 and 54per cent (as against the 51 per cent found in most ofthe other countries)3
5 A more detailed discussion of changes in the age and sexstructure of the Eastern European labour supply can be foundin Economic Survey of Europe in 1968 (United Nations publica-tion, Sales No. E.69.II.E.1), chapter 3.
51
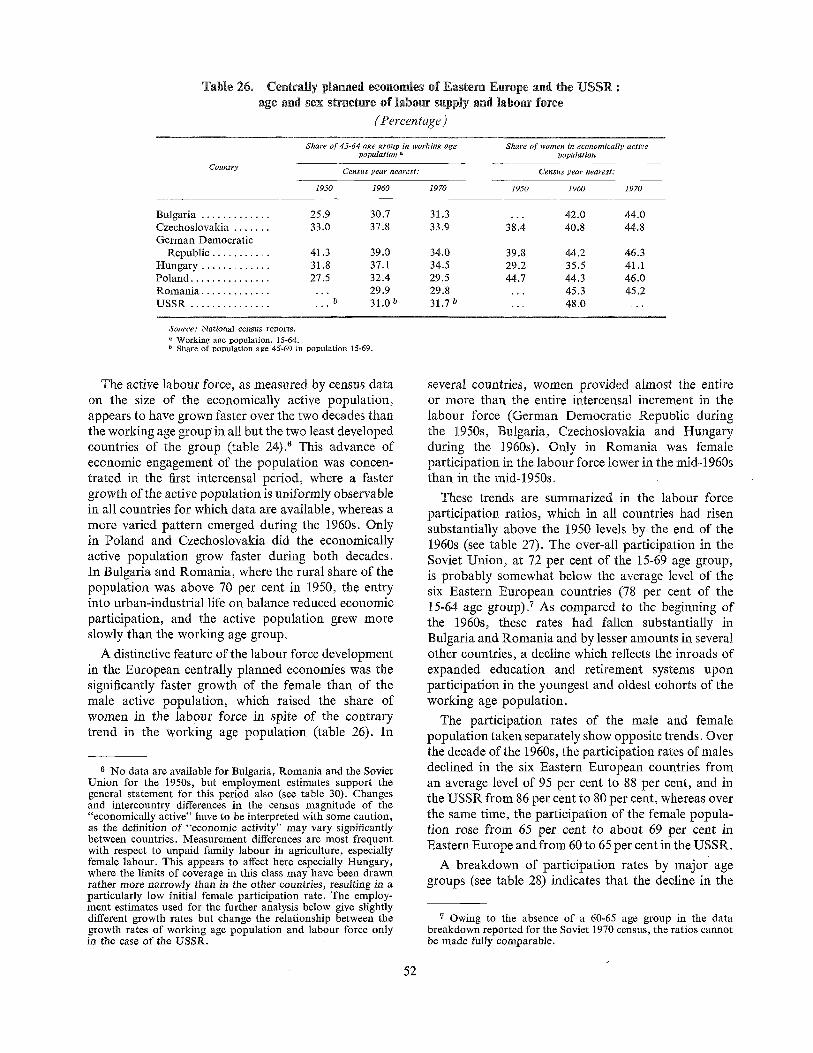
Table 26. Centrally planned econonfies of Eastern Europe and the USSR :age and sex structure nf labour supply and labour force
(Percentage)
Country
Share of 45-64 age group in working age Share of women in economically activepopulation a population
Census year nearest: Census year neas'est:
1950 1960 1970 2950 1960 1970
Bulgaria ............. 25.9 30.7
Czechoslovakia ....... 33.0 37.8
German DemocraticRepublic ........... 41.3 39.0
Hungary ............. 31.8 37.1
Poland ............... 27.5 32.4
Romania ................ 29.9
USSR .................. b 31.0
31.3 ... 42.0 44,0
33.9 38.4 40.8 44.8
34.034.529.529.831.7 0
39.829.244.7
44.2 46.335.5 41.144.3 46.045.3 45,248.0 ...
Source." National census reports.Working age population, 15-64.
b Share of population age 45-69 in population 15-69.
The active labour force, as measured by census dataon the size of the economically active population,appears to have grown faster over the two deca des thanthe working age group in all but the two least developedcountries of the group (table 24):6 This advance ofeconomic engagement of the population was concen-trated in the first intercensal period, where a fastergrowth of the active populatiort is uniformly observablein all countries for which data are available, whereas amore varied pattern emerged during the 1960s. Onlyin Poland and Czechoslovakia did the economicallyactive population grow faster during both decades.In Bulgaria and Romania, where the rural share of thepopulation was above 70 per cent in 1950, the entryinto urban-industrial life on balance reduced economicparticipation, and the active population grew moreslowly than the working age group.
A distinctive feature of the labour force developmentin the European centrally planned economies was thesignificantly faster growth of the female than of themale active population, which raised the share ofwomen in the labour force in spite of the contrarytrend in the working age population (table 26). In
several countries, women provided almost the entireor more than the entire intercensal increment in thelabour force (German Democratic Republic duringthe 1950s, Bulgaria, Czechoslovakia and Hungaryduring the 1960s). Only in Romania was femaleparticipation in the labour force lower in the mid-1960sthan in the mid-1950s.
6 No data are available for Bulgaria, Romania and the SovietUnion for the 1950s, but employment estimates support thegeneral statement for this period also (see table 30). Changesand intercountry differences in the census magnitude of the"economically active" have to be interpreted with some caution,as the definition of "economic activity" may vary significantlybetween countries. Measurement differences are most frequentwith respect to unpaid family labour in agriculture, especiallyfemale labour. This appears to affect here especially Hungary,where the limits of coverage in this class may have been drawnrather more narrowly than in the other countries, resulting in aparticularly low initial female participation rate. The employ-ment estimates used for the further analysis below give slightlydifferent growth rates but change the relationship between thegrowth rates of working age population and labour force onlyin the case of the USSR.
These trends are summarized in the labour forceparticipation ratios, which in all countries had risensubstantially above the 1950 levels by the end of the1960s (see table 27). The over-all participation in theSoviet Union, at 72 per cent of the 15-69 age group,is probably somewhat below the average level of thesix Eastern European countries (78 per cent of the15-64 age group).7 As compared to the beginning ofthe 1960s, these rates had fallen substantially inBulgaria and Romania and by lesser amounts in severalother countries, a decline which reflects the inroads ofexpanded education and retirement systems uponparticipation in the youngest and oldest cohorts of theworking age population.
The participation rates of the male and femalepopulation taken separately show opposite trends. Overthe decade of the 1960s, the participation rates of malesdeclined in the six Eastern European countries froman average level of 95 per cent to 88 per cent, and inthe USSR from 86 per cent to 80 per cent, whereas overthe same time, the participation of the female popula-tion rose from 65 per cent to about 69 per cent inEastern Europe and from 60 to 65 per cent in the USSR.
A breakdown of participation rates by major agegroups (see table 28) indicates that the decline in the
7 Owing to the absence of a 60-65 age group in the databreakdown reported for the Soviet 1970 census, the ratios cannotbe made fully comparable.
52
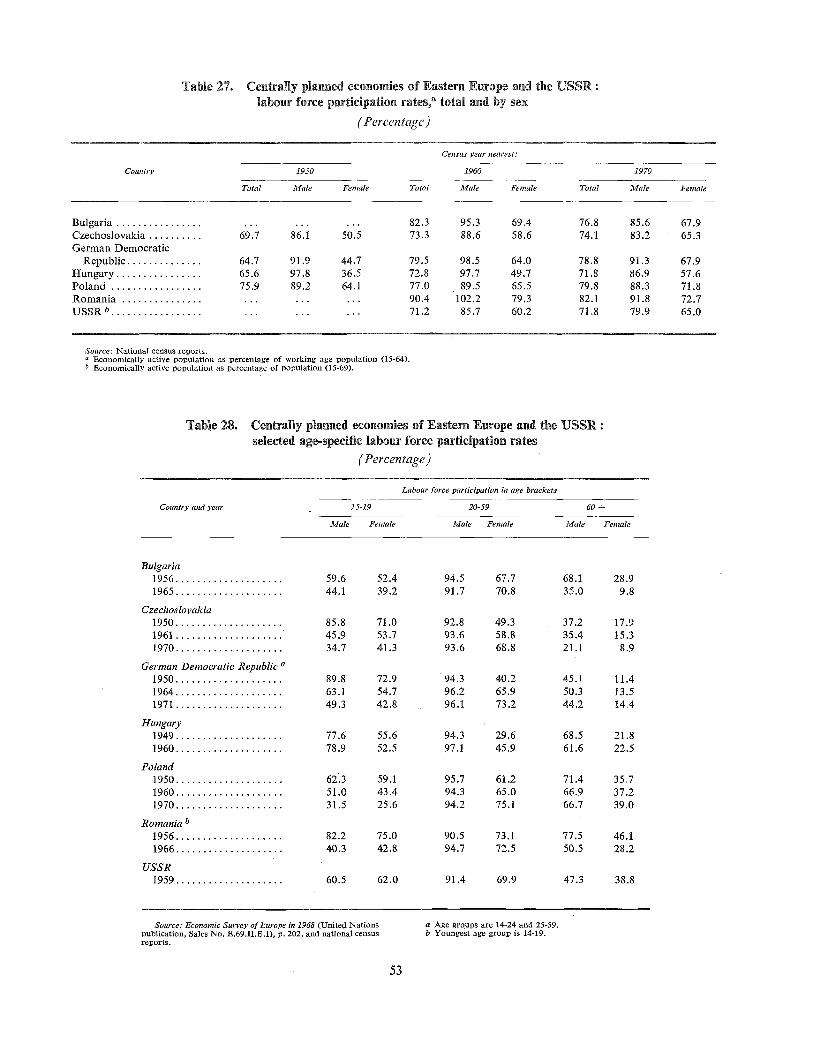
Table 27. Centrally planned economies of Eastern Europe and the USSR :labour force participation rates,a total and by sex
(Percentage)
Country
Census year nearest."
1950 1960
Total ÿale Female Total Male Female Total
1970
13/Iale Female
Bulgaria ...................
Czechoslovakia .......... 69.7
German DemocraticRepublic .............. 64.7
Hungary ................ 65.6
Poland ................. 75.9
Romania ..................
USSR b ....................
...... 82.3 95.3 69.4 76.8 85.6 67.9
86.1 50.5 73,3 88.6 58.6 74.1 83.2 65.3
91.997.889.2
44.7 79,5 98.5 64.0 78.836,5 72,8 97.7 49.7 71.864.1 77,0 89,5 65.5 79.8... 90.4 102.2 79.3 82,1
... 71.2 85.7 60.2 71.8
91.386.988.391.879.9
67.957.671.872.765.0
Source: Nÿtt[oaal census reIÿorts.a Economically active population as percentage of working age population (15-64).b Economically active population as percentage of population (15-69).
Table 28. Centrally plamled economies of Eastern Europe and the USSR :selected age-specific labour force participation rates
(Percentage)
Country attd year
Labour force participation in age brackets
15-19 20-59 60 ÷
Male Female Male Female Male Female
Bulgaria1956 .................... 59.6 52.4
1965 .................... 44.1 39.2
CzechosNvakÿ1950 .................... 85.8 71.0
1961 .................... 45.9 53,7
1970 .................... 34.7 41.3
German Democratic RepubBc a1950 .................... 89.8 72.9
1964 .................... 63.1 54.7
1971 .................... 49.3 42.8
Hungary1949 .................... 77.6 55.6
1960 .................... 78.9 52.5
PoNnd1950 .................... 62.3 59.1
1960 .................... 51.0 43.4
1970 .................... 31.5 25.6
Romania o1956 .................... 82.2 75.0
1966 .................... 40.3 42.8
USSR1959 .................... 60.5 62.0
94.5 67.7 68.1 28.991.7 70.8 35.0 9.8
92.8 49.3 37.2 17.993,6 58.8 35.4 15.393.6 68.8 21.1 8,9
94.3 40.2 45.1 11.496.2 65.9 50.3 13.596.1 73.2 44.2 14.4
94.3 29.6 68.5 21.897.1 45.9 61.6 22.5
95.7 61.2 71.4 35.794.3 65.0 66.9 37.294.2 75.1 66.7 39.0
90.5 73.1 77.5 46.194.7 72.5 50.5 28.2
91.4 69.9 47.3 38.8
Source: Economic Survey of Enrope in 1968 (United Nationspublication, Sales No, E.69.II.E,1), 19. 202, and national censusreports.
a Age groups are 14-24 and 25-59.b Youngest age group is 14-19.
53
over-all male labour force participation was caused bya marked decline in the participation levels of themarginal age groups, the i5-19 year olds and those60 years and over, whereas the economic participationof the central working age groups remained substan-tially unchanged at over 90 per cent in all countries.In the female population, the same declining trend inthe extreme age groups was more than offset by thesteep increases in the economic activity of the centralage groups in all but the two still highly agriculturalcountries.
The change in the activity level at the young end ofthe scale reflects both the shift of the population intothe cities--participation rates still being rather higherin the countryside where agriculture offers moreemployment for marginal labour than do the typicalurban activities--and, more importantly, the extensionof educational opportunities and of the length of timespent in schooling. School enrolments at the primaryand secondary levels increased faster than the popula-tion in the school age cohorts.S
In the 60 and over age group, the reduction ofactivity levels is caused not only by the effects ofurbanization but also by the introduction of retirementpension schemes in the nationalized sector and, morerecently, their spread to the non-state (collective farm)labour force. The retirement age for women in mostcountries is now set five years earlier than that for men(at age 55 in all countries but Poland and the GermanDemocratic Republic, where it is at age 60). This isreflected in the much sharper decline and lower levelsof the female participation rates. The trends in theolder age group, however, are not as uniform across thecountries of the group as those among the young. Inthe German Democratic Republic, severe labourshortages may have induced a rising male employmentlevel during the 1950s and a continued increase inthe 1960s in that of women, and in Poland, the signi-ficant weight of a large (and ageing) private agriculturalsector probably accounts for the relatively high (andrising in the case of females) participation rates amongthe older groupY
The employment structure of the economically activepopulation showed very large changes over the 20-yearperiod (see table 29). Around 1950, two of the countries,Bulgaria and Romania, were still agricultural econ-omies by a generally employed classification scheme(agricultural employment share above 60 per cent),
and with the exception of the German DemocraticRepublic, all others were at a semi-industrial level ofdevelopment (agricultural employment share of 35 to59 per cent). By the time of the latest census round,only Bulgaria and Romania were still at the semi-industrial state, all others having passed into theindustrial group (agricultural employment share below35 per cent).
Poland, with its very high population growth rate,was the only country of the area which did notexperience a significant decline in the absolute size ofthe population engaged in agriculture. For the groupas a whole, the agricultural population declined byabout 20 million persons during the 1960s alone, whilethe economically active population increased by20 million people and industrial employment rose byan equal number (or about 29 per cent).
During the 1960s, and one can suppose during the1950s as well (though data are not available for severalcountries), the highest rates of growth of industrialemployment were experienced in the least developedcountries of the area, with Bulgaria far in advance ofthe others. The rate of structural change appears tohave generally accelerated during the second intercensaldecade, with a shift of focus to the tertiary (service)sectors where employment growth increased in anumber of the centrally planned economies as the rateof employment growth in industry slowed down.
DEMOGRAPHIC CHANGE AND ECONOMIC POLICY
Extensive versus intensive development strategy
The development strategy shared by the countries ofthe centrally planned group resulted over the 20-yearperiod in very substantial though decelerating growthof output (see table 30), and in a marked convergenceof structure among the seven countries which hadstarted out from very different levels of development.This is evident, whether viewed from the productionside in terms of the shares of sectoral value added ingross domestic product and the sectoral shares in totallabour and capital inputs (see table 31), or from thedistribution side in terms of shares of major final usesin total output (see table 32).1°
s In Poland, for instance, school enrolment among the14-17 year olds increased from 44 per cent of the age cohort inthe mid-1950s to 87 per cent in the 1970/71 school year.
9 The data for the Hungarian economy fit the general trendin neither of the two age groups, but, as noted earlier, this isprobably caused by differences in coverage.
10 The two tables reflect different macro-accounting con-cepts. Data in tables 32 to 34 are based on the net materialproduct measure employed in the national accounting of thecentrally planned economies, while those in tables 30 and 31useestimates of the Economic Commission for Europe relating tothe gross domestic product. The latter differs from the former,apart from its grossness, primarily by the value added of thetiertiary (service) sectors of production, and was preferred forthe discussion of production structure because its sectoral com-ponents can be directly juxtaposed to a similar partitioning oftotal factor use.
54
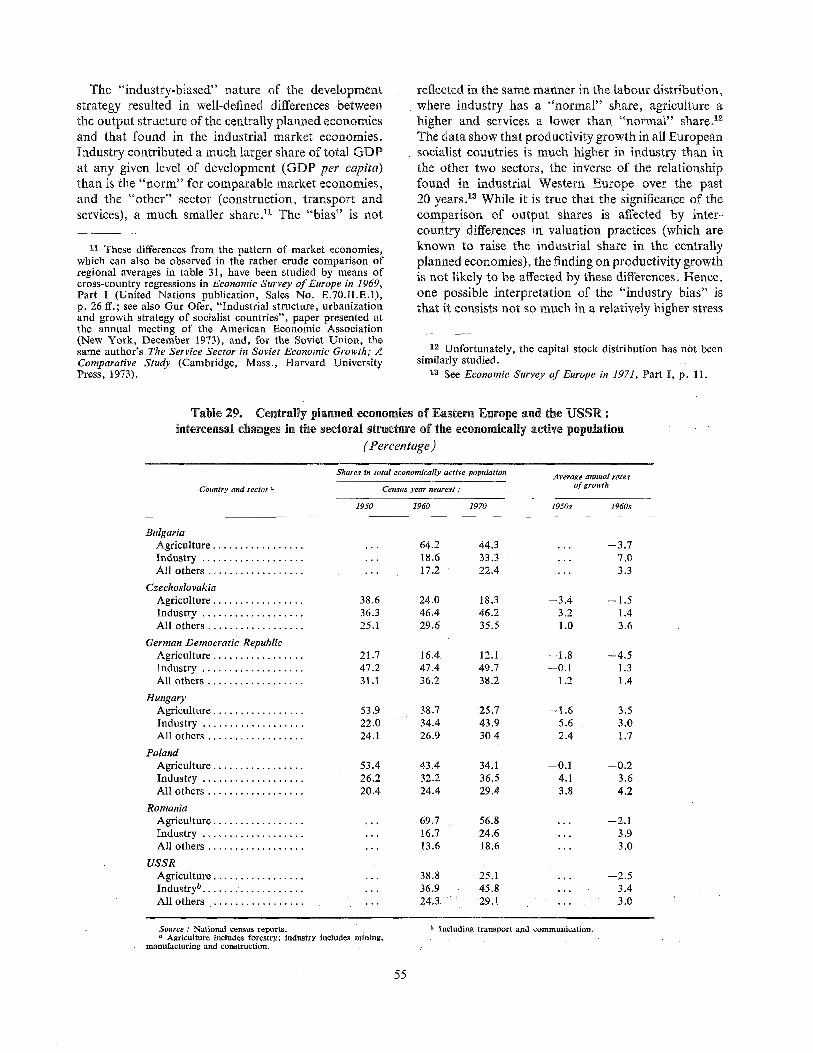
The "industry-biased" nature of the developmentstrategy resulted in well-defined differences betweenthe output structure of the centrally planned economiesand that found in the industrial market economies.Industry contributed a much larger share of total GDPat any given level of development (GDP per capita)than is the "norm" for comparable market economies,and the "other" sector (construction, transport andservices), a much smaller share.!1 The "bias" is not
11 These differences from the pattern of market economies,which can also be observed in the rather crude comparison ofregional averages in table 31, have been studied by means ofcross-country regressions in Economic Survey of Europe in 1969,Part I (United Nations publication, Sales No. E.70.II.E.1),p. 26 ft. ; see also Gur Ofer, "Industrial structure, urbanizationand growth strategy of socialist countries", paper presented atthe annual meeting of the American Economic Association(New York, December 1973), and, for the Soviet Union, thesame author's The Service Sector in Soviet Economic Growth; AComparative Study (Cambridge, Mass., Harvard UniversityPress, 1973).
reflected in the same manner in the labour distribution,where industry has a "normal" share, agriculture ahigher and services a lower than "normal" share32The data show that productivity growth in all Europeansocialist countries is much higher in industry than inthe other two sectors, the inverse of the relationshipfound in industrial Western Europe over the past20 years?a While it is true that the significance of thecomparison of output shares is affected by inter-country differences in valuation practices (which areknown to raise the industrial share in the centrallyplanned economies), the finding on productivity growthis not likely to be affected by these differences. Hence,one possible interpretation of the "industry bias" isthat it consists not so much in a relatively higher stress
12 Unfortunately, the capital stock distribution has not beensimilarly studied.
13 See Economic Survey of Europe in 1971, Part I, p. ll.
Table 29. Centrally planned economies of Eastern Europe and the USSR :intereensal changes in the seetoral structure of the economically active population
(Percentage)
Country and sector a
Shares in total economically active population Average annual rates
Census year nearest : of growth
1950 1960 1970 1950s 1960s
BulgariaAgriculture .................
Industry ...................
All others ..................
CzechoslovakiaAgriculture .................
Industry ...................
All others ..................
German Democratic RepublicAgriculture .................
Industry ...................
All others ..................
HungaryAgriculture .................
Industry ...................
All others ..................
PolandAgriculture .................
Industry ...................
All others ..................
RomaniaAgriculture .................
Industry ...................
All others ..................
USSRAgriculture .................
Industryb ....... ............
All others ..................
64.2 44.3 ... --3.7
18.6 33.3 ... 7.0
17.2 22.4 ... 3.3
38.6 24.0 18.3 --3.4 --1.5
36.3 46.4 46.2 3.2 1.425.1 29.6 35.5 1.0 3.6
21.7 16.4 12.1 --1.8 --4.5
47.2 47.4 49.7 --0.1 1.3
31.1 36.2 38.2 1.2 1.4
53.9 38.7 25.7 --! .6 --3.5
22.0 34.4 43.9 5.6 3.024.1 26.9 30.4 2.4 1.7
53.4 43,4 34.1 --0.1 --0.2
26.2 32.2 36.5 4.1 3.620.4 24.4 29.4 3.8 4.2
,.. 69.7 56.8 ... --2.1
16.7 24.6 ... 3.9
13.6 18.6 ... 3.0
38.8 25.1 ... --2.5
36.9 45.8 . . . 3.4
24.3 29.1 ..... 3.0
Source : National censns reports.a Agriculture includes forestry; industry includes mining,
manufacturing and construction.
b Including transport and communication,
55
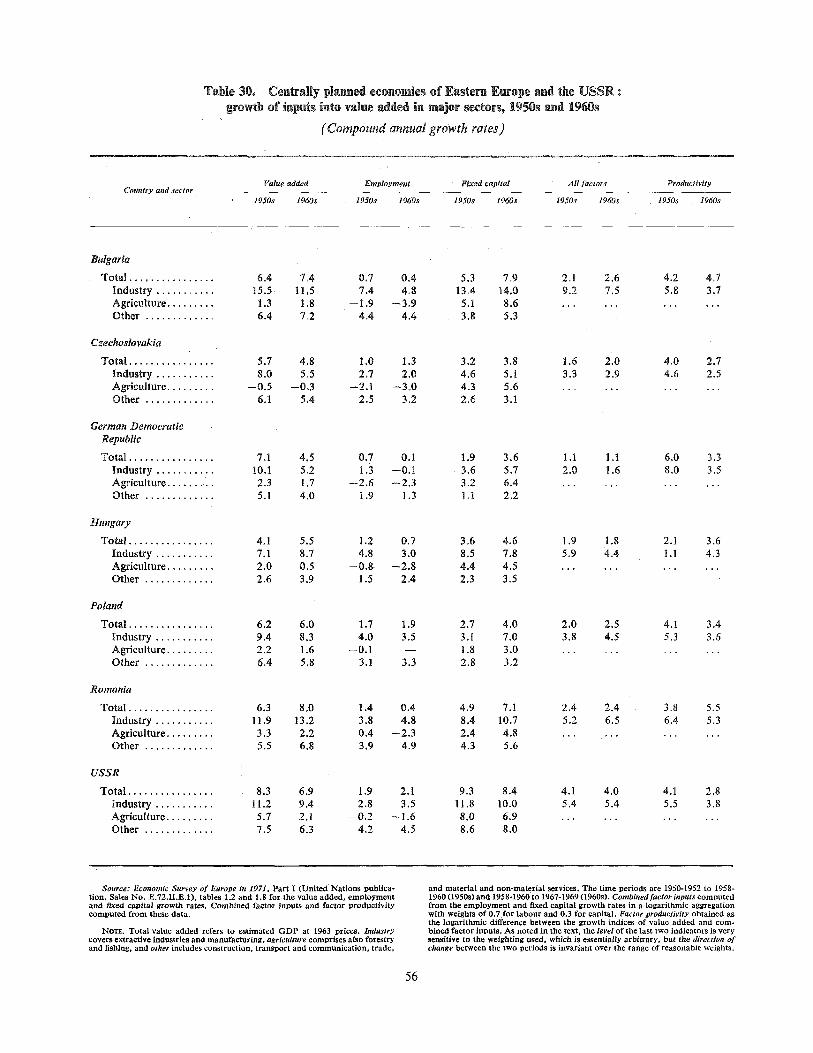
Table 30. Centrally planned economies of Eastern Europe and the LrSSR :growth of inputs into vaÿue added in major sectorsÿ 1950s and 1960s
(Compound annual growth rales )
Country and sectorValue added Employment Fixed capital All factors
1950s 1960s 1950s 1960s 1950s 1960s 1950s 1960s
Productivity
1950s 1960s
Bulgaria
Total ................ 6.4 7.4 0.7 0.4 5.3 7.9 2.1
Industry ........... 15.5 11,5 7.4 4.8 13.4 14°0 9.2
Agriculture ......... 1.3 1.8 --1.9 --3.9 5.1 8.6 ...
Other ............. 6.4 7.2 4.4 4.4 3.8 5.3
2,6 4.2 4.77.5 5.8 3.7
CzechoslovaMa
Total ................ 5.7 4.8 1.0 1.3 3.2 3.8 1.6 2.0 4.0 2.7
Inÿsÿy ........... 8.0 5.5 2.7 2.0 4.6 5.1 3.3 2.9 4.6 2.5
Aÿculture ......... --0.5 --0.3 --2.1 --3.0 4.3 5.6 ............
Other ............. 6.1 5,4 2.5 3.2 2.6 3.1
German DemocraticRepublic
Total ................ 7.1 4,5 0.7 0.1 1.9 3.6 1.1
Industry ........... 10.1 5.2 1.3 --0.1 3.6 5.7 2.0
Agriculture ......... 2.3 1.7 --2.6 --2.3 3.2 6.4 ...
Other ............. 5.1 4.0 1.9 1.3 1.1 2.2
1.1 6.0 3.3
1.6 8.0 3.5
Poland
Romania
Total ................ 6.3 8.0 1.4 0.4 4.9 7.1 2.4 2.4 3.8 5.5
Industry ........... 11.9 13.2 3.8 4.8 8.4 10.7 5.2 6.5 6.4 5.3
Agriculture ......... 3.3 2.2 0.4 --2.3 2.4 4.8 ............
Other ............. 5.5 6.8 3.9 4.9 4.3 5.6
USSR
Total ................ 8.3 6.9 1.9 2.1 9.3 8.4 4.1 4.0 4.1 2.8
Industry ........... 11.2 9.4 2,8 3.5 11.8 10.0 5,4 5.4 5.5 3.8
Agdculture ......... 5.7 2.1 --0.2 --1.6 8.0 6.9 ............
Other ............. 7.5 6.3 4,2 4.5 8.6 8.0
Total ................ 6.2 6.0 1.7 1.9 2.7 4.0 2.0 2.5 4.1 3.4
Industry ........... 9.4 8.3 4.0 3.5 3.1 7.0 3.8 4.5 5.3 3.6
Agriculture ......... 2.2 1.6 --0.1 -- 1.8 3.0 ............
Other ............. 6.4 5.8 3.1 3.3 2.8 3.2
Httÿaÿ
Total ................ 4.1 5.5 1.2 0.7 3.6 4.6 1.9
Indusÿy ........... 7.1 8.7 4.8 3.0 8.5 7.8 5.9
Agiculture ......... 2.0 0.5 --0.8 --2.8 4.4 4.5 ...
Oÿer ............. 2.6 3.9 1.5 2.4 2.3 3.5
1,8 2.1 3.6
4.4 1.1 4.3
Source: Economic Survey of Earope in 1971, Part I (United Nations publica-tion, Sales No. E.72.II.E.1), tables 1.2 and 1.8 for the value added, employmentand fixed capital growth rates. Combined factor inputs and factor productivitycomputed from these data.
NOTE. Total value added refers to estimated GDP at 1963 prices. Industrycovers extractive industries and manufacturing, agriculture comprises also forestryand fishing, and other includes collstruction, transport and communication, trade,
and material and non-material services, The time periods are 1950-1952 to 1958-1960 (1950s) and 1958-1960 to 1967-1969 (1960s), Combined factor inpats computedfrom the employment and fixed capital growth rates in a logarithmic aggregationwith weights of 0.7 for labour and 0.3 for capital. Factor productivity obtained asthe logarithmic difference between the growth indices of value added and com-bined factor inputs. As noted in the text, the level of the last two indicators is verysensitive to the weighting used, which is essentially arbitrary, but the direction ofchange between the two periods is invariant over the range of reasonable weights.
56
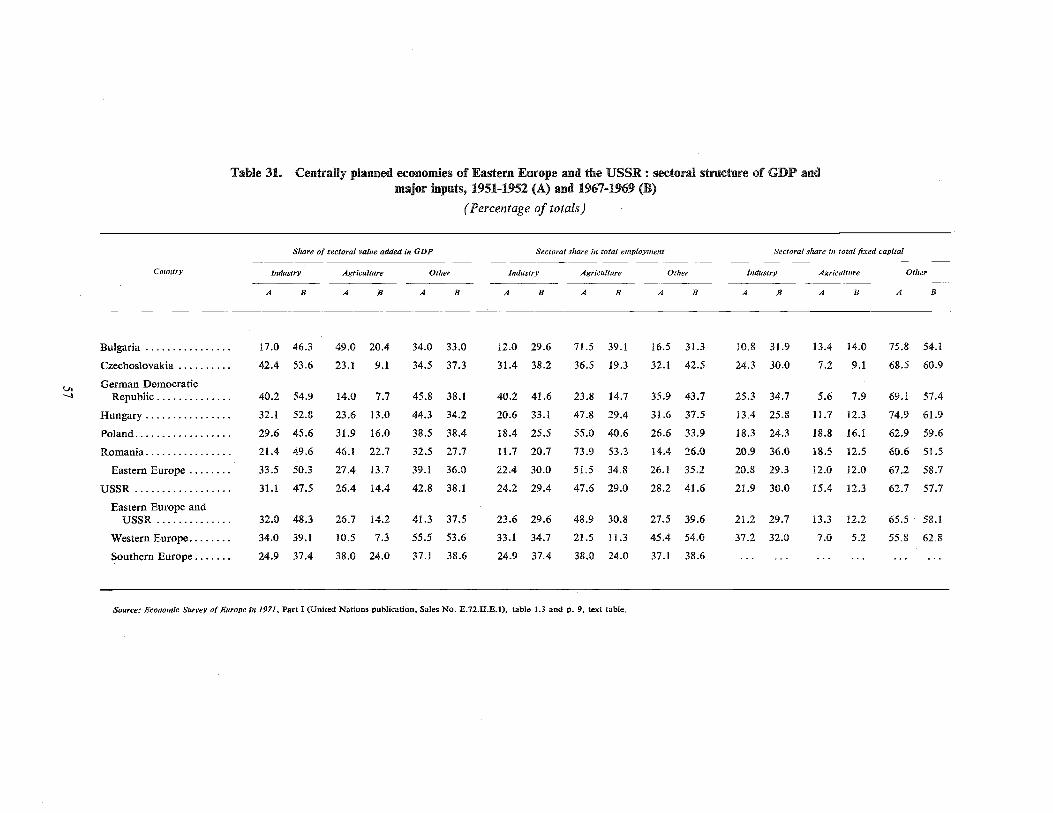
Table 31. Centrally planned economies of Eastern Europe and the USSR : sectoral structure of GDP andmajor inputs, 1951-1952 (A) and 1967-1969 (B)
(Percentage of totals)
Cololtry
Share of sectora! value added itt GDP Sectoral share in total employment Sectoral share in total fÿed capital
Industry Agriculture Other lttdustry Agriculture Other ludustry Agriculture Other
A B A B A B A B A B A B A B A B A B
-...l
Bulgaria ................
Czechoslovakia ..........
German DemocraticRepublic ..............
Hungary ................
Poland ..................
Romania ................
Eastern Europe ........
USSR ..................
Eastern Europe andUSSR ..............
Western Europe ........
Southern Europe .......
17.0 46.3 49.0 20.4 34.0 33.0 12.0 29.6 71.5 39.1 16.5 31.3 10.8 31.9 13.4 14.0 75.8 54.1
42.4 53.6 23.1 9.1 34.5 37.3 31.4 38.2 36.5 19.3 32.1 42.5 24.3 30.0 7.2 9.1 68.5 60.9
40.2 54.9 14.0 7.7 45.8 38.1 40.2 41.6 23.8 14.7 35.9 43.7 25.3 34.7 5.6 7.9 69.1 57.4
32.1 52.8 23.6 13.0 44.3 34.2 20.6 33.1 47.8 29.4 31.6 37.5 13.4 25.8 11.7 12.3 74.9 61.9
29.6 45.6 31.9 16.0 38.5 38.4 18.4 25.5 55.0 40.6 26.6 33.9 18.3 24.3 18.8 16.1 62.9 59.6
21.4 49.6 46.1 22.7 32.5 27.7 11.7 20.7 73.9 53.3 14.4 26.0 20.9 36.0 18.5 12.5 60.6 51.5
33.5 50.3 27.4 13.7 39.1 36.0 22.4 30.0 51.5 34.8 26.1 35.2 20.8 29.3 12.0 12.0 67.2 58.7
31.1 47.5 26.4 14.4 42.8 38.1 24.2 29.4 47.6 29.0 28.2 41.6 21.9 30.0 15.4 12.3 62.7 57.7
32.0 48.3 26.7 14.2 41.3 37.5 23.6 29.6 48.9 30.8 27.5 39.6 21.2 29.7 13.3 12.2 65.5 58.1
34.0 39.1 10.5 7.3 55.5 53.6 33.1 34.7 21.5 11.3 45.4 54.0 37.2 32.0 7.0 5.2 55.8 62.8
24.9 37.4 38.0 24.0 37.1 38.6 24.9 37.4 38.0 24.0 37.1 38.6 ..................
Source: Economic Survey of Europe in 1971, Part I (United Nations publication, Sales No. E.72.II.E.1), table 1.3 and p. 9, text table.
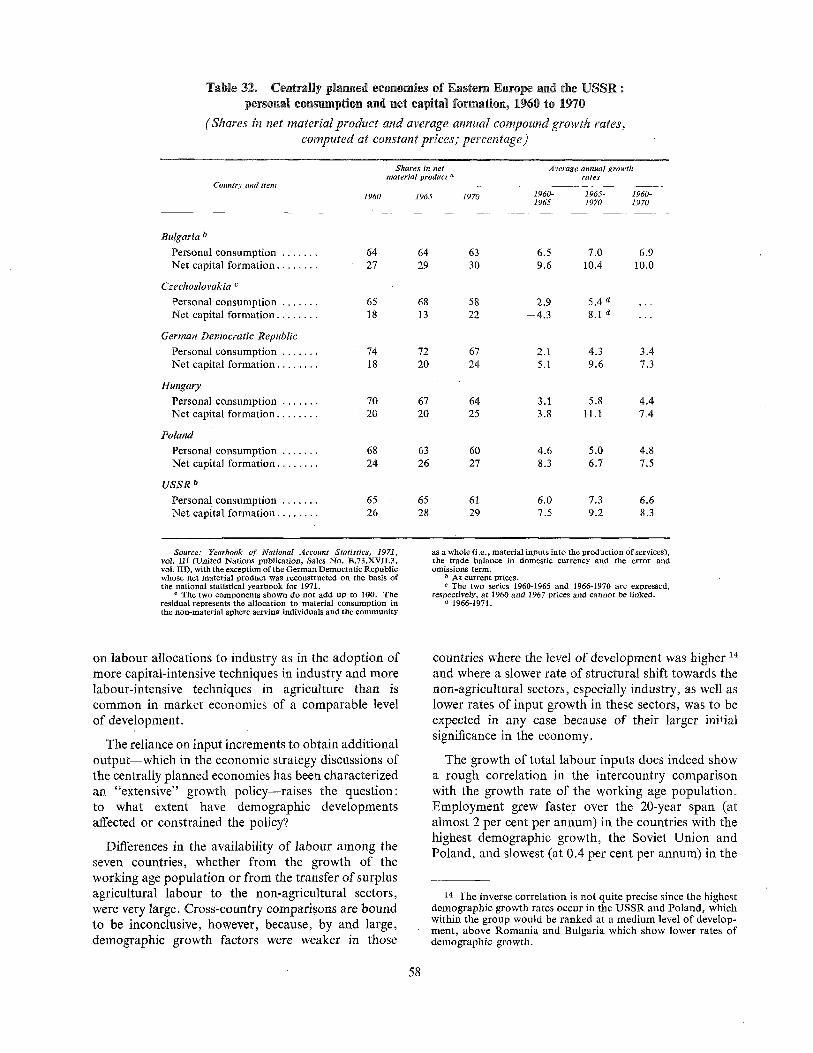
Table 32. Cen*rally planned economies of Eÿstern Europe ÿnd the USSR :persbnal consumption and net capital formation, 1960 to 1970
(Shares in net material product and average annual compound growth rates,computed at constant prices; percentage)
COUntry Ond item
Shares in net Average annual growthmaterialproducta rates
1960 1965 1970 1960- 1965- ÿf960-1965 1970 1970
Bulgaria b
Personal consumption ....... 64
Net capital formation ........ 27
64 63 6.5 7.0 6.929 30 9.6 10.4 10.0
Czechoslovakia e
Personal consumption ....... 65
Net capital formation ........ 18
68 58 2.9 5.4 a13 22 --4.3 8.1 ÿ
USSR bPersonal consumption ....... 65
Net capital formation ........ 26
PolandPersonal consumption ....... 68
Net capital formation ........ 24
Hungary
Personal consumption ....... 70
Net capital formation ........ 20
72 67 2.1 4,3 3.420 24 5.1 9.6 7.3
67 64 3.1 5.8 4.420 25 3.8 11.1 7.4
63 60 4.6 5.0 4.826 27 8.3 6.7 7.5
65 61 6.0 7.3 6.628 29 7.5 9.2 8.3
German Democratic Republic
Personal consumption ....... 74
Net capital formation ........ 18
Source: Yearbook of National Account Statistics, 1971,vol, !II (United Nations publication, Sales No. E.73,XVIL3,vol. III), with the exception of the German Democratic Republicwhose net material product was reconstructed on the basis ofthe national statistical Yearbook for 1971.
a The two components shown do not add up to 100, Theresidual represents the allocation to material consumption inthe non-material sphere serving individuals and the community
as a whole 0.e., material inputs into the production of services),the trade balance in domestic currency and the error andomissions term.
b At current prices.e The two series 1960-1965 and 1966-1970 are expressed,
respectively, at 1960 and 1967 prices and cannot be linked.a 1966-1971.
on labour allocations to industry as in the adoption ofmore capital-intensive techniques in industry and morelabour-intensive techniques in agriculture than iscommon in market economies of a comparable levelof development.
The reliance on input increments to obtain additionaloutput--which in the economic strategy discussions ofthe centrally planned economies has been characterizedan "extensive" growth policy--raises the question:to what extent have demographic developmentsaffected or constrained the policy?
Differences in the availability of labour among theseven countries, whether from the growth of theworking age population or from the transfer of surplusagricultural labour to the non-agricultural sectors,were very large. Cross-country comparisons are boundto be inconclusive, however, because, by and large,demographic growth factors were weaker in those
countries where the level of development was higher 14and where a slower rate of structural shift towards thenon-agricultural sectors, especially industry, as well aslower rates of input growth in these sectors, was to beexpected in any case because of their larger initialsignificance in the economy.
The growth of total labour inputs does indeed showa rough correlation in the intercountry comparisonwith the growth rate of the working age population.Employment grew faster over the 20-year span (atalmost 2 per cent per annum) in the countries with thehighest demographic growth, the Soviet Union andPoland, and slowest (at 0.4 per cent per annum) in the
14 The inverse correlation is not quite precise since the highestdemographic growth rates occur in the USSR and Poland, whichwithin the group would be ranked at a medium level of develop-ment, above Romania and Bulgaria which show lower rates ofdemographic growth.
58
German Democratic Republic, where working agepopulation contracted. In the in-between group, how-ever, Czechoslovakia and Hungary, both known forperennial labour shortage problems, showed a higheremployment growth rate (over 1 per cent per annum)than Romania and Bulgaria (0.9 and 0.5 per cent,respectively), the reverse of their demographic growthranking .15
Except in the last two countries, the least developedof the group, employment expanded faster than theworking age population. This reflects the "extensive"growth policy based on massive input increments andthe significant contribution of "mobilization", that is,the recruitment of hitherto non-participating membersof the working age group--primarily women--into theactive labour force. The "mobilization" policy largelyfreed the centrally planned economies' developmentdrive from constraints stemming from demographicdevelopments and thus served as a substitute for thelabour import policies pursued in most of the Europeanindustrial market economies. Since the female labourparticipation ratio climbed to levels far above thosefound in the industrial market economies not only inthose centrally planned economies with a relativelyslow labour supply growth but also in Poland and theSoviet Union, however, the activization of womenappears to have been less a policy response to thedemographic situation than a basic feature of the socialand economic system. Egalitarian strands in the socio-political value structure make for greater female roleequality. Labour-hoarding incentives built into theoperation of the economic mechanism may well makemore jobs available for female labour than wouldotherwise be the case. And in the period under reviewthese factors are likely to have been reinforced by theplanners' desire to economize on infrastructure outlaysduring the urbanization process by maximizing thenumber of labour units made available per unit ofexpenditure on social overhead.
table 27),16 their effect was overshadowed by thechanges occurring in the large rural sector whereparticipation in the labour force by women, the veryyoung and the very old, is traditionally high. Thewithdrawals from the active labour force occasionedby the modernization process, with its expansion ofthe educational system and the spread of retirementpension schemes, apparently more than offset theeffect upon the over-all labour force participation rateof the increased entry of working age females into theurban industrial labour force.
Total factor inputs and factor productivity
While similar "mobilization" tendencies were un-doubtedly also at work in Romania and Bulgaria, asis shown by the relatively high female labour forceparticipation ratios, especially in the towns (see
In all countries the growth of total employment wasaccompanied by pronounced changes in its sectoralstructure and rapid growth of the stock of fixed capital.
As already noted, the transfer of labour from agri-culture into the non-agricultural sectors played animportant role, especially in the less developedcountries of the group, in providing labour inputs forthe growth-carrying sectors. With the exception ofPoland, agricultural employment contracted in all theEastern European countries at an accelerated rateduring the 1960s, after the completion of collectiviza-tion in the countryside during the 1950s. A similaracceleration, though at a considerably slower rate,occurred in the Soviet Union. Between the 1950s andthe 1960s the growth of labour inputs generally sloweddown in the case of industry (except in Romania andthe Soviet Union), whereas in the case of other non-agricultural activities (construction, transport andservices) there was an acceleration in the growth ofemployment in most countries (except the GermanDemocratic Republic).
Fixed capital inputs generally expanded at a higherrate in the 1960s than in the 1950s in the non-agri-cultural sectors, especially in industry. Only in theSoviet Union, the country which shows by far thehighest growth rate of fixed capital assets (9 per centper annum over the 20 years), did the growth of capitalinputs decelerate between the two decades.17
15 It should be noted that as measures of the real growth oflabour inputs, the employment growth rates in table 30--whichrefer to total employment (including agricultural and non-agricultural self-employment, wherever applicable) in an approxi-mation of man-years--are, in spite of their comprehensiveness,somewhat crude proxies. Two mutually offsetting correctionswould be desirable: (a) an adjustment to allow for the qualityimprovements in the labour force due to its rising educationallevel, and (b) an adjustment for the general downward trendin the average annual hours worked. Since the former wouldraise and the latter lower the growth rate of labour inputs, itis not possible to state in which direction the net effect would go.
16 For an East-West comparison of urban participation ratios,see Economic Survey of Europe in 1968 (United Nations publi-cation, Sales No. E.69.II.E.1), page 249.
17 The observed capital stock growth rates conform ratherwell to the hypothesis that with a given capacity to save (whichis likely to be largely institutionally determined and thereforevery similar for the countries of the centrally planned group)this rate should vary inversely with the level of development (andthus presumably the initial capital endowment) and directly withthe length of time spent in the socialist system, reflecting the factthat in the absence of large-scale trading possibilities the physicalcapacity of the investment goods industry forms a constraint whichcan be removed over time by a suitable reshaping of the inheritedindustrial structure. As the capital stock grows, larger incrementswill be required to maintain a given growth rate; hence, unless
59
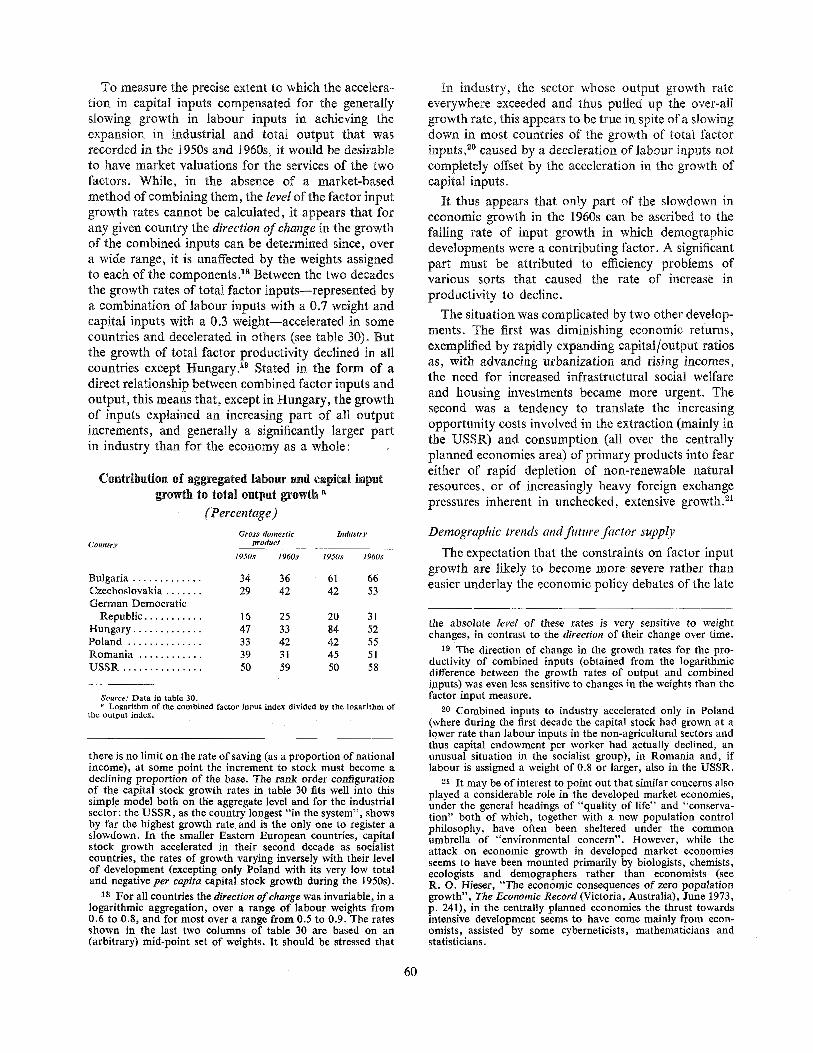
To measure the precise extent to which the accelera-tion in capital inputs compensated for the generallyslowing growth in labour inputs in achieving theexpansion in industrial and total output that wasrecorded in the 1950s and 1960s, it would be desirableto have market valuations for the services of the twofactors. While, in the absence of a market-basedmethod of combining them, the level of the factor inputgrowth rates cannot be calculated, it appears that forany given country the direction of change in the growthof the combined inputs can be determined since, overa wide range, it is unaffected by the weights assignedto each of the components 18 Between the two decadesthe growth rates of total factor inputs--represented bya combination of labour inputs with a 0.7 weight andcapital inputs with a 0.3 weight--accelerated in somecountries and decelerated in others (see table 30). Butthe growth of total factor productivity declined in allcountries except Hungary.19 Stated in the form of adirect relationship between combined factor inputs andoutput, this means that, except in Hungary, the growthof inputs explained an increasing part of all outputincrements, and generally a significantly larger partin industry than for the economy as a whole:
Contribution of aggregated labour and capital inputgrowth to total output growth a
(Percentage)
In industry, the sector whose output growth rateeverywhere exceeded and thus pulled up the over-allgrowth rate, this appears to be true in spite of a slowingdown in most countries of the growth of total factorinputs,2° caused by a deceleration of labour inputs notcompletely offset by the acceleration in the growth ofcapital inputs.
It thus appears that only part of the slowdown ineconomic growth in the 1960s can be ascribed to thefalling rate of input growth in which demographicdevelopments were a contributing factor. A significantpart must be attributed to efficiency problems ofvarious sorts that caused the rate of increase inproductivity to decline.
The situation was complicated by two other develop-ments. The first was diminishing economic returns,exemplified by rapidly expanding capital/output ratiosas, with advancing urbanization and rising incomes,the need for increased infrastructural social welfareand housing investments became more urgent. Thesecond was a tendency to translate the increasingopportunity costs involved in the extraction (mainly inthe USSR) and consumption (all over the centrallyplanned economies area) of primary products into feareither of rapid depletion of non-renewable naturalresources, or of increasingly heavy foreign exchangepressures inherent in unchecked, extensive growth.21
Gross domestic ltMttstryCouutry product
1950s 1960s 1950s 1960s
Demographic trends and future factor supply
Bulgaria ............. 34 36 61 66
Czechoslovakia ....... 29 42 42 53
German DemocraticRepublic ........... 16 25 20 31
Hungary ............. 47 33 84 52
Poland .............. 33 42 42 55
Romania ............ 39 31 45 51
USSR ............... 50 59 50 58
Source: Data in table 30.Logarithm of the combined factor input index divided by the logarithm of
thc output index.
there is no limit on the rate of saving (as a proportion of nationalincome), at some point the increment to stock must become adeclining proportion of the base. The rank order configurationof the capital stock growth rates in table 30 fits well into thissimple model both on the aggregate level and for the industrialsector: the USSR, as the country longest "in the system", showsby far the highest growth rate and is the only one to register asIowdown. In the smaller Eastern European countries, capitalstock growth accelerated in their second decade as socialistcountries, the rates of growth varying inversely with their levelof development (excepting only Poland with its very low totaland negative per capita capital stock growth during the 19500.
is For all countries the direction of change was invariable, in alogarithmic aggregation, over a range of labour weights from0.6 to 0.8, and for most over a range from 0.5 to 0.9. The ratesshown in the last two columns of table 30 are based on an(arbitrary) mid-point set of weights. It should be stressed that
The expectation that the constraints on factor inputgrowth are likely to become more severe rather thaneasier underlay the economic policy debates of the late
the absolute level of these rates is very sensitive to weightchanges, in contrast to the direction of their change over time.
19 The direction of change in the growth rates for the pro-ductivity of combined inputs (obtained from the logarithmicdifference between the growth rates of output and combinedinputs) was even less sensitive to changes in the weights than thefactor input measure.
2o Combined inputs to industry accelerated only in Poland(where during the first decade the capital stock had grown at alower rate than labour inputs in the non-agricultural sectors andthus capital endowment per worker had actually declined, anunusual situation in the socialist group), in Romania and, iflabour is assigned a weight of 0.8 or larger, also in the USSR.
2i It may be of interest to point out that similar concerns alsoplayed a considerable role in the developed market economies,under the general headings of "quality of life" and "conserva-tion" both of which, together with a new population controlphilosophy, have often been sheltered under the commonumbrella of "environmental concern". However, while theattack on economic growth in developed market economiesseems to have been mounted primarily by biologists, chemists,ecologists and demographers rather than economists (seeR. O. Hieser, "The economic consequences of zero populationgrowth", The Economic Record (Victoria, Australia), June 1973,p. 241), in the centrally planned economies the thrust towardsintensive development seems to have come mainly from econ-omists, assisted by some cyberneticists, mathematicians andstatisticians.
60
1960s with their stress on a changeover from a strategyrelying on "extensive" use of inputs to one stimulatingmuch more "intensive" utilization of the availablefactors of production.
The limitations affect both parts of the factor inputstream discussed here, though with different degreesof rigidity (and certainty). As far as the rate of capitalstock expansion is concerned, it is to be noted thateven during the 1960s, the observed acceleration in thegrowth of capital inputs into the growth-leadingindustrial sector was insufficient to offset the decliningrates of labour input growth. This reflects in partcapacity constraints in the investment goods industriesand in part the increasingly insistent capital needs ofagriculture and the "other" sectors which, having beenunder-emphasized during the initial period of theindustrialization drive, could no longer be ignored.22
Even if capital stock growth could be furtheraccelerated in some of the countries--and, as noted,in the USSR in the 1960s it actually slowed down fromits very high growth rate--it is almost bound ultimatelyto be limited by the conflicting claims of consumptionon the national dividend. The labour input growthrate, moreover, is expected to fall in all the centrallyplanned economies during the 1970s)s The expansionrate of the working age population will fall everywhereas a result of the steeply declining birth trends of thelate 1950s and early 1960s. The slowdown will be quitesharp and in several countries there will even be anabsolute contraction in working age cohorts.
some 20 percentage points above those in WesternEurope) are beginning to bump, but also because ofthe probable relationship between high female labourforce participation and the extremely low fertility levelsrecently experienced in those countries, which will feedback into lowered future labour supply. In a numberof countries this has already induced pro-natalistpolicy measures including, in addition to material andfinancial incentives for increased family formation,extensions of the maternity leave period up to severalyears, which by themselves indirectly or directly (ifsuccessful) may reduce female employment levels. Itseems likely, therefore, that demographic growth willhave a significantly stronger impact upon the laboursupply and development policy. BeCause of the sub-stantial convergence between the Eastern Europeancountries in output and demographic patterns, how-ever, this may not bring about greater differences indevelopment patterns.
The shift from agriculture into non-agriculturalemployment, even if it is to continue at the high ratesexperienced in several of the countries, will yielddecreasing absolute increments as the base contracts.Finally, as noted earlier, where labour force scarcitiesdid occur, they appear in the past to have beenmitigated not by a different growth policy but by the"mobilization" of labour force reserves, primarily ofwomen. This element of flexibility may by now havebeen largely exhausted--not only because there mayexist a de facto ceiling against which the female labourforce participation rates in Eastern Europe (which are
The dilemma facing the planners of Eastern Europelies in the dual role played by investment and thelimited degree of substitutability between capital andthe remaining factors of production. As the level ofinvestment determines the level of income and, there-fore, the size of accumulation, which in turn affects thevolume of productive capacity, it follows that incomemust grow if the expansion of capital accumulation isto be financed, However, if technologies remain un-altered and labour productivity does not improve, theexpansion of capital has to be accompanied by acorresponding expansion of the labour force. Con-versely, at any given level of income, to the extent thatsubstitution between factors is possible, lower rates ofpopulation expansion must be accompanied by pro-ductivity improvement through higher rates of capitalaccumulation. And the greater the r01e played bylabour-saving technological progress, invention andinnovation, the higher does the rate of accumulationhave to be if growth is to be maintained.
Impact on final demand shares
2z It should be noted that, in most countries of the region,capital inputs into agriculture expanded at notably high andaccelerating rates while labour input declined and output grewat relatively low rates. As a result, capital per worker increasedat by far the highest rates in this sector in all countries with acollectivized agriculture, though not in Poland, and the marginalcapital[output ratio in this sector increased sharply everywhere.Capital claims of the "other" sector include not only those ofthe production sectors complementary to industry (constructionand transport), but also those of housing.
2a Cf. L. Degtiar', "Ob isporzovanii trudovykh resursov vstranakh-chlenakh SEV" (On the utilization of labour resourcesin the CMEA member States), Foprosy ekonomild (Moscow),1974, No. 1, and country labour force projections cited there.
As indicated above, the pattern of economic develop-ment followed by all centrally planned economies ofEurope during the 1950s was characterized by highgrowth rates of output associated with a massivedeployment of all factors of production. The first fewyears of the 1960s, however, brought to light pressuresand imbalances of various kinds which caused con-siderable fluctuations in the expansion of income (seetable 33).
The simultaneity of these imbalances throughout thearea--despite wide country differences in economicstatus and in the incidence of specific events--suggeststhat the similarity that characterized planning strategy
61
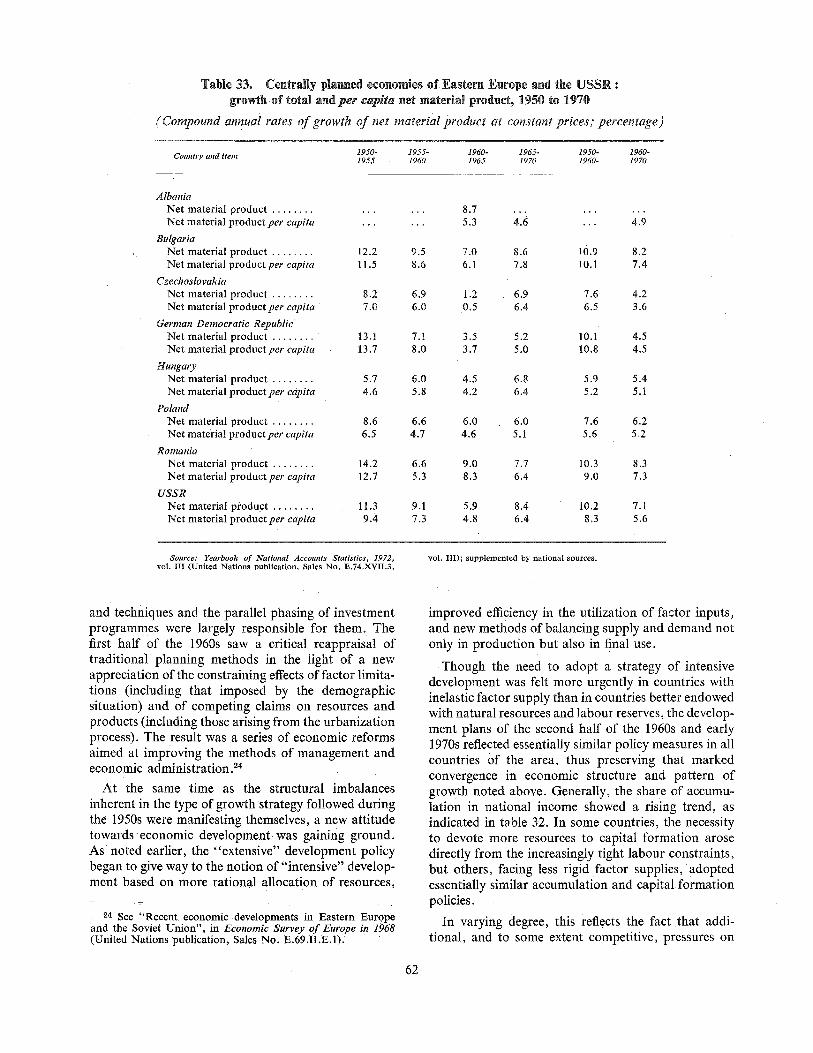
Table 33, Centrally planned econonfies of Eastern Europe and the USSR :growth of total and per eapiea net material product, 1950 to 1970
(Compound annual rates of growth of net material product at constant prices; percentage)
1950- 1955- 1960- 1965- 1950- 1960-Country and item 1955 1960 1965 1970 1960- 1970
AlbaniaNet material product .............. 8.7__ .......
Net material productper capita ...... 5.3 4.6 ... 4.9
BulgariaNet material product ........ 12.2 9.5 7.0 8.6 10.9 8.2
Net material product per capita 11.5 8.6 6.1 7.8 10.1 7.4
CzechoslovakiaNet material product ........ 8.2 6.9 1.2 6.9 7.6 4.2
Net material productper capita 7.0 6.0 0.5 6.4 6.5 3.6
German Democratic RepublicNet material pro duct ........ 13.1 7.1 3.5 5.2 10.1 4.5
Net material product per capita 13.7 8.0 3.7 5.0 10.8 4.5
HungaryNet material product ........ 5.7 6.0 4.5 6.8 5.9 5.4
Net material product per capita 4.6 5.8 4.2 6.4 5.2 5.1
PolandNet material product ........ 8.6 6.6 6.0 6.0 7.6 6.2
Net material product per capita 6.5 4.7 4.6 5.1 5.6 5.2
RomaniaNet material product ........ 14.2 6.6 9.0 7.7 10.3 8.3
Net material productper capita 12.7 5.3 8.3 6.4 9.0 7.3
USSRNet material product ........ 11.3 9.1 5.9 8.4 10.2 7.1
Net material productper capita 9.4 7.3 4.8 6.4 8.3 5.6
Source: Yearbook of National Accounts Statistics, 1972,vol. III (United Nations publication, Sales No. E.74.XVII.3,
vol. IID; supplemented by national sources.
and techniques and the parallel phasing of investmentprogrammes were largely responsible for them. Thefirst half of the 1960s saw a critical reappraisal oftraditional planning methods in the light of a newappreciation of the constraining effects of factor limita-tions (including that imposed by the demographicsituation) and of competing claims on resources andproducts (including those arising from the urbanizationprocess). The result was a series of economic reformsaimed at improving the methods of management andeconomic administration.24
At the same time as the structural imbalancesinherent in the type of growth strategy followed duringthe 1950s were manifesting themselves, a new attitudetowards economic development was gaining ground.As noted earlier, the "extensive" development policybegan to give way to the notion of "intensive" develop-ment based on more rational allocation of resources,
z4 See "Recent economic developments in Eastern Europeand the Soviet Union", in Economic Survey of Europe in 1968(United Nations publication, Sales No. E,69.II.E.1).
improved efficiency in the utilization of factor inputs,and new methods of balancing supply and demand notonly in production but also in final use.
Though the need to adopt a strategy of intensivedevelopment was felt more urgently in countries withinelastic factor supply than in countries better endowedwith natural resources and labour reserves, the develop-ment plans of the second half of the 1960s and early1970s reflected essentially similar policy measures in allcountries Of the area, thus preserving that markedconvergence in economic structure and pattern ofgrowth noted above. Generally, the share of accumu-lation in national income showed a rising trend, asindicated in table 32. In some countries, the necessityto devote more resources to capital formation arosedirectly from the increasingly tight labour constraints,but others, facing less rigid factor supplies, adoptedessentially similar accumulation and capital formationpolicies.
In varying degree, this reflects the fact that addi-tional, and to some extent competitive, pressures on
62
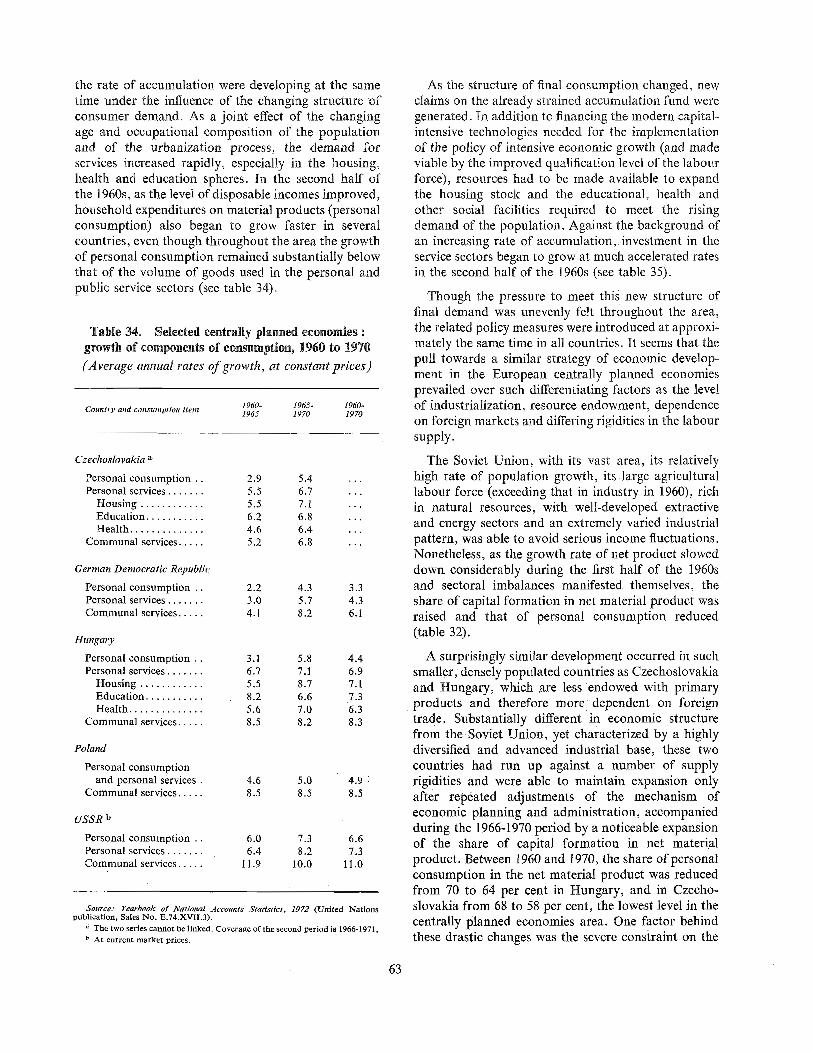
the rate of accumulation were developing at the sametime under the influence of the changing structure ofconsumer demand. As a joint effect of the changingage and occupational composition of the populationand of the urbanization process, the demand forservices increased rapidly, especially in the housing,health and education spheres. In the second half ofthe 1960s, as the level of disposable incomes improved,household expenditures on material products (personalconsumption) also began to grow faster in severalcountries, even though throughout the area the growthof personal consumption remained substantially belowthat of the volume of goods used in the personal andpublic service sectors (see table 34).
As the structure of final consumption changed, newclaims on the already strained accumulation fund weregenerated. In addition to financing the modern capital-intensive technologies needed for the implementationof the policy of intensive economic growth (and madeviable by the improved qualification level of the labourforce), resources had to be made available to expandthe housing stock and the educational, health andother social facilities required to meet the risingdemand of the population. Against the background ofan increasing rate of accumulation, investment in theservice sectors began to grow at much accelerated ratesin the second half of the !960s (see table 35).
Table 34. Selected centrally planned economies :growth of components of consumption, 1960 to 1970
(Average annual rates of growth, at constant prices)
Country and cousumption item 1960- 1965- 1960-1965 1970 1970
Czechoslovakia ÿ
Though the pressure to meet this new structure offinal demand was unevenly felt throughout the area,the related policy measures were introduced at approxi-mately the same time in all countries. It seems that thepull towards a similar strategy of economic develop-ment in the European centrally planned economiesprevailed over such differentiating factors as the levelof industrialization, resource endowment, dependenceon foreign markets and differing rigidities in the laboursupply.
Personal consumption .. 2.9 5.4 ...
Personal services ....... 5.5 6.7 ...
Housing ............ 5.5 7.1 ...
Education ........... 6.2 6.8 ...
Health .............. 4.6 6.4 ...
Communal services ..... 5.2 6.8 . ..
Poland
Personal consumptionand personal services . 4.6 5.0 4.9
Communal services ..... 8.5 8.5 8.5
USSR b
Personal consumption .. 6.0 7.3 6.6
Personal services ....... 6.4 8.2 7.3
Communal services ..... 11.9 10.0 11.0
2.2 4.3 3,3
3.0 5.7 4.3
4.1 8.2 6.1
3.1 5.8 4.4
6.7 7.1 6.9
5.5 8.7 7.1
8.2 6.6 7.3
5.6 7.0 6.3
8.5 8.2 8.3
Source: Yearbook of National Accounts Statistics, 1972 (United Nationspublication, Sales No. E.74.XVII.3).
a The two series cannot be linked. Coverage of the second period is 1966-1971.b At current market prices.
Hungary
Personal consumptionPersonal services .......
Housing ............
Education ...........
Health ..............
Communal services .....
German Democratic Republic
Personal consumption ..
Personal services .....
Communal services...
The Soviet Union, with its vast area, its relativelyhigh rate of population growth, its large agriculturallabour force (exceeding that in industry in 1960), richin natural resources, with well-developed extractiveand energy sectors and an extremely varied industrialpattern, was able to avoid serious income fluctuations.Nonetheless, as the growth rate of net product sloweddown considerably during the first half of the 1960sand sectoral imbalances manifested themselves, theshare of capital formation in net material product wasraised and that of personal consumption reduced(table 32).
A surprisingly similar development occurred in suchsmaller, densely populated countries as Czechoslovakiaand Hungary, which are less endowed with primaryproducts and therefore more dependent on foreigntrade. Substantially different in economic structurefrom the Soviet Union, yet characterized by a highlydiversified and advanced industrial base, these twocountries had run up against a number of supplyrigidities and were able to maintain expansion onlyafter repeated adjustments of the mechanism ofeconomic planning and administration, accompaniedduring the 1966-1970 period by a noticeable expansionof the share of capital formation in net materialproduct. Between 1960 and 1970, the share of personalconsumption in the net material product was reducedfrom 70 to 64 per cent in Hungary, and in Czecho-slovakia from 68 to 58 per cent, the lowest level in thecentrally planned economies area. One factor behindthese drastic changes was the severe constraint on the
63
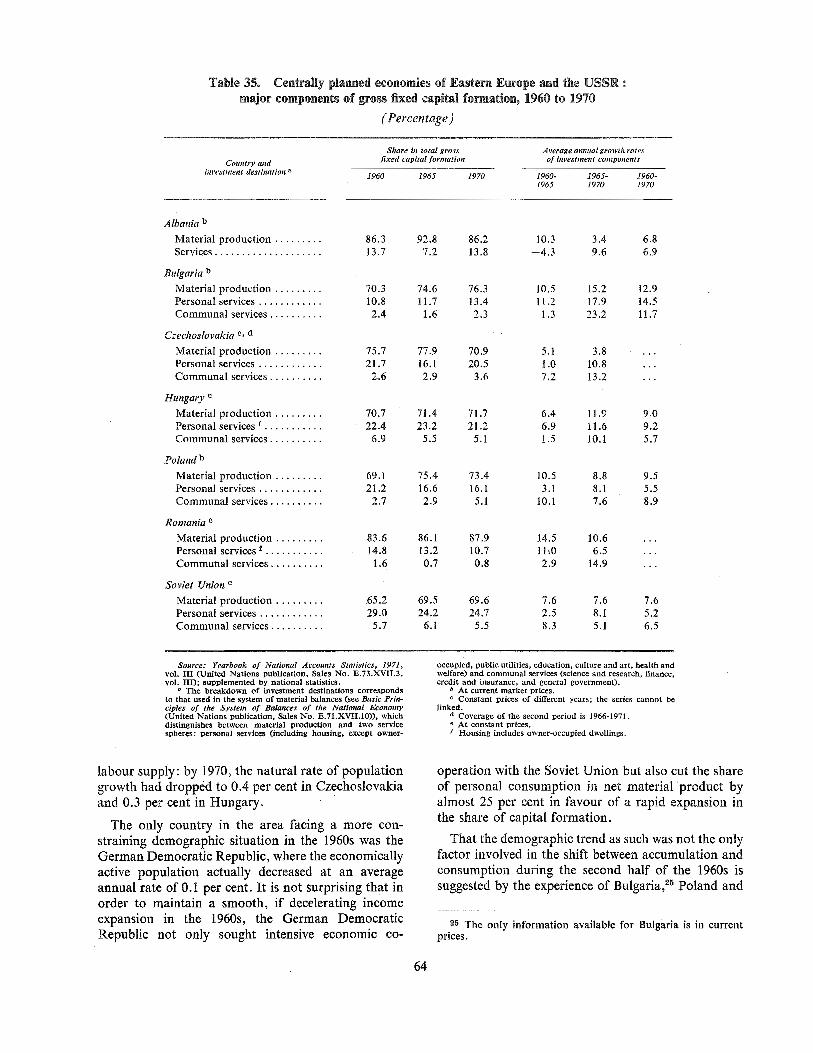
Table 35. Centrally planned economies of Eastern Europe and the USSR :major components of gross fixed capital formation, 1960 to lP70
(Percentage)
Cmtntry arminvestment destination ÿ
Shore io total grossfixed capital formation
Average annoal growth ratesof investment colaponents
1960 1965 1970 1960- 1965- 1960-1965 1970 1970
Albania bMaterial production ......... 86.3
Services .................... 13.7
92.8 86.2 10.3 3.4 6,87.2 13,8 --4,3 9.6 6,9
Bulgaria b
Material production .........
Personal services ............
Communal services ..........
70.310.82,4
Hungary e
Material production .........
Personal services r ...........
Communal services ..........
Ronlania e
Material production .........
Personal services ÿ ...........
Communal services ..........
Soviet Union e
Material production .........
Personal services ............
Communal services ..........
Poland b
Material production .........
Personal services ............
Communal services ..........
75.721.72,6
70.722.46.9
69.1 75.4 73.4 10.5 8.8 9.521.2 16,6 16.1 3.1 8.1 5.52.7 2.9 5.1 10.1 7.6 8.9
83.6 86.1 87.9 14.5 10.614.8 13.2 10.7 11ÿ0 6.51.6 0.7 0.8 2,9 14.9
65.2 69.5 69.6 7.6 7.6 7.629.0 24.2 24.7 2.5 8.1 5.2
5.7 6.1 5.5 8.3 5.1 6.5
Czechoslovakia e, d
Material production .........
Personal services ............
Communal servlces ..........
74.6 76.3 10,5 15.2 12.911.7 13,4 11.2 17.9 14.51.6 2.3 1.3 23.2 11.7
77.9 70,9 5.1 3.816,1 20,5 1.0 10,82,9 3.6 7.2 13.2
71.4 71,7 6.4 11.9 9.023.2 21.2 6.9 11.6 9.25.5 5.1 1.5 10.1 5.7
Source: Yearbook of National Accounts Statistics, 1971,vol. III (United Nations publication, Sales No. E.73.XVII.3,vol. lID; supplemented by national statistics.
a The breakdown of investment destinations correspondsto that used in the system of material balances (see Basic Prin-ciples of the System of Balances of the Natioaal Economy(United Nations publication, Sales No. E.71.XVII.10)), whichdistinguishes between material production and two servicespheres: personal services (including housing, except owner-
occupied, public utilities, education, culture and art, health andwelfare) and communal services (science and research, finance,credit and insurance, and general government).
At current market prices,e Constant prices of different years; the series cannot be
linked.a Coverage of the second period is 1966-1971.* At constant prices.! Housing includes owner-occupied dwellings,
labour supply: by 1970, the natural rate of populationgrowth had dropped to 0.4 per cent in Czechoslovakiaand 0.3 per cent in Hungary.
The only coumry in the area facing a more con-straining demographic situation in the 1960s was theGerman Democratic Republic, where the economicallyactive population actually decreased at an averageannual rate of 0.1 per cent. It is not surprising that inorder to maintain a smooth, if decelerating incomeexpansion in the 1960s, the German DemocraticRepublic not only sought intensive economic co-
operation with the Soviet Union but also cut the shareof personal consumption in net material product byalmost 25 per cent in favour of a rapid expansion inthe share of capital formation.
That the demographic trend as such was not the onlyfactor involved in the shift between accumulation andconsumption during the second half of the 1960s issuggested by the experience of Bulgaria,25 Poland and
25 The only information available for Bulgaria is in currentprices.
64
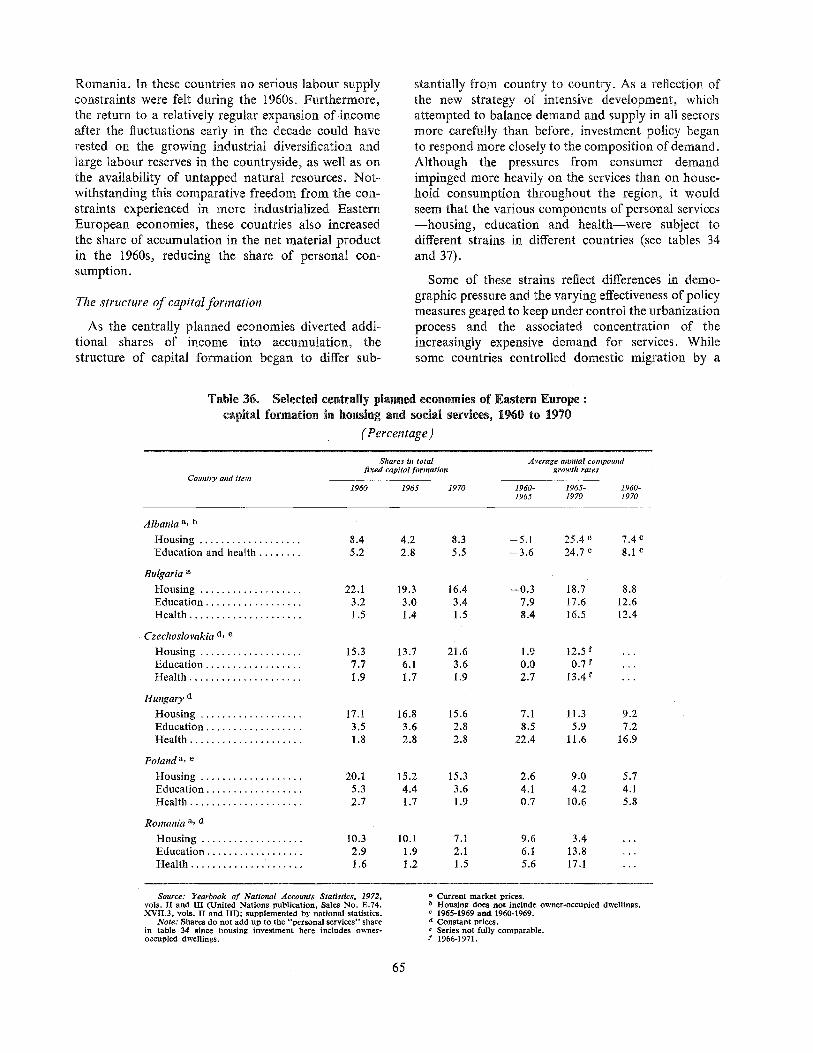
Romania. In these countries no serious labour supplyconstraints were felt during the 1960s. Furthermore,the return to a relatively regular expansion of incomeafter the fluctuations early in the decade could haverested on the growing industrial diversification andlarge labour reserves in the countryside, as well as onthe availability of untapped natural resources. Not-withstanding this comparative freedom from the con-straints experienced in more industrialized EasternEuropean economies, these countries also increasedthe share of accumulation in the net material productin the 1960s, reducing the share of personal con-sumption.
stantially from country to country. As a reflection ofthe new strategy of intensive development, whichattempted to balance demand and supply in all sectorsmore carefully than before, investment policy beganto respond more closely to the composition of demand.Although the pressures from consumer demandimpinged more heavily on the services than on house-hold consumption throughout the region, it wouldseem that the various components of personal services--housing, education and health--were subject todifferent strains in different countries (see tables 34and 37).
The structure of capital formation
As the centrally planned economies diverted addi-tional shares of income into accumulation, thestructure of capital formation began to differ sub-
Some of these strains reflect differences in demo-graphic pressure and the varying effectiveness of policymeasures geared to keep under control the urbanizationprocess and the associated concentration of theincreasingly expensive demand for services. Whilesome countries controlled domestic migration by a
Table 36. Selected centrally planned economies of Eastern Europe :capital formation in housing and social services, 1960 to 1970
(Percentage)
Shares tu total Average annual compoundfixed capital formation growth rates
COIIJUry altd item1960 1965 1970 1960- 1965- 1960-
1965 1970 1970
Albania a, b
Housing ................... 8.4
Education and health ........ 5.2
4.2 8.3 --5.1 25.4 e 7.4 e
2.8 5.5 --3.6 24.7 e 8.1 e
Bulgaria a
Housing ................... 22.1
Education .................. 3.2
Health ..................... 1.5
19.3 16.4 --0.3 18.7 8.8
3.0 3.4 7.9 17.6 12.61.4 1.5 8.4 16.5 12.4
Hungary a
Housing ................... 17.1
Education .................. 3.5
Health ..................... 1.8
Romania a, d
Housing ................... 10.3
Education .................. 2.9
Health ..................... 1.6
Polanda, e
Housing ................... 20.1
Education .................. 5.3
Health ..................... 2.7
Czechoslovakia d, e
Housing ................... 15.3
Education .................. 7.7
Health ..................... 1.9
13.7 21.6 1.9 12.5r6.1 3.6 0.0 0.7r
1.7 1.9 2.7 13.4f
16.8 15.6 7.1 11.3 9.23.6 2.8 8,5 5.9 7.2
2.8 2.8 22.4 11.6 16.9
15.2 15.3 2.6 9.0 5.74.4 3.6 4.1 4.2 4.11.7 1.9 0.7 10.6 5.8
10.1 7.1 9.6 3.41.9 2.1 6.1 13.81.2 1.5 5.6 17.1
Source: Yearbook of National Accounts Statistics, 1972,vols. II and III (United Nations publication, Sales No. E.74.XVII.3, vols. II and hi); supplemented by national statistics.
Note: Shares do not add up to the "personal services" sharein table 34 since housing investment here includes owner-occupied dwellings.
a Current market prices.b Housing does not include owner-occupied dwellings.c 1965-1969 and 1960-1969.
Constant prices.Series not fully comparable.
f 1966-1971,
65
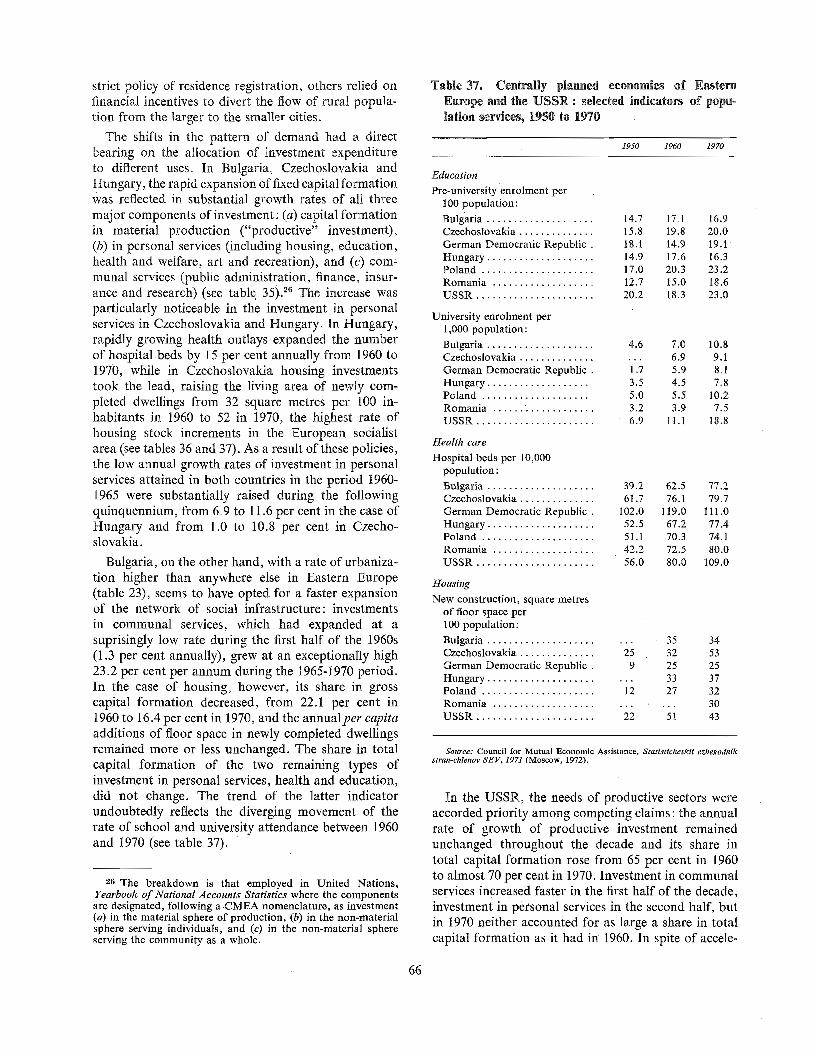
strict policy of residence registration, others relied onfinancial incentives to divert the flow of rural popula-tion from the larger to the smaller cities.
The shifts in the pattern of demand had a directbearing on the allocation of investment expenditureto different uses. In Bulgaria, Czechoslovakia andHungary, the rapid expansion of fixed capital formationwas reflected in substantial growth rates of all threemajor components of investment: (a) capital formationin material production ("productive" investment),(b) in personal services (including housing, education,health and welfare, art and recreation), and (c) com-munal services (public administration, finance, insur-ance and research) (see table 35).26 The increase wasparticularly noticeable in the investment in personalservices in Czechoslovakia and Hungary. In Hungary,rapidly growing health outlays expanded the numberof hospital beds by 15 per cent annually from 1960 to1970, while in Czechoslovakia housing investmentstook the lead, raising the living area of newly com-pleted dwellings from 32 square metres per 100 in-habitants in 1960 to 52 in 1970, the highest rate ofhousing stock increments in the European socialistarea (see tables 36 and 37). As a result of these policies,the low annual growth rates of investment in personalservices attained in both countries in the period 1960-1965 were substantially raised during the followingquinquennium, from 6.9 to 11.6 per cent in the case ofHungary and from 1.0 to 10.8 per cent in Czecho-slovakia.
Table 37. Centrally planned economies of EasternEurope and the USSR : selected indicators of popu-lation services, 1950 to 1971)
1950 1960 1970
Education
Pre-university enrolment per100 population:Bulgaria .................... 14.7 17.1 16.9
Czechoslovakia .............. 15.8 19.8 20.0
German Democratic Republic . 18.1 14.9 19.1Hungary .................... 14.9 17.6 16.3
Poland ..................... 17.0 20.3 23.2
Romania ................... 12.7 15.0 18.6
USSR ...................... 20.2 18.3 23.0
University enrolment per1,000 population:Bulgaria .................... 4.6 7.0 10.8
Czechoslovakia ................. 6.9 9.1
German Democratic Republic. 1.7 5.9 8.1Hungary ................... 3.5 4.5 7.8
Poland .................... 5.0 5.5 10.2
Romania ................... 3.2 3.9 7.5
USSR ...................... 6.9 11.1 18.8
26 The breakdown is that employed in United Nations,Yearbook of National Accounts Statistics where the componentsare designated, following a CMEA nomenclature, as investment(a) in the material sphere of production, (b) in the non-materialsphere serving individuals, and (c) in the non-material sphereserving the community as a whole.
Bulgaria, on the other hand, with a rate of urbaniza-tion higher than anywhere else in Eastern Europe(table 23), seems to have opted for a faster expansionof the network of social infrastructure: investmentsin communal services, which had expanded at asuprisingly low rate during the first half of the 1960s(1.3 per cent annually), grew at an exceptionally high23.2 per cent per annum during the 1965-1970 period.In the case of housing, however, its share in grosscapital formation decreased, from 22.1 per cent in1960 to 16.4 per cent in 1970, and the annualper capitaadditions of floor space in newly completed dwellingsremained more or less unchanged. The share in totalcapital formation of the two remaining types ofinvestment in personal services, health and education,did not change. The trend of the latter indicatorundoubtedly reflects the diverging movement of therate of school and university attendance between 1960and 1970 (see table 37).
Health care
Hospital beds per 10,000population:
Bulgaria ....................
Czechoslovakia ..............
German Democratic Republic .Hungary ....................
Poland .....................
Romania ...................
USSR ......................
Housing
New construction, square metres
of floor space per100 population:Bulgaria ....................
Czechoslovakia ..............
German Democratic Republic .Hungary ....................
Poland .....................
Romania ...................
USSR ......................
39.2 62.5 77.261.7 76.l 79.7
102.0 119.0 111.052.5 67.2 77.451.1 70.3 74.142.2 72.5 80.056.0 80.0 109.0
.. 35 34
25 32 539 25 25.. 33 37
12 27 32..... 30
22 51 43
SoUrce: Council for Mutual Economic Assistance, Statisticheskii ezhegodnikstran-chlenov SEV, 1971 (Moscow, 1972).
In the USSR, the needs of productive sectors wereaccorded priority among competing claims: the annualrate of growth of productive investment remainedunchanged throughout the decade and its share intotal capital formation rose from 65 per cent in 1960to almost 70 per cent in 1970. Investment in communalservices increased faster in the first half of the decade,investment in personal services in the second half, butin 1970 neither accounted for as large a share in totalcapital formation as it had in 1960. In spite of accele-
66
rated growth, during the second half of the 1960s, ofoutlays on new facilities needed to support the sub-stantial expansion of school and university enrolment,to meet the growing demand for medical attention andto extend the network of day-care centres vital in thecampaign to recruit women into the labour force,investment in personal services obtained a smaller shareof total capital formation in 1970 (25 per cent) thanin 1960 (29 per cent). Housing policy followed thesame course: in 1970, theper capita floor space of newdwellings completed was appreciably lower than in1960.
In the three remaining countries of the area,Albania, Poland and Romania, the pattern was morevaried. The growth rate in productive investmentdecreased markedly between the first and second halvesof the 1960s, but trends in the service sphere weremixed. In Romania, a shift of priorities from housingto education and health is observable. In Poland,outlays for new dwellings were especially high: percapita additions of housing space in 1970 were 23 percent above the 1965 level.27 In Albania, investmentexpenditures on personal services doubled during thesecond half of the 1960s, though their share in totalinvestment remained among the lowest in the area.
systemY In Eastern Europe, the inherited schoolsystems--ÿlitist and compartmentalized--were re-structured and made more accessible, making move-ment from the lower to the secondary and higher levelsof education possible for a much larger proportion ofthe population. Institutional innovations played asignificant role, especially in raising the qualificationsof the adult labour force during the 1950s, whenhistorical lags had to be remedied in the urban labourforce and large inflows of unskilled rural labour hadto be absorbed into the industrial system. Conse-quently, all levels of education saw the introductionof various types of part-time, evening and correspond-ence schools, factory schools and training courses.
The resultant broadening of the educational networkis reflected in substantial increases in the-age-specificenrolment ratios, especially at the secondary andhigher levels of education (see table 38). This intensiveaspect of educational growth was especially pronouncedduring the early 1950s, when the demographic pressurefrom the post-war birth cohorts was beginning to rise,but it continued into the 1960s as this generationreached secondary school age. After 1965, the absolutenumber of secondary school students began to declinein most countries.
Education and improvement of labour force quality
The changing structure of final demand reflects oneaspect of development policy common to all countriesof the area: the determined effort to raise the educa-tional level of the population and, concomitantly, thequality of the labour force--a requirement which wasreinforced by the demand for education generated byrising income levels. The claims of the educationalsystem on the disposition of the national productrepresent one of the variables most directly affected bydemographic trends. At the same time, changes in thelevel of educational attainment of the population havea considerable bearing on the composition of consumerdemand. On the supply side of the national product,furthermore, the investment in human resources toraise the qualifications of the labour force was a pre-condition for the introduction of more complex andcapital-intensive production technologies.
The educational effort took several forms. Therewas a general tendency, which still continues, to extendthe period of minimum compulsory education fromthe seven to eight years prevalent in the region at thebeginning of the period towards a basic 10-year
Givert the expansion of plant and instructional staff,the diminution of demographic pressure made possiblea further broadening of the educational base and, asnoted above, the late 1960s saw an extension of theobligatory schooling period in several countries.
27 An explanation of the Polish policy orientation may befound in the fact that post-war reconstruction was still claimingpart of the available investment resources, thus adding to thestrains of urbanization.
At the same time, however, the sharp decline in therate of increase in labour supply created a conflictbetween the need for additional manpower (whichcalled for the channelling of the increments in theworking age population into the labour force as fastas possible) and the need for improved qualificationlevels (which required the withholding of the enteringcohorts in order to provide them with more intensiveeducation). This conflict was not equally seriousthroughout the area; consequently, the policy measuresadopted during the decade differed from country tocountry. In the Eastern European group, the changein the rate of growth of investment in education andthe change of its share in total fixed capital formationwere positively correlated with the demographicpressure and, even more strongly, with the rate ofgrowth of income, but negatively related with the level
28 In the Soviet Union, the length of compulsory schoolingwas raised from seven to eight years in the late 1950s, and to10 years at the end of the 1960s. In Poland, the compulsoryperiod was extended from seven to eight years in 1965, and in theGerman Democratic Republic, 10 years of school attendancehas been the obligatory minimum since 1964.
67
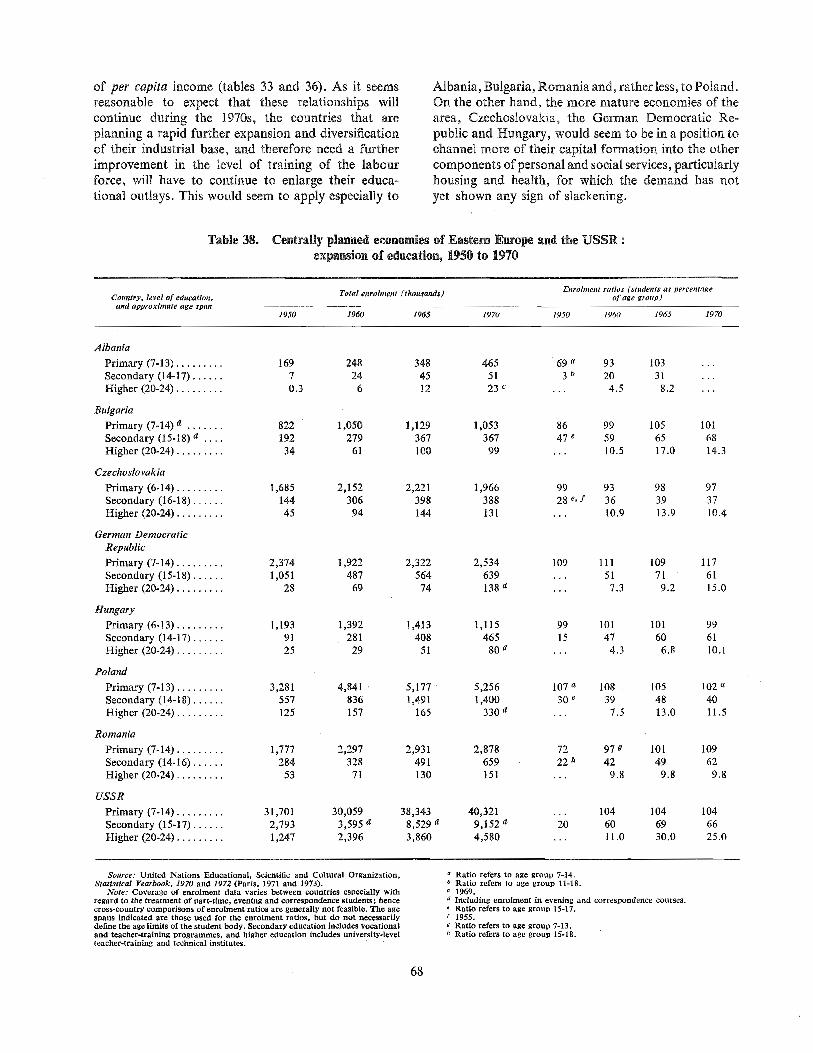
of per capita income (tables 33 and 36). As it seemsreasonable to expect that these relationships willcontinue during the 1970s, the countries that areplanning a rapid further expansion and diversificationof their industrial base, and therefore need a furtherimprovement in the level of training of the labourforce, will have to continue to enlarge their educa-tional outlays. This would seem to apply especially to
Albania, Bulgaria, Romania and, rather less, to Poland.On the other hand, the more mature economies of thearea, Czechoslovakia, the German Democratic Re-public and Hungary, would seem to be in a position tochannel more of their capital formation into the othercomponents of personal and social services, particularlyhousing and health, for which the demand has notyet shown any sign of slackening.
Table 38. Centrally planned economies of Eastern Europe and the USSR :expansion of education, 1950 to 1970
Country, level ofeducatlon, Total enrolment (thousands)and approximate age span
1950 1960 1965
Enrohnent ratios (students as percentageof age group)
1970 1950 1960 1965 1970
AlbaniaPrimary (7-13) ......... 169 248 348
Secondary (14-17) ...... 7 24 45Higher (20-24) ......... 0.3 6 12
465 69 a 93 10351 3 b 20 3123 e ... 4.5 8.2
BulgariaPrimary (%14) a ....... 822 1,050 1,129Secondary (15-18) a .... 192 279 367Higher (20-24) ......... 34 61 100
HungaryPrimary (6-13) ......... 1,193 1,392 1,413
Secondary (14-17) ...... 91 281 408Higher (20-24) ......... 25 29 51
PolandPrimary (7-13) ......... 3,281 4,841 5,177
Secondary (14-18) ...... 557 836 1,491Higher (20-24) ......... 125 157 165
Romania
Primary (7-14) ......... 1,777 2,297 2,931
Secondary (14-16) ...... 284 328 491Higher (20-24) ......... 53 71 130
USSRPrimary (7-14) ......... 31,701 30,059 38,343
Secondary (15-17) ...... 2,793 3,595 a 8,529 aHigher (20-24) ......... 1,247 2,396 3,860
German Democratic
RepublicPrimary (7-14) ......... 2,374 1,922 2,322
Secondary (15-18) ...... 1,051 487 564Higher (20-24) ......... 28 69 74
Czechoslovakia
Primary (6-14) ......... 1,685 2,152 2,221
Secondary (16-18) ...... 144 306 398Higher (20-24) ......... 45 94 144
1,966 99 93 98 97388 28 e,y 36 39 37131 ... 10.9 13.9 10.4
2,534 109 111 109 117639 ... 51 71 61138 a ... 7.3 9.2 15.0
1,115 99 101 101 99465 15 47 60 6180 a ... 4.3 6.8 10.1
5,256 107 a 108 105 102 "1,400 30 e 39 48 40
330 a ... 7.5 13.0 11.5
2,878 72 97 o 101 109659 22 n 42 49 62151 ... 9.8 9.8 9.8
40,321 ... 104 104 1049,152 a 20 60 69 664,580 ... 11.0 30.0 25.0
1,053 86 99 105 101367 47 e 59 65 6899 ... 10.5 17.0 14.3
Source: United Nations Educational, Scientific and Cultural Organization,Statistical Yearbook. 1970 and 1972 (Paris, 1971 and 1973).
Note: Coverage of enrolment data varies between countries especially withregard to the treatment of part-time, evening and correspondence students; hencecross-country comparisons of enrolment ratios are generally not feasible. The agespans indicated are those used for the enrolment ratios, but do not necessarilydefine the age limits of the student body. Secondary education includes vocationaland teacher-training programmes, and higher education includes university-levelteacher-training and technical institutes.
Ratio refers to age group 7-14.b Ratio refers to age group 11-18.
1969.a Including enrolment in evening and correspondence cotlrses.e Ratio refers to age group 15-17,I 1955.g Ratio refers to age group 7-13.n Ratio refers to age group 15-18.
68

Chapter IV
THE IMPACT OF RECENT DEMOGRAPHIC CHANGESIN THE DEVELOPING COUNTRIES
As indicated in chapter I above, the developingcountries are in various stages of the demographictransition from high vital rates to low. About 18 percent of the 1.7 billion people in the developing countriesfor which plausible estimates can be made live in the38 countries that have not yet begun the change. Abouta billion peoplemalmost 60 per cent of the developingcountry total--live in the 28 countries in which thedeath rate has begun to decline. About 11 per cent livein the 15 countries that are far along in the transition,with death rates down to low levels even though birthrates have changed very little. A similar group rep-resents the next stage in the transition, in whichnatality has also begun its decline. Only three countries--Argentina, Israel and Uruguay--have reached themature stage of low vital rates.
The main demographic characteristics of the devel-oping countries thus stem from the prevalence of highnatality and high, but rapidly declining, mortality?The first of these is the high rate of natural increase--averaging about 2.5 per cent a year, compared withabout 1 per cent in the more advanced countries. Thesecond is the short life expectancy--averaging about50 years for a newly born infant, compared with about70 years in the more advanced countries .2 The third isthe youthfulness of the population--more than 41 percent of the total are under 15 years of age, comparedwith less than 27 per cent in the more advancedcountries.
Apart from these basic demographic features, thedeveloping countries are characterized by a geo-graphical distribution of population that distinguishesthem from the more advanced countries: in the formerabout a fourth of the population lives in urban areas,as against two thirds in the latter. Rural populationstend to be not only much larger in the developingcountries, but in some cases much more concentrated.Partly as a result Of the distribution, the pace ofurbanization is much faster in the developing countries.However, while in the more advanced countries thetownward movement has brought about an abso!uteas well as a relative decline in rural population, in thedeveloping countries rural populations have continuedto increase at the relatively high rate of 1.7 per centa year.
This expansion in population has impinged upon theprocess of economic and social development at manypoints. It has affected the balance between consumptionand investment, for example, as well as the pattern ofexpenditure, both private and public. It has alsocomplicated the task of economic diversification onwhich development so greatly depends: fitting thestream of those graduating into the labour force--oftenfrom the subsistence sector--into useful employmentin the exchange economy has been, and remains, amatter of extreme difficulty in many developingcountries.
1 In the past 20 years, average crude death rates have hoveredbetween 9 and 10 per 1,000 of the population in the moreadvanced countries and fallen from 24 to 16 in the developingcountries.
2 Because infant mortality rates have declined much moreslowly in the developing countries than in the more advancedcountries (between the early 1950s and the late 1960s theiraverage decline was about a fourth in the former and a half inthe latter) and, at about 140 per 1,000 live births, are still aboutfive times as high, survival through infancy tends to lengthenlife expectancy in the developing countries. Thus, averageexpectation at age 5, for example, differs much less between thedeveloping and the more advanced countries: estimates of age-specific mortality based on censuses taken in the 1960s coveringabout 1.5 billion population more or less equally dividedbetween the developing countries and the rest of the world,suggest that life expectancy in the more advanced countries wasthree years less at age 5 than at birth, whereas in the developingcountries it was about seven years greater.
The precise economic impact of the demographicfactor is impossible to determine. In the developingcountries, much more than in the more advancedcountries, the dominant force tends to come from theforeign trade sector, from the discovery and exploi-tation of natural resources and even from the weather,rather than from changes in the size, or compositionor distribution of the population. Nevertheless, overa period of years, changes in family size and composi-tion clearly shape the pattern of household expenditure.Cumulated, the changes in household behaviour playtheir part in determining the course of national adjust-ment. Moreover, apart from the aggregative effects ofresponses to demographic changes at the micro level,there is a direct impact on the decisions that are made
69
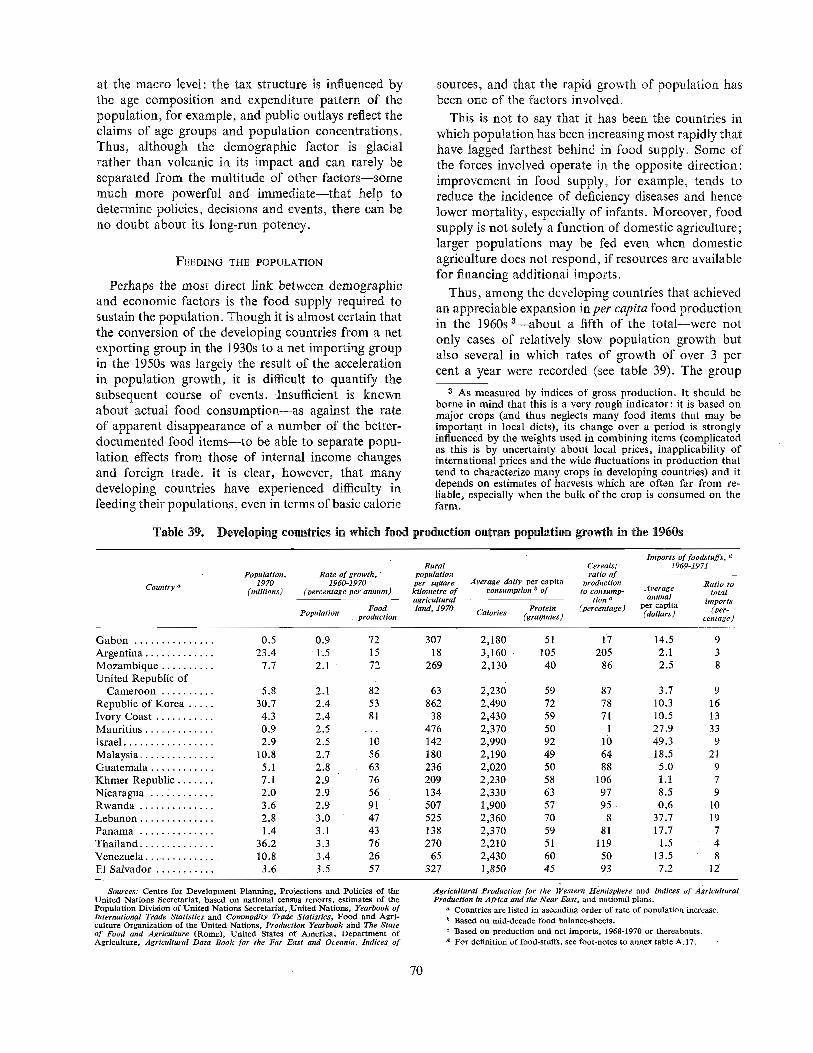
at the macro level: the tax structure is influenced bythe age composition and expenditure pattern of thepopulation, for example, and public outlays reflect theclaims of age groups and population concentrations°Thus, although the demographic factor is glacialrather than volcanic in its impact and can rarely beseparated from the multitude of other factors--somemuch more powerful and immediate--that help todetermine policies, decisions and events, there can beno doubt about its long-run potency°
sources, and that the rapid growth of population hasbeen one of the factors involved.
FEEDING THE POPULATION
Perhaps the most direct link between demographicand economic factors is the food supply required tosustain the population. Though it is almost certain thatthe conversion of the developing countries from a netexporting group in the 1930s to a net importing groupin the 1950s was largely the result of the accelerationin population growth, it is difficult to quantify thesubsequent course of events. Insufficient is knownabout actual food consumption--as against the rateof apparent disappearance of a number of the better-documented food items--to be able to separate popu-lation effects from those of internal income changesand foreign trade. It is clear, however, that manydeveloping countries have experienced difficulty infeeding their populations, even in terms of basic calorie
This is not to say that it has been the countries inwhich population has been increasing most rapidly thathave lagged farthest behind in food supply. Some ofthe forces involved operate in the opposite direction:improvement in food supply, for example, tends toreduce the incidence of deficiency diseases and hencelower mortality, especially of infants. Moreover, foodsupply is not solely a function of domestic agriculture;larger populations may be fed even when domesticagriculture does not respond, if resources are availablefor financing additional imports.
Thus, among the developing countries that achievedan appreciable expansion in per capita food productionin the 1960s a--about a fifth of the total--were not
only cases of relatively slow population growth butalso several in which rates of growth of over 3 percent a year were recorded (see table 39). The group
8 As measured by indices of gross production. It should beborne in mind that this is a very rough indicator: it is based onmajor crops (and thus neglects many food items that may beimportant in local diets), its change over a period is stronglyinfluenced by the weights used in combining items (complicatedas this is by uncertainty about local prices, inapplicability ofinternational prices and the wide fluctuations in production thattend to characterize many crops in developing countries) and itdepends on estimates of harvests which are often far from re-liable, especially when the bulk of the crop is consumed on thefarm.
Table 39. Developing countries in which food production outran population growth in the 1960s
Country ÿ
1reports of foodstuffs, aRural Cereals: 1969-1971
Population, Rate of growth, " population ratio of1970 1960-1970 per square Average daily per capita production Ratio to
(millions) (percentage per annum) kilometre of consumption ÿ of to consump- Average totalagricultural tlon c annual imports
capitaFood land, 1970 Calories Protein (percentage) P?ÿollars) (per-Population production (grammes) centage)
Gabon ............... 0.5 0.9 72
Argentina ............. 23.4 1.5 15
Mozambique .......... 7.7 2.1 72
United Republic ofCameroon .......... 5.8 2.1 82
Republic of Korea ..... 30.7 2.4 53
Ivory Coast ........... 4.3 2.4 81
Mauritius ............. 0.9 2.5 ...
Israel ................. 2.9 2.5 10
Malaysia .............. 10.8 2.7 56
Guatemala ............ 5.1 2.8 63
Khmer Republic ....... 7.1 2.9 76
Nicaragua ............ 2.0 2.9 56
Rwanda .............. 3.6 2.9 91
Lebanon .............. 2.8 3.0 47
Panama .............. 1.4 3.1 43
Thailand .............. 36.2 3.3 76
Venezuela ............. 10.8 3.4 26
E1 Salvador ........... 3.6 3.5 57
307 2,180 51 17 14.518 3,160 105 205 2.1
269 2,130 40 86 2.5
938
63 2,230 59 87 3.7 9862 2,490 72 78 10.3 1638 2,430 59 71 10.5 13
476 2,370 50 1 27.9 33142 2,990 92 10 49.3 9180 2,190 49 64 18.5 21236 2,020 50 88 5.0 9209 2,230 58 106 1.1 7134 2,330 63 97 8.5 9507 1,900 57 95 0,6 10525 2,360 70 8 37.7 19138 2,370 59 81 17.7 7270 2,210 51 119 1.5 465 2,430 60 50 13.5 8
327 1,850 45 93 7.2 12
Sources: Centre for Development Planning, Pro]ections and Policies of theUnited Nations Secretariat, based on national census reports, estimates of thePopulation Division of United Nations Secretariat, United Nations, Yearbook oflnteruational Trade Statistics and Commodity Trade Statistics, Food and Agri-culture Organization of the United Nations, Production Yearbook aiad The Stateof Food and Agriculture (Rome), United States of America, Department ofAgriculture, Agricultural Data Book for the Far East and Oceania, Indices of
Agricultural Production for the Western Hemisphere and Indices of AgriculturalProduction in Africa and the Near East, and national plans.
a Countries are listed in ascending order of rate of population increase.b Based on mid-decade food balance-sheets.e Based on production and net imports, 1968-1970 or thereabouts.a For definition of food-stuffs, see foot-notes to annex table A.17.
70
included some countries that were net exporters ofcereals (Argentina, the Khmer Republic and Thailand)as well as some that produced less than an eighth oftheir cereal requirements (Israel, Lebanon andMauritius). In most cases over 60 per cent of thepopulation was engaged in agriculture, but in somethe proportion was less than 30 per cent (Argentina,Israel and Venezuela). Rural population densitiesvaried widely--from less than 100 persons per squarekilometre in Argentina, Ivory Coast, the UnitedRepublic of Cameroon, and Venezuela to over 500 inLebanon, the Republic of Korea and Rwanda.
urbanization, the rural population has begun to declinein absolute numbers (in t971 it was estimated to be7 per cent below its mid-1960s peak). A reduction inboth the average size of households (by about 5 percent in the course of the decade to just under six per-sons) and in the average number of households persquare kilometre of arable land is expected to permitimprovements in farm organization, especially in theupland, rain-watered areas.
Despite the relatively satisfactory agricultural per-formance, sizeble food imports were required in anumber of cases: at the end of the decade they amountedto more than a sixth of all imports in Lebanon,Malaysia and Mauritius and cost over $25 a year perinhabitant in Israel, Lebanon and Mauritius. Andthese imports, combined with the high rates of increasein per capita food production, did not always ensureadequate nutritional status of the population: percapita calorie intake was below 2,100 calories a dayin E1 Salvador, Guatemala and Rwanda andper capitaprotein intake below 50 grammes a day in E1 Salvador,Malaysia and Mozambique.
Thus, even a high rate of increase in food productionmay not obviate a rising food import bill in countriesin which population is growing rapidly or pressingheavily on the land. In the Republic of Korea, forexample, the very high rural density has made itextremely difficult to produce adequate supplies ofgrain. With all the lowlands under cultivation,increasing areas being taken over for urban, industrialand transport uses, and attempts to reclaim tidelands--which had yielded an extra 5,000 hectares a year inthe second half of the 1960s--now abandoned as toocostly, an increasing proportion of land is beingplanted with higher-price, labour-intensive crops suchas vegetables and fruits. Demand for grain--especiallyrice and wheat--has been increasing at about 6 percent a year, almost twice as fast as production, leavinga widening gap to be filled by imports, and this gapmay widen even faster if demand for meat increasesmore rapidly in the wake of rising incomes .4
A high population density also determines thepattern of agriculture in Lebanon, where only a fourthof the land area is arable and most farm householdssupplement their income from other types of employ-ment. Though food output has outstripped populationgrowth, the increase has been chiefly in fruit andvegetables, a large proportion of which is exported;imports still provide the bulk of domestic requirementsof cereals and sugar. In Rwanda, too, there has beenlittle or no advance inper capita grain production; theincrease in food output has been partly in beans andpeas, partly in potatoes and cassava but chiefly inplantains and bananas. Mauritius, another country ofextremely high rural density, continues to be almostcompletely dependent on imports for cereal supplies;the increase in food production has been confined tosugar and vegetables and other intensive crops.
E1 Salvador has a more balanced agriculture. In the1960s, cereal production increased more than that ofcoffee and cotton, the main export crops, mainly as aresult of higher yields. High population density hasmade it difficult to expand areas under cultivation.The extension that has occurred has often been intomarginal land and up unsuitable hillsides. This hasgiven rise to accelerated soil erosion and has alsointroduced a greater element of instability in output.
4 Food-grain imports were approaching 3 million tons a yearin the early 1970s, almost six times as much as in the early 1960sand over one third of domestic production. Feed-grain imports,which were negligible in the early 1960s, had reached 0.5 milliontons. The most rapid expansion in food consumption in the 1960swas of milk and eggs.
The demographic pressures are easing in the Republicof Korea. Under the combined influences of risinglevels of living and public policy in respect of familyplanning, the growth rate is decelerating (to below2 per cent in the early 1970s) and, as a result of rapid
In most of the other countries in which food pro-duction has been running ahead of population, pressureon the land is less intense. In most cases, indeed, theexpansion in output in the 1960s was in large measurethe result of extension of cultivation. This has givenrise to difficulties in some areas of locally high densityor unfavourable climate or topography. Even inThailand, for example, the exhaustion of croplandreserve is now thought to lie only a decade away. Inthe north-east, where population densities tend to behighest, land that is officially classified as forest hassuffered major inroads for purposes of "shifting"cultivation. Even in the more productive central regionof the country, farm size is getting smaller and theproblem of fragmentation of holdings more serious.
In Thailand, and in other countries in which farmingis a largely self-sufficient operation, the availability ofland has prevented an upsurge in unemployment: thebulk of the increment in the labour force has been
71
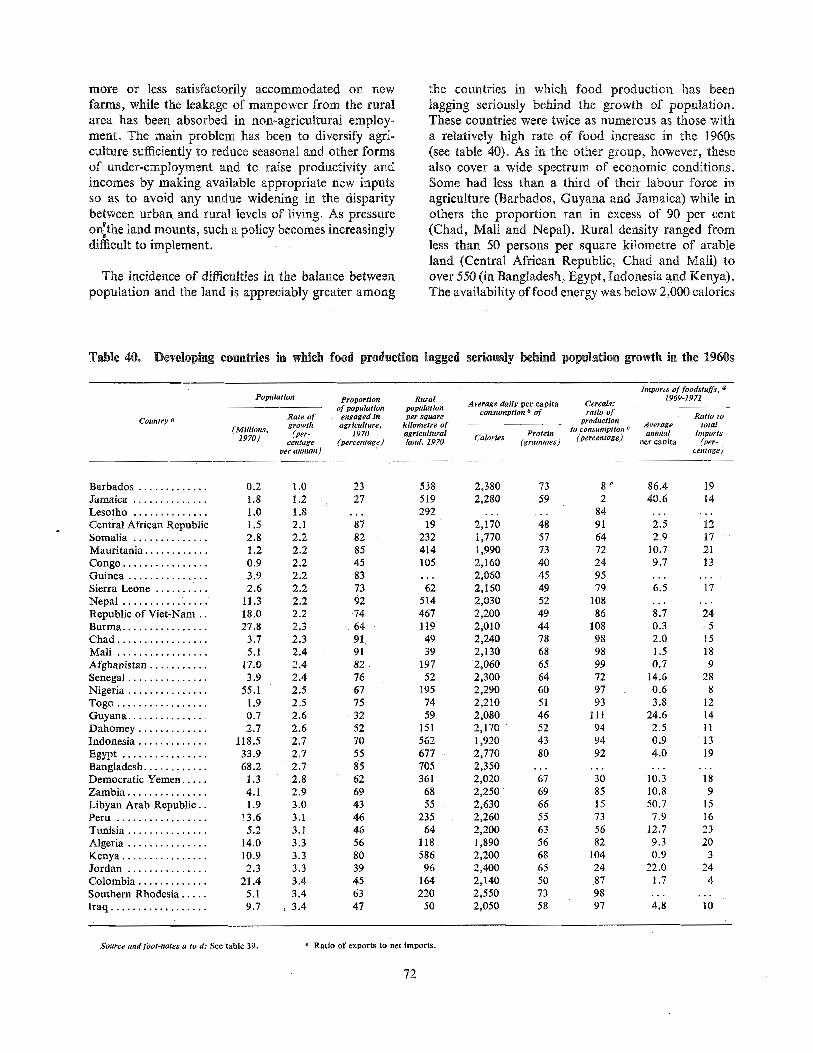
more or less satisfactorily accommodated on newfarms, while the leakage of manpower from the rura!area has been absorbed in non-agricultural employ-ment. The main problem has been to diversify agri-culture sufficiently to reduce seasonal and other formsof under-employment and to raise productivity andincomes by making available appropriate new inputsso as to avoid any undue widening in the disparitybetween urban and rural levels of living. As pressureonÿ,the land mounts, such a policy becomes increasinglydifficult to implement.
The incidence of difficulties in the balance betweenpopulation and the land is appreciably greater among
the countries in which food production has beenlagging seriously behind the growth of population,These countries were twice as numerous as those witha relatively high rate of food increase in the 1960s(see table 40). As in the other group, however, thesealso cover a wide spectrum of economic conditions.Some had less than a third of their labour force inagriculture (Barbados, Guyana and Jamaica) while inothers the proportion ran in excess of 90 per cent(Chad, Mali and Nepal). Rural density ranged fromless than 50 persons per square kilometre of arableland (Central African Republic, Chad and Mall) toover 550 (in Bangladesh, Egypt, Indonesia and Kenya).The availability of food energy was below 2,000 calories
Table 40. Develophg countries in which food production lagged seriously behind population growth in the 1960s
Country tÿ
Imports of foodstuffs, aPopulation Proportion Rural 1969-1971
of population population Average dally per capita Cereals:Rate of engaged in per square consumption ÿ of ratio of Ratio to
(Millions, growth agriculture, kilometre of production Average totalto consampttou c1970) (per- 1970 agricultural Protein annual intportscentage (percentage) land, 1970 Calories (grammes) (percentage) per capita (per-
IJer annum) centage)
Barbados ............. 0.2 1.0
Jamaica .............. 1.8 1.2
Lesotho .............. 1.0 1.8
Central African Republic 1.5 2.1Somalia .............. 2.8 2.2
Mauritania ............ 1.2 2°2
Congo ................ 0.9 2.2
Guinea ............... 3.9 2.2
Sierra Leone .......... 2.6 2.2
Nepal ................ 11.3 2.2
Republic of Viet-Nam.. 18.0 2.2Burma ................ 27.8 2.3
Chad ................. 3.7 2.3
Mall ................. 5.1 2.4
Afghanistan ........... 17.0 2.4
Senegal ............... 3.9 2.4
Nigeria ............... 55.1 2.5
Togo ................. 1.9 2.5
Guyana ............... 0.7 2.6
Dahomey ............. 2.7 2.6
Indonesia ............. 118.5 2.7
Egypt ................ 33.9 2.7
Bangladesh ............ 68.2 2.7
Democratic Yemen ..... 1.3 2.8
Zambia ............... 4.1 2.9
Libyan Arab Republic.. 1.9 3.0Peru ................. 13.6 3.1
Tunisia ............... 5.2 3. I
Algeria ............... 14.0 3.3
Kenya ................ 10.9 3.3
Jordan ............... 2.3 3.3
Colombia ............. 21.4 3.4
Southern Rhodesia ..... 5.1 3.4
Iraq .................. 9.7 3.4
23 538 2,380 73 8 e 86.4 1927 519 2,280 59 2 40.6 14... 292 ...... 84 ......
87 19 2,170 48 91 2.5 1282 232 1,770 57 64 2.9 1785 414 1,990 73 72 10.7 2145 105 2,160 40 24 9.7 1383 ... 2,060 45 95 ......
73 62 2,160 49 79 6.5 1792 514 2,030 52 108 ......74 467 2,200 49 86 8.7 2464 119 2,010 44 108 0.3 591. 49 2,240 78 98 2.0 1591 39 2,130 68 98 1.5 1882 197 2,060 65 99 0.7 976 52 2,300 64 72 14.6 2867 195 2,290 60 97 0.6 875 74 2,210 51 93 3.8 1232 59 2,080 46 111 24.6 1452 151 2,170 52 94 2.5 1170 562 1,920 43 94 0.9 1355 677 2,770 80 92 4.0 1985 705 2,350 ............
62 361 2,020 67 30 10.3 1869 68 2,250 69 85 10.8 943 55 2,630 66 15 50.7 1546 235 2,260 55 73 7.9 1646 64 2,200 63 56 12.7 2356 118 1,890 56 82 9.3 2080 586 2,200 68 104 0.9 339 96 2,400 65 24 22.0 2445 164 2,140 50 87 1.7 463 220 2,550 73 98 ......
47 50 2,050 58 97 4,8 10
Source and foot-notes a to d: See table 39. e Ratio of exports to net imports.
72
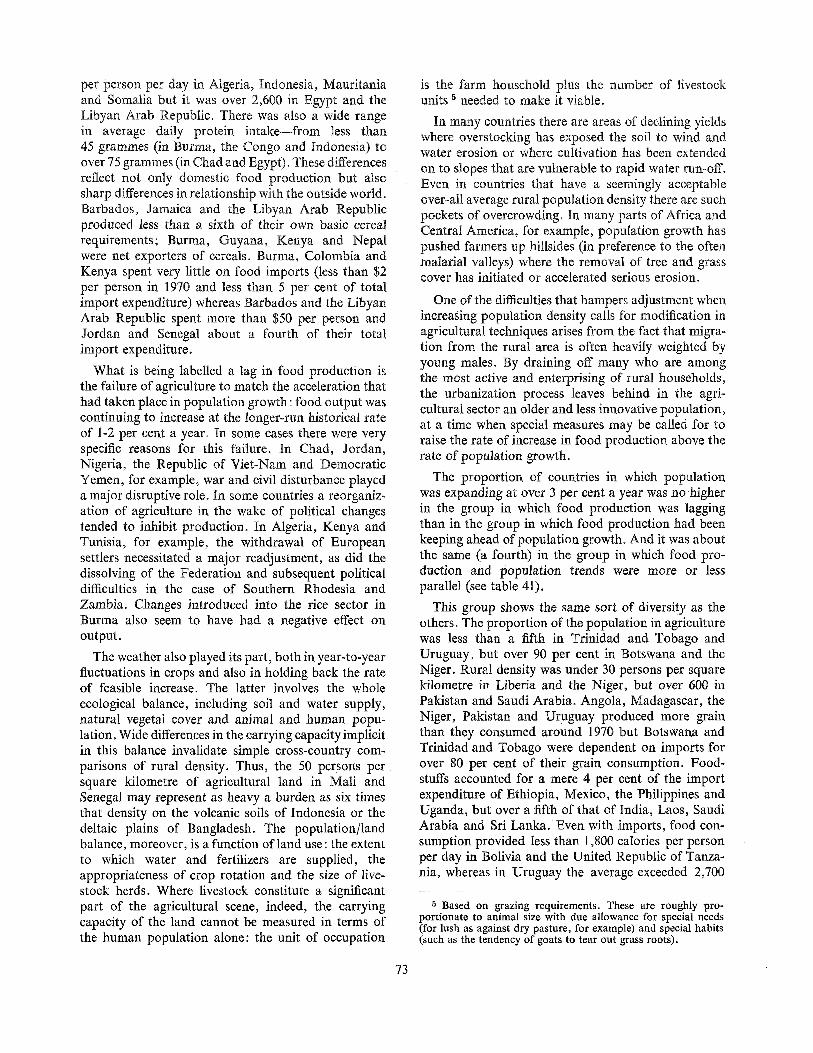
per person per day in Algeria, Indonesia, Mauritaniaand Somalia but it was over 2,600 in Egypt and theLibyan Arab Republic. There was also a wide rangein average daily protein intake from less than45 grammes (in Burma, the Congo and Indonesia) toover 75 grammes (in Chad and Egypt). These differencesreflect not only domestic food production but alsosharp differences in relationship with the outside world.Barbados, Jamaica and the Libyan Arab Republicproduced less than a sixth of their own basic cerealrequirements; Burma, Guyana, Kenya and Nepalwere net exporters of cereals. Burma, Colombia andKenya spent very little on food imports (less than $2per person in 1970 and less than 5 per cent of totalimport expenditure) whereas Barbados and the LibyanArab Republic spent more than $50 per person andJordan and Senegal about a fourth of their totalimport expenditure.
is the farm household plus the number of livestockunits 5 needed to make it viable.
In many countries there are areas of declining yieldswhere overstocking has exposed the soil to wind andwater erosion or where cultivation has been extendedon to slopes that are vulnerable to rapid water run-off.Even in countries that have a seemingly acceptableover-all average rural population density there are suchpockets of overcrowding. In many parts of Africa andCentral America, for example, population growth haspushed farmers up hillsides (in preference to the oftenmalarial valleys) where the removal of tree and grasscover has initiated or accelerated serious erosion.
What is being labelled a lag in food production isthe failure of agriculture to match the acceleration thathad taken place in population growth: food output wascontinuing to increase at the longer-run historical rateof 1-2 per cent a year. In some cases there were veryspecific reasons for this failure. In Chad, Jordan,Nigeria, the Republic of Viet-Nam and DemocraticYemen, for example, war and civil disturbance playeda major disruptive role. In some countries a reorganiz-ation of agriculture in the wake of political changestended to inhibit production. In Algeria, Kenya andTunisia, for example, the withdrawal of Europeansettlers necessitated a major readjustment, as did thedissolving of the Federation and subsequent politicaldifficulties in the case of Southern Rhodesia andZambia. Changes introduced into the rice sector inBurma also seem to have had a negative effect onoutput.
One of the difficulties that hampers adjustment whenincreasing population density calls for modification inagricultural techniques arises from the fact that migra-tion from the rural area is often heavily weighted byyoung males. By draining off many who are amongthe most active and enterprising of rural households,the urbanization process leaves behind in the agri-cultural sector an older and less innovative population,at a time when special measures may be called for toraise the rate of increase in food production above therate of population growth.
The proportion of countries in which populationwas expanding at over 3 per cent a year was no higherin the group in which food production was laggingthan in the group in which food production had beenkeeping ahead of population growth. And it was aboutthe same (a fourth) in the group in which food pro-duction and population trends were more or lessparallel (see table 41).
The weather also played its part, both in year-to-yearfluctuations in crops and also in holding back the rateof feasible increase. The latter involves the wholeecological balance, including soil and water supply,natural vegetal cover and animal and human popu-lation. Wide differences in the carrying capacity implicitin this balance invalidate simple cross-country com-parisons of rural density. Thus, the 50 persons persquare kilometre of agricultural land in Malt andSenegal may represent as heavy a burden as six timesthat density on the volcanic soils of Indonesia or thedeltaic plains of Bangladesh. The population/landbalance, moreover, is a function of land use: the extentto which water and fertilizers are supplied, theappropriateness of crop rotation and the size of live-stock herds. Where livestock constitute a significantpart of the agricultural scene, indeed, the carryingcapacity of the land cannot be measured in terms ofthe human population alone: the unit of occupation
This group shows the same sort of diversity as theothers. The proportion of the population in agriculturewas less than a fifth in Trinidad and Tobago andUruguay, but over 90 per cent in Botswana and theNiger. Rural density was under 30 persons per squarekilometre in Liberia and the Niger, but over 600 inPakiStan and Saudi Arabia. Angola, Madagascar, theNiger, Pakistan and Uruguay produced more grainthan they consumed around 1970 but Botswana andTrinidad and Tobago were dependent on imports forover 80 per cent of their grain consumption. Food-stuffs accounted for a mere 4 per cent of the importexpenditure of Ethiopia, Mexico, the Philippines andUganda, but over a fifth of that of India, Laos, SaudiArabia and Sri Lanka. Even with imports, food con-sumption provided less than 1,800 calories per personper day in Bolivia and the United Republic of Tanza-nia, whereas in Uruguay the average exceeded 2,700
5 Based on grazing requirements. These are roughly pro-portionate to animal size with due allowance for special needs(for lush as against dry pasture, for example) and special habits(such as the tendency of goats to tear out grass roots).
73
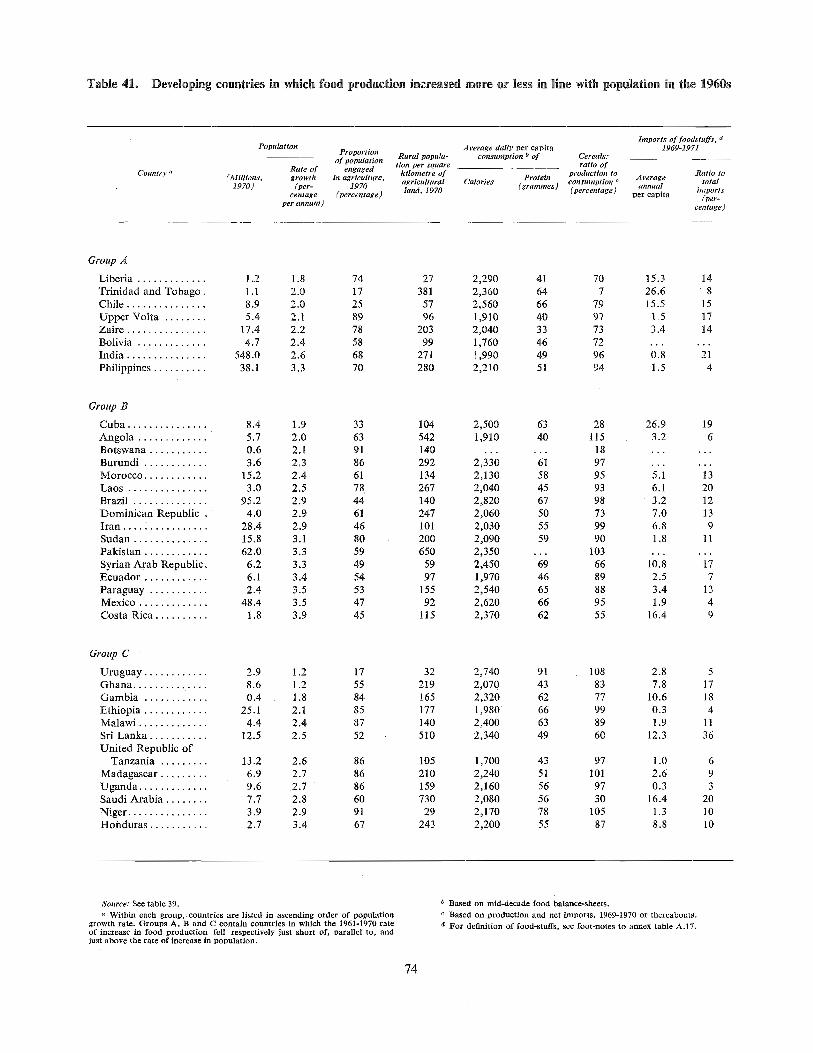
Table 41. Developing countries in which food production increased more or less in llne with popuhtlon ÿn the 1960s
Country a
hnports of foodstuffs, aPopulation Average daily per capita 1969-1971
Proportion Rural popula- consumption b of Cereals:of population lion per square ratio of
Rate of engaged kilometre of production to Ratio to(Aaiillions, growth in agriculture, agricultural Calories Protein Average total
1970) (per- 1970 (grammes) consumption e annualimportscentage (percentage) land, I970 (percentage) per capita (pea'-
per annum) centage)
Group A
Liberia ............. 1.2 1.8 74 27 2,290 41 70 15.3 14
Trinidad and Tobago. 1.1 2.0 17 381 2,360 64 7 26.6 8Chile ............... 8.9 2.0 25 57 2,560 66 79 15.5 15
Upper Volta ........ 5.4 2.1 89 96 1,910 40 97 1.5 17
Zaire ............... 17.4 2.2 78 203 2,040 33 73 3.4 14
Bolivia ............. 4.7 2.4 58 99 1,760 46 72 ......
India ............... 548.0 2.6 68 271 1,990 49 96 0.8 21
Philippines .......... 38.1 3.3 70 280 2,210 51 94 1.5 4
Group B
Cuba ............... 8.4 1.9 33 104 2,500 63 28 26.9 19
Angola ............. 5.7 2.0 63 542 1,910 40 115 3.2 6
Botswana ........... 0.6 2.1 91 140 ...... 18 ......
Burundi ............ 3,6 2.3 86 292 2,330 61 97 ......
Morocco ............ 15.2 2.4 61 134 2,130 58 95 5.1 13
Laps ............... 3.0 2.5 78 267 2,040 45 93 6.1 20
Brazil .............. 95.2 2.9 44 !40 2,820 67 98 3.2 12
Dominican Republic . 4.0 2.9 61 247 2,060 50 73 7.0 13Iran .... ÿ ........... 28.4 2.9 46 101 2,030 55 99 6.8 9
Sudan .............. 15.8 3.1 80 200 2,090 59 90 1.8 11
Pakistan ............ 62.0 3.3 59 650 2,350 ... 103 ......
Syrian Arab Republic. 6.2 3.3 49 59 2,450 69 66 10.8 17Ecuador ............ 6.1 3.4 54 97 1,970 46 89 2.5 7
Paraguay ........... 2.4 3.5 53 155 2,540 65 88 3.4 13
Mexico ............. 48.4 3.5 47 92 2,620 66 95 1.9 4
Costa Rica .......... 1.8 3.9 45 115 2,370 62 55 16.4 9
Group C
Uruguay ............ 2.9 1.2 17 32 2,740 91 108 2.8 5
Ghana .............. 8.6 1.2 55 219 2,070 43 83 7.8 17
Gambia ............ 0.4 1.8 84 165 2,320 62 77 10.6 !8
Ethiopia ............ 25.1 2.1 85 177 1,980 66 99 0.3 4
Malawi ............. 4.4 2.4 87 140 2,400 63 89 1.9 11
Sri Lanka ........... 12.5 2.5 52 510 2,340 49 60 12.3 36
United Republic ofTanzania ......... 13.2 2.6 86 105 1,700 43 97 1.0 6
Madagascar ......... 6.9 2.7 86 210 2,240 51 101 2.6 9
Uganda ............. 9.6 2.7 86 159 2,160 56 97 0.3 3
Saudi Arabia ........ 7.7 2.8 60 730 2,080 56 30 16.4 20Niger ............... 3.9 2.9 91 29 2,170 78 105 1.3 10
Honduras ........... 2.7 3.4 67 243 2,200 55 87 8.8 10
Source: See table 39.s Within each group, countries are listed in ascending order of population
growth rate. Groups A, B and C contain countries in which the 1961-1970 rateof increase in food production fell respectively just short of, parallel to, andjust above the rate of increase in population.
b Based on mid-decade food balance-sheets.e Based on production and net imports, 1969-1970 or thereabouts.a For definition of food-stuffs, see foot-notes to annex table A.17.
74
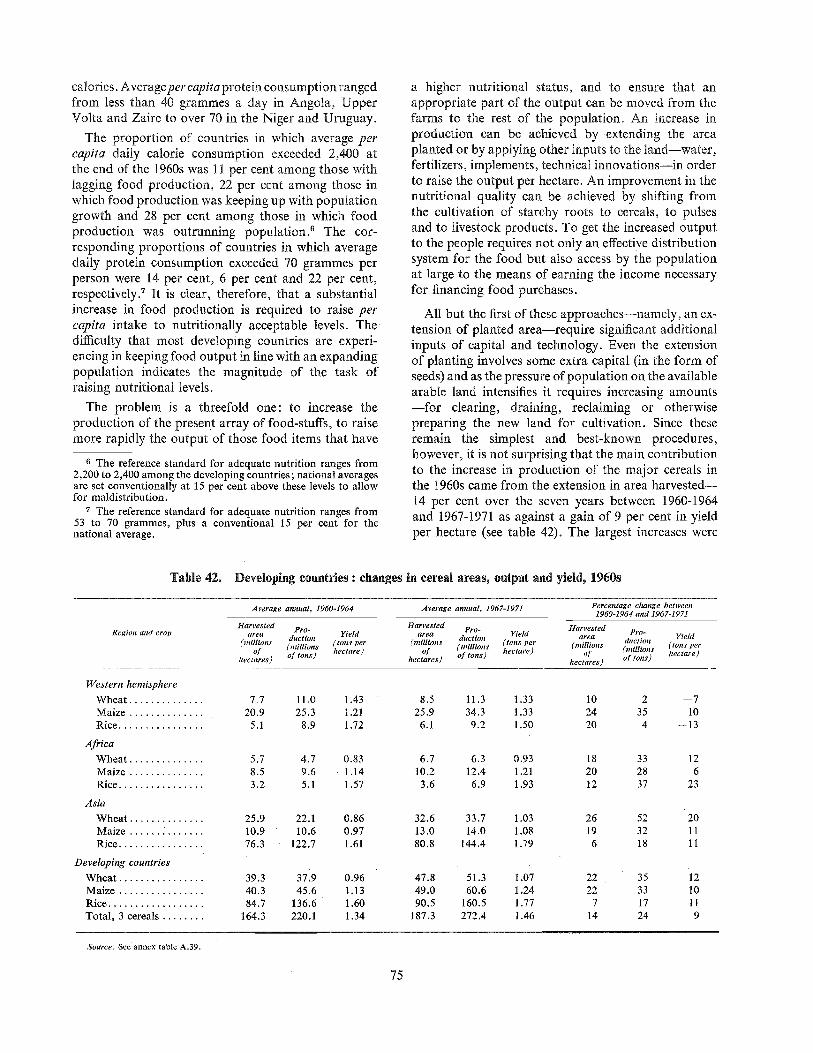
calories. Averageper capita protein consumption rangedfrom less than 40 grammes a day in Angola, UpperVolta and Zaire to over 70 in the Niger and Uruguay.
The proportion of countries in which average percapita daily calorie consumption exceeded 2,400 atthe end of the 1960s was 11 per cent among those withlagging food production, 22 per cent among those inwhich food production was keeping up with populationgrowth and 28 per cent among those in which foodproduction was outrunning population.6 The cor-responding proportions of countries in which averagedaily protein consumption exceeded 70 grammes perperson were 14 per cent, 6 per cent and 22 per cent,respectively.7 It is clear, therefore, that a substantialincrease in food production is required to raise pet"capita intake to nutritionally acceptable levels. Thedifficulty that most developing countries are experi-encing in keeping food output in line with an expandingpopulation indicates the magnitude of the task ofraising nutritional levels.
The problem is a threefold one: to increase theproduction of the present array of food-stuffs, to raisemore rapidly the output of those food items that have
a higher nutritional status, and to ensure that anappropriate part of the output can be moved from thefarms to the rest of the population° An increase inproduction can be achieved by extending the areaplanted or by applying other inputs to the land--water,fertilizers, implements, technical innovations--in orderto raise the output per hectare. An improvement in thenutritional quality can be achieved by shifting fromthe cultivation of starchy roots to cereals, to pulsesand to livestock products. To get the increased outputto the people requires not only an effective distributionsystem for the food but also access by the populationat large to the means of earning the income necessaryfor financing food purchases.
6 The reference standard for adequate nutrition ranges from2,200 to 2,400 among the developing countries; national averagesare set conventionally at 15 per cent above these levels to allowfor maldistribution.
7 The reference standard for adequate nutrition ranges from53 to 70 grammes, plus a conventional 15 per cent for thenational average.
All but the first of these approaches--namely, an ex-tension of planted area--require significant additionalinputs of capital and technology. Even the extensionof planting involves some extra capital (in the form ofseeds) and as the pressure of population on the availablearable land intensifies it requires increasing amounts--for clearing, draining, reclaiming or otherwisepreparing the new land for cultivation. Since theseremain the simplest and best-known procedures,however, it is not surprising that the main contributionto the increase in production of the major cereals inthe 1960s came from the extension in area harvested--14 per cent over the seven years between 1960-1964and 1967-1971 as against a gain of 9 per cent in yieldper hectare (see table 42). The largest increases were
Table 42. Developing countries : changes in cereal areas, output and yield, 1960s
Average annual, 1960-1964 Average annual, 1967-1971 Percentage change between1960-1964 and 1967-1971
Western hemisphere
Wheat ..............
Maize ..............
Rice ................
AfricaWheat ..............
Maize ..............
Rice ................
AsiaWheat ..............
Maize ...... 2 .......
Rice ................
Developing countries
Wheat ................
Maize ................
Rice ..................
Total, 3 cereals ........
HarvestedHarvested Pro- Yield Pro- YieldHarvested Pro- Yield area duction (tons per area ductiouarea duction (tons per (millions (nffllions (millious (tons per
(millions (nffllions hectare) of hectare) (millionsof oftons) oftons) of hectare)
hectares) hectares) hectares) oftons)
Region and crop
7.7 11.0 1.43 8.5 11.3 1.33 10 2 --720.9 25.3 1.21 25.9 34.3 1.33 24 35 105.1 8.9 1.72 6.1 9.2 1.50 20 4 --13
5.7 4.7 0.83 6.7 6.3 0.93 18 33 128.5 9.6 i .14 10.2 12.4 1.21 20 28 63.2 5.1 1.57 3.6 6.9 1.93 12 37 23
25.9 22.1 0.86 32.6 33.7 1.03 26 52 2010.9 10.6 0.97 13.0 14.0 1.08 19 32 1176.3 122.7 1.61 80.8 144.4 1.79 6 18 11
39.3 3719 0.96 47.8 51.3 t .07 22 35 1240.3 45.6 1.13 49.0 60.6 1.24 22 33 1084.7 136.6 1.60 90.5 160.5 1.77 7 17 11
164.3 220.1 1.34 187.3 272.4 1.46 14 24 9
Source." See annex table A.39.
75
in wheat and maize, production of which rose at over4 per cent a year--well ahead of population growth--two thirds from extended area, one third from higheryield. Rice area was increased by only 7 per cent,reflecting the relative scarcity of land suitable fortraditional methods of cultivation: the one-sixthexpansion in output was chiefly the result of higheryields, in the wake of the introduction of improvedtechniques in Africa and the spread of the new short-stem varieties in Asia.
Changes in harvested area played a more importantpart than changes in yield in most countries in all threecereals. In the case of wheat, area extension contributedmore than increase in yield in two thirds of thecountries in which there was an expansion in produc-tion.s In the case of maize, area changes were evenmore predominant and in the case of rice only slightlyless (see annex table A.39). Only in the case of in-creasing rice production in Africa and Asia did gainsin yield rank as often as area extension as the sourceof expansion.
Population density did not seem to inhibit the exten-sion of the area under cereal cultivation in the 1960s: areaincreases were as frequent and as large among countrieswith a high rural density (Burundi, E1 Salvador, India,Kenya, the Republic of Korea, Surinam and Thailand,for example) as among countries in which there wasa far smaller rural population per square kilometre ofarable land (Argentina, Chad, Iraq, the Ivory Coast,Venezuela and Zambia, for example). In the aggregate,cases of area extension outnumbered cases of contrac-tion by three to one and this ratio obtained in eachquarter of the rural density spectrum. Increases inyield also outnumbered reductions by three to one,but the incidence of reductions was significantlygreater among the lower-density countries than amongthe higher: countries in which there was a ruralpopulation of more than 170 per square kilometre ofarable land registered five improvements in yield forevery decline whereas among those less heavily settledthere were only two gains for each loss in yield. Theonly reductions in countries with a rural density ofover 250 were in Egypt, Laos and Democratic Yemen(rice) and Indonesia (maize).
The higher the rural density the less the scope forincreasing area under cultivation. Where output wasincreased in the 1960s, higher yields played the pre-dominant role in more than half the countries in whichthere were over 250 rural persons per square kilometreof arable land but in only a third of those with ruraldensities of less than 100. As density rises so does the
need for more intensive cultivation of the land and forthe various inputs--particularly water and fertilizers--that make it productive.
The wide disparities in average yield that provide arough measure of intercountry differences in thecapacity of the land to feed the population are alsoto be found within countries. This is particularly truein the larger countries which tend to embody a varietyof soils, topography, climate and water supply condi-tions. Catering for the food requirements of an enlargedpopulation (or raising nutritional standards) may beachieved with less difficulty through the expansion ofoutput in the more productive regions than in con-formity with the pattern of population growth. Theprerequisite for this, however, is an effective transportand marketing system, as well as appropriate priceand tax policies.
That these are not always available has been dem-onstrated in recent years in India where the capacityof the land to carry a rapidly growing populationvaries tremendously from state to state. The annualoutput of food-grains in the Punjab in the north-westis eight times as great per person as in the denselypopulated state of Kerala in the south-west, and12 times as great per square kilometre as in the sparselypopulated state of Assam in the north-east (seetable 43). Punjab and the neighbouring state ofHaryana produce twice as much grains as is neededby their own population of 24 million. Five otherstates (Himachal Pradesh, Uttar Pradesh, MadyaPradesh, Rajasthan and Orissa) normally produce agrain surplus--though sometimes only a modest one.The rest--containing about 65 per cent of the country'stotal population--are in deficit: their annual produc-tion of 140 kilogrammes per person in the 1968/69-1970/71 period was insufficient for domestic needs.From time to time it has proved easier to obtain grainsupplies for the deficit states from abroad than totransfer it from the surplus states.
Concern about the food requirements of an expandingpopulation should not be construed as a generalendorsement of a policy of national self-sufficiency infood-stuffs. In fact, many developing countries find itnecessary, or even desirable, to purchase food abroadnot only to obtain items it is difficult to produce athome, but also to supplement domestic production.In many cases natural resource endowment sets apattern of comparative advantage that suggests theimportation of food and provides the means forfinancing such imports.
s Similarly, contraction in area contributed more thanreduction in yield in most of the countries in which wheat pro-duction declined in the 1960s.
For a majority of developing countries, however,there are three considerations that have moved themtowards a more vigorous policy in respect of domesticfood production. First is the high proportion of the
76
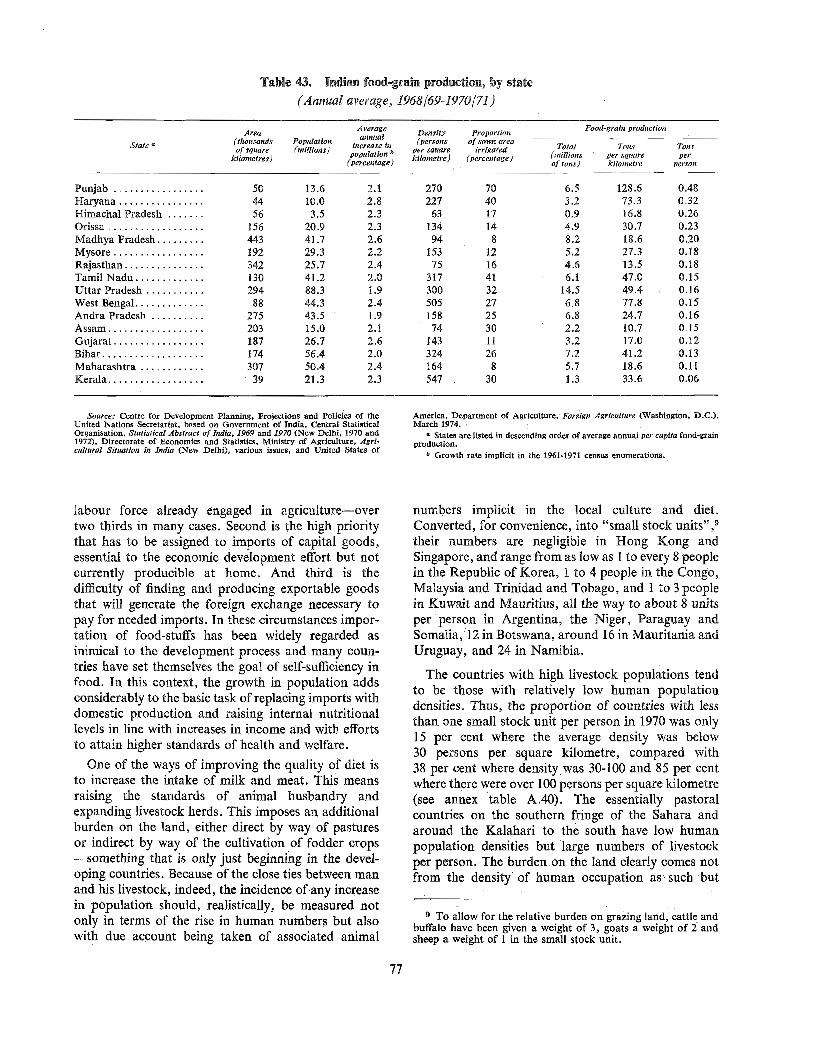
Table 43. Indian food-grain production, by state
(Annual average, 1968/69-I970/71)
Slate ÿ
Area(thousandsofsquare
kllometree)
Average Density Proportionannual (persons of sown areaPopulation increase In
per square irrigated(millions) populatlon b kilometre) (percentage)
(percentage)
Food-graia production
Total Tons Tons(millions per square perof tons) kilometre person
Punjab ................. 50 13.6 2.1
Haryana ................ 44 10.0 2.8
Himachal Pradesh ....... 56 3.5 2.3
Orissa .................. 156 20.9 2.3
Madhya Pradesh ......... 443 41.7 2.6
Mysore ................. 192 29.3 2.2
Rajasthan ............... 342 25.7 2.4
Tamil Nadu ............. 130 41.2 2.0
Uttar Pradesh ........... 294 88.3 1.9
West Bengal ............. 88 44.3 2.4
Andra Pradesh .......... 275 43.5 1.9
Assam .................. 203 15.0 2.1
Gujarat ................. 187 26.7 2.6
Bihar ................... 174 56.4 2.0
Maharashtra ............ 307 50.4 2.4
Kerala .................. 39 21.3 2.3
270 70 6.5 128.6 0.48227 40 3.2 73.3 0.3263 17 0.9 16.8 0.26
134 14 4.9 30.7 0.2394 8 8.2 18.6 0.20
153 12 5.2 27.3 0.1875 16 4.6 13.5 0.18
317 41 6.1 47.0 0.15300 32 14.5 49.4 0.16505 27 6.8 77.8 0.15158 25 6.8 24.7 0.1674 30 2.2 10.7 0.15
143 11 3.2 17.0 0.12324 26 7.2 41.2 0.13164 8 5.7 18.6 0.11547 30 1.3 33.6 0.06
Source: Centre for Development Planning, Projections and Policies of theUnited Nations Secretariat, based on Government of India, Central StatisticalOrganisation, Statistical Abstract of India, 1969 and 1970 (New Delhi, 1970 and1972), Directorate of Economics and Statistics, Ministry of Agriculture, Agri-cultural Situation in Iudia (New Delhi), various issues, and United States of
America, Department of Agriculture, Foreign Agriculture (Washington, D.C.),March 1974.
a States are listed in descending order of average annual per capita food-grainproduction.
Growth rate implicit in the 1961-1971 census enumerations.
labour force already engaged in agriculture--overtwo thirds in many cases. Second is the high prioritythat has to be assigned to imports of capital goods,essential to the economic development effort but notcurrently producible at home. And third is thedifficulty of finding and producing exportable goodsthat will generate the foreign exchange necessary topay for needed imports. In these circumstances impor-tation of food-stuffs has been widely regarded asinimical to the development process and many coun-tries have set themselves the goal of self-sufficiency infood. In this context, the growth in population addsconsiderably to the basic task of replacing imports withdomestic production and raising internal nutritionallevels in line with increases in income and with effortsto attain higher standards of health and welfare.
One of the ways of improving the quality of diet isto increase the intake of milk and meat. This meansraising the standards of animal husbandry andexpanding livestock herds. This imposes an additionalburden on the land, either direct by way of pasturesor indirect by way of the cultivation of fodder crops--something that is only just beginning in the devel-oping countries. Because of the close ties between manand his livestock, indeed, the incidence of any increasein population should, realistically, be measured notonly in terms of the rise in human numbers but alsowith due account being taken of associated animal
numbers implicit in the local culture and diet.Converted, for convenience, into "small stock units" ,9
their numbers are negligible in Hong Kong andSingapore, and range from as low as 1 to every 8 peoplein the Republic of Korea, 1 to 4 people in the Congo,Malaysia and Trinidad and Tobago, and 1 to 3 peoplein Kuwait and Mauritius, all the way to about 8 unitsper person in Argentina, the Niger, Paraguay andSomalia, 12 in Botswana, around 16 in Mauritania andUruguay, and 24 in Namibia.
The countries with high livestock populations tendto be those with relatively low human populationdensities. Thus, the proportion of countries with lessthan one small stock unit per person in 1970 was only15 per cent where the average density was below30 persons per square kilometre, compared with38 per cent where density was 30-100 and 85 per centwhere there were over 100 persons per square kilometre(see annex table A.40). The essentially pastoralcountries on the southern fringe of the Sahara andaround the Kalahari to the south have low humanpopulation densities but large numbers of livestockper person. The burden on the land clearly comes notfrom the density of human occupation as such but
9 To allow for the relative burden on grazing land, cattle andbuffalo have been given a weight of 3, goats a weight of 2 andsheep a weight of 1 in the small stock unit.
77
from the animal density associated with the life stylesof the people. The impact of population increase canbe assessed only by taking both human and animalcomponents into account.
The need to include livestock in the demographicpicture is most necessary in countries where the soilsare fragile, the climate unreliable and the ecologicalbalance precarious. The importance of the livestockpopulation is a general one, however, in the economicdevelopment context. The improvement of animalhusbandry is important both on the production side--through the raising of the productivity and the closerintegration of arable and livestock farming--and onthe consumption side for which its role requires themost careful consideration in planning to meet thefood needs of an expanding population and to raise thequality of diets.
increase or movement. Moreover, foreign companiesare likely to be affected by the demographic situationin the same way as domestic concerns, though whetherthe result is reflected in the deployment of their netearnings depends on many other factors.
INCREASING THE SAVINGS OF THE POPULATION
It was pointed out above that as population expandsand pressure on the land increases, the task of providingadditional supplies of food-stuffs tends to becomemore difficult. At the Very least, it requires largeramounts of capital--to prepare new land for cultivationand to produce the various inputs necessary to main-tain and improve yields. Capital requirements forother purposes are correspondingly increased: if theaverage per capita endowment of various forms offixed capital--tools and equipment, housing and socialinfrastructure--is not to decline, appropriate newinvestment is required. And quite apart from the taskof providing for increments in the population, theprocess of economic and social development is itselfdependent upon an adequate rate of investment.
Corporate savings represent net earnings used fornew investment, usually within the enterprise. Whilenet earnings are likely to be influenced by demographicfactors on both the cost and the sales side of theaccounts, the effect is not readily measurable. On thecost side, the higher the rate of increase in the labourforce and the greater the resultant competition for jobs,the lower are wage levels likely to be. Other thingsbeing equal, low wages tend to mean high profits andhence larger corporate savings. On the sales side,however, contrary influences may operate: high ratesof population increase are often associated with lowper capita income, and a low wage level also meansrestricted local purchasing power. As far as thedomestic market is concerned, therefore, gross earningsmay well be held down by a high rate of populationgrowth. The result is obviously not determinate: itdepends on the company's cost structure, on howmuch of the output is exported, on local demandschedules, on official tax policy and on companydividend policy. The role of the company form oforganization, moreover, differs considerably fromcountry to country. It tends to be greatest--especiallyin respect of the savings contribution--where large-scale exploitation of natural resources is involved, andsuch enterprises are rarely labour-intensive and oftenexport-oriented and hence unlikely to be directlyaffected to any major extent by demographic factors.
Investment resources may be made available byGovernments out of tax revenues, by business enter-prises out of net earnings, by private households outof current income, or by foreign companies, lendinginstitutions or development aid entities. All foursources of savings are affected, in some degree,directly or indirectly, by the population situation ingeneral and by changes in total numbers, in agecomposition and in geographical concentration. Theimpact of such changes cannot be isolated, however,and because it is usually outweighed by other factors,no clear relationship between population and savingsis discernible from intercountry comparisons.
Demographic changes in a given country have littleor no direct bearing on the flow of foreign savings,though pre-transition subsistence economies mayattract special forms of assistance, as indeed maycountries whose development plans are being com-
plicated by an especially rapid rate of population
The government contribution to savings is alsolikely to be subject to many influences more powerfulthan those emanating from population changes.Nevertheless, the latter do affect both the tax base andthe amount and distribution of current expenditure andtherefore the volume of public savings. Inasmuch ashigh rates of population increase tend to lower bothper capita income and the relative size of the workingage cohorts, they tend to reduce the tax base. At thesame time, moreover, high fertility and high propor-tions of children and low-income families in thepopulation tend to magnify the claims on governmentexpenditure for education, health, relief and othersocial services. As a result of such convergence offorces, many developing countries derive only a verysmall proportion of their national savings frombudgetary surpluses.
Population concentration tends to strengthen the taxbase: it increases and standardizes the flow of taxablegoods and facilitates the collection not only of com-modity taxes but also of taxes on other transactions,
78
on property and on incomes. However, it also has amajor impact on the expenditure side of the account:much social spending that is optional and avoidablein a dispersed rural population tends to becomemandatory and expected in a concentrated urbanpopulation where sanitation and health, communica-tion and transport, the reduction of fire hazard andthe expansion of various social amenities a!l take ona new urgency.
Government revenue is not always dependent onpopulation-sensitive activities, however. Resource-based industries, especially those that are export-oriented, are the most prolific source of tax revenue inmany countries. Hence, it is possible for some Govern-ments to generate savings--or transfer savings fromthe corporate sector to the public sector--even indemographically unpromising circumstances.
It is the household sector that is most exposed tothe impact of demographic changes. The decision ofa family to distribute its income over the range of itspresent and future needs is directly affected by its sizeand composition. The lower the income--on a percapita basis--the greater is the weight of presentconsumption needs likely to be. An acceleration in therate of increase in population caused by an increase inthe birth rate or a reduction in mortality in the earlieror later years of life would, in the circumstances ofmost developing countries, cause a contraction in thehousehold savings ratio. A reduction in working agedeath rates would serve to raise family income--as-suming there were no difficulty about gainful employ-ment--and a lengthening of life expectancy shouldimprove the deployment of cumulated knowledge andskill and thus raise productivity and incomes, too.Though in countries with a well-articulated marketsystem and a higher level of per capita income, familiesmay meet the cost of an additional child either bysqueezing consumption rather than savings or byforgoing leisure and earning extra income, the scopefor these responses is severely limited in most devel-oping countries. Here, the evidence of most microsurveys seems to indicate that the negative influencespredominate, and savings rates tend to decline withfamily size.
The effect of this at the macro level depends on thenational distribution of incomes. Though savingscapacity increases progressively as income rises,changes in the pattern of consumption may go a longway in offsetting this, and higher levels of luxuryspending slow down the pace at which family savingsratios actually rise across the income spectrum. Themacro effect also depends on the efficient mobilizationand deployment of whatever savings are in factgenerated so as to maximize opportunities for employ-
merit and income earning. It is not surprising, there-fore, that any inhibiting influence that demographiccircumstances might exert on household savings rarelyshows up at the national level2°
The countries in which dependent groups--the youngand the old--outnumber the working age populationare mostly in the Centra! American area or north oreast Africa. They all have high rates of populationincrease, except Jamaica where the high dependencyratio reflects the emigration of working age males.Children under 15 years of age account for 46-48 percent of the population. Their saving ratios, however,are not at all uniform: in 1968-1970 they were ratherlow (under an eighth of gross national product) in theDominican Republic, Ghana and Nicaragua, aroundthe developing country average (of about one sixth)in Costa Rica, Jamaica, Kenya, Mexico, Morocco andUganda, and well above that average in the mineral-exporting countries of Algeria and Surinam.
At the other end of the spectrum, among the devel-oping countries with the lowest dependency ratio(less than 70 per cent) in which children under15 constitute around a third of the population, thereis a similar wide range of savings performance. Arelatively small proportion of 1968-1970 income wassaved in Israel and Uruguay, a more or less normalproportion in Argentina and Hong Kong and a veryhigh proportion (over one third) in the export-orientedeconomies of Equatorial Guinea and Gabon.
The availability of exportable natural resourcesclearly exercised a greater influence on savings per-formance than differences in demographic circum-stances. The proportion of countries saving over afifth of their total output in 1968-1970 was abouta sixth among those in which population was increasingat 2-2.49 per cent a year and also among those witha 2.5-2.99 per cent growth rate. In both groups thecountries concerned were largely mineral producersand/or export-oriented--the Congo, the Ivory Coast,Mauritania, Namibia and Zaire in the first case andMalaysia, Saudi Arabia, Singapore, Surinam andZambia in the second. And in the group with thefastest-growing population (over 3 per cent a year)almost a third were high savers, and again largelymineral exporters--Algeria, Iraq, Kuwait, the LibyanArab Republic, Panama, Swaziland, Thailand andVenezuela (see annex table A.41).
Most of the countries that are in the very early stageof the demographic transition have populationsexpanding at 2-3 per cent a year. Over half those
10 It should also be borne in mind that some householdsavings are used in forms that are poorly documented--the accu-mulation of jewellery, for example, and the improvement ofdwelling place and other family assets.
9
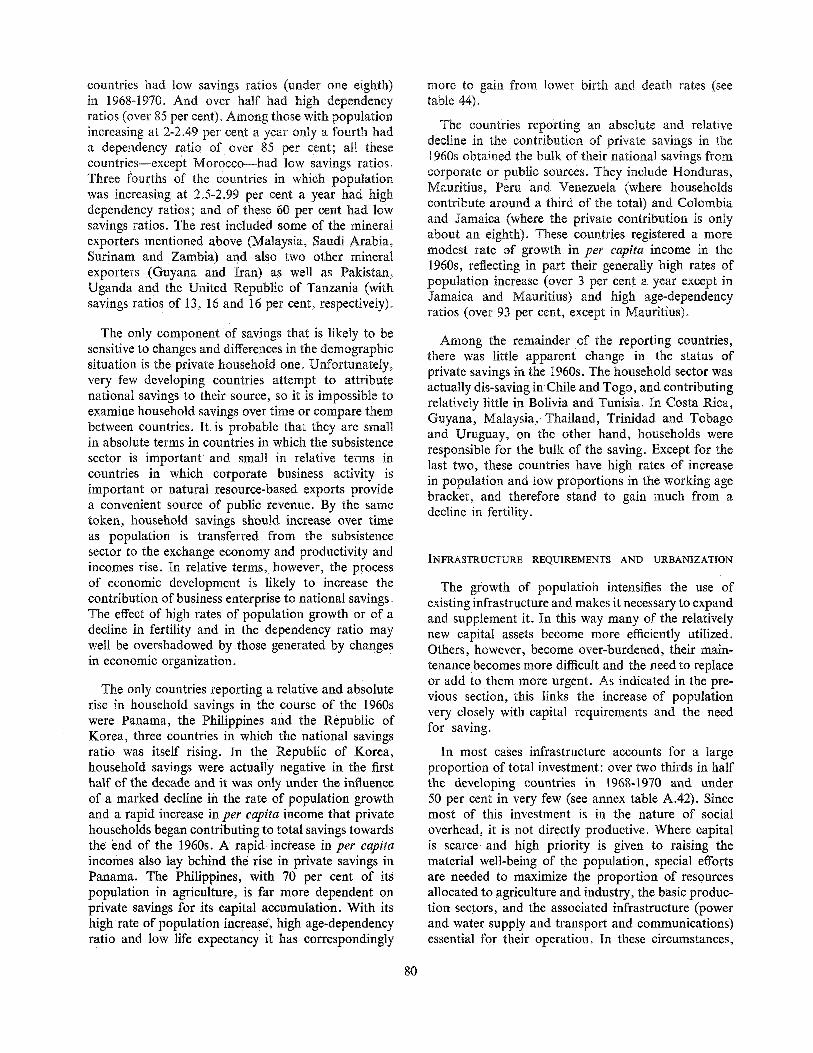
countries had low savings ratios (under one eighth)in 1968-1970. And over half had high dependencyratios (over 85 per cent). Among those with populationincreasing at 2-2.49 per cent a year only a fourth hada dependency ratio of over 85 per cent; all thesecountries--except Morocco--had low savings ratios.Three fourths of the countries in which populationwas increasing at 2.5-2.99 per cent a year had highdependency ratios; and of these 60 per cent had lowsavings ratios. The rest included some of the mineralexporters mentioned above (Malaysia, Saudi Arabia,Surinam and Zambia) and also two other mineralexporters (Guyana and Iran) as well as Pakistan,Uganda and the United Republic of Tanzania (withsavings ratios of 13, 16 and 16 per cent, respectively).
more to gain from lower birth and death rates (seetable 44).
The countries reporting an absolute and relativedecline in the contribution of private savings in the1960s obtained the bulk of their national savings fromcorporate or public sources. They include Honduras,Mauritius, Peru and Venezuela (where householdscontribute around a third of the total) and Colombiaand Jamaica (where the private contribution is onlyabout an eighth). These countries registered a moremodest rate of growth in per capita income in the1960s, reflecting in part their generally high rates ofpopulation increase (over 3 per cent a year except inJamaica and Mauritius) and high age-dependencyratios (over 93 per cent, except in Mauritius).
The only component of savings that is likely to besensitive to changes and differences in the demographicsituation is the private household one. Unfortunately,very few developing countries attempt to attributenational savings to their source, so it is impossible toexamine household savings over time or compare thembetween countries. It is probable that they are smallin absolute terms in countries in which the subsistencesector is important and small in relative terms incountries in which corporate business activity isimportant or natural resource-based exports providea convenient source of public revenue. By the sametoken, household savings should increase over timeas population is transferred from the subsistencesector to the exchange economy and productivity andincomes rise. In relative terms, however, the processof economic development is likely to increase thecontribution of business enterprise to national savings.The effect of high rates of population growth or of adecline in fertility and in the dependency ratio maywell be overshadowed by those generated by changesin economic organization.
Among the remainder of the reporting countries,there was little apparent change in the status ofprivate savings in the 1960s. The household sector wasactually dis-saving in Chile and Togo, and contributingrelatively little in Bolivia and Tunisia. In Costa Rica,Guyana, Malaysia, Thailand, Trinidad and Tobagoand Uruguay, on the other hand, households wereresponsible for the bulk of the saving. Except for thelast two, these countries have high rates of increasein population and low proportions in the working agebracket, and therefore stand to gain much from adecline in fertility.
INFRASTRUCTURE REQUIREMENTS AND URBANIZATION
The only countries reporting a relative and absoluterise in household savings in the course of the 1960swere Panama, the Philippines and the Republic ofKorea, three countries in which the national savingsratio was itself rising. In the Republic of Korea,household savings were actually negative in the firsthalf of the decade and it was only under the influenceof a marked decline in the rate of population growthand a rapid increase in per capita income that privatehouseholds began contributing to total savings towardsthe end of the 1960s. A rapid increase in per capitaincomes also lay behind the rise in private savings inPanama. The Philippines, with 70 per cent of itspopulation in agriculture, is far more dependent onprivate savings for its capital accumulation. With itshigh rate of population increase, high age-dependencyratio and low life expectancy it has correspondingly
The growth of population intensifies the use ofexisting infrastructure and makes it necessary to expandand supplement it. In this way many of the relativelynew capital assets become more efficiently utilized.Others, however, become over-burdened, their main-tenance becomes more difficult and the need to replaceor add to them more urgent. As indicated in the pre-vious section, this links the increase of populationvery closely with capital requirements and the needfor saving.
In most cases infrastructure accounts for a largeproportion of total investment: over two thirds in halfthe developing countries in 1968-1970 and under50 per cent in very few (see annex table A.42). Sincemost of this investment is in the nature of socialoverhead, it is not directly productive. Where capitalis scarce and high priority is given to raising thematerial well-being of the population, special effortsare needed to maximize the proportion of resourcesallocated to agriculture and industry, the basic produc-tion sectors, and the associated infrastructure (powerand water supply and transport and communications)essential for their operation. In these circumstances,
80
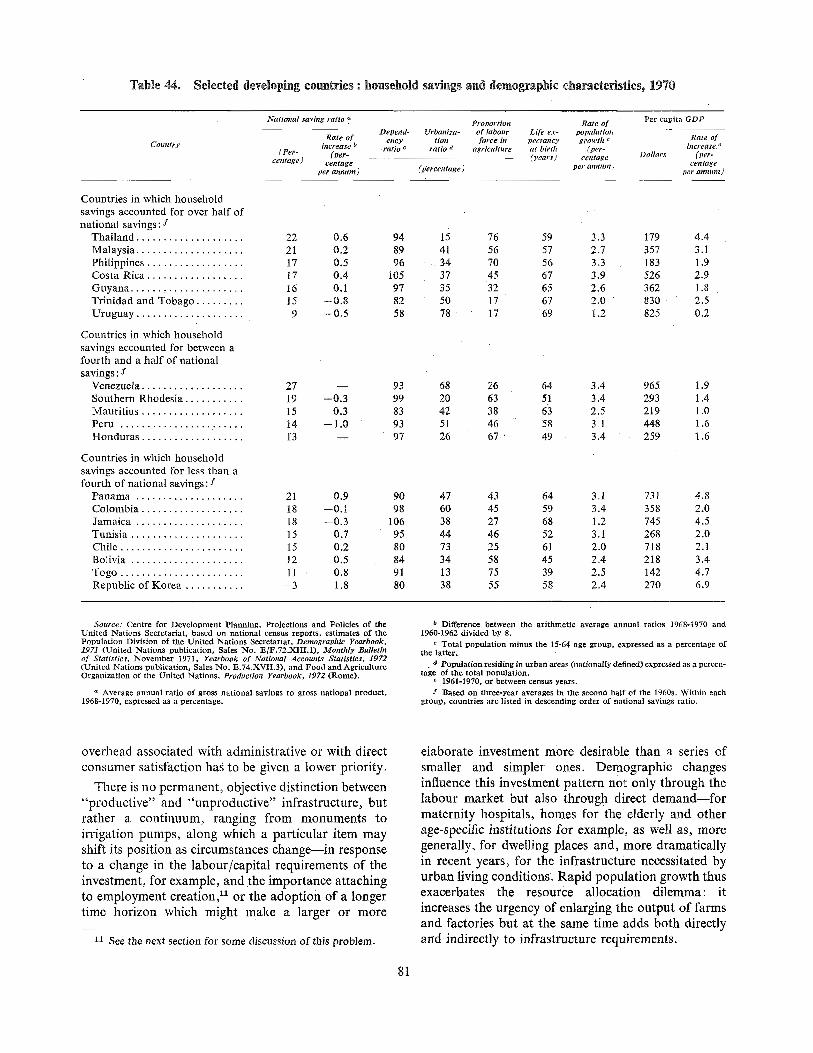
Table 44. Selected develophig countries : household savings and demographic characteristics, 1970
CoanD'y
National saving ratio a Proportion Rate of Per capita GDPDepend- Urbaniza- of labour Life ex- popnlatton
Rate of ency lion force ill pcctancy growth, Rate ofincrease b ratio c ratio a agriculture at birth (per- increasee
(Per- (per- Dollars (per-centage) (years) centagecentage eentageper annum) (percentage) pet" anannt) per" annnnt )
Countries in which householdsavings accounted for over half ofnational savings: /
Thailand .................... 22
Malaysia .................... 21
Philippines .................. 17
Costa Rica .................. 17
Guyana ..................... 16
Trinidad and Tobago ......... 15
Uruguay .................... 9
0.6 940.2 890.5 960.4 1050.1 97
--0.8 82
--0.5 58
15 76 59 3.3 179 4.441 56 57 2.7 357 3.134 70 56 3.3 183 1.937 45 67 3.9 526 2.935 32 65 2.6 362 1.850 17 67 2.0 830 2.578 17 69 1.2 825 '0.2
Countries in which householdsavings accounted for between afourth and a half of nationalsavings: Y
Venezuela ................... 27
Southern Rhodesia ........... 19
Mauritius ................... 15
Peru ....................... 14
Honduras ................... 13
-- 93--0.3 99
0.3 83--1.0 93
-- 97
Countries in which householdsavings accounted for less than afourth of national savings: Y
Panama .................... 21 0.9
Colombia ................... 18 --0.1
Jamaica .................... 18 -- 0.3
Tunisia ..................... 15 0.7
Chile ....................... 15 0.2
Bolivia ..................... 12 0.5
Togo ....................... 11 0.8
Republic of Korea ........... --3 1.8
90 47 43 64 3.1 731 4.898 60 45 59 3.4 358 2.0
106 38 27 68 t.2 745 4.595 44 46 52 3.1 268 2.080 73 25 61 2.0 718 2.184 34 58 45 2.4 218 3.491 13 75 39 2.5 142 4.780 38 55 58 2.4 270 6.9
68 26 64 3.4 965 1.920 63 51 3.4 293 !.442 38 63 2.5 219 1.051 46 58 3.1 448 1.626 67 49 3.4 259 1.6
Source: Centre for Development Planning, Projections and Policies of theUnited Nations Secretariat, based on national census reports, estimates of thePopulation Division of the United Nations Secretariat, Demographic Yearbook,1971 (United Nations publication, Sales No. E/F.72.XIII.1), Monthly Bulletinof Statistics, November 1971, Yearbook of National Accounts Statistics, 1972(United Nations publication, Sales No. E.74.XVII.3), and Food and AgricultureOrganization of the United Nations, Frodnctioa Yearbook, 1972 (Rome).
a Average annual ratio of gross national savings to gross national product,1968-1970, expressed as a percentage.
Difference between the arithmetic average annual ratios 1968-1970 and1960-1962 divided by 8.
c Total population minus the 15-64 age group, expressed as a percentage ofthe latter.
a Population residing in urban areas (nationally defined) exprcssed as a percen-tage of the total population.
1961-1970, or between census years.Y Based on three-year averages in the second half of the 1960s. Within each
group, countries are listed in descending order of national savings ratio.
overhead associated with administrative or with directconsumer satisfaction hal to be given a lower priority.
There is no permanent, objective distinction between"productive" and "unproductive" infrastructure, but
rather a continuum, ranging from monuments toirrigation pumps, along which a particular item mayshift its position as circumstances change--in responseto a change in the labour/capital requirements of theinvestment, for example, and the importance attachingto employment creation,n or the adoption of a longertime horizon which might make a larger or more
11 See the next section for some discussion of this problem.
elaborate investment more desirable than a series ofsmaller and simpler ones. Demographic changesinfluence this investment pattern not only through thelabour market but also through direct demand--formaternity hospitals, homes for the elderly and otherage-specific institutions for example, as well as, moregenerally, for dwelling places and, more dramaticallyin recent years, for the infrastructure necessitated byurban living conditions: Rapid population growth thusexacerbates the resource allocation dilemma: itincreases the urgency of enlarging the output of farmsand factories but at the same time adds both directlyand indirectly to infrastructure requirements.
81
One of the most direct of these requirements is forhousing. In 1970, almost half the developing countrieswere spending more than 5 per cent of their grossproduct on residential construction, and over a fourthwere spending more then 8 per cent (see annextable A.43). Thus, just as infrastructure constitutes amajor portion of total fixed investment, so housing hasbecome a major component of infrastructure. Thisreflects not only the growth but also the movement ofpopulation and, in particular, the ramifications ofurbanization.
The movement of population from rural to urbanareas in the developing countries corresponds in ageneral way with the urbanization process in the moreadvanced countries discussed in the previous chapters.Because over-all population growth has been so muchfaster in the developing countries, however, the ruralpopulation so much larger and the problem of equippingit with complementary factors so much greater, thescale of townward movement has been much moreextensive. In the 1960s, for example, the rate ofincrease in the urban population exceeded 5 per centa year in half the developing countries, and in less thana fifth was it under 4 per cent (see table 45).
The pace of this townward movement was greatestin Africa: two thirds of the developing countries inthis region saw their urban populations increase bymore than 5 per cent a year, compared with only onefourth in the western hemisphere and 45 per cent inAsia. On the average over the decade, the urbanpopulation increased by about 16 million people eachyear, approximately half representing natural increaseand the other half newcomers from the countryside.Rather less than half the increment in urban populationwas in Asia and rather more than a third in thedeveloping countries of the western hemisphere.Africa, the least urbanized region in 1960, added2.6 million people to its towns each year, and endedthe decade with a higher proportion of its populationin towns than was the case in Asia.
The countries in which there was a relatively modestincrease in the urban population (less than 4 per centa year in the 1960s) were for the most part either verysmall (Barbados, Gambia, Guadeloupe and Mauritius,for example) or those in which the proportion of thepopulation living in towns at the beginning of thedecade was already high (over 70 per cent)--Argentina,Chile, Hong Kong, Israel and Uruguay, for example.
Table 45. Developing countries: distribution of countries according to rate of urbanization,1960-1970
AsiaItem Developing Western
countries hemisphere Afl'ica andPacific
Percentage of population in urban areas
1960 ................................. 23.2 48.4 18.9 18.4
1970 ................................. 27.1 56.2 22.3 21.0
Average annual rate of increase in urban
population
Less than 3 per cent:
Number of countries ................ 6 4 1 1
Population (thousands) .............. 581 573 6 2
3.0-3.9 per cent:
Number of countries ................ 13 3 5 5
Population (thousands) .............. 3,897 272 99 3,526
4.0-4.9 per cent:
Number of countries ................ 33 13 i0 10
Population (thousands) .............. 4,749 1,621 778 2,349
5.0-5.9 per cent:
Number of countries ................ 30 6 15 9
Population (thousands) .............. 5,511 3,006 801 1,705
6.0 per cent and over:
Number of countries ................ 21 1 16 4
Population (thousands) .............. 1,070 72 852 145
Source: Centre for Development Plamling, Projections and Policies of the United Nations Secretariat, based on United Nations,Monthly Bulletin of Statistics, November 1971.
82
They included Afghanistan, Bangladesh, Burma andIndia, however--large countries in which less than afifth of the population lived in urban areas. Even witha rate of urban growth of only 3.5 per cent a year,India had to accommodate an average annual incre-ment of over 5 million in its towns in the 1960s.
At the other end of the scale, most of the countries inwhich urban populations expanded at over 6 per centa year were African, and they entered the decade withvery low proportions of town dwellers--less than10 per cent in general, but higher in the UnitedRepublic of Cameroon (about a fifth) and, even more,in Algeria, where the average annual increase in thenumber living in towns was 267,000, exceeded inAfrica only by Egypt and Nigeria. In the westernhemisphere, only the Dominican Republic registereda rate of urban growth as high as 6 per cent a year.In West Asia, there were three with higher rates--Kuwait, Saudi Arabia and Yemen.
In these countries with very high rates of urbangrowth, 60-70 per cent of the increment representsinward movement from the rural areas. The patternof such movement differs from country to country,depending not only on the relationship of populationto land but also on the physical size of the country andthe distribution of urban centres. In many developingcountries the most rapid movement has been towardstowns that have grown up around mineral deposits orsmelting and refining facilities (such as the copper beltagglomerations in Zaire and Zambia or the petroleumtowns of Abadan in Iran or Maracaibo in Venezuela).Capital cities have also attracted large numbers: noless than 21 had over a million inhabitants in 1970and seven had over 3 million?2 But in most countries,it was the port cities that expanded most rapidly in the1960s, reflecting the fact that foreign trade was usuallythe most dynamic element in the economy.
stream has been from low-lncome states in the north-east southward to states where incomes are higher.14And cutting across these density and income motivatedflows are the intra-state townward movements. Evenin states in which population has been increasing atless than the national average, the main metropolitanareas have been expanding at rates substantially higherthan those experienced by the cities themselves?5Between 1960 and 1970 the population of the nine mainBrazilian cities rose from 10 million to 15 million(48 per cent) while the population of the surroundingurban areas rose from less than 2.9 million to nearly7.4 million (160 per cent). As in the more advancedcountries, some of this peripheral growth representsthe "suburbanization" movement, discussed in
chapter II above, made possible by rising incomes andimproving transport systems. Much of the latter hasbeen based on the private motor-car. In 1971 therewere about seven persons per registered passenger carin Sÿo Paulo, compared with about 42 per car in therest of the country. Heavy investment in urban highwaysystems has accompanied this population redistribu-tion, made necessary by it, but also in turn facilitatingor even inducing it.
But most of the peri-urban growth is the result notof the rich moving out of the city but of the poorarriving from the rural areas. This has been the patternnot only in Brazil but also in most other developingcountries. And everywhere the inflow of people hasoutrun the capacity of the towns to provide the requisiteinfrastructure for integrating the new population intothe physical framework and economic life of the urbanarea. The result has been the proliferation of squattercommunities and similar unplanned human settlements.
In some of the larger countries fairly clear migrationpatterns are discernible. In Brazil, for example, therehas been a distinct drift away from the north-east and,to a less extent, the south-east towards the north, thesouth and, most notably, the central-west region(see annex table A.44). Part of this movement has beenfrom states with a high rural density, towards thesparsely populated states in the interior.18 Another
As indicated above, because of the difficulty thatmost developing countries have in raising their savingsratios, the provision of appropriate infrastructure posesgreat problems when the population is growing rapidly:the natural increase adds to the needs arising frommaintenance and replacement, from adaptation to newtechnology and from the incorporation of the qualityimprovements that are the essence of the developmentobjective. Movement of the population adds consider-ably to this burden, especially when it is from arelatively under-capitalized rural environment to an
18 Notably from Alagoas, Para]ba, Pernambuco and Sergipein the north-east (where the density is about four times thenational average) and Espirito Santo and Minas Gerais in thesouth-east to Goifis, Mato Grosso and Parfi, as well as on asmaller scale, to Amapfi in the far north and RondSnia in thefar west.
12 Buenos Aires, Cairo, Karachi (while Islamabad was underconstruction), Mexico City, New Delhi-Delhi, Seoul andTeheran.
14 Particularly from Maranhao and Bahia where in 1968 percapita production was between a third and a half of the nationalaverage, to Parami, Santa Catarina and 'Rio de Janeiro and,strongest magnet of all, Sÿo Paulo (where per capiia productionwas nearly twice the national average).
15 In the t960s, for example, the population of Greater Recifegrew at an average annual rate of 4.8 per cent, Greater Bel6mat 4.8 per cent, Greater Salvador at 5.0 per cent, Greater Curi-tiba at 5.4 per cent, Greater Fortaleza at 5.8 per cent, GreaterBelo Horizonte at 6.8 per cent and Greater Sgto Paulo at 7.1 percent.
83
urban set-up whose very functioning depends in largemeasure on the adequacy of the available socialoverhead.
The requirements make a formidable list. Theconcentration of population that is the distinguishingcharacteristic of the urban environment necessitateshigher and more capital-intensive standards fordwelling construction, water reticulation, waste dis-posal, cooking arrangements and many other aspectsof household organization.16 It also imposes newstandards for the physical accoutrements of formaleducation and most other group activities, as well asin the handling of communicable disease. The func-tioning of an urban community also depends oneffective intercommunication and, as the area itoccupies expands, on the adequacy of the means ofmoving people and goods to all parts of the nexus thatmake it possible for all the components--becomingincreasingly differentiated in the process of develop-ment--to operate as a viable entity.
superficial integration. The peripheral population thentends to become a distinct squatter community, livingin a shanty town that has very little in common withthe city that was the original magnet drawing peoplefrom the countryside. The links lie not in a commoninfrastructure but in a more or less casual series ofsingle-purpose connexions, created as individuals inthe peri-urban Community succeed in finding employ-ment in the city and as city services are stretched intothe outlying area to help with housing, health oreducation--sometimes in campaigns that are motivatedby self-defence rather than a desire to unify the"greater metropolitan area" as a functional entity.
The full benefits of urbanization materialize only asthese higher infrastructural standards are achieved.Thus in the context of socio-economic developmentthere is a natural tendency for a developing country toassign a high priority in its capital budget and asso-ciated policy measures to investment related to theurban sector. This is reinforced by overriding physicalneeds (for safety, for example), social needs (arisingfrom the scope and visibility of urban phenomena)and political needs (reflecting the concentration ofwealthy and intellectually influential groups in thelarger towns). This poses a serious dilemma for adeveloping country with severely limited capitalresources. The more its investment pattern leanstowards urban development the wider becomes thedisparity between urban and rural levels of living.And as it is this disparity that constitutes one of thestrongest forces behind the townward drift of popula-tion, urban investment tends never to achieve itsessential purpose: population increase constantlyprevents the creation of a fully operational, integratedand articulated socio-economic unit.
As there is scarcely a city throughout the developingworld 17 that has not experienced an influx too rapidtO permit ks absorption into an integral urban com-munity, the situation has attracted increasing attentionfrom economic planners and policy-makers. While itis generally accepted that the long-range solution liesin the slowing down of the rate of population growth,the weight of shorter-run action has been shifting tothe rural areas. This is partly in response to the problemof feeding the population, discussed earlier in thischapter, and partly in the realization that a betterrural/urban balance is essential and that concentrationon the urban end tends to accentuate the disparities.
In some places the pace of peri-urban accretion hasbeen too rapid to permit anything but the most
16 It is the environment rather than personal preferences thattends to make urban housing requirements more specialized andmore elaborate. In the rural areas of many developing countries,temporary structures, made of local materials, are still widelyused; they are acceptable because their maintenance and renewalare relatively easy and they are not unduly concentrated. Inurban areas, both density and the need for greater permanencecall for different types of materials--more fireproof, for example,and more resistant to weathering--and for a layout and construc-tion that will permit more indoor activity.
As the 1960s progressed, development plans beganto lay greater emphasis on the agrarian sector. Theproblem is not only the technical one of increasingagricultural productivity--per farm family as well asper hectare--but also the often more intricate one ofmodifying rural institutions and structures so as tobring about a more appropriate balance between landand population and between purely agriculturalactivities and those associated with the production ofinputs and processing of outputs. This requires moreinvestment in rural infrastructure, to lessen the isola-tion of the subsistance sector, to facilitate the acquisi-tion of new inputs and the disposition of incrementsin output and to permit a greater degree of industrialdecentralization. It also requires vigilance to ensurethat land tenure systems are consistent with efforts toimprove productivity and equity. Credit systems andthe price relationships between agricultural andindustrial products must also be brought into line withthe over-all policy of aiming for an optimal geographicaldistribution of population.
17 As indicated in chapter II above, the townward movementof population has also given rise to problems in the moreadvanced countries. The developing countries' difficulties, how-ever, are of different order of magnitude: their capital resourcesare much scarcer and their rate of population increase three orfour times as great.
84
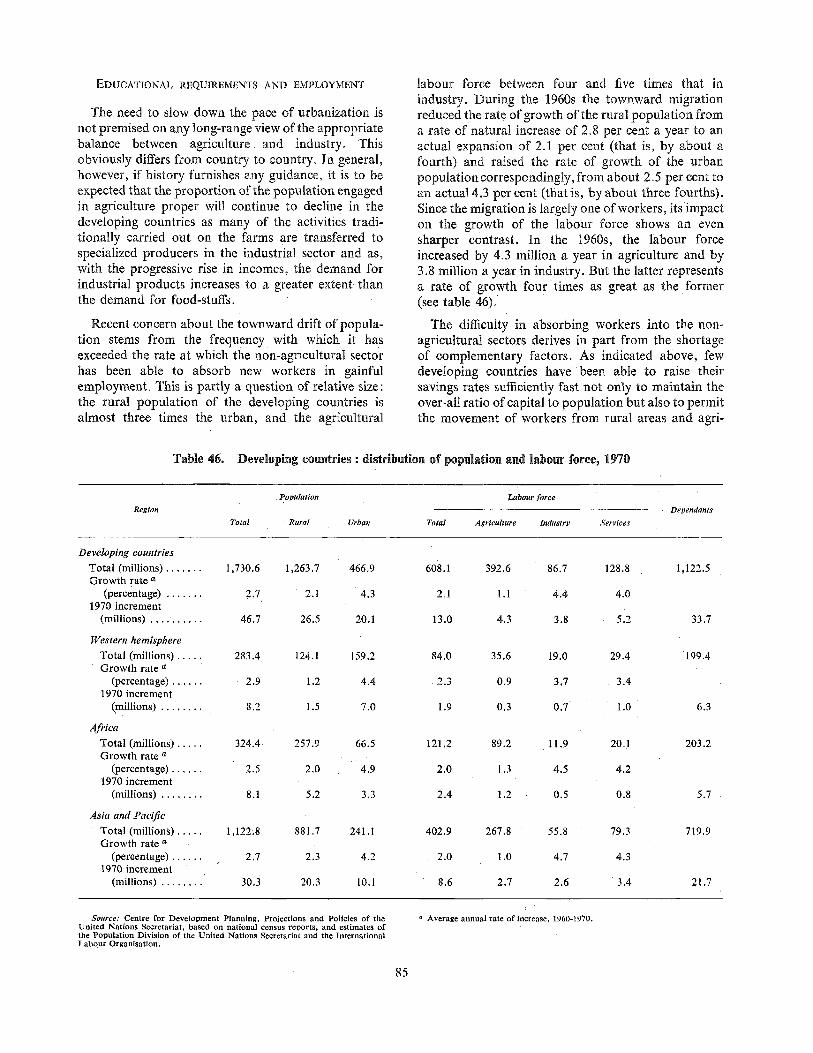
EDUCATIONAL REQUIREMENTS AND EMPLOYMENT
The need to slow down the pace of urbanization isnot premised on any long-range view of the appropriatebalance between agriculture and industry. Thisobviously differs from country to country. In genera!,however, if history furnishes any guidance, it is to beexpected that the proportion of the population engagedin agriculture proper will continue to decline in thedeveloping countries as many of the activities tradi-tionally carried out on the farms are transferred tospecialized producers in the industrial sector and as,with the progressive rise in incomes, the demand forindustrial products increases to a greater extent thanthe demand for food-stuffs.
labour force between four and five times that inindustry. During the 1960s the townward migrationreduced the rate of growth of the rural population froma rate of natural increase of 2.8 per cent a year to anactual expansion of 2.1 per cent (that is, by about afourth) and raised the rate of growth of the urbanpopulation correspondingly, from about 2.5 per cent toan actual 4.3 per cent (that is, by about three fourths).Since the migration is largely one of workers, its impacton the growth of the labour force shows an evensharper contrast. In the 1960s, the labour forceincreased by 4.3 million a year in agriculture and by3.8 million a year in industry. But the latter representsa rate of growth four times as great as the former(see table 46).
Recent concern about the townward drift of popula-tion stems from the frequency with which it hasexceeded the rate at which the non-agricultural sectorhas been able to absorb new workers in gainfulemployment. This is partly a question of relative size:the rural population of the developing countries isalmost three times the urban, and the agricultural
The difficulty in absorbing workers into the non-agricultural sectors derives in part from the shortageof complementary factors. As indicated above, fewdeveloping countries have been able to raise theirsavings rates sufficiently fast not only to maintain theover-all ratio of capital to population but also to permitthe movement of workers from rural areas and agri-
Table 46. Developing countries : distribution of population and labour force, 1970
Poptdation Labour force
Region
Total Rural Urban Total Agriculture Industry Services
Dependants
Developing countries
Total (millions) ....... 1,730.6 t ,263.7 466.9 608,1 392.6 86.7 128.8Growth rate ÿ
(percentage) ....... 2.7 2.1 4.3 2.1 1.1 4.4 4.0
1970 increment(millions) .......... 46.7 26.5 20,1 13.0 4.3 3.8 5.2
1,122.5
33.7
Asia and PacificTotal (millions) ..... 1,122.8 881.7 241.1 402.9 267.8 55.8 79.3Growth rate a
(percentage) ...... 2.7 2.3 4.2 2.0 1.0 4.7 4.31970 increment
(millions) ........ 30.3 20.3 10.1 8.6 2.7 2.6 3.4
Western hemisphere
Total (millions) ..... 283.4 124.1 159.2 84.0 35.6 19.0 29.4Growth rate a
(percentage) ...... 2.9: 1.2 4.4 2.3 0.9 3.7 3.4
1970 increment(millions) ........ 8.2 1.5 7.0 1.9 0.3 0.7 1.0
AfricaTotal (millions) ..... 324.4 257.9 66.5 121.2 89.2 11.9 20,1Growth rate a
(percentage) ...... 2.5 2.0 4.9 2.0 1.3 4.5 4.2
1970 increment(millions) ........ 8.1 5.2 3.3 2.4 1.2 0.5 0.8
199.4
6.3
203.2
5.7
719.9
21.7
Source: Centre for Development Planning, Projections and Policies of theUnited Nations Secretariat, based on national census reports, and estimates ofthe Population Division of tile United Nations Secretariat and the InternationalLabour Organisation.
a Average annual rate ofincrease, 1960-1970.
85
cultural occupations to urban areas and industrialoccupations in which capital requirements are sub-stantially greater. This is one reason why manyworkers end up in the labour-intensive service sectorrather than the industrial sector.
Efforts to accommodate the flood of new entrants tothe labour market have revealed that in many countriesthe plethora of workers was associated with a dearthof requisite skills. This reflects, in part, the fact thatit has generally been the younger worker who has beenhardest to accommodate. It also reflects the fact thatmany new entrants--especially from the rural areas--have had little or no formal education. But in manycases it has also revealed the inadequacy or inappro-priateness of the training they had in fact received.
figure, as does Uruguay one of the most urbanizedcountries in the region. There is some tendency forfemale participation rates to rise with the process ofurbanization and industrialization, but cultural factorsare also involved: the proportion of women in thelabour force is high not only in Uruguay which hasthe demographic characteristics of a more advancedcountry but also in Paraguay where over half thepopulation is still engaged in agriculture and inGuyana, Haiti, Jamaica and Surinam where over60 per cent live in the rural areas.
This has set in motion a widespread re-examinationof educational systems and a great deal of discussionof the relationship between formal education and theabsorption in productive employment of a rapidlyincreasing labour force. Since the latter has emergedas the most general of all the development problemsnow facing the developing countries, and educationcosts have become one of the largest items of publicexpenditure, the need to ensure that the schoolsprovide the most useful preparation for employmentis now widely regarded as a matter of great importanceand urgency.
In the developing countries of the western hemi-sphere, the total population increased at 2.9 per centa year in the 1960s, the urban group at 4.4 per centand the labour force at 2.3 per cent. At the end of thedecade, one fifth of the annual increment to the labourforce consisted of women; and for every new entrantinto the labour force there were about three newdependents. About 56 per cent of the population livedin urban areas and the industrial labour force wasincreasing at 3.7 per cent a year four times as fastas the agricultural labour force. In almost 40 per centof the countries of the region, indeed, the agriculturallabour force was declining. The countries in whichmore than half the active population was engaged inagriculture were concentrated largely in the Caribbeanarea--the Dominican Republic, E1 Salvador, Guate-mala, Haiti, Honduras and Nicaragua--though theyalso included Bolivia, Ecuador and Paraguay (seeannex table A.45).
Some of these Central American countries arecharacterized by extremely low female participationrates: in the Dominican Republic, Guatemala andHonduras, women constituted less than 15 per cent ofthe labour force in t970. Mexico also has relativelyfew women in its labour force. Other countries in thearea, by contrast--notably Barbados, Haiti andJamaica--have female participation rates double that
Among the western hemisphere countries the demo-graphic pressure on the job market is least in Argentina,Barbados, Chile, Jamaica and Uruguay where thegrowth of the working-age population is lowest(because of emigration in the case of Barbados andJamaica), the proportion of the labour force still inagriculture smallest (ranging from 15 to 27 per cent),and the proportion of women in gainful employmentalready relatively high (over 24 per cent). At the otherend of the demographic spectrum, the need for jobsis greatest in Colombia, Costa Rica, Honduras,Paraguay and Venezuela, where the working agepopulation is expanding at over 3 per cent a year, ahigh proportion of the population is still in agriculture(except in Venezuela) and relatively few women arein the labour force (except in Paraguay).
High rates of population growth are creatingemployment problems in most of the other LatinAmerican countries, particularly where more than halfthe labour force is still in agriculture despite a rapidswing to other sectors in the 1960s, as in the DominicanRepublic, E1 Salvador, Guatemala and Nicaragua and,to a less extent, Bolivia and Ecuador. Though themovement out of agriculture has proceeded somewhatfurther in Brazil, Mexico and Peru, these countriesare also finding it difficult to absorb the 4-5 per centannual increase in the industrial labour force as wellas a 1-2 per cent annual increase in those working onthe land. In Mexico, the urban population expandedby 1 million a year in the 1960s and in Brazil by2 million, and both these countries still have relativelylow female participation rates.
Up to the present, employment problems in Africahave arisen more from the movement of populationthan from its growth. However, even though totalpopulation has been increasing less rapidly than in thedeveloping countries of the western hemisphere (2.5per cent a year compared with 2.9 per cent), the distri-bution has been such that both rural and urban groupshave been growing more rapidly--the former by 2 percent a year and the latter at almost 5 per cent a year.Despite its rapid growth, the urban populationaccounted for only a fifth of the total in 1970, and
86
despite a dramatic rise in the proportion engaged innon-agricultural activities (a near doubling in a numberof cases) there are very few countries in which less thanhalf the labour force is engaged in agriculture, andthey are all small ones--the Congo, the Libyan ArabRepublic, Mauritius, Rÿunion and Tunisia. The Congo,Gabon and Mauritius are the only African countriesto experience an absolute decline in the agriculturallabour force in the 1960s. At the beginning of the1970s, the African population was expanding at almost10 million a year: rather less than 3 million were goinginto the labour force, 7 million were dependants. Ofthe increment in the labour force almost half (1.3 mil-lion) were going into agriculture, about a third(0.9 million) into trade and other service activities andabout a fifth (0.6 million) into industry.
Though there is great diversity in the demographic/employment situation among the developing countriesof Africa, the smallness of the urban and industrialbase has generally made it difficult to provide jobs forboth the natural increase in the labour force and thosetransferring from the agricultural sector. The problemhas been most severe in countries with a very lowproportion of the population in non-agriculturalactivities which have experienced a high rate of growthboth in the working age group and in the urbanpopulation. These include most of the east Africancountries--Kenya, Madagascar, Malawi, Rwanda,Somalia, Swaziland, Uganda and the United Republicof Tanzania--in which over 80 per cent of the popula-tion was still in agriculture in 1970. Largely because ofthe organization of agriculture in these countries, mostof them absorbed a high proportion of women in thelabour force.
fourth in Hong Kong, Israel, Kuwait and Singapore.Female participation was under 10 per cent of thelabour force in the Arab countries of West Asia, butover a third in Indochina and Thailand, where womenplay a prominent role in agriculture, as well as in theindustrialized countries--Hong Kong, Israel and
Singapore.
In relative terms, the urbanization trend was notquite as vigorous in Asia in the 1960s as in the othertwo regions. Nevertheless, the rate of increase in urbanpopulation averaged 4.2 per cent a year and by the endof the decade over 10 million people were being addedto the urban group each year. The rural population,however, was expanding at 20 million a year. Thusthe land was being called upon to carry a larger shareof the increment in population than was the case in theother regions. As rural densities were already muchhigher in most Asian countries than elsewhere, thistended to exacerbate tenure and farm organizationproblems. Some of the imbalance that emerged asvisible urban unemployment in other regions, was leftmore diffused in rural underemployment in Asia.
This was not the case among countries with strongMoslem traditions where female participation ratescontinue to be very low--as in the case of Algeria,Egypt, the Libyan Arab Republic, the Sudan andTunisia, for example. The north African countrieshave relatively large urban, non-agricultural bases toreceive the new entrants into the labour force. Despitelarge-scale temporary migration to Europe, however,a substanital proportion--estimated as high as afourth of the working age population in 1970--havenot been accommodated. A tendency for more womento enter the labour force would aggravate the employ-ment problem. At present these countries are distin-guished by the very high ratio of dependants toemployed workers.
The developing countries of Asia and the Pacific arealso demographically diverse. The proportion of thepopulation active in agriculture in 1970 was over threefourths in Afghanistan, Bangladesh, the KhmerRepublic, Laos, Nepal and Thailand, but under one
This is not to say that the growth of the urban labourforce was slow and easily accommodated in Asia. Onthe contrary, because participation rates are muchhigher than in Africa or Latin America, the Asianregion experienced the most rapid growth in non-agricultural labour force in the !960s--4.7 per centa year in the industrial sector and 4.3 per cent a yearin the services sector. And, as in the other regions,there were serious absorption difficulties in manycountries: at the end of the decade, urban unemploy-ment is estimated to have reached 9 per cent of thelabour force in the Philippines, 10 per cent in Indonesiaand Iran, 11 per cent in Sri Lanka and 13 per centin Malaysia.
Of the various demographic factors influencing therelationship between the growth of populations andthe absorption of the working age cohorts in gainfulemployment, the two that stand out most clearly fromthe experience of the 1960s are the extent of femaleinvolvement and the differentiation of the labour forcethrough the acquisition of skills. The importance ofthese two factors lies in part in their dual role: theyaffect both the growth of the labour force and itseconomic deployment.
High female participation in economic life is acharacteristic of the two extremes of the developmentspectrum. It is a feature of subsistence communitieswith high vital rates and a population increase of2-3 per cent a year. It is also a feature of economicallyadvanced countries with a much more intricate sub-division of labour, low vital rates and a populationgrowth of less than 1.5 per cent a year (see annex
87
table A.46). While cultural traditions as well aseconomic organization are clearly involved,18 there isa direct and negative association between femaleparticipation and the rate of population growth. Theproportion of countries in which less than a fourthof the working age women are economically activerises systematically from 23 per cent of those with alow rate of population increase (less than 1.5 per centa year), and 29 per cent of those growing at 1o5-2.5per cent a year, to 48 per cent of those growing at2.5-3.0 per cent a year, and 75 per cent of thosegrowing at over 3 per cent a year.
Bolivia, E1 Salvador, Guatemala, Haiti, Mexico andPeru (plus Ecuador, Honduras and Trinidad andTobago at the secondary level).
Since the process of economic development entailsincreasing involvement of women in the productionof goods and services, countries in which femaleparticipation rates are very low can expect to see theirlabour force expand at particularly high rates: inaddition to the new entrants from the cohorts gradu-ating into the working age bracket, there will be anincreasing number entering from the hitherto unin-volved female group. In due course, greater femaleparticipation will probably result in a lowering of thebirth rate and ultimately in a slowing down in the rateof expansion of the labour force. As in the case of mostdemographic phenomena, however, the braking timeis inevitably lengthy: the number of new entrants intothe labour force from the natural increase of thepopulation is determined 15 years or more in advance.A rise in the female participation rate, therefore, hasserious implications for the problem of job creation,especially for those developing countries that havealready encountered difficulties in fitting their presentstream of new entrants into productive employment.The problem is by no means trivial: over a fourth ofall developing countries have female participation ratesof less than 20 per cent and in three fourths of thempopulation is increasing at more than 2.5 per cent ayear. In many Arab and Latin countries, the entranceof more women on to the labour market wouldaggravate an already serious unemployment problem.
This was far from the case in the other regions,however: in Asia, only Israel and the Philippines hadmore or less equal enrolment of boys and girls, andin Africa, only Lesotho and R6union, plus Botswana,Guinea-Bissau and Swaziland where there was somelag in the secondary schools (see annex table A.47).In many countries boys outnumbered girls by morethan 2 to 1 and in some by 3 to 1 (Chad, Mauritania,Somalia and Saudi Arabia), 4 to 1 (Democratic Yemen)or even 6 to 1 (Afghanistan and Nepal).
In secondary school enrolments, which have theearliest and greatest impact on the job market, the ratioof girls to boys in most developing countries in thewestern hemisphere was comparable to that registeredin the more advanced countries in the late 1960s. Themajority of developing countries, however, had lowerratios: in nearly 60 per cent there were less than 60 girlsto every 100 boys and in nearly40 per cent less than 40(see annex table A.48).
That this is not a remote contingency is borne outby the rapid rise that has taken place in recent years inschool enrolments, female as well as male. By 1970most of the countries in the western hemisphere hadachieved a rough equality in enrolments at bothprimary and secondary levels: the only countries inwhich girls were still clearly underrepresented were
18 Adjustment to exogenous factors and events also affectsfemale participation from time to time. Manpower losses in wartend to increase the employment of women, for example, andsome of the consequences of this in Eastern Europe are discussedin chapter III above. Activation of the feminist movement mayalso affect the volume as well as the grade and remuneration offemale employment.
In general, the educational system acts as both abuffer and a training ground between demographicforces and the job market. In the 1960s in mostdeveloping countries it appears to have served the firstpurpose rather better than the second.
There was a vigorous and widespread growth inschool enrolment, proportionately highest in thosecountries which started with the smallest educationalbase. In many cases primary enrolment rose by over10 per cent a year and secondary enrolment by over20 per cent. In the aggregate the number of childrenin primary schools increased by 6 per cent a year,twice the rate at which the relevant age group wasexpanding, and the number in secondary schoolsincreased by 12 per cent a year. Though the absolutenumbers were small in relation to the growth of popu-lation, enrolment in third-level education rose evenfaster. By the end of the decade, 43 per cent of the5-14 age group was enrolled in primary schools,26 per cent of the 15-19 age group was enrolled insecondary schools and the total school population(including those at the third level) was approaching250 million.
These averages conceal sharp regional differences.The primary enrolment ratio (to the 5-14 age group)was about a third in Africa, rather more than 40 percent in Asia and ahnost 60 per cent in the westernhemisphere. Similarly, the secondary ratio (to the15-19 age group) ranged from an eighth in Africa torather more than a fourth in Asia and a third in thewestern hemisphere. Altogether, full-time education
88
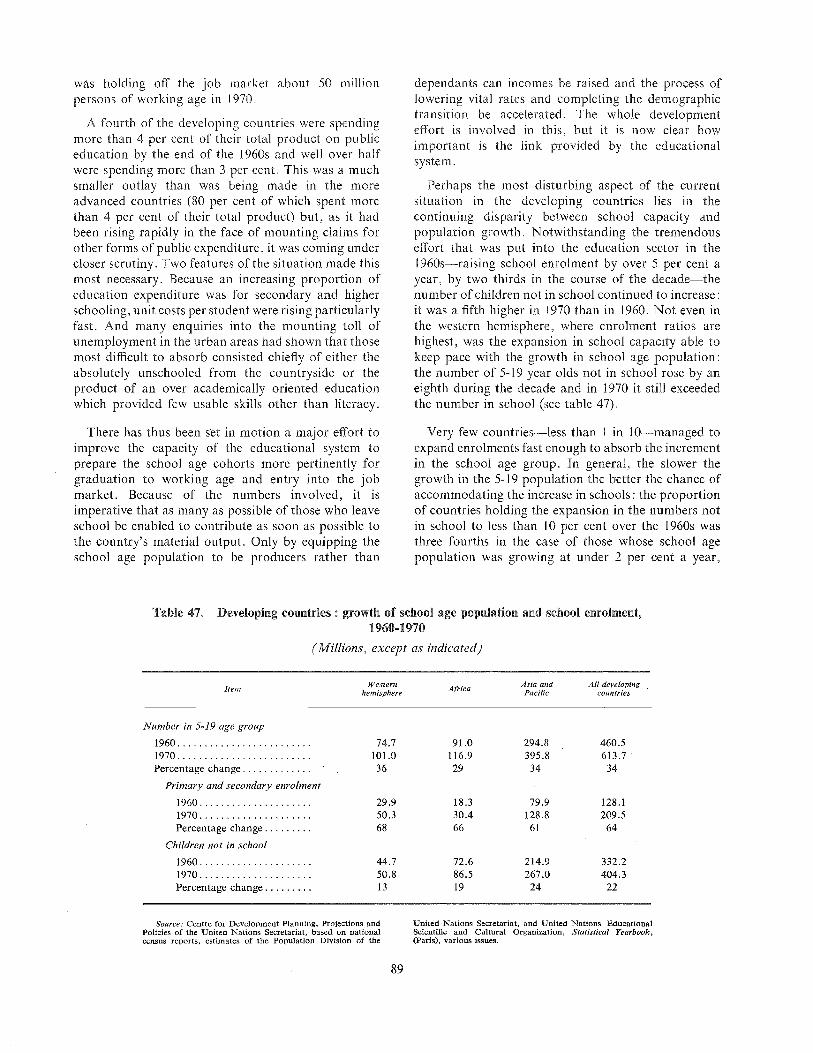
was holding off the job market about 50 millionpersons of working age in 1970.
A fourth of the developing countries were spendingmore than 4 per cent of their total product on publiceducation by the end of the 1960s and well over halfwere spending more than 3 per cent. This was a muchsmaller outlay than was being made in the moreadvanced countries (80 per cent of which spent morethan 4 per cent of their total product) but, as it hadbeen rising rapidly in the face of mounting claims forother forms of public expenditure, it was coming undercloser scrutiny. Two features of the situation made thismost necessary. Because an increasing proportion ofeducation expenditure was for secondary and higherschooling, unit costs per student were rising particularlyfast. And many enquiries into the mounting toll ofunemployment in the urban areas had shown that thosemost difficult to absorb consisted chiefly of either theabsolutely unschooled from the countryside or theproduct of an over academically oriented educationwhich provided few usable skills other than literacy.
dependants can incomes be raised and the process oflowering vital rates and completing the demographictransition be accelerated. The whole developmenteffort is involved in this, but it is now clear howimportant is the link provided by the educationalsystem.
Perhaps the most disturbing aspect of the currentsituation in the deve!oping countries lies in thecontinuing disparity between school capacity andpopulation growth. Notwithstanding the tremendouseffort that was put into the education sector in the1960s--raising school enrolment by over 5 per cent ayear, by two thirds in the course of the decade--thenumber of children not in school continued to increase :it was a fifth higher in 1970 than in 1960. Not even inthe western hemisphere, where enrolment ratios arehighest, was the expansion in school capacity able tokeep pace with the growth in school age population:the number of 5-19 year olds not in school rose by aneighth during the decade and in 1970 it still exceededthe number in school (see table 47).
There has thus been set in motion a major effort toimprove the capacity of the educational system toprepare the school age cohorts more pertinently forgraduation to working age and entry into the jobmarket. Because of the numbers involved, it isimperative that as many as possible of those who leaveschool be enabled to contribute as soon as possible to
the country's material output. Only by equipping theschool age population to be producers rather than
Very few countries--less than 1 in 10--managed toexpand enrolments fast enough to absorb the incrementin the school age group. In general, the slower thegrowth in the 5-19 population the better the chance ofaccommodating the increase in schools : the proportionof countries holding the expansion in the numbers notin school to less than 10 per cent over the 1960s wasthree fourths in the case of those whose school age
population was growing at under 2 per cent a year,
Table 47. Developing countries : growth of school age population and school enrolment,1960-1970
(Millions, except as indicated)
Western Africa Asia and All developingItem hemisphere Pacific countries
Number in 5-19 age group
1960 .........................
1970 .........................
Percentage change .............
Primary and secondary enrolment
1960 .....................
1970 .....................
Percentage change .........
Children not in school
1960 .....................
1970 .....................
Percentage change .........
74.7 91.0 294.8 460.5101.0 116.9 395.8 613.736 29 34 34
29.9 18.3 79.9 128.150.3 30.4 128.8 209.568 66 61 64
44.7 72.6 214.9 332.250.8 86.5 267.0 404.313 19 24 22
Source." Centre for Development Planning, Projections andPolicies of the United Nations Secretariat, based on nationalcensus reports, estimates of the Population Division of tfie
United Nations Secretariat. and United Nations EducationalScientific and Cultural Organization, Statistical Yearbook,(Paris), various issues.
89
but only one fourth of those with a 2-4 per cent growthrate, and less than a fifth of those in which the numberof potential pupils was rising even faster (see annextable A.49). Correspondingly, the proportion ofcountries in which the increase in children not in schoolwas above the developing country average of 22 percent was only a fifth among those with a school agegrowth rate of less than 2.5 per cent but over halfof those with higher rates.
Since there is an inverse relationship betweenfertility and level of education, something of a viciouscircle emerges: the impact of education on population
growth is seriously reduced by the sheer magnitude ofthat growth. A breakthrough on this front calls for agood deal of innovation in the educational field:conventional schools and conventional curricula willhave to be supplemented by other means of spreadingliteracy and conveying the rudiments of trainingessential as the personal equipment of those enteringthe working force in a development-oriented economy.Only by techniques that involve a lower effectivebudgetary cost and penetrate further into the rural aswell as the urban community is the educational systemlikely to be able to overcome the consequences of rapiddemographic growth in most developing countries.
9O

ANNEX
STATISTICAL TABLES

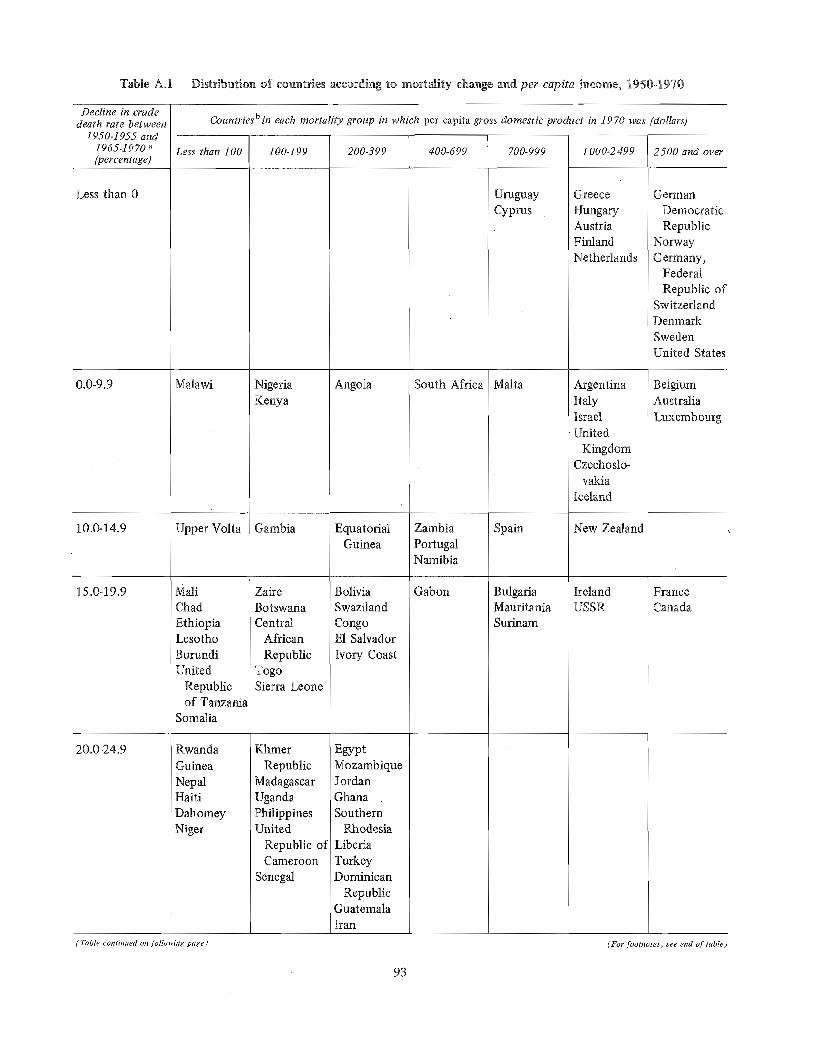
Table A.1 Distribution of countries according to mortality change and per capita income, 1950-1970
Decline in crudedeath rate between Countriesb in each mortality group in which per capita gross domestic product in 19 70 was {dollars)
1950-1955 and1965-1970 a Less than 100 100-199 200-399 400-699 700-999 1000-2499 2500 and over(percentage)
Less than 0 UruguayCyprus
Greece
HungaryAustriaFinlandNetherlands
Malawi
20.0-24.9
(Table continued on following page)
15.0-19.9
Upper Volta
MaliChadEthiopiaLesothoBurundiUnited
Republicof Tanzania
Somalia
Rwanda
Guinea
NepalHaitiDahomeyNiger
10.0-14.9 Gambia
ZaireBotswanaCentral
AfricanRepublic
TogoSierra Leone
Khl-ner
RepublicMadagascarUgandaPhilippinesUnited
Republic ofCameroon
Senegal
Angola
EquatorialGuinea
BoliviaSwazilandCongoE1 SalvadorIvory Coast
EgyptMozambiqueJordanGhanaSouthern
RhodesiaLiberiaTurkeyDominican
RepublicGuatemalaIran
South Africa
ZambiaPortugalNamibia
Gabon
NigeriaKenya
Malta
Spain
BulgariaMauritaniaSurinam
0.0-9.9 ArgentinaItalyIsraelUnited
KingdomCzechoslo-
vakiaIceland
New Zealand
IrelandUSSR
GermanDemocraticRepublic
NorwayGermany,
FederalRepublic of
SwitzerlandDenmarkSwedenUnited States
BelgiumAustrÿiaLuxembourg
FranceCanada
(For footnotes, see end of table)
93
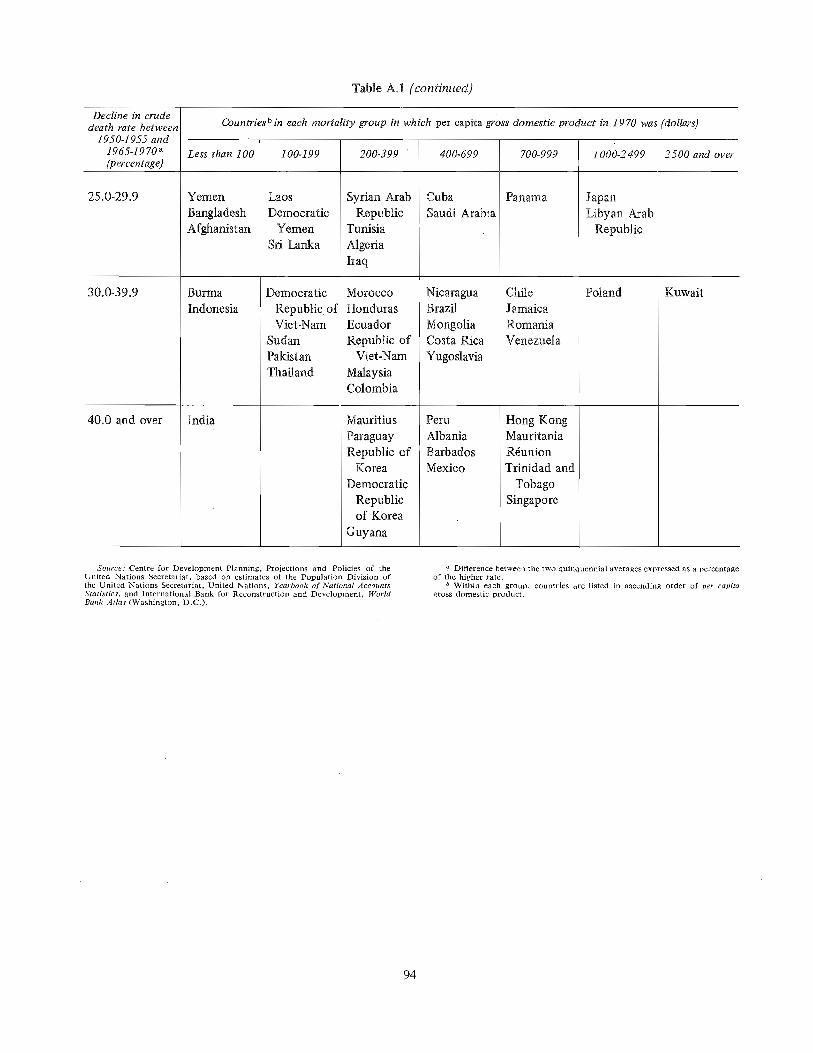
Table A.1 (continued)
Decline in crudedeath rate between Countriesb in each mortality group in which per capita gross domestic product in 1970 was (dollars]
1950-1955 and1965"1970a Less than 100 100-199 200-399 ' 400.699 700-999 1000-2499 2500 and over{percentage]
25.0-29.9 YemenBangladeshAfghanistan
Laos
DemocraticYemen
Sri Lanka
40.0 and over
Burma
Indonesia
India
30.0-39.9 DemocraticRepublic ofViet-Nam
SudanPakistanThailand
Syrian ArabRepublic
TunisiaAlgeriaIraq
MoroccoHondurasEcuadorRepublic of
Viet-Nam
MalaysiaColombia
Mauritius
ParaguayRepublic of
KoreaDemocratic
Republicof Korea
Guyana
CubaSaudi Arabia
NicaraguaBrazilMongoliaCosta PicaYugoslavia
Peru
AlbaniaBarbadosMexico
Panama
ChileJamaicaRomaniaVenezuela
Hong KongMauritaniaR4unionTrinidad and
TobagoSingapore
JapanLibyan Arab
Republic
Poland Kuwait
Source: Centre for Development Planning, Projections and Policies of theUnited Nations Secretariat, based on estimates of the Population Division ofthe United Nations Secretariat, United Nations, Yearbook of National AccountsStatistics, and International Bank for Reconstruction and Development, WorldBank Atlas (Washington, D.C.).
a Difference between the two quinquennial averages expressed as a percentageof the higher rate.
b Within each group, countries are listed in ascending order of per capitagross domestic product.
94
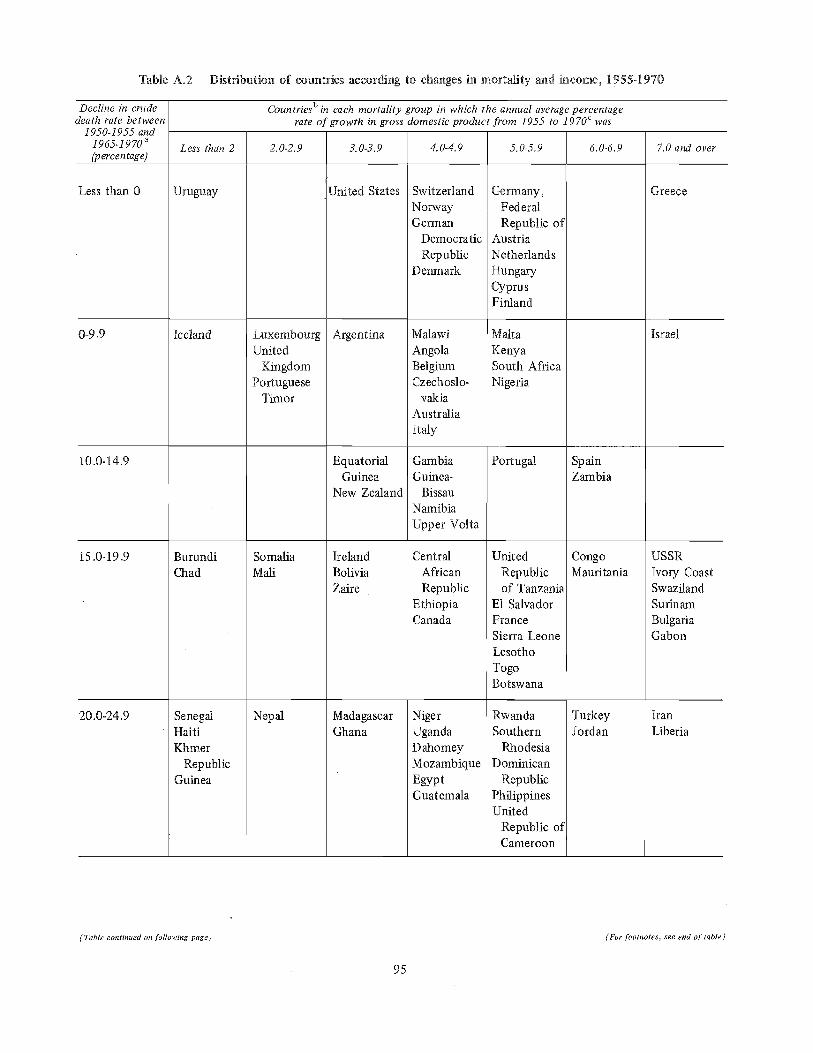
Table A.2 Distribution of countries according to changes in mortality and income, 1955-1970
Decline in crude Countriesb in each mortality group in which the annual average percentagedeath rate between rate of growth in gross domestic product from 1955 to 1970c was
I ÿJu-1 yJJ ÿftu
1965"1970a Less than 2 2.0-2.9 3.0-3.9 4.0-4.9 5.0-5.9 6.0-6.9 7.0 and over(p ereen rage)
Less than 0 Uruguay United States SwitzerlandNorwayGerman
Democratic
RepublicDenmark
20.0-24.9
KhlTler
RepublicGuinea
15.0-19.9
10.0-14.9
BurundiChad
SenegalHaiti
LuxembourgUnited
KingdomPortuguese
Timor
SomaliaMall
Nepal
Iceland Argentina
EquatorialGuinea
New Zealand
IrelandBoliviaZaire
MadagascarGhana
0-9.9 MalawiAngolaBelgiumCzechoslo-
vakiaAustraliaitaly
GambiaGuinea-
BissauNamibiaUpper Volta
CentralAfricanRepublic
EthiopiaCanada
NigerUgandaDahomeyMozambiqueEgyptGuatemala
Germany,FederalRepublic of
AustriaNetherlandsHungaryCyprusFinland
MaltaKenyaSouth AfricaNigeria
Portugal
UnitedRepublicof Tanzania
E1 SalvadorFranceSierra LeoneLesothoTogoBotswana
RwandaSouthern
RhodesiaDominican
RepublicPhilippinesUnited
Republic ofCameroon
SpainZambia
CongoMauritania
TurkeyJordan
Greece
Israel
USSRIvory CoastSwazilandSurinamBulgariaGabon
IranLiberia
(Table continued on following page) (For footnotes, see end of table)
95
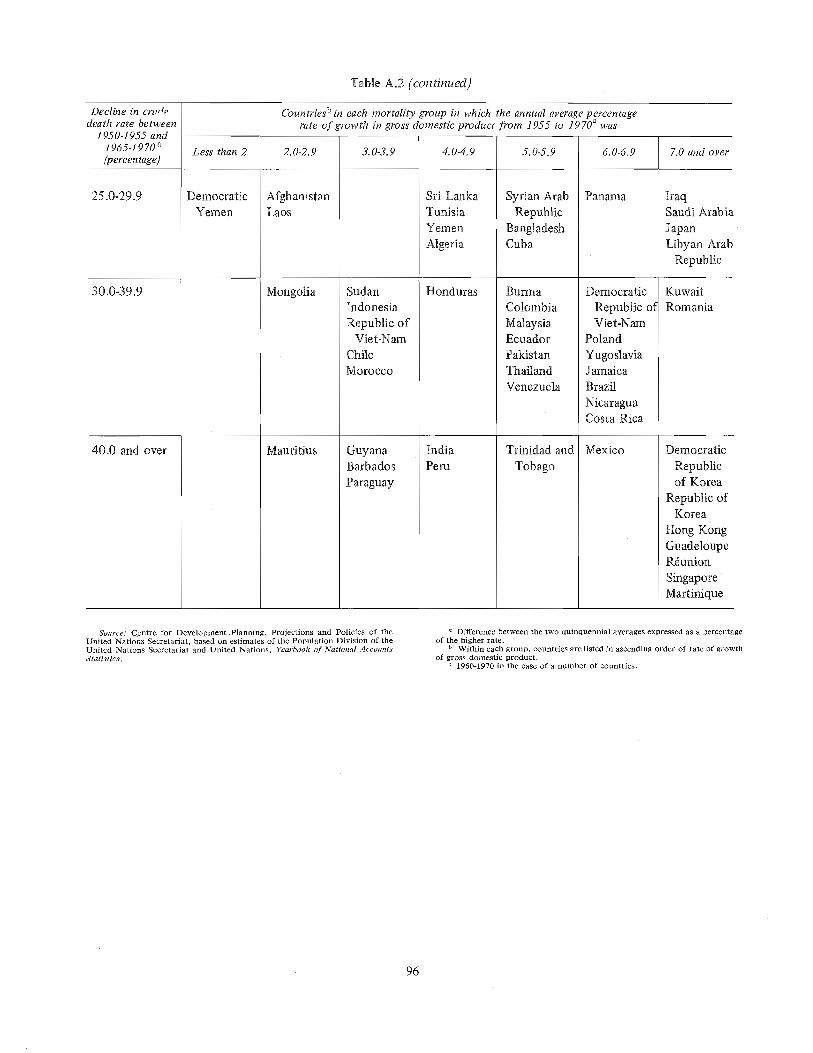
Table A.2 {continued)
Decline in cn,3ÿ Countriesb in each mortality group in which the annual average percentagedeath rate between rate of growth in gross domestic product from 1955 to 19700 was
1950-1955 and1965"1970a Less than 2 2.0-2.9 3.0-3.9 4.0-4.9 5.0-5.9 6.0-6.9 7.0 and over{percentage)
25.0-29.9 DemocraticYemen
AfghanistanLaos
40.0 and over
30.0-39.9 Mongolia
Mauritius
SudanIndonesia
Repubfic ofViet-Nam
ChileMorocco
GuyanaBarbadosParaguay
Sri LankaTunisiaYemen
Algeria
Honduras
IndiaPeru
Syrian ArabRepublic
BangladeshCuba
BurmaColombiaMalaysiaEcuadorPakistanThailandVenezuela
Trinidad andTobago
Panama
DemocraticRepublic ofViet-Nam
PolandYugoslaviaJamaicaBrazilNicaraguaCosta Rico
Mexico
IraqSaudi ArabiÿJapanLibyan Ara/c
Republic
KuwaitRomania
Democratic
Republicof Korea
Republic ofKorea
Hong KongGuadeloupeRÿunion
SingaporeMartinique
Source: Centre for Development Planning, Projections and Policies of theUnited Nations Secretariat, based on estimates of the Population Division of theUnited Nations Secretariat and United Nations, Yearbook of National AccountsStatistics.
a Difference between the two quinquennial averages expressed as a percentageof the higher rate.
b Within each group, countries are listed in ascending order of rate of growthof gross domestic product.
c 1960-1970 in the case of a number of countries.
96
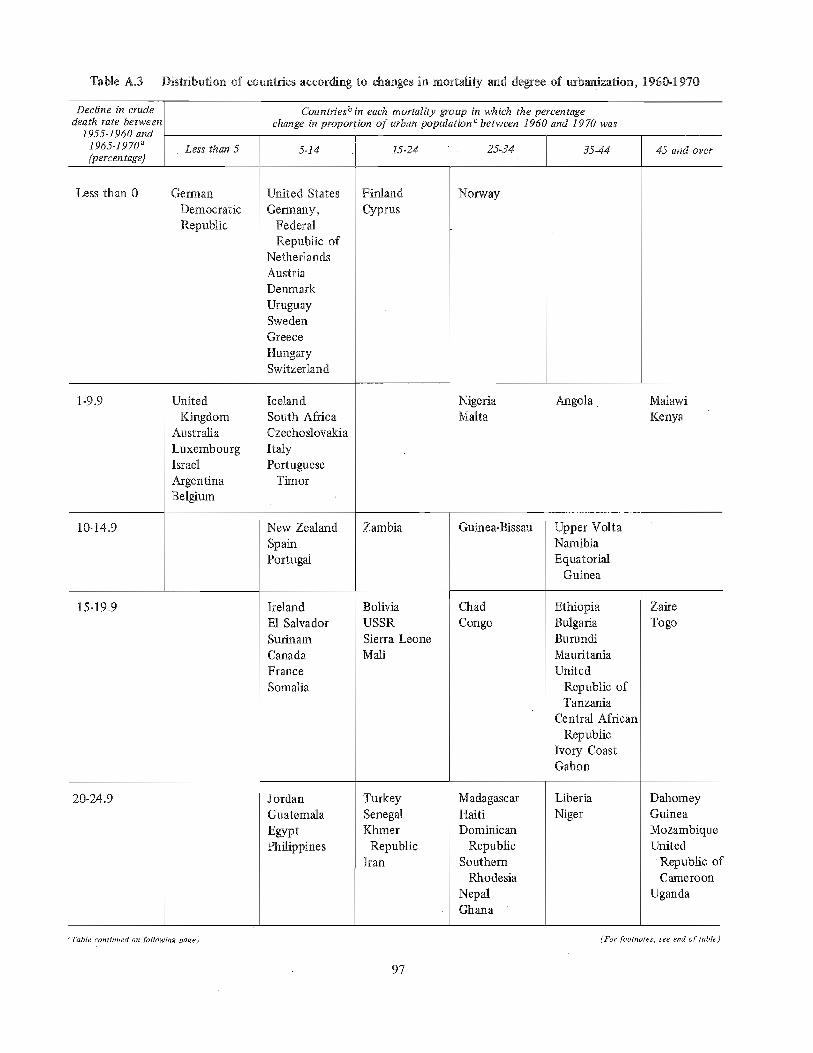
Table A.3 Distribution of countries according to changes in mortality and degree of urbanization, 1969-1970
Decline in crude Countriesb in each mortality group in which the percentagedeath rate between change in proportion of urban population c between 1960 and 1970 was
1955-1960 and I1965"1970a Less than 5 5-14 15-24 25-34 35-44 45 and over(percentage)
Less than 0 German
DemocraticRepublic
United StatesGermany,
FederalRepublic of
NetherlandsAustriaDenmark
UruguaySwedenGreece
HungarySwitzerland
FirdandCyprus
20-24.9
CanadaFrance
Somalia
Mali
15-19.9
10-14.9
UnitedKingdom
AustraliaLuxembourgIsrael
ArgentinaBelgium
IcelandSouth AfricaCzechoslovakiaItalyPortuguese
Timor
New ZealandSpainPortugal
IrdandE1 SalvadorSurinam
JordanGuatemalaEgyptPhilippines
1-9.9
Zambia
BoliviaUSSRSierra Leone
TurkeySenegalKhmer
RepublicIran
Norway
NigeriaMalta
Guinea-Bissau
ChadCongo
MadagascarHaitiDominican
RepublicSouthern
RhodesiaNepalGhana
Angola
Upper VdtaNamibiaEquatorial
Guinea
EthiopiaBulgariaBumndiMauritaniaUnited
Republic ofTanzania
Central AfricanRepublic
Ivory CoastGabon
LiberiaNiger
MalawiKenya
Zaire
Togo
DahomeyGuinea
MozambiqueUnited
Republic oJCameroon
Uganda
(Table continued on following page) (For footnotes, see end of table)
97
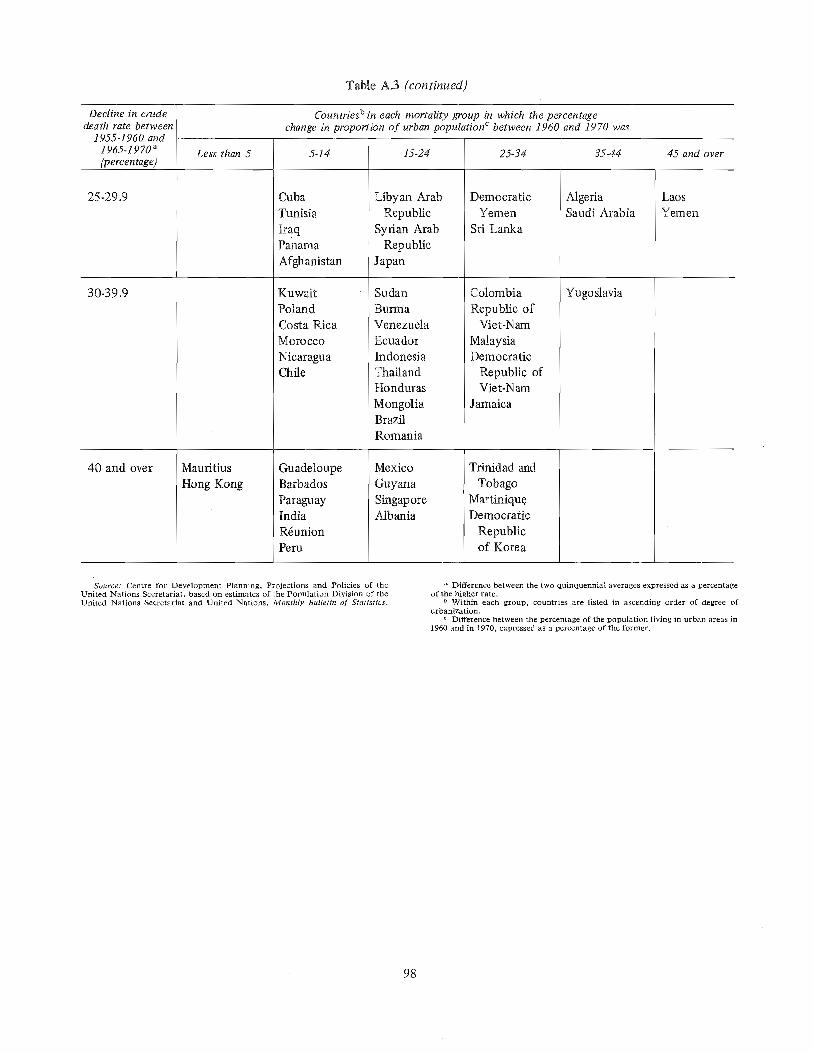
Table A.3 {continued)
Decline in crude Countriesb in each mortality group in which the percentagedeath rate between change in proportion of urban populationc between 1960 and 1970 was
1955-1960 and
1965"1970a Less than 5 5-14 15-24 25-34 35-44 45 and over(percentage)
25-29.9 CubaTunisiaIraqPanamaAfghanistan
Libyan ArabRepublic
Syrian ArabRepublic
Japan
DemocraticYemen
Sri Lanka
MauritiusHong Kong
40 and over GuadeloupeBarbadosParaguayIndiaR4unionPeru
KuwaitPolandCosta RicaMoroccoNicaraguaChile
SudanBurmaVenezuelaEcuadorIndonesiaThailandHondurasMongoliaBrazilRomania
Mexico
Guyana
SingaporeAlbania
30-39.9 ColombiaRepublic of
Viet-Nam
MalaysiaDemocratic
Republic ofViet-Nam
Jamaica
Trinidad andTobago
MartiniqueDemocratic
Republicof Korea
AlgeriaSaudi Arabia
Yugoslavia
LaosYemen
Source: Centre for Development Planning, Projections and Policies of theUnited Nations Secretariat, based on estimates of the Population Division of theUnited Nations Secretariat and United Nations, Monthly Bulh, tin of Statistics,
a Difference between the two quinquennial averages expressed as a percentageof the higher rate.
b Within each group, countries are listed in ascending order of degree ofurbanization.
c Difference between the percentage of the population living in urban areas in1960 and in 1970, expressed as a percentage of the former.
98
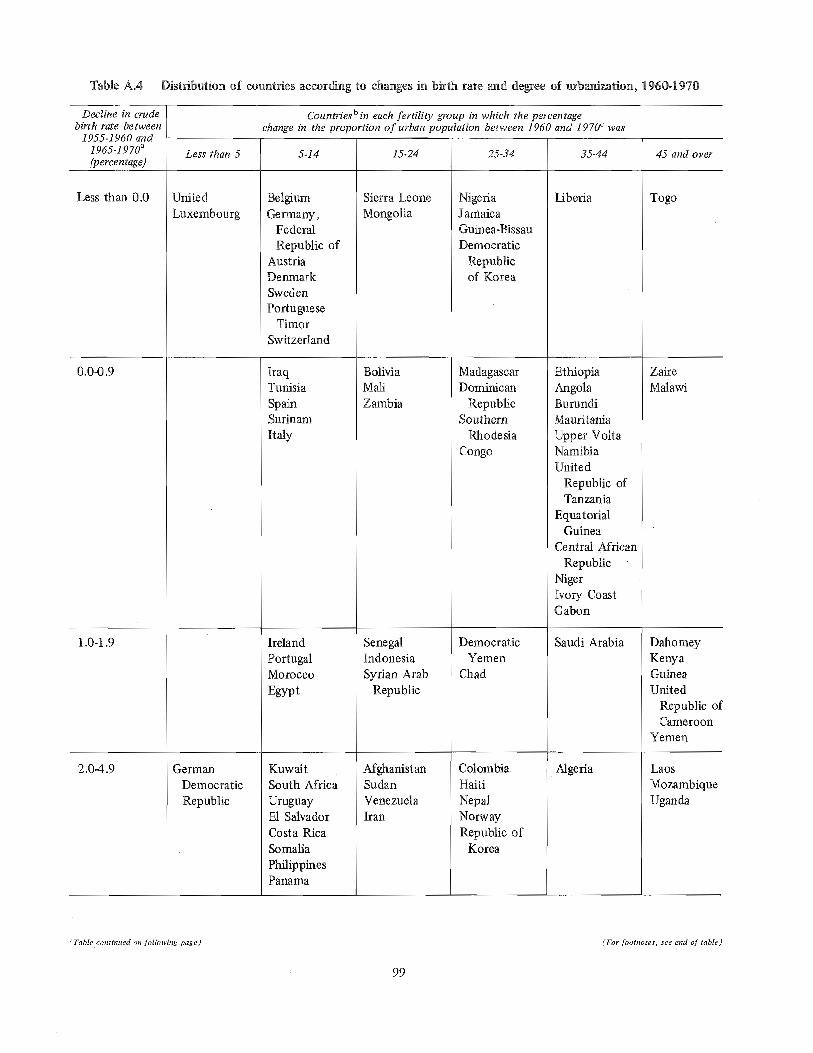
Table A.4 Distribution of countries according to changes in bkth rate and degree of urbanization, 1960-1970
Decline in crude Countriesb in each fertility group in which the percentagebirth rate between change in the proportion of urban population between 1960 and 1970c was
1955-1960 and1965-1970a
Less than 5 5-14 15-24 25-34 35-44 45 and over(percentage)
Less than 0.0 UnitedLuxembourg
BelgiumGermany,
FederalRepublic of
AustriaDenmarkSwedenPortuguese
TimorSwitzerland
Sierra LeoneMongolia
1.0-1.9
GermanDemocraticRepublic
2.04.9
IraqTunisiaSpainSurinamItaly
IrelandPortugalMorocco
Egypt
KuwaitSouth AfricaUruguayE1 SalvadorCosta RicaSomaliaPhilippinesPanama
0.04) .9 BohviaMarlZambia
SenegalIndonesia
Syrian ArabRepublic
AfghanistanSudanVenezuelaIran
NigeriaJamaicaGuinea-BissanDemocratic
Republicof Korea
MadagascarDominican
RepublicSouthern
RhodesiaCongo
DemocraticYemen
Chad
Colombia.
HaitiNepalNorwayRepublic of
Korea
Liberia
EthiopiaAngolaBumndiMauritaniaUpper VoltaNamibiaUnited
Republic ofTanzania
EquatorialGuinea
Central AfricanRepublic
NigerIvory CoastGabon
Saudi Arabia
Algeria
Togo
ZaireMalawi
DahomeyKenyaGuineaUnited
Republic ofCameroon
Yemen
LaosMozambiqueUganda
(Table continued on following page) (For footnotes, see end of table)
99
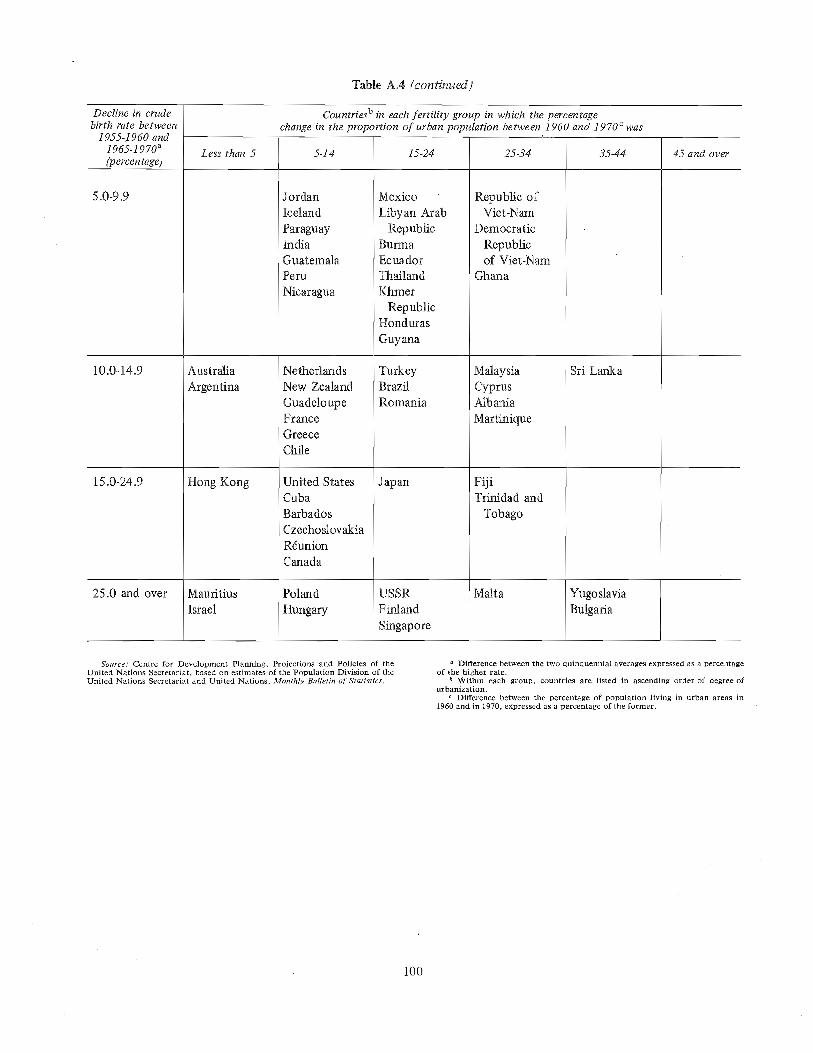
Table A°4 (continued)
Decline in crude Countriesb in each fertility group in which the percentagebirth rate between change in the proportion of urban population between 1960 and 1970c was
1955-! 960 and1965-1970a
Less than 5 5-14 15-24 25-34 35-44 45 and over(percen rage)
5.0-9.9 JordanIcelandParaguayIndiaGuatemalaPeru
Nicaragua
Mexico
Libyan ArabRepublic
BurmaEcuadorThailandKhmer
RepublicHonduras
Guyana
10.0-14o9
25.0 and over
!Hong Kong
MauritiusIsrael
15.0-24.9
NetherlandsNew ZealandGuadeloupeFranceGreeceChile
United StatesCubaBarbadosCzechoslovakiaRdunionCanada
PolandHungary
AustraliaArgentina
TurkeyBrazilRomania
Japan
USSRFinlandSingapore
Republic ofViet-Nam
Democratic
Republicof Viet-Nam
Ghana
MalaysiaCyprusAlbaniaMartinique
FijiTrinidad and
Tobago
Malta
Sri Lanka
YugoslaviaBulgaria
Source: Centre for Development Planning, Projections and Policies of theUnited Nations Secretariat, based on estimates of the Population Division of theUnited Nations Secretariat and United Nations, Monthly Bulletin of Statistics,
Difference between the two quinquennial averages expressed as a percentageof the higher rate.
b Within each group, countries are listed in ascending order of degree ofurbanization.
c Difference between the percentage of population living in urban areas in1960 and in 1970, expressed as a percentage of the former.
100
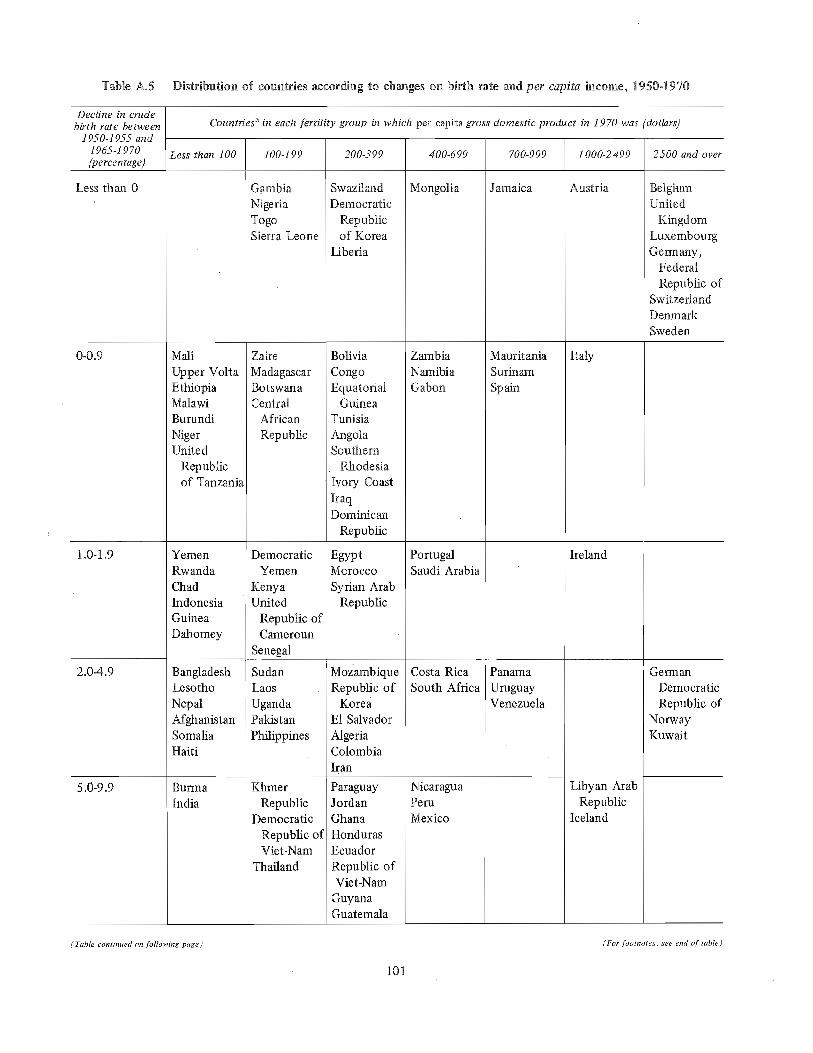
Table A.5 Distribution of countries according to changes on birth rate and per capita income, 1950-197{)
Decline in crudebirth rate between Countriesa in each fertility group in which per capita gross domestic product in 1970 was (dollars)
1950-1955 and1965-1970 Less than 100 100-199 200-399 400-699 700-999 1000-2499 2500 and over(percentage)
Less than 0 Jamaica AustriaG ambiaNigeriaTogoSierra Leone
SwazilandDemocratic
Republicof Korea
Liberia
Mali
5.0-9.9
2.0-4.9
guri-na
India
1.0-1.9 YemenRwandaChadIndonesiaGuineaDahomey
BangladeshLesothoNepalAfghanistanSomaliaHaiti
Upper VoltaEthiopiaMalawiBurundiNigerUnited
Republicof Tanzania
Zaire
MadagascarBotswanaCentral
AfricanRepublic
DemocraticYemen
KenyaUnited
Republic ofCameroun
Senegal
SudanLaos
UgandaPakistanPhilippines
KhlTler
RepublicDemocratic
Republic ofViet-Nam
Thailand
0-0.9 BoliviaCongoEquatorial
GuineaTunisiaAngolaSouthern
RhodesiaIvory Coast
kaqDominican
Republic
EgyptMorocco
Syrian ArabRepublic
MozambiqueRepublic of
KoreaE1 SalvadorAlgeriaColombiaIran
ParaguayJordanGhanaHondurasEcuadorRepublic ofViet-Nam
GuyanaGuatemala
Mongolia
ZambiaNamibiaGabon
PortugalSaudi Arabia
Costa RicaSouth Africa
NicaraguaPeruMexico
MauritaniaSurinam
Spam
Panama
UruguayVenezuela
kaly
I Ireland
Libyan ArabRepublic
Iceland
BelgiumUnited
KingdomLuxembourg
Germany,FederalRepublic of
SwitzerlandDenmarkSweden
GerlYlanDemocratic
Republic ofNorwayKuwait
(Table continued on following page) (For footnotes, see end of table)
101
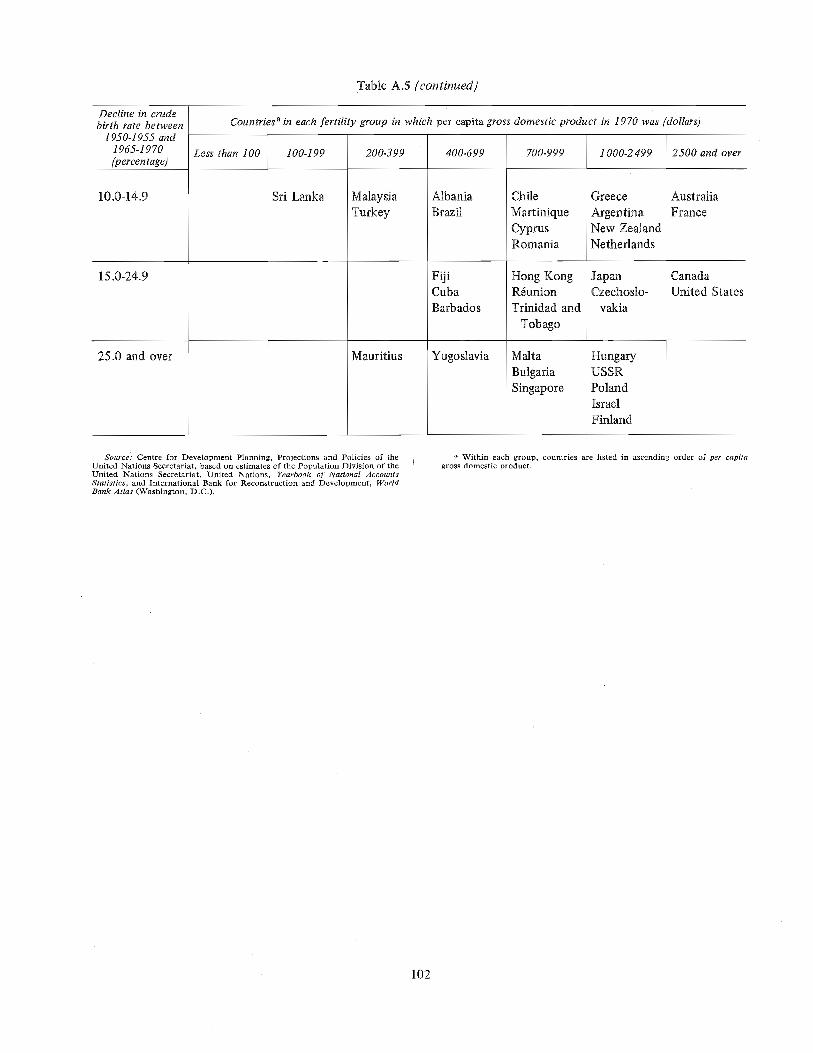
Table A.5 (continued}
Decline in crudebirth rate between Countriesa in each fertility group in which per capita gross domestic product in 1970 was {dollars)
1950-1955 and1965-1970 Less than 100 100-199 200-399 400-699 700-999 1000-2499 2500 and over(percentage)
10.0-14.9 Sri Lanka MalaysiaTurkey
25.0 and over
15.0-24.9
Mauritius
AlbaniaBrazil
FijiCubaBarbados
Yugoslavia
ChileMartiniqueCyprusRomania
Hong KongRÿunionTrinidad and
Tobago
MaltaBulgariaSingapore
Greece
ArgentinaNew ZealandNetherlands
JapanCzechoslo-
vakia
HungaryUSSRPolandIsraelFinland
AustraliaFrance
CanadaUnited States
Source: Centre for Development Planning, Projections and Policies of theUnited Nations Secretariat, based on estimates of the Population Division of theUnited Nations Secretariat, United Nations, Yearbook of National AccountsStatistics, and International Bank for Reconstruction and Development, WorldBank Atlas (Washington, D.C.),
a Within each group, countries are listed in ascending order of per capitagross domestic product.
102
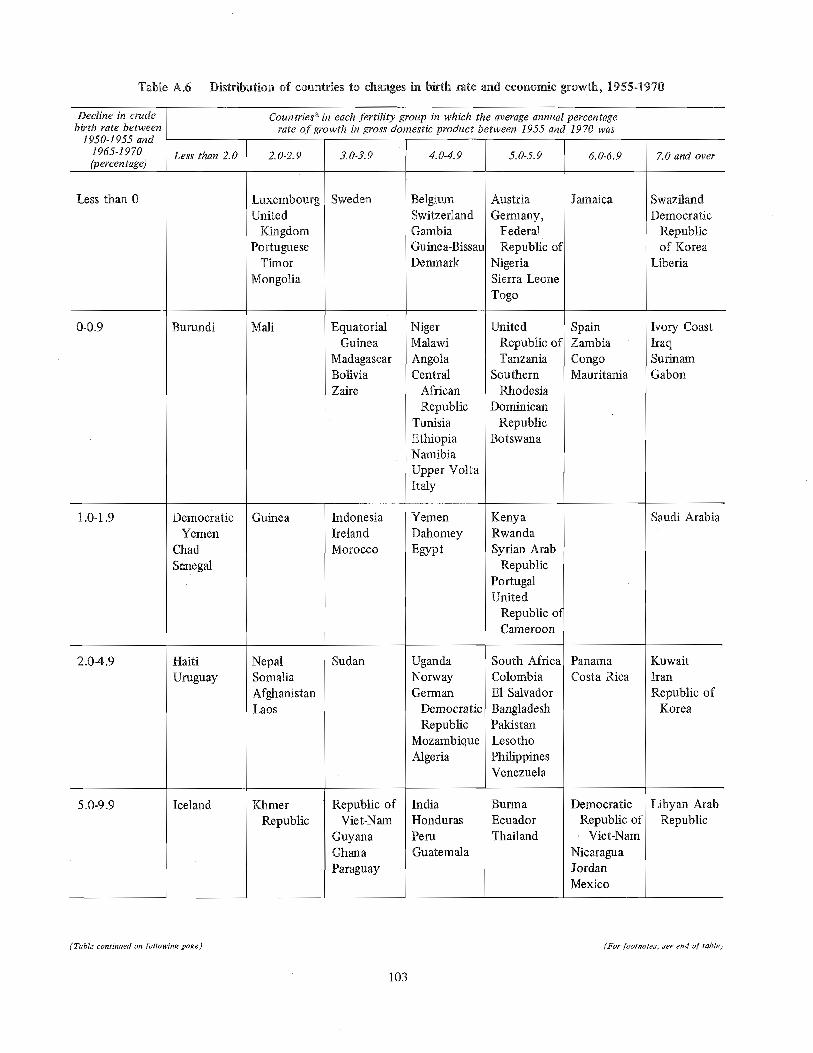
Table A.6 Distribution of countries to changes in birth rate and economic growth, 1955q970
Decline in crude Countriesa in each fertility group in which the average annual percentagebirth rate between rate of growth in gross domestic product between 1955 and 1970 was
1950-1955 and1965-1970
Less than 2.0 2.0-2.9 3.0-3.9 4.0-4.9 5.0-5.9 6.0-6.9 ZO and over(percentage)
Less than 0 LuxembourgUnited
KingdomPortuguese
TknorMongolia
Sweden BelgiumSwitzerlandGambiaGuinea-BissauDenmark
2.0-4.9
5.0-9.9
1.0-1.9
0-0.9
AustriaGermany,
FederalRepublic of
NigeriaSierra Leone
Jamaica
Burundi Marl EquatorialGuinea
MadagascarBofivia
NigerMalawiAngolaCentral
Togo
UnitedRepublic ofTanzania
Southern
SpainZambiaCongoMauritania
DemocraticYemen
ChadSenegal
HaitiUruguay
Iceland
Guinea
NepalSomaliaAfghanistanLaos
KhnlerRepublic
Zaire
IndonesiaIrelandMorocco
Sudan
Republic ofViet-Nam
GuyanaGhanaParaguay
AfricanRepublic
TunisiaEthiopiaNamibiaUpper VoltaItaly
Yemen
DahomeyEgypt
UgandaNorwayGerman
DemocraticRepublic
MozambiqueAlgeria
IndiaHondurasPeruGuatemala
RhodesiaDominican
RepublicBotswana
KenyaRwandaSyrian Arab
RepublicPortugalUnited
Republic ofCameroon
South AfricaColombiaE1 SalvadorBangladeshPakistanLesothoPhilippinesVenezuela
gurnlaEcuadorThailand
PanamaCosta Rica
DemocraticRepublic of
Viet-Nam
NicaraguaJordanMexico
SwazilandDemocratic
Republicof Korea
Liberia
Ivory CoastIraqSurinam
Gabon
Saudi Arabia
KuwaitIran
Republic ofKorea
Libyan ArabRepublic
(Table continued on following page) (2For footnotes, see end of tab&)
103
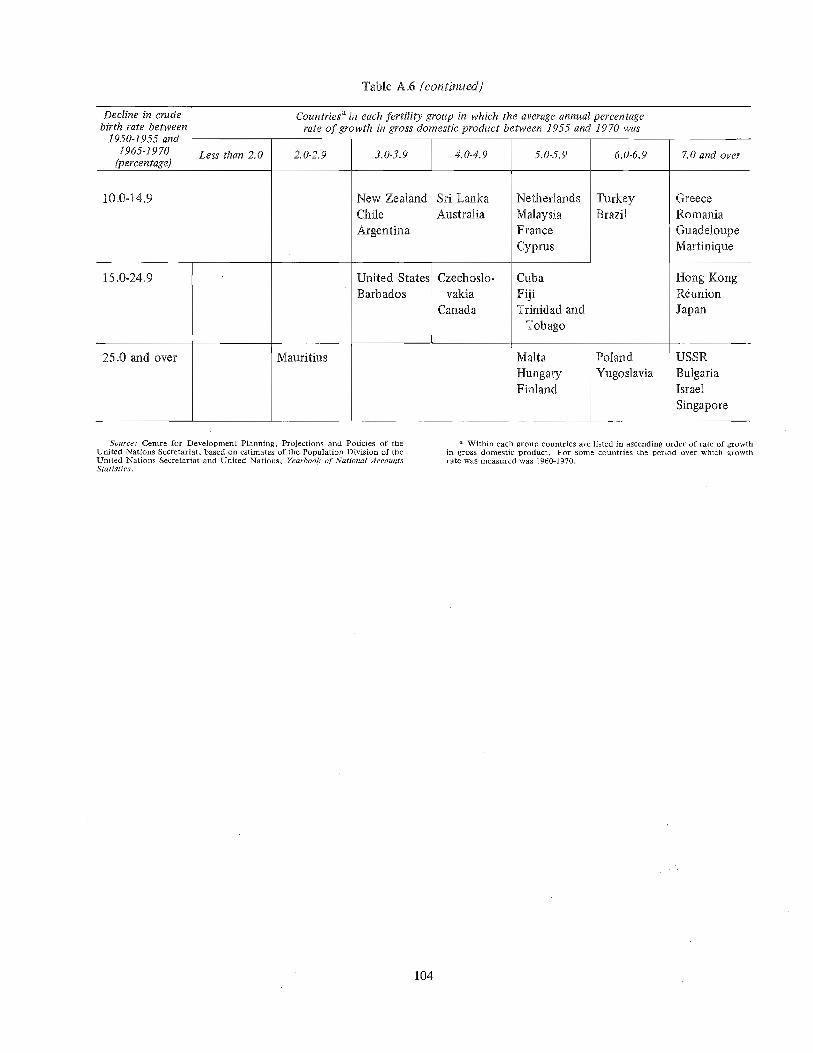
Table A,6 (continued)
Decline in crude Countriesa in each fertili& group in which the average annual percentagebirth rate between rate of growth in gross domestic product between 1955 and 1970 was
1950-1955 and1965-1970 Less than 2,0 2.0-2.9 3.0-3.9 4.0-4,9 5°0-5.9 6.0-6.9 7.0 and over
(pereen rage)
10.0-14.9 New ZealandChileArgentina
Sri LankaAustralia
Mauritius25.0 and over
United StatesBarbados
15.0-24.9 Czechoslo-vakia
Canada
NetherlandsMalaysiaFranceCyprus
CubaFijiTrinidad and
Tobago
MaltaHungaryFinland
TurkeyBrazil
PolandYugoslavia
GreeceRomania
GuadeloupeMartinique
Hong KongR4unionJapan
USSRBulgariaIsrael
Singapore
Source: Centre for Development Planning, Projections and Policies of theUnited Nations Secretariat, based on estimates of the Population Division of theUnited Nations Secretariat and United Nations, Yÿarbook of National AccountsStatistics.
a Within each group countries are listed in ascending order of rate of growthin gross domestic product, For some countries the period over which growthrate was measured was 1960-1970.
104
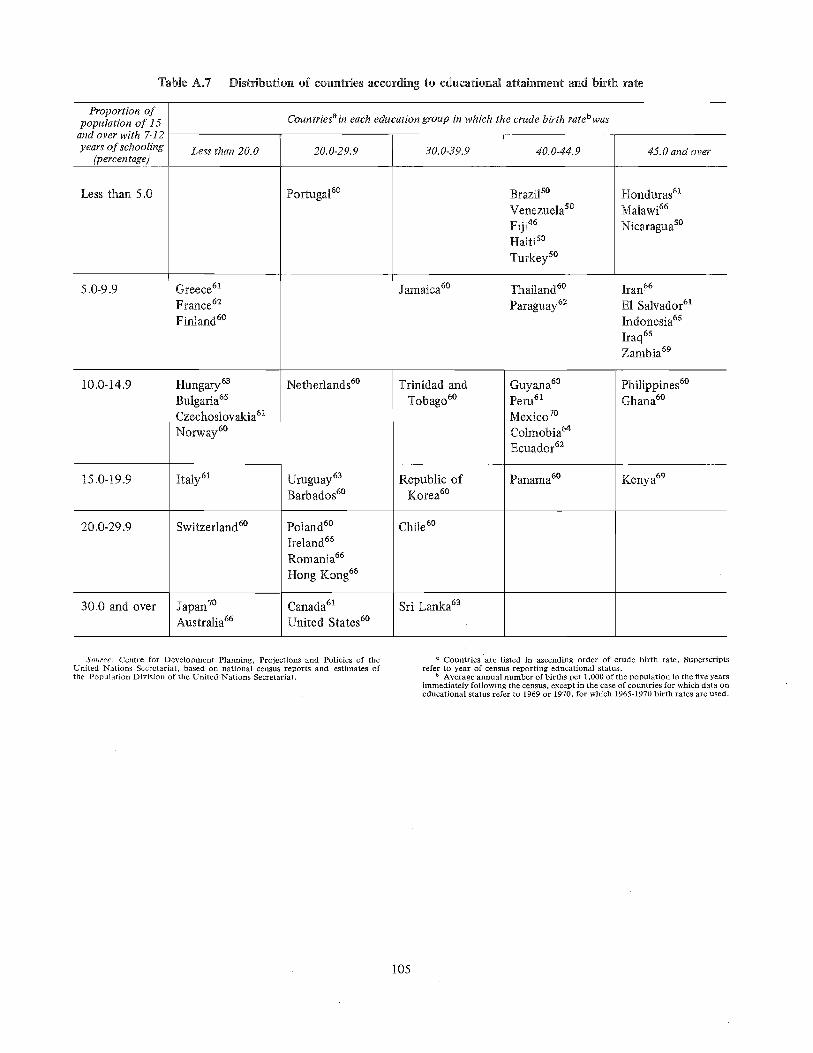
Table A.7 Distribution of countries according to educational attainment and birth rate
Proportion ofpopulation of 15 Countriesa in each education group in which the crude birth ratebwas
g!flU OI]UF wltn /-1.5
years of schooling Less than 20.0 20.0-29.9 30.0-39.9 40.0-44.9 45.0 and over(percentage)
Less than 5.0 Portugal6° Brazils°
Venezuelas°Fiji46Haffis°Turkeys°
5.0-9.9
20.0-29.9
30.0 and over Japanv° Canada61 Sri Lanka63Australia66 United States6°
15.0-19.9
Hungary6aBulgaria6s
Czechoslovakia6xNorway6°
Italy61
Switzerland6°
10.0-14.9 Netherlands6°
Uruguay6aBarbados6°
Poland6°Ireland66Romania66
Hong Kong66
Jamaica60
Trinidad andTobago6°
Republic ofKorea6°
Chile6°
Greece61France62Finland6°
Thailand6°Paraguay6ÿ
Guyana6°Peru61
Mexico7°Cohnobia64Ecuador62
Panama6°
Honduras61Malawi66
Nicaraguas°
Iran66
E1 Salvador6!Indonesia6sIraq6sZambia69
Philippines6°Ghana6°
Kenya69
Source." Centre for Development Planning, Projections and Policies of theUnited Nations Secretariat, based on national census reports and estimates ofthe Population Division of the United Nations Secretariat.
a Countries'are listed in ascending order of crude birth rate. Superscriptsrefer to year of census reporting educational status.
Average annual number of births per t ,000 of the population in the five yearsimmediately following the census, except in the case of countries for which data oneducational status refer to 1969 or 1970, for which 1965-1970 birth rates are used.
105
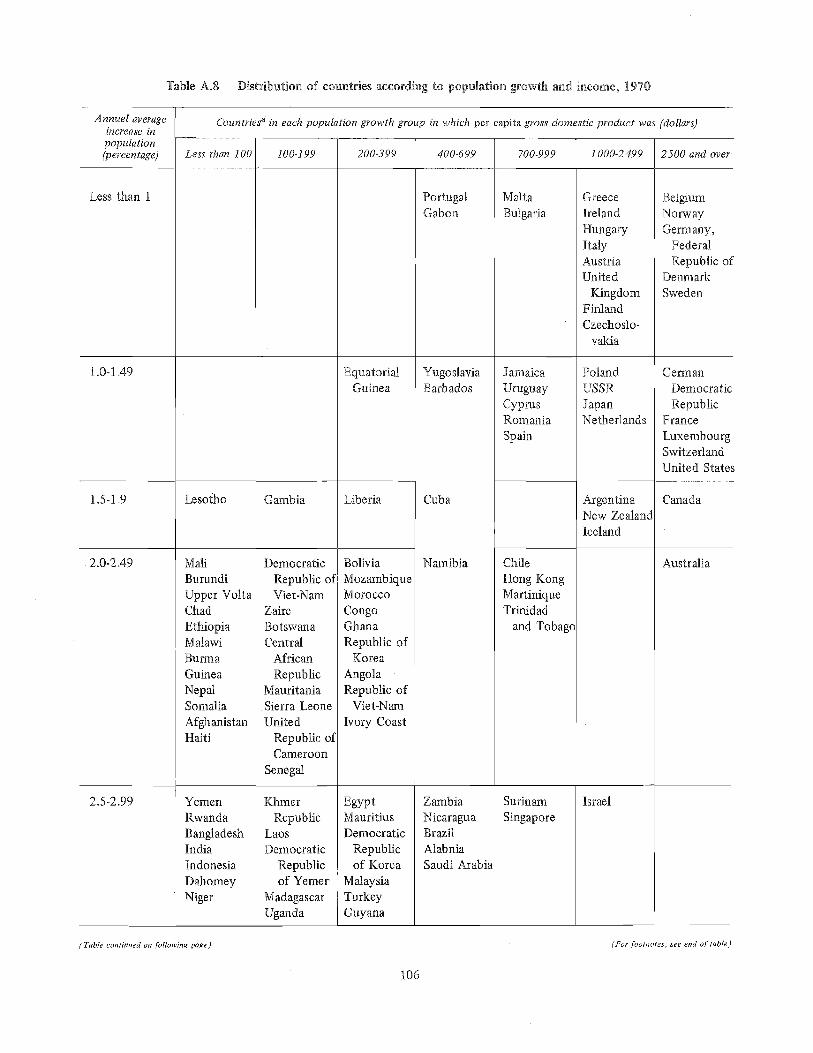
Table A.8 Distribution of countries according to population growth and income, !970
Annuel average Countriega in each population growth group in which per capita gross domestic product was {dollars)increase in
population(percentage) 200-399 400-699 700-999 1000-2499 2500 and over
Less than i
1.0-1.49
1.5-1,9
2.0-2.49
Lesotho Gambia Liberia
Less than 100 100-199
Mali DemocraticBurundi Republic ofUpper Volta Viet-Nam
PortugalGabon
EquatorialGuinea
2.5-2.99 YemenRwandaBangladeshIndiaIndonesia
DahomeyNiger
ZaireBotswanaCentral
AfricanRepublic
MauritaniaSierra LeoneUnited
Republic ofCameroon
Senegal
Khlyler
RepublicLaosDemocratic
Republicof Yemer
MadagascarUganda
ChadEthiopiaMalawiBurmaGuineaNepalSomaliaAfghanistanHaiti
BoliviaMozambiqueMorocco
CongoGhanaRepublic of
Korea
AngolaRepublic of
Viet-Nam
Ivory Coast
EgyptMauritiusDemocratic
Republicof Korea
MalaysiaTurkeyGuyana
Cuba
YugoslaviaBarbados
Namibia
ZambiaNicaraguaBrazilAlabniaSaudi Arabia
MaltaBulgaria
JamaicaUruguayCyprusRomaniaSpain
ChileHong KongMartiniqueTrinidad
SurinamSingapore
GreeceIrelandHungaryItalyAustriaUnited
KingdomFinlandCzechoslo-
valda
PolandUSSRJapanNetherlands
ArgentinaNew ZealandIceland
Israel
and Tobago
BelgiumNorway
Germany,FederalRepublic of
Denmark
Sweden
GermanDemocratic
RepublicFranceLuxembourgSwitzerlandUnited Stateÿ
Canada
Australia
(Table continued opt following page) (For footnotes, see end of table)
106
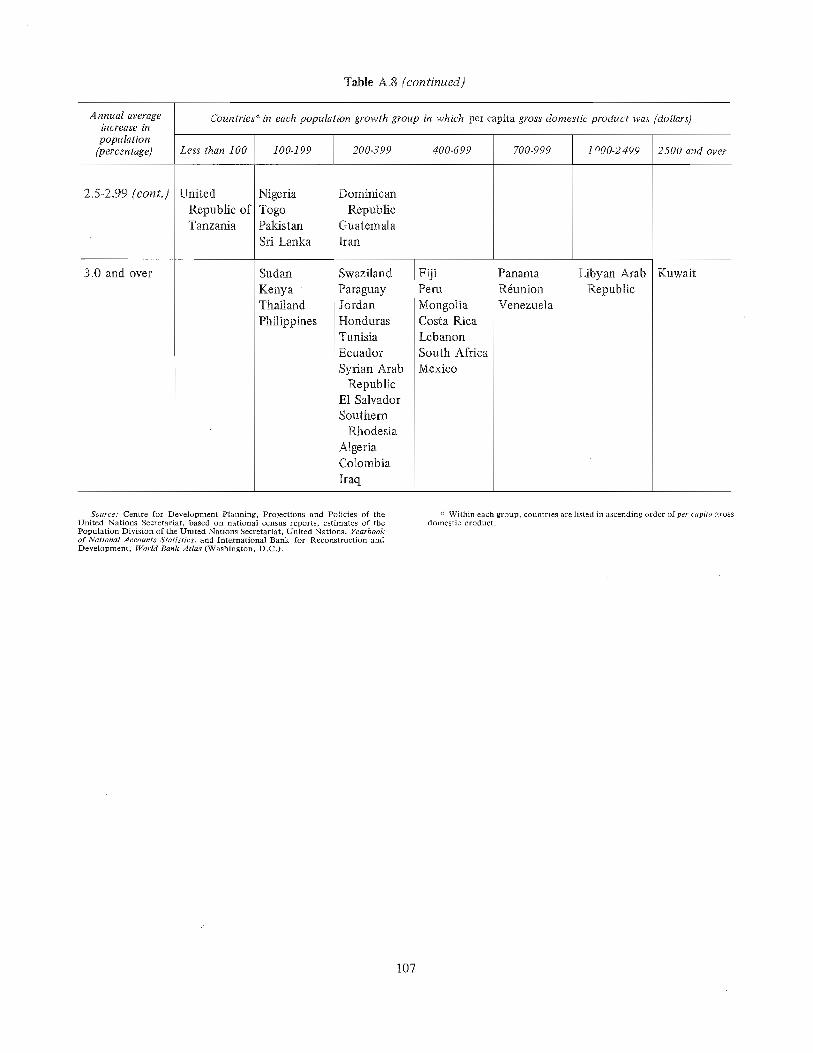
Table A°8 (continued)
Annual average Countriesa in each population growth group in which per capita gross domestic product was (dollars)increase in
population(percentage) Less than 100 100-199 200-399 400-699 700-999 1ÿ00-2499 2500 and over
2°5°2°99 (cont.) UnitedRepublic ofTanzania
NigeriaTogoPakistanSri Lanka
Dominican
RepublicGuatemalaIran
3.0 and over SudanKenyaThailandPhilippines
SwazilandParaguayJordanHondurasTunisiaEcuadorSyrian Arab
RepublicE1 SalvadorSouthern
RhodesiaAlgeriaColombiaIraq
FijiPeru
MongoliaCosta RicaLebanonSouth AfricaMexico
PanamaRÿunionVenezuela
Libyan ArabRepublic
Kuwait
Source." Centre for Development Planning, Projections and Policies of theUnited Nations Secretariat, based on national census reports, estimates of thePopulation Division of the United Nations Secretariat, United Nations, Yearbookof National Accounts Statistics, and International Bank for Reconstruction andDevelopment, WoHd Bank Atlas (Washington, D.C.).
a Within each group, countries are listed in ascending order of per capita grossdomestic product.
107
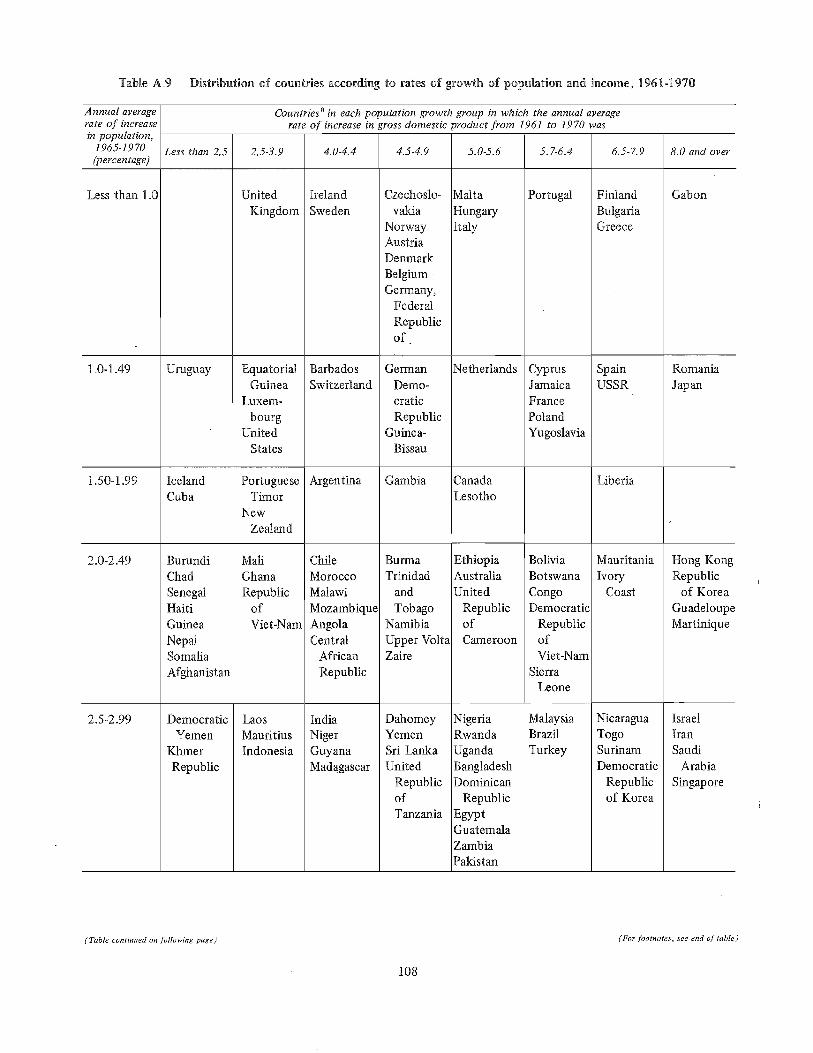
Table A.9 Distribution of countries according to rates of growth of population and income, 1961-1970
Annual average Countriesa in each population growth group in which the annual averagerate of increase rate of increase in gross domestic woduet from 1961 to 1970 wasin population,
1965-1970 Less than 2.5 2.5-3.9 4.0-4.4 4.5-4.9 5.0-5.6 5.7-6.4 6.5-7.9 8.0 and over(percentage)
Less than 1.0 UnitedKingdom i
IrelandSweden
Uruguay
2.5-2.99
2.0-2.49
IcelandCuba
BurondiChadSenegalHaitiGuinea
NepalSomaliaAfghanistan
DemocraticYemen
KhmerRepublic
1.50-1.99
EquatorialGuinea
Luxem-
bourgUnited
States
PortugueseTimor
NewZealand
MarlGhanaRepublicofViet-Nam
gao8MauritiusIndonesia
1.0-1.49 BarbadosSwitzerland
Argentina
ChileMoroccoMalawiMozambiqueAngolaCentral
AfricanRepublic
IndiaNigerGuyanaMadagascar
Czechoslo-
vakiaNorwayAustriaDenmark
BelgiumGermany,
FederalRepublicof
German
Demo-cratic
RepublicGuinea-
Bissau
Gambia
gUlTIlaTrinidad
andTobago
NamibiaUpper VoltaZaire
DahomeyYemenSri LankaUnited
RepublicofTanzania
MaltaHungaryItaly
Netherlands
CanadaLesotho
EthiopiaAustraliaUnited
RepublicofCameroon
NigeriaRwandaUgandaBangladeshDominican
RepublicEgyptGuatemalaZambiaPakistan
Portugal
CyprusJamaicaFrancePolandYugoslavia
BoliviaBotswana
CongoDemocratic
RepublicofViet-Nam
SierraLeone
MalaysiaBrazilTurkey
FinlandBulgariaGreece
SpainUSSR
Liberia
Mauritania
IvoryCoast
Nicaragua
TogoSurinamDemocratic
Republicof Korea
Gabon
Romania
Japÿ
Hong KongRepublic
of Korea
GuadeloupeMartinique
IsraelIranSaudi
ArabiaSingapore
(Table continued on following page) (For footnotes, see end of table
108
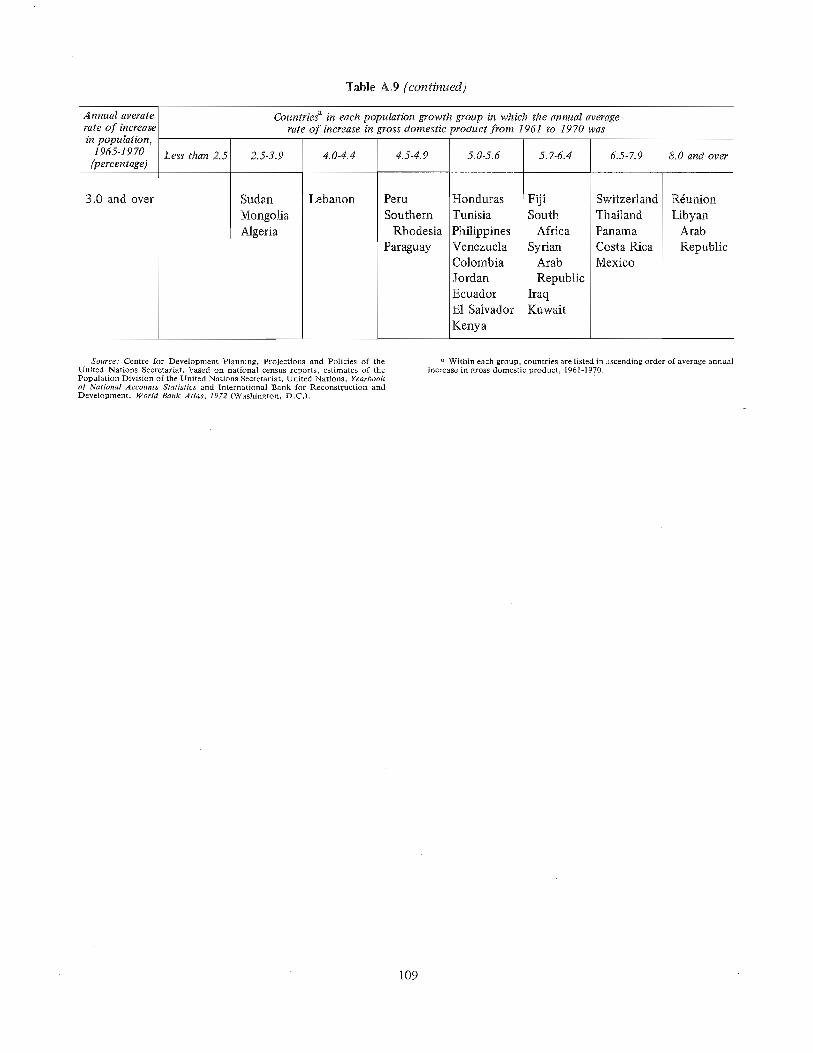
Table A,9 (continued)
Annual averaterate of increasein population,
1965-1970(percen rage)
Countriesa in each population growth group in which the annual averagerate of increase in gross domestic product from 196! to 1970 was
Less than 2.5 2.5-3.9 4.0-4.4
3.0 and over SudanMongoliaAlgeria
Lebanon
4.5-4.9
PeruSouthern
RhodesiaParaguay
5.0-5.6
HondurasTunisiaPhilippines:VenezuelaColombiaI JordanEcuadorE1 SalvadorKenya
5.7-6.4
FijiSouth
AfricaSyrian
ArabRepublic
IraqKuwait
6.5-7.9
SwitzerlandThailandPanamaCosta RicaMexico
8°0 and over
Rÿunion
LibyanArabRepublic
Source: Centre for Development Planning, Projections and Policies of theUnited Nations Secretariat, based on national census reports, estimates of thePopulation Division of the United Nations Secretariat, United Nations, Yearbookof National Accounts Statistics and International Bank for Reconstruction andDevelopment, World Bank Atlas, 1972 (Washington, D.C.).
a Within each group, countries are listed in ascending order of average annualincrease in gross domestic product, 1961-1970.
109
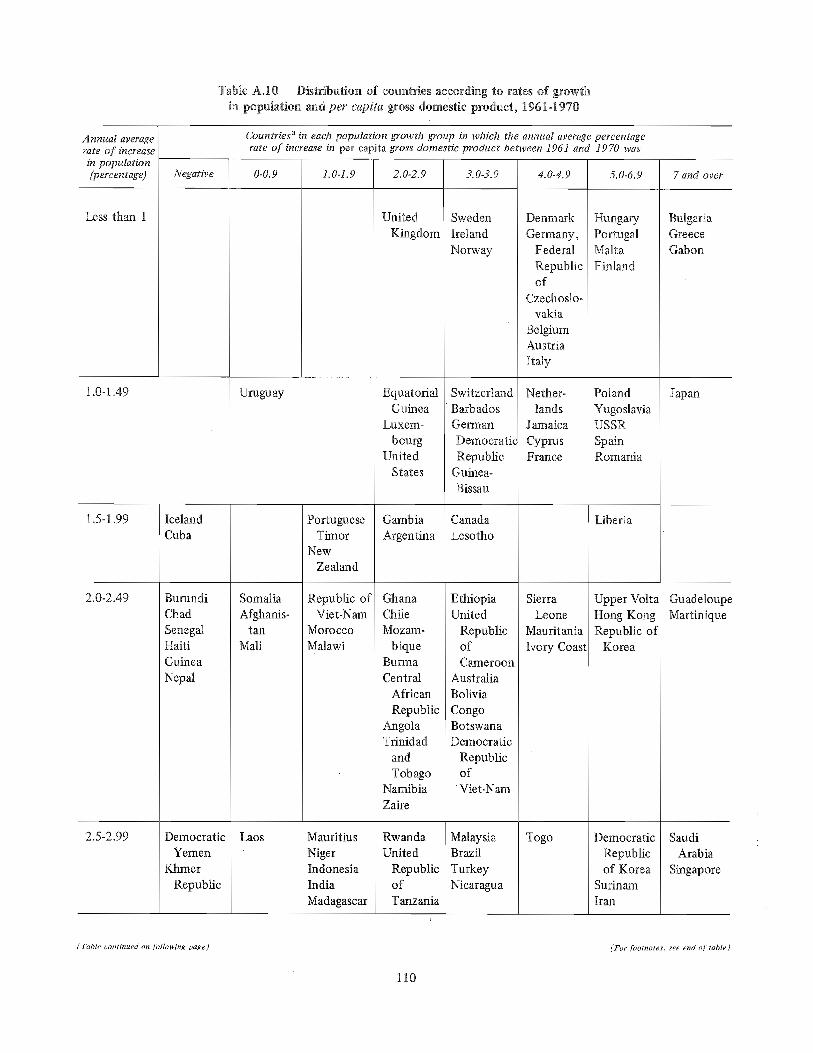
Table AAO Distribution of countries according to rates of growthin population and per capita gross domestic product, 1961-1970
Annual average Countriesa in each population growth group in which the annual average percentagerate of increase rate of increase in per capita gross domestic product between 1961 and 1970 was
in population(percentage) Negative 0-0.9 1.0-1.9 2.0-2.9 3.0-3.9 4.0.4.9 5.0-6.9 7 and over
Less than 1 UnitedKingdom
Uruguay
2.5-2.99
2.0-2.49
IcelandCuba
BurundiChadSenegalHaitiGuineaNepal
DemocraticYemen
Kkwaer
Republic
1.5-1.99
SomaliaAfghanis-
tanMall
Laos
PortugueseTimor
NewZealand
Republic ofViet-Nam
MoroccoMalawi
MauritiusNigerIndonesiaIndiaMadagascar
1.0-1.49 EquatorialGuinea
Luxem-
bourgUnited
States
GambiaArgentina
GhanaChileMozam-
biqueBurma
CentralAfricanRepublic
AngolaTrinidad
and
TobagoNamibiaZaire
RwandaUnited
RepublicofTanzania
SwedenIrelandNorway
SwitzerlandBarbadosGermanDemocratic
RepublicGuinea-
Bissau
CanadaLesotho
EthiopiaUnited
RepublicofCameroon
AustraliaBoliviaCongoBotswanaDemocratic
Republicof
' Viet-Nam
MalaysiaBrazilTurkeyNicaragua
Denmark
Germany,FederalRepublicof
Czechoslo-vakia
BelgiumAustriaItaly
Nether-lands
Jamaica
CyprusFrance
SierraLeone
MauritaniaIvory Coast
Togo
HungaryPortugalMaltaFinland
PolandYugoslaviaUSSRSpainRomania
Liberia
Upper VoltaHong KongRepublic of
Korea
DemocraticRepublicof Korea
SurinamIran
BulgariaGreeceGabon
Japan
GuadeloupeMartinique
SaudiArabia
Singapore
(Table continued on following page) (For footnotes, see end of table)
110
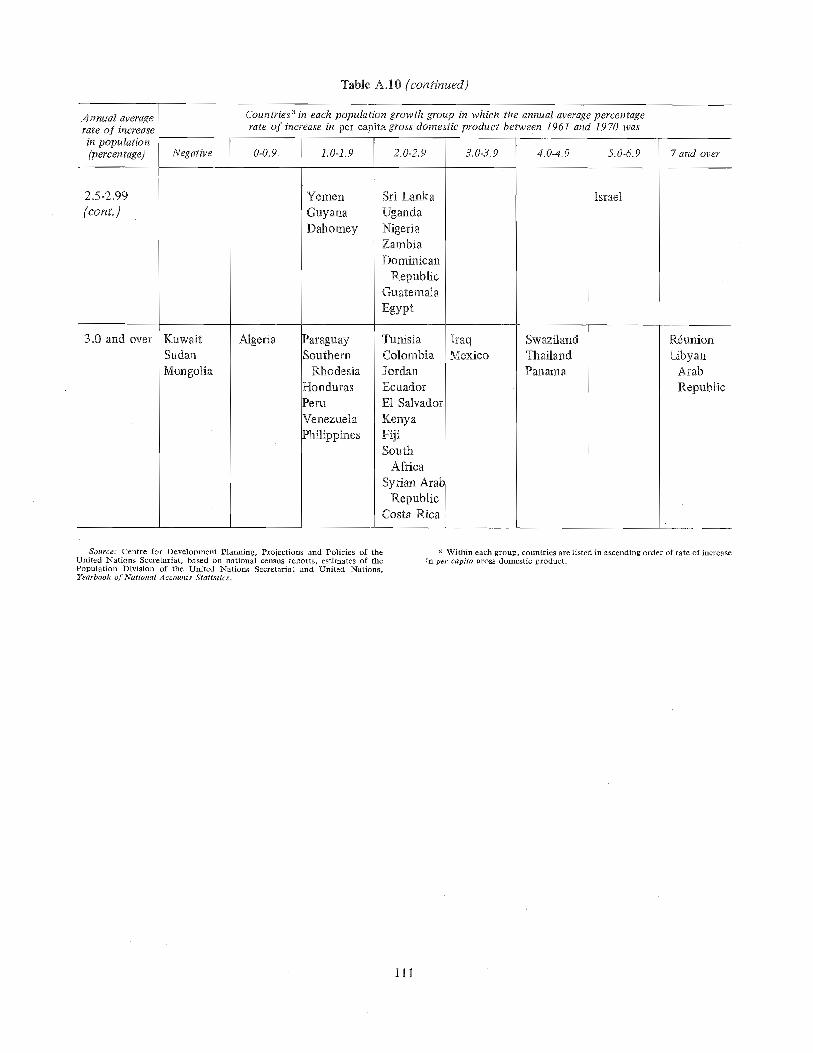
Table A.IO [continued)
Annual average Countriesa in each population growth group in which the annual average percentagerate of increase rate of increase in per capita gross domestic product between 1961 and 1970 wasin population(percentage) Negative 2.0-2.9 3ÿ0-3.9 4.0-4.9 5ÿ0-6.9 7 and over
3.0 and over KuwaitSudanMongolia
Algeria
0-0.9. 1.0-1.9
Yemen
GuyanaDahomey
ParaguaySouthern
RhodesiaHondurasPeruVenezuela
Philippines
Sri LankaUgandaNigeriaZambiaDominican
RepublicGuatemala
Egypt
TunisiaColombiaJordanEcuadorE1 SalvadorKenyaFijiSouth
AfricaSyrian Arab
RepublicCosta Rica
IraqMexico
SwazilandThailandPanama
Israel
R4unionLibyan
ArabRepublic
Source: Centre for Development Planning, Projections and Policies of theUnited Nations Secretariat, based on national census reports, estimates of thePopulation Division of the United Nations Secretariat and United Nations,Yearbook of National Accounts Statistics.
a Within each group, countries are listed in ascending order of rate of increasein per capita gross domestic product.
111
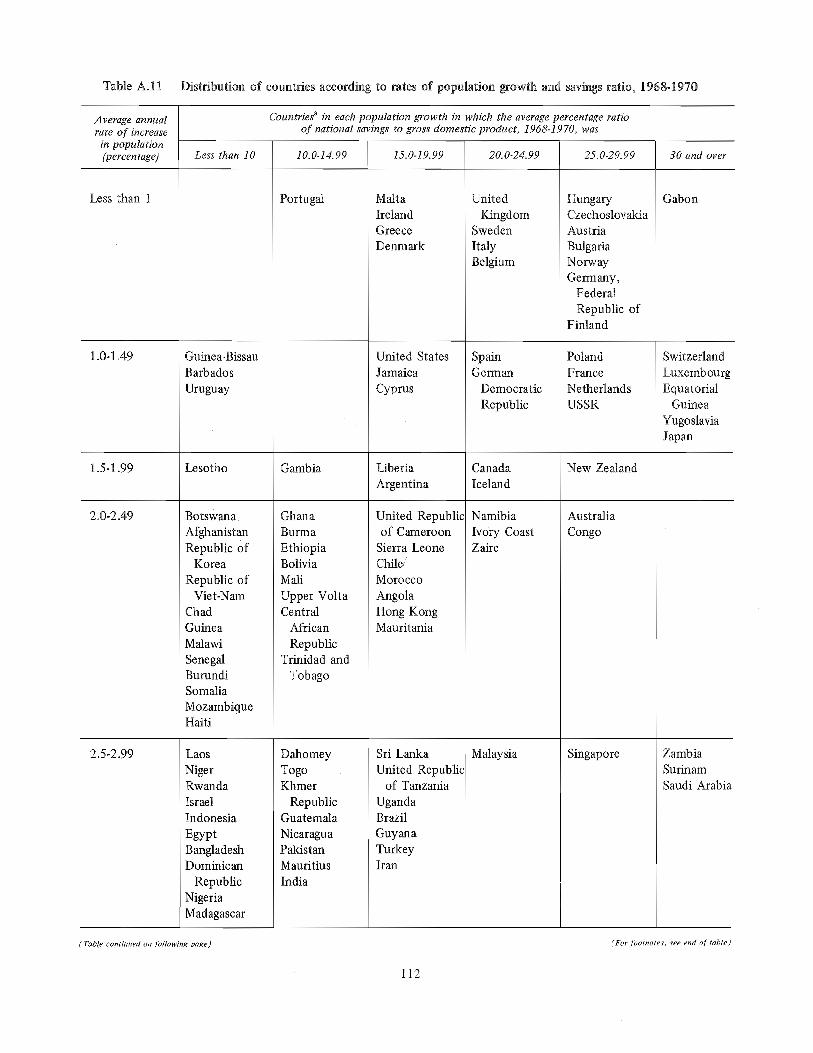
Table A.11 Distribution of countries according to rates of population growth and savings ratio, 1968-1970
Average annual Countriesa in each population growth in which the average percentage ratiorate of increase of national savings to gross domestic product, 1968-1970, wasin population(percentage) Less than 10 10.0-14.99 15.0-19.99 20.0-24.99 25.0-29.99 30 and over
Less than 1 Portugal MaltaIrelandGreeceDenmark
1.0-1.49
2.5-2.99
2.0-2.49
Lesotho
BotswanaAfghanistanRepublic of
Korea
Republic ofViet-Nam
ChadGuineaMalawiSenegalBurundiSomaliaMozambiqueHaiti
Laos
NigerRwandaIsraelIndonesia
EgyptBangladeshDominican
RepublicNigeriaMadagascar
1.5-1.99 Gambia
GhanaBurma
EthiopiaBoliviaMarlUpper VoltaCentral
AfricanRepublic
Trinidad andTobago
DahomeyTogoKhmer
RepublicGuatemalaNicaraguaPakistanMauritiusIndia
Guinea-Bissau
BarbadosUruguay
United StatesJamaica
Cyprus
LiberiaArgentina
United Republicof Cameroon
Sierra LeoneChile!Morocco
AngolaHong KongMauritania
Sri LankaUnited Republic
of Tanzania
UgandaBrazilGuyanaTurkeyIran
UnitedKingdom
SwedenItalyBelgium
SpainGerman
Democratic
Republic
CanadaIceland
NamibiaIvory CoastZaire
Malaysia
HungaryCzechoslovakiaAustriaBulgariaNorwayGermany,
FederalRepublic of
Finland
PolandFranceNetherlandsUSSR
AustraliaCongo
Singapore
New Zealand
Gabon
SwitzerlandLuxembourgEquatorial
Guinea
YugoslaviaJapan
ZambiaSurinamSaudi Arabia
(Table contintted on following page) (For tbotnotes, see end of table)
112
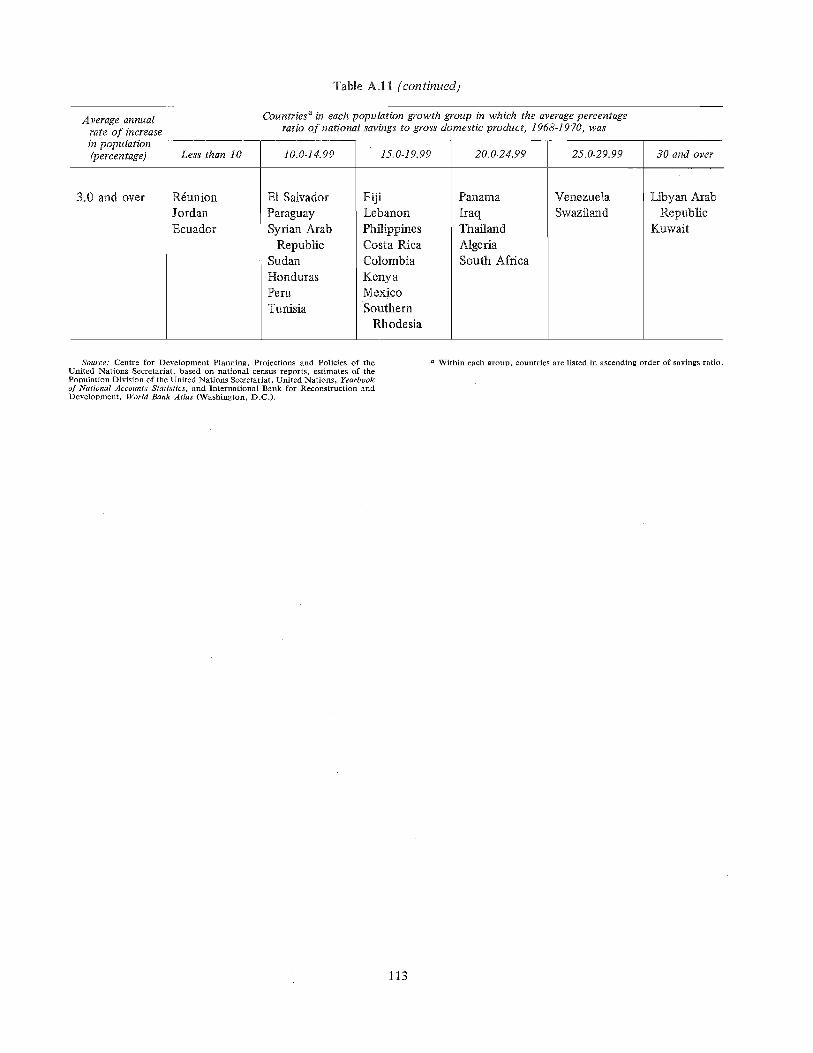
Table AA 1 (continued)
Average annual Countriesa in each population growth group in which the average percentagerate of increase ratio of national savings to gross domestic product, 1968-1970, was
in population(percentage) Less than 10 10.0-14.99 15.0-19.99 20.0-24.99 25.0-29.99 30 and over
3.0 and over RÿunionJordanEcuador
E1 SalvadorParaguaySyrian Arab
RepublicSudanHondurasPeruTunisia
FijiLebanon
PhilippinesCosta RicaColombiaKenyaMexicoSouthern
Rhodesia
Panama
IraqThailandAlgeriaSouth Africa
VenezuelaSwaziland
Libyan ArabRepublic
Kuwait
Source: Centre for Development Planning, Projections and Policies of theUnited Nations Secretariat, based on nat,.'onal census reports, estimates of thePopulation Division of the United Nations Secretariat, United Nations, Yearbookof National Accounts Statistics, and International Bank for Reconstruction andDevelopment, World Bank Atlas (Washington, D.C.).
Within each group, countries are listed in ascending order of savings ratio.
113
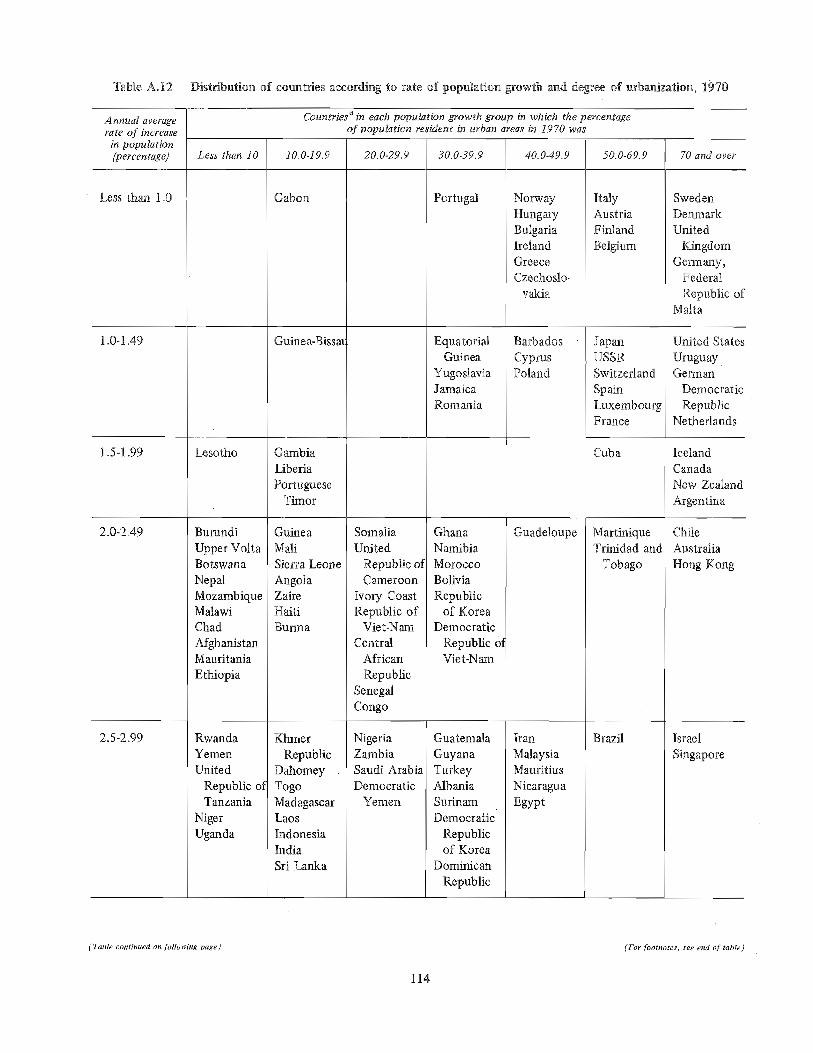
Table AA2 Distribution of countries according to rate of population growth and degree of urbanization, 1970
Annual average Countriesa in each population growth group in which the percentagerate of increase of population resident in urban areas in 1970 was
in population{percentage) Less than 10 10.0-19.9 20.0-29,9 30.0-39.9 40.0-49.9 50.0-69.9 70 and over
Less than 1.0 Gabon Portugal
1.0-1.49
2.5-2.99
2.0-2.49 BurundiUpper VoltaBotswanaNepalMozambiqueMalawiChadAfghanistanMauritaniaEthiopia
RwandaYemenUnite d
Republic ofTanzania
NigerUganda
Lesotho!.5-1.99 GambiaLiberiaPortuguese
Timor
GuineaMaliSierra Leone
AngolaZaireHaitiBurma
KhmerRepublic
DahomeyTogoMadagascarLaosIndonesiaIndiaSri Lanka
SomaliaUnited
Republic otCameroon
Ivory CoastRepublic of
Viet-NamCentral
AfricanRepublic
SenegalCongo
NigeriaZambiaSaudi ArabiaDemocratic
Yemen
Guinea-Bissau EquatorialGuinea
YugoslaviaJamaicaRomania
GhanaNamibiaMoroccoBoliviaRepublic
of KoreaDemocratic
Republic OfViet-Narn
GuatemalaGuyanaTurkeyAlbaniaSurinam
Democratic
Republicof Korea
Dominican
Republic
Norway
HungaryBulgariaIrelandGreeceCzechoslo-
vakia
BarbadosCyprusPoland
Guadeloupe
1ranMalaysiaMauritius
Nicaragua
Egypt
AustriaFinlandBelgium
JapanUSSRSwitzerlandSpainLuxembourgFrance
Cuba
MartiniqueTrinidad and
Brazi!
Tobago
SwedenDenmarkUnited
KingdomGermany,
FederalRepublic of
Malta
United StatesUruguayGerman
DemocraticRepublic
Netherlands
IcelandCanadaNew ZealandArgentina
ChileAustraliaHong Kong
Israel
Singapore
(Table continued on following page) (For footnotes, see end of table)
114
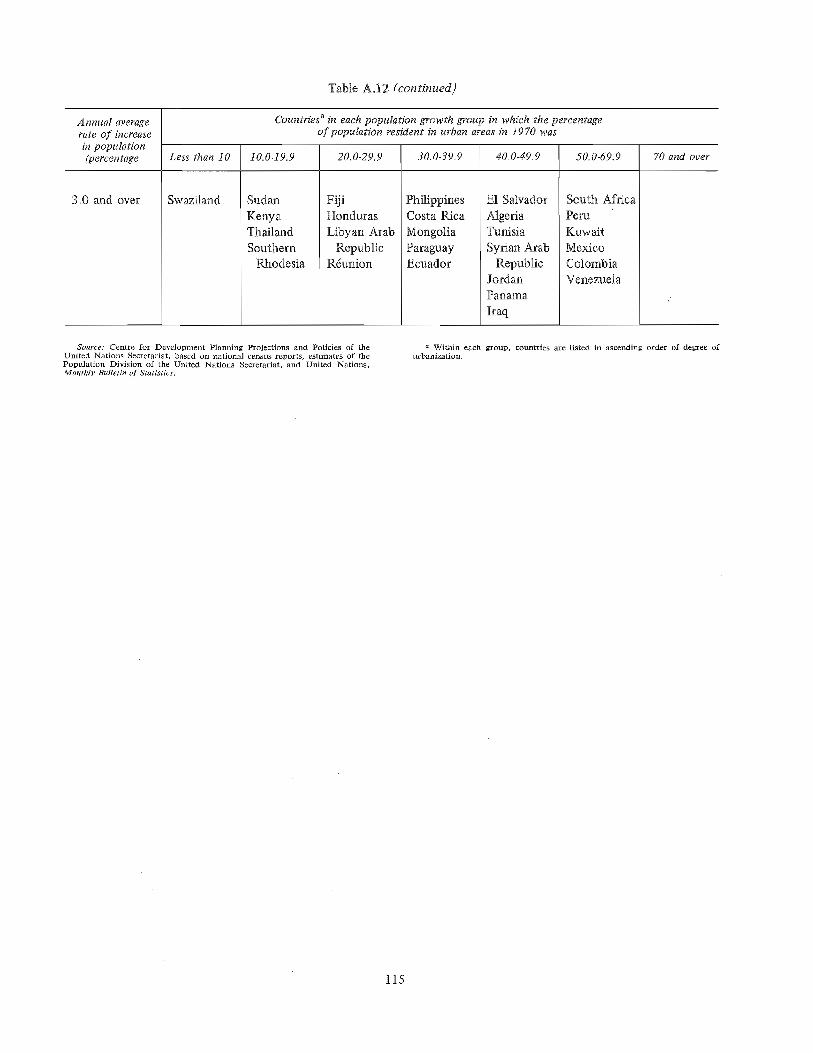
Table AA2 (continued)
Annual average Countriesa in each population growth group in which the percentagerate of increase of population resident in urban areas in 1970 wasin population(percentage Less than 10 10.0-19.9 20.0-29.9 30.0-39.9 40.0-49.9 50.0-69.9 70 and over
3.0 and over Swaziland SudanKenyaThmlandSouthern
Rhodesia
FijiHonduras
Libyan ArabRepublic
Rÿunion
PhilippinesCosta RicaMongoliaParaguayEcuador
E1 SalvadorAlgeriaTunisiaSyrian Arab
RepublicJordan
Panama
traq
South AfricaPeru
KuwaitMexicoColombiaVenezuela
Source: Centre for Development Planning Projections and Policies of theUnited Nations Secretariat, based on national census reports, estimates of thePopulation Division of the United Nations Secretariat, and United Nations,Monthly Bulletin of Statistics.
a Within each group, countries are listed in ascending order of degree ofurbanization.
115

Table AA3 Distribution of countries according to population growth and school enrolment, late 1960s
Average annual Countriesa in each population growth group in which the percentagerate of increase ratio of primary and secondary enrolment to the. 5-19 age groupb in the late 1960s wasin population,1965-1970 Less than 15.0 15.0-29.9 30.0-44.9 45.0-59.0 60.0-69.9 70.0-79.9 80.0 and over(percentage)
Less than 1.0 Portugal ItalyCzechoslo-
vakiaDenmarkGreece
Hungary
Guinea-Bissau
2.50-2.99
2.20-2.49
Upper VoltaEthiopia
SomaliaMauritaniaAfghanistanMaliChadNepal
NigerNigeria
GambiaAngolaMozambique
BurundiGuineaHaiti
!Sierra LeoneMalawiSenegalMorocco
DahomeySaudi ArabiaUnited
Republic ofTanzania
LaosUgandaGuatemalaIndia
1,50-2.19 CentralÿAfricanRepublic
LiberiaBotswana
I Ivory Coast
GhanaBurmaBolivia
RwandaIndonesiaIran
TogoNicaraguaMadagascar
EgyptKhmer
Republic
Ghana Jamaica
UnitedRepublicofCameroon
Lesotho
ZaireRepublic of
Viet-Nam
ZambiaBrazilTurkeyDominican
RepublicMauritiusSri Lanka
1.00-1.49 YugoslaviaSpainUruguayPolandSwitzerlandLuxembourg
IcelandArgentinaCubaTrinidad and
TobagoChile
Republic ofKorea
GuadeloupeHong Kong
GuyanaAlbaniaIsraelSingapore
BulgariaFinlandMaltaIrelandNorwayAustriaGabonUnited
KingdomSwedenGermany,
FederalRepublic o!
RomaniaFranceBarbadosJapanNetherlands
Martinique
Congo
Belgium
USSRUnited States
New ZealandAustraliaCanada
(Table continued on following page) (For footnotes, see end of table)
116
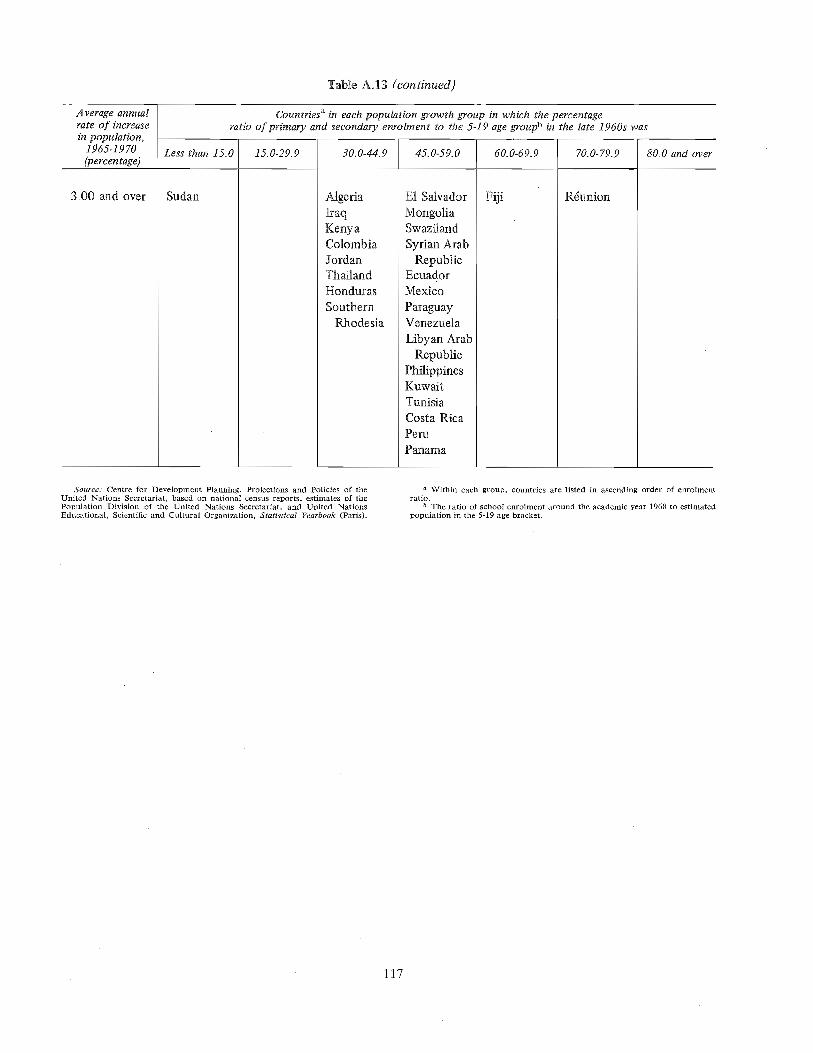
Table AA3 (continued)
Average annual Countriesa in each population growth group in which the percentagerate of increase ratio of primary and secondary enrolment to the 5-19 age groupb in the late 1960s wasin population,
1965-1970 Less than 15.0 15.0-29.9 30.0-44.9 45.0-59.0 60.0-69.9 70.0-79.9 80.0 and over(percen rage)
3.00 and over Sudan AlgeriaIraqKenyaColombiaJordanThailandHondurasSouthern
Rhodesia
E! SalvadorMongoliaSwazilandSyrian Arab
RepublicEcuadorMexico
ParaguayVenezuelaLibyan Arab
RepublicPhilippinesKuwaitTunisiaCosta RicaPeruPanama
Fiji Rÿunion
Source: Centre for Development Planning, Projections and Policies of theUnited Nations Secretariat, based on national census reports, estimates of thePopulation Division of the United Nations Secretariat, and United NationsEducational, Scientific and Cultural Organization, Statistical Yearbook (Paris).
a Within each group, countries are listed in ascending order of enrolmentratio.
b The ratio of school enrolment around the academic year 1968 to estimatedpopulation in the 5-19 age bracket.
117
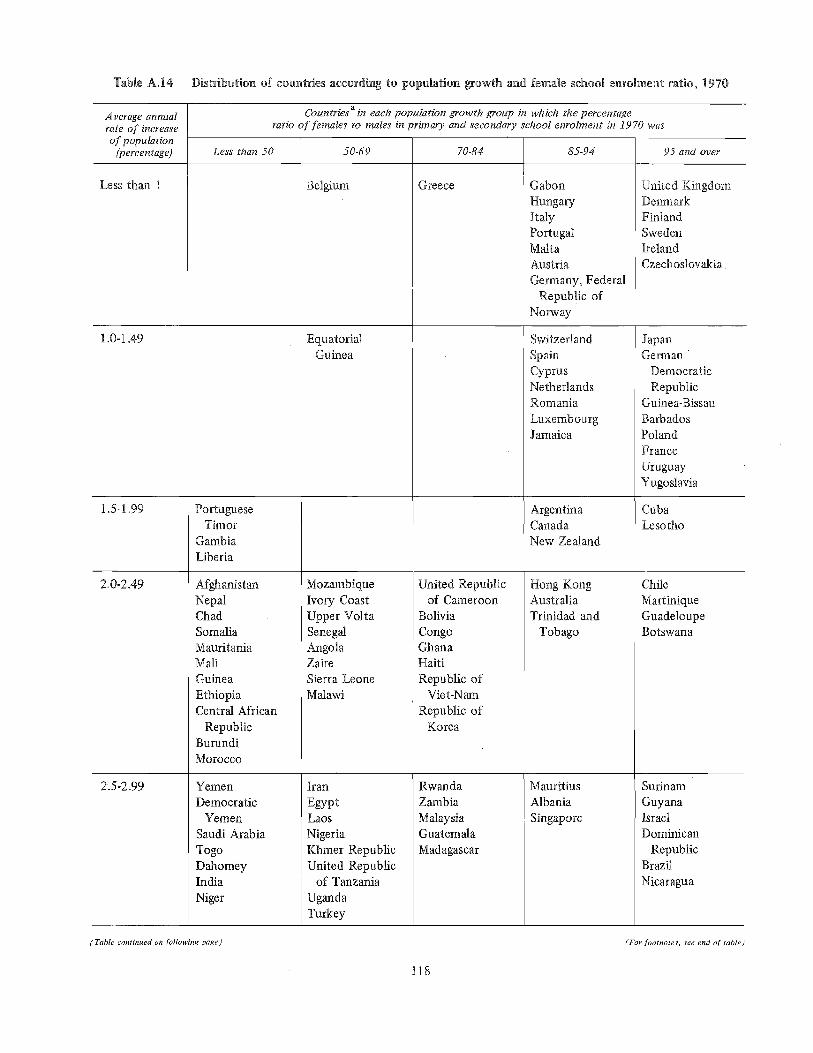
Table AA4 Distribution of countries according to population growth and female school enrolment ratio, 1970
Average annualrate of increaseof population
(percentage)
Countriesa in each population growth group & which the percentageratio of females to males in primary and secondary school enrolment in 1970 was
Leÿ ÿan 50 50-69
1.5-1.99
2.5-2.99
2.0-2.49
1.0-1.49
PortugueseTimor
GambiaLiberia
AfghanistanNepalChadSomaliaMauritaniaMarlGuineaEthiopiaCentral African
RepublicBumndiMorocco
YemenDemocratic
YemenSaudi ArabiaTogoDahomeyIndiaNiger
Less than 1 Belgium
EquatorialGuinea
MozambiqueDory CoastUpper VoltaSenegalAngolaZaireSierra LeoneMalawi
Iran
EgyptLaosNigeriaKhmer RepublicUnited Republic
of Tanzania
UgandaTurkey
70-84
Greece
United Republicof Cameroon
BoliviaCongoGhanaHaitiRepublic of
Viet-Nam
Republic ofKorea
RwandaZambiaMalaysiaGuatemala
Madagascar
85-94
GabonHungaryItalyPortugalMaltaAustriaGermany, Federa!
Republic ofNorway
SwitzerlandSpainCyprusNetherlandsRomaniaLuxembourgJamaica
ArgentinaCanadaNew Zealand
Hong KongAustraliaTrinidad and
MauritiusAlbaniaSingapore
Tobago
95 and over
United KingdomDenmarkFinlandSwedenIrelandCzechoslovakia
JapanGerman
Democratic
RepublicGuinea-Bissau
BarbadosPolandFrance
UruguayYugoslavia
CubaLesotho
ChileMartiniqueGuadeloupeBotswana
Surinam
GuyanaIsraelDominican
RepublicBrazilNicaragua
(Table continued on following page) (For footnotes, see end of table)
118
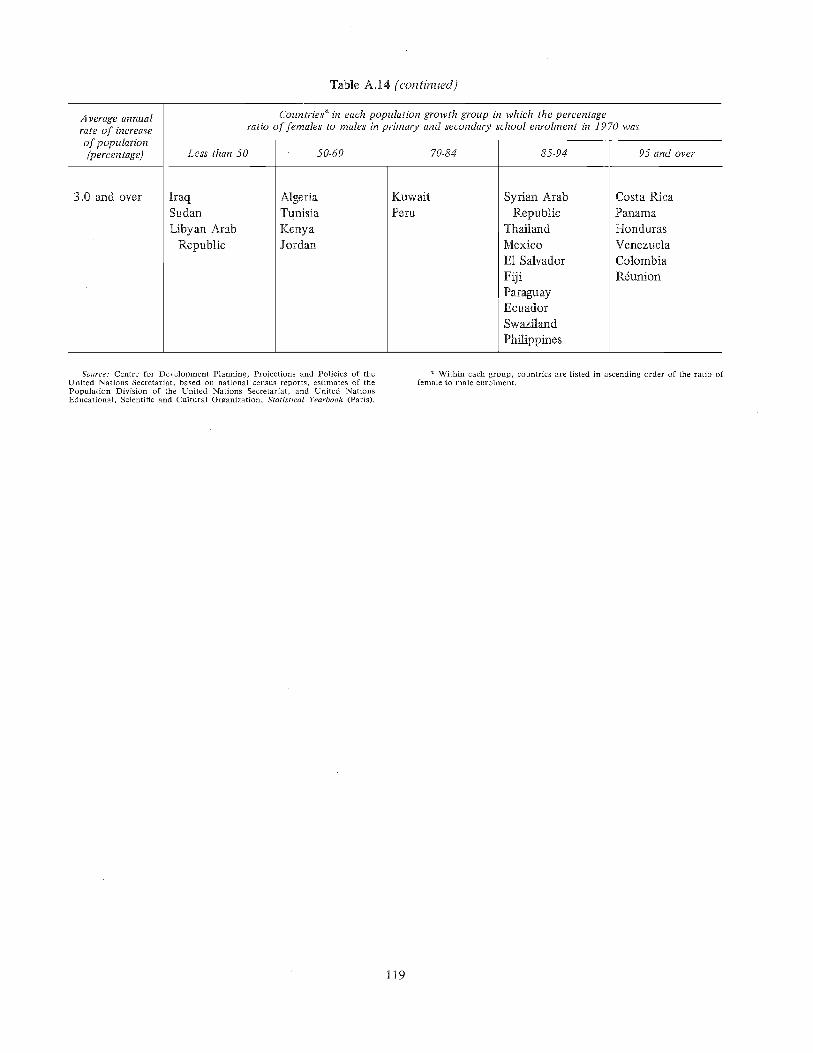
Table AA4 (continued)
Average annual Countriesa in each population growth group in which the percentagerate Of increase ratio of females to males in primary and secondary school enrolment in 1970 was
o] poputatlon{percentage) Less than 50 50-69 70-84 85-94 95 and over
3.0 and over IraqSudanLibyan Arab
Republic
AlgeriaTunisiaKenyaJordan
KuwaitPeru
Syrian ArabRepublic
ThailandMexicoE1 SalvadorFijiParaguayEcuadorSwazilandPhilippines
Costa Rica
PanamaHonduras
VenezuelaColombiaRÿunion
Source: Centre for Development Planning, Projections and Policies of theUnited Nations Secretariat, based on national census reports, estimates of thePopulation Division of the United Nations Secretariat, and United NationsEducational, Scientific and Cultural Organization, Statistical Yearbook (Paris).
a Within each group, countries are listed in ascending order of the ratio offemale to male enrolment.
119
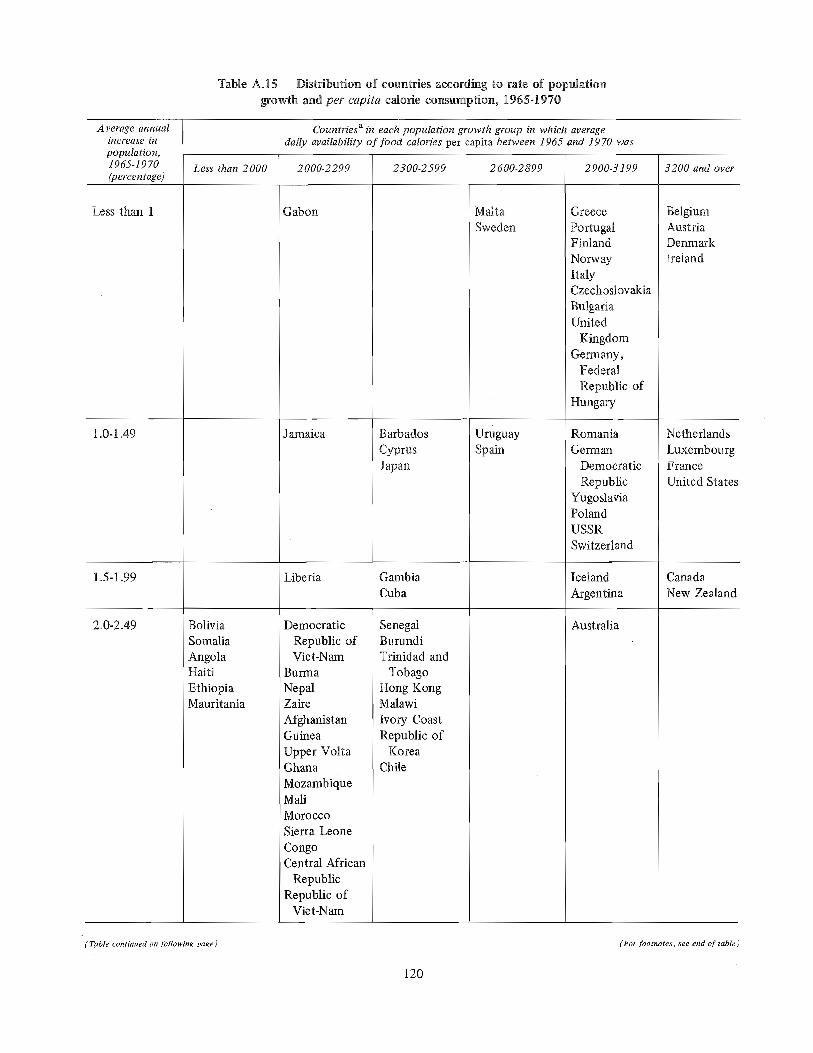
Table A.!5 Distribution of countries according to rate of populationgrowth and per capita calorie comumpfion, 1965-1970
Average annual Countriesa in each population growth group in which averageincrease in daily availability of food calories per capita between 1965 and 1970 waspopulation,1965-1970 Less than 2000 2000-2299 2300-2599 2600-2899 2900-3199 3200 and over(percentage)
Less than 1 Gabon
1.0-1.49
2.0-2.49 BoliviaSomaliaAngolaHaitiEthiopiaMauritania
1.5-1.99
Jamaica
Liberia
DemocraticRepublic ofViet-Nam
BurmaNepalZaireAfghanistanGuineaUpper VoltaGhanaMozambiqueMallMoroccoSierra Leone
CongoCentral African
RepublicRepublic of
Viet-Nam
BarbadosCyprusJapan
GambiaCuba
SenegalBurundiTrinidad and
TobagoHong KongMalawiIvory CoastRepublic of
KoreaChile
MaltaSweden
UruguaySpain
Greece
PortugalFinlandNorwayItalyCzechoslovakiaBulgariaUnited
KingdomGermany,
FederalRepublic of
Hungary
RomaniaGerman
DemocraticRepublic
YugoslaviaPolandUSSRSwitzerland
IcelandArgentina
Australia
BelgiumAustriaDenmarkIreland
NetherlandsLuxembourgFranceUnited States
CanadaNew Zealand
(Table continued on following page) (For footnotes, see end of table)
120
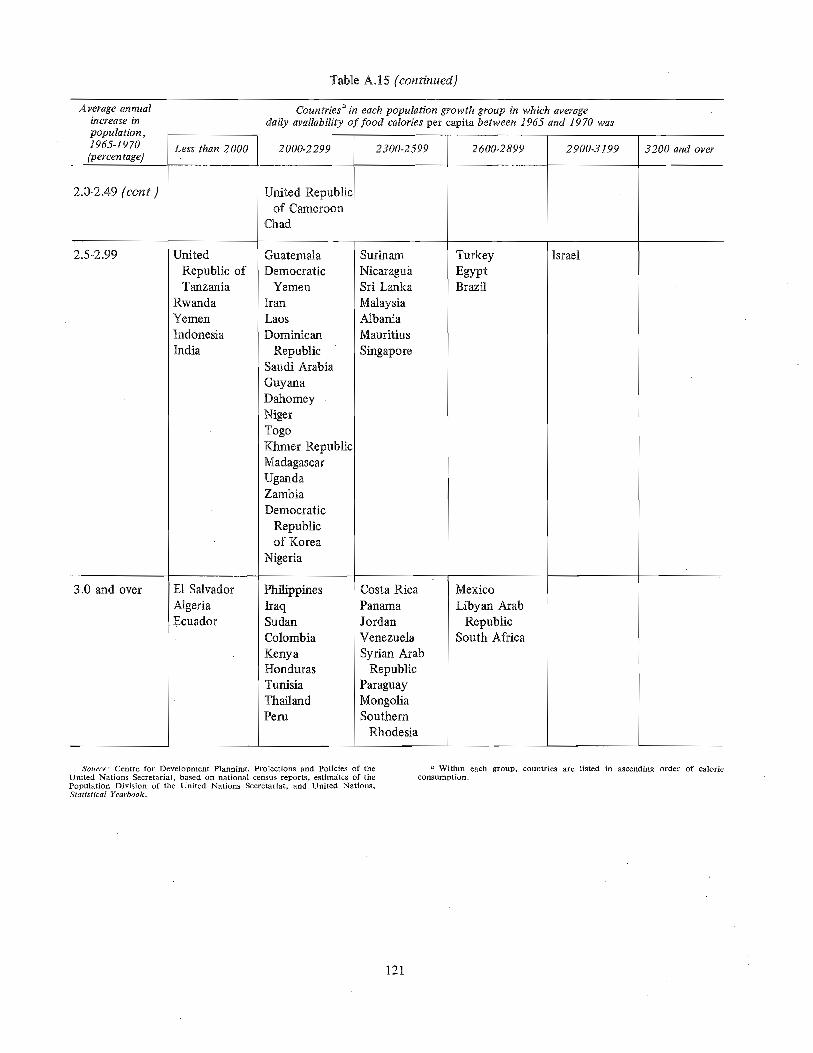
Table A.15 (conÿnued)
.Average annual Countriesa in each population growth group in which averageincrease in daily availability of food calories per capita between 1965 and 1970 waspopulation,1965-1970 Less than 2000 2000-2299 2300-2599 2600.2899 2900-3199 3200 and over(percen rage)
2.0-2.49 (cont.) United Republicof Cameroon
Chad
2.5-2.99 UnitedRepublic ofTanzania
RwandaYemenIndonesiaIndia
GuatemalaDemocratic
Yemenlran
LaosDominican
RepublicSaudi ArabiaGuyanaDahomeyNigerTogoKhmer RepublicMadagascarUgandaZambiaDemocratic
Republicof Korea
Nigeria
3.0 and over E1 SalvadorAlgeriaEcuador
PhilippinesIraqSudanColombiaKenyaHondurasTunisiaThailandPeru
SurinamNicaraguaSri LankaMalaysiaAlbaniaMauritiusSingapore
Costa RicaPanamaJordanVenezuelaSyrian Arab
RepublicParaguayMongoliaSouthern
Rhodesia
TurkeyEgyptBrazil
MexicoLibyan Arab
RepublicSouth Africa
Israel
Source: Centre for Development Planning, Projections and Policies of theUnited Nations Secretariat, based on national census reports, estirnÿites of thePopulation Division of the United Nations Secretariat, and United Nations,Statistical Yearbook,
a Within each group, countries are listed in ascending order of calorieconsumption.
121
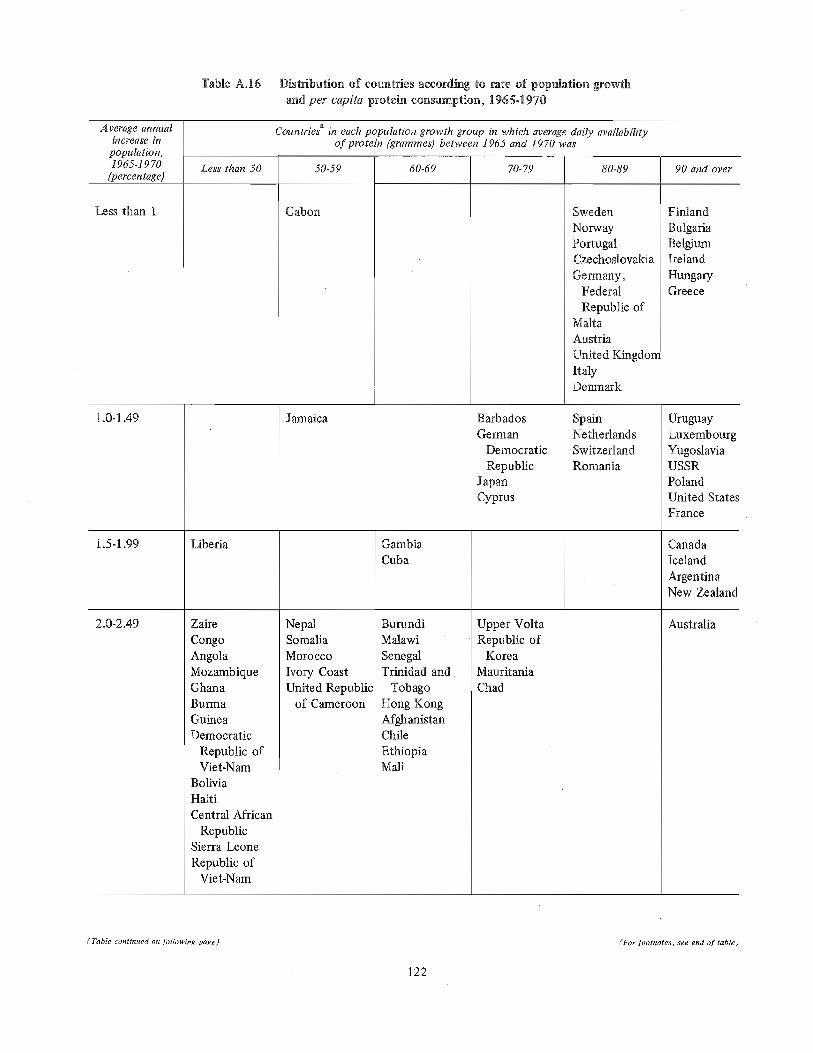
Table A.16 Distribution of countries according to rate of population growthand per capita protein consumption, 1965-1970
Average annual Countriesa in each population growth group in which average daily availabilityincrease in of protein (grammes) between 1965 and 1970 waspopulation,
1965-1970 Less than 50 50-59 60-69 70-79 80-89 90 and over(percentage)
Less than 1 Gabon
1.0-1.49
2.0-2.49
Liberia
ZaireCongoAngolaMozambiqueGhanaBurmaGuineaDemocratic
Republic ofViet-Nam
BoliviaHaitiCentral African
RepublicSierra Leone
Republic ofViet-Nam
1.5-1.99
Jamaica
NepalSomaliaMoroccoIvory CoastUnited Republic
of Cameroon
GambiaCuba
BurundiMalawiSenegalTrinidad and
Tobago
BarbadosGerman
DemocraticRepublic
JapanCyprus
Upper VoltaRepublic of
KoreaMauritaniaChad
SwedenNorwayPortugalCzechoslovakiaGermany,
FederalRepublic of
MaltaAustriaUnited KingdorÿItalyDenmark
SpainNetherlandsSwitzerlandRomania
Hong KongAfghanistanChileEthiopiaMarl
FinlandBulgariaBelgiumIrelandHungaryGreece
UruguayLuxembourgYugoslaviaUSSRPolandUnited StatesFrance
CanadaIcelandArgentinaNew Zealand
Australia
(Table continued on following page) (For footnotes, see end of table)
122
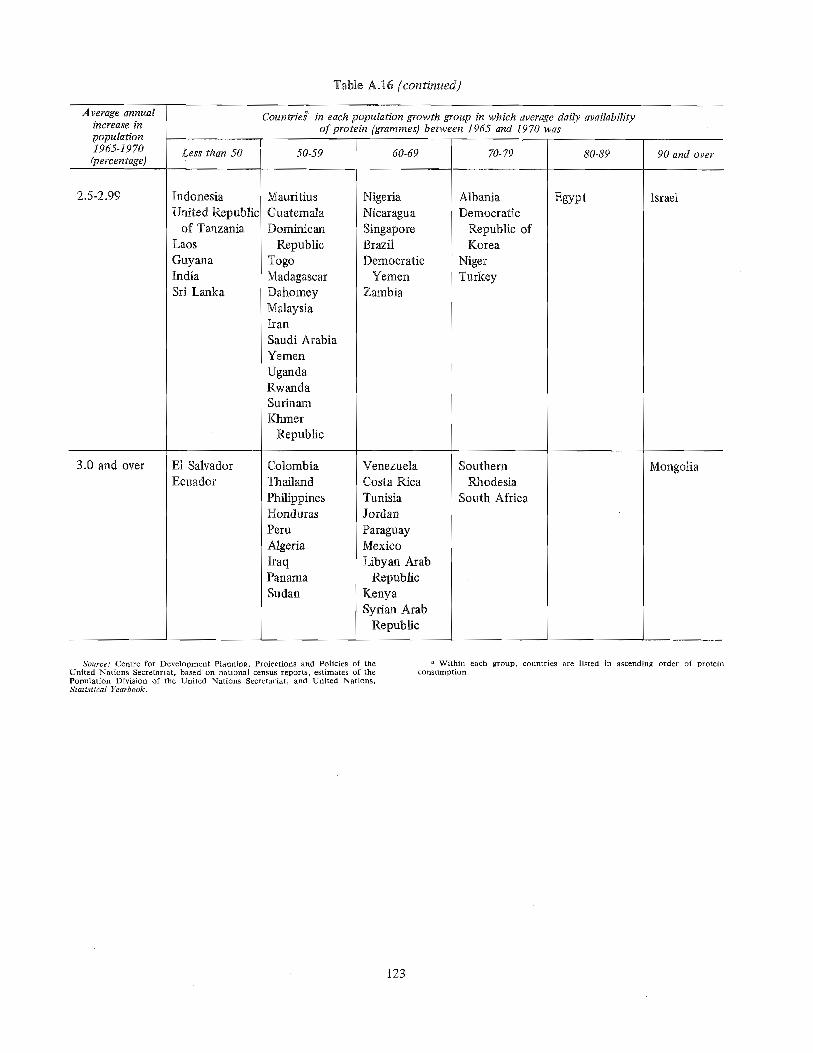
Table A.16 {continued)
Average annual Countrieÿ in each population growth group in which average daily availabilityincrease inpopulation of protein (grammes) between 1965 and !970 was
1965-1970 Less than 50 50-59 60-69 70-79 80-89(percentage) 90 and over
2.5-2.99 Indonesia
United Republicof Tanzania
Laos
GuyanaIndiaSri Lanka
MauritiusGuatemalaDominican
RepublicTogoMadagascarDahomeyMalaysia1ran
Saudi ArabiaYemen
UgandaRwandaSurinamKhmer
Republic
NigeriaNicaragua
SingaporeBrazilDemocratic
YemenZambia
AlbaniaDemocratic
Republic ofKorea
NigerTurkey
E1 SalvadorEcuador
ColombiaThailandPhilippinesHondurasPeru
AlgeriaIraqPanamaSudan
VenezuelaCosta RicaTunisiaJordanParaguayMexicoLibyan Arab
RepublicKenyaSyrian Arab
Republic
3.0 and over SouthernRhodesia
South Africa
Egypt Israel
Mongolia
Source: Centre for Development Planning, Projections and Policies of theUnited Nations Secretariat, based on national census reports, estimates of thePopulation Division of the United Nations Secretariat, and United Nations,Statistical Yearbook,
a Within each group, countries are listed in ascending order of proteinconsumption.
123
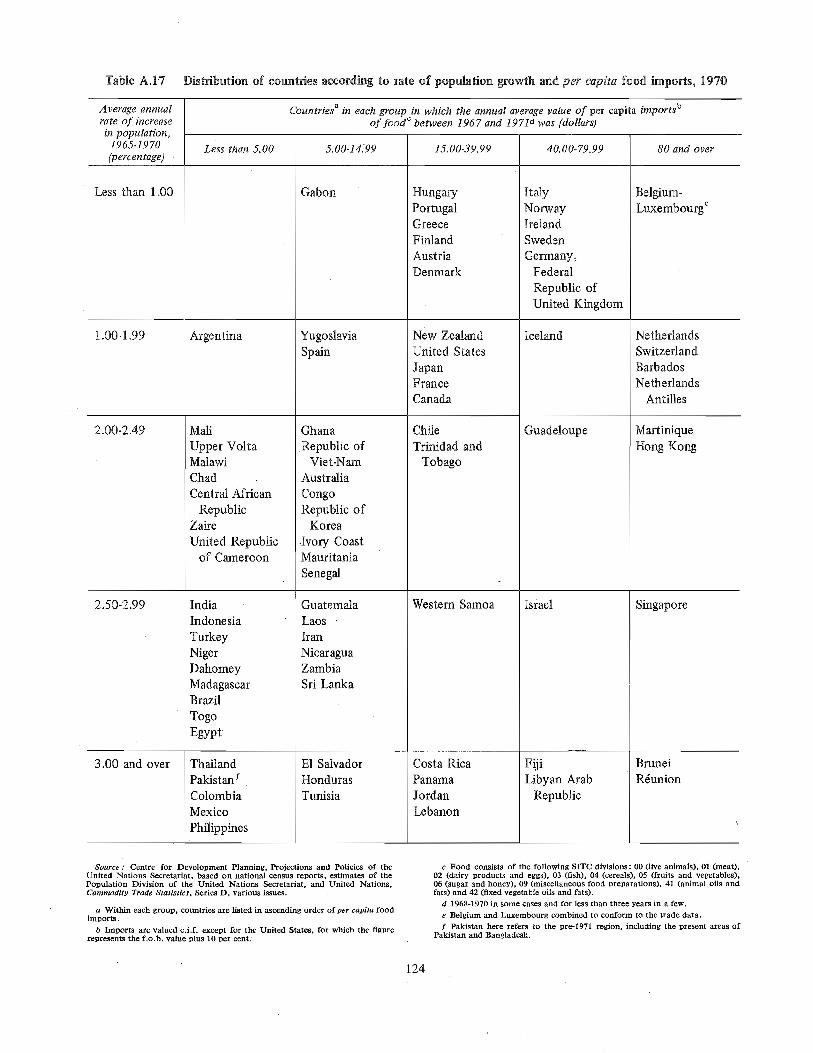
Table A.!7 Distribution of countries according to rate of population growth and per capita food imports, 1970
Average annual Countriesa in each group in which the annual average value of per capita importsbrate of increase of foodc between 1967 and 19710 was (dollars)in population,
1965-1970 Less than 5.00 5°00-14599 15.00-39.99 40.00-79.99 80 and over(percentage) ,
Less than 1.00 Gabon HungaryPortugalGreeceFirflandAustriaDenmark
1.00-1.99
3.00 and over
2.50-2.99
MaliUpper VoltaMalawiChadCentral African
RepublicZaireUnited Republic
of Cameroon
IndiaIndonesia
TurkeyNigerDahomeyMadagascarBrazilTogoEgypt
ThailandPakistanfColombiaMexicoPhilippines
2.00-2.49
YugoslaviaSpain
GhanaRepublic of
Viet-NamAustraliaCongoRepublic of
KoreaIvory CoastMauritania
Senegal
GuatemalaLaosIran
NicaraguaZambiaSri Lanka
E1 SalvadorHondurasTunisia
Argentina New ZealandUnited StatesJapanFranceCanada
ChileTrinidad and
Tobago
7
Western Samoa
Costa RicaPanamaJordanLebanon
ItalyNorwayIrelandSwedenGermany,
FederalRepublic ofUnited Kingdom
Iceland
Guadeloupe
Israel
r__,FijiLibyan Arab
Republic
Belgium-Luxembourge
NetherlandsSwitzerlandBarbadosNetherlands
Antilles
MartiniqueHong Kong
Singapore
BruneiRÿunion
Source : Centre for Development Planning, Projections and Policies of theUnited Nations Secretariat, based on national census reports, estimates of thePopulation Division of the United Nations Secretariat, and United Nations,Commodity Trade Statistics, Series D, various issues.
a Within each group, countries are listed in ascending order of per capita foodimports,
b Imports are valued c.i.f, except for the United States, for which the figurerepresents the f.o,b, value plus 10 per cent.
c Food consists of the following SITC divisions : 00 (live animals), 01 (meat),02 (dairy products and eggs), 03 (fish), 04 (cereals), 05 (fruits and vegetables),06 (sugar and honey), 09 (miscellaneous food preparations), 41 (animal oils andfats) and 42 (fixed vegetable oils and fats).
d 1968-1970 in some cases and for less than three years in a few.e Belgium and Luxembourg combined to conform to the trade data.f Pakistan here refers to the pre-1971 region, including the present areas of
Pakistan and Bangladesh,
124
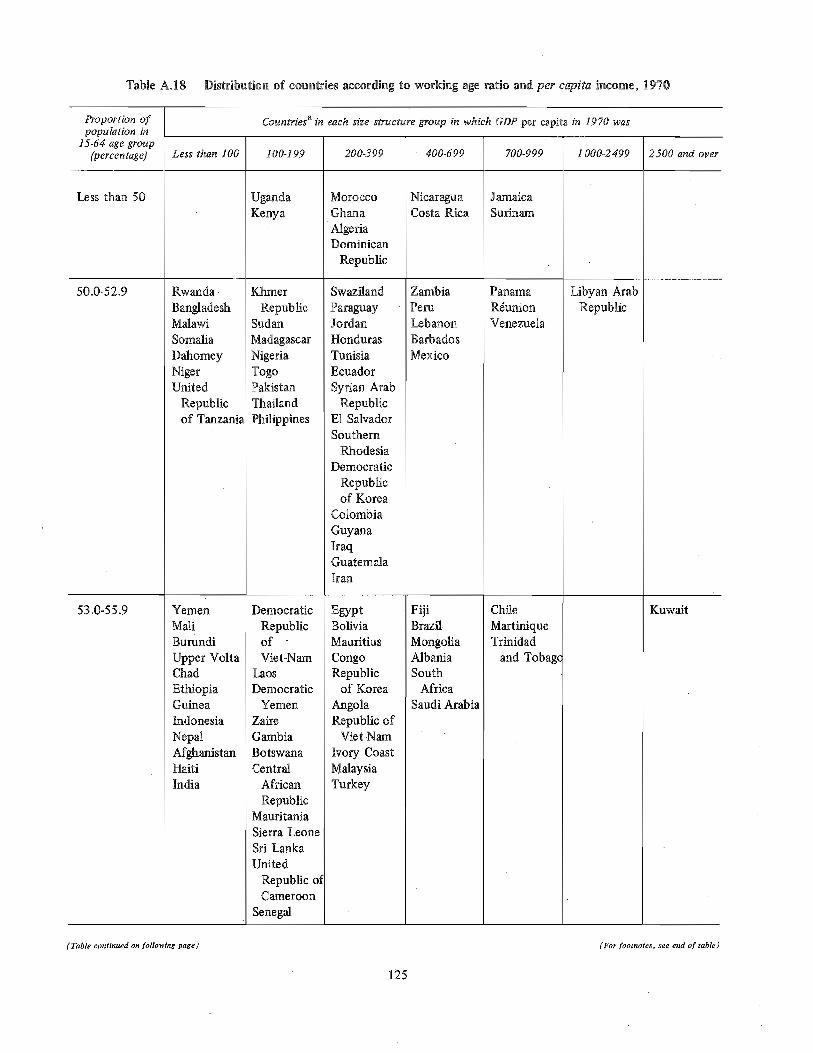
Table A.18 Distribution of countries according to working age ratio and per capita income, 1970
Proportion ofpopulation &
15-64 age group[percen rage) Less than 100
Countriesa in each size structure group in which GDP per capita in 1970 was
100-199
RwandaBangladeshMalawiSomaliaDahomeyNigerUnited
Republicof Tanzania
53.0-55.9 YemenMaliBurundiUpper VoltaChadEthiopiaGuineaIndonesiaNepalAfghanistanHaitiIndia
50.0-52.9
Less than 50 UgandaKenya
KhlnerRepublic
SudanMadagascar
NigeriaTogoPakistanThailandPhilippines
DemocraticRepublicofViet-Nam
LaosDemocratic
YemenZaireGambiaBotswanaCentral
AfricanRepublic
MauritaniaSierra LeoneSri LankaUnited
Republic ofCameroon
Senegal
200ÿ99
MoroccoGhana?dgeriaDominican
Republic
SwazilandParaguayJordanHondurasTunisiaEcuadorSyrian Arab
RepublicE1 SalvadorSouthern
RhodesiaDemocratic
Republicof Korea
ColombiaGuyanaIraqGuatemalaIran
EgyptBoliviaMauritiusCongoRepublic
of KoreaAngolaRepublic of
Viet-NamIvory CoastMalaysiaTurkey
400-699
NicaraguaCosta Rica
ZambiaPeru
LebanonBarbadosMexico
FijiBrazilMongoliaAlbaniaSouth
AfricaSaudi Arabia
700-999
JamaicaSurinam
PanamaR4unionVenezuela
ChileMartiniqueTrinidad
and Tobag(
1000-2499
Libyan ArabRepublic
2500 and over
Kuwait
(Table continued on following page) (For footnotes, see end of table
125
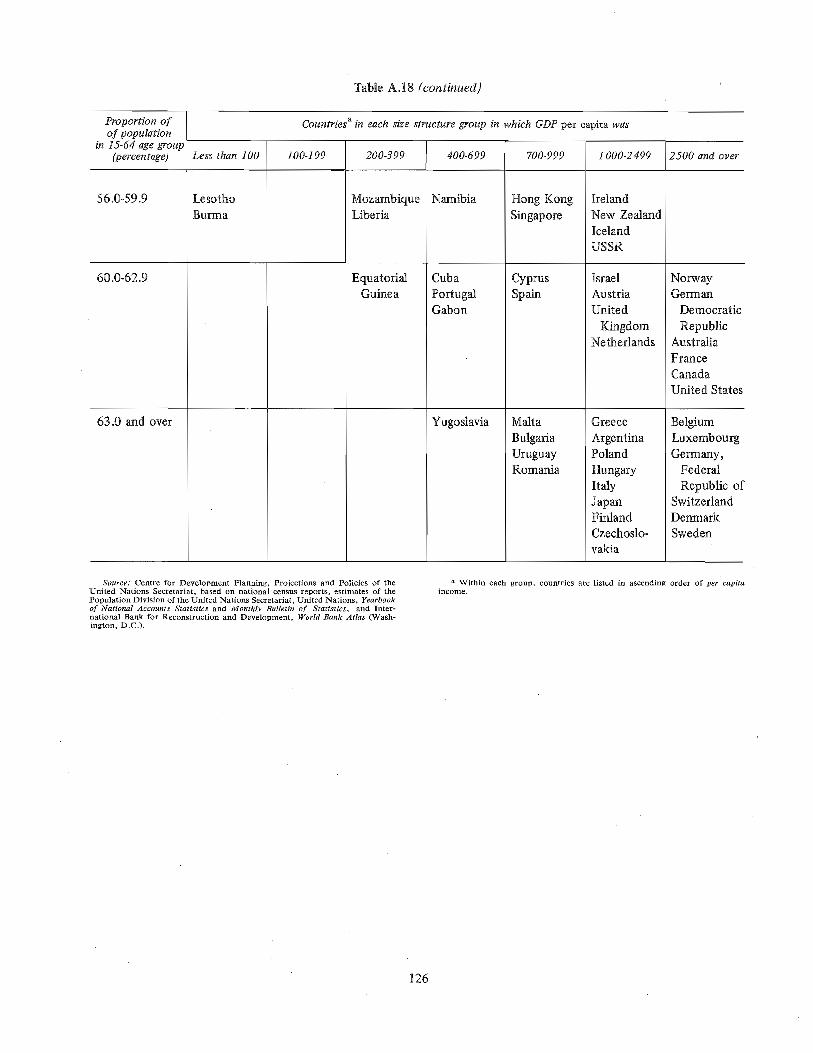
Table A.18 (continued)
Proportion of Countriesa in each size structure group in which GDP per capita wasof population
in 15-64 age group(percentage) Less than 100 100-199 200-399 400-699 700-999 1 000-2499 2500 and over
56.0-59.9 LesothoBurma
MozambiqueLiberia
Namibia
60.0-62.9
63.0 and over
EquatorialGuinea
CubaPortugalGabon
Yugoslavia
Hong KongSingapore
CyprusSpain
MaltaBulgariaUruguayRomania
IrelandNew ZealandIcelandUSSR
IsraelAustriaUnited
KingdomNetherlands
GreeceArgentinaPolandHungaryItalyJapanFinlandCzechoslo-vakia
NorwayGerman
Democratic
RepublicAustraliaFranceCanadaUnited States
BelgiumLuxembourg
Germany,FederalRepublic ot
SwitzerlandDenmark
Sweden
Source: Centre for Development Planning, Projections and Policies of theUnited Nations Secretariat, based on national census reports, estimates of thePopulation Division of the United Nations Secretariat, United Nations, Yearbookof National Accounts Statistics and Monthly Bulletin of Statistics, and Inter-national Bank for Reconstruction and Development, Worm Bank Atlas (Wash-ington, D.C.).
a Within each group, countries areincome.
listed in ascending order of per capita
126
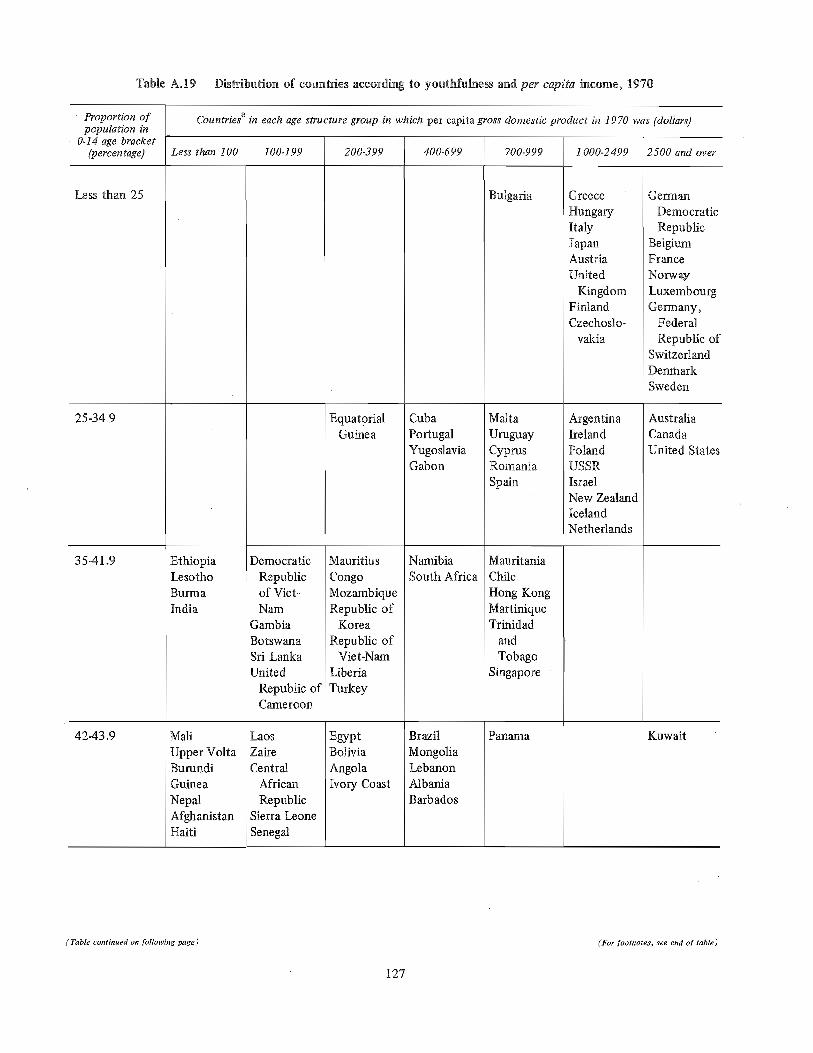
Table AA9 Dis*dbution of countries according to youthfulness and per capita income, 1970
Proportion of Countriesa in each age structure group in which per capita gross domestic product in 1970 was (dollars)population in
0-!4 age bracket(percentage) Less than 100 100-199 200-399 400-699 700-999 1 000-2499 2500 and over
Less than 25 Bulgaria Greece
HungaryItalyJapanAustriaUnited
KingdomFinlandCzechoslo-
vakia
3541.9
4243.9
gurlyla
India
MarlUpper VoltaBurundiGuineaNepalAfghanistanHaiti
Democratic
Republicof Viet-
NamGambiaBotswanaSri LankaUnited
Republic ofCameroon
LaosZaireCentral
AfricanRepublic
!Sierra LeoneSenegal
EthiopiaLesotho
MauritiusCongoMozambiqueRepublic of
KoreaRepublic of
Viet-NamLiberiaTurkey
EgyptBoliviaAngolaDory Coast
CubaPortugalYugoslaviaGabon
NamibiaSouth Africa
BrazilMongoliaLebanonAlbaniaBarbados
EquatorialGuinea
MaltaUruguayCyprusRomaniaSpain
MauritaniaChileHong KongMartiniqueTrinidad
andTobago
Singapore
Panama
25-34.9 ArgentinaIrelandPolandUSSRIsraelNew ZealandIcelandNetherlands
GerfflanDemocraticRepublic
BelgiumFrance
Norway
LuxembourgGermany,
FederalRepublic of
SwitzerlandDenmarkSweden
AustraliaCanada
United States
Kuwaff
(Table continued on following page) (For footnotes, see end of table)
127
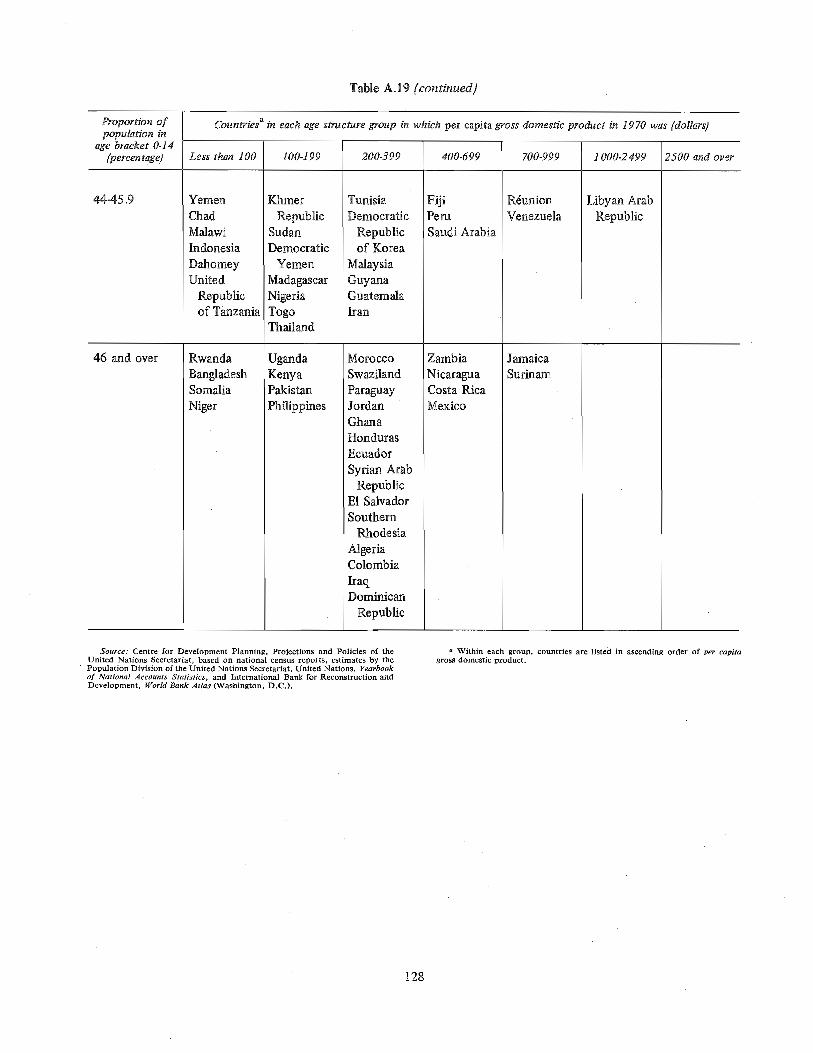
Table AA9 (continued)
Proportion of Countriesa in each age structure group in which per capita gross domestic product in 1970 was (dollars)population in
age bracket 0-14(percentage) Less than 100 100-199 200-399 400-699 700-999 1000-2499 2500 and over
44-45.9 YemenChadMalawiIndonesiaDahomeyUnited
Repubficof Tanzania
3_rner
RepublicSudanDemocratic
YemenMadagascarNigeriaTogoThailand
TunisiaDemocratic
Republicof Korea
MalaysiaGuyanaGuatemalaIran
RwandaBangladeshSomaliaNiger
UgandaKenyaPakistanPhilippines
46 and over MoroccoSwazilandParaguayJordanGhanaHondurasEcuadorSyrian Arab
RepublicE1 SalvadorSouthern
RhodesiaAlgeriaColombiaIraqDominican
Republic
FijiPeruSaudi Arabia
ZambiaNicaraguaCosta RicaMexico
RdunionVenezuela
JamaicaSurinam
Libyan ArabRepublic
Source: Centre for Development Planning, Projections and Policies of theUnited Nations Secretariat, based on national census reports, estimates by the
' Population Division of the United Nations Secretariat, United Nations, Yearbookof National Accounts Statistics, and International Bank for Reconstruction andDevelopment, Worm Bank Atlas (Washington, D.C.).
a Within each group, countries are listed in ascending order of per capitagross domestic rroduct.
128
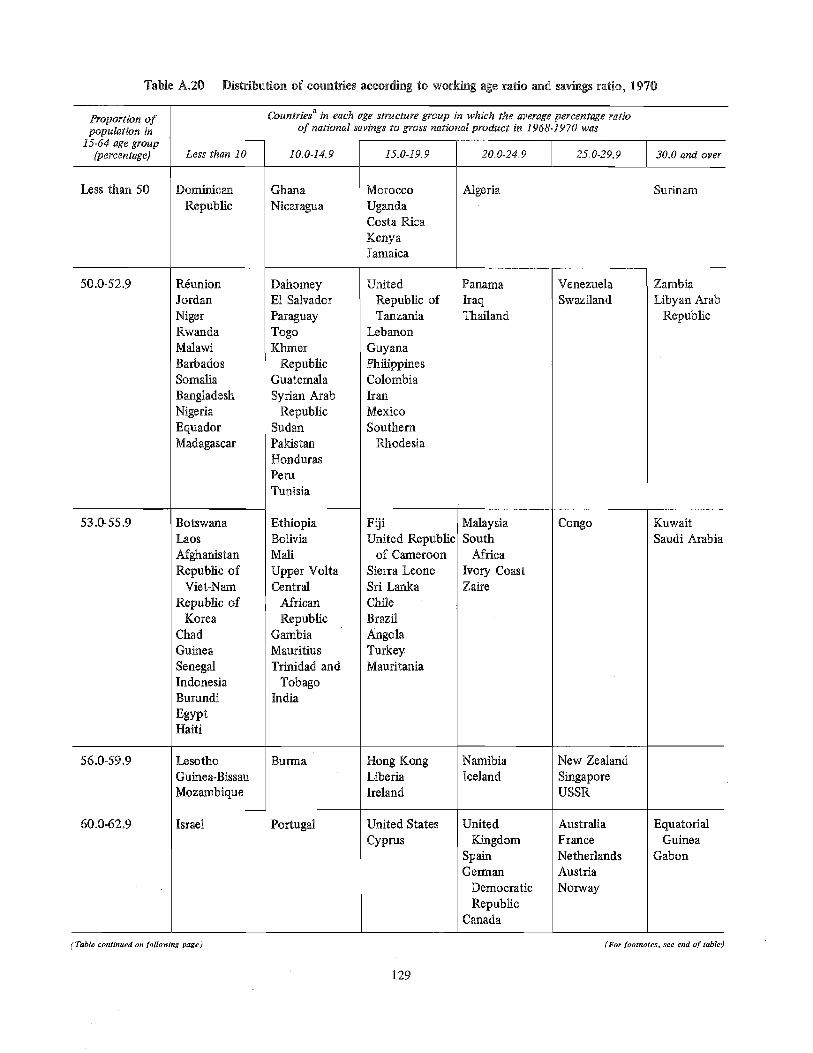
Table A.20 Distribution of countries according to working age ratio and savings ratio, 1970
Proportion of Countriesa in each age structure group in which the average percentage ratiopopulation in of national savings to gross national product iÿ 1968-1970 was
15-64 age group(percentage) Less than 10 15.0-19.9 20.0-24.9 25.0-29,9 30.0 and over
Less than 50 Dominican
Republic
10.0-14.9
GhanaNicaragua
Morocco
UgandaCosta RicaKenyaJamaica
60.0-62.9
56.0-59,9
53.0-55,9
Israel
BangladeshNigeria
[ EquadorMadagascar
BotswanaLaosAfghanistanRepublic of
Viet-Nam
Republic ofKorea
ChadGuineaSenegalIndonesiaBurundiEgyptHaiti
LesothoGuinea-BissauMozambique
RÿunionJordanNigerRwandaMalawiBarbadosSomalia
DahomeyE1 SalvadorParaguayTogoKhmer
RepublicGuatemalaSyrian Arab
RepublicSudanPakistanHondurasPeruTunisia
EthiopiaBoliviaMaliUpper VoltaCentral
AfricanRepublic
GambiaMauritiusTrinidad and
TobagoIndia
gurnla
Portugal
50.0-52.9 UnitedRepublic ofTanzania
Lebanon
GwanaPhilippinesColombiaIranMexicoSouthern
Rhodesia
FijiUnited Republic
of CameroonSierra LeoneSri LankaChileBrazilAngolaTurkeyMauritania
Hong KongLiberiaIreland
United StatesCyprus
Algeria
PanamaIraqThailand
MalaysiaSouth
AfricaIvory CoastZaire
NamibiaIceland
UnitedKingdom
SpainGerman
Democratic
RepublicCanada
VenezuelaSwaziland
Congo
New ZealandSingaporeUSSR
AustraliaFranceNetherlandsAustriaNorway
Surinam
ZambiaLibyan Arab
Republic
KuwaitSaudi Arabia
EquatorialGuinea
Gabon
( Table continued on following page) (For footnotes, see end of table)
129
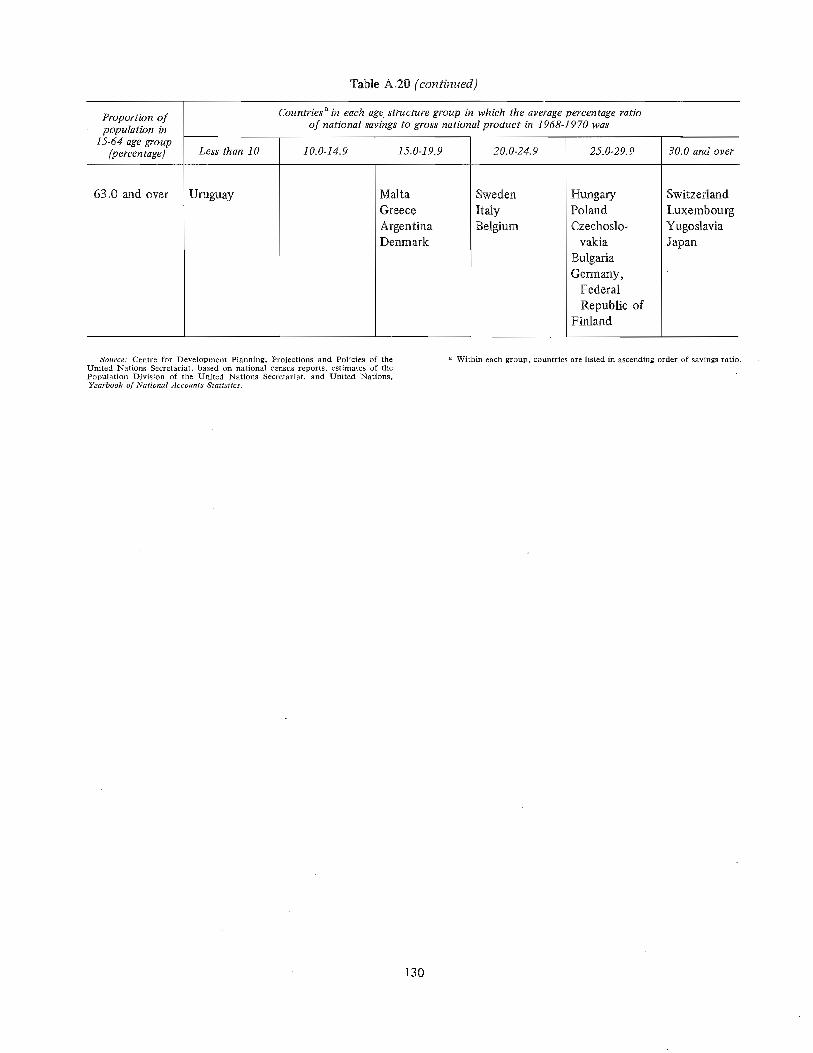
Table A.20 (continued)
Proportion of Countriesa in each age structure group in which the average percentage ratiopopulation in of national savings to gross national product in 1968-1970 was
15-64 age group(percentage) Less than 10 10.0-14.9 15.0-19.9 20.0-24.9 25.0-29.9 30.0 and over
63.0 and over Uruguay MaltaGreeceArgentinaDenmark
SwedenItalyBelgium
HungaryPolandCzechoslo-
vakiaBulgariaGermany,
FederalRepublic of
Finland
SwitzerlandLuxembourgYugoslaviaJapan
Source: Centre for Development Planning, Projections and Policies of theUnited Nations Secretariat, based on national census reports, estimates of thePopulation Division of the United Nations Secretariat, and United Nations,Yearbook of National Accounts Statistics.
a Within each group, countries are listed in ascending order of savings ratio.
130
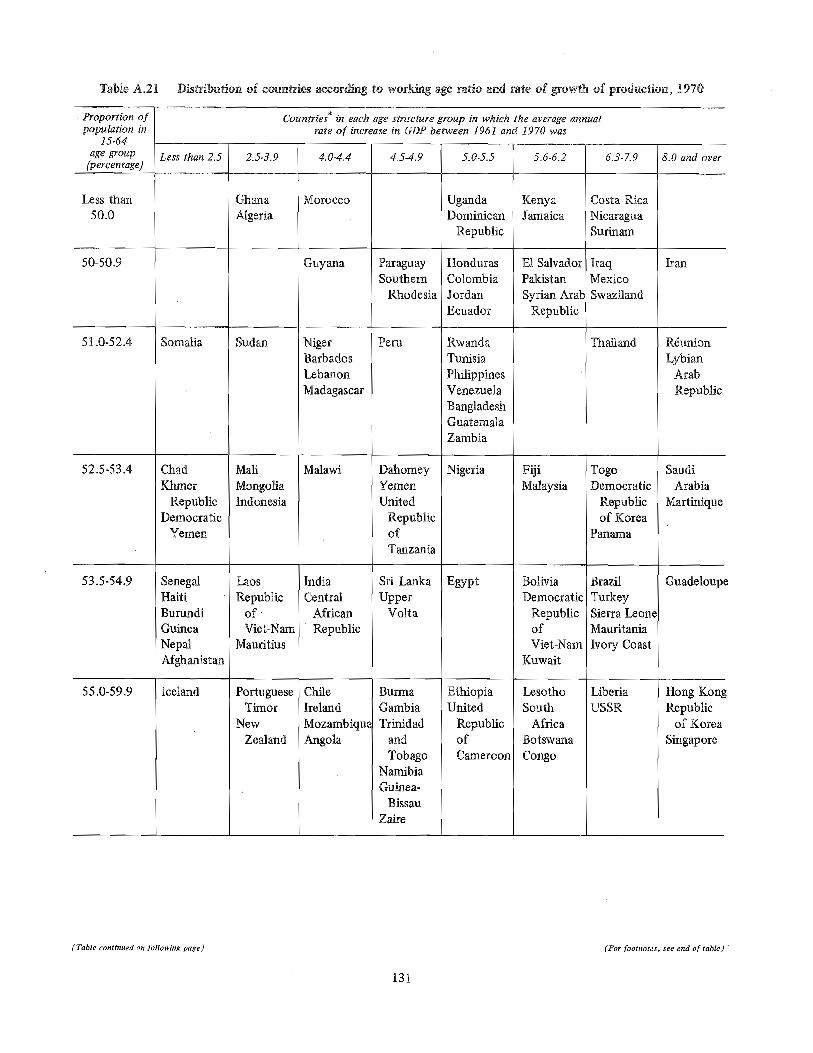
Table A.21 Distribution of countries according to working age ratio and rate cf growth of production, 1970
. Proportion of Countriesa in each age structure group in which the average annualpopulan'on in rate of increase in GDP between 1961 and 1970 was
15-64age group Less than 2.5 2.5-3.9 4.0-4.4 4.5-4.9 5.0-5.5 5.6-6.2 6.3-7,9 8.0 and over
(percentage)
Less than50.0
GhanaAlgeria
Morocco UgandaDominican
Republic
53.5-54.9
55.0-59,9 Iceland
52.5-53.4 ChadKhmer
RepublicDemocratic
Yemen
SenegalHaitiBurundiGuineaNepalAfghanistan
Somalia Sudan
MallMongoliaIndonesia
Laos
RepublicofViet-Nam
Mauritius
PortugueseTimor
NewZealand
51.0-52A
Guyana
NigerBarbadosLebanon
Madagascar
Malawi
IndiaCentral
AfricanRepublic
ChileIrelandMozambiquÿAngola
ParaguaySouthern
Rhodesia
Peru
DahomeyYemenUnited
RepublicofTanzania
Sri LankaUpper
Volta
gurlTla
GambiaTrinidad
andTobago
NarnibiaGuinea-
BissauZaire
50-50.9 HondurasColombiaJordanEcuador
RwandaTunisiaPhilippinesVenezuela
BangladeshGuatemalaZambia
Nigeria
Egypt
EthiopiaUnRed
RepubficofCameroon
KenyaJamaica
E1 SalvadorPakistanSyrian Arab
Republic
FijiMalaysia
BoliviaDemocratic
RepublicofViet-Narn
Kuwait
LesothoSouth
AfricaBotswana
Congo
Costa RicaNicaraguaSurinam
IraqMexicoSwaziland
Thailand
TogoDemocratic
Republicof Korea
Panama
BrazilTurkeySierra LeoneMauritaniaIvory Coast
LiberiaUSSR
Iran
RÿunionLybian
ArabRepablic
SaudiArabia
Martinique
Guadeloupe
Hong KongRepublic
of Korea
Singapore
(Table continued on following page)(For footnotes, see end of table) '
131
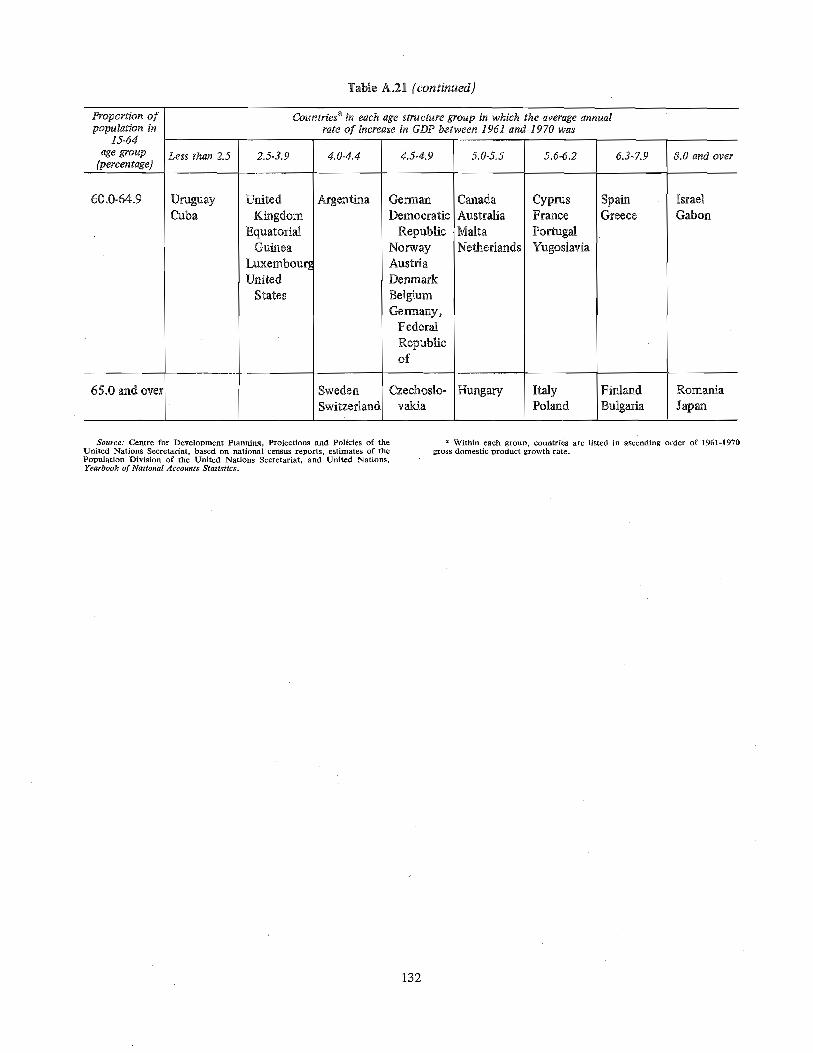
Table A.21 (continued)
Proportion of Countriesa in each age structure group in which the average annualpopulation in rate of increase in GDP between ]961 and 1970 was
15-64
age group Less than 2.5 2.5-3.9 4.0-4.4 4.5-4.9 5.0-5.5 5.6-6.2 6.3-7.9 8.0 and over(percentage)
60.0-64.9 UruguayCuba
UnitedKingdom
EquatorialGuinea
LuxembourÿUnited
States
, Argentina Gerrflan
Democratic
RepublicNorwayAustriaDenmarkBelgiumGermany,
FederalRepublicof
CanadaAustraliaMaltaNetherlands
SwedenSwitzerland
Czechoslo-valda
65.0 and oveI Hungary
CyprusFrance
PortugalYugoslavia
ItalyPoland
SpainGreece
FinlandBulgaria
IsraelGabon
Romama3ÿan
Source: Centre for Development Planning, Projections and Policies of theUnited Nations Secretariat, based on national census reports, estimates of thePopulation Division of the United Nations Secretariat. and United Nations,Yearbook o[ National Accounts Statistics.
a Within each group, countries are listed in ascending order of 1961-1970gross domestic product growth rate.
132
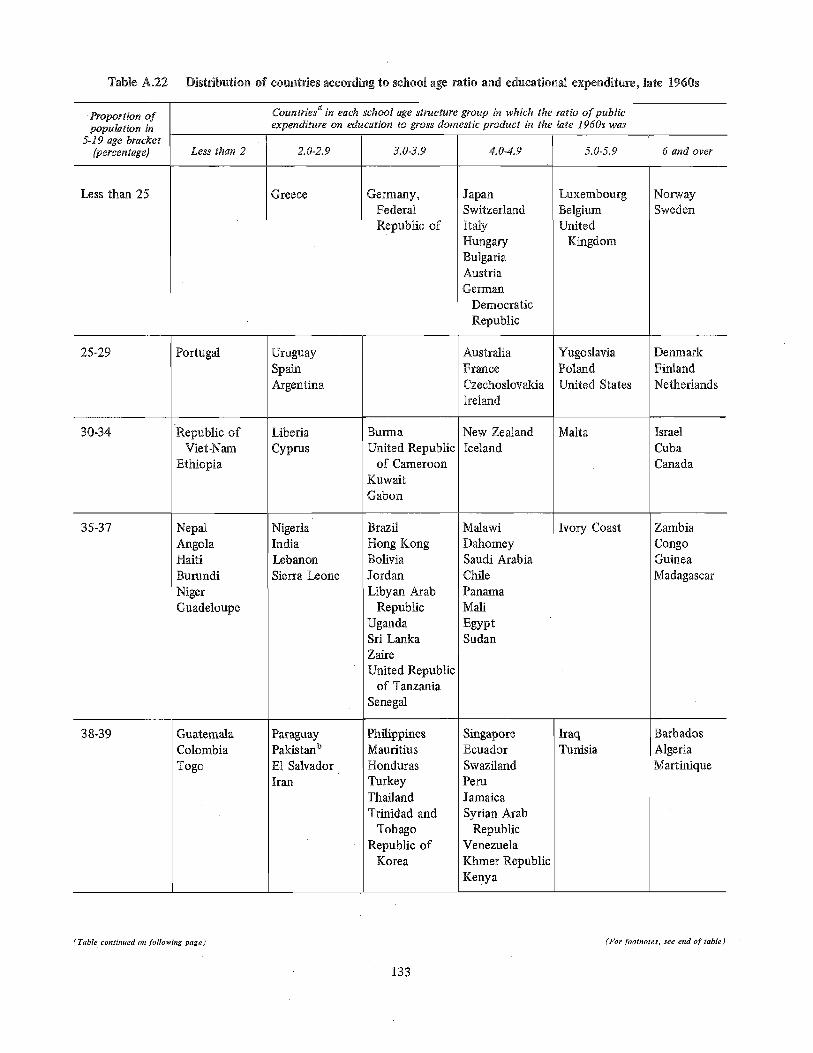
Table A.22 Distribution of countries according to school age ratio and educational expenditure, late 1960s
'Proportion of Countriesa in each school age structure group in which the ratio of publicpopulation in expenditure on education to gross domestic product in the late 1960s was
5-19 age braeget(percentage) Less than 2 2.0-2.9 3,0-3.9 4.0-4.9 5.0-5.9 6 and over
Less than 25 Greece Germany,FederalRepublic of
25-29
38-39
Togo E1 SalvadorIran
NepalAngolaHaitiBurundiNiger
35-37
Republic ofViet-Nam
Ethiopia
Guaddoupe
GuatemalaColombia
30-34
UruguaySpainArgentina
LiberiaCyprus
NigeriaIndia
i LebanonSierra Leone
ParaguayPakistanu
Portugal
BurmaUnited Republic
of CameroonKuwaitGabon
BrazilHong KongBoliviaJordanLibyan Arab
RepublicUgandaSri LankaZaireUnited Republic
of TanzaniaSenegal
PhilippinesMauritiusHondurasTurkeyThailandTrinidad and
TobagoRepublic of
Korea
JapanSwitzerlandItalyHungaryBulgariaAustriaGerman
DemocraticRepublic
AustraliaFranceCzechoslovakiaIreland
New ZealandIceland
MalawiDahomeySaudi ArabiaChilePanamaMarlEgyptSudan
SingaporeEcuadorSwazilandPeruJamaicaSyrian Arab
RepublicVenezuelaKhmer RepublicKenya
LuxembourgBelgiumUnited
Kingdom
YugoslaviaPolandUnited States
Malta
Ivory Coast
IraqTunisia
NorwaySweden
DenmarkFinlandNetherlands
IsraelCubaCanada
ZambiaCongoGuineaMadagascar
BarbadosAlgeriaMartinique
(Table continued on following page) (For footnotes, see end of table)
133
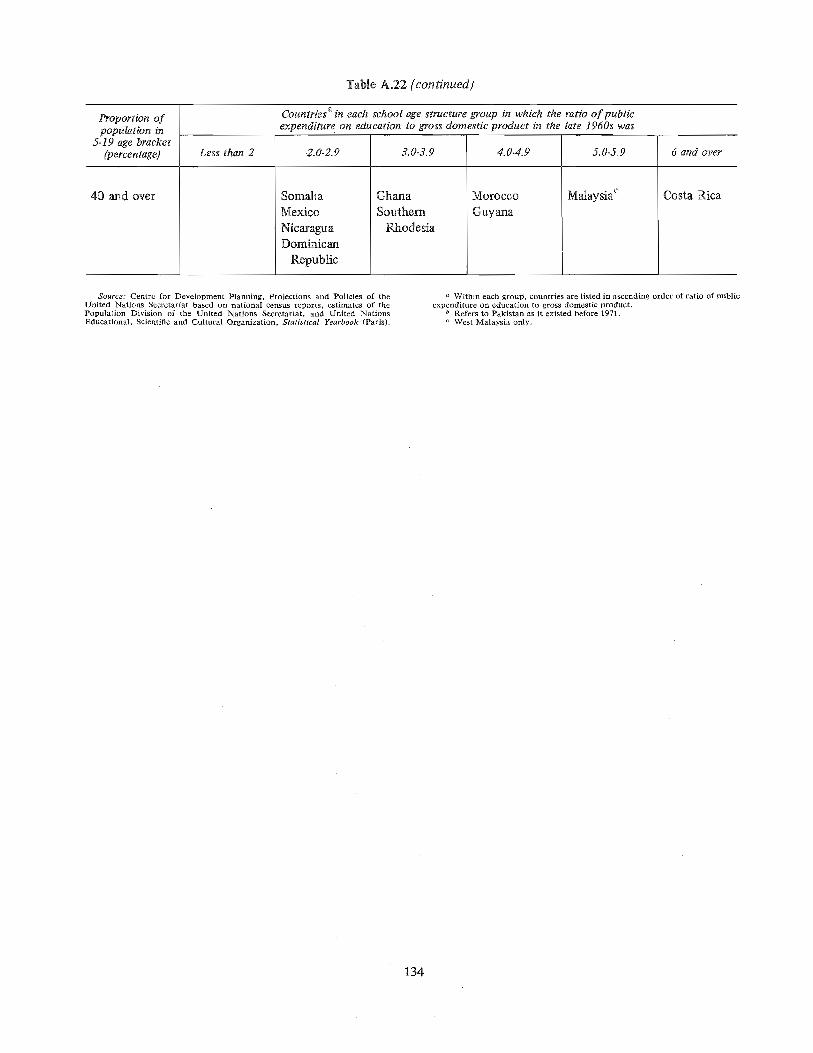
Table A.22 (continued)
Proportion of Countriesa in each school age structure group in which the ratio of publicpopulation in expenditure on education to gross domestic product in the late 1960s was
5-19 age bracket(percentage) Less than 2 2.0-2.9 3.0-3.9 4.0-4.9 5.0-5.9 6 and over
4(} and over SomaliaMexico
NicaraguaDominican
Republic
GhanaSouthern
Rhodesia
MOROCCO
Guyana
Malaysiac Costa Rica
Source: Centre for Development Planning, Projections and Policies of theUnited Nations Secretariat based on national census reports, estimates of thePopulation Division of the United Nations Secretariat, and United NationsEducational, Scientific and Cultural Organization, Statistical Yearbook (Paris).
Within each group, countries are listed in ascending order of ratio of publicexpenditure on education to gross domestic product.
b Refers to Pakistan as it existed before 1971.e West Malaysia only.
134
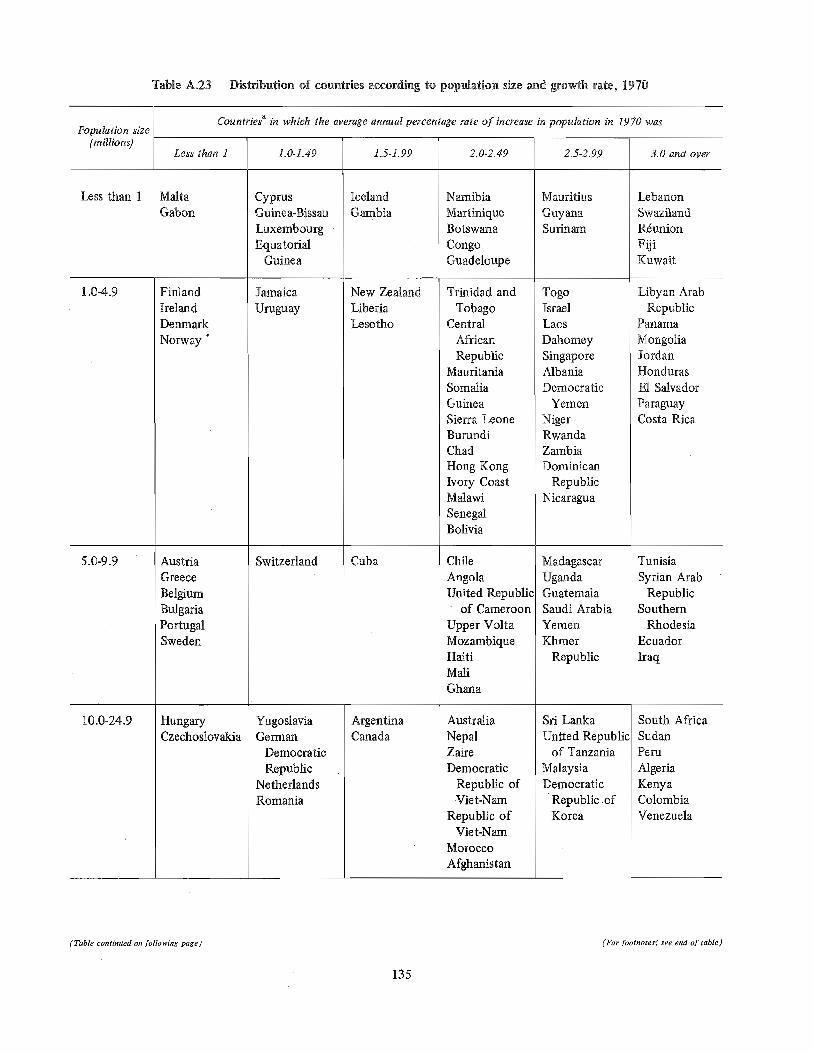
Table A.23 Distribution of countries according to populatinn size and growth rate, 1970
Population size(millions)
Countriesa in which the average annual percentage rate of increase in population in 1970 was
5.0-9.9
10.0-24.9
Greece
BelgiumBulgariaPortugalSweden
Norway '
Jamaica
UruguayNew ZealandLiberiaLesotho
FinlandIrelandDenmark
1.0-4.9
Less than 1
Less than 1
MaltaGabon
Austria
HungaryCzechoslovakia
1.0-1.49
CyprusGuinea-Bissau
LuxembourgEquatorial
Guinea
Switzerland
YugoslaviaGerman
DemocraticRepublic
NetherlandsRomania
1.5-1.99
IcelandGambia
Cuba
ArgentinaCanada
2,0-2.49
NamibiaMartiniqueBotswanaCongoGuadeloupe
Trinidad andTobago
CentralAfricanRepublic
MauritaniaSomaliaGuineaSierra LeoneBurundiChadHong KongIvory CoastMalawiSenegalBolivia
ChileAngolaUnited Republic
of Cameroon
Upper VoltaMozambiqueHaitiMaliGhana
AustraliaNepalZaireDemocratic
Republic ofViet-Nam
Republic ofViet-Nam
MoroccoAfghanistan
2.5-2.99
MauritiusGwanaSurinam
TogoIsraelLaosDahomeySingaporeAlbaniaDemocratic
Yemen
NigerRwandaZambiaDominican
RepublicNicaragua
Madagascar
UgandaGuatemalaSaudi ArabiaYemenKhmer
Republic
Sri LankaUnited Republic
of Tanzania
MalaysiaDemocratic
Republic ofKorea
3.0 and over
LebanonSwazilandRdunionFijiKuwait
Libyan ArabRepublic
Panama
MongoliaJordanHonduras131 SalvadorParaguayCosta Rica
TunisiaSyrian Arab
RepublicSouthern
RhodesiaEcuador
Iraq
South AfricaSudanPeru
AlgeriaKenyaColombiaVenezuela
(Table continued on following page) (For footnoteÿ,, see end of table)
135
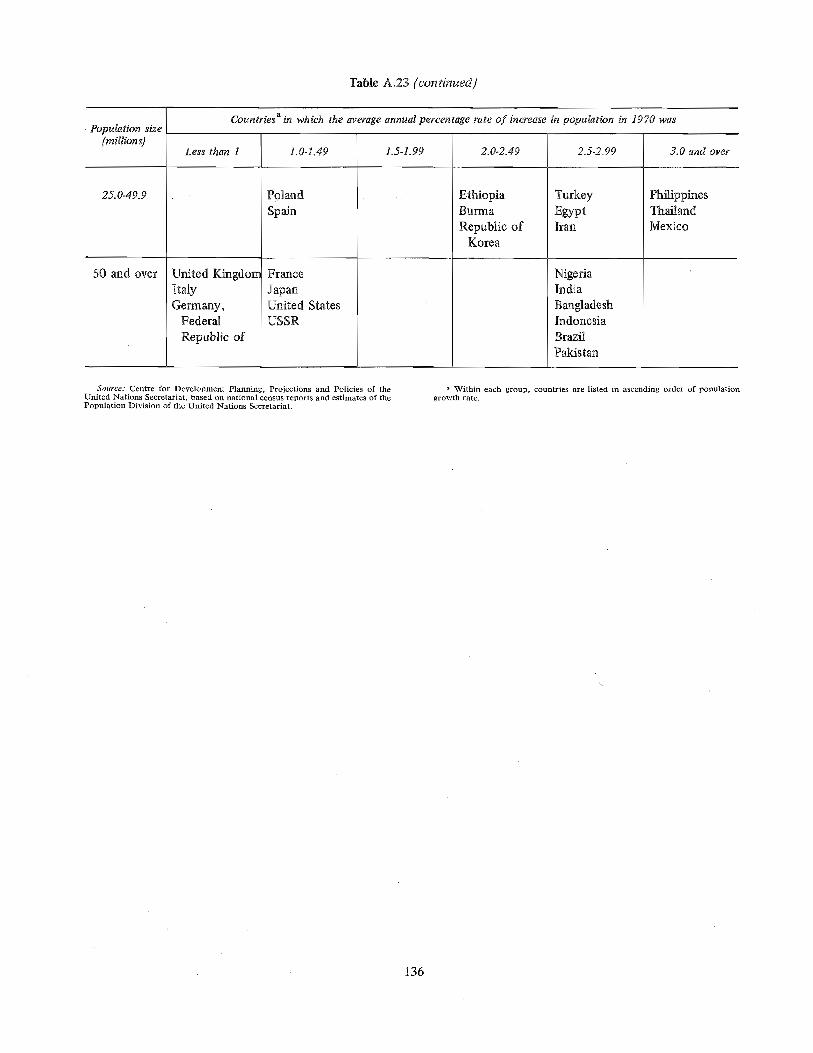
Table A°23 (continued)
Countriesa in which the average annual percentage rate of increase in population in 1970 wasPopulation size
(millions)Less Nan 1 1.0-1.49 1.5-1.99 2.0-2.49 2.5-2.99 3.0 and over
25.0-49.9 P01anc!Spain
EthiopiaBurmaRepublic of
Korea
TurkeyEgyptIran
50 and over France
JapanUnited StatesUSSR
United KingdorÿItalyGermany,
FederalRepublic of
NigeriaIndiaBangladeshIndonesiaBrazilPakistan
PhilippinesThailandMexico
Source: Centre for Development Planning, Projections and Policies of theUnited Nations Secretariat, based on national census reports and estimates of thePopulation Division of the United Nations Secretariat.
a Within each group, countries are listed in ascending order of populationgrowth rate.
136
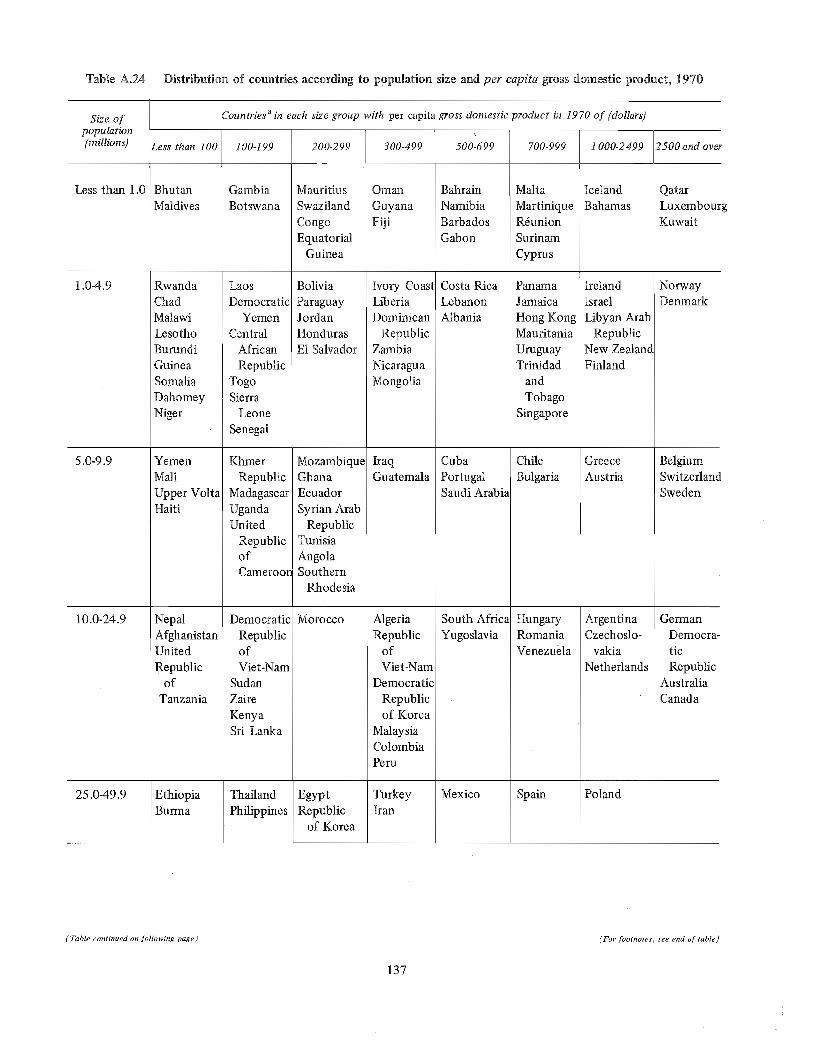
Table A.24 Distribution of cotmtries according to population size and per capita gross domestic product, 1970
Size of Countriesa in each size group with per capita gross domestic oroduct in 1970 of (dollars)
population(millions) Less than 100 100-199 200-299 300-499 500-699 700.999 1 000-2499 2500and oveÿ
Less than 1.0 BhutanMaldives
GambiaBotswana
MauritiusSwazilandCongoEquatoria!
Guinea
25.0-49.9
10.0-24.9
5.0-9.9 YemenMallUpper VoltaHaiti
NepalAfghanistanUnitedRepublic
ofTanzania
EthiopiaBurma
RwandaChadMalawiLesothoBurundiGuinea
SomaliaDahomeyNiger
LaosDemocratic
YemenCentral
AfricanRepublic
TogoSierra
Leone
Senegal
KhmerRepublic
Madagascar
UgandaUnited
RepublicofCamerooÿ
Democratic
RepublicofViet-Nam
SudanZaire
KenyaSri Lanka
ThailandPhilippines
1.0-4.9 BoliviaParaguayJordanHondurasE1 Salvador
MozambiqueGhanaEcuadorSyrian Arab
RepublicTunisia
AngolaSouthern
Rhodesia
Morocco
EgyptRepublic
of Korea
OmanGuyanaFiji
Ivory CoastLiberiaDominican
RepublicZambiaNicaraguaMongolia
IraqGuatemala
AlgeriaRepublicofViet-Nam
Democratic
Republicof Korea
MalaysiaColombiaPeru
TurkeyIran
BahrainNamibiaBarbadosGabon
Costa RicaLebanonAlbania
CubaPortugalSaudi Arabia
South AfricaYugoslavia
Mexico
MaltaMartiniqueRÿunionSurinam
Cyprus
PanamaJamaicaHong KongMauritania
UruguayTrinidad
and
TobagoSingapore
ChileBulgaria
HungaryRomaniaVenezuda
Spain
IcelandBahamas
IrelandIsraelLibyan Arab
RepublicNew ZealandFinland
GreeceAustria
ArgentinaCzechoslo-
vakiaNetherlands
Poland
QatarLuxembourgKuwait
NorwayDenmark
BelgiumSwitzerlandSweden
GermanDemocra-
ticRepublic
AustraliaCanada
(Table continued on following page) (For footnotes, see end of table)
137
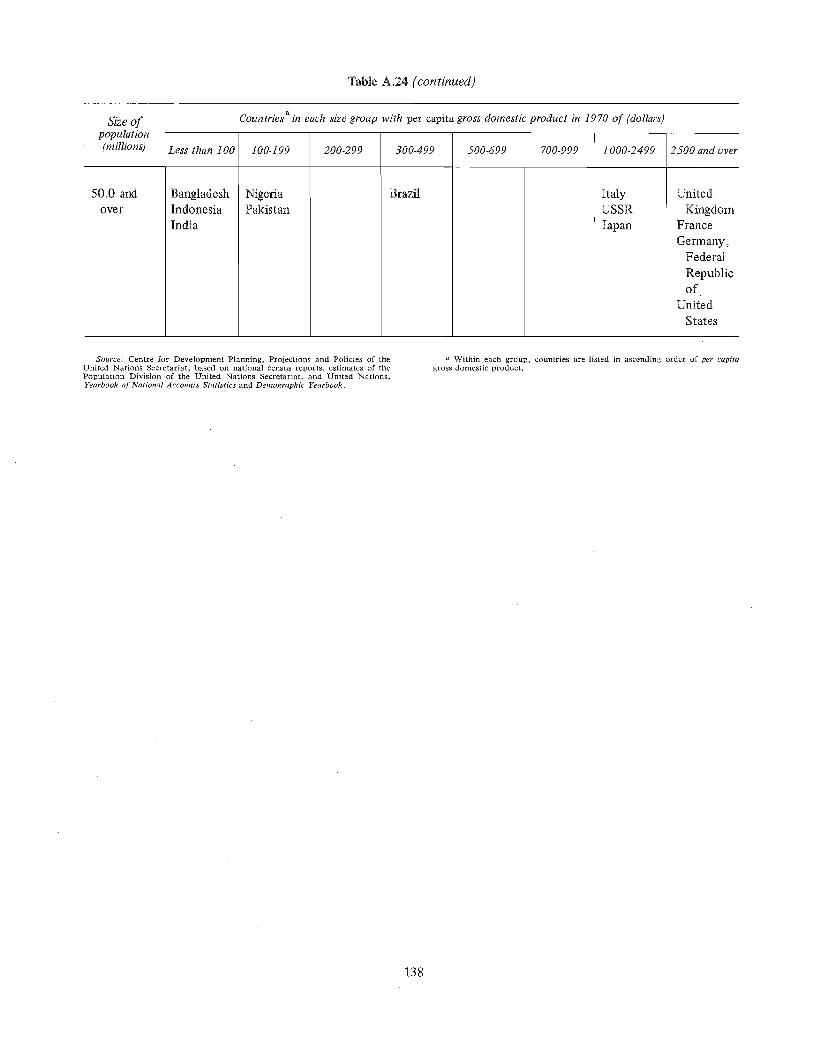
Table A,24 (continued)
• a.Size of Counmes m each size group with per capita gross domestic product in 1970 of (dollars)
population(millions) Less than 100 100-199 200-299 300-499 500-699 700-999 1000-2499 2500 and over
50.0 andover
BangladeshIndonesiaIndia
NigeriaPakistan
Brazil ItalyUSSRJapan
UnitedKingdom
France
Germany,FederalRepublicof
UnitedStates
Source: Centre for Development Planning, Projections and Policies of theUnited Nations Secretariat, based on national census reports, estimates of thePopulation Division of the United Nations Secretariat, and United Nations,Yearbook of National Accounts Statistics and Demographic Yearbook.
a Within each group, countries are listed in ascending order of per capitagross domestic product.
138
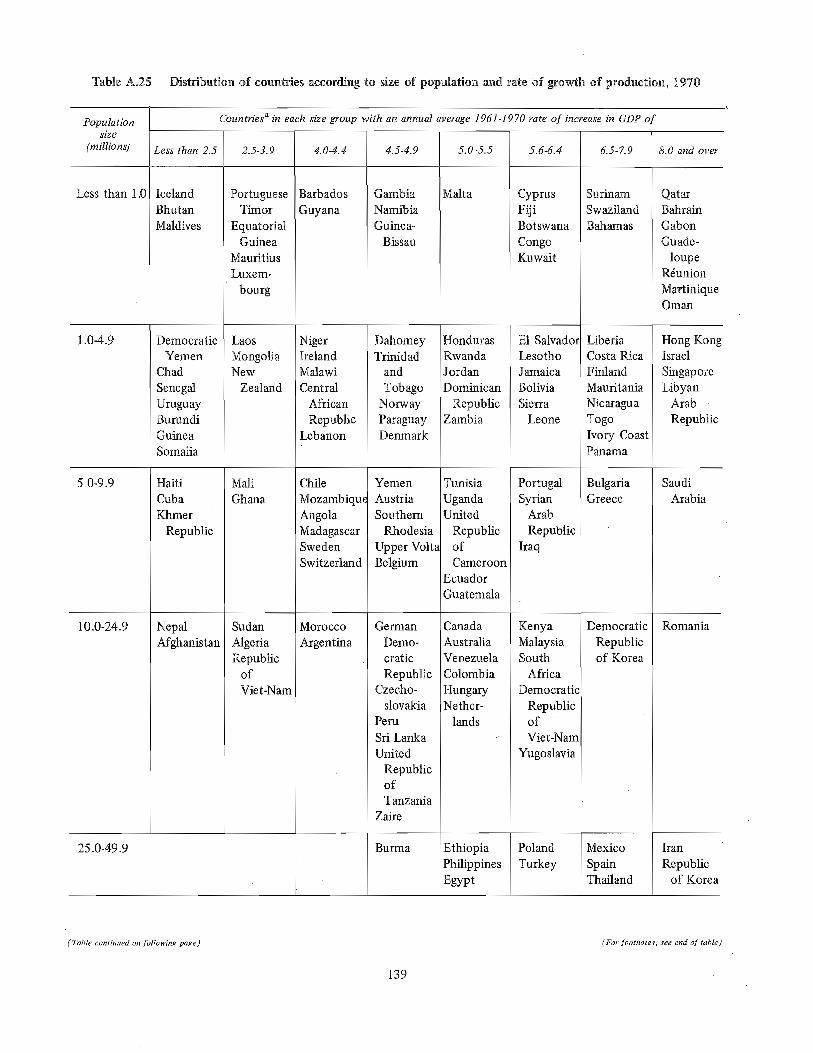
Table A.25 Distribution of countries according to size of population and rate of growth of production, 1970
Population Countriesa in each size group with an annual average 1961-1970 rate of increase in GDP of
size
(millions) Less than 2.5 2.5-3.9 4.0-4.4 4.5-4.9 5.0-5.5 5.6-6.4 6.5-Z9 8.0 and over
Less than 1.0 IcelandBhutanMaldives
PortugueseTimor
EquatorialGuinea
MauritiusLuxem-
bourg
BarbadosGuyana
25.0-49.9
10.0-24.9
5.0-9.9 HaitiCubaKhmer
Republic
NepalAfghanistan
DemocraticYemen
ChadSenegalUruguayBurundiGuineaSomalia
LaosMongoliaNew
Zealand
MaliGhana
SudanAlgeriaRepublicofViet-Nam
1.0-4.9 NigerIrelandMalawiCentral
AfricanRepublic
Lebanon
ChileMozambiquÿAngolaMadagascarSwedenSwitzerland
i MoroccoArgentina
GambiaNamibiaGuinea-
Bissau
DahomeyTrinidad
andTobago
NorwayParaguayDenmark
YemenAustriaSouthern
RhodesiaUpper VoltaBelgium
GermanDemo-
cratic
RepublicCzecho-
slovakiaPeru
Sri LankaUnited
RepublicofTanzania
Zaire
gurina
Malta
HondurasRwandaJordanDominican
RepublicZambia
TunisiaUgandaUnited
RepublicofCameroon
EcuadorGuatemala
CanadaAustraliaVenezuelaColombiaHungaryNether-
lands
EthiopiaPhilippinesEgypt
CyprusFijiBotswana
CongoKuwait
E1 SalvadorLesothoJamaicaBoliviaSierra
Leone
PortugalSyrian
ArabRepublic
Iraq
KenyaMalaysiaSouth
AfricaDemocratic
RepublicofViet-Nam
Yugoslavia
PolandTurkey
SurinamSwazilandBahamas
LiberiaCosta RicaFinlandMauritaniaNicaragua
TogoDory CoastPanama
BulgariaGreece
DemocraticRepublicof Korea
Mexico
SpainThailand
QatarBahrainGabonGuade-
loupeRÿunionMartiniqueOman
Hong KongIsrael
SingaporeLibyan
ArabRepublic
SaudiArabia
Romania
Iran
Republicof Korea
(Table continued on following page) (For footnotes, see end of table)
139
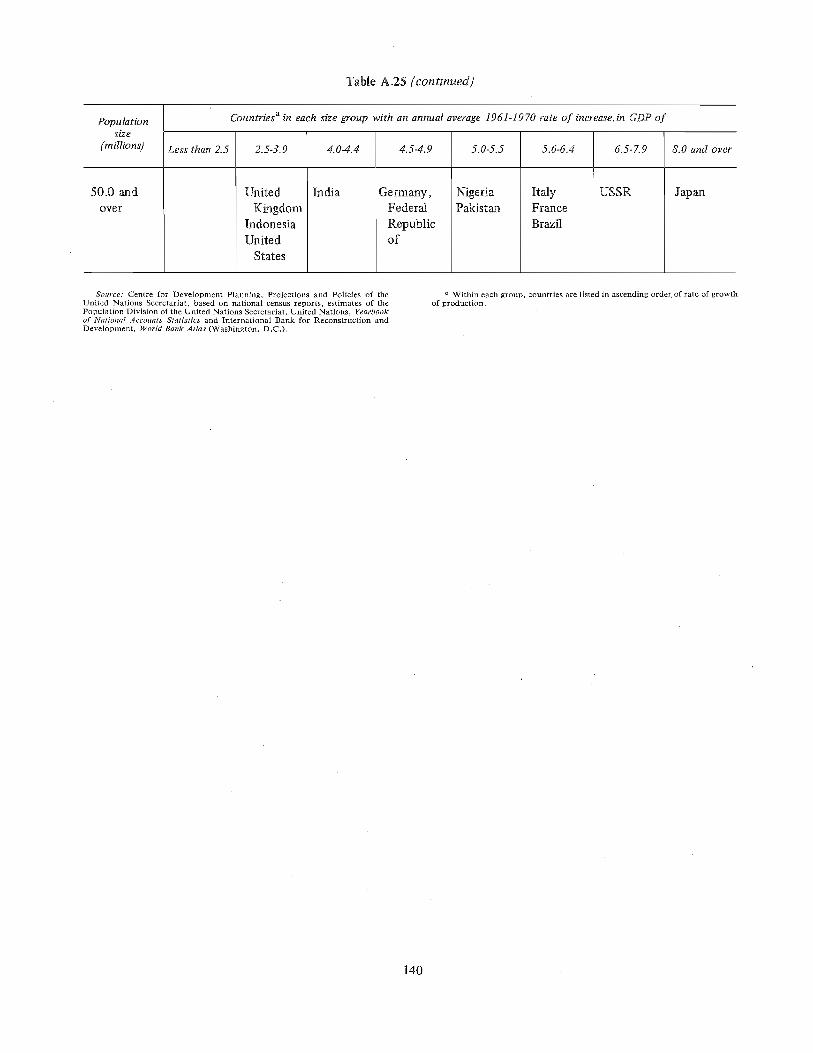
Table A.25 (continued)
Population Countriesa in each size group with an annual average 1961-1970 rate of increase, in GDP of
sÿe
(millions) i Less than 2.5 2.5-3.9 4.0-4.4 4.5-4.9 5.0-5.5 5.6-6,4 6.5-7.9 8.0 and over
50.0 andover
UnitedKingdom
IndonesiaUnited
States
India Germany,FederalRepublicof
NigeriaPakistan
ItalyFranceBrazil
USSR Japan
Source: Centre for Development Planning, Projections and Policies of theUnited Nations Secretariat, based on national census reports, estimates of thePopulation Division of the United Nations Secretariat, United Nations, Yearbookof National Accounts Statistics and International Bank for Reconstruction andDevelopment, World Bank Atlas (Washington, D.C.).
a Within each group, countries are listed in ascending order of rate of growthof production.
140
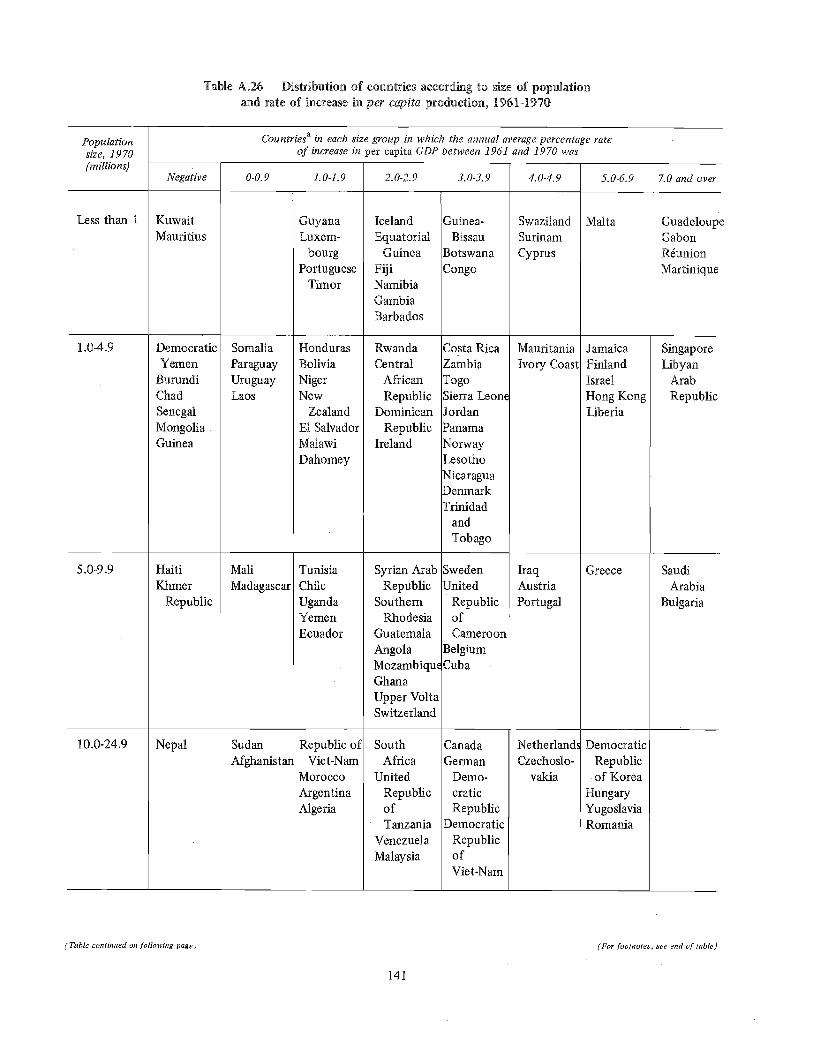
Table A.26 Distribution of countries according to size of populationand rate of increase in per capita production, 1961-1970
Population Countriesa in each size group in which the annual average percentage ratesize, 1970 of increase in per capita GDP between 1961 and 1970 was(millions)
Negative 0-0.9 1.0-1.9 2.0-2.9 3.0-3.9 4.0-4.9 5.0-6.9 7.0 and over
Less than 1 KuwaitMauritius
1.0-4.9
10.0-24.9
5.0-9.9
DemocraticYemen
BurundiChadSenegalMongoliaGuinea
HaitiKhmer
Republic
Nepa!
SomaliaParaguayUruguayLaos
MaliMadagascar
SudanAfghanistan
GuyanaLuxem-
bourgPortuguese
Timor
HondurasBoliviaNigerNew
ZealandE1 SalvadorMalawiDahomey
TunisiaChileUgandaYemenEcuador
Republic ofViet-Nam
Morocco
ArgentinaAlgeria
IcelandEquatorial
Guinea
FijiNamibiaGambiaBarbados
RwandaCentral
AfricanRepublic
DominicanRepublic
Ireland
Syrian ArabRepublic
SouthernRhodesia
GuatemalaAngolaMozanlbiquÿGhanaUpper VoltaSwitzerland
SouthAfrica
UnitedRepublicofTanzania
Venezuela
Malaysia
Guinea-
BissauBotswana
Congo
Costa RicaZambiaTogoSierra LeonÿJordanPanamaNorwayLesothoNicaraguaDenmarkTrinidad
andTobago
SwedenUnited
RepublicofCameroon
Belgiumguba
CanadaGerman
Demo-
craticRepublic
DemocraticRepublicofViet-Nam
SwazilandSurinamCyprus
MauritaniaIvory Coast
IraqAustriaPortugal
NetherlandsCzechoslo-
vakia
Malta
JamaicaFinlandIsrael
Hong KongLiberia
Greece
DemocraticRepublicof Korea
HungaryYugoslaviaRomania
GuadeloupeGabonRÿunion
Martinique
SingaporeLibyan
ArabRepublic
SaudiArabia
Bulgaria
(Table continued on following page) (For footnotes, see end of table)
141
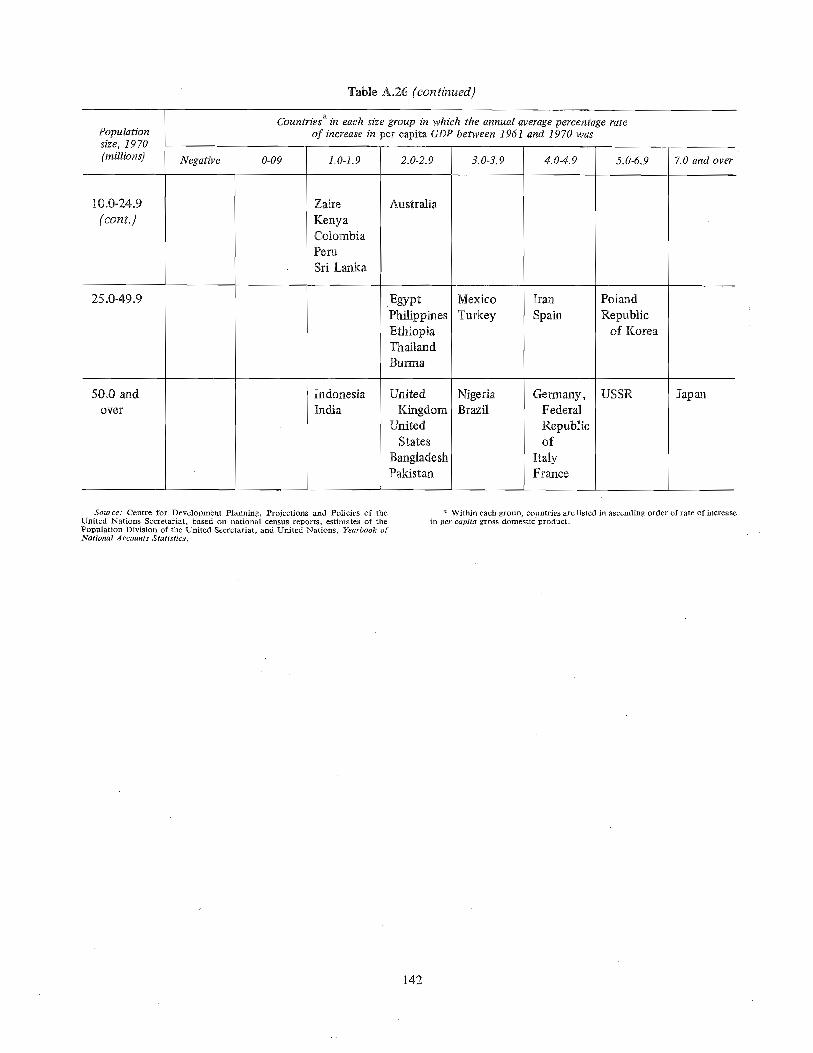
Table A.26 (continued}
Countriesa in each size group in which the annual average percentage ratePopulation of increase in per capita GDP between 1961 and 1970 wassize, 1970
(millions) Negative 0-09 1.0-1.9 2.0-2.9 3.0-3.9 4.0-4.9 5.0-6,9 7.0 and over
Zaire
KenyaColombiaPeruSri Lanka
Australia
25.0-49.9 EgyptPhilippinesEthiopiaThailandBurma
50.0 andover
IndonesiaIndia
UnitedKingdom
UnitedStates
BangladeshPakistan
Mexico
Turkey
NigeriaBrazil
Iran
Spain
Germany,FederalRepublicof
ItalyFrance
PolandRepublic
of Korea
USSR Japan
Source: Centre for Development Planning, Projections and Policies of theUnited Nations Secretariat, based on national census reports, estimates of thePolÿulation Division of the United Secretariat, and United Nations, Yearbook ofNational Accounts Statistics.
a Within each group, countries are listed in ascending order of rate of increasein per capita gross domestic product.
142

Table A.27 Distribution of countries according to population and savings ratio, 1968o1970
Population Countriesa in each size group in which the ratio of national savings to gross national product was
size
(millions) Less than 10 10.0-14.99 15.0-19.99 20.0-24.99 25.0-29.99 30.0 and over
Less than 1 BotswanaGuinea-BissauRÿunionBarbados
MauritiusGambia
FijiMaltaGuyana
Cyprus
10.0-24.9
5.0-9.9 MozambiqueHaitiEcuador
Madagascar
AfghanistanRepublic of
Viet-Narn
LesothoLaosJordanChadNigerRwandaGuineaMalawiIsrael
SenegalBurundiSomaliaUruguayDominican
Republic
DahomeyE1 SalvadorParaguayTogoNicaraguaBoliviaHondurasCentral
AfricanRepublic
Trinidad andTobago
GhanaKhmer
RepublicGuatemalaSyrian Arab
RepublicMallUpper VoltaPortugalTunisia
SudanPeru
1.0-4.9 Sierra LeoneLebanon
Hong KongCosta RicaLiberiaJamaicaIrelandMauritaniaDenmark
UnitedRepublic ofCameroon
ChileUgandaAngolaGreeceSouthern
Rhodesia
Sri LankaMoroccoUnited Republic
of TanzaniaColombiaKenyaArgentina
NamibiaIceland
PanamaIvory Coast
IraqSwedenBelgium
MalaysiaGerman
DemocraticRepublic
CanadaAlgeriaSouth AfricaZaire
CongoSwaziland
New ZealandSingaporeNorwayFinland
AustriaBulgaria
HungaryVenezuelaAustraliaCzechoslovakiaNetherlands
LuxembourgEquatorial
GuineaGabonKuwaitSurinam
ZambiaLibyan Arab
Republic
SwitzerlandSaudi Arabia
Yugoslavia
(Table continued on following page) (For footnotes, see end of table)
143
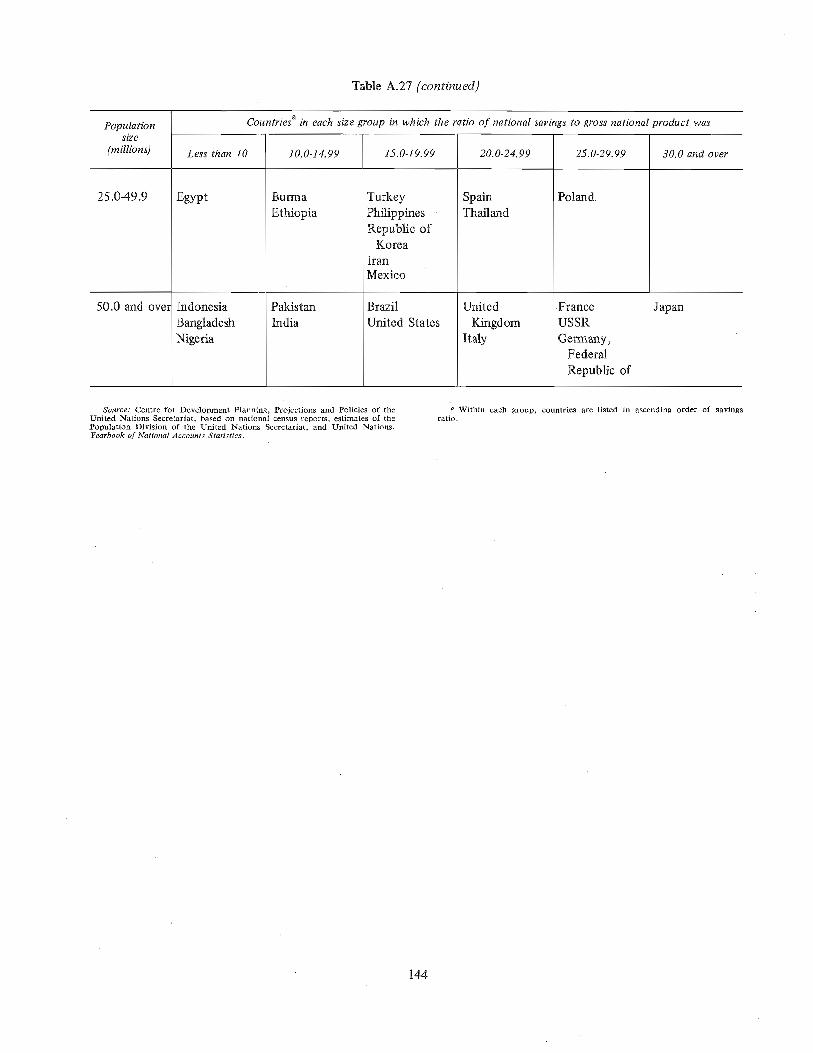
Table A.27 (continued)
Population Countriesa in each size group in which the ratio of national savings to gross nationa product was
size
(millions) Less than 10 10.0-14.99 15.0-19.99 20.0-24.99 25.0-29.99 30.0 and over
25.0-49.9 Egypt gurnla
EthiopiaTurkeyPhilippinesRepublic of
KoreaIranMexico
Indonesia
BangladeshNigeria
PakistanIndia
50.0and ove, BrazilUnited States
SpainThailand
UnitedKingdom
Italy
Poland
FranceUSSRGermany,
FederalRepublic of
Japan
Source: Centre for Development Planning, Projections and Policies of theUnited Nations Secretariat, based on national census reports, estimates of thePopulation Division of the United Nations Secretariat. and United Nations,Yearbook of National Accounts Statistics.
a Within each group, countries are listed in ascending order of savingsratio.
144
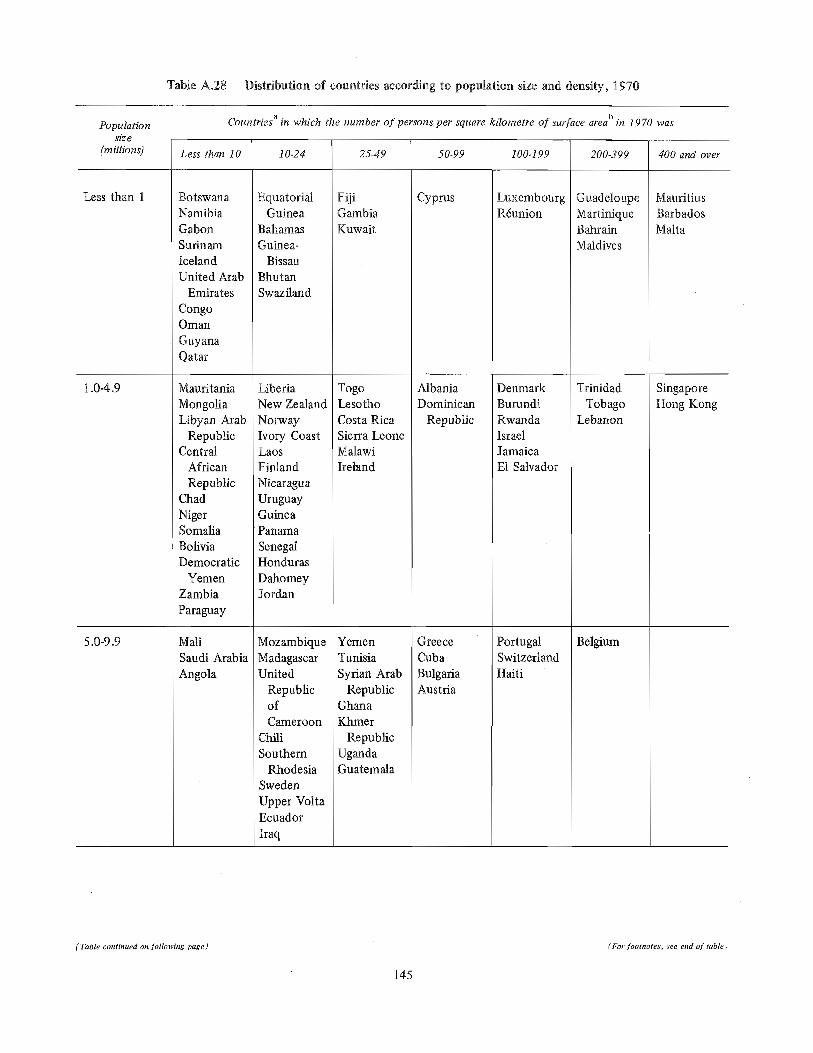
Table A.28 Distribution of countries according to population size and density, 1970
• a . bPopulation Counmes m which the number of persons per square kilometre of surface area in 1970 was
size
{millions) Less than 10 10-24 25.49 50-99 100-199 200-399 400 and over
Less than 1 BotswanaNamibiaGabonSurinamIcelandUnited Arab
Emirates
CongoOmanGuyanaQatar
EquatorialGuinea
BahamasGuinea-
BissauBhutanSwaziland
5.0-9.9
Mauritania
MongoliaLibyan Arab
RepublicCentral
AfricanRepublic
ChadNigerSomaliaBoliviaDemocratic
YemenZambiaParaguay
MallSaudi ArabiaAngola
1.04.9 LiberiaNew ZealandNorwayDory CoastLaosFinlandNicaragua
UruguayGuineaPanama
SenegalHonduras
DahomeyJordan
MozambiqueMadagascarUnited
RepublicofCameroon
ChiliSouthern
RhodesiaSwedenUpper VoltaEcuador
Iraq
FijiGambiaKuwait
TogoLesothoCosta RicaSierra LeoneMalawiIrekand
YemenTunisiaSyrian Arab
RepublicGhanaKhmer
RepublicUgandaGuatemala
Cyprus
AlbaniaDominican
Republic
GreeceCubaBulgariaAustria
LuxembourgRÿunion
DenmarkBurundiRwandaIsraelJamaicaE1 Salvador
PortugalSwitzerland
!Haiti
GuadeloupeMartiniqueBahrainMaldives
TrinidadTobago
Lebanon
Belgium
MauritiusBarbadosMalta
SingaporeHong Kong
(Table continued on following page) (For footnotes, see end of table)
145
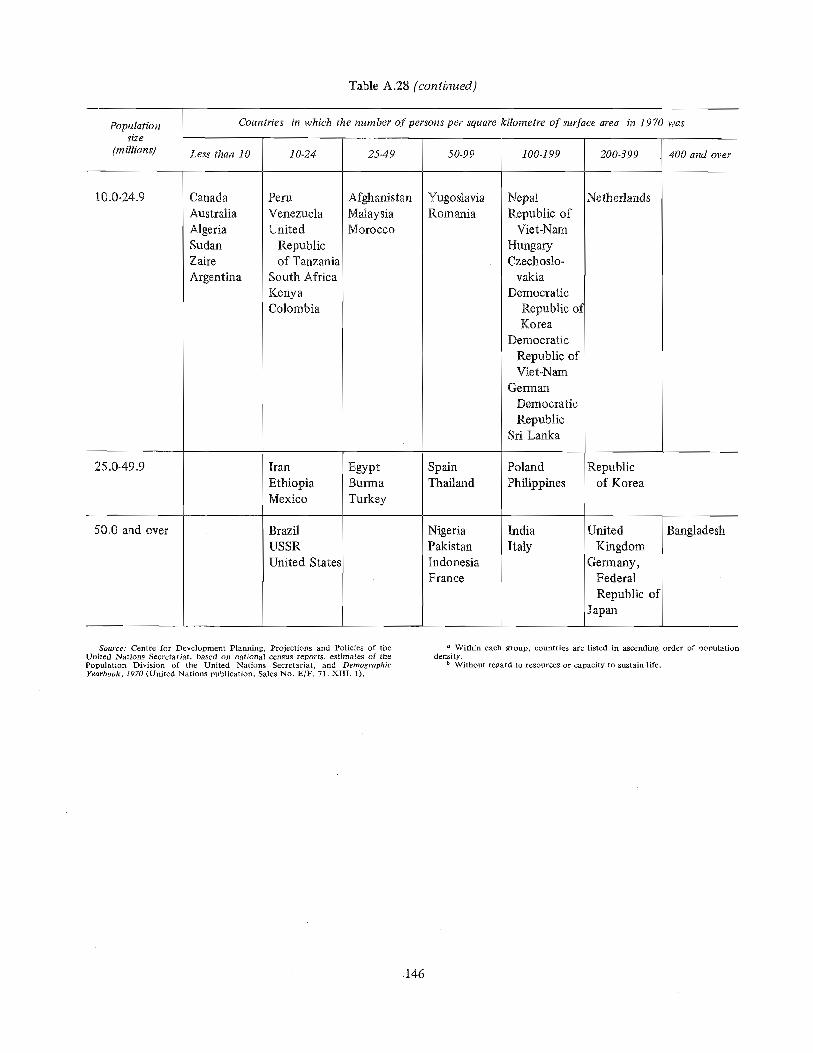
Table A.28 (continued)
Population Countries in which the number of persons per square kilometre of surface area in 1970 wassize
(millions) Less than 10 10-24 25-49 50-99 100-199 200-399 400 and over
10.0-24.9 CanadaAustraliaAlgeriaSudanZaireArgentina
Peru
VenezuelaUnite d
Republicof Tanzania
South AfricaKenyaColombia
AfghanistanMalaysiaMorocco
25.0-49.9 Iran Egypt Spain Poland RepublicEthiopia Burma Thailand Philippines of KoreaMexico Turkey
50.0 and over BangladeshBrazilUSSRUnited Stateÿ
YugoslaviaRomania
NigeriaPakistanIndonesiaFrance
NepalRepublic of
Viet-Narn
HungaryCzechoslo-
vakiaDemocratic
Republic ofKorea
DemocraticRepublic ofViet-Nam
German
DemocraticRepublic
Sri Lanka
IndiaItaly
Netherlands
UnitedKingdom
i Germany,FederalRepublic of
Japan
Source: Centre for Development Planning, Projections and Policies of theUnited Nations Secretariat, based on national census reports, estimates of thePopulation Division of the United Nations Secretariat, and DemographicYearbook, 1970 (United Nations publication, Sales No. E/F. 71. XIII. 1).
" Within each group, countries are listed in ascending order of populationdensity.
b Without regard to resources or capacity to sustain life,
146
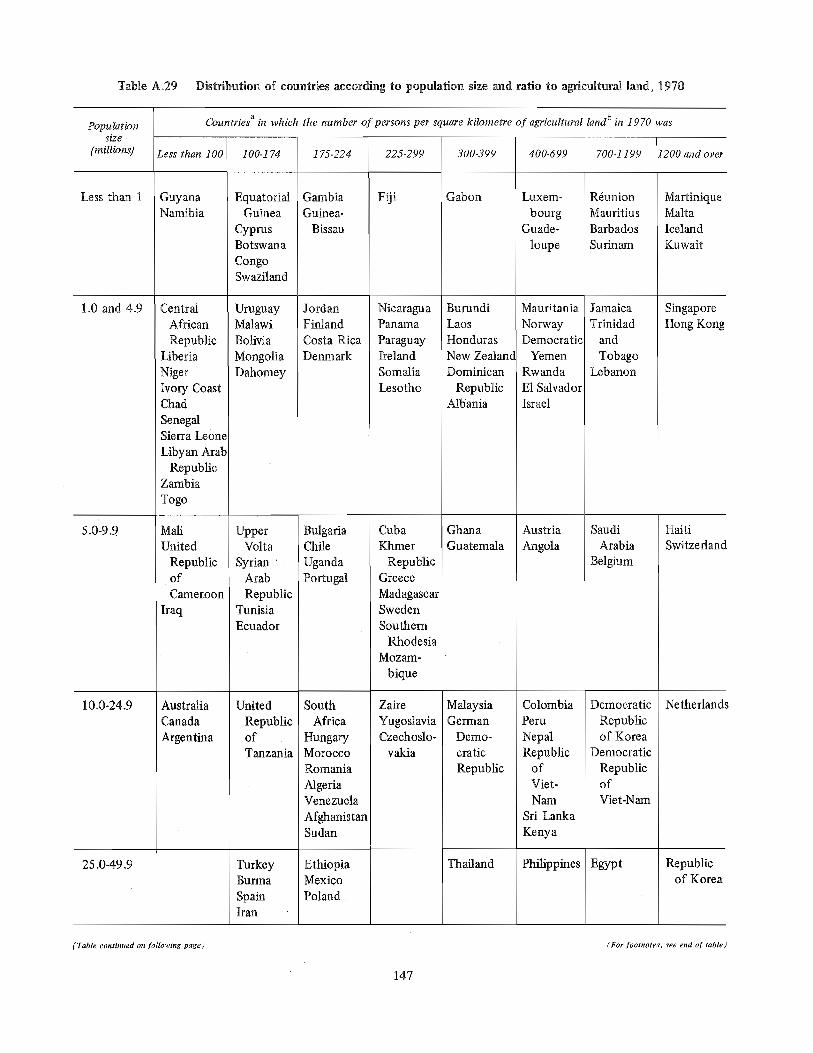
Table A.29 Distribution of countries according to population size and ratio to agricultural land, 1970
• a .Povulation Countrtes tn which the number of persons per square kilometre of agricultural landb in 1970 was
size
(millions) Less than 100 100-174 175-224 225-299 300-399 400-699 ZOO-1199 1200 and over
Less than 1 GuyanaNamibia
EquatorialGuinea
CyprusBotswana
CongoSwaziland
GambiaGuinea-
Bissau
25.0-49.9
10.0-24.9
5.0-9.ÿ MaliUnited
RepublicofCameroon
Iraq
AustraliaCanadaArgentina
CentralAfricanRepublic
LiberiaNigerIvory CoastChadSenegalSierra LeoneLibyan Arab
RepublicZambiaTogo
UruguayMalawiBoliviaMongoliaDahomey
UpperVolta
Syrian '
ArabRepublic
TunisiaEcuador
UnitedRepublicofTanzania
TurkeyBurma
SpainIran
1.0 and 4.9 JordanFirdandCosta RicaDenmark
BulgariaChileUgandaPortugal
SouthAfrica
HungaryMoroccoRomania
AlgeriaVenezuelaAfghanistanSudan
EthiopiaMexicoPoland
Fiji
NicaraguaPanamaParaguayIrelandSomaliaLesotho
CubaKhmer
RepublicGreeceMadagascarSwedenSouthern
RhodesiaMozam-
bique
ZaireYugoslaviaCzechoslo-
vakia
Gabon
BurundiLaosHondurasNew ZealancDominican
RepublicAlbania
GhanaGuatemala
MalaysiaGerman
Demo-
craticRepublic
Thailand
Luxem-
bourgGuade-
loupe
Mauritania
NorwayDemocratic
YemenRwandaE! SalvadorIsrael
AustriaAngola
ColombiaPeru
NepalRepublicofViet-
NamSri LankaKenya
Philippines
RÿunionMauritiusBarbadosSurinam
JamaicaTrinidad
andTobago
Lebanon
SaudiArabia
Belgium
Democratic
Republicof Korea
Democratic
RepublicofViet-Nam
Egypt
MartiniqueMaltaIcelandKuwait
SingaporeHong Kong
HaitiSwitzerland
Netherland:
Republicof Korea
(Table continued on following page) (For footnotes, see end of table)
147
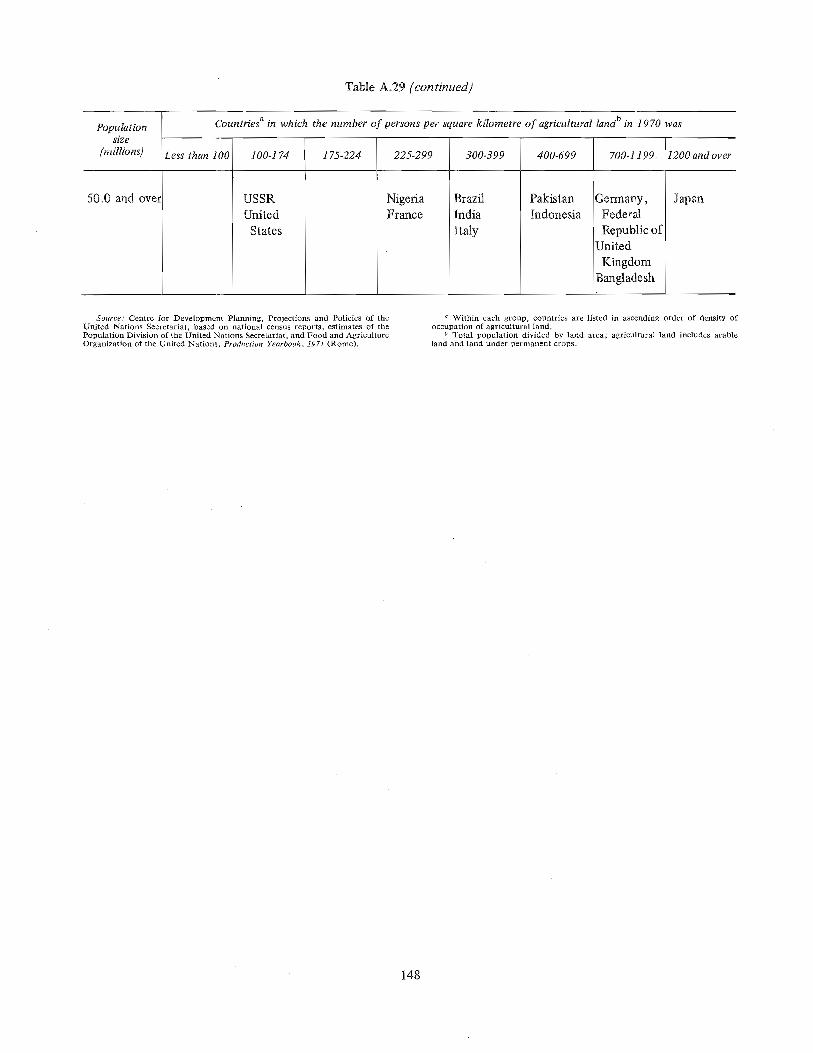
Table A.29 (continued}
Populationsize
(millions}
Countriesa in which the number of persons per square kilometre of agricultural landb in 1970 was
Less than 100 100-174
50.0 and over
175-224 225-299
USSRUnited
States
300-399
NigeriaFrance
400-699
BrazilIndiaItaly
PakistanIndonesia
700-1199
Germany,FederalRepublic of
UnitedKingdom
Bangladesh
1200andover
Japan
Source: Centre for Development Planning, Projections and Policies of theUnited Nations Secretariat, based on national census reports, estimates of thePopulation Division of the United Nations Secretariat, and Food and AgricultureOrganization of the United Nations, Production Yearbook, 1971 (Rome).
a Within each group, countries are listed in ascending order of density ofoccupation of agricultural land.
b Total population divided by land area; agricultural land includes arableland and land under permanent crops.
148
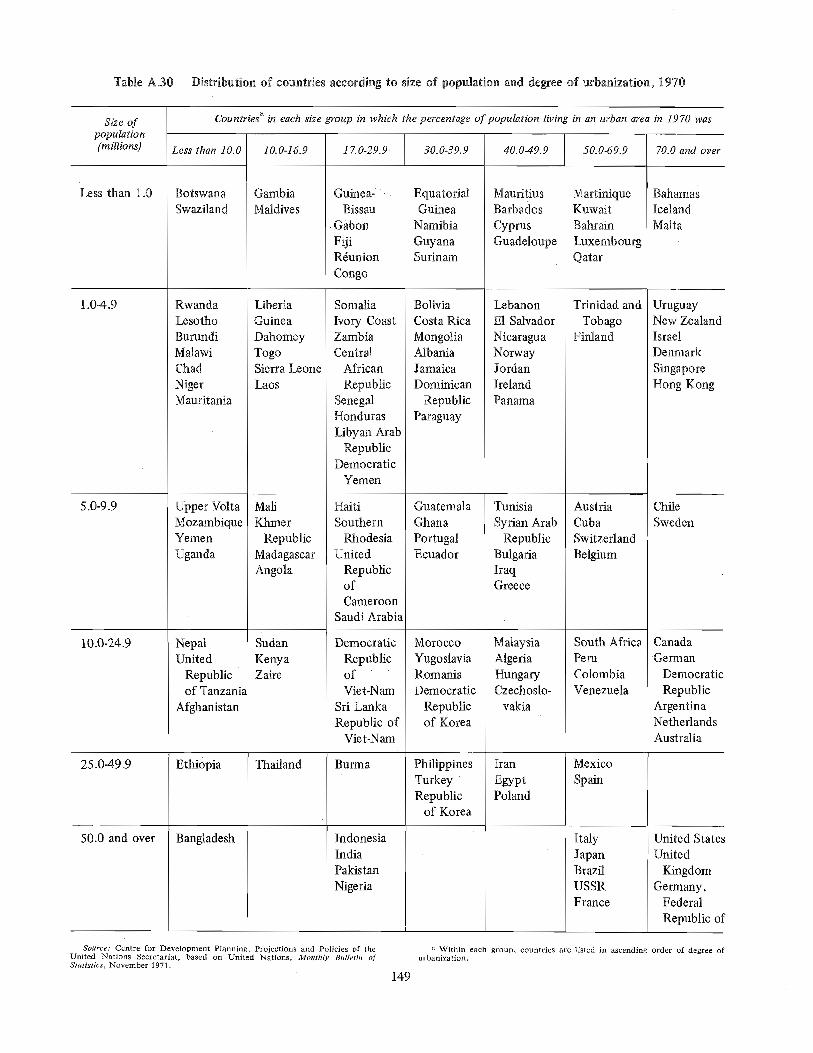
Table A.30 Distribution of countries according to size of population and degree of urbanization, 1970
Size of Coumriesa in each size group in which the percentage of population living in an urban area in 1970 was
population(millions) Less than 10.0 10.0-16.9 17.0-29.9 30°0-39.9 40.0-49.9 50.0-69.9 70.0 and over
Less than 1.0 BotswanaSwaziland
GanabiaMaldives
Guinea-,
Bissau, Gabon
FijiRÿunion
Congo
25.0-49.9
50.0 and over
10.0-24.9
5.OO.9 Upper VoltaMozambiqueYemen
Uganda
NepalUnited
Republicof Tanzania
Afghanistan
Ethiopia
Bangladesh
RwandaLesothoBurundiMalawiChadNigerMauritania
LiberiaGuineaDahomeyTogoSierra Leone !Laos
MarlKhmer
RepublicMadagascarAngola
SudanKenyaZaire
Thailand
1.0-4.9 SomaliaIvory CoastZambiaCentral
AfricanRepublic
SenegalHondurasLibyan Arab
RepublicDemocratic
Yemen
HaitiSouthern
RhodesiaUnited
RepublicofCameroon
Sandi Arabia
Democratic
RepublicofViet-Nam
Sri LankaRepublic of
Viet-Nam
gurl"na
IndonesiaIndiaPakistanNigeria
EquatorialGuinea
NamibiaGwanaSurinam
BoliviaCosta RicaMongoliaAlbaniaJamaicaDominican
RepublicParaguay
GuatemalaGhanaPortugalEcuador
MoroccoYugoslaviaRomania
DemocraticRepublicof Korea
PhilippinesTurkeyRepublic
of Korea
MauritiusBarbadosCyprusGuadeloupe
LebanonE1 SalvadorNicaraguaNorwayJordanIrelandPanama
TunisiaSyrian Arab
RepublicBulgariaIraqGreece
MalaysiaAlgeriaHungaryCzechoslo-
vakia
Iran
EgyptPoland
MartiniqueKuwaitBahrainLuxembourgQatar
Trinidad andTobago
Finland
AustriaCubaSwitzerlandBelgium
South AfricaPeruColombiaVenezuela
Mexico
Spain
ItalyJapanBrazilUSSRFrance
BahamasIcelandMalta
UruguayNew ZealandIsraelDenmark
SingaporeHong Kong
ChileSweden
CanadaGerman
DemocraticRepublic
ArgentinaNetherlandsAustralia
United StatesUnited
KingdomGermany,
FederalRepublic of
Source." Centre for Development Planning, Projections and Policies of theUnited Nations Secretariat, based on United Nations, Monthly BuHetln ofStatistics, November 1971.
a Within each group, countries are listed in ascending order of degree ofurbanization.
149
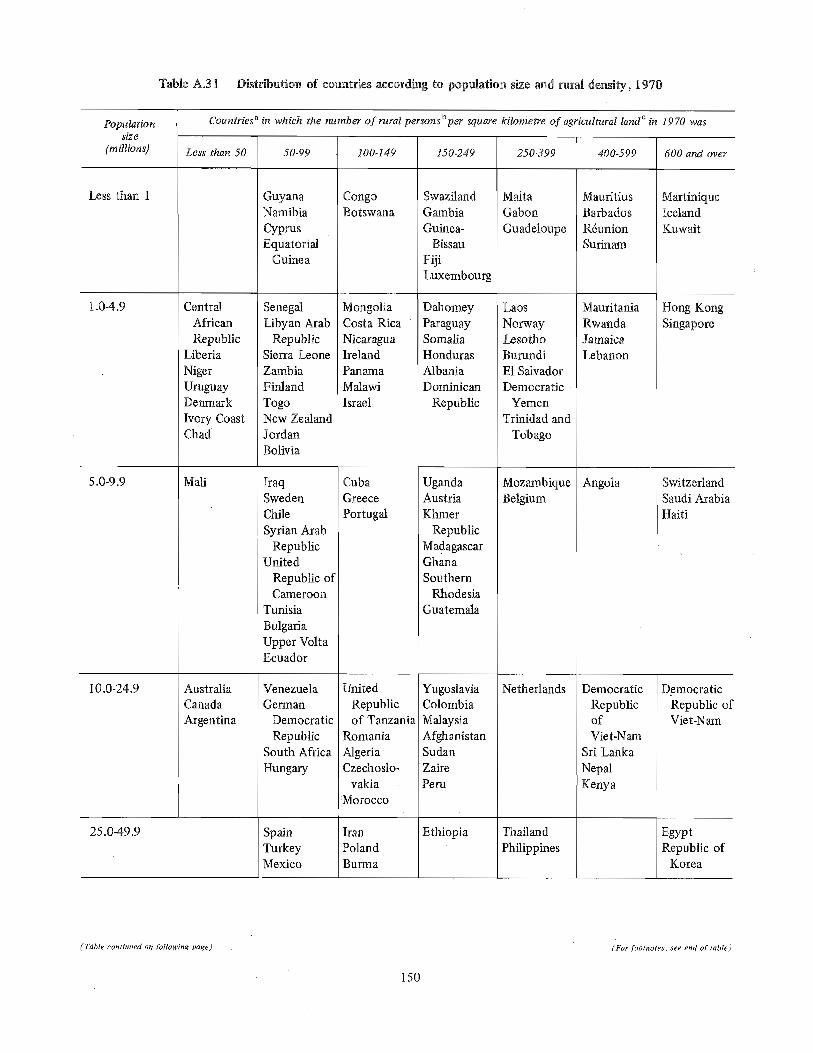
Table A.31 Distribution of countries according to population size and rural density, 1970
Population Countriesa in which the number of rural persons U per square kilometre of agricultural landc in 1970 was
e
(millions) Less than 50 50-99 100-149 150-249 250-399 400-599 600 and over
Less than I GuyanaNamibiaCyprusEquatorial
Guinea
CentralAfricanRepublic
LiberiaNigerUruguayDenmark
Ivory CoastChad
25.0-49.9
10.0-24.9
Mali5.0-9.9
AustraliaCanadaArgentina
1.0-4.9 SenegalLibyan Arab
RepublicSierra LeoneZambiaFirdandTogoNew ZealandJordanBolivia
IraqSwedenChileSyrian Arab
RepublicUnited
Republic ofCameroon
TunisiaBulgariaUpper VoltaEcuador
VenezuelaGerman
Democratic
RepublicSouth AfricaHungary
SpainTurkeyMexico
CongoBotswana
MongoliaCosta RicaNicaraguaIrelandPanamaMalawiIsrael
CubaGreecePortugal
UnitedRepublicof Tanzania
RomaniaAlgeriaCzechoslo-
vakia:Morocco
IranPolandBurma
SwazilandGambiaGuinea-
Bissan
FijiLuxembourg
DahomeyParaguaySomaliaHondurasAlbaniaDominican
Republic
UgandaAustriaKhmer
RepublicMadagascarGhanaSouthern
RhodesiaGuatemala
'YugoslaviaColombiaMalaysiaAfghanistanSudanZaire
I Peru
Ethiopia
MaltaGabonGuadeloupe
Laos
NorwayLesothoBurundiE1 SalvadorDemocratic
YemenTrinidad and
Tobago
MozambiqueBelgium
Netherlands
ThailandPhilippines
MauritiusBarbadosRdunionSurinam
MauritaniaRwandaJamaicaLebanon
Angola
DemocraticRepublicofViet-Nam
Sri LankaNepalKenya
MartiniqueIcelandKuwait
Hong KongSingapore
SwitzerlandSaudi ArabiaHaiti
DemocraticRepublic ofViet-Nam
EgyptRepublic of
Korea
(Table continued on following page) (For" footnotes, see end of table)
150
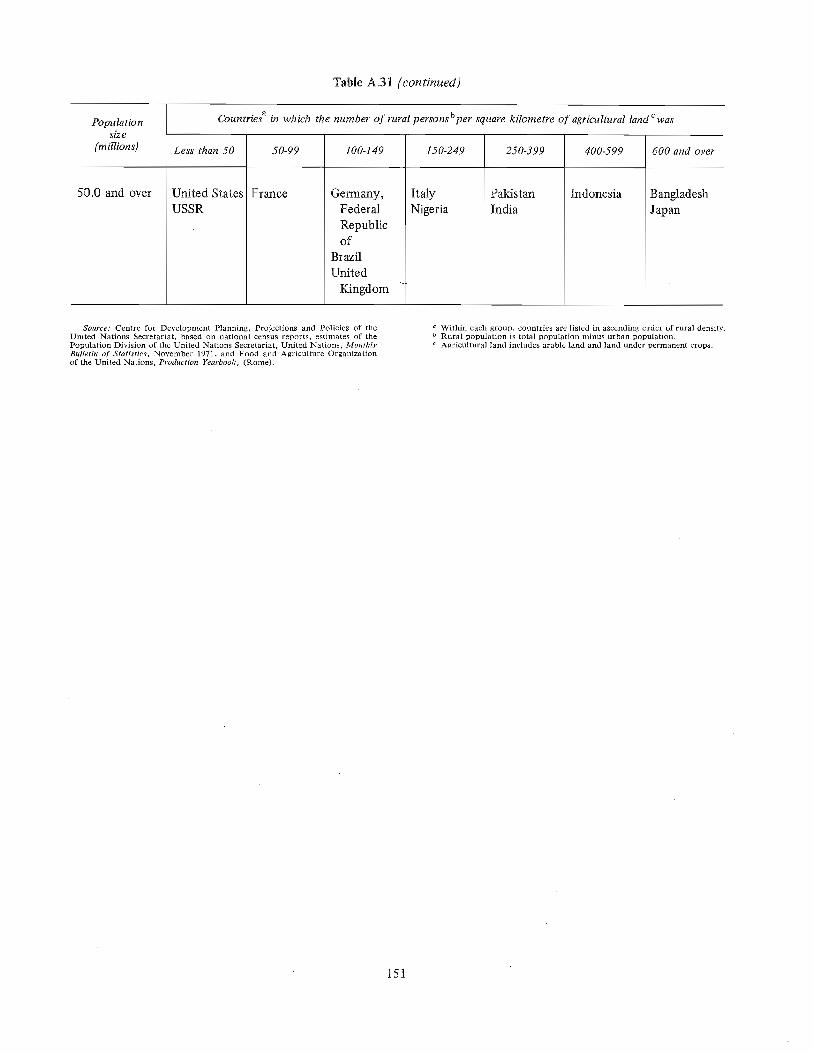
Table A.31 (continued)
Population Countriesa in which the number of rural persons bper square kilometre of agricultural land C was
size
(millions) Less than 50 50-99 100-149 150-249 250-399 400-599 600 and over
50.0 and over United StatesUSSR
France Germany,FederalRepublicof
BrazilUnited
Kingdom
ItalyNigeria
PakistanIndia
Indonesia BangladeshJapan
Source: Centre for Development Planning, Projections and Policies of theUnited Nations Secretariat, based on national census reports, estimates of thePopulation Division of the United Nations Secretariat, United Nations, MonthlyBulletin of Statistics, November 1971, and Food and Agriculture Organizationof the United Nations, Production Yearbook, (Rome).
a Within each group, countries are listed in ascending order of rural density.b Rural population is total population minus urban population.c Agricultural land includes arable land and land under permanent crops.
151

Table A.32 Distribution of countries according to size of population and the proportionof economically active population engaged in agriculture, 1970
Population Countriesa in which the percentage of the economically active population engaged in agriculture & 1970 was
size
(millions) Less than 10 10-24 25-39 40-49 50-59 60-69 70-79 80 and over
Less than 1 KuwaitMaltaLuxembourg
IcelandBarbados
Surinam
GuyanaCyprus
25.0-49.9
50.0 and ovei
10.0-24.9
5.0-9.9 BelgiumSwitzerlandSweden
Netherlands.CanadaAustralia
UnitedKingdom
UnitedStates
Hang KongSingapore
IsraelDenmarkNew
ZealandNorwayTrinidad
and
TobagoUruguay
Austria
GermanDemo-
craticRepublic
ArgentinaCzechoslo-
vakia
Germany,FederalRepublic
France
JapanItaly
!-4.9 FinlandIrelandJamaicaJordan
ChileCubaPortugal
HungaryVenezuelaSouth
Africa
SpainPoland
USSR
of
Congo
LibyanArabRepublic
PanamaCosta RicaLebanon
BulgariaGreece
TunisiaIraqSyrian Arab
Republic
ColombiaPeru
IranMexico
Brazil
Namibia
DahomeyParaguayNicaraguaE1 SalvadorBoliviaMongolia
EcuadorGhana
RomaniaSri LankaDemocraticRepublicof Korea
YugoslaviaAlgeriaMalaysia
EgyptRepubfic of
Korea
Pakistan
Dominican
RepublicAlbaniaDemocratic
YemenHondurasZambia
SaudiArabia
AngolaGuatemalaSouthern
Rhodesia
Morocco
gurlTla
Turkey
NigeriaIndia
Gabon
Sierra Leone
LiberiaTogaSenegalLaps
MozambiqueYemenKhmer
RepublicHaiti
Republic ofViet-Nam
DemocraticRepublicofViet-Nam
Zaire
PhilippinesThailand
Indonesia
Gambia
Dory CoastSomaliaGuineaMauritaniaBurundiCentral
AfricanRepublic
MalawiChadNigerRwanda
UnitedRepublicofCameroor
MadagascarUgandaUpper VoltÿMali
KenyaSudanAfghanistarUnited
RepublicofTanzania
Nepal
Ethiopia
Bangladesh
Source: Centre for Development Planning, Projections and Policies of theWni.ÿad Nations Secretariat, based on national census reports, estimates by thePopulation Division of the United Nations Secretariat, and Food and AgricultureOrganization of the United Nations, Production Yearbook, 1972 (Rome).
a Within each group, countries are listed in ascending order of proportion ofactive population in agriculture.
152
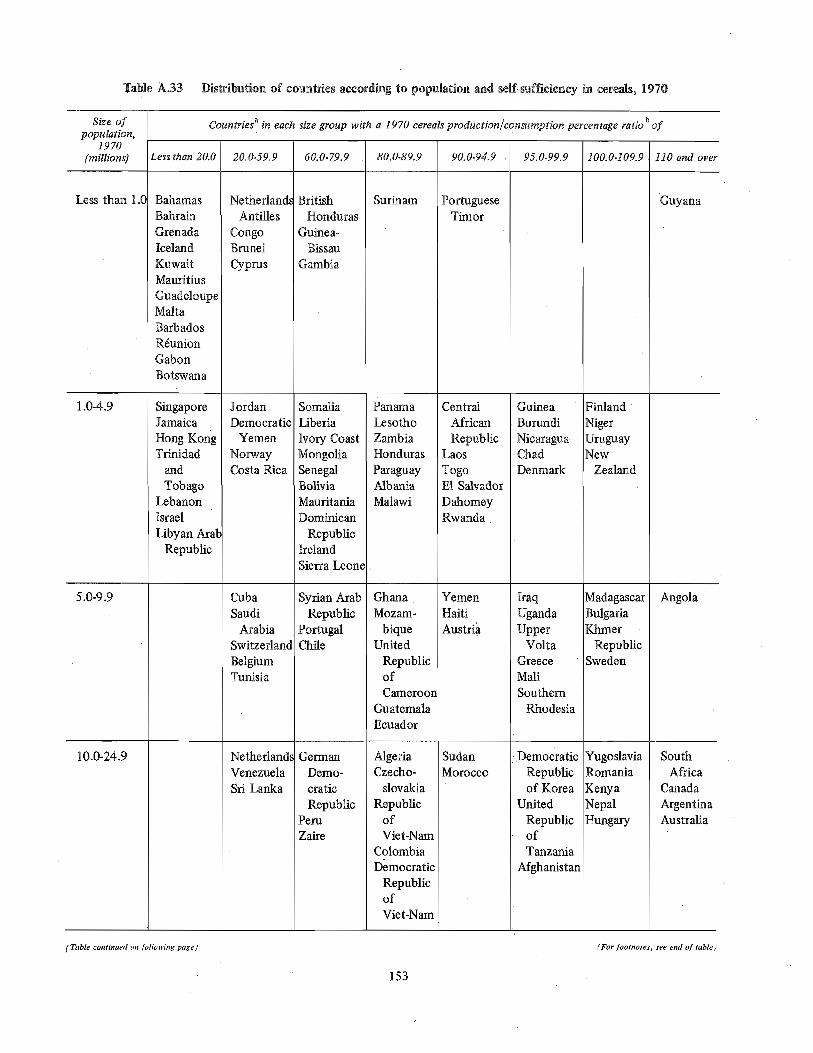
TaMe A.33 Distribution of countries according to population and self-sufficiency in cereals, 1970
Size ofpopulation,
1970(millions)
Countriesa in each size group with a 1970 cereals production/consumption percentage ratio b of
Less than 20.0 20.0-59.9
10.0-24.9
5.0-9.9
(Table continued on [ollowing page)
SingaporeJamaica
Hong KongTrinidad
andTobago
LebanonIsraelLibyan Mat
Republic
BelgiumTunisia
1.04.9
BahamasBahrainGrenadaIcelandKuwaitMauritiusGuadeloupeMaltaBarbadosRÿunionGabonBotswana
CongoBrunei
Cyprus
JordanDemocratic
Yemen
NorwayCosta Rica
CubaSaudi
ArabiaSwffzefland
NetherlandsVenezuelaSri Lanka
Guinea-
BissauGambia
SomaliaLiberiaIvory CoastMongoliaSenegalBoliviaMauritaniaDominican
RepublicIrelandSierra Leone
Syrian ArabRepublic
PortugalChile
GelTllanDemo-
craticRepublic
PeruZaire
PanamaLesothoZambiaHonduras
ParaguayAlbaniaMalawi
GhanaMozam-
biqueUnited
RepublicofCameroon
GuatemalaEcuador
AlgeriaCzecho-
slovakiaRepublicofViet-Nam
ColombiaDemocratic
RepublicofViet-Nam
CentralAfricanRepublic
Laos
TogoE1 SalvadorDahomeyRwanda
YemenHaitiAustria
SudanMorocco
GuineaBurundiNicaragua-ChadDenmark
IraqUgandaUpper
VoltaGreeceMarlSouthern
Rhodesia
• Democratic
Republicof Korea
UnitedRepublicofTanzania
Afghanistan
FinlandNigerUruguayNew
Zealand
MadagascarBulgariaKhmer
Republic• Sweden
YugoslaviaRomania
KenyaNepalHungary
Less than 1.C NetherlandÿAntilles
60.0-79.9
BritishHonduras
80.0-89.9
Surinam
90.0-94.9
PortugueseTimor
95.0-99.9 100.0-109.9 110 and over
-Guyana
Angola
SouthAfrica
CanadaArgentinaAustralia
(For footnotes, see end of table)
153
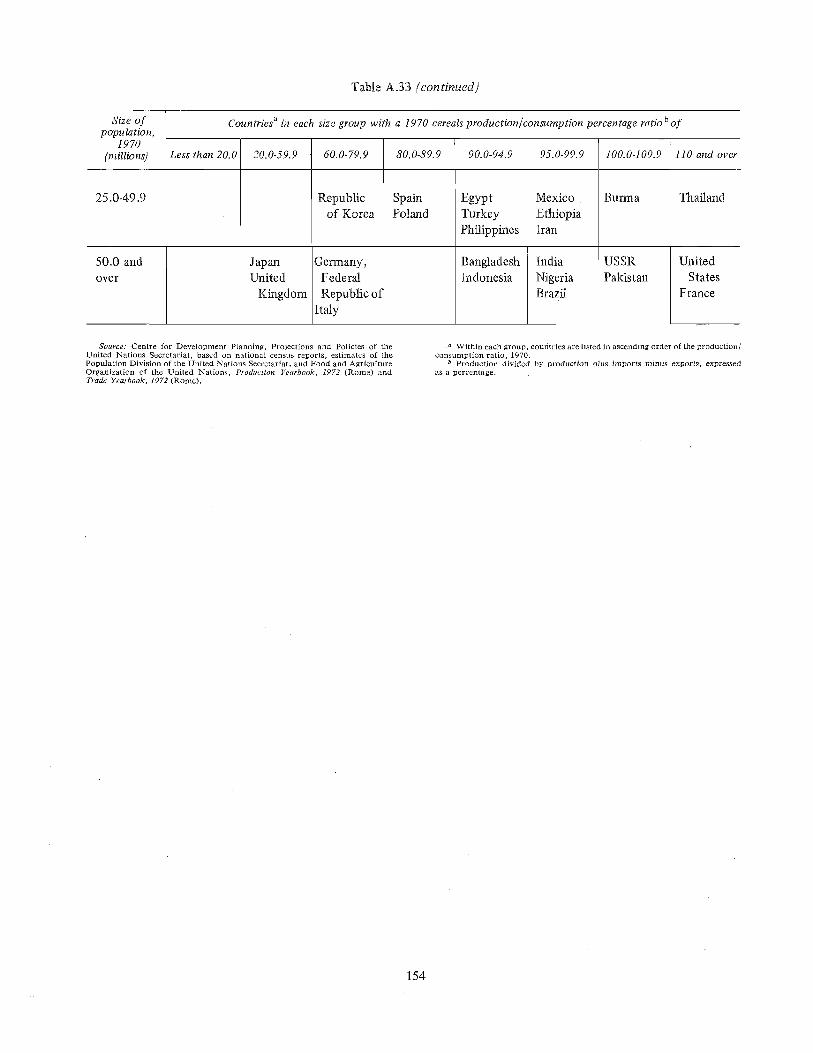
Table A.33 (contin,ued)
Size of Countriesa in each size group with a 1970 cereals production/consumption percentage ratio b ofpopulation,
1970 [(millions) Less than 20.0 20.0-59.9 60.0-79.9 80.0-89.9 90.0-94.9 95.0-99.9 100.0-109.9 110 and over
25.0-49.9 Republicof Korea
SpainPoland
50.0 and
over
Germany,Federa!Republic of
Italy
JapanUnited
Kingdom
EgyptTurkeyPhilippines
BangladeshIndonesia
Mexico
EthiopiaIran
IndiaNigeriaBrazil
Burma
USSRPakistan
Thailand
UnitedStates
France
Source: Centre for Development Planning, Projections and Policies of theUnited Nations Secretariat, based on national census reports, estimates of thePopulation Division of the United Nations Secretariat, and Food and AgricultureOrganization of the United Nations, Production Yearbook, 1972 (Rome) andTrade Yearbook, 1972 (Rome).
a Within each group, countries are listed in ascending order of the production/consumption ratio, 1970.
Production divided by production plus imports minus exports, expressedas a percentage.
154
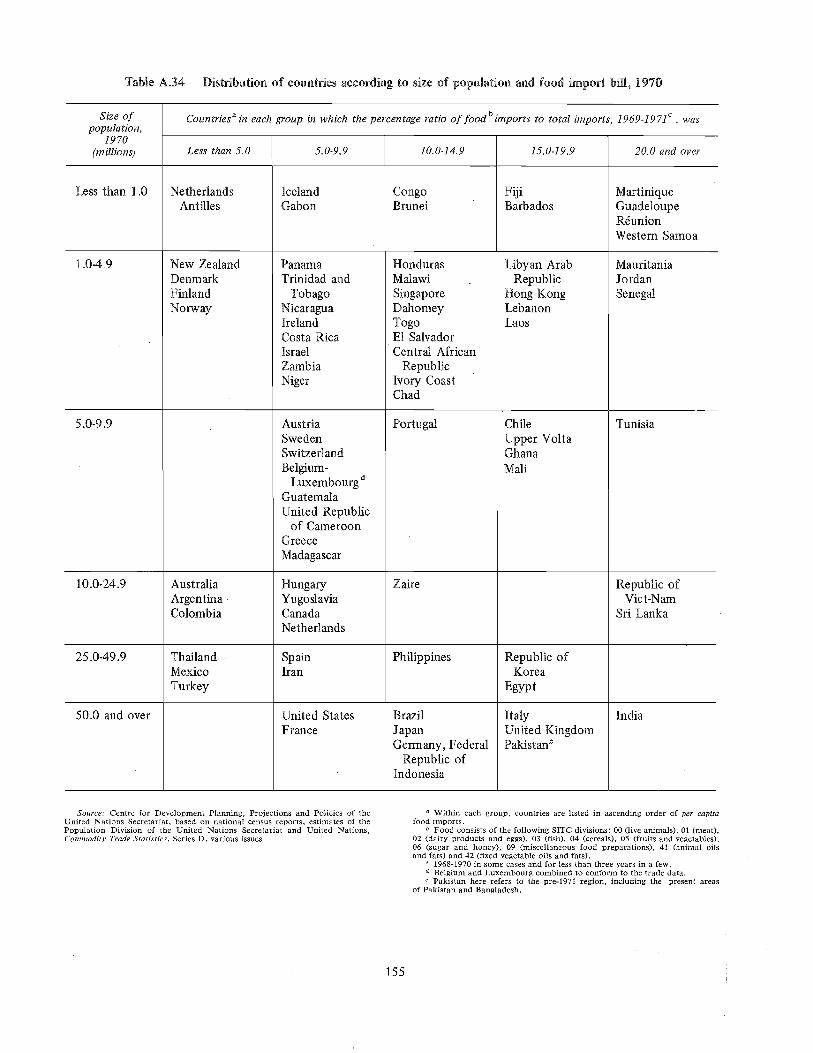
Table A.34 Distribution of countries according to size of population and food import bill, 1970
Size of Countriesa in each group in which the percentage ratio of foodb imports to total imports, 1969-1971c , waspopulation,
1970(millions) Less than 5.0 5.0-9.9 10.0-14.9 15.0-19.9 20.0 and over
Less than 1.0 NetherlandsAntilles
IcelandGabon
CongoBrunei
25.0-49.9
50.0 and over
10.0-24.9
5.00.9
AustraliaArgentinaColombia
ThailandMexicoTurkey
New ZealandDenmarkFinlandNorway
PanalTlaTrinidad and
TobagoNicaraguaIrelandCosta RicaIsraelZambiaNiger
AustriaSwedenSwitzerlandBelgium-
Luxembourg dGuatemalaUnited Republic
of CameroonGreeceMadagascar
HungaryYugoslaviaCanadaNetherlands
SpainIran
United StatesFrance
1.0-4.9 HondurasMalawiSingaporeDahomeyTogoE1 SalvadorCentral African
RepublicIvory CoastChad
Portugal
Zaire
Philippines
BrazilJapanGermany, Federal
Republic ofIndonesia
FijiBarbados
Libyan ArabRepublic
Hong KongLebanonLaos
ChileUpper VoltaGhanaMall
Republic ofKorea
Egypt
ItalyUnited KingdomPaldstan.e
MartiniqueGuadeloupeRdunionWestern Samoa
MauritaniaJordanSenegal
Tunisia
Republic ofViet-Nam
Sri Lanka
India
Source: Centre for Development Planning, Projections and Policies of theUnited Nations Secretariat, based on national census reports, estimates of thePopulation Division of the United Nations Secretariat and United Nations,CommodUy Trade Statistics, Series D, various issues,
a Within each group, countries are listed in ascending order of per capitafood imports.
b Food consists of the following SITC divisions: 00 (live animals), 01 (meat),02 (dairy products and eggs), 03 (fish), 04 (cereals), 05 (fruits and vegetables),06 (sugar and honey), 09 (miscellaneous food preparations), 41 (animal oilsand fats) and 42 (fixed vegetable oils and fats).
e 1968-1970 in some cases and for less than three years in a few,a Belgium and Luxembourg combined to conform to the trade data.e Pakistan here refers to the pre-1971 region, including the present areas
of Pakistan and Bangladesh.
155
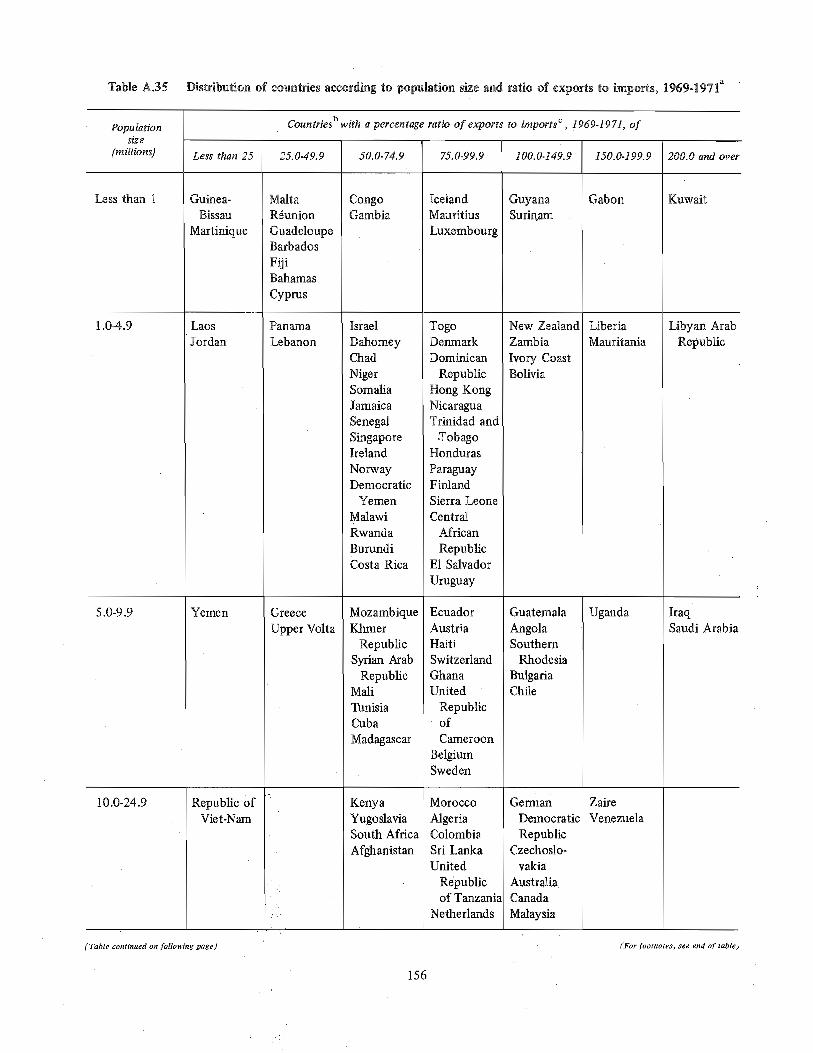
Table A.35 Distribution of countries according to population size and ratio of exports to imports, 1969-1971a
Countriesb with a percentage ratio of exports to importsc, 1969-1971, ofPopulationsize
(millions) Less than 25 25.0-49°9 50.0-74.9 73.0-99.9 100.0-149.9 150.0-199.9 200.0 and over
Less than 1 Guinea-
BissauMartinique
MaltaRÿunionGuadeloupeBarbadosViiiBahamas
Cyprus
CongoGambia
10.0-24.9
5.0-9.9 Yemen
Republic ofViet-Nam
LaosJordan
PanamaLebanon
Greece
Upper Volta
1.0-4.9 IsraelDahomeyChadNigerSomaliaJamaicaSenegalSingaporeIrelandNorwayDemocratic
YemenMalawiRwandaBurundiCosta Rica
MozambiqueKhmer
RepublicSyrian Arab,
RepublicMaltTunisiaCubaMadagascar
KenyaYugoslaviaSouth AfricaAfghanistan
IcelandMauritiusLuxembourg
TogoDenmarkDominican
RepublicHong KongNicaraguaTrinidad and
.TobagoHonduras
ParaguayFinlandSierra LeoneCentral
AfricanRepublic
E1 SalvadorUruguay
Ecuador
AustriaHaitiSwitzerlandGhanaUnited
RepublicofCameroon
BelgiumSweden
Morocco
AlgeriaColombiaSri LankaUnited
Republicof Tanzania
Netherlands
GuyanaSuriaam
New ZealandZambiaIvory CoastBolivia
GuatemalaAngolaSouthern
RhodesiaBulgariaChile
GenTianDemocraticRepublic
Czechoslo-
vakiaAustraliaCanadaMalaysia
Gabon
LiberiaMauritania
Uganda
ZaireVenezuela
Kuwait
Libyan ArabRepublic
IraqSaudi Arabia
(Table continued on following page) (For footnotes, see end of table)
156

Table A.35 (continued)
Populationsize
(millions)
Countries bwith a percentage ratio of exports to importsc, 1969-1971, of
Less than 25
50.0 and over
25.0-49.9
25.0-49.9
Republic ofKorea
50.0-74.9
SpainThailandMexico
TurkeyEthiopia
Pakistan
75.0-99.9
HungarySudanRomaniaArgentina
gurlna
PhilippinesPolandEgypt
IndiaBrazilUnited
KingdomItalyFrance
100.0-149.9
Peru
Iran
NigeriaUnited State,ÿIndonesiaJapanUSSRGermany,
FederalRepublicof
150.0-!99.9 200.0 and over
Source: Centre for Development Planning, Projection and Policies oftheUnited Nations Secretariat, based on United Nations, Monthly Bulletin ofStatistics, January 1974, and Yearbook of International Trade Statistics, 1970-1971(United Nations publication, Sales No. E. 73. XVII. 12).
a Except in the case of British Honduras and Zaire (1968-1970) and Yemen(1969-1970).
b Within each group, countries are listed in ascending order of export/import ratio.
c Ratio of exports (valued f.o.b.) to imports (valued c.i.f.) expressed as apercentage.
157
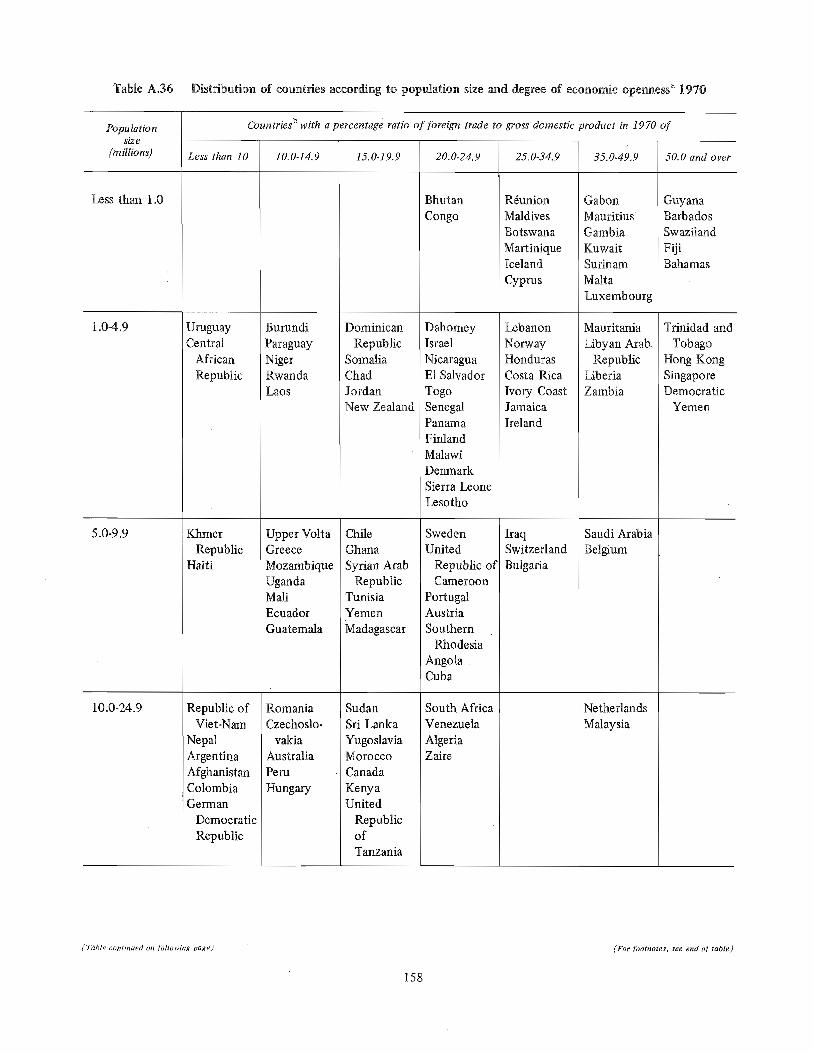
Table A.36 Distribution of countries according to population size and degree of economic opennessa 1970
Countriesb with a percentage ratio o f foreign trade to gross domestic product in 1970 ofPopulationsize
(millions) Less than 10 10.0-14.9 15.0-19.9 20.0-24.9 25.0-34.9 35,0-49.9 50.0 and over
Less than 1.0 BhutanCongo
RÿunionMaldivesBotswanaMartiniqueIcelandCyprus
UruguayCentral
AfricanRepublic
10.0-24.9
Khnler
RepublicHaiti
Republic ofViet-Nam
NepalArgentinaAfghanistan
1 ColombiaGerman
Democratic
Republic
5.0-9.9 Upper VoltaGreeceMozambiqueUgandaMallEcuadorGuatemala
RomaniaCzechoslo-
vakiaAustraliaPeruHungary
Dominican
RepublicSomaliaChadJordanNew Zealand
ChileGhanaSyrian Arab
RepublicTunisiaYemen
Madagascar
SudanSri LankaYugoslaviaMoroccoCanada
KenyaUnited
RepublicofTanzania
BurundiParaguayNigerRwandaLaos
DahomeyIsrael
NicaraguaE1 SalvadorTogoSenegalPanamaFinlandMalawiDenmarkSierra LeoneLesotho
SwedenUnited
Republic ofCameroon
PortugalAustriaSouthern
RhodesiaAngolaCuba
South AfricaVenezuelaAlgeriaZaire
1.0-4.9 Lebanon
NorwayHondurasCosta RicaIvory CoastJamaicaIreland
IraqSwitzerlandBulgaria
GabonMauritiusÿ
GambiaKuwaitSurinam
MaltaLuxembourg
MauritaniaLibyan Arab.
RepublicLiberiaZambia
Saudi ArabiaBelgium
NetherlandsMalaysia
GuyanaBarbadosSwazilandFijiBahamas
Trinidad andTobago
Hong KongSingaporeDemocratic
Yemen
(Table continued on following page) (For footnotes, see end of table)
158
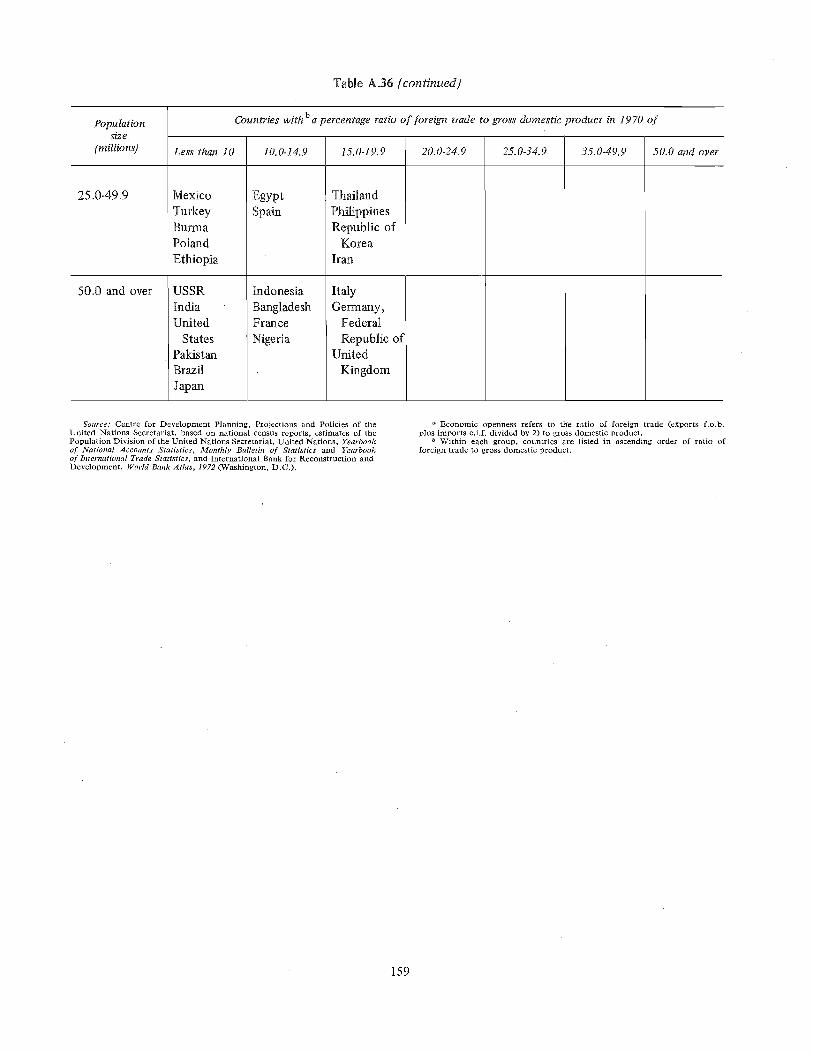
Table A.36 (continued)
Countries with ba percentage ratio of foreign trade to gross domestic product in 1970 ofPopulationsize
(millions) Less than 10 10.0-14.9 15.0-19.9 20.0-24.9 25.0-34.9 35.0-49.9 50.0 and over
25.0-49.9 Mexico
TurkeyBurmaPolandEthiopia
EgyptSpain
ThailandPhilippinesRepublic of
KoreaIran
USSRIndiaUnited
StatesPakistanBrazilJapan
Indonesia
BangladeshFrance
Nigeria
50.0 and over ItalyGermany,
FederalRepublic of
UnitedKingdom
Source: Centre for Development Planning, Projections and Policies of theUnited Nations Secretariat, based on national census reports, estimates of thePopulation Division of the United Nations Secretariat, United Nations, Yearbookof National Accounts Statistics, Monthly Bulletin of Statistics and Yearbookof International Trade Statistics, and International Bank for Reconstruction andDevelopment, World Bank Atlas, 1972 (Washington, D.C.).
a Economic openness refers to the ratio of foreign trade (exports f.o.b.plus imports c.i.f, divided by 2) to gross domestic product.
b Within each group, countries are listed in ascending order of ratio offoreign trade to gross domestic product.
159
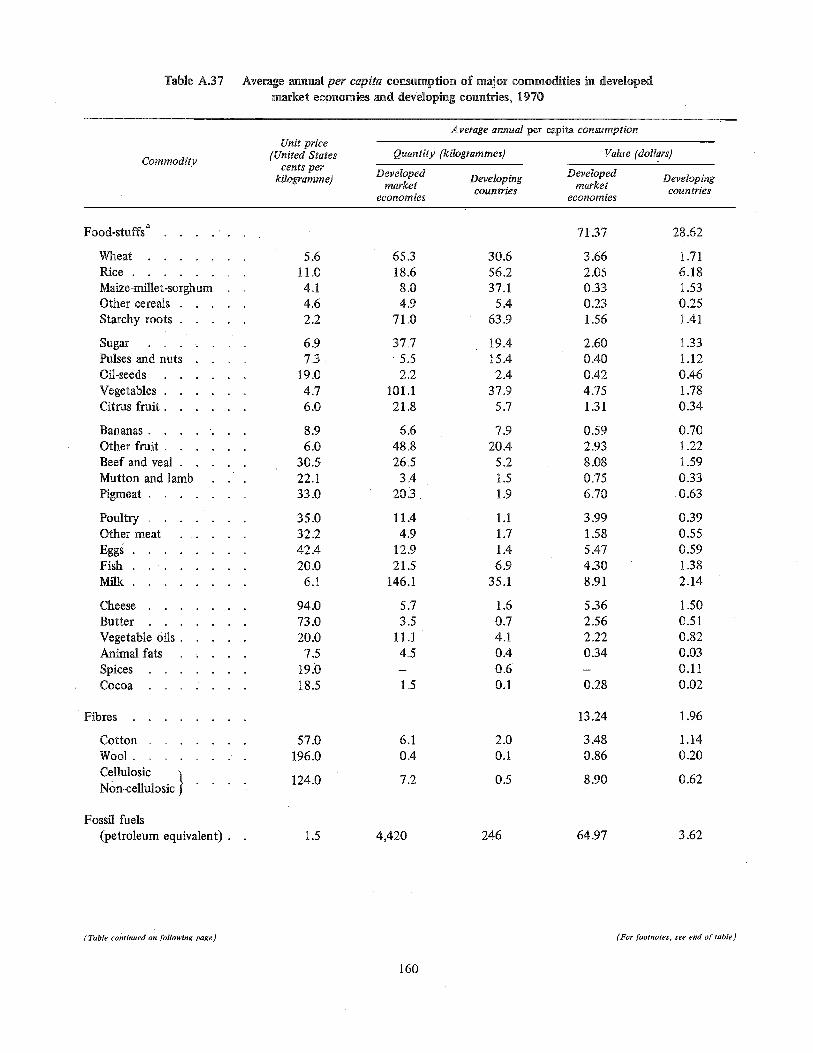
Table A.37 Average annual per capita consumption of major commodities in developedmarket economies and developing countries, 1970
Average annual per capita consumption
Commodity
Unit price(United States
cents perkilogramme)
Quantity (kilogrammes) Value (dollars)
Developed Developing Developedmarket marketcountries
economies economies
Developingcountries
Food-stuffsa . . . . . . 71.37 28.62
Cheese .......
Butter .......
Vegetable oils .....
Animal fats .....
Spices .......
Cocoa .......
Bananas .......
Other fruit ......
Beef and veal .....
Mutton and lambPigrneat .......
Poultry .......
Other meat .....
Eggs ........
Fish . . ......
Milk ........
6.9 37.7 19.4 2.60 1.337.3 5.5 15.4 0.40 1.12
19.0 2.2 2.4 0.42 0.464.7 101.1 37.9 4.75 1.786.0 21.8 5.7 1.31 0.34
8.96.0
30.522.133.0
35.032.242.420.0
6.1
94.073.020.0
7.5191'0
18.5
6.648.826.53.4
20.3
11.44.9
12.921.5
146.1
5.73.5
11.14.5
1.5
7.920.4
5.21.5
1.9
1.11.71.4
6.935.1
1.60.74.10.40.60.1
5.6 65.3 30.6 3.66 1.7111.0 18.6 56.2 2.05 6.184.1 8.0 37.1 0.33 1.534.6 4.9 5.4 0.23 0.252.2 71.0 63.9 1.56 1.41
0.592.938.080.756.70
3.991.585.474.308.91
5.362.562.220.34
0.28
Wheat .......
Rice ........
Maize-millet-sorghumOther cereals .....
Starchy roots ......
Sugar . . . ....
Pulses and nuts ....
Oil-seeds ......
Vegetables ......
Citrus fruit ......
0.701.221.590.330.63
0.390.550.591.382.14
1.500.510.820.030.110.02
Fibres ........
Cotton .......
Wool ....... .
CellulosicN0n-cellulosic } ....
Fossil fuels(petroleum equivalent) .
57.0196.0
124.0
1.5
6.10.4
7.2
4,420
2.00.1
0.5
246
13.24
3.480.86
8.90
64.97
1.96
1.140.20
0.62
3.62
(Table continned on following page) (For footnotes, see end of table)
160
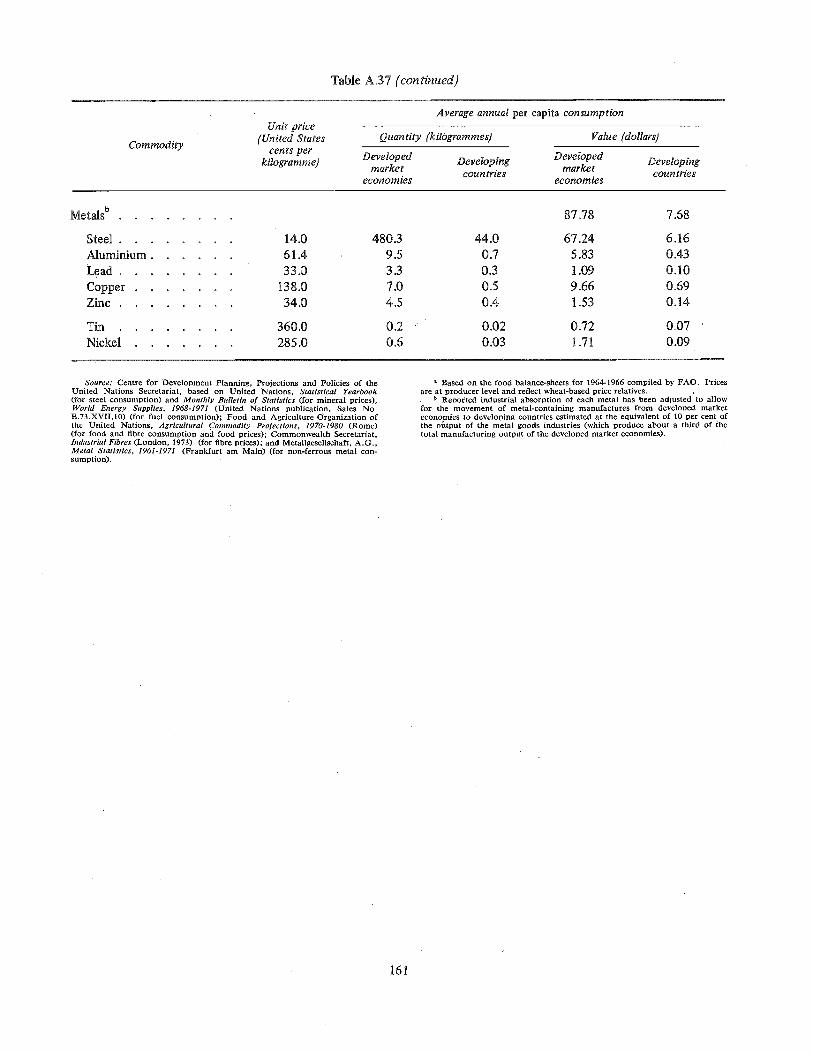
TaNe A.37 (continued)
Average annual per capita consumption
Commodity
Unit price(United States
cents perkilogramme)
Quantity (kilogrammes) Value (dollars)
Developed Developing Developed Developingmarket countries market countries
economies economies
Metalsb ........ 87.78 7.68
Steel ........ 14.0
Aluminium ...... 61.4
Lead ........ 33.0
Copper ....... 138.0
Zinc ........ 34.0
480.3 44.0 67.24 6.169.5 0.7 5.83 0.433.3 0.3 1.09 0.107.0 0.5 9.66 0.694.5 0.4 1.53 0.14
0.20.6
0.02 0.72 0.070.03 1.71 0.09
Tin ........ 360.0
Nickel ....... 285.0
Source: Centre for Development Planning, Projections and Policies of theUnited Nations Secretariat, based on United Nations, Statistical Yearbook(for steel consumption) and Monthly Bulletin of Statistics (for mineral prices),Worm Energy Supplies, 1968-1971 (United Nations publication, Sales No.E.73.XVII.10) (for fuel consumption); Food and Agriculture Organization ofthe United Nations, Agricultural Commodity Pro]ections, 1970-1980 (Rome)(for food and fibre consumption and food prices); Commonwealth Secretariat,Industrial Fibres (London, 1973) (for fibre prices); and Metallgesellschaft, A.G.,Metal Statistics, 1961-1971 (Frankfurt am Main) (for non-ferrous metal con-sumption).
a Based on the food balance-sheets for 1964-1966 compiled by FAO. Pricesare at producer level and reflect wheat-based price relatives.
b Reported industrial absorption of each metal has been adjusted to allowfor the movement of metal-containing manufactures from developed marketeconomies to developing countries estimated at the equivalent of 10 per cent ofthe output of the metal goods industries (which produce about a third of thetotal manufacturing output of the developed market economies).
161
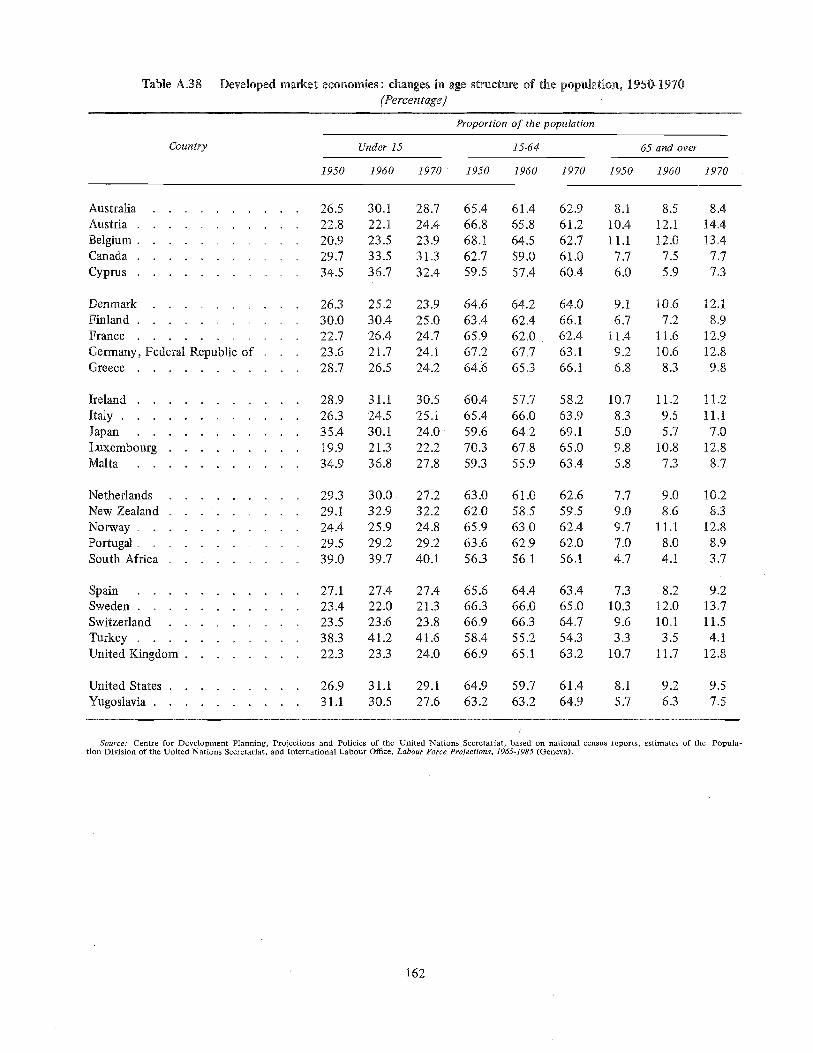
Table A.38
Country
Developed market economies: changes in age structure of the population, 195{)-1970
(Percentage J
Proportion of the population
Under 15 15-64 65 and over
1950 1960 1970 1950 1960 1970 1950 1960 1970
Australia .......... 26.5 30.1 28.7 65.4 61.4 62.9 8.1 8.5 8.4
Austria ........... 2.2.8 22.1 24.4 66.8 65.8 61.2 10.4 12.1 14.4
Belgium ........... 20.9 23.5 23.9 68.1 64.5 62.7 11.1 12.0 13.4
Canada ........... 29.7 33.5 31.3 62.7 59.0 61.0 7.7 7.5 7.7
Cyprus ........... 34.5 36.7 32.4 59.5 57.4 60.4 6.0 5.9 7.3
Denmark .......... 26.3 25.2 23.9 64.6 64.2 64.0 9.1 10.6 12.1
Finland ........... 30.0 30.4 25.0 63.4 62.4 66.1 6.7 7.2 8.9
France ........... 22.7 26.4 24.7 65.9 62.0 62.4 11.4 11.6 12.9
Germany, Federal Republic of . 23.6 21.7 24.1 67.2 67.7 63.1 9.2 10.6 12.8Greece ........... 28.7 26.5 24.2 64.6 65.3 66.1 6.8 8.3 9.8
Ireland ........... 28.9 31.1 30.5 60.4 57.7 58.2 10.7 11.2 11.2
Italy ............ 26.3 24.5 25.1 65.4 66.0 63.9 8.3 9.5 11.1
Japan ........... 35.4 30.1 24.0 59.6 64.2 69.1 5.0 5.7 7.0
Luxembourg ......... 19.9 21.3 22.2 70.3 67.8 65.0 9.8 10.8 12.8
Malta ........... 34.9 36.8 27.8 59.3 55.9 63.4 5.8 7.3 8.7
Netherlands ......... 29.3 30.0 27.2 63.0 61.0 62.6 7.7 9.0 10.2
New Zealand ......... 29.1 32.9 32.2 62.0 58.5 59.5 9.0 8.6 8.3
Norway ........... 24.4 25.9 24.8 65.9 63.0 62.4 9.7 11.1 12.8
Portugal ........... 29.5 29.2 29.2 63.6 62.9 62.0 7.0 8.0 8.9
South Africa ......... 39.0 39.7 40.1 56.3 56.1 56.1 4.7 4.1 3.7
Spain ........... 27.1 27.4 27.4 65.6 64.4 63.4 7.3 8.2 9.2
Sweden ........... 23.4 22.0 21.3 66.3 66.0 65.0 10.3 12.0 13.7
Switzerland ......... 23.5 23.6 23.8 66.9 66.3 64.7 9.6 10.1 11.5Turkey ........... 38.3 41.2 41.6 58.4 55.2 54.3 3.3 3.5 4.1
United Kingdom ........ 22.3 23.3 24.0 66.9 65.1 63.2 10.7 11.7 12.8
United States ......... 26.9 31.1 29.1 64.9 59.7 61.4 8.1 9.2 9.5
Yugoslavia .......... 31.1 30.5 27.6 63.2 63.2 64.9 5.7 6.3 7.5
/
Som'ce: Centre for Develolÿment Planning, Projections and Policies of the United Nations Secretariat, based on national census reports, estimates of the Popula-tion Division of the United Nations Secretariat, and International Labour Office, Labour Force Proiections, 1965~1985 (Geneva).
162
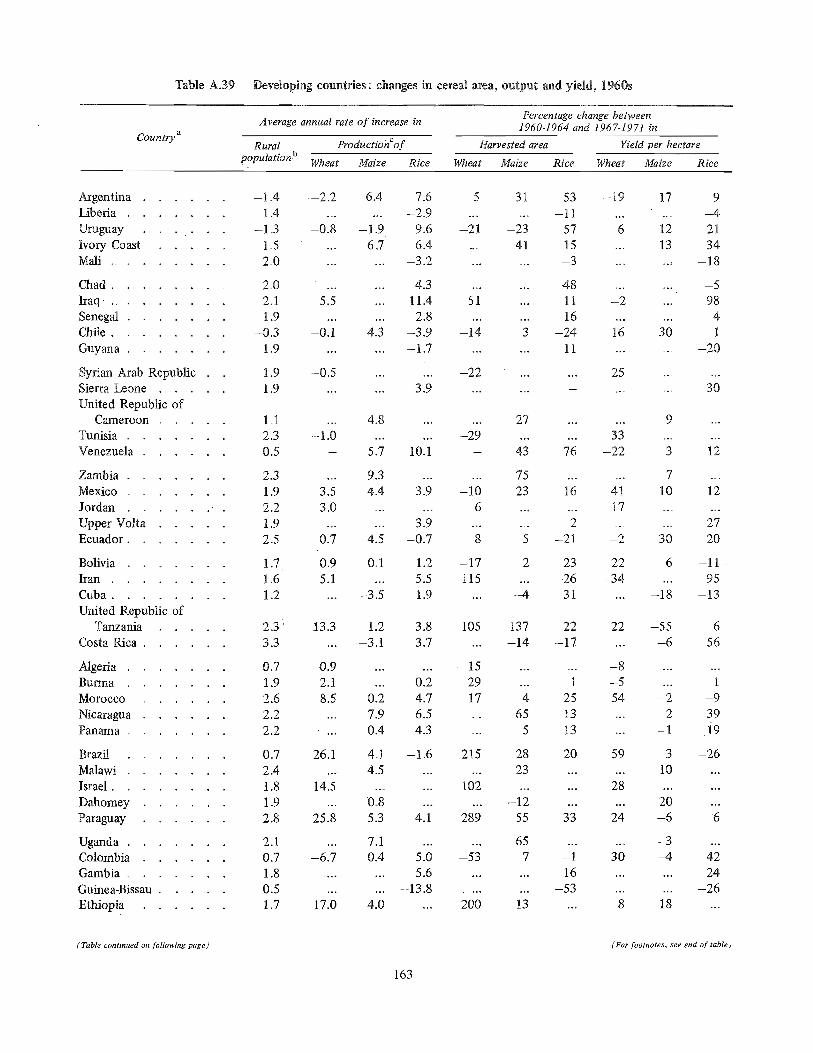
Table A.39 Developing countries: changes in cereal area, output and yield, 196ÿ
CounlTy a
Percentage change betweenAverage annual rate of increase in !960-1964 and 1967-1971 in
Rural ProductionCof Harvested area Yield per hectare
p°pulati°n b Wheat Maize Rice Wheat Maize Rice Wheat Maize Rice
Argentina ...... -1.4 -2.2 6.4 7.6 5 31 53 -19 17 9
Liberia ....... 1.4 ...... -2.9 ...... -11 ...... -4
Uruguay ...... -1.3 -0.8 -1.9 9.6 -21 -23 57 6 12 21
Ivory Coast ..... 1.5 ... 6,7 6.4 ... 41 15 ,.. 13 34
Mall ........ 2.0 ...... -3.2 ...... -3 ...... -18
Chad ........ 2.0 ...
Iraq, . ....... 2,1 5.5
Senegal ....... 1.9 ...
Chile ........ -0.3 -0.1
Guyana ....... 1.9 ...
Syrian Arab Republic . 1.9 -0.5Sierra Leone ..... 1.9 ...
United Republic ofCameroon ..... 1.1 ...
Tunisia ....... 2.3 - 1.0
Venezuela ...... 0.5
... 4.3 ...... 48 ...... , -5
... 11.4 5 ! ... 11 -2 ... 98
... 2.8 ...... 16 ...... 4
4.3 -3.9 -14 3 -24 !6 30 1
... -1.7 ...... 11 ...... -20
...... -22 ...... 25 ......
... 3.9 ...... - ...... 30
Zambia ....... 2,3 ...
Mexico ....... 1.9 3.5
Jordan ....... 2.2 3.0
Upper Volta ..... 1.9 ...
Ecuador ....... 2.5 0.7
Bolivia .......
Iran ........
Cuba ........
United Republic ofTanzania .....
Costa Rica ......
1.71.61.2
2.33.3
Brazil .......
Malawi .......
Israel ........
Dahomey ......
Paraguay ......
Uganda .......
Colombia ......
Gambia .......
Guinea-Bissan .....
Ethiopia ......
0.7
1.92.62.22.2
0.72.41.81.92.8
2.10.71.80.51.7
Algeria .......
Burma .......
Morocco ......
Nicaragua ......
Panama .......
13.3 1.2 3.8 105 137 22 22 -55 6... -3.1 3.7 ... -14 -17 ... -6 56
0.9 ...... 15 ...... -8 ......
2.1 ... 0.2 29 ... 1 -5 ... 1
8.5 0.2 4.7 17 4 25 54 -2 -9
... 7.9 6.5 ... 65 13 ... 2 39
... 0.4 4.3 .., 5 13 ... -1 19
26.1 4.1 -1.6 215 28 20 59 3 -26.... 4.5 ...... 23 ...... 10 ...
14.5 ...... 102 ...... 28 ......
... 0.8 ...... -12 ...... 20 .,.
25.8 5.3 4.1 289 55 33 24 -6 6
... 7.1 ...... 65 ...... -3 ...
-6.7 0.4 5.0 -53 7 -1 30 -4 42
...... 5.6 ...... 16 ...... 24
...... -13.8 ....... -53 ...... -26
17.0 4.0 ... 200 13 ... 8 18 ...
0.95.1
4.8 ...... 27 ...... 9 ...
...... -29 ...... 33 ......
5.7 10.1 - 43 76 -22 3 12
9.3 ...... 75 ...... 7 ...
4.4 3.9 -10 23 16 41 10 12...... 6 ...... 17 ......
... 3.9 ...... 2 ...... 27
4.5 -0.7 8 5 -21 -2 30 20
0.1 1.2 -17 2 23 22 6 -11... 5.5 115 ... -26 -34 ... 95
-3.5 1.9 ... -4 31 ... -18 -13
(Table continued on following page) (For footnotes, see end of table)
163
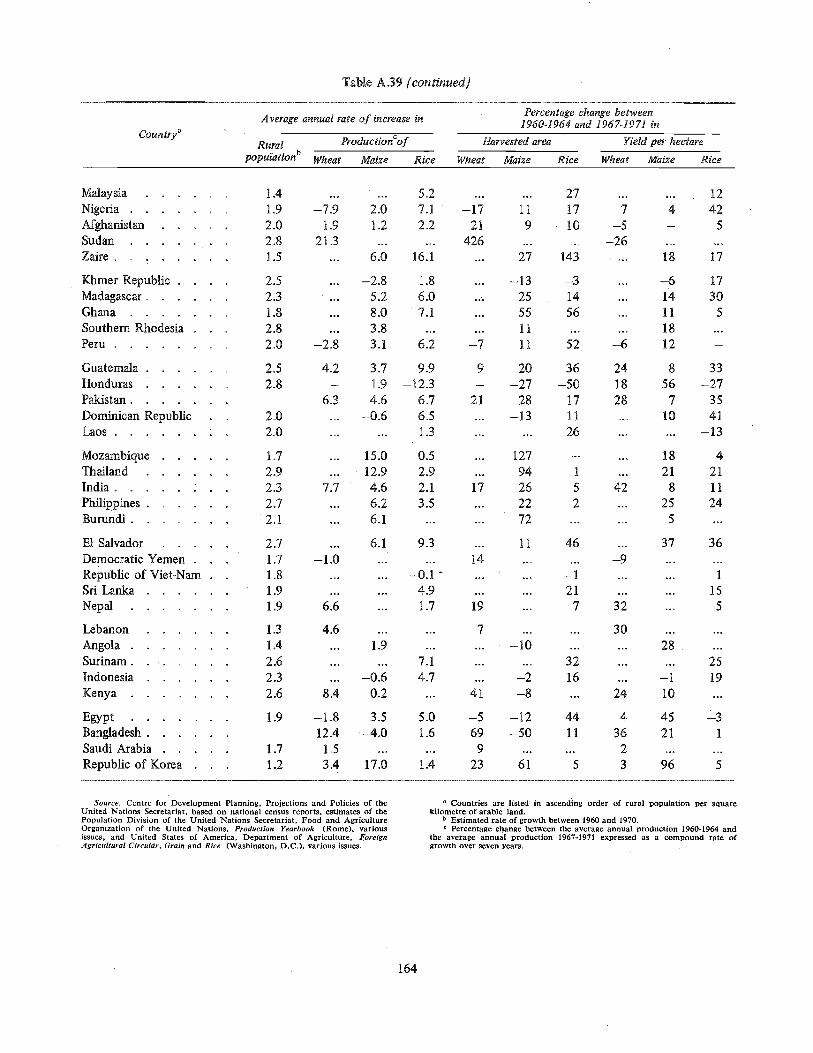
Table A.39 (continued]
CounD'ya
Average annual rate of increase in
Rural Pr°ducti°nC°f
P°Pulati°nb Wheat Maize Rice
Percentage change between1960-1964 and 1967-1971 in
Harvested area Yield per hectarÿ
Wheat Maize Rice Wheat Maize Rice
Malaysia ...... 1.4
Nigeria ....... 1.9
Afghanistan ..... 2.0
Sudan ....... 2.8
Zaire ........ 1.5
...... 5.2
-7.9 2.0 7.1
1.9 1.2 2.221.3 ......
... 6.0 16.1
...... 27 ...... 12
-17 11 17 7 4 4221 9 10 -5 - 5426 ...... -26 ......
... 27 143 ... 18 17
Khmer Republic .... 2.5 ...
Madagascar ...... 2.3 ...
Ghana ....... 1.8 ...
Southern Rhodesia . 2.8 ...Peru ........ 2.0 -2.8
Guatemala ...... 2.5 4.2
Honduras ...... 2.8
Pakistan ....... 6.3
Dominican Republic 2.0 ...Laos ........ 2.0 ...
E1 Salvador ..... 2.7 ...
Democratic Yemen . 1.7 -1.0Republic of VietÿNam . 1.8 ...Sri Lanka ...... 1.9 ...
Nepal ....... 1.9 6.6
Lebanon ...... 1.3 4.6
Angola ....... 1.4 ...
Surinam ....... 2.6 ...
Indonesia ...... 2.3 ...
Kenya ....... 2.6 8.4
Egypt ....... 1.9 -1.8
Bangladesh ...... 12.4
Saudi Arabia ..... 1.7 1.5
Republic of Korea 1.2 3.4
Mozambique ..... 1.7 ...
Thailand ...... 2.9 ...
India 2.3 7.7Philippines ...... 2.7 ...
Burundi ....... 2.1 ...
15.0 0.512.9 2.94.6 2.16.2 3.5
6.1 ...
6.1 9.3
... -0.1 "
... 4.9
... 1.7
1.9 ...
... 7.1
-0.6 4.7
0.2 ...
3.5 5.0-4.0 1.6
17.0 1.4
-2.8 1.8
5.2 6.08.0 7.1
3.8 ...
3.1 6.2
3.7 9.91.9 -12.3
4.6 6.7-0.6 6.5
... 1.3
... -13 -3 ... --6 17
... 25 14 ... 14 30
... 55 56 ... 11 5
... 11 ...... 18 ...
-7 11 52 -6 12 -
9 20 36 24 8 33- -27 -50 18 56 -27
21 28 17 28 7 35... -13 11 ... 10 41
...... 26 ...... -13
... 127 - ... 18 4
... 94 1 ... 21 21
17 26 5 42 8 11... 22 2 ... 25 24
... 72 ...... 5 ...
... 11 46 ... 37 36
14 ...... -9 ......
...... -1 ...... 1
...... 21 ...... 15
19 ... 7 32 ... 5
7 ...... 30 ......
... -10 ...... 28 ...
...... 32 ...... 25
• .. -2 16 ... -1 19
41 -8 ... 24 10 ...
-5 -12 44 4 45 -369 -50 11 36 21 19 ...... 2 ......
23 61 5 3 96 5
Source." Centre for Development Planning, Projections and Policies of theUnited Nations Secretariat, based on national census reports, estimates of thePopulation Division of the United Nations Secretariat, Food and AgricultureOrganization of the United Nations, Production Yearbook (Rome), variousissues, and United States of America, Department of Agriculture, ForeignAgricultural Circulcir, Grain and Rice (Washington, D.C.), various issues.
a Countries are listed in ascending order of rural population per squarekilometre of arable land.
a Estimated rate of growth between 1960 and 1970.c Percentage change between the average annual production 1960-1964 and
the average annual production 1967-1971 expressed as a compound rate ofgrowth over seven years.
164
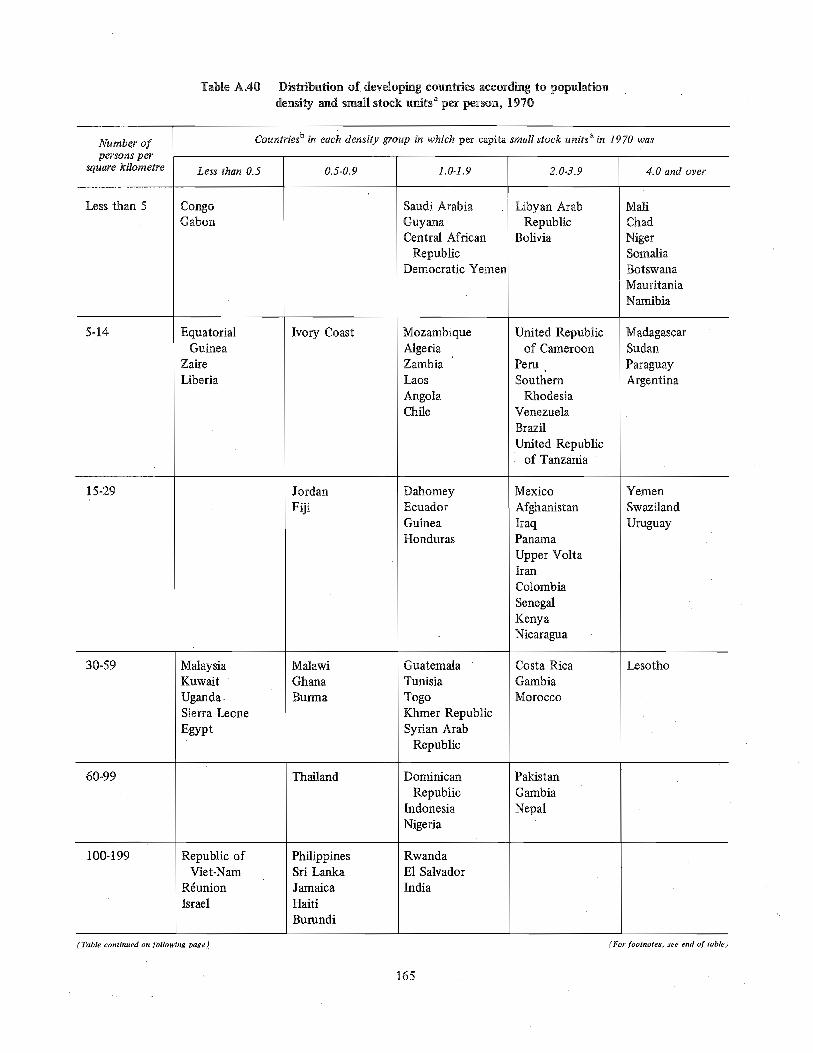
Table A.40 Distribution of develophag countries according to populationdensity and small stock unitsa per person, 1970
Numbe, r of Countriesb in each density group in which per capita small stock unitsa in 1970 was
persons per
square kilometre Less than 0.5 0.5-0,9 1.0-1.9 2.0-3.9 4.0 and over
Less than 5 CongoGabon
Saudi ArabiaGuyanaCentral African
RepublicDemocratic Yemen
Libyan ArabRepublic
Bolivia
60-99
100-199
30-59
15-29
MalaysiaKuwaitUgandaSierra Leone
Egypt
Republic ofViet-Nam
RÿunionIsrael
Ivory Coast
JordanFÿi
MalawiGhanaBurma
Thailand
PhilippinesSri LankaJamaica
HaitiBurundi
EquatorialGuinea
ZaireLiberia
MozambiqueAlgeriaZambiaLaos
AngolaChile
DahomeyEcuadorGuineaHonduras
GuatemalaTunisiaTogoKhmer RepublicSyrian Arab
Republic
Dominican
RepublicIndonesia
Nigeria
RwandaE1 SalvadorIndia
5-14 United Republicof Cameroon
Peru,
SouthernRhodesia
VenezuelaBrazilUnited Republic
of Tanzania
MexicoAfghanistanIraqPanamaUpper VoltaIranColombiaSenegalKenyaNicaragua
Costa RicaGambiaMorocco
PakistanGambiaNepal
MarlChadNigerSomaliaBotswanaMauritaniaNamibia
MadagascarSudanParaguayArgentina
YemenSwazilandUruguay
Lesotho
(Table continued on following page) (For footnotes, see end of table)
165

Table A.40 (continued)
Number of Countriesb in each density group in which per capita small stock unitsa in 1970 was
persons persquare kilometre Less than 0.5 0.5-0.9 1.0-1.9 2.0-3.9 4.0 and over
200 and over Hong KongSingaporeRepublic of
KoreaTrinidad and
TobagoMauritiusLebanon
MartiniqueBarbadosBangladesh
Source: Centre for Development Planning, Projections and Policies of theUnited Nations Secretariat, based on national census reports, estimates of thePopulation Division of the United Nations Secretariat, and Food and AgricultureOrganization of the United Nations, Production Yearbook (Rome).
a The number of small stock units is derived by adding together sheep (witha weight of 1), goats (with a weight of 2) and cattle and buffalo (with a weight of 3).
Within each group, countries are listed in ascending order of livestockdensity.
166
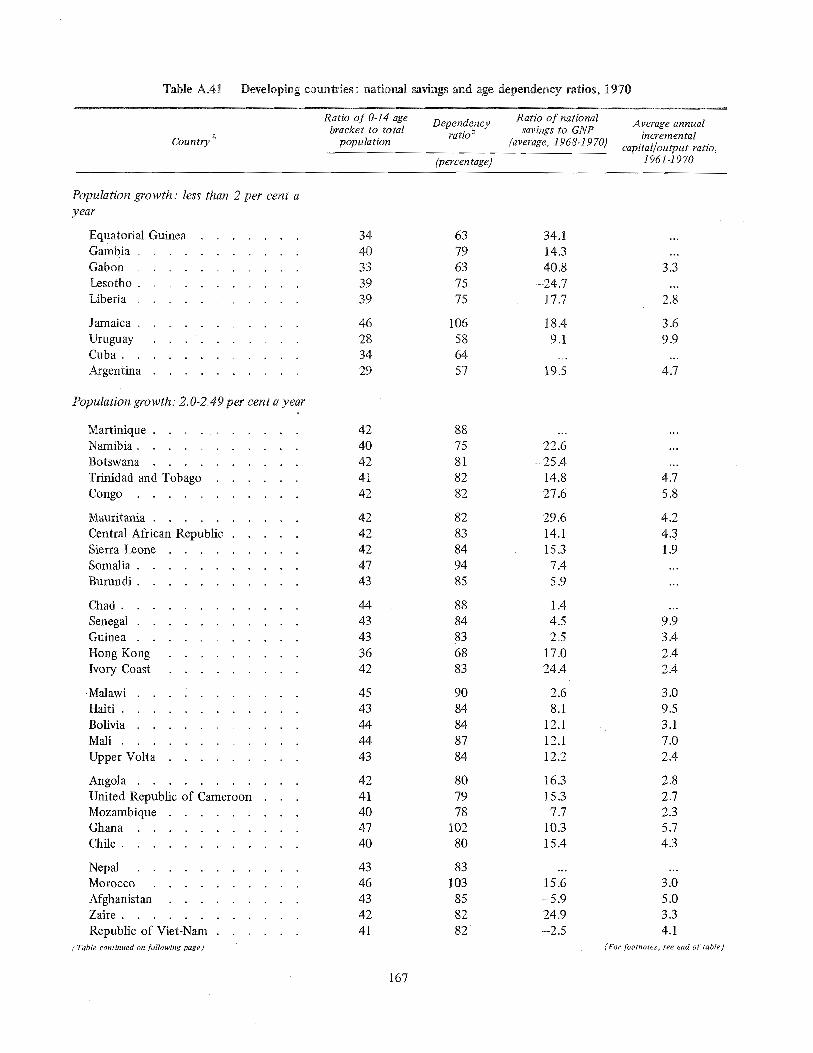
Table A.41 Developing countries: national savings and age dependency ratios, 1970
Ratio of 0-14 agebracket to total
Country a population
Ratio of nationalDependency
ratiob savings to GNP[average, 1968-1970)
(percentage)
Average annualincremental
capital/output ratio,i961-1970
Population growth." less than 2 per cent a
year
Equatorial Guinea .......
Gambia ...........
Gabon ...........
Lesotho ...........
Liberia ...........
Jamaica ...........
Uruguay ..........
Cuba ............
Argentina ..........
3440333939
46283429
6379637575
106586457
34.114.3
40.8-24.7
17.7
18.49.1
19.5
Chad ............
Senegal ..........
Guinea ...........
Hong Kong .........
Ivory Coast .........
Malawi ..........
Haiti ............
Bolivia ...........
Mali ...........
Upper Volta .........
Angola ..........
United Republic of CameroonMozambique .........
Ghana ...........
Chile ............
Nepal ...........
Morocco ..........
Afghanistan .........
Zaire ............
Republic of Viet-Nam ......
(Table continued on following page)
424O424142
4242424743
4443433642
4543444443
4241404740
4346434241
Martinique ..........
Namibia ...........
Botswana ..........
Trinidad and Tobago ......
Congo ...........
Mauritania ..........
Central African Republic .....
Sierra Leone .........
Somalia ...........
Burundi ...........
8875818282
8283849485
8884836883
9O84848784
807978
10280
83103858282
Population growth." 2.0-2.49 per cent a year
22.6-25.4
14.827.6
29.614.11537.4
5.9
1.44.5
2.517.024.4
2.68.1
12.112.112.2
16.3
15.37.7
10.315.4
15.6-5.9
24 ÿ9-2.5
3.3
2.8
3.69.9
4.7
..°
4.75,8
4.24.3
1.9
9.93.42.42.4
3.09.53.17.02.4
2.82.72.35.74.3
3.05.03.34.1
(For footnotes, see end of table)
167
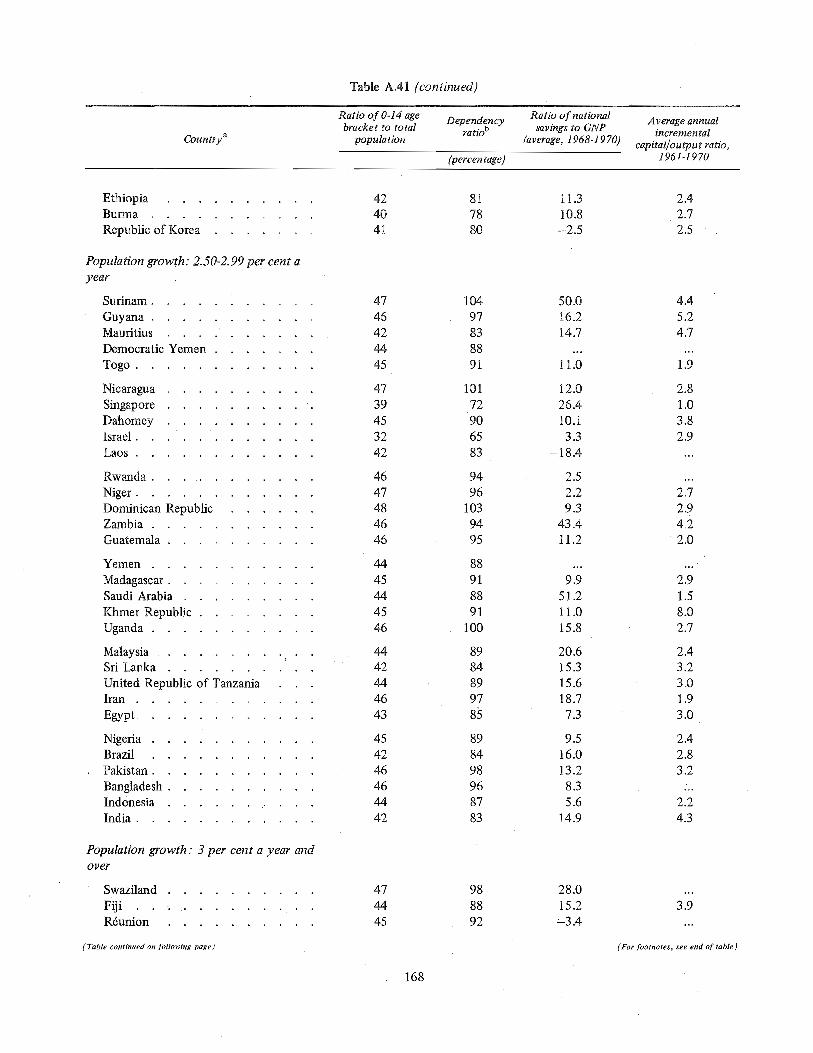
Table A.41 (continued)
Countrya
Ratio of 0-14 age Dependencybracket to total ratiob
population
Ratio of nationalsavings to GNP
'average, 1968-1970)
(percen rage)
Average annualincremental
capita!/ou&ut ratio,196!-1970
Ethiopia .......... 42 81
Burma ........... 40 78
Republic of Korea ....... 41 80
11.310.8-2.5
2.42.72.5
47 104 50.0 4.446 97 16.2 5.242 83 14.7 4.744 88 ......
45 91 11.0 1.9
Population growth: 3 per cent a year andol2er
Swaziland .......... 47 98 28.0
Fiji ............ 44 88 15.2
Rÿunion .......... 45 92 -3.4
(Table continued on following page)
Yemen ...........
Madagascar ..........
Saudi Arabia .........
Khmer Republic ........
Uganda ...........
Malaysia ..........
Sri Lanka ..........
United Republic of TanzaniaIran ............
Egypt ...........
Nigeria ...........
Brazil ...........
Pakistan ...........
Bangladesh ..........
Indonesia ..........
India . ...........
Rwanda ...........
Niger ............
Dominican Republic ......
Zambia ...........
Guatemala ..........
46 94 2.5 ...
47 96 2.2 2.748 103 9.3 2.946 94 43.4 4.246 95 11.2 2.0
44 88 ......
45 91 9.9 2.944 88 51.2 1.545 91 11.0 8.046 100 15.8 2.7
44 89 2O.6 2.442 84 ! 5.3 3.244 89 15.6 3.046 97 18.7 1.943 85 7.3 3.0
45 89 9.5 2.442 84 16.0 2.846 98 13.2 3.246 96 8.3 :..44 87 5.6 2.242 83 14.9 4.3
47 101 12.0 2.839 72 26.4 1.045 90 10.1 3.832 65 3.3 2.942 83 -18.4 ...
Population growth: 2.50-2.99 per cent a
year
Surinam ...........
Guyana ...........
Mauritius .... ......
Democratic Yemen .......
Togo ............
Nicaragua ..........
Singapore ..........
Dahomey .... ......
Israel ............
Laos ............
...
3.9
(For footnotes, see end of table)
168
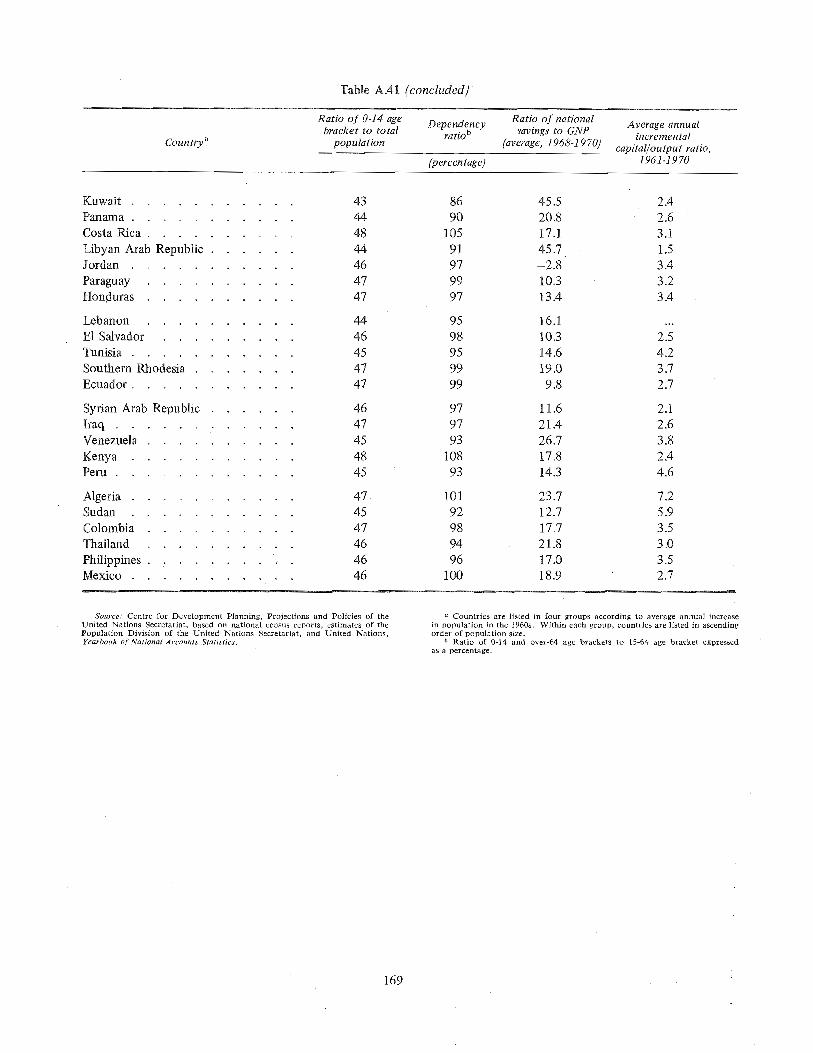
Table A,41 (concluded]
Countrya
Ratio of 0-14 agebracket to total
population
Ratio of nationalDependency savings to GNP
ra riob(average, 1968-1970)
(percentage)
Average annualincremental
capital/output ratio,1961-1970
Kuwait ...........
Panama ...........
Costa Pica ..........
Libyan Arab Republic ......
Jordan ...........
Paraguay ..........
Honduras ..........
43 86 45.5 2.444 90 20.8 2.648 105 17.1 3.144 91 45.7 1.546 97 -2.8 3.4
47 99 10.3 3.247 97 13.4 3.4
Lebanon ..........
E1 Salvador .........
Tunisia ...........
Southern Rhodesia .......
Ecuador ...........
44 95 16.1 ...
46 98 !0.3 2.545 95 14.6 4.247 99 19.0 3.747 99 9.8 2.7
Syrian Arab Republic ...... 46 97 11.6 2.147 97 21.4 2.6Iraq ...........
Venezuela .......... 45 93 26.7 3.8
48 108 !7.8 2.4Kenya ...........45 93 14.3 4.6Peru ...........
Algeria ...........
Sudan ...........
Colombia ..........
Thailand ..........
Philippines ..........
Mexico ...........
47, 101 23.7 7.245 92 12.7 5.947 98 17.7 3.546 94 21.8 3.046 96 17.0 3.546 100 18.9 2.7
Source: Centre for Development Planning, Projections and Policies of theUnited Nations Secretariat, based on national census reports, estimates of thePopulation Division of the United Nations Secretariat, and United Nations,Yearbook of National Accounts Statistics.
a Countries are listed in four groups according to average annual increasein population in the 1960s. Within each group, countries are listed in ascendingorder of population size.
Ratio of 0-14 and over-64 age brackets to 15-64 age bracket expressedas a percentage.
169
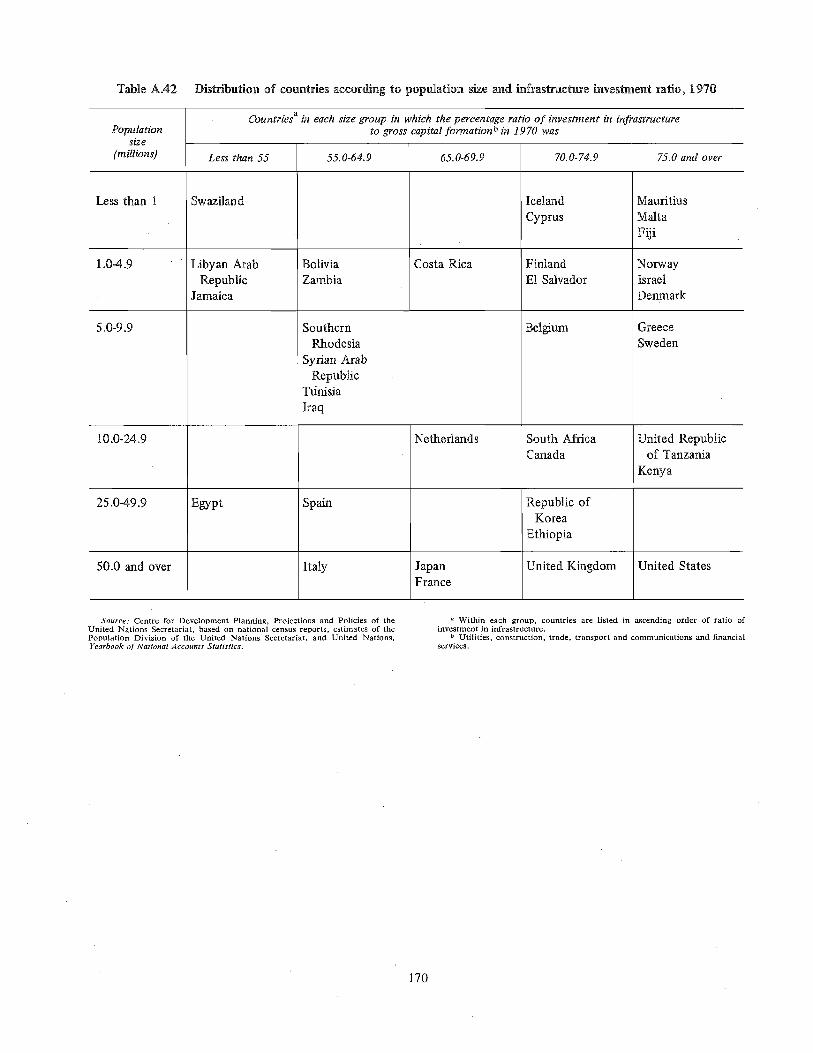
Table A.42 Distribution of countries according to populafian size and infrastructure investment ratio, 1970
Countriesa in each size group in which the percentage ratio of investment in infrastructurePopulation to gross capital formationb in 1970 was
size
[millions) Less than 55 55.0-64.9 65.0-69.9 70.0-74.9 75.0 and over
Less than 1 Swaziland IcelandCyprus
Mauritius
MaltaFiji
25.0-49.9
50.0 and over
10.0-24.9
5.0-9.9
Egypt
BoliviaZambia
SouthernRhodesia
Syrian ArabRepublic
TfinisiaIraq
Spain
Italy
Costa Rica
Netherlands
JapanFrance
Libyan ArabRepublic
Jamaica
FinlandE1 Salvador
Belgium
South AfficaCanada
Republic ofKorea
Ethiopia
United Kingdom
1.0-4.9 NorwayIsraelDenmark
GreeceSweden
United Republicof Tanzania
Kenya
United States
Source: Centre for Development Planning, Projections and Policies of theUnited Nations Secretariat, based on national census reports, estimates of thePopulation Division of the United Nations Secretariat, and United Nations,Yearbook of National Accounts Statistics.
Within each group, countries are listed in ascending order of ratio ofinvestment in infrastructure.
b Utilities, construction, trade, transport and communications and financialservices.
170
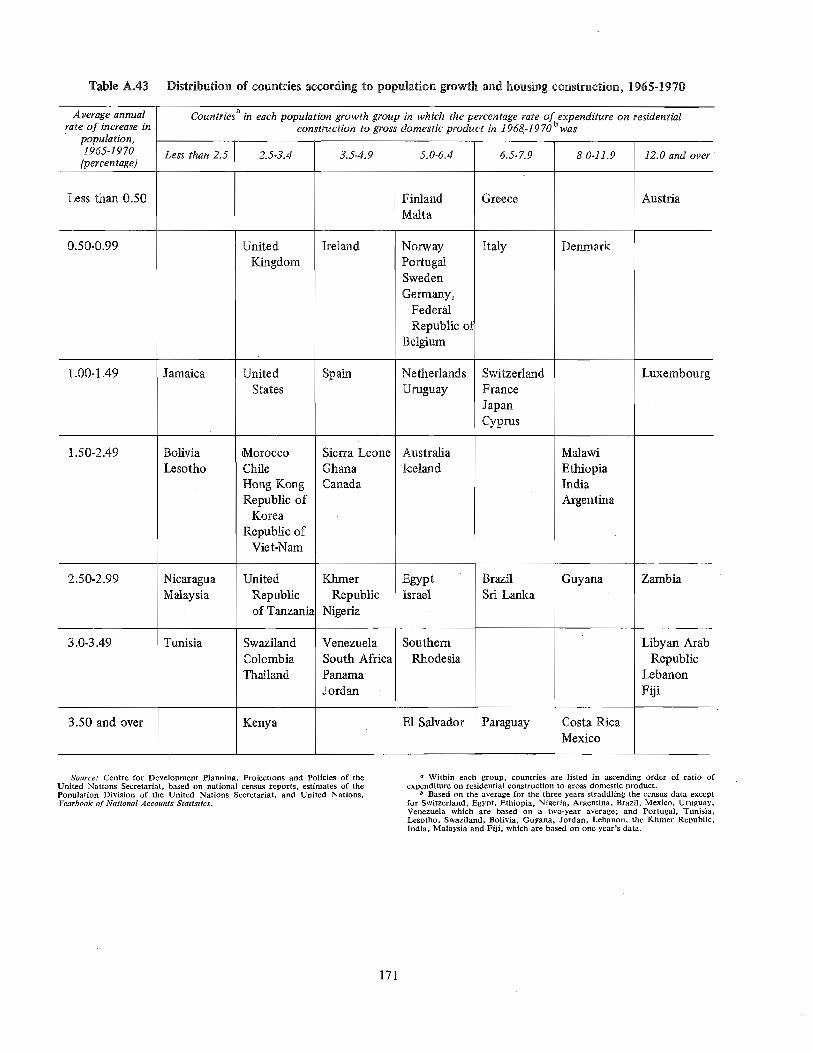
Table A.43 Distribution of countries according to population growth and housing construction, 1965-1970
Average annual Countriesa in each population growth group in which the percentage rate ofbexpenditure on residentialrate of increase in construction to gross domestic product in 1968-1970 was
population,
1965-1970 Less than 2.5 2.5-3.4 3.5-4.9 5.0-6.4 6.5-7.9 8.0-11.9 12.0 and over(percentage)
Less than 0.50 Finland Greece AustriaMalta
0.50-0.99 Ireland Italy DenmarkUnitedKingdom
NorwayPortugalSwedenGermany,
FederalRepublic ot
Belgium
1.00-1.49
3.0-3.49
3.50 and over
2.50-2.99
BoliviaLesotho
NicaraguaMalaysia
Tunisia
1.50-2.49
UnitedStates
MoroccoChileHong KongRepublic of
KoreaRepublic of
Viet-Nam
UnitedRepublicof Tanzania
SwazilandColombiaThailand
Kenya
Spain
Sierra LeoneGhanaCanada
Khlner
RepublicNigeria
VenezuelaSouth AfricaPanamaJordan
Jamaica NetherlandsUruguay
AustraliaIceland
EgyptIsrael
SouthemRhodesia
E1 Salvador
SwitzerlandFrance
JapanCyprus
BrazilSri Lanka
Paraguay
MalawiEthiopiaIndiaArgentina
Guyana
Costa RicaMexico
Luxembourg
Zambia
Libyan ArabRepublic
Lebanon
Fiji
Source." Centre for Development Planning, Projections and Policies 'of theUnited Nations Secretariat, based on national census reports, estimates of thePopulation Division of the United Nations Secretariat, and United Nations,Yearbook of National Accounts Statistics.
a Within each group, countries are listed in ascending order of ratio ofexpenditure on residential construction to gross domestic product.
Based on the average for the three years straddling the census data exceptfor Switzerland, Egypt, Ethiopia, Nigeria, Argentina, Brazil, Mexico, Uruguay,Venezuela which are based on a two-year average; and Portugal, Tunisia,Lesotho, Swaziland, Bolivia, Guyana, Jordan, Lebanon, the Khmer Republic,India, Malaysia and Fiji, which are based on one year's data.
171
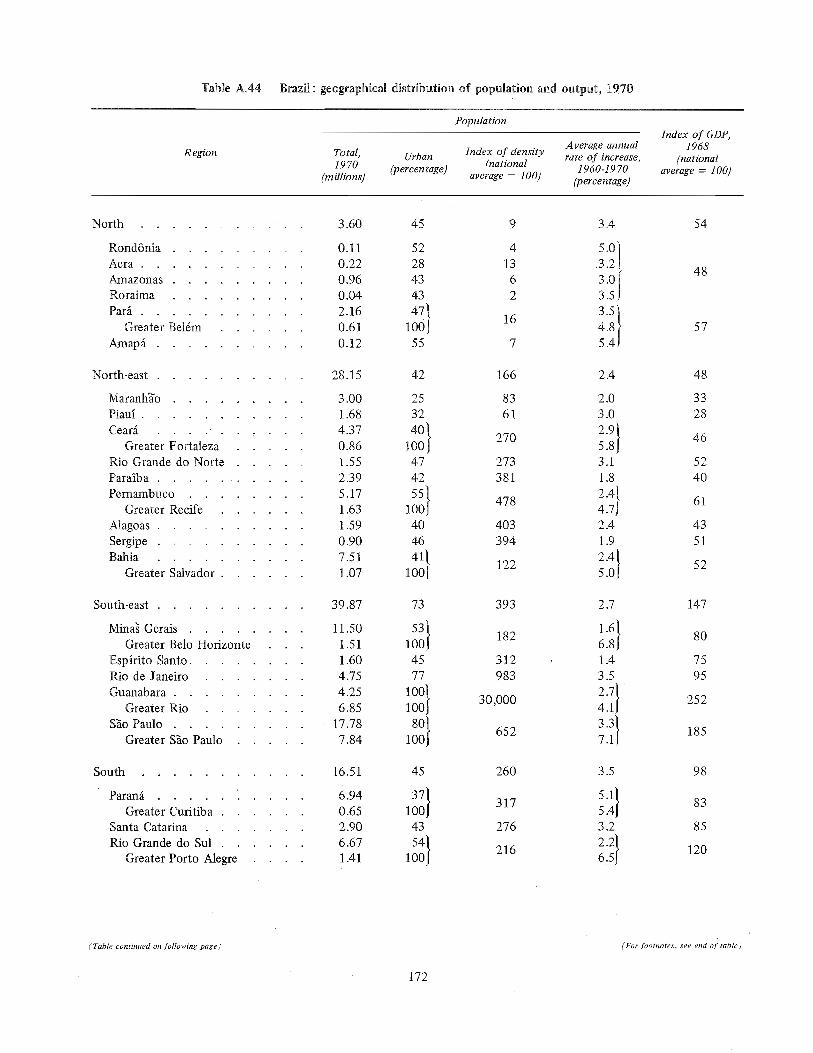
Table A.44 Brazil: geographical distribution of population and output, 1970
Population
Region
Index of GDP,Total, Urban Index of density Average annual 1968
rate of increase, (national1970 (percentage) (national 1960-1970 average = 100)
(millions) average = 100} (percentage)
North ........... 3.60 45 9 3.4
Rond6nia ......... 0.11 52 4 5.0
........... 3.2Acra 0.22 28 13Amazonas ......... 0.96 43 6 3.0
Roraima ......... 0.04 43 2 3.5
........... 3.5}Parfi 2.16 47 164£Greater Belÿm ...... 0.61 100
Amapfi .......... 0.12 55 7 5.4
54
48
57
North-east ..........
Maranhÿo .........
Piaul ...........
Cearÿi ..........
Greater Fortaleza .....
Rio Grande do Norte .....
Paraiba ...........
Pernambuco ........
Greater Recife ......
Alagoas ..........
Sergipe ..........
Bahia ..........
Greater Salvador ......
South-east .......... 39.87 73 393 2.7
South ........... 16.51 45 260 3.5
Paranÿi ..........
Greater Curitiba ......
Santa Catarina .......
Rio Grande do Sul ......
Greater Porto Alegre ....
Mina; Gerais ........ 11.50 53} 182 1"6/Greater Belo Horizonte 1.51 100 6.8
Espirito Santo ........ 1.60 45 312 1.4
Rio de Janeiro ....... 4.75 77 983 3.5
Guanabara ......... 4,25 100/ 2.7}Greater Rio ....... 6.85 100] 30,000 4.1
Sÿo Paulo ......... 17.78 80/ 652 3.3}Greater Sÿo Paulo ..... 7.84 100 7.1
6.94 37} 317 5'1/ 830.65 100 5.42.90 43 276 3.2 85
6.67 54} 216 2"2/1.41 100 6.5 120
28.15 42 166 2.4 48
3.00 25 83 2.0 331.68 32 61 3.0 28
4.37 40 270 460.86 100 5.81.55 47 273 3.1 522.39 42 381 1.8 40
5.17 55} 478 2"41 611.63 100 4.71.59 40 403 2.4 430.90 46 394 1.9 51
/7.51 41 521.07 100 122 5.0
147
8O
7595
252
185
98
(Table continued on following page) (For footnotes, see end of table)
172
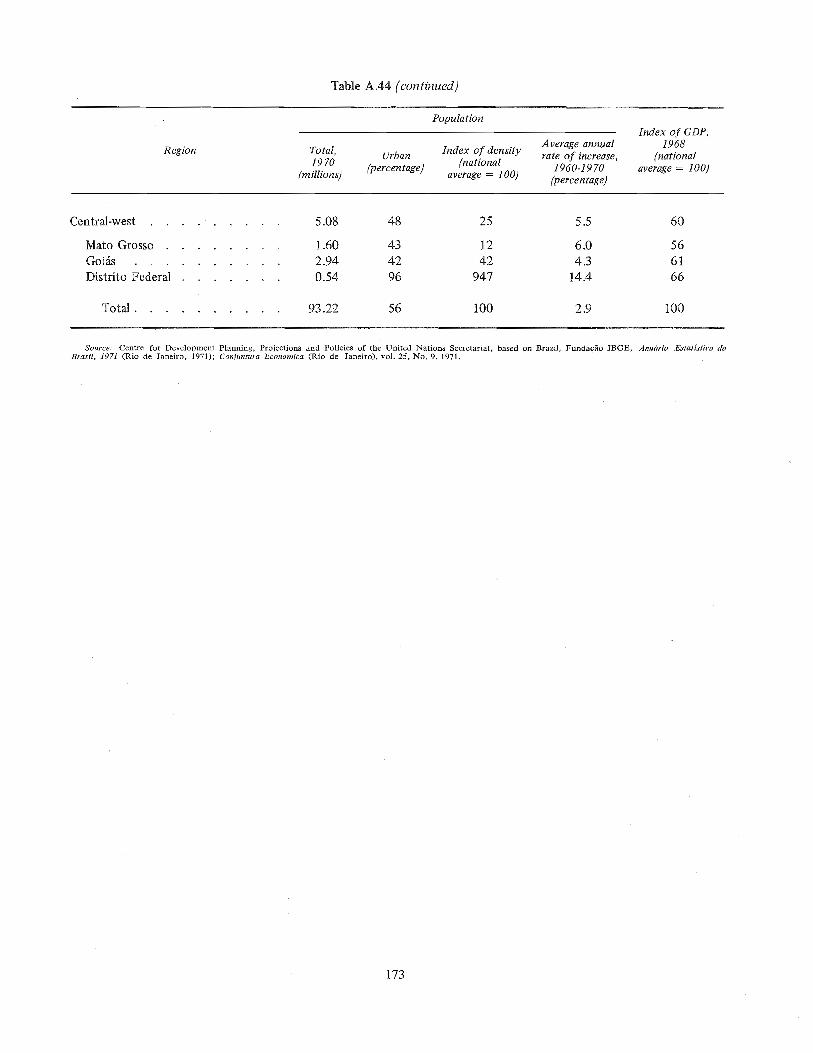
Table A.44 (continued)
Population
Region
Index of GDP,Total, Urban Index of density Average annual 19681970 (national rate of increase, (national
1960-1970 average = 100)(millions) (percentage) average = 100) (percentage)
Central-west ......... 5.08 48 25 5.5 60
Mato Grosso ........ 1.60 43 12 6.0 56
Goifis .......... 2.94 42 42 4.3 61
Distrito Federal ....... 0.54 96 947 14.4 66
TotN .......... 93.22 56 100 2.9 100
Source." Centre for Development Planning, Projections and Policies of the United Nations Secretariat, based on Brazil, Fundacÿo IBGE, Anu6rio Estatistico doBrasil, J971 (Rio de Janeiro, 1971); Coniuntura Economica (Rio de Janeiro), vol. 25, No. 9, 1971.
173
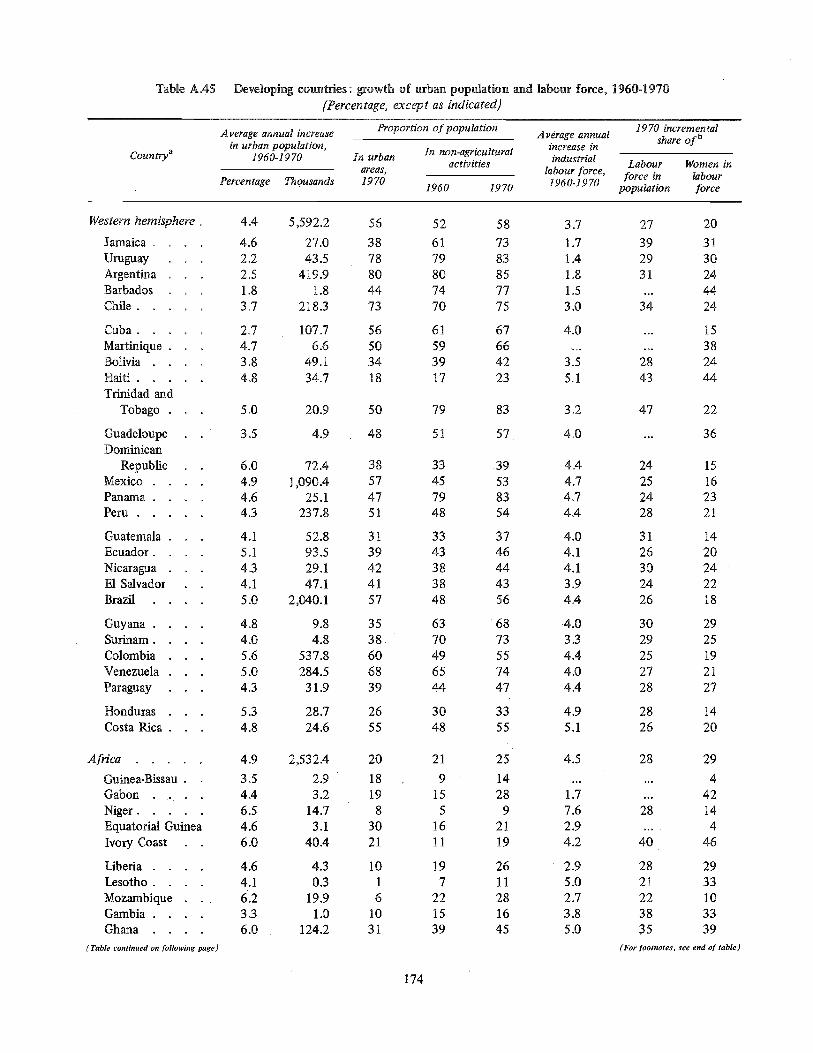
Table A.45 Developing countries: growth of urban population and labour force, 1960-1970(Percentage, except as indicated)
Countrya
Average annual increase Proportion of population Average annual
in urban population, increase in1960-!970 In urban In non-agricultura!
activities industrialareas, labour force,
Percentage Thousands 1970 !960 1970 1960-1970
!970 incrementalshare ofb
Labour Women inforce in labour
population force
Western hemisphere. 4.4
Jamaica .... 4.6
Uruguay 2.2Argentina 2.5Barbados 1.8Chile ..... 3.7
5,592.2 56 52 58 3.7 27 20
27.0 38 61 73 1.7 39 3143.5 78 79 83 1.4 29 30
419.9 80 80 85 1.8 31 241.8 44 74 77 1.5 ... 44
218.3 73 70 75 3.0 34 24
Cuba ..... 2.7
Martinique . 4.7Bolivia .... 3.8
Haiti ..... 4.8
Trinidad andTobago . 5.0
Guadeloupe 3.5Dominican
Republic 6.0Mexico .... 4.9
Panama .... 4.6
Peru ..... 4.3
107.7 56 61 67 4.0 ...6.6 50 59 66 ......
49.1 34 39 42 3.5 2834.7 18 17 23 5.1 43
20.9 50 79 83 3.2 47
4.9 48 51 57 4.0 ...
72.4 38 33 39 4.4 241,090.4 57 45 53 4.7 25
25.1 47 79 83 4.7 24237.8 51 48 54 4.4 28
15382444
52.8 31 33 37 4.0 31 1493.5 39 43 46 4.1 26 2029.1 42 38 44 4.1 30 2447.1 41 38 43 3.9 24 22
2,040.1 57 48 56 4A 26 18
Guyana .... 4.8
Surinam .... 4.0
Colombia 5.6Venezuela . 5.0
Paraguay 4.3
Honduras 5.3Costa Rica . 4.8
9.8 35 63 68 4.0 30 294.8 38 70 73 3.3 29 25
537.8 60 49 55 4.4 25 19284.5 68 65 74 4.0 27 2131.9 39 44 47 4.4 28 27
28.7 26 30 33 4.9 28 1424.6 55 48 55 5.1 26 20
Guatemala . 4.1Ecuador .... 5.1
Nicaragua 4.3E1 Salvador 4.1Brazil .... 5.0
22
36
15162321
Africa ..... 4.9
Guinea-Bissau . 3.5Gabon .... 4.4
Niger ..... 6.5
Equatorial Guinea 4.6Ivory Coast 6.0
Liberia .... 4.6
Lesotho .... 4.1
Mozambique 6.2Gambia .... 3.3
Ghana .... 6.0
(Table continued on following page)
2,532.4 20 21 25 4.5 28 292.9 18 9 14 ...... 4
3.2 19 15 28 1.7 ... 4214.7 8 5 9 7.6 28 143.1 30 16 21 2.9 ... 4
40.4 21 11 19 4.2 40 46
4.3 10 19 26 2.9 28 290.3 1 7 11 5.0 21 33
19.9 6 22 28 2.7 22 101.0 10 15 16 3.8 38 33
124.2 31 39 45 5.0 35 39(For ÿomotes, see end ÿ tabÿ)
174
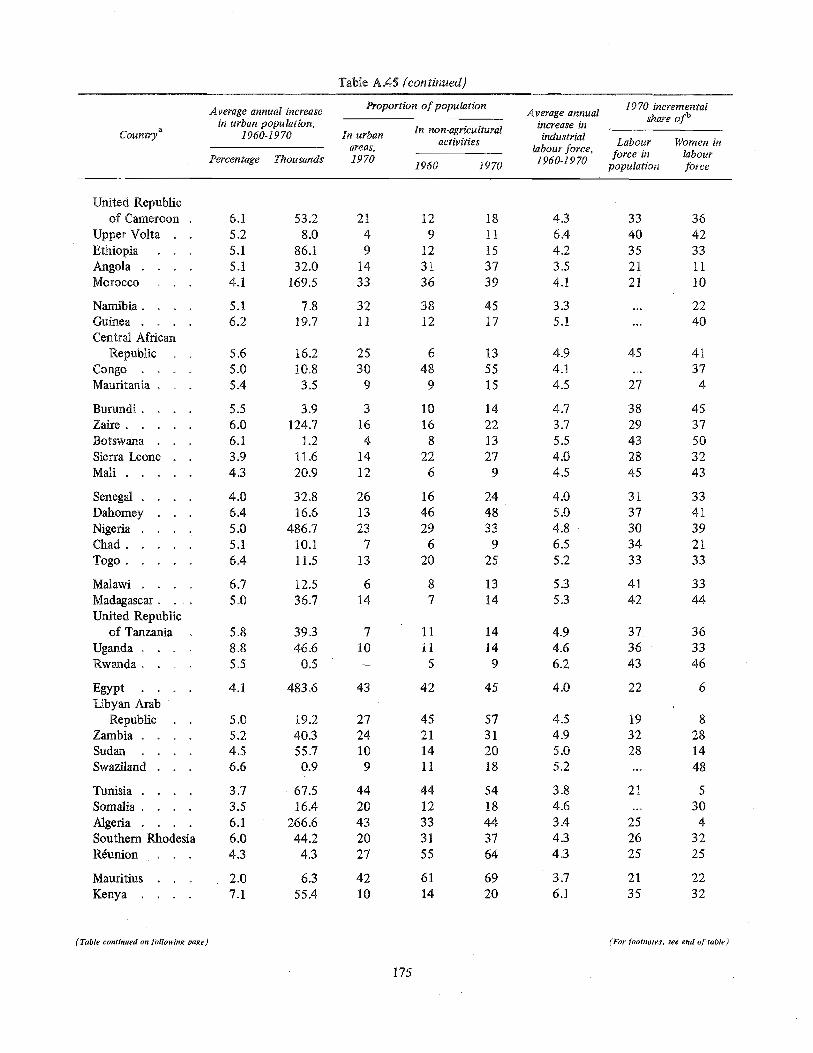
Table A.45 (continued]
Countrya
Average annual increasein urban population,
1960-1970
Percentage Thousands
Senegal .... 4.0 32.8
Dahomey 6.4 16.6Nigeria . . . . 5.0 486.7Chad ..... 5.1 10.1
Togo ..... 6.4 11.5
Malawi .... 6.7 12.5 6Madagascar. 5.0 36.7 14United Republic
of Tanzania 5.8 39.3 7Uganda .... 8.8 46.6 10Rwanda .... 5.5 0.5 -
Egypt .... 4.1 483.6 43 42 45 4.0 22 6Libyan Arab
Republic 5.0 19.2 27 45 57 4.5 19 8Zambia .... 5.2 40.3 24 21 31 4.9 32 28Sudan .... 4.5 55.7 10 14 20 5.0 28 14Swaziland 6.6 0.9 9 11 18 5.2 ... 48
Tunisia .... 3.7 67.5 44 44 54 3.8 21 5Somalia .... 3.5 16.4 20 12 18 4.6 ... 30Algeria .... 6.1 266.6 43 33 44 3.4 25 4Southern Rhodesia 6.0 44.2 20 31 37 4.3 26 32R6union 4.3 4.3 27 55 64 4.3 25 25
Mauritius 2.0 6.3 42 61 69 3.7 21 22Kenya .... 7.1 55.4 10 14 20 6.1 35 32
Burundi .... 5.5 3.9 3 10 14 4.7 38 45Zaire ..... 6.0 124.7 16 16 22 3.7 29 37Botswana 6.1 1.2 4 8 13 5.5 43 50Sierra Leone 3.9 11.6 14 22 27 4.0 28 32Mali ..... 4.3 20.9 12 6 9 4.5 45 43
Namibia .... 5.1 7.8 32 38 45 3.3 ... 22Guinea .... 6.2 19.7 11 12 17 5.! ... 40Central African
Republic 5.6 16.2 25 6 13 4.9 45 41Congo .... 5.0 10.8 30 48 55 4.1 ... 37Mauritania . 5.4 3.5 9 9 15 4.5 27 4
United Republicof Cameroon 6.1 53.2 21 12 18 4.3 33 36
Upper Volta 5.2 8.0 4 9 11 6.4 40 42Ethiopia 5.1 86.1 9 12 15 4.2 35 33Angola .... 5.1 32.0 14 31 37 3.5 21 11Morocco 4.1 169.5 33 36 39 4.1 21 10
Proportion of population
In urbanareas,2970
In non-agriculturalactivities
1960 1970
Average annualincrease inindustrial
labour force,1960-1970
26 16 24 4.0 31 3313 46 48 5.0 37 4123 29 33 4.8 30 397 6 9 6.5 34 21
13 20 25 5.2 33 33
87
11 14 4.9 37 3611 14 4.6 36 335 9 6.2 43 46
13 5.3 41 3314 5.3 42 44
1970 incrementalshare ofu
Labour Women inforce in labour
population force
(Table continued on following page) (For footnotes, see end of table)
175
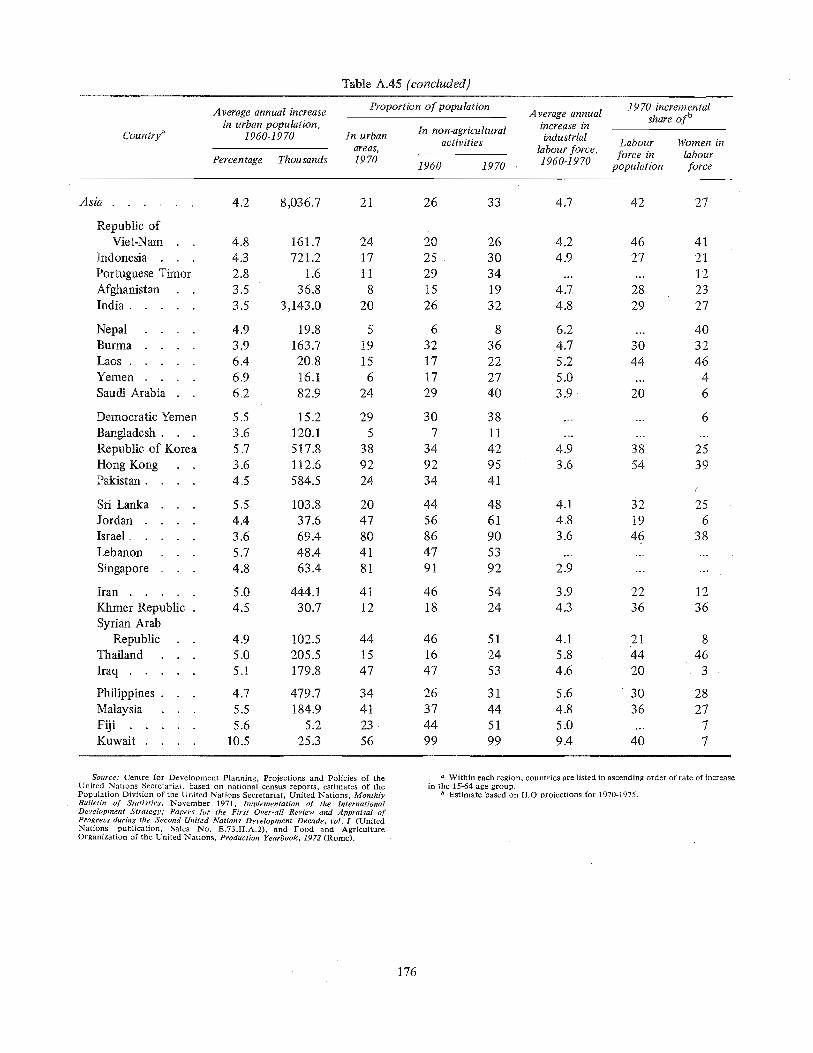
Table A.45 (concluded)
Average annual increase
in urban population,Countrya 1960-1970 In urban
areas,Percen rage Thou sands 19 70
Proportion of population
In non-agriculturalactivities
1960 1970 .
1970 incrementalAverage annual share ofb
increase in
industrial Labour Women inlabour force, force in labour1960-1970 population force
Asia ...... 4.2 8,036.7 21 26 33 4.7 42 27
Republic ofViet-Nam 4.8 161.7 24
Indonesia 4.3 721.2 17Portuguese Timor 2.8 1.6 11Afghanistan 3.5 36.8 8India ..... 3.5 3,143.0 20
20 26 4,2 46 4125. 30 4.9 27 2129 34 ...... 12
15 19 4.7 28 2326 32 4.8 29 27
Nepal .... 4.9 19.8 5
Burma .... 3.9 163.7 19
Laps ..... 6.4 20.8 15
Yemen .... 6.9 16.1 6
Saudi Arabia 6.2 82.9 24
Sri Lanka 5.5 103.8 20Jordan .... 4.4 37.6 47
Israel ..... 3.6 69.4 80
Lebanon 5.7 48.4 41
Singapore 4.8 63.4 81
Iran ..... 5.0 444.1 41
Khmer Republic . 4.5 30.7 12Syrian Arab
Republic 4.9 102.5 44Thailand 5.0 205.5 15Iraq ..... 5.1 179.8 47
Philippines . 4.7 479.7 34Malaysia 5.5 184.9 41Fiji ..... 5.6 5.2 23
Kuwait .... 10.5 25.3 56
Democratic Yemen 5.5 15.2 29Bangladesh . 3.6 120.1 5Republic of Korea 5.7 517.8 38Hong Kong 3.6 112.6 92Pakistan .... 4.5 584.5 24
6 8 6.2 ... 40
32 36 4.7 30 3217 22 5.2 44 4617 27 5.0 ... 429 40 3.9 20 6
30 38 ...... 6
7 11 .........
34 42 4.9 38 2592 95 3.6 54 3934 41
44 48 4.1 32 2556 61 4,8 19 686 90 3.6 46 3847 53 .........
91 92 2.9 ......
46 54 3.9 22 1218 24 4.3 36 36
46 51 4.1 21 816 24 5.8 44 4647 53 4.6 20 3
26 31 5.6 30 2837 44 4.8 36 2744 51 5.0 ... 799 99 9.4 40 7
Source: Centre for Development Planning, Projections and Poiicies of theUnited Nations Secretariat. based on national census reports, estimates of thePopulation Division of the United Nations Secretariat, United Nations, MonthlyBulletin of Statistics, November 1971, Implementation of the InternationalDevelopment Strategy; Papers for the First Over-all Review and Appraisal ofProgress during the Second United Nations Development Decade, vol. I (UnitedNations publication, Sales No. E.73.II.A.2), and Food and AgricultureOrganization of the United Nations, Production Yearbook, 1972 (Rome).
a Within each region, countries are listed in ascending order of rate of increasein the 15-64 age group.
b Estimate based on ILO projections for 1970-1975.
176
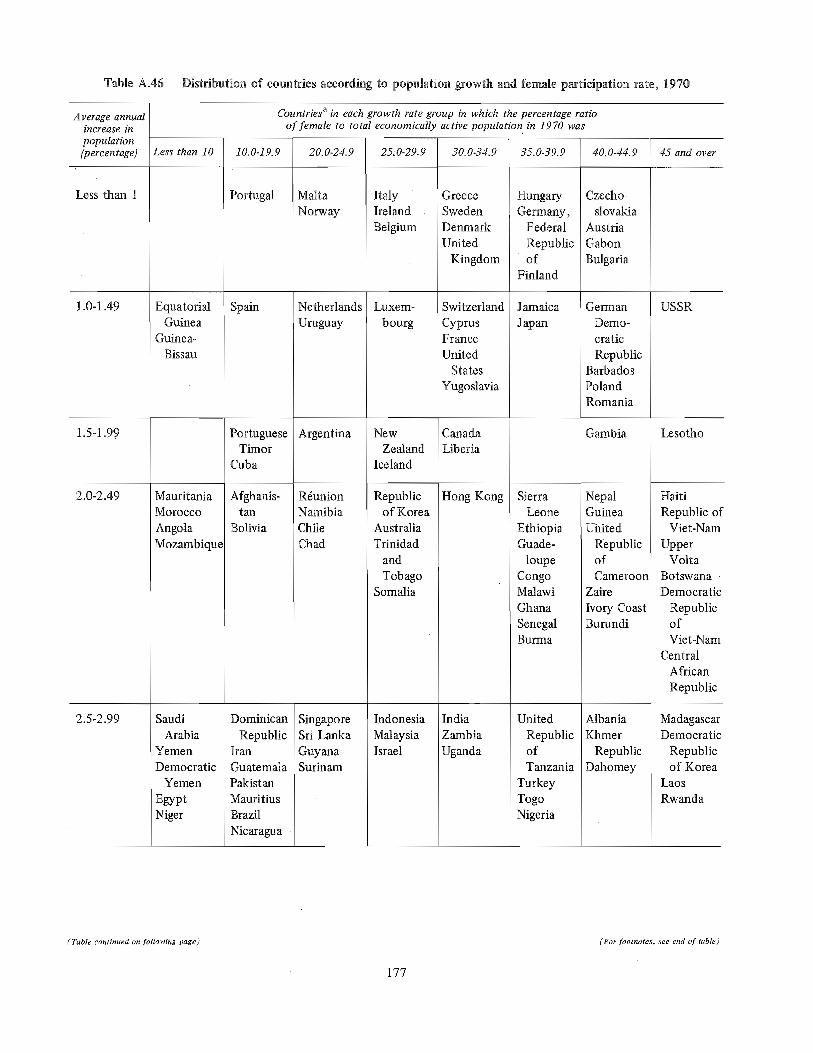
Table A.46 Distribution of countries according to population growth and female participation rate, 1970
IAverage annual Countriesa in each growth rate group in which the percentage ratio
increase in of female to total economically active population in 1970 was
population(percentage) Less than 10 10.0-19.9 20.0-24.9 25.0-29.9 30.0-34.9 35.0-39.9 40.0-44.9 45 and over
Less than 1 Portugal MaltaNorway
!.0-1.49
2.5-2.99
2.0-2.49 Mauritanial Morocco
AngolaMozambique
SaudiArabia
YemenDemocratic
Yemen
EgyptNiger
1.5-1.99
Spain
PortugueseTimor
Cuba
Afghanis-tan
Bolivia
DominicanRepublic
IranGuatemalaPakistanMauritiusBrazilNicaragua
EquatorialGuinea
Guinea-
Bissau
NetherlandsUruguay
Argentina
RdunionNamibiaChileChad
SingaporeSri LankaGuyanaSurinam
ItalyIrelandBelgium
guxem-
bourg
NewZealand
Iceland
Republicof Korea
AustraliaTrinidad
and
TobagoSomalia
Indonesia
Malaysiaisrael
GreeceSwedenDenmarkUnited
Kingdom
SwitzerlandCyprusFranceUnited
StatesYugoslavia
CanadaLiberia
Hong Kong
IndiaZambiaUganda
HungaryGermany,
FederalRepublicof
Finland
Jamaica
Japan
SierraLeone
EthiopiaGuade-
loupeCongoMalawiGhanaSenegalBurma
UnitedRepublicofTanzania
TurkeyTogoNigeria
Czecho-slovakia
AustriaGabonBulgaria
GermanDemo-
craticRepublic
BarbadosPolandRomania
Gambia
NepalGuineaUhited
RepublicofCameroon
ZaireIvory CoastBurundi
AlbaniaKhmer
RepublicDahomey
USSR
Lesotho
HaitiRepublic of
Viet-Nam
UpperVolta
BotswanaDemocratic
RepublicofViet-Nam
CentralAfricanRepublic
MadagascarDemocratic
Republicof Korea
LosRwanda
(Table continued on following page) (For footnotes, see end of table)
177

Table A.46 (continued)
Average annual Countriesa in each growth rate group in which the percentage ratioincrease in of female to total economically active population in 1970 was
population(percentage} Less than 10 10.0-19.9 20.0-24.9 25.0-29.9 30.0-34.9 35.0-39.9 40.0-44.9 45 and over
3.0 and over LebanonIraq •AlgeriaLibyan
ArabRepublic
KuwaitJordanTunisiaFijiSyrian Arab
Republic
SudanHondurasMexicoCosta PicaEcuadorE1 SalvadorVenezuelaColombia
Panama
ParaguaySouth
Africa
SouthernRhodesia
PhilippinesMongoliaKenya
Martinique SwazilandThailand
Source: Centre for Development Planning, Projections and Policies of theUnited Nations Secretariat, based on national census reports, estimates of thePopulation Division of the United Nations Secretariat, and International LabourOffice, Labour Force Projections, 1965-1985 (Geneva).
a Within each group, countries are listed in ascending order of female partici-pation.
178
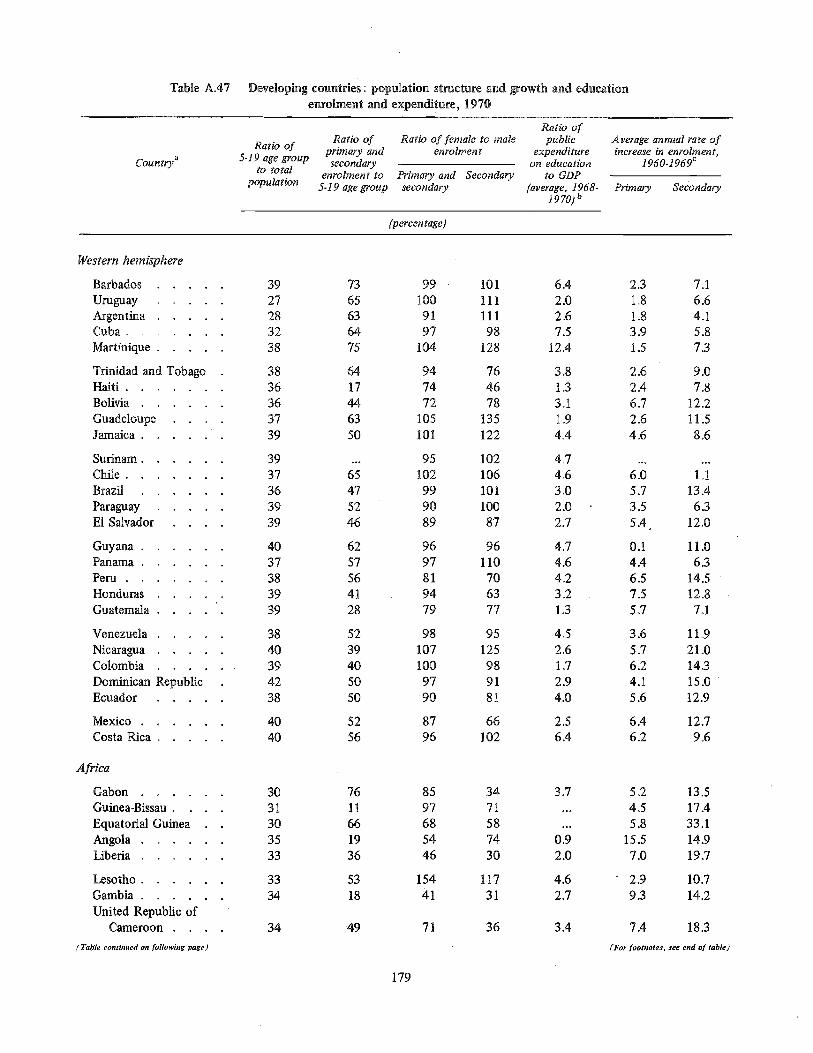
Table A.47 Developing countries: population structure and growth and educationenrolment and expenditure, 1970
CountFya
Ratio ofRatio of Ratio of female to male public
Ratio of primary and enrolment expenditure5-19 age group secondary on education
to total enrolment to Primary and Secondary to GDPpopulation 5-19 age group secondary (average, 1968-
1970)b
Average annual rate ofincrease in enrolment,
1960.1969c
Primary Secondary
(percen rage]
Western hemisphere
Barbados ..... 39 73 99 101 6.4 2.3 7.1Uruguay ..... 27 65 100 111 2.0 1.8 6.6Argentina ..... 28 63 91 111 2.6 1.8 4.1Cuba ....... 32 64 97 98 7.5 3.9 5.8Martinique ..... 38 75 104 128 12.4 1.5 7.3
Trinidad and Tobago 38 64 94 76 3.8 2.6 9.0Haiti ....... 36 17 74 46 1.3 2.4 7.8Bolivia ...... 36 44 72 78 3.1 6.7 12.2Guadeloupe .... 37 63 105 135 1.9 2.6 11.5Jamaica ...... 39 50 101 122 4.4 4.6 8.6
Surinam ...... 39 ... 95 102 4.7
Chile ....... 37 65 102 106 4.6Brazil ...... 36 47 99 101 3.0
Paraguay ..... 39 52 90 100 2.0E1 Salvador .... 39 46 89 87 2.7
Guyana ...... 40 62 96 96 4.7Panama ...... 37 57 97 110 4.6Peru ....... 38 56 81 70 4.2
Honduras ..... 39 41 94 63 3.2Guatemala ..... 39 28 79 77 1.3
6.0 1.15.7 13.43.5 6.35A 12.0
0.1 11.04.4 6.36.5 14.57.5 12.8
5.7 7.1
Venezuela ..... 38 52 98 95 4.5 3.6 11.9
Nicaragua ..... 40 39 107 125 2.6 5.7 21.0Colombia ...... 39 40 100 98 1.7 6.2 14.3Dominican Republic 42 50 97 91 2.9 4.1 15.0Ecuador ..... 38 50 90 81 4.0 5.6 12.9
Mexico ...... 40 52 87 66 2.5 6A 12.7Costa Rica ..... 40 56 96 102 6.4 6.2 9.6
Africa
Gabon ......
Guinea-Bissau ....
Equatorial GuineaAngola ......
Liberia ......
30 76 85 34 3.7 5.2 13.531 11 97 71 ... 4.5 17.430 66 68 58 ... 5.8 33.135 19 54 74 0.9 15.5 14.933 36 46 30 2.0 7.0 19.7
33 53 154 117 4.6 2.9 10.734 18 41 31 2.7 9.3 14.2
Lesotho ......
Gambia ......
United Republic ofCameroon ....
(Table continued on following page)
34 49 71 36 3.4 7.4 18.3(For footnotes, see end of table)
179
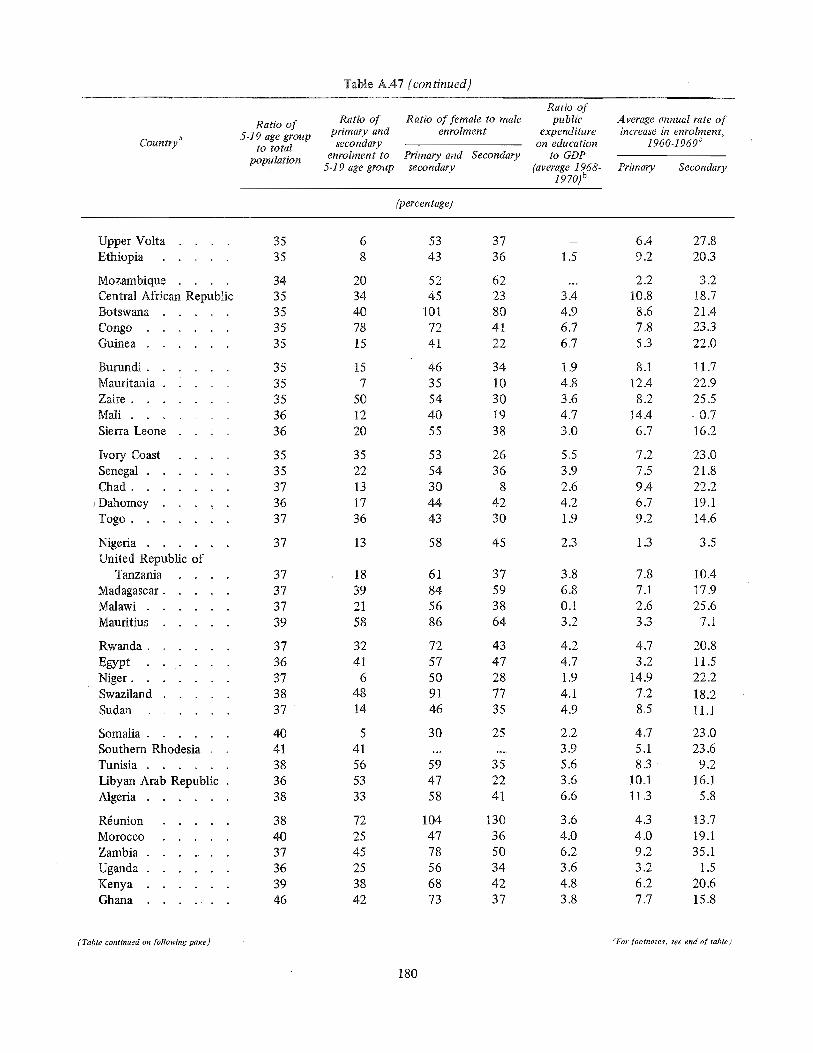
Table A.47 (continuedJ
Countrya
Ratio of Ratio of female to maleRatio ofprimary and enrolment5-19 age group
to total secondaryenrolment to Primary and Secondary
population 5-19 age group secondary
Ratio ofpublic Average annual rate of
expenditure increase in enrolment,on education 1960-1969c
to GDP(average 1968- Primary Secondary
1970)8
(percen rage)
Upper Volta ....
Ethiopia .....
3535
68
53 37 - 6.4 27.843 36 1.5 9.2 20.3
Nigeria ...... 37 13 58 45 2.3 1.3 3.5United Republic of
Tanzania .... 37 18 61 37 3.8 7.8 10.4Madagascar ..... 37 39 84 59 6.8 7.1 17.9Malawi ...... 37 21 56 38 0.1 2.6 25.6Mauritius ..... 39 58 86 64 3.2 3.3 7.1
Rwanda ...... 37 32 72 43 4.2 4.7 20.8
Egypt ...... 36 41 57 47 4.7 3.2 11.5Niger ....... 37 6 50 28 1.9 14.9 22.2Swaziland ..... 38 48 91 77 4.1 7.2 18.2
Sudan ...... 37 14 46 35 4.9 8.5 11.1
Somalia ...... 40 5 30 25 2.2 4.7 23.0Southern Rhodesia 41 41 ........ 3.9 5.1 23.6
Tunisia ....... 38 56 59 35 5.6 8.3 9.2
Libyan Arab Republic . 36 53 47 22 3.6 10.1 16.1Algeria ...... 38 33 58 41 6.6 11.3 5.8
R6union ..... 38 72 104 130 3.6 4.3 13.7Morocco ..... 40 25 47 36 4.0 4.0 19.1Zambia ...... 37 45 78 50 6.2 9.2 35.1Uganda ...... 36 25 56 34 3.6 3.2 1.5Kenya ...... 39 38 68 42 4.8 6.2 20.6Ghana ...... 46 42 73 37 3.8 7.7 15.8
Ivory Coast .... 35 35 53 26 5.5 7.2 23.0Senegal ...... 35 22 54 36 3.9 7.5 21.8Chad ....... 37 13 30 8 2.6 9.4 22.2, Dahomey ..... 36 17 44 42 4.2 6.7 19.1Togo ....... 37 36 43 30 1.9 9.2 14.6
Burundi ...... 35 15 46 34 1.9 8.1 11.7Mauritania ..... 35 7 35 !0 4.8 12.4 22.9Zaire ....... 35 50 54 30 3.6 8.2 25.5
Mali ....... 36 12 40 19 4.7 14.4 -0.7
Sierra Leone .... 36 20 55 38 3.0 6.7 16.2
Mozambique .... 34 20 52 62 ... 2.2 3.2Central African Republic 35 34 45 23 3.4 !0.8 18.7Botswana ..... 35 40 101 80 4.9 8.6 21.4Congo ...... 35 78 72 4! 6.7 7.8 23.3Guinea ...... 35 15 41 22 6.7 5.3 22.0
(Table continued on following page) (For footnotes, see end of table)
180
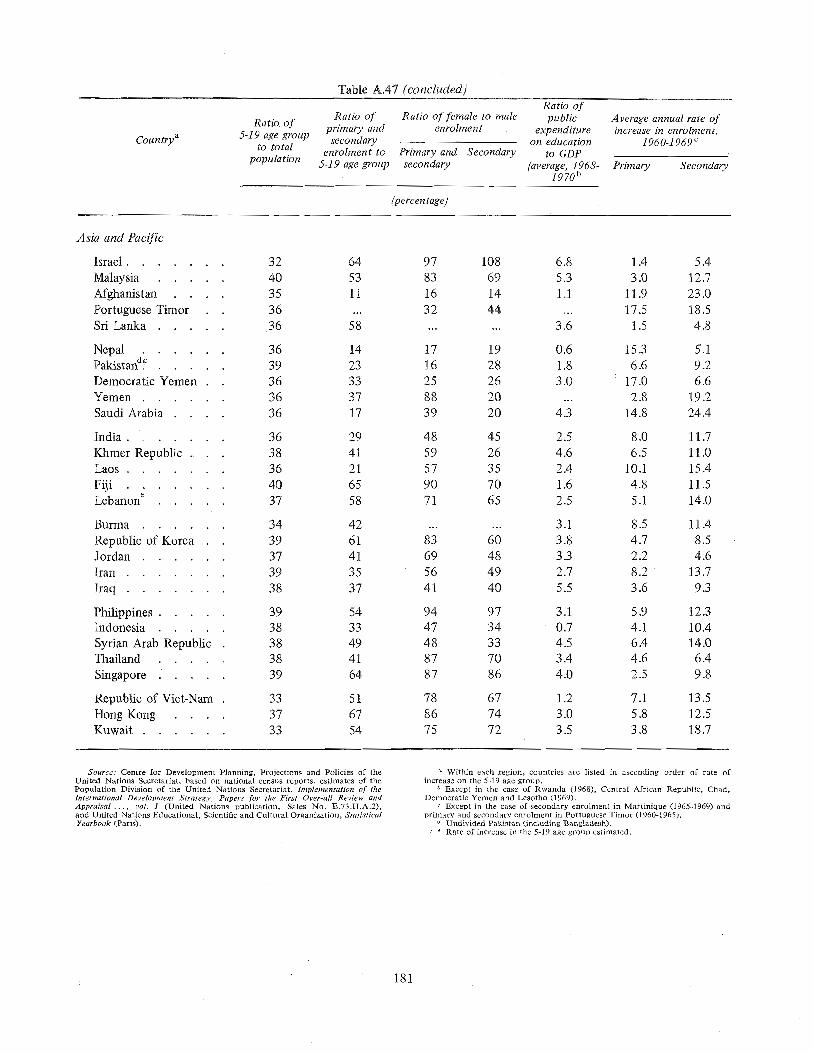
Table A.47 (concluded)
Countrya
Ratio of Ratio of female to maleRatio of primary and enrolment
5-19 age group secondaryto total enrolment to Primary and Secondary
population 5-19 age group secondary
Ratio ofpublic Average annual rate of
expenditure increase in enrolment,on education 1960-1969c
to GDP(average, 1968- Primary Secondary
1970b
{percen rage}
Asia and Pacific
Israel ....... 32 64 97 108 6.8 1.4 5.4
Malaysia ..... 40 53 83 69 5.3 3.0 12.7Afghanistan .... 35 11 16 14 1.1 11.9 23.0
Portuguese Timor 36 ... 32 44 ... 17.5 18ÿ5Sri Lanka ...... 36 58 ...... 3.6 15 4.8
Nepal ...... 36
PakistanÿY ..... 39
Democratic Yemen . 36Yemen ...... 36
Saudi Arabia .... 36
14 17 19 0.6 15.3 5.123 16 28 1.8 6.6 9.233 25 26 3.0 17.0 6.637 88 20 ... 2.8 19.217 39 20 4.3 14.8 24.4
India ....... 36 29 48 45 2.5 8.0 11.7
Khmer Republic . 38 41 59 26 4.6 6.5 11.0Laos ....... 36 21 57 35 2.4 10.1 15.4
Fiji ....... 40 65 90 70 1.6 4.8 11.5Lebanone . .... 37 58 71 65 2.5 5.1 14.0
Burma ...... 34 42 ...... 3.1 8.5 11.4
Republic of Korea 39 61 83 60 3.8 4.7 8.5Jordan ...... 37 41 69 48 3.3 2.2 4.6
Iran ....... 39 35 56 49 2.7 8.2 13.7
Iraq ....... 38 37 41 40 5.5 3.6 9.3
Philippines ..... 39 54 94 97 3.1 5.9 12.3Indonesia ..... 38 33 47 34 0.7 4.1 10.4Syrian Arab Republic . 38 49 48 33 4.5 6.4 14.0Thailand ..... 38 41 87 70 3.4 4.6 6.4
Singapore ..... 39 64 87 86 4.0 2.5 9.8
Republic of Viet-Nam . 33 51 78 67 1.2 7.1 13.5Hong Kong .... 37 67 86 74 3.0 5.8 12.5Kuwait ...... 33 54 75 72 3.5 3.8 18.7
Source: Centre for Development Planning, Projections and Policies of theUnited Nations Secretariat, based on national census reports, estimates of thePopulation Division of the United Nations Secretariat, Implementation of theInternational Development Strategy," Papers for the First Over-all Review andAppraisal .... vol. I (United Nations publication, Sales No. E.73.II.A.2),and United Nations Educational, Scientific and Cultural Organization, StatisticalYearbook (Paris).
Within each region, countries are listed in ascending order of rate ofincrease on the 5-19 age group.
b Except in the case of Rwanda (1968), Central African Republic, Chad,Democratic Yemen and Lesotho (1969).
c Except in the case of secondary enrolment in Martinique (1965-1969) andprimary and secondary enrolment in Portuguese Timor (1960-1965).
a Undivided Pakistan (including Bangladesh).e Rate of increase in the 5-19 age group estimated.
181
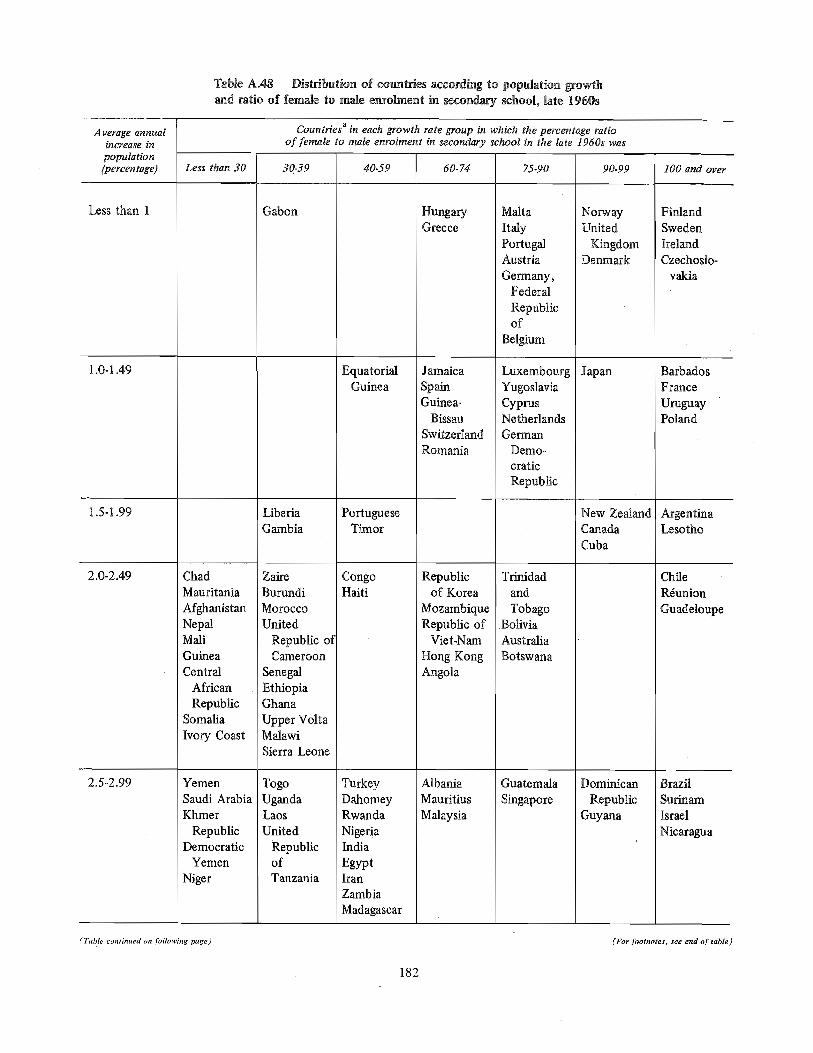
Table A.48 Distribution of countries according to population growthand ratio of female to male enrolment in secondary school, late 1960s
Average annual Countriesa in each growth rate group in which the percentage ratioincrease in of female to male enrolment in secondary school in the late 1960s waspopulation{percentage) 40-59 60-74 75-90 90-99 100 and over
Less than 1
Less than 30 30-39
Gabon
1.0-1.49
2.5-2.99
2.0-2.ÿ
1.5-1.99 LiberiaGambia
ChadMauritaniaAfghanistanNepalMallGuineaCentral
AfricanRepublic
SomaliaIvory Coast
YemenSaudi ArabiaKhmer
RepublicDemocratic
Yemen
Niger
ZaireBurundiMoroccoUnited
Republic ofCameroon
SenegalEthiopiaGhanaUpper VoltaMalawiSierra Leone
TogoUgandaLaosUnited
RepublicofTanzania
EquatorialGuinea
PortugueseTimor
CongoHaiti
TurkeyDahomeyRwandaNigeriaIndiaEgyptIranZambiaMadagascar
HungaryGreece
JamaicaSpainGuinea-
BissauSwitzerlandRomania
Republicof Korea
AlbaniaMauritiusMalaysia
MaltaItalyPortugalAustriaGermany,
FederalRepublicof
Belgium
LuxembourgYugoslaviaCyprusNetherlandsGerman
Demo-craticRepublic
Trinidadand
GuatemalaSingapore
NorwayUnited
KingdomDenmark
Japan
New ZealandCanadaCuba
Dominican
RepublicGuyana
MozambiqueRepublic of
Viet.Nam
Hong KongAngola
TobagoBoliviaAustraliaBotswana
FinlandSwedenIrelandCzechoslo-
vakia
BarbadosFranceUruguayPoland
ArgentinaLesotho
ChileRdunionGuadeloupe
BrazilSurinamIsraelNicaragua
(Table continued on following page) (For footnotes, see end of table)
182

Table A.48 (continued)
Annual average Countriesa in each growth rate group in which the percentage ratioincrease in of female to male enrolment in secondary school in the late 1960s was
population{percentage) Less than 30 30-39 40-59 60-74 75-90 90-99 100 and over
3.0 and over Libyan ArabRepublic
Syrian ArabRepublic
TunisiaSudan
IraqAlgeriaKenyaJordan
HondurasMexicoThailandPeru
FijiKuwait
SwazilandEcuadorE1 Salvador
VenezuelaPhilippinesColombiaParaguay
PanamaCosta RicaMartinique
Source: Centre for Development Planning, Projections and Policies of theUnited Nations Secretariat, based on national census reports, estimates of thePopulation Division of the United Nations Secretariat, and United NationsEducational, Scientific and Cultural Organization, Statistical Yearbook (Paris).
a Within each group, countries are listed in ascending order of female]maleenrolment ratio.
183
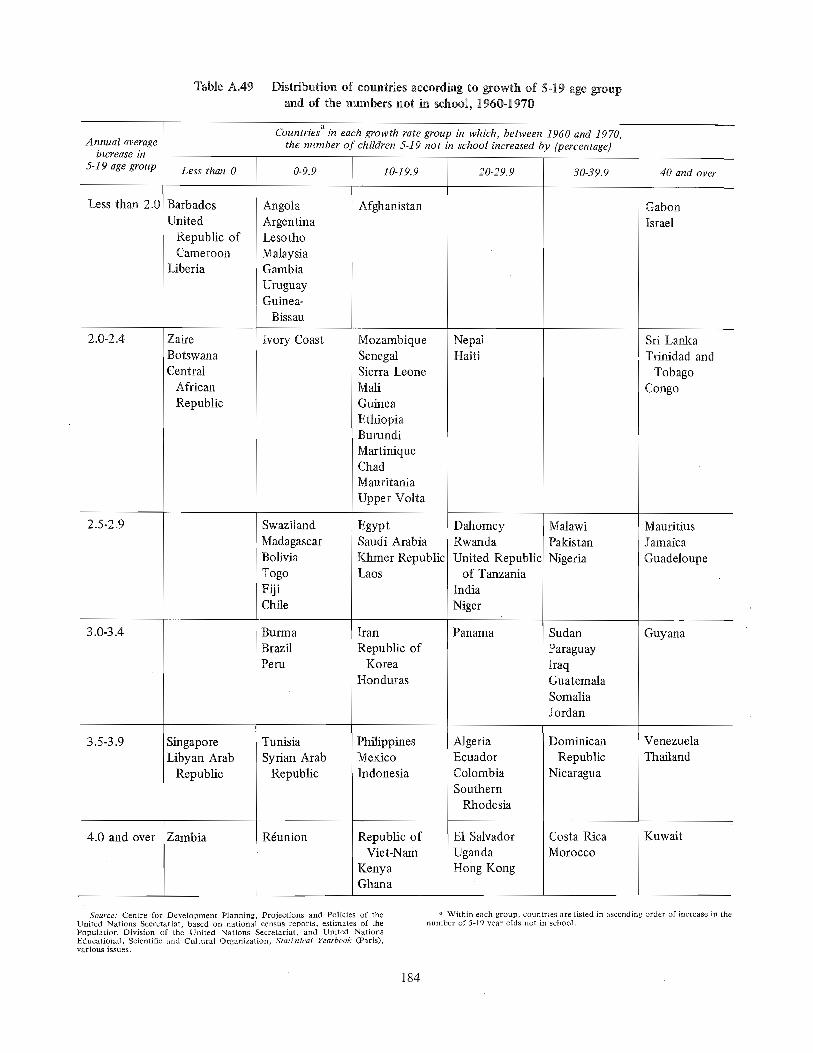
Table A.49 Distribution of countries accordhng to growth of 5-19 age groupand of the numbers not in school, 1960-1970
• aCountrws in each growth rate group in which, between 1960 and 1970,
Annual average the number of children 5-19 not in school increased by (percentage)increase in
5-19 age group Less than 0 0-9.9 20-29.9 30-39.9 40 and over
Less than 2.0 BarbadosUnited
Republic ofCameroon
Liberia
2.0-2.4
3.5-3.9
4.0 and over
3.0-3.4
2.5-2.9
Zaire
BotswanaCentral
AfricanRepublic
SingaporeLibyan Arab
Republic
Zambia
AngolaArgentinaLesothoMalaysiaGambiaUruguay
I Guinea-
Bissau
Ivory Coast
SwazilandMadagascarBoliviaTogoFijiChile
gurlTl aBrazilPeru
TunisiaSyrian Arab
Republic
Rÿunion
10-19.9
Afghanistan
MozambiqueSenegalSierra LeoneMaliGuineaEthiopiaBurundiMartiniqueChadMauritania
Upper Volta
EgyptSaudi ArabiaKhmer RepublicLaos
IranRepublic of
KoreaHonduras
PhilippinesMexicoIndonesia
Republic ofViet-Nam
KenyaGhana
NepalHaiti
DahomeyRwanda
United Republicof Tanzania
IndiaNiger
Panama
AlgeriaEcuadorColombiaSouthern
Rhodesia
E1 SalvadorUgandaHong Kong
MalawiPakistanNigeria
SudanParaguayIraqGuatemalaSomaliaJordan
DominicanRepublic
Nicaragua
Costa RicaMorocco
GabonIsrael
Sri LankaTrinidad and
TobagoCongo
MauritiusJamaica
Guadeloupe
Guyana
VenezuelaThailand
Kuwait
Source: Centre for Development Planning, Projections and Policies of theUnited Nations Secretariat, based on national census reports, estimates of thePopulation Division of the United Nations Secretariat, and United NationsEducational, Scientific and Cultural Organization, Statistical Yearbook (Paris),various issues.
. Within each group, countries are listed in ascending order of increase in thenumber of 5-19 year olds not in school.
184
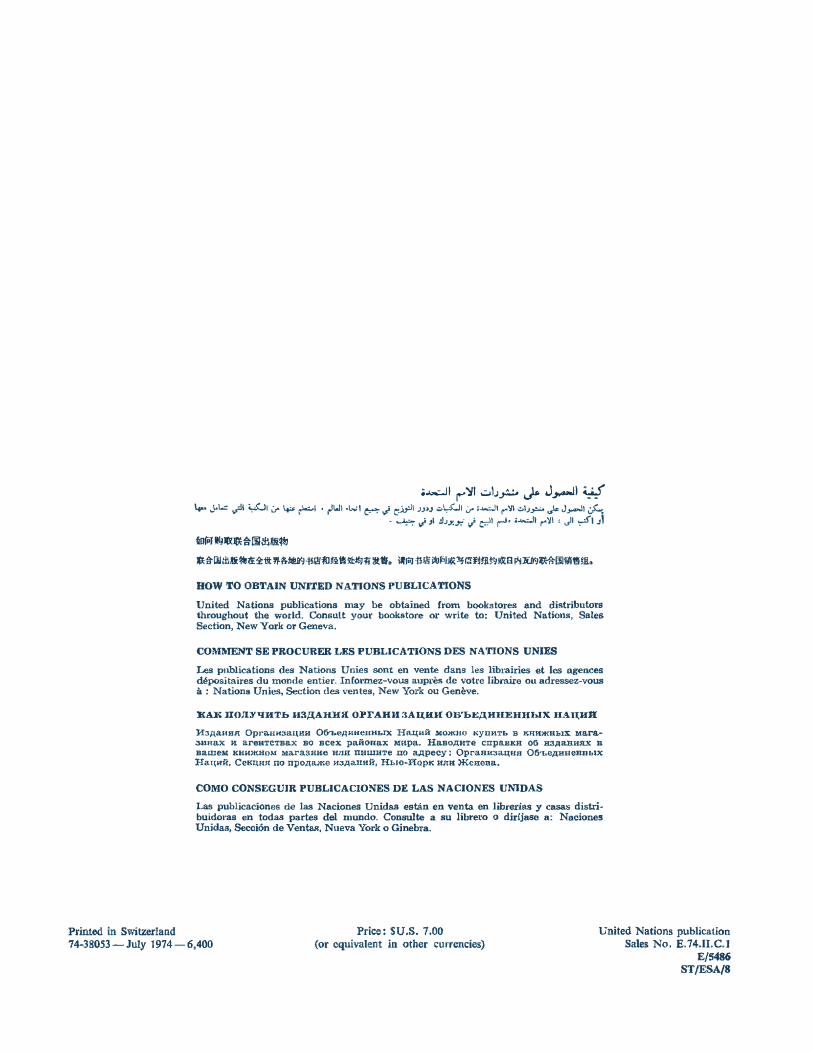
.�I r"' 'St d..i_,!.:., � J.,_JI � \.,.. J-1..::- .;JI .,.WI .,- � �I , .JWl •WI � ,j C':,_,:ll JAJ .a.1,-:(..JI ;_,. ,.i..:.ll r"'JI .:.lJ..,._.. ,fa J_,_JI J..,..
· � ,j �1 :J,J'.�· ,j �I ri' o.....JI 1'"''111 : JI .,.:fl�\
tnfoJ ���"*�ilir&!lt
J!Htl:iltMiJnU:fll:!/f�lll!S!J�i.1!ffl���$Jti�·· iWia!�-�ltPl��r.-u�rn�;Ji;llPiD'1�00'1W!A.
HOW TO OBTAIN UNITED NATIONS PUBLICATIONS
United Nations publications may be obtained from bookstores and distribut.ots throughout the world. Consult your bookstore or write to: United Nations, Sales Section, New York or Geneva.
COMMENT SE PROCURER LES PUBLICATIONS DES NATIONS UNIES
Les publications des Nations Unies sont en vente dans !es librairies et lcs o.gences d�positaires du monde entier. lnformez-vous auptes de votre libraire ou adressez-vous a : Nations Unies, Section des ventes, New York ou Geneve.
JCAR JIO!IY'IHTI> 113,'l;AHlUl OPFAHH3AU,lllf OB'b"E,11.HllEHHl>IX UAI�HII
H3A8HBR Opra.mt:JSJ.\BH Ofn.e,[1HHeHHLIX H9.llHH .!o!IOJKHO KynHTh B KHH>KHLIX: Me.ML-3RHax K areeTCTB&X BO Bcex paiioeax MUpa. HaBO,Zl;HTe cnpasK.H OD H3,lla.HHS:X B sarneM KHH)IU{OM'. Mar&3RHe HJIH IllirLIHTe no 8,!l;pecy: OpraR.li'.39.llHft 06-t,eJIJUte>IBblX Rat1irlt, Ceimmt no npoAame H3Aansli, H1>1-0-nopK HllR mea:esa.
COMO CONSEGUJR PUBLICACIONES DE LAS NACIONES UNIDAS
Las publicaciones de las Naciones Unidas est.an en venta en lib.rerias y Casas distribuidoras en todas partes del mundo. Consulte a su libret'O o dirijase a: Naciones Unidas, Secoion de Venta.<J, Nueva York o Ginebra.
Printed in Switzerland 74-38053-July 1974-6,400
Price: SU.S. 7.00 (or equivalent in other currencies)
United Nations publication Sales No. E.74.11.C.1
E/5486 ST/"ESA/8


