Embed Size (px)
Citation preview

wiiw Working Papers | 44
Robert C. Feenstra
Globalization and Its Impact on Labour
July 2007

wiiw Working Papers published since 1998: No. 8 J. Fersterer and M. Landesmann: Vertical Product Differentiation in International Trade: An Econometric
Investigation. April 1998 No. 9 A. Bhaduri, K. Laski and M. Riese: Effective Demand versus Profit Maximization in Aggregate Demand/Supply
Analysis from a Dynamic Perspective. November 1998 No. 10 M. Landesmann and R. Stehrer: The European Unemployment Problem: A Structural Approach. March 1999 No. 11 R. Stehrer, M. Landesmann and J. Burgstaller: Convergence Patterns at the Industrial Level: the Dynamics of
Comparative Advantage. October 1999 No. 12 K. Laski: Three Ways to . . . High Unemployment. January 2000 No. 13 F. Turnovec: A Leontief-type Model of Ownership Structures. Methodology and Implications. April 2000 No. 14 M. Landesmann and R. Stehrer: Potential Switchovers in Comparative Advantage: Patterns of Industrial
Convergence. June 2000 No. 15 R. Stehrer: Industrial Specialization, Trade, and Labour Market Dynamics in a Multisectoral Model of Technological
Progress. January 2001; revised version February 2002 No. 16 K. Laski and R. Römisch: Growth and Savings in USA and Japan. July 2001 No. 17 P. Egger and R. Stehrer: International Outsourcing and the Skill-Specific Wage Bill in Eastern Europe. July 2001 No. 18 R. Stehrer: Expenditure Levels, Prices and Consumption Patterns in a Cross-Section of Countries. August 2001 No. 19 R. Stehrer and J. Wörz: Technological Convergence and Trade Patterns. October 2001 No. 20 M. Landesmann, R. Stehrer and S. Leitner: Trade Liberalization and Labour Markets: Perspective from OECD
Economies. October 2001 No. 21 E. Christie: Potential Trade in South-East Europe: A Gravity Model Approach. March 2002 No. 22 M. Landesmann and R. Stehrer: Technical Change, Effective Demand and Economic Growth. April 2002 No. 23 R. Stehrer and J. Wörz: Industrial Diversity, Trade Patterns and Productivity Convergence. November 2002; revised
version July 2003 No. 24 E. Christie: Foreign Direct investment in Southeast Europe: a Gravity Model Approach. March 2003 No. 25 J. Wörz: Skill Intensity in Foreign Trade and Economic Growth. November 2003; revised version January 2004 No. 26 M. Landesmann and R. Stehrer: Global Growth Processes: Technology Diffusion, Catching-up and Effective Demand.
January 2004 No. 27 M. Landesmann and R. Stehrer: Modelling International Economic Integration: Patterns of Catching-up, Foreign Direct
Investment and Migration Flows. March 2004 No. 28 L. Podkaminer: Assessing the Demand for Food in Europe by the Year 2010. March 2004 No. 29 U. Dulleck, N. Foster, R. Stehrer and J. Wörz: Dimensions of Quality Upgrading in CEECs. April 2004 No. 30 R. Stehrer: Can Trade Explain the Sector Bias of Skill-biased Technical Change? May 2004 No. 31 M. Landesmann and R. Stehrer: Income Distribution, Technical Change and the Dynamics of International Economic
Integration. September 2004 No. 32 A. Hildebrandt and J. Wörz: Determinants of Industrial Location Patterns in CEECs. November 2004 No. 33 K. Laski: Macroeconomics versus ‘Common Sense’. December 2004 No. 34 V. Astrov, Sectoral Productivity, Demand, and Terms of Trade: What Drives the Real Appreciation of the East
European Currencies? April 2005 No. 35 R. Stehrer: The Effects of Factor- and Sector-biased Technical Change Revisited. September 2005 No. 36 N. Foster and R. Stehrer: Modelling GDP in CEECs Using Smooth Transitions. December 2005 No. 37 J. Francois and J. Wörz: Rags in the High Rent District: The Evolution of Quota Rents in Textiles and Clothing.
January 2006 No. 38 C. F. Castejón and J. Wörz: Good or Bad? The Influence of FDI on Output Growth. An industry-level analysis. April
2006 No. 39 R. Römisch and M. Leibrecht: An Alternative Formulation of the Devereux-Griffith Effective Average Tax Rates for
International Investment. May 2006 No. 40 E. Christie and M. Holzner: What Explains Tax Evasion? An Empirical Assessment based on European Data. June
2006 No. 41 M. Landesmann and R. Stehrer: Goodwin’s Structural Economic Dynamics: Modelling Schumpeterian and Keynesian
Insights. October 2006 No. 42 A. Bhaduri: On the Dynamics of Profit- and Wage-led Growth. March 2007 No. 43 P. Esposito and R. Stehrer: The Sector Bias of Skill-biased Technical Change and the Rising Skill Premium in
Transition Economies. May 2007 No. 44 Robert C. Feenstra: Globalization and Its Impact on Labour. July 2007

Robert C. Feenstra holds the C. Bryan Cameron Distinguished Chair in International Economics at the University of California at Davis. He is also Director of the International Trade and Investment Program at the National Bureau of Economic Research (NBER) and Director of its Center for International Data.
This paper represents the text of the author’s ‘Global Economy Lecture’, organized by Oesterreichische Nationalbank (OeNB) and wiiw, Vienna, February 2007.
Robert C. Feenstra
Globalization and Its
Impact on Labour

Contents
Abstract .................................................................................................................................... i
1 Introduction ......................................................................................................................1
2 Outsourcing and wages...................................................................................................2
Evidence from the 1980s.................................................................................................3
Model of outsourcing........................................................................................................5
Trade versus technology .................................................................................................7
3 Outsourcing and productivity ...........................................................................................8
Evidence for the United States ........................................................................................9
Outsourcing in the 1990s and services .........................................................................11
4 Productivity and wages in NAFTA.................................................................................13
Evidence for Mexico.......................................................................................................13
Evidence for Canada .....................................................................................................16
5 Other sources of gains from trade.................................................................................17
Evidence for Europe ......................................................................................................18
6 Immigration to the United States ...................................................................................19
Mariel Boat Lift ...............................................................................................................19
Mexican migration to the United States.........................................................................20
7 Conclusions....................................................................................................................22
References ............................................................................................................................24
List of Tables and Figures
Table 1 Increase in the relative wage of Nonproduction. Labour in US manufacturing, 1979-1990 .. 7
Table 2 Real wage of nonproduction and production, labour in US manufacturing, 1979-1990 .... 10
Table 3 Offshoring intensity, 1992-2000............................................................................................ 12
Table 4 Impact of outsourcing on productivity in US manufacturing, 1992-2000 ............................ 13
Table 5 Immigration and wages in the US ........................................................................................22
Figure 1 Relative wage of nonproduction/production workers, US manufacturing............................. 2
Figure 2 Relative wage of nonproduction/production workers, Mexico manufacturing ...................... 3
Figure 3 Relative wage and employment of, nonproduction/production workers, 1979-1990 ........... 4
Figure 4 Outsourcing on the value-chain ............................................................................................. 6
Figure 5 Real wages of production workers, US manufacturing (1982 US dollars) ........................ 10
Figure 6 Relative wage and employment of nonproduction/production workers, 1990-2000 .......... 11
Figure 7 Labour productivity and wages in Mexico............................................................................ 14
Figure 8 Share of foreign-born in US workforce, 2004....................................................................... 21
i
Abstract
This is the text of Professor Robert Feenstra’s ‘Global Economy Lecture’ which he delivered in February 2007. It is part of a lecture series organized jointly by the Vienna Institute for International Economic Studies (wiiw) and the Austrian National Bank (OeNB). In this lecture, Professor Feenstra covers a wide range of issues related to the ongoing discussion of the impact of global economic integration upon labour markets: the impact of outsourcing upon wage structures and upon productivity, the effects of NAFTA upon the US, Mexican and Canadian economies, the issue of outsourcing in services, the impact of international migration flows, etc. Keywords: globalization and labour markets, outsourcing, trade vs. technology;
outsourcing in services, migration, production-nonproduction workers. JEL classification: F16, F21, F22, F15

1
Robert C. Feenstra
Globalization and Its Impact on Labour*
1 Introduction
Last January we witnessed the enlargement of the European Union to include two new members, Romania and Bulgaria, in addition to the ten countries added in 2004. The European Union is without doubt the greatest example of the spread of free trade in the world today, and to an economist, that is what globalization is all about. But the spread of free trade does not come without challenges, which take several forms. First, there is the potential impact of trade on wages, which is an issue of ongoing concern in Europe. Outsourcing, or offshoring, continues to receive a good deal of attention in the United States, too. This aspect of trade was discussed at a conference sponsored by the US Federal Reserve Bank, held last summer in Jackson Hole. In addition, this past September the Federal Reserve Bank held a meeting in Washington, D.C., to discuss the implications of outsourcing for the US economy, which I attended. I will draw on these meetings to describe the impact of outsourcing on the economy in general, and workers in particular. Second, there is the question of how free trade affects the productivity of firms. As productivity improves, we expect those gains to be reflected in lower prices, and therefore higher real wages, so this second question also relates to the impact of globalization on workers. There is less research on the impact of free trade on productivity than on wages themselves, but there are some very recent studies that we can draw on in this regard. Third, there is the issue of labour mobility between countries, such as from new EU members to the rest of Europe. Migration is also an issue in North America, especially the migration from Mexico to the United States. In 2005, there were close to 12 million Mexicans living in the United States, which is more than 10% of the population of Mexico. It is no surprise, then, that immigration is a frequent topic of debate. I will draw on the latest research to describe the effects of immigration on US wages. I take the ongoing enlargement of the European Union, with both its benefits and its challenges, as the motivation for my talk today; but by necessity, I will focus on the area of the world I know more about – North America. It has now been over 10 years since Canada, Mexico and the United States signed the North American Free Trade Agreement (NAFTA), in 1994, allowing for free trade between the three countries. But Canada and the United States had signed an agreement five years before that, in 1989, allowing for free
* ‘Global Economy Lecture‘, organized by Oesterreichische Nationalbank (OeNB) and the Vienna Institute for
International Economic Studies (wiiw), Vienna, February 2007.
2
trade between themselves. And of course, both of these agreements carried on a process of integration of the North American market that had started some years before. So as I look at what the impact of free trade in North America has been, I will start a decade before the Canada-US agreement, giving us more than 25 years to see the effects of economic integration on that continent. 2 Outsourcing and wages
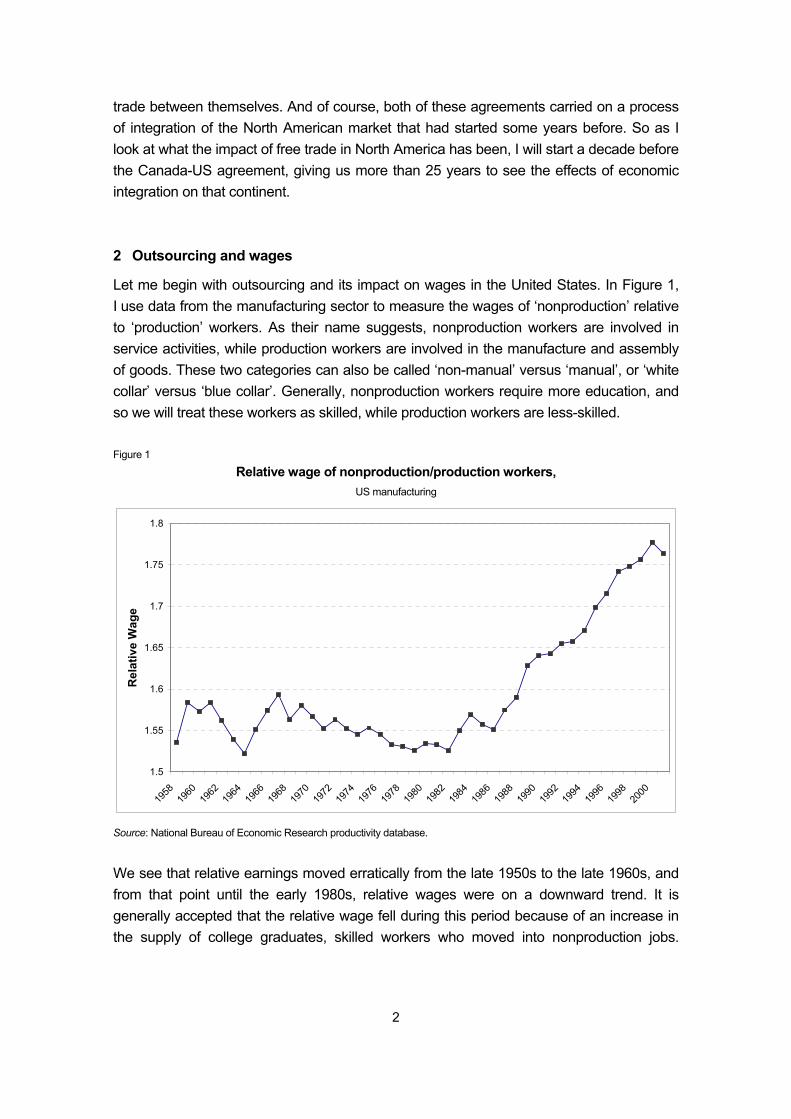
Let me begin with outsourcing and its impact on wages in the United States. In Figure 1, I use data from the manufacturing sector to measure the wages of ‘nonproduction’ relative to ‘production’ workers. As their name suggests, nonproduction workers are involved in service activities, while production workers are involved in the manufacture and assembly of goods. These two categories can also be called ‘non-manual’ versus ‘manual’, or ‘white collar’ versus ‘blue collar’. Generally, nonproduction workers require more education, and so we will treat these workers as skilled, while production workers are less-skilled. Figure 1
Relative wage of nonproduction/production workers, US manufacturing
1.5
1.55
1.6
1.65
1.7
1.75
1.8
1958
1960
1962
1964
1966
1968
1970
1972
1974
1976
1978
1980
1982
1984
1986
1988
1990
1992
1994
1996
1998
2000
Rel
ativ
e W
age
Source: National Bureau of Economic Research productivity database.
We see that relative earnings moved erratically from the late 1950s to the late 1960s, and from that point until the early 1980s, relative wages were on a downward trend. It is generally accepted that the relative wage fell during this period because of an increase in the supply of college graduates, skilled workers who moved into nonproduction jobs.
3
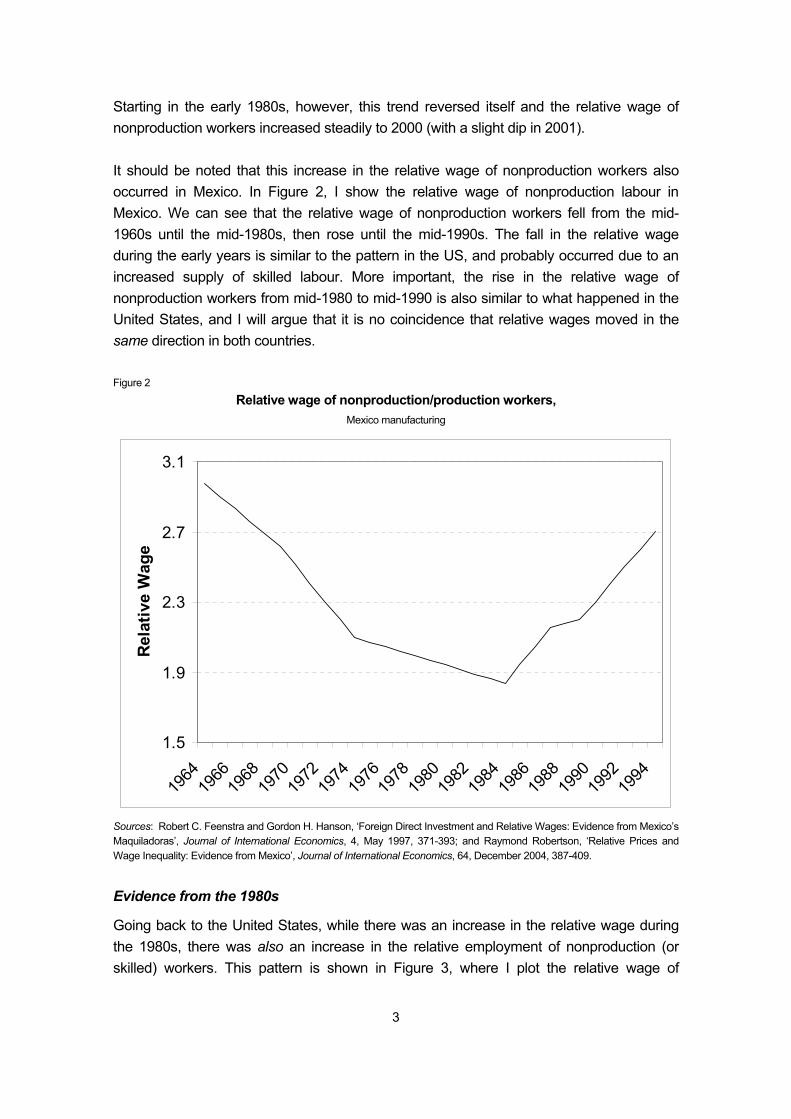
Starting in the early 1980s, however, this trend reversed itself and the relative wage of nonproduction workers increased steadily to 2000 (with a slight dip in 2001). It should be noted that this increase in the relative wage of nonproduction workers also occurred in Mexico. In Figure 2, I show the relative wage of nonproduction labour in Mexico. We can see that the relative wage of nonproduction workers fell from the mid-1960s until the mid-1980s, then rose until the mid-1990s. The fall in the relative wage during the early years is similar to the pattern in the US, and probably occurred due to an increased supply of skilled labour. More important, the rise in the relative wage of nonproduction workers from mid-1980 to mid-1990 is also similar to what happened in the United States, and I will argue that it is no coincidence that relative wages moved in the same direction in both countries. Figure 2
Relative wage of nonproduction/production workers, Mexico manufacturing
1.5
1.9
2.3
2.7
3.1
1964
1966
1968
1970
1972
1974
1976
1978
1980
1982
1984
1986
1988
1990
1992
1994
Rel
ativ
e W
age
Sources: Robert C. Feenstra and Gordon H. Hanson, ‘Foreign Direct Investment and Relative Wages: Evidence from Mexico’s Maquiladoras’, Journal of International Economics, 4, May 1997, 371-393; and Raymond Robertson, ‘Relative Prices and Wage Inequality: Evidence from Mexico’, Journal of International Economics, 64, December 2004, 387-409.
Evidence from the 1980s
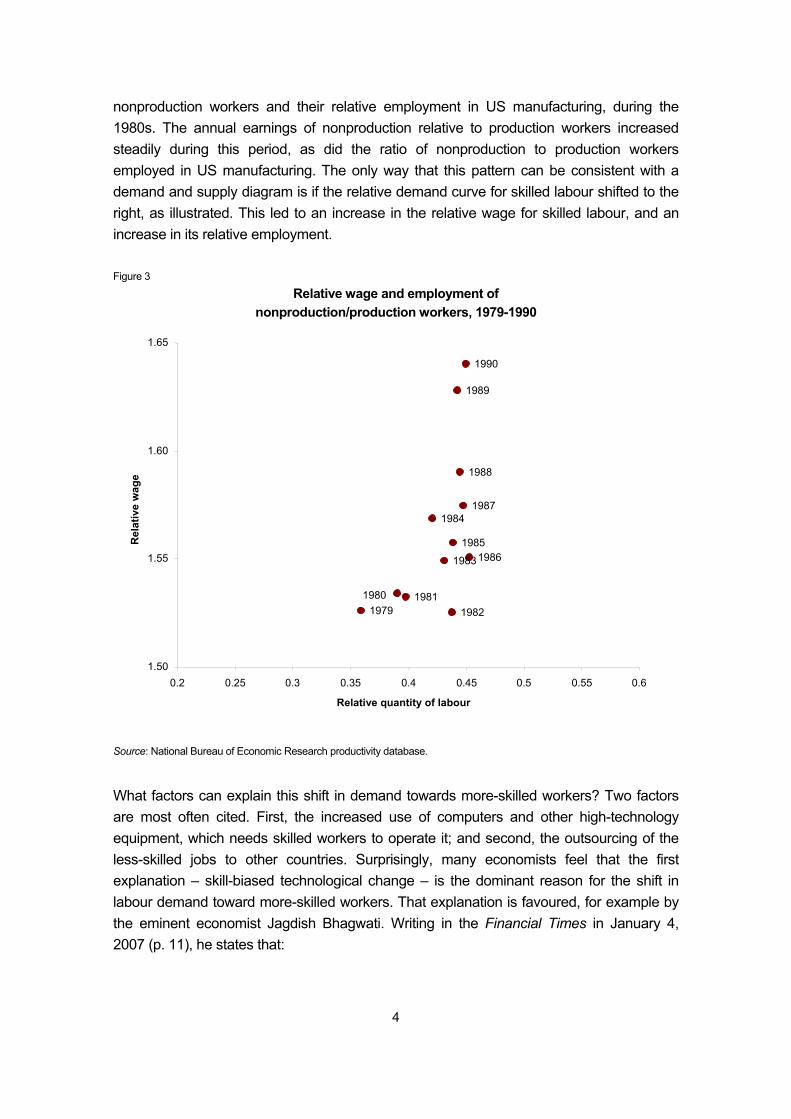
Going back to the United States, while there was an increase in the relative wage during the 1980s, there was also an increase in the relative employment of nonproduction (or skilled) workers. This pattern is shown in Figure 3, where I plot the relative wage of
4
nonproduction workers and their relative employment in US manufacturing, during the 1980s. The annual earnings of nonproduction relative to production workers increased steadily during this period, as did the ratio of nonproduction to production workers employed in US manufacturing. The only way that this pattern can be consistent with a demand and supply diagram is if the relative demand curve for skilled labour shifted to the right, as illustrated. This led to an increase in the relative wage for skilled labour, and an increase in its relative employment. Figure 3
Relative wage and employment of nonproduction/production workers, 1979-1990
1989
1990
19791980 1981
1982
19861983
1985
19841987
1988
1.50
1.55
1.60
1.65
0.2 0.25 0.3 0.35 0.4 0.45 0.5 0.55 0.6
Relative quantity of labour
Rel
ativ
e w
age
Source: National Bureau of Economic Research productivity database.
What factors can explain this shift in demand towards more-skilled workers? Two factors are most often cited. First, the increased use of computers and other high-technology equipment, which needs skilled workers to operate it; and second, the outsourcing of the less-skilled jobs to other countries. Surprisingly, many economists feel that the first explanation – skill-biased technological change – is the dominant reason for the shift in labour demand toward more-skilled workers. That explanation is favoured, for example by the eminent economist Jagdish Bhagwati. Writing in the Financial Times in January 4, 2007 (p. 11), he states that:
5
The culprit is not globalization but labour-saving technical change that puts pressure on the wages of the unskilled. Technical change prompts continual economies in the use of unskilled labour. Much empirical argumentation and evidence exists on this.
For the empirical evidence, Bhagwati cites Paul Krugman of Princeton University and myself, as well as the labour economists George Borjas and Larry Katz of Harvard. Before reviewing that empirical evidence, it is worth asking why Bhagwati, as well as many other scholars, have been sceptical that the falling relative wages of less-skilled workers has been caused by outsourcing.1 One reason for this scepticism is that the same pattern of wage changes – favouring more-skilled workers – also occurred in Mexico, as we have seen, and other developing countries and industrial countries (Feenstra and Hanson, 2003). Traditional theories of international trade, such as the Heckscher-Ohlin model, usually predict that wages will move in opposite directions in different countries due to trade, not in the same direction. For example, the Factor Price Equalization theorem states that wages will move towards equality across countries, meaning that labour should earn more in poor countries but less in rich countries, due to trade. That logic does not seem to be consistent with the fact that skilled workers earned relatively more in rich and poor countries alike during 1980s and 1990s. So can we really reconcile this global pattern of wage changes with international trade? I think that we can reconcile the wage changes with international trade, but not with the Heckscher-Ohlin model or other traditional theories of international trade. Instead, we need to adopt a new paradigm, which emphasizes how tasks or activities can be sent across borders, as with outsourcing. In this new paradigm, it is fairly easy to predict that more-skilled workers will gain in all countries due to increased outsourcing. Let me take a moment to explain how this prediction is obtained, and then return to review the empirical evidence. Model of outsourcing
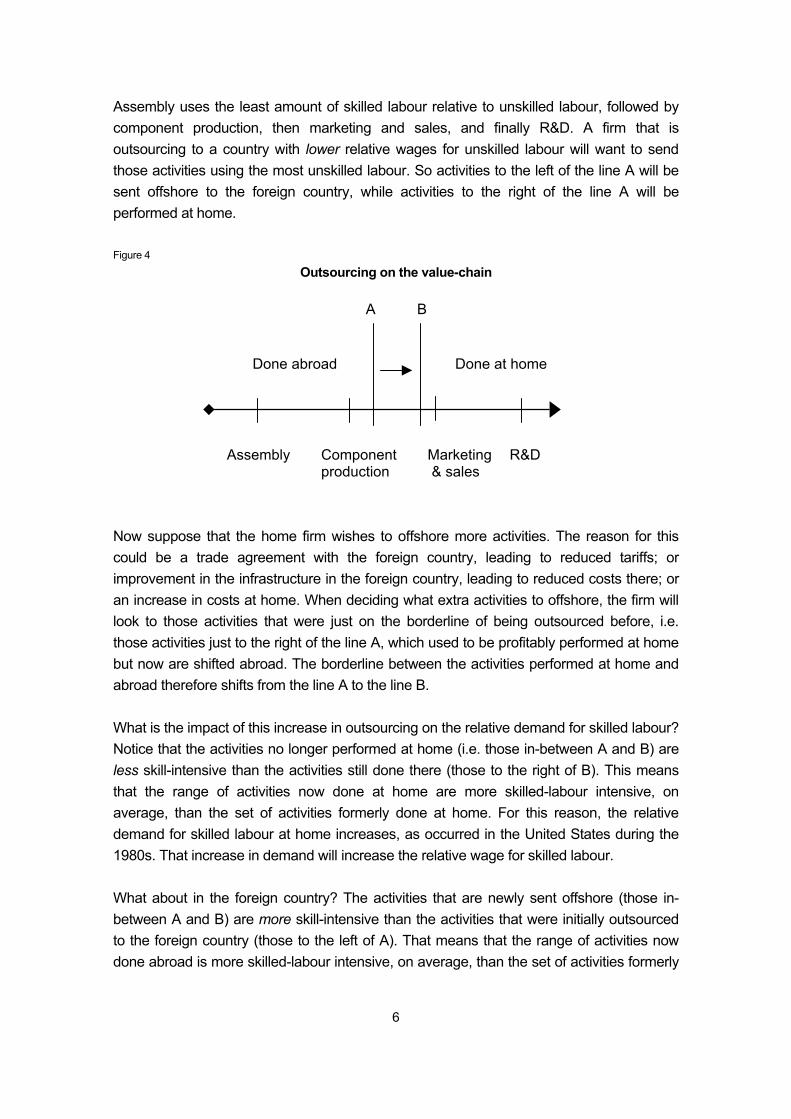
To understand how outsourcing will increase the relative demand for skilled labour, we need to use the ‘value chain’ of a firm, which includes all the activities involved in the production of a good or service, from research and development (R&D) to assembly to marketing and after-sales service. For the purpose of modelling outsourcing, rather than arranging activities in the order they are actually performed, we instead arrange them in increasing ratio of skilled/unskilled labour used in each activity, as shown in Figure 4.
1 See Bhagwati and Kosters (1994) and Bhagwati (2004), especially Chapter 10, which will be re-published with a new
Afterword (25 November 2006). Early writers on the trade and wages issue include Berman, Bound and Griliches (1994) and Lawrence and Slaughter (1993) both of which argue that trade is not the main cause of the change in wages.
6
A
Done abroad Done at home
Assembly Component Marketing R&D production & sales
B
Assembly uses the least amount of skilled labour relative to unskilled labour, followed by component production, then marketing and sales, and finally R&D. A firm that is outsourcing to a country with lower relative wages for unskilled labour will want to send those activities using the most unskilled labour. So activities to the left of the line A will be sent offshore to the foreign country, while activities to the right of the line A will be performed at home. Figure 4
Outsourcing on the value-chain Now suppose that the home firm wishes to offshore more activities. The reason for this could be a trade agreement with the foreign country, leading to reduced tariffs; or improvement in the infrastructure in the foreign country, leading to reduced costs there; or an increase in costs at home. When deciding what extra activities to offshore, the firm will look to those activities that were just on the borderline of being outsourced before, i.e. those activities just to the right of the line A, which used to be profitably performed at home but now are shifted abroad. The borderline between the activities performed at home and abroad therefore shifts from the line A to the line B. What is the impact of this increase in outsourcing on the relative demand for skilled labour? Notice that the activities no longer performed at home (i.e. those in-between A and B) are less skill-intensive than the activities still done there (those to the right of B). This means that the range of activities now done at home are more skilled-labour intensive, on average, than the set of activities formerly done at home. For this reason, the relative demand for skilled labour at home increases, as occurred in the United States during the 1980s. That increase in demand will increase the relative wage for skilled labour. What about in the foreign country? The activities that are newly sent offshore (those in-between A and B) are more skill-intensive than the activities that were initially outsourced to the foreign country (those to the left of A). That means that the range of activities now done abroad is more skilled-labour intensive, on average, than the set of activities formerly
7
done there. For this reason, the relative demand for skilled labour in the foreign country also increases. With this increase in the relative demand for skilled labour, the relative wage of skilled labour also increases in the foreign country. That outcome occurred in Mexico during the 1980s, just like that in the United States, exactly as predicted from the model of outsourcing! Trade versus technology
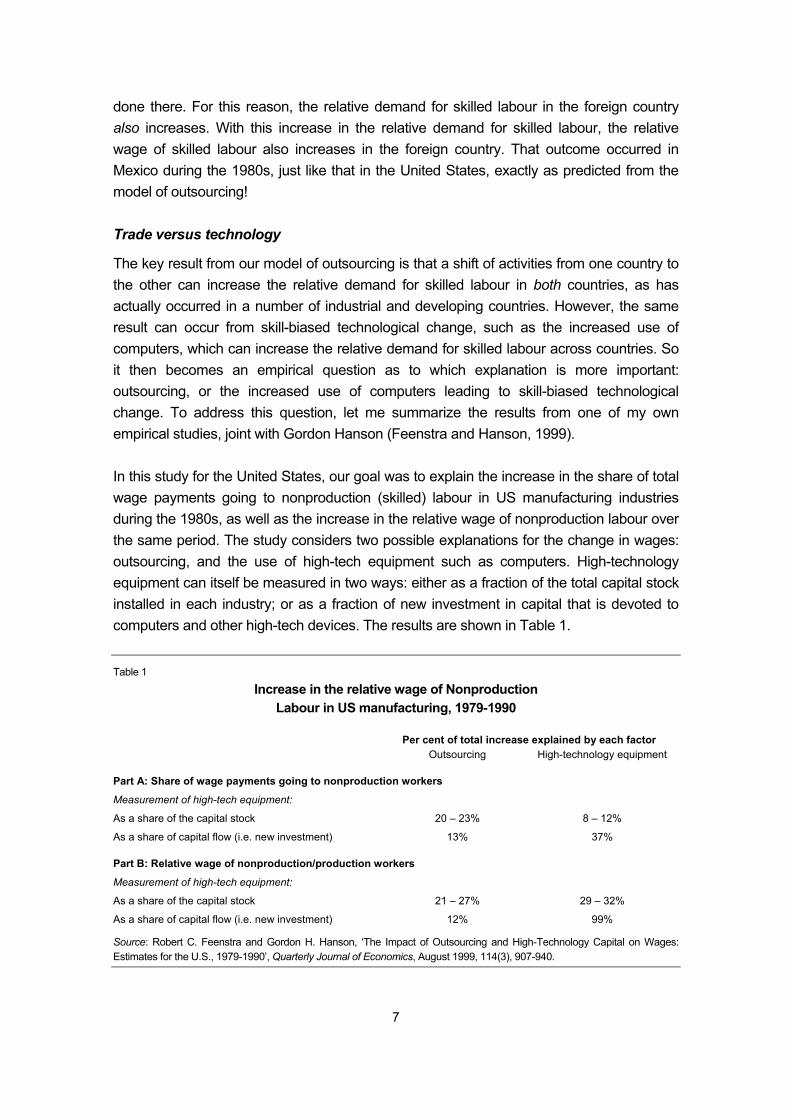
The key result from our model of outsourcing is that a shift of activities from one country to the other can increase the relative demand for skilled labour in both countries, as has actually occurred in a number of industrial and developing countries. However, the same result can occur from skill-biased technological change, such as the increased use of computers, which can increase the relative demand for skilled labour across countries. So it then becomes an empirical question as to which explanation is more important: outsourcing, or the increased use of computers leading to skill-biased technological change. To address this question, let me summarize the results from one of my own empirical studies, joint with Gordon Hanson (Feenstra and Hanson, 1999). In this study for the United States, our goal was to explain the increase in the share of total wage payments going to nonproduction (skilled) labour in US manufacturing industries during the 1980s, as well as the increase in the relative wage of nonproduction labour over the same period. The study considers two possible explanations for the change in wages: outsourcing, and the use of high-tech equipment such as computers. High-technology equipment can itself be measured in two ways: either as a fraction of the total capital stock installed in each industry; or as a fraction of new investment in capital that is devoted to computers and other high-tech devices. The results are shown in Table 1. Table 1
Increase in the relative wage of Nonproduction Labour in US manufacturing, 1979-1990
Per cent of total increase explained by each factor Outsourcing High-technology equipment
Part A: Share of wage payments going to nonproduction workers
Measurement of high-tech equipment:
As a share of the capital stock 20 – 23% 8 – 12%
As a share of capital flow (i.e. new investment) 13% 37%
Part B: Relative wage of nonproduction/production workers
Measurement of high-tech equipment:
As a share of the capital stock 21 – 27% 29 – 32%
As a share of capital flow (i.e. new investment) 12% 99%
Source: Robert C. Feenstra and Gordon H. Hanson, ‘The Impact of Outsourcing and High-Technology Capital on Wages: Estimates for the U.S., 1979-1990’, Quarterly Journal of Economics, August 1999, 114(3), 907-940.
8
Using the first measure of high-tech equipment (that is, as a fraction of the capital stock), around 20% of the increase in the share of wage payments going the nonproduction workers was explained by outsourcing, and about 10% of that increase was explained by the growing use of high-tech capital. Thus, using the first measure of high-tech equipment, it appears that outsourcing was more important than high-tech capital in explaining the change in relative demand for skilled workers. The results are different, however, when the second measure of high-tech equipment (as a fraction of new investment) is used. In that case, outsourcing explains only 13% of the increase in the nonproduction share of wages, whereas high-tech investment explains 37% of that increase. So we see that both outsourcing and high-tech equipment are important explanations for the increase in the relative share of skilled labour in the US, but which one is most important depends on how we measure high-tech equipment. Moving on to the increase in the relative wage of nonproduction workers, using the first measure of high-tech equipment (as a fraction of the capital stock), about 25% of the increase in the relative wage of nonproduction workers was explained by outsourcing, and 30% of that increase was explained by the growing use of high-tech capital. Using the other measure of high-tech equipment (as a fraction of new investment), the large spending on high-tech equipment in new investment can explain nearly all (99%) of the increased relative wage for nonproduction workers, leaving little room for outsourcing to play much of a role. These results are lopsided enough that we might be sceptical of using new investment to measure high-tech equipment and therefore prefer the results using the capital stocks. I mention these last results because using high-tech equipment as a fraction of new investment is often used by labour economists (such as Larry Katz and David Autor, 1999), which explains why they find very little scope for outsourcing to be important in their regressions. Those views might be changing, however. Interviewed for an article in the New York Times just a few weeks ago, David Autor said that:2
The consensus until recently was that trade was not a major cause of the earnings inequality in this country …That consensus is now being revisited.
3 Outsourcing and productivity
Summing up, both outsourcing and high-tech equipment are important explanations for the shift in demand towards nonproduction workers in US manufacturing, though the relative contributions of the two measures are very sensitive to how we measure high-tech equipment. But the results I have reported so far are only part of the story, since I have focused on explaining either the share of wage payments going to nonproduction workers,
2 Louis Uchitell, ‘To Mend the Flaws in Trade’, The New York Times, 30 January 2007, pp. C1-C7.
9
or the relative wage of nonproduction workers. Instead, we could ask about the real wages of nonproduction and production workers. Regardless of how outsourcing affects the relative wages, it is entirely possible that the real wages of all workers will improve. The reason for this improvement is that outsourcing leads to a productivity increase for firms, which will lower the prices for final goods. It is certainly possible that the drop in prices exceeds the fall in the wage of either type of worker, so that real wages improve. That possibility is shown in the model of Feenstra and Hanson (1996), which uses the value-chain of a firm. The same result occurs more strongly in the recent model of Gene Grossman and Esteban Rossi-Hansberg (2006), where the real wage of less-skilled workers is guaranteed to rise due to the productivity-enhancing effect of outsourcing. The model of Grossman and Rossi-Hansberg (2006) generated substantial attention when it was presented at the meeting of the Federal Reserve Bank in Jackson Hole last summer, meriting a write-up in the Economist magazine at the time and again last month. Let me quote from that article:3
Offshoring makes firms more productive. The tasks that are best kept close to home remain onshore; other tasks can be taken care of in cheaper places abroad. Everyone benefits from this gain in productivity, including workers who have fewer tasks to perform.
Evidence for the United States
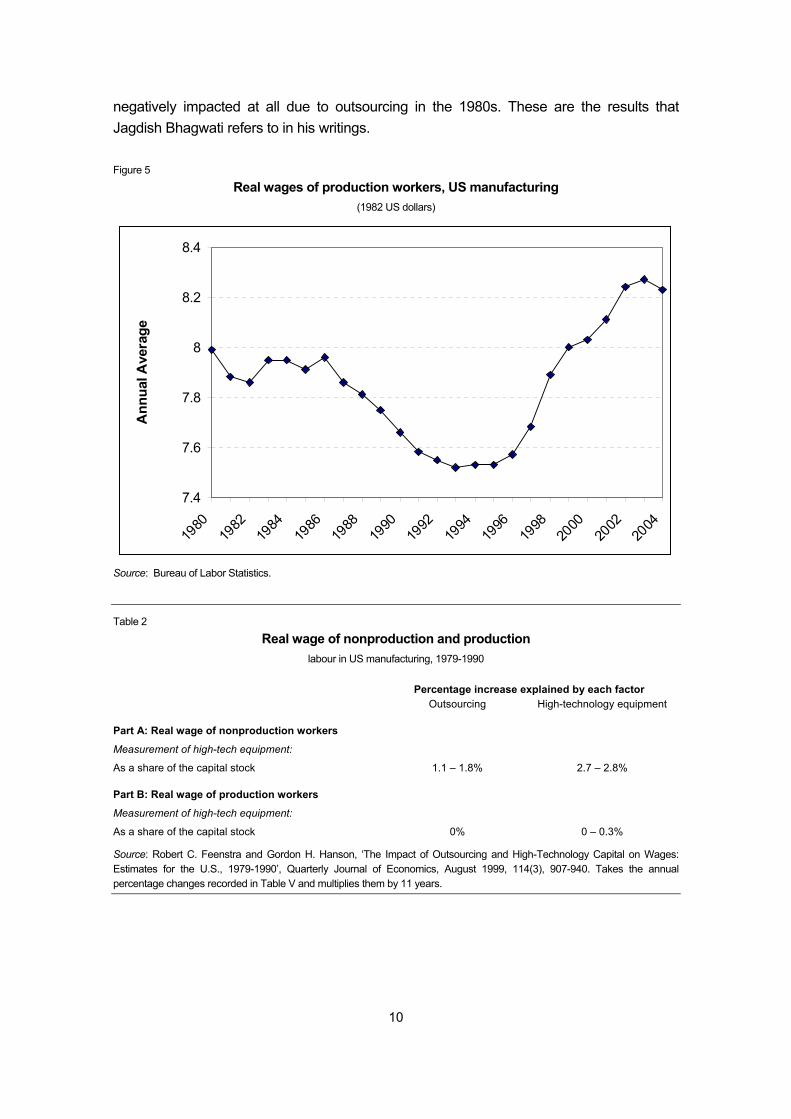
The real wages of production workers in US manufacturing are shown in Figure 5, and tell a mixed story. From the mid-1980s to the mid-1990s, real wages of production workers fell. Fortunately, they recovered in the latter part of the 1990s, so that by 2000 real wages exceeded their level in earlier years. They have continued to rise, but with a slight dip in 2004. To see the impact of outsourcing on real wages, let us return to my earlier study with Gordon Hanson (1999). Let me focus on the most reliable case where high-tech capital is measured as a share of the capital stock. In Table 2, I record our estimates of the impact of outsourcing during the 1980s on real wages of nonproduction and production workers. For nonproduction workers, we estimate that their real wages rose between 1 and 2% due to outsourcing over the entire 11-year period, and closer to 3% due to the increased use of high-technology capital. For production workers, we cannot identify any significant impact of outsourcing on their real wage, and a very slight positive impact of the increased use of high-tech capital. So for both types of labour, there is no evidence that real wages are
3 The Economist, Economics Focus, ‘The Great Unbundling: Does Economics Need a New theory of Offshoring?’,
18 January 2007.
10
negatively impacted at all due to outsourcing in the 1980s. These are the results that Jagdish Bhagwati refers to in his writings. Figure 5
Real wages of production workers, US manufacturing (1982 US dollars)
7.4
7.6
7.8
8
8.2
8.4
1980
1982
1984
1986
1988
1990
1992
1994
1996
1998
2000
2002
2004
Ann
ual A
vera
ge
Source: Bureau of Labor Statistics.
Table 2
Real wage of nonproduction and production labour in US manufacturing, 1979-1990
Percentage increase explained by each factor Outsourcing High-technology equipment
Part A: Real wage of nonproduction workers
Measurement of high-tech equipment:
As a share of the capital stock 1.1 – 1.8% 2.7 – 2.8%
Part B: Real wage of production workers
Measurement of high-tech equipment:
As a share of the capital stock 0% 0 – 0.3%
Source: Robert C. Feenstra and Gordon H. Hanson, ‘The Impact of Outsourcing and High-Technology Capital on Wages: Estimates for the U.S., 1979-1990’, Quarterly Journal of Economics, August 1999, 114(3), 907-940. Takes the annual percentage changes recorded in Table V and multiplies them by 11 years.
11
Outsourcing in the 1990s and services
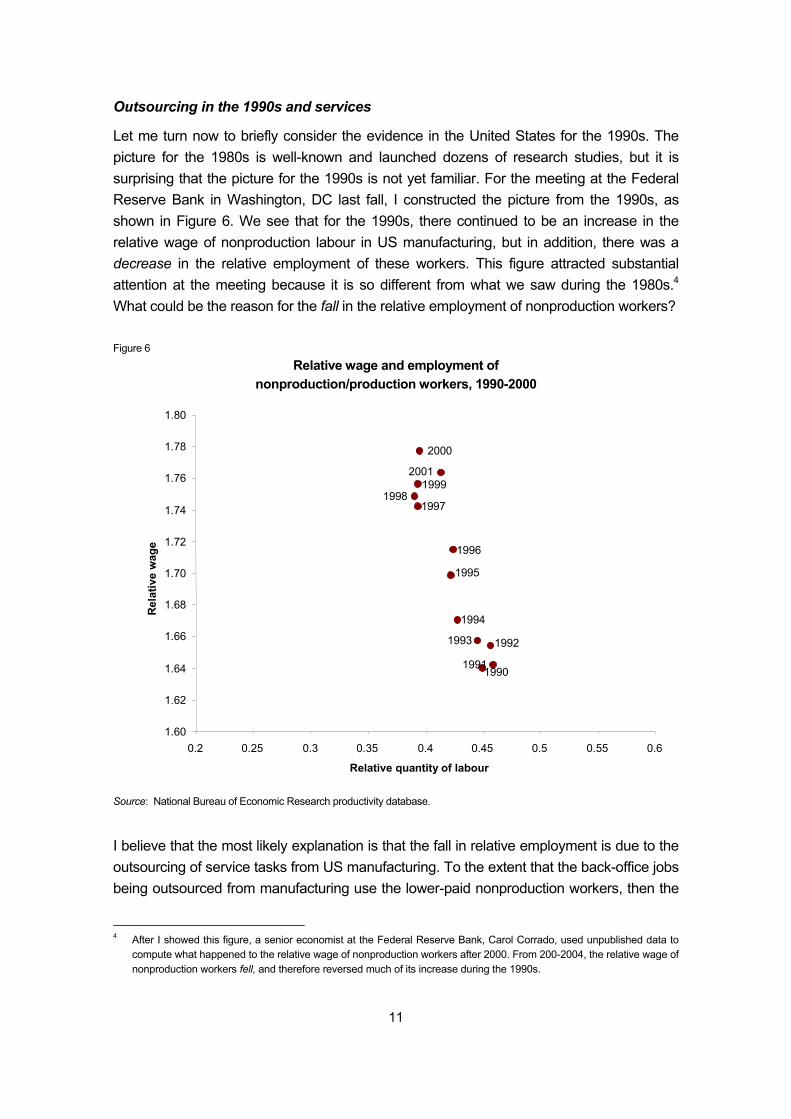
Let me turn now to briefly consider the evidence in the United States for the 1990s. The picture for the 1980s is well-known and launched dozens of research studies, but it is surprising that the picture for the 1990s is not yet familiar. For the meeting at the Federal Reserve Bank in Washington, DC last fall, I constructed the picture from the 1990s, as shown in Figure 6. We see that for the 1990s, there continued to be an increase in the relative wage of nonproduction labour in US manufacturing, but in addition, there was a decrease in the relative employment of these workers. This figure attracted substantial attention at the meeting because it is so different from what we saw during the 1980s.4 What could be the reason for the fall in the relative employment of nonproduction workers? Figure 6
Relative wage and employment of nonproduction/production workers, 1990-2000
2001
2000
19991998
1997
1996
1995
1994
1993 1992
19911990
1.60
1.62
1.64
1.66
1.68
1.70
1.72
1.74
1.76
1.78
1.80
0.2 0.25 0.3 0.35 0.4 0.45 0.5 0.55 0.6
Relative quantity of labour
Rel
ativ
e w
age
Source: National Bureau of Economic Research productivity database.
I believe that the most likely explanation is that the fall in relative employment is due to the outsourcing of service tasks from US manufacturing. To the extent that the back-office jobs being outsourced from manufacturing use the lower-paid nonproduction workers, then the
4 After I showed this figure, a senior economist at the Federal Reserve Bank, Carol Corrado, used unpublished data to
compute what happened to the relative wage of nonproduction workers after 2000. From 200-2004, the relative wage of nonproduction workers fell, and therefore reversed much of its increase during the 1990s.
12
offshoring of those jobs could very well raise the average wage among nonproduction workers. At the same time, sending these activities overseas will also lower the relative employment of non-production workers. So I interpret the pattern shown in Figure 6 as suggestive evidence for the offshoring of service activities within manufacturing. Once again, however, there is no need for a change in the relative wage of nonproduction labour to be associated with any decline in real wages. The real wage of production workers can rise, or at least not fall, provided that the service outsourcing leads to a sufficiently large increase in productivity. Fortunately, it appears that outsourcing has indeed has a significant impact on productivity in US manufacturing during 1990s, and let me summarize those results (Amiti and Wei, 2005, 2006). In addition to measuring the outsourcing of material inputs, as we did in the earlier case study, let us also evaluate the outsourcing of service inputs. In the United States, the amount of imported service inputs is small but growing. Measured as a share of total inputs purchased, imported services were 0.2% in 1992 (i.e. two-tenths of one per cent of total inputs), and grew to 0.3% in 2000 (i.e. three-tenths of one per cent), which is an increase of 50%, as shown in Table 3. The fact that imported services are small does not prevent them from being important for productivity. Over the same period, the imports of material inputs increased from 12 to 17% of total inputs used in manufacturing, also an increase of about 50%. In addition to service and materials outsourcing, I will also consider the contribution of high-technology equipment, such as computers, to productivity. High-technology equipment is measured as a share of the capital stock, which was the preferred method from the earlier study, and not as a share of new investment. Table 3
Offshoring intensity, 1992-2000
Share of imported material inputs Share of imported service inputs
Year % %
1992 11.7 0.18
1993 12.7 0.18
1994 13.4 0.20
1995 14.2 0.20
1996 14.3 0.21
1997 14.6 0.23
1998 14.9 0.24
1999 15.6 0.29
2000 17.3 0.29
Source: Mary Amiti and Shang-Jin Wei, 2005, ‘Service Offshoring, Productivity, and Employment: Evidence from the United States’, IMF Working Paper 05/238, International Monetary Fund, Washington, D.C.

13
In Table 4, I show the impact of service outsourcing, materials outsourcing and high-technology equipment on manufacturing productivity, which is measured by value-added per worker. During the 1990s, service outsourcing explains more than 10% of the total increase in productivity. Despite the small amount of service imports, it explains a significant portion of productivity growth. In addition, the outsourcing of material inputs explains another 5% or so of the increase in productivity, and likewise for the increased use of high-tech capital in manufacturing. Adding together these contributions, we see that these three factors explain as much as one-quarter of productivity growth. Since productivity rose by about 4% per year in manufacturing, we conclude that outsourcing together with the increased use of high-tech equipment can explain as much as one percentage point of productivity growth per year, which is certainly important. Table 4
Impact of outsourcing on productivity in US manufacturing, 1992-2000
Per cent of total increase in productivity explained by each factor:
Service outsourcing Materials outsourcing High technology equipment
11-13% 3-6% 4-7%
Source: Mary Amiti and Shang-Jin Wei, 2005, ‘Service Offshoring, Productivity, and Employment: Evidence from the United States’, IMF Working Paper 05/238, International Monetary Fund, Washington, D.C.; 2006, ‘Service Offshoring and Productivity: Evidence from the United States’, NBER Working Paper No. 11926.
4 Productivity and wages in NAFTA
So much for the United States. Let me now turn elsewhere in North America to see the linkages between trade, productivity and wages. I will begin with Mexico. Evidence for Mexico
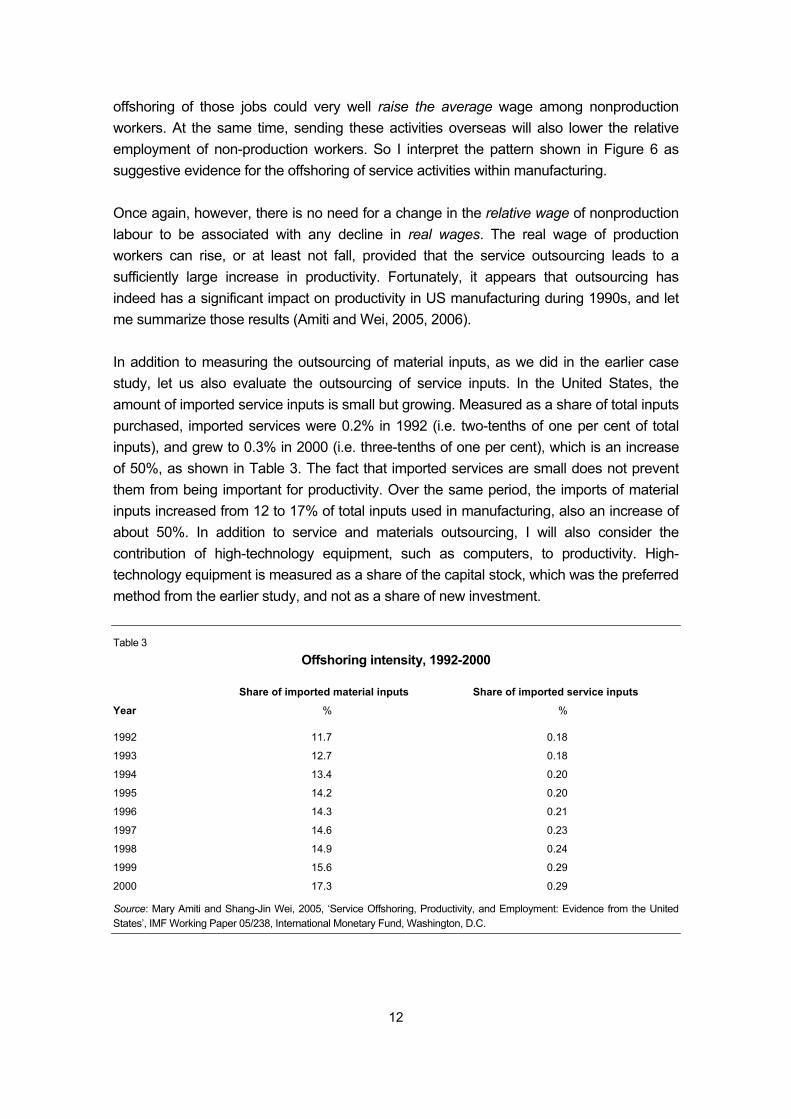
We saw earlier that the relative wage of nonproduction workers rose in Mexico, just like in the United States. But that evidence only went to 1994, when NAFTA began. We are more interested in what has happened to productivity and wages after NAFTA, as shown in Figure 7. There I show the growth in labour productivity for two types of manufacturing firms: first, the maquiladora plants in panel (a), which are close to the border and produce almost exclusively for export to the US; and second, all other manufacturing plants in Mexico in panel (b).5 The maquiladora plants should be most affected by NAFTA. In each diagram, I show what happened to productivity, to real wages and to real income.
5 These figures are drawn from data reported in Hufbauer and Schott (2005), Table 1.9, p. 45.
14
Figure 7
Labour productivity and wages in Mexico (a) Mexican manufacturing (Maquiladora)
75
100
125
150
1990 1991 1992 1993 1994 1995 1996 1997 1998 1999 2000 2001 2002 2003
Labor Productivity Real wages Real monthly income
(b) Mexican manufacturing (Non-Maquiladora)
75
100
125
150
1990 1991 1992 1993 1994 1995 1996 1997 1998 1999 2000 2001 2002 2003
Labor Productivity Real wages Real monthly income
Source: Gary C. Hufbauer and Jeffrey J. Schott, NAFTA Revisited, Institute for International Economics, 2005, p. 45.
15
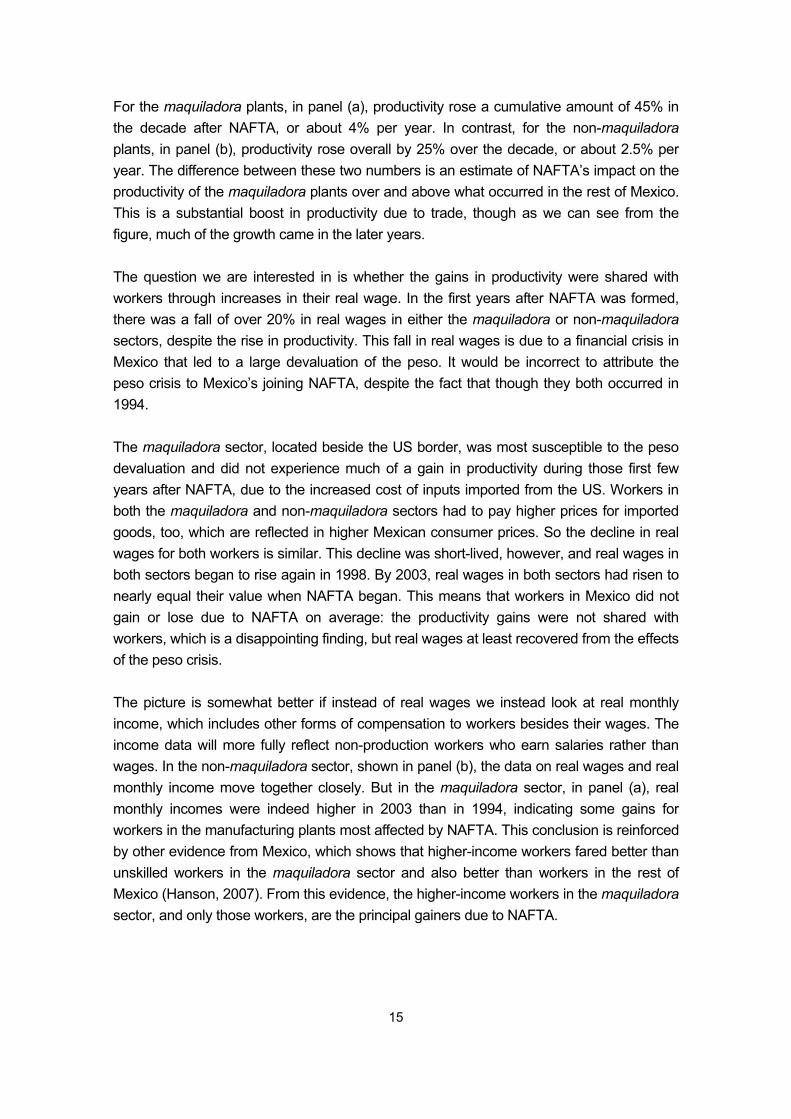
For the maquiladora plants, in panel (a), productivity rose a cumulative amount of 45% in the decade after NAFTA, or about 4% per year. In contrast, for the non-maquiladora plants, in panel (b), productivity rose overall by 25% over the decade, or about 2.5% per year. The difference between these two numbers is an estimate of NAFTA’s impact on the productivity of the maquiladora plants over and above what occurred in the rest of Mexico. This is a substantial boost in productivity due to trade, though as we can see from the figure, much of the growth came in the later years. The question we are interested in is whether the gains in productivity were shared with workers through increases in their real wage. In the first years after NAFTA was formed, there was a fall of over 20% in real wages in either the maquiladora or non-maquiladora sectors, despite the rise in productivity. This fall in real wages is due to a financial crisis in Mexico that led to a large devaluation of the peso. It would be incorrect to attribute the peso crisis to Mexico’s joining NAFTA, despite the fact that though they both occurred in 1994. The maquiladora sector, located beside the US border, was most susceptible to the peso devaluation and did not experience much of a gain in productivity during those first few years after NAFTA, due to the increased cost of inputs imported from the US. Workers in both the maquiladora and non-maquiladora sectors had to pay higher prices for imported goods, too, which are reflected in higher Mexican consumer prices. So the decline in real wages for both workers is similar. This decline was short-lived, however, and real wages in both sectors began to rise again in 1998. By 2003, real wages in both sectors had risen to nearly equal their value when NAFTA began. This means that workers in Mexico did not gain or lose due to NAFTA on average: the productivity gains were not shared with workers, which is a disappointing finding, but real wages at least recovered from the effects of the peso crisis. The picture is somewhat better if instead of real wages we instead look at real monthly income, which includes other forms of compensation to workers besides their wages. The income data will more fully reflect non-production workers who earn salaries rather than wages. In the non-maquiladora sector, shown in panel (b), the data on real wages and real monthly income move together closely. But in the maquiladora sector, in panel (a), real monthly incomes were indeed higher in 2003 than in 1994, indicating some gains for workers in the manufacturing plants most affected by NAFTA. This conclusion is reinforced by other evidence from Mexico, which shows that higher-income workers fared better than unskilled workers in the maquiladora sector and also better than workers in the rest of Mexico (Hanson, 2007). From this evidence, the higher-income workers in the maquiladora sector, and only those workers, are the principal gainers due to NAFTA.
16
Evidence for Canada
Next, let me turn to the impact of free trade with the United States on productivity and wages in Canada. There were studies by the Economic Council of Canada dating back to the 1960s that predicted substantial gains from free trade with the US, as Canadian firms would expand their scale of operations and lower costs. A set of simulations performed by the Canadian economist Richard Harris (1984a,b) in the mid-1980s were very influential in convincing Canadian policy makers to proceed with the free trade agreement with the US in 1989. Enough time has passed since then to look back and see what the outcome has been. A recent study for Canada, by Daniel Trefler (2004), does just that. Trefler uses firm-level data during the decades before and after the Canada-US free trade agreement, and is interested in the impact of the agreement on the selection and productivity of firms. He obtains a number of clear results.6 First, Canadian industries that had relied most on tariffs saw their employment fall by 12% due to the elimination of tariffs. In manufacturing overall, the trade agreement reduced employment by 5%. Second, these job losses were a short-term effect, and over a 10-year period, employment in Canadian manufacturing did not drop. While low-productivity plants shut down, high-productivity Canadian manufacturers expanded into the United States. Third, the trade agreement set off a productivity boom. Formerly sheltered Canadian companies began to compete with, and compare themselves to, more efficient American businesses. Some went under, but others significantly improved operations. In the formerly sheltered industries most affected by the tariff cuts, labour productivity jumped 15%, or an annual rate of 1.9%, at least half from closing inefficient plants. To summarize, Trefler finds overwhelming evidence that the Canada-US free trade agreement resulted in the self-selection of Canadian firms, with only the more productive firms surviving. Productivity in Canadian manufacturing overall rose 6%. This productivity gain translates directly into higher wages or lower prices, and is a gain from trade for workers. Trefler’s estimates of the gains are the highest we have seen from any country study, and probably higher than would occur in the US, simply because trade is a much higher fraction of GDP for Canada. But we could expect some of the European countries to show productivity gains of the same magnitude as Canada, provided that the labour market institutions are flexible enough to allow for the entry and exit of firms on the same scale as occurred in Canada.
6 These results are drawn from an interview of Trefler by Virginia Postrel, ‘Economic Scene’, The New York Times,
27 January 2005, p. C2, posted on the home page for Daniel Trefler at the University of Toronto.
17
5 Other sources of gains from trade
Before moving to my last topic, which is immigration in North America, let me pause and ask whether there are any other sources of gains for workers that I have not yet considered. In fact, there are. Beside increasing the productivity of firms, free trade can be expected to expand the variety of goods available to consumers, leading to gains for that reason. This source of gain due to product variety has been well known in theory for several decades, but it is only very recently that we have been able to estimate such gains. To explain why it has been difficult to estimate these gains, let me go back to the simulation models for Canada-US free trade by Richard Harris (1984a, 1984b). Harris based his model on the idea that firms have economies of scale, but in the small Canadian market, firms would be unable to expand their output to realize these economies. That is why free trade with the United States is so attractive from the Canadian standpoint: it allows for an expansion of firms’ scale and a fall in costs, which is just another way of saying that productivity rises. Harris based his estimates of economies of scale on engineering studies, and was able to predict substantial gains for Canada due to free trade, as Trefler confirmed. But Harris was reluctant to build into his model another common assumption: that firms produce differentiated products. The reason, I believe, is that Harris realized that the calculated gains from trade would be very sensitive to the extent of differentiation across products, i.e. on the elasticity of substitution. If the elasticity of substitution is high, then products easily substitute for each other, and consumers do not gain much from having new varieties available. A high elasticity of substitution may describe T-shirts for example, where we probably don’t care too much whether our T-shirts comes from China, India, Vietnam, or wherever. But as soon as we leave such basic items of clothing, and go to higher-fashion items, then the product sold by one company is probably quite different from the product sold by another. Consumers gains by having more choices available when they shop for fashion items, or electronics, or nearly anything else. So the elasticity of substitution between these items is lower, which indicates that consumers benefit more from having greater variety available. Harris was reluctant to build product differentiation into his simulation model for Canada because he did not know what value to use for the elasticity of substitution in each industry. For technical reasons (as described in Feenstra, 2006), the estimates for the elasticity that were available in the 1980s were quite poor. Often the elasticities were too low, which would result in exaggerated estimates of the consumer benefits from product variety. Harris realized this potential for bias in his simulation results, so whereas he always made
18
use of economies of scale, he added product differentiation only a secondary feature to the simulation models. But now two decades later, we do have the statistical technique we need to estimate the elasticity of substitution between varieties of each and every product. This statistical technique comes from Feenstra (1994), which deals with the empirical methods needed to analyse the gains from trade due to expanding product variety. I applied that statistical technique to just half a dozen products, obtaining estimates of the elasticity of substitution for each. Now more than ten years later, our computing power has increased by several orders of magnitude, and the same technique been applied to over 30,000 products in recent work by Christian Broda and David Weinstein (2006), for the United States. They treat imports coming from new supplying countries as new product varieties. By combining the data on imports from new supplying countries with estimates of the elasticity of substitution, Broda and Weinstein come away with an estimate of the gains from trade for the US due to the expansion of import varieties, which amounts to 2.6% of GDP in 2001. Economists sometimes get very excited over small numbers, but 2.6% of GDP is actually a very large number. It indicates the ongoing annual gains from having the import varieties available from new supplying countries. I would expect that a number of the same or greater magnitude would apply to the gains to the European Union from having new import varieties available, and there could quite possibly be even larger gains from internal-EU trade. Those estimates for Europe have not yet been made, but I hope that they will. Evidence for Europe
While estimates of the gains from product variety are not available for Europe, there are a number of studies looking at a closely related topic, which is the impact of unification of the European market on the prices charged by firms. Simulations done in the late 1980s by Alasdair Smith and Tony Venables (1988, 1991) predicted large gains to the 1992 Single Market reforms in Europe, allowing for greater unification of the market. Smith and Venables expected that firms would be forced to equalize their selling prices across markets. In other words, rather than treating Europe as a collection of segmented markets, where firms could choose their prices in each country separately, Europe would instead become a unified market where firms could not price-discriminate. As price-discrimination is eliminated, then the average prices are expected to fall, providing benefits to consumers. Given the 15 years since the Single Market reforms of 1992, and the much shorter period since the adoption of the Euro in 2002, we can ask whether the prediction of unified and lower prices within Europe has been realized. Some positive results are starting to appear. A recent paper by Harald Badinger (2006) uses sectoral data from 1981 to 1999 and finds solid evidence of markup reductions in manufacturing and construction, but not in services. The service industry that we are all perhaps most familiar with is restaurants, where it is
19
widely believed that prices increased following the adoption of the Euro. But a new paper by Hobijn, Ravenna and Tombalotti (2006) argues that this increase can be understood as making up for unusually small price changes prior to the adoption of the Euro, and in fact, the real puzzle is why such price increases were not more widespread. So I conclude that there is some evidence in favour of falling markups in Europe, but not in all sectors. Clearly, Europe is the ideal testing ground to look for the positive impact of trade on productivity, as well. We can hope that further empirical research will add to the results that we have already, demonstrating the gains from a unified market in Europe. 6 Immigration to the United States
Let me turn now to my final topic, the question of how migration within North America affects wages. Migration within the European Union is of major concern, of course, as Romania and Bulgaria have joined, along with the 10 central and eastern European countries in 2004. Established members of the EU are understandably concerned with the pressure on wages and employment that might result from immigration from countries with much lower wages. We have an analogy within North America with the large inflow of immigrants to the United States from Mexico and other developing countries. How has this wave of immigration over the past twenty-five years affected US wages? The idea that immigrants lead to downward pressure on local wages has not been realized to the extent that was feared the United States. There are two offsetting effects which limit the need for local wages to adjust. First, there can be an expansion of industries employing the immigrants, thereby allowing these workers to be absorbed without a fall in wages. Second, it turns out that the immigrants coming into the United States are at different education levels – either less-educated or more-educated – than the majority of the US population. That also limits the fall in wages due to competition between workers, and in fact, allows for some complementary effects of immigrants on local wages. Mariel Boat Lift
To see these effects at work, let me begin with an isolated example from the United States that has been studied in depth. Known as the Mariel Boat Lift, this case occurred in 1980 when, for political reasons, a wave of refugees were allowed to leave the port of Mariel, Cuba and sail to Miami, Florida. From May to September of that year, about 125,000 refugees arrived in Miami, and increased that city’s overall population by 7%. Not surprisingly, the refugees were less skilled than the other workers in Miami. What is surprising, however, is that this influx of low-skilled immigrants does not appear to have pulled down the wages of other less-skilled workers in Miami (Card, 1990). The wages for low-skilled workers in Miami pretty much followed national trends over this period, despite
20
the large inflow of workers from Cuba. This finding contradicts the prediction that the inflow of low-skilled workers should bid down wages, and calls for an explanation. One explanation comes from a careful study of what happened to the output of various industries in Miami during this time period (Lewis, 2004). It turns out that certain labour-intensive industries in Miami, such as apparel, declined by less than we would have predicted from national trends. In other words, the industries using less-skilled workers intensively, like apparel, expanded relative to the national trend to absorb more of the Cuban workers. As some industries expand relative to their trend, it is logical to expect other industries to contract, which also occurred in Miami. A group of skill-intensive industries (including motor vehicles, electronic equipment, and aircraft) fell more rapidly in Miami after 1980. This finding illustrates that there was a change in the industry mix in Miami, towards those industries using less-skilled labour and away from those using more-skilled labour, which allowed the city to absorb the Cuban refugees without a decline in wages. This example from Miami could perhaps be useful as we think about the immigration from the new EU members to other European countries. Britain was one of the European Union countries that opened its jobs to all nationals from the 10 countries joining in 2004, and as a result, 400,000 immigrants came in. That pressure has led Britain to limit the number of migrants permitted from Bulgaria and Romania, at least for now. The inflow of 400,000 migrants to Britain is slightly more than 5% of the population of London, which is less than the percentage inflow into Miami due to the Mariel boat-lift. As economists of the future look back on the experience of Britain due to this inflow, as well as other European countries, I submit that one crucial factor will be the extent to which industries can expand and contract, as needed, to absorb the inflow of immigrants. With sufficiently flexibility in industry output and employment, we should not expect that wages need to adjust to bear the burden of the labour inflows. Mexican migration to the United States
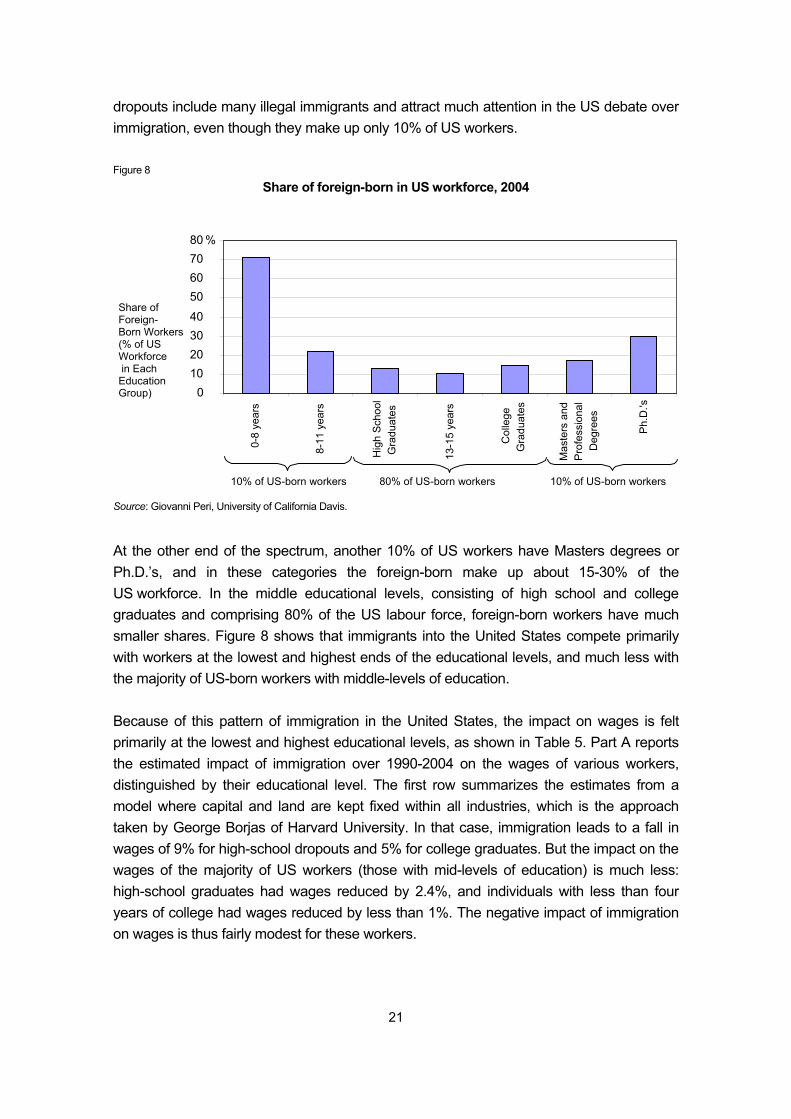
Let us shift from the isolated case of Cuban refuges in Miami to the overall inflow of immigrants to the United States. In 1980, the percentage of foreign-born persons in the US population was 6%, and since that time, the percentage has doubled to 13% in 2005. A sizable percentage of these immigrants are from Mexico. As shown by my colleague Giovanni Peri, the combination of legal and illegal immigrants in the US creates a ‘U-shaped’ pattern between the number of immigrants and their educational level, illustrated in Figure 8. Among those workers in the US with only less than 8 years of education, about 70% were foreign born, and for those with 8-11 years of education, slightly more than 20% were foreign born. These two categories of high-school
21
dropouts include many illegal immigrants and attract much attention in the US debate over immigration, even though they make up only 10% of US workers. Figure 8
Share of foreign-born in US workforce, 2004
Source: Giovanni Peri, University of California Davis.
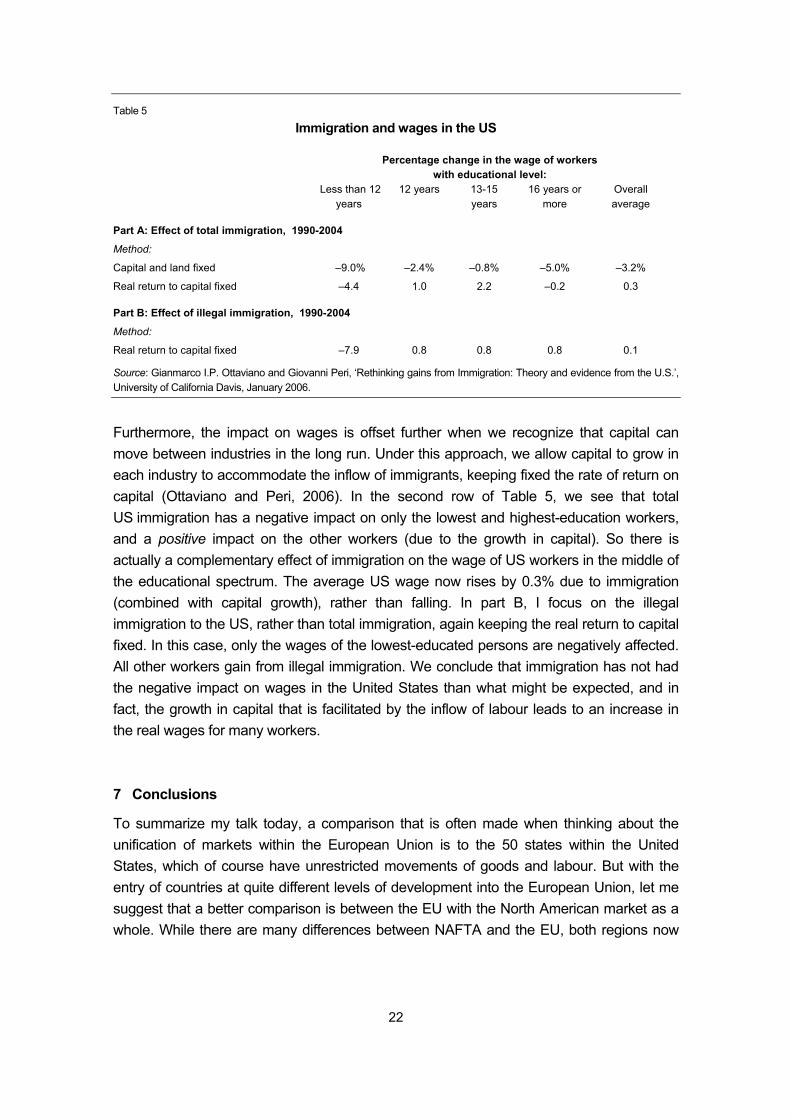
At the other end of the spectrum, another 10% of US workers have Masters degrees or Ph.D.’s, and in these categories the foreign-born make up about 15-30% of the US workforce. In the middle educational levels, consisting of high school and college graduates and comprising 80% of the US labour force, foreign-born workers have much smaller shares. Figure 8 shows that immigrants into the United States compete primarily with workers at the lowest and highest ends of the educational levels, and much less with the majority of US-born workers with middle-levels of education. Because of this pattern of immigration in the United States, the impact on wages is felt primarily at the lowest and highest educational levels, as shown in Table 5. Part A reports the estimated impact of immigration over 1990-2004 on the wages of various workers, distinguished by their educational level. The first row summarizes the estimates from a model where capital and land are kept fixed within all industries, which is the approach taken by George Borjas of Harvard University. In that case, immigration leads to a fall in wages of 9% for high-school dropouts and 5% for college graduates. But the impact on the wages of the majority of US workers (those with mid-levels of education) is much less: high-school graduates had wages reduced by 2.4%, and individuals with less than four years of college had wages reduced by less than 1%. The negative impact of immigration on wages is thus fairly modest for these workers.
Share of Foreign- Born Workers (% of US Workforce in Each Education Group) 0
10 20 30 40 50 60 70 80
0-8
year
s
8-11
yea
rs
Hig
h S
choo
l G
radu
ates
13-1
5 ye
ars
Col
lege
G
radu
ates
Mas
ters
and
P
rofe
ssio
nal
Deg
rees
Ph.
D.'s
10% of US-born workers10% of US-born workers 80% of US-born workers
%
22
Table 5
Immigration and wages in the US
Percentage change in the wage of workers with educational level:
Less than 12 years
12 years 13-15 years
16 years or more
Overall average
Part A: Effect of total immigration, 1990-2004
Method:
Capital and land fixed
Real return to capital fixed
–9.0%
–4.4
–2.4%
1.0
–0.8%
2.2
–5.0%
–0.2
–3.2%
0.3
Part B: Effect of illegal immigration, 1990-2004
Method:
Real return to capital fixed
–7.9
0.8
0.8
0.8
0.1
Source: Gianmarco I.P. Ottaviano and Giovanni Peri, ‘Rethinking gains from Immigration: Theory and evidence from the U.S.’, University of California Davis, January 2006.
Furthermore, the impact on wages is offset further when we recognize that capital can move between industries in the long run. Under this approach, we allow capital to grow in each industry to accommodate the inflow of immigrants, keeping fixed the rate of return on capital (Ottaviano and Peri, 2006). In the second row of Table 5, we see that total US immigration has a negative impact on only the lowest and highest-education workers, and a positive impact on the other workers (due to the growth in capital). So there is actually a complementary effect of immigration on the wage of US workers in the middle of the educational spectrum. The average US wage now rises by 0.3% due to immigration (combined with capital growth), rather than falling. In part B, I focus on the illegal immigration to the US, rather than total immigration, again keeping the real return to capital fixed. In this case, only the wages of the lowest-educated persons are negatively affected. All other workers gain from illegal immigration. We conclude that immigration has not had the negative impact on wages in the United States than what might be expected, and in fact, the growth in capital that is facilitated by the inflow of labour leads to an increase in the real wages for many workers. 7 Conclusions
To summarize my talk today, a comparison that is often made when thinking about the unification of markets within the European Union is to the 50 states within the United States, which of course have unrestricted movements of goods and labour. But with the entry of countries at quite different levels of development into the European Union, let me suggest that a better comparison is between the EU with the North American market as a whole. While there are many differences between NAFTA and the EU, both regions now
23
share a wide range of income and productivity levels across countries, that create both new opportunities for trade, as with outsourcing, but also challenges, as with immigration. There is substantial evidence for North America that free trade has led to higher levels of productivity and real wages. That is especially true for Canada and the United State. So far, Mexico has not shared in productivity gains in manufacturing to the same extent as those with its neighbours to the north. So this is subject for ongoing investigation. At the same time, the chief concern when Mexico joined NAFTA was with the potential competitive effects in agriculture, and especially on corn, which is a staple crop for the rural poor in Mexico. Fortunately, it appears that competition from US exports of corn has had a much more modest effect than was expected (McMillan, Zwane and Ashraf, 2007). There are several reasons for this outcome. First, the poorest farmers are not sellers of corn, but instead consume it themselves while buying the extra that they need. So these farmers benefited from cheaper prices for corn imported from the United States. Second, the Mexican government was able to use subsidies to offset the reduction in income for other corn farmers. Surprisingly, the total production of corn in Mexico has actually risen after NAFTA instead of falling. Even with these modest improvements in the agricultural sector in Mexico, the pressure for immigration to the United States remains very high. But there is little evidence to support the fear that such immigration leads to falling wages in the United States. On the contrary, once we recognize that industries can adjust their outputs and capital stocks, it turns out that immigration has a complementary effect on wages for many American workers. I hope that future generations of economists looking at the European Union will likewise find that the immigration has played a positive role, provided for higher incomes not only for the immigrants, but also for their new host countries. I congratulate the European Union on its continuing ability to absorb new members, thereby sharing the gains from trade with an ever widening group. It is a splendid example to the rest of the world of the benefits of free trade, as well as the willingness to work through the challenges involved.
24
References
Amiti, Mary and Shang-Jin Wei (2005), ‘Service Offshoring, Productivity, and Employment: Evidence from the United States’, IMF Working Paper 05/238.
Amiti, Mary and Shang-Jin Wei (2006), ‘Service Offshoring and Productivity: Evidence from the United States’, National Bureau of Economic Research working paper no. 11926.
Badinger, Harald (2006), ‘Has the EU’s Single Market Programme fostered competition? Testing for a decrease in markup ratios in EU industries’, Oxford Bulletin of Economics and Statistics, forthcoming.
Berman, Eli, John Bound, and Zvi Griliches (1994), ‘Changes in the Demand for Skilled Labor within U.S. Manufacturing: Evidence from the Annual Survey of Manufactures’, Quarterly Journal of Economics, 104, pp. 367-398.
Bhagwati, Jagdish (2004), In Defense of Globalization, Oxford University Press.
Bhagwati, Jagdish and Marvin H. Kosters (eds.) (1994), Trade and Wages, The AEI Press.
Broda, Christian and David E. Weinstein (2006), ‘Globalization and the Gains from Variety’, Quarterly Journal of Economics, 121(2), May, pp. 541-585.
Card, David (1990), ‘The Impact of the Mariel Boatlift on the Miami Labor Market’, Industrial Labor Relations Review, 43(2), January, pp. 245-257.
Feenstra, Robert C. (1994), ‘New Product Varieties and the Measurement of International Prices’, American Economic Review, 84(1), March, pp. 157-177.
Feenstra, Robert C. (2006), ‘New Evidence on the Gains from Trade’, Review of World Economics / Weltwirtschaftliches Archiv, December.
Feenstra, Robert C. and Gordon H. Hanson (1996), ‘Foreign Investment, Outsourcing and Relative Wages’, in R.C. Feenstra, G.M. Grossman and D.A. Irwin (eds.), The Political Economy of Trade Policy: Papers in Honor of Jagdish Bhagwati, MIT Press, pp. 89-127.
Feenstra, Robert C. and Gordon H. Hanson (1999), ‘The Impact of Outsourcing and High-Technology Capital on Wages: Estimates for the U.S., 1979-1990’, Quarterly Journal of Economics, 114(3), August, pp. 907-940.
Feenstra, Robert C. and Gordon H. Hanson (2003), ‘Global Production Sharing and Rising Inequality: A Survey of Trade and Wages’, in Kwan Choi and James Harrigan (eds.), Handbook of International Trade, Basil Blackwell, 2003, pp. 146-187.
Grossman, Gene and Esteban Rossi-Hansberg (2006), ‘Trading Tasks: A Simple Model of Outsourcing’, National Bureau of Economic Research working paper no. 12721.
Hanson, Gordon H. (2007), ‘Globalization, Labor Income and Poverty in Mexico’, in Ann Harrison (ed.), Globalization and Poverty, University of Chicago Press, forthcoming.
Harris, Richard (1984a), ‘Applied General Equilibrium Analysis of Small Open Economies with Scale Economies and Imperfect Competition’, American Economic Review, 74(5), December, pp. 1016-32.
Harris, Richard (1984b), Trade, Industrial Policy, and Canadian Manufacturing, Toronto: Ontario Economic Council.
Hobijn, Bart, Federico Ravenna and Andrea Tombalotti (2006), ‘Menu Costs at Work: Restaurant Prices and the Introduction of the Euro’, Quarterly Journal of Economics, 121(3), August, pp. 1103-1131.
Hufbauer, Gary C. and Jeffrey J. Schott (2005), NAFTA Revisited: Achievements and Challenges, Institute for International Economics.
25
Katz, Lawrence F. and David Autor (1999), ‘Changes in the Wage Structure and Earnings Inequality’, in Orley Ashenfelter and David Card (eds.), Handbook of Labor Economics, Vol. 3A, Amsterdam: Elsevier Science, pp. 1463-1555.
Lawrence, Robert Z. and Matthew Slaughter (1993), ‘International Trade and American Wages in the 1980s: Giant Sucking Sound or Small Hiccup?’, Brookings Papers on Economic Activity: Microeconomics, pp. 161-226.
Lewis, Ethan (2004), ‘How did the Miami Labor Market Absorb the Mariel Immigrants?’, Working Paper 04-3, Federal Reserve Bank of Philadelphia.
McMillan, Margaret, Alix Peterson Zwane and Nava Ashraf (2007), ‘My Policies or Yours: Does OECD Support for Agriculture Increase Poverty in Developing Countries?’, in Ann Harrison (ed.), Globalization and Poverty, University of Chicago Press, forthcoming.
Ottaviano, Gianmarco I.P. and Giovanni Peri (2006), ‘Rethinking Gains from Immigration: Theory and Evidence from the U.S.’, University of California Davis.
Smith, Alasdair and Anthony J. Venables (1988), ‘Completing the Internal Market in the European Community: Some Industry Simulations’, European Economic Review, 32, pp. 1501-1525.
Smith, Alasdair and Anthony J. Venables (1991), ‘Economic Integration and Market Access’, European Economic Review, Papers and Proceedings, 35, pp. 388-395.
Trefler, Daniel (2004), ‘The Long and Short of the Canada-U.S. Free Trade Agreement’, American Economic Review, 94(4), September, pp. 870-895.


Short list of the most recent wiiw publications (as of July 2007)
For current updates and summaries see also wiiw's website at www.wiiw.ac.at Globalization and Its Impact on Labour by Robert C. Feenstra wiiw Working Papers, No. 44, June 2007 26 pages including 5 Tables and 8 Figures hardcopy: EUR 8.00 (PDF: free download from wiiw’s website)
High Growth Continues, with Risks of Overheating on the Horizon by Vladimir Gligorov, Sándor Richter et al. wiiw Research Reports, No. 341, July 2007 (special issue on economic prospects for Central, East and Southeast Europe; covering Albania, Bosnia and Herzegovina, Bulgaria, Croatia, the Czech Republic, Hungary, Macedonia, Montenegro, Poland, Romania, Russia, Serbia, Slovakia, Slovenia, Ukraine, Turkey, and China) 139 pages including 65 Tables and 25 Figures hardcopy: EUR 70.00 (PDF: EUR 65.00) The Vienna Institute Monthly Report 7/07 edited by Leon Podkaminer • The Russian Oil Fund as a tool of stabilization and sterilization • Effects of the Unified Social Tax in Russia • Some issues related to the euro’s progress • Selected monthly data on the economic situation in ten transition countries, 2005-2007 • Guide to wiiw statistical services on Central, East and Southeast Europe, Russia and Ukraine wiiw, July 2007 30 pages including 12 Tables (exclusively for subscribers to the wiiw Service Package)
The Vienna Institute Monthly Report 6/07 edited by Leon Podkaminer • Reflections on transition, restructuring and integration in the Newly Independent States • Foreign trade restructuring in Belarus and Ukraine: a comparison • Capital transfers: effects of oligopoly • Selected monthly data on the economic situation in ten transition countries, 2005-2007 • Guide to wiiw statistical services on Central, East and Southeast Europe, Russia and Ukraine wiiw, June 2007 30 pages including 23 Tables (exclusively for subscribers to the wiiw Service Package)
Structural Change and Trade Integration on EU–NIS Borders by Peter Havlik wiiw Research Reports, No. 340, May 2007 32 pages including 13 Tables and 15 Figures hardcopy: EUR 22.00 (PDF: EUR 20.00)
The Sector Bias of Skill-biased Technical Change and the Rising Skill Premium in Transition Economies by Piero Esposito and Robert Stehrer wiiw Working Papers, No. 43, May 2007 25 pages including 5 Tables and 7 Figures hardcopy: EUR 8.00 (PDF: free download from wiiw’s website)

wiiw Database on Foreign Direct Investment in Central, East and Southeast Europe: Shift to the East by Gábor Hunya (concept and analysis) and Monika Schwarzhappel (database and layout) wiiw, Vienna, May 2007 104 pages including 81 Tables hardcopy: EUR 70.00 (PDF: EUR 65.00), CD-ROM (including hardcopy): EUR 145.00 Wirtschaftswachstum in den MOEL zunehmend durch heimische Nachfrage getragen by Vasily Astrov wiiw Research Papers in German language, May 2007 (reprinted from: WIFO-Monatsberichte, Vol. 80, No. 5, May 2007) 15 pages including 9 Tables and 3 Figures, EUR 8.00 (PDF: free download from wiiw's website) The Vienna Institute Monthly Report 5/07 edited by Leon Podkaminer • Kazakhstan: an economic assessment • The twin deficits: myth and real problems • Global financial architecture, legitimacy, and representation: voice for emerging markets • Selected monthly data on the economic situation in ten transition countries, 2005-2007 • Guide to wiiw statistical services on Central, East and Southeast Europe, Russia and Ukraine wiiw, May 2007 30 pages including 12 Tables and 2 Figures (exclusively for subscribers to the wiiw Service Package) Restructuring of Energy-intensive Industrial Branches in Romania and Proposals for Industrial Policy Measures by Gábor Hunya, Waltraut Urban et al. wiiw Research Reports, No. 339, April 2007 98 pages including 34 Tables and 16 Figures hardcopy: EUR 22.00 (PDF: EUR 20.00)
The Vienna Institute Monthly Report 4/07 edited by Leon Podkaminer • Baltic states: perils of a boom-bust scenario • What drives the Chinese stock market? • Russia and WTO accession • Selected monthly data on the economic situation in ten transition countries, 2005-2007 • Guide to wiiw statistical services on Central, East and Southeast Europe, Russia and Ukraine wiiw, April 2007 36 pages including 14 Tables and 2 Figures (exclusively for subscribers to the wiiw Service Package)
On the Dynamics of Profit- and Wage-led Growth by Amit Bhaduri wiiw Working Papers, No. 42, March 2007 19 pages including 6 Figures hardcopy: EUR 8.00 (PDF: free download from wiiw’s website)
The Impact of EU Enlargement on Economic Restructuring in Russia and Future Relations between Russia and the European Union by Svetlana Glinkina and Natalia Kulikova wiiw Research Reports, No. 338, March 2007 42 pages including 3 Tables and 4 Figures hardcopy: EUR 22.00 (PDF: EUR 20.00)

Privatization Disputes in Romania – the Petrom Case by Gábor Hunya wiiw Research Reports, No. 337, March 2007 36 pages including 9 Tables and 2 Figures hardcopy: EUR 22.00 (PDF: EUR 20.00)
The Vienna Institute Monthly Report 3/07 edited by Leon Podkaminer • Net outward investment position of the new member states • Sources of growth in the CIS • The troubling economics and politics of the US trade deficit • Selected monthly data on the economic situation in ten transition countries, 2005-2007 • Guide to wiiw statistical services on Central, East and Southeast Europe, Russia and Ukraine wiiw, March 2007 36 pages including 17 Tables and 2 Figures (exclusively for subscribers to the wiiw Service Package)
Rapid Growth in the CIS: Is It Sustainable? by Garbis Iradian wiiw Research Reports, No. 336, February 2007 81 pages including 24 Tables and 11 Figures hardcopy: EUR 22.00 (PDF: EUR 20.00)
Private Consumption and Flourishing Exports Keep the Region on High Growth Track by Vladimir Gligorov, Leon Podkaminer et al. wiiw Research Reports, No. 335, February 2007 (special issue on economic prospects for Central, East and Southeast Europe; covering Albania, Bosnia and Herzegovina, Bulgaria, Croatia, the Czech Republic, Hungary, Macedonia, Montenegro, Poland, Romania, Russia, Serbia, Slovakia, Slovenia, Ukraine, Turkey, and China) 134 pages including 49 Tables and 19 Figures hardcopy: EUR 70.00 (PDF: EUR 65.00)
The Vienna Institute Monthly Report 2/07 edited by Leon Podkaminer • Regional convergence in the NMS • EU membership – support and challenge to the competitiveness of the Polish and Romania economies • The flawed logic of capital account liberalization • Selected monthly data on the economic situation in ten transition countries, 2005-2006 • Guide to wiiw statistical services on Central, East and Southeast Europe, Russia and Ukraine wiiw, February 2007 36 pages including 21 Tables (exclusively for subscribers to the wiiw Service Package)
The Vienna Institute Monthly Report 1/07 edited by Leon Podkaminer • Romania: EU entry and related environmental challenges • China and India: a comparison of recent economic growth trajectories • Poland’s experience with capital account convertibility • Selected monthly data on the economic situation in ten transition countries, 2005-2006 • Guide to wiiw statistical services on Central, East and Southeast Europe, Russia and Ukraine wiiw, January 2007 32 pages including 15 Tables and 2 Figures (exclusively for subscribers to the wiiw Service Package)

wiiw Service Package
The Vienna Institute offers to firms and institutions interested in unbiased and up-to-date information on Central, East and Southeast European markets a package of exclusive services and preferential access to its publications and research findings, on the basis of a subscription at an annual fee of EUR 2,000.
This subscription fee entitles to the following package of Special Services:
– A free invitation to the Vienna Institute's Spring Seminar, a whole-day event at the end of March, devoted to compelling topics in the economic transformation of the Central and East European region (for subscribers to the wiiw Service Package only).
– Copies of, or online access to, The Vienna Institute Monthly Report, a periodical consisting of timely articles summarizing and interpreting the latest economic developments in Central and Eastern Europe and the former Soviet Union. The statistical annex to each Monthly Report contains tables of the latest monthly country data. This periodical is not for sale, it can only be obtained in the framework of the wiiw Service Package.
– Free copies of the Institute's Research Reports (including Reprints), Current Analyses and Country Profiles and Statistical Reports.
– A free copy of the wiiw Handbook of Statistics (published in October/November each year and containing more than 400 tables and graphs on the economies of Albania, Bosnia and Herzegovina, Bulgaria, Croatia, the Czech Republic, Estonia, Hungary, Latvia, Lithuania, Macedonia, Poland, Romania, Russia, Serbia and Montenegro, the Slovak Republic, Slovenia and Ukraine)
– Free online access to the wiiw Monthly Database, containing more than 1200 leading indicators monitoring the latest key economic developments in ten Central and East European countries.
– Consulting. The Vienna Institute is pleased to advise subscribers on questions concerning the East European economies or East-West economic relations if the required background research has already been undertaken by the Institute. We regret we have to charge extra for ad hoc research.
– Free access to the Institute's specialized economics library and documentation facilities.
Subscribers who wish to purchase wiiw data sets on CD-ROM or special publications not included in the wiiw Service Package are granted considerable price reductions.
For detailed information about the wiiw Service Package please visit wiiw's website at www.wiiw.ac.at

To The Vienna Institute for International Economic Studies Oppolzergasse 6 A-1010 Vienna
Please forward more detailed information about the Vienna Institute's Service Package Please forward a complete list of the Vienna Institute's publications to the following address
Please enter me for
1 yearly subscription of Research Reports (including Reprints) at a price of EUR 225.00 (within Austria), EUR 250.00 (Europe) and EUR 265.00 (overseas) respectively
Please forward
the following issue of Research Reports ..............................................................................................
the following issue of Current Analyses and Country Profiles .............................................................
the following issue of Working Papers .................................................................................................
the following issue of Statistical Reports ..............................................................................................
the following issue of Research Papers in German language ............................................................
the following issue of Industry Studies .................................................................................................
the following issue of Structural Reports ..............................................................................................
the following issue of wiiw Database on Foreign Direct Investment ...................................................
the following issue of wiiw Handbook of Statistics ...............................................................................
.........................................................................................................................................................................................................
Name
.........................................................................................................................................................................................................
Address
.........................................................................................................................................................................................................
Telephone Fax E-mail
............................................................ ..........................................................
Date Signature
Herausgeber, Verleger, Eigentümer und Hersteller:
Verein „Wiener Institut für Internationale Wirtschaftsvergleiche“ (wiiw), Wien 1, Oppolzergasse 6
Postanschrift: A-1010 Wien, Oppolzergasse 6, Tel: [+431] 533 66 10, Telefax: [+431] 533 66 10 50
Internet Homepage: www.wiiw.ac.at
Nachdruck nur auszugsweise und mit genauer Quellenangabe gestattet.
P.b.b. Verlagspostamt 1010 Wien


![Respecifying Globalization [Globalization In Practice] 2014](https://img.dokumen.tips/doc/110x75/631e105c05964b686800a1bd/respecifying-globalization-globalization-in-practice-2014.jpg)


